

Decoupling Effect and Driving Factors of Land-Use Carbon Emissions in the Yellow River Basin Using Remote Sensing Data


1
The School of Geoscience and Technology, Zhengzhou University, Zhengzhou 450052, China
2
Joint Laboratory of Eco-Meteorology, Chinese Academy of Meteorological Sciences, Zhengzhou University, Zhengzhou 450052, China
3
Songshan Laboratory, Zhengzhou 450046, China
4
National Engineering Research Center of Geographic Information System, School of Geography and Information Engineering, China University of Geosciences, Wuhan 430074, China
*
Author to whom correspondence should be addressed.
Remote Sens. 2023, 15(18), 4446; https://doi.org/10.3390/rs15184446
Submission received: 24 July 2023
/
Revised: 26 August 2023
/
Accepted: 7 September 2023
/
Published: 9 September 2023
(This article belongs to the Special Issue Applications of Multi-Scale Remote Sensing and GIS Technology to Study Terrestrial Ecosystems)
Abstract
:Land-use change is a crucial element influencing the patterns of carbon sinks/sources in the Yellow River Basin (YRB). Therefore, studying land-use carbon emissions (LUCE) in the YRB and the decoupling from economic development can help formulate emission reduction strategies. In order to explore the spatiotemporal characteristics of LUCE in the YRB, we estimated the LUCE in 69 cities in the YRB using the downscale energy balance table estimation method and land-use remote sensing data for seven phases from 1990 to 2020. The spatial and temporal features of LUCE were researched from three different spatial scales: the whole spatial scale of the YRB, the sub-basin level, and the city level. Furthermore, the Tapio decoupling model was utilized to research the decoupling state between LUCE and economic development using a multi-scale approach. The Logarithmic Mean Divisia Index (LMDI) model was employed to explore the influencing factors of LUCE in the YRB. These results showed the following: (1) The LUCE in the YRB went through two stages: “stable growth” (1990–2000) and “rapid growth” (2000–2020). The LUCE increased from 165 million tons in 1990 to 1.414 billion tons in 2020, and the average annual growth rate was 25.12%. The spatial pattern of LUCE in the YRB exhibited significant variations, with the LUCE showing a geographic differentiation of midstream > downstream > upstream. (2) Except for the expansive coupling state during 2000–2005 (e: 0.952) and the expansive negative decoupling state during 2015–2020 (e: 2.151), the YRB was in the weak decoupling state for the majority of the time periods. (3) Economic development was the major positive driving factor for the rise of LUCE in this basin, while energy consumption intensity was the primary inhibiting factor. Through a discussion of the features and influencing factors of LUCE, these results can be utilized to provide carbon emission reduction recommendations tailored to the characteristics of cities’ resources and economic development, which will be helpful for achieving low-carbon and sustainable development in the YRB.

1. Introduction
The increase in greenhouse gas concentration, primarily carbon dioxide, is a crucial reason for global warming [1]. The rise of atmospheric carbon dioxide concentration is mainly related to carbon emissions caused by human activities and land-use change. Land-use change significantly influences the distribution and intensity of carbon sources/sinks [2]. The Yellow River Basin (YRB) is a vital ecological functional area in China, serving as an ecological corridor connecting the Qinghai–Tibet Plateau, Loess Plateau, and North China Plain. The ecological environment of the YRB is fragile. This vulnerability is particularly acute in plateau ecosystems within watersheds, grasslands, and agricultural systems in arid and semi-arid regions. The changes and layout of land use are important factors affecting the ecological functions of the YRB. Land-use change in the YRB is a vital factor influencing the carbon source and sink patterns. Therefore, studying the characteristics of carbon emissions in the YRB from the perspective of land use can better balance the ecological protection function of the YRB.
The YRB spans the eastern, central, and western regions of China. In terms of resources, the YRB is rich in energy sources such as solar energy, coal, and oil. The energy development intensity is particularly high in the middle and upper reaches of the basin, exerting tremendous pressure on the fragile ecological environment. It is a region in China where heavy industries are concentrated. The YRB has gradually formed a high-carbon industrial structure based on energy and mineral resource endowments. The energy structure is dominated by extensive development, and the leading industries have high energy consumption and high carbon emissions. Therefore, it is necessary to carry out carbon reduction in the YRB to achieve low-carbon and sustainable development in the YRB. In terms of the economy, the economic development within the YRB is unbalanced, and the differences in development capacity, foundation, and potential are obvious. Moreover, affected by capital, technology, and other factors, the YRB faces great difficulties in conserving resources and reducing energy consumption. It also presents a contradiction between the distribution of productivity and the security of the ecological environment. Cities of different types in this basin face significant variations in economic development, land-use characteristics, and stages of urban development, and the challenges these cities face in realizing low-carbon development are also quite different. Therefore, decoupling analysis between land-use carbon emissions (LUCE) and economic development is helpful in formulating reasonable land management and emission reduction policies in line with the current situation of urban economic development.
The carbon source/sink generated by different land-use modes is a critical determinant impacting the global carbon cycle [3]. Numerous researchers have conducted a multitude of studies on LUCE from diverse angles in recent years. Scientifically assessing the carbon sources/sinks of various land-use modes is the basis for other related research [4,5]. The accounting of LUCE is mainly divided into bottom-up methods based on natural ecosystems (such as the model simulation method, plot inventory method, and remote sensing estimation method) and top-down methods based on social and economic systems (such as the material balance method, emission coefficient method, and direct measurement method) [6,7]. Among these, the emission coefficient method has gained widespread usage in assessing regional carbon emissions because of its high operability and simplicity [8,9]. For example, Wang et al. [10] assessed the LUCE in the Nansi Lake Basin according to the emission coefficient method. Zhao et al. [11] calculated the carbon emissions from the energy consumption of nine provinces in the YRB based on the emission coefficient method. Additionally, studying the mechanism of LUCE can further elucidate the alterations in carbon sources/sinks during land-use changes and land-use administration processes [12,13]. Simulating and predicting the future trends of LUCE based on different scenarios can offer a scientific foundation for establishing phased objectives and policies for carbon reduction [14,15].
LUCE are not solely connected to natural shifts in land use but also interrelated with other factors, including economic development, urbanization level, and ecosystem service value [10,16]. The Organization for Economic Cooperation and Development (OECD) put forward the OECD decoupling model in 2002 [17]. The OECD decoupling model can be employed to research the decoupling state between LUCE and economic development. However, the primary drawback of this model is its poor stability. Tapio proposed the decoupling model [18] while investigating the correlation among European economic development, transportation volume, and transportation carbon emissions. This model divides the decoupling state into three major states and eight levels based on the range of elasticity values. Compared with the OECD decoupling model, the Tapio decoupling model eliminates the need to choose a base period for calculation; it is not influenced by statistical dimensions and has a more comprehensive decoupling indicator system [19]. Therefore, it has been widely applied in exploring the relationship between carbon emissions and economic development [20,21].
The commonly used methods for studying the influential factors regarding carbon emissions include the decomposition analysis method, econometric method, and geographically weighted regression (GWR) model [22]. Among them, the decomposition analysis method has been extensively employed in the research of energy consumption and its environmental impacts because of its high efficiency [8]. The decomposition analysis method mainly includes index decomposition analysis (IDA) and structural decomposition analysis (SDA). Compared to SDA, IDA is easier to employ and suitable for time series analysis comparisons [23]. The logarithmic mean Divisia index (LMDI) is a frequently applied approach within the IDA [24]. LMDI [25] is an extension of the Kaya identity [26], which decomposes the changes in the target variable into a combination of different driving factors and then assesses the level of influence based on the data of the factors. It can avoid residual terms and data zeros and has the advantages of time independence and aggregation consistency [27].
Through the above analysis, we know that the current research on LUCE is relatively comprehensive. The relevant research has promoted the improvement and deepening of the theoretical system of LUCE. These studies provide an important reference for regional carbon reduction and sustainable development. Currently, studies on carbon emissions in the YRB have the following limitations: (1) The calculation of carbon emissions mostly concerns the aspect of energy consumption [11], while the quantitative analysis of carbon sources/sinks of other land-use types is lacking, thus precluding an overall grasp of land use. Therefore, it is difficult to reduce carbon emissions from the aspect of land-use optimization. (2) Because of the relative scarcity of city-level energy consumption data, most studies are conducted at the provincial scale [28], with less refinement to the city level. Further in-depth exploration is required for the multi-scale analysis of LUCE in the YRB. To address these issues, we proposed two main research objectives: (1) To calculate the LUCE of 69 cities in the YRB from 1990 to 2020 from the perspective of land use. (2) In order to more reasonably formulate carbon emission reduction strategies in line with regional economic development, the second objective of this study is to clarify the decoupling state of LUCE and economic development of cities in the basin.
We focus on the following facets to achieve the research objectives: (1) Based on the downscale energy balance table estimation method and the land-use remote sensing data for seven periods from 1990 to 2020, the LUCE of 69 cities in the YRB were calculated. Then the spatiotemporal characteristics of LUCE were analyzed at three different spatial scales: the whole spatial scale of the YRB, the sub-basin level, and the city level. (2) The decoupling state between LUCE and economic development in the YRB was analyzed using the Tapio decoupling model. (3) The LMDI model was employed to analyze the influencing factors with regard to LUCE in the YRB.
2. Materials and Methods
2.1. Study Area
According to the natural watershed scope of the YRB defined by the Yellow River Conservancy Commission of the Ministry of Water Resources, and considering the integrity of cities’ administrative divisions and the direct correlation between cities’ development and the YRB [29], we selected 69 cities as the study area. The study area is located at 89°27′E~119°19′E, 27°57′N~43°22′N (Figure 1).
2.2. Data
These data primarily encompass land-use data, energy and socio-economic data, and carbon emission coefficient data (Table 1). The land-use data during 1990–2010 were mainly sourced from Landsat TM/ETM, while the data from 2015 to 2020 were sourced from Landsat 8. Land-use data were categorized into six types (cropland, forest land, grassland, water areas, building land, and unused land). For the purpose of eliminating the influence of price factors on nominal GDP, we employed the consumer price index of each province to deflate the nominal GDP of each city and then obtained the real GDP. The real GDP was calculated at constant prices in 1990.
2.3. Methods
2.3.1. LUCE Calculation Method
LUCE can generally be classified into two types: direct carbon emissions and indirect carbon emissions. The former refers to carbon emissions directly generated by land use, while the latter refers to carbon emissions resulting from human activities, primarily stemming from energy consumption [33]. The amount of LUCE is the total of direct carbon emissions and indirect carbon emissions. Carbon sources/sinks from crop land, forest land, grassland, water areas, and unused land were calculated using direct carbon emission estimation methods based on IPCC inventories. It is assumed that the changes in carbon sources and sinks in non-building land categories caused by land-use management during the research period are relatively small and negligible. Therefore, the formula is as follows:
where Ed is the direct carbon emissions of land use; i is land-use type; Si is the area of land-use type i; Vi is the carbon emission coefficient of land-use type i, with positive values indicating carbon emissions and negative values indicating carbon absorption. Based on existing studies [30,31,32,33,34] and considering the current situation of the YRB, the Vi of cropland, forest land, grassland, water areas, and unused land in this paper are taken as 0.497 t/(hm2·a), −0.644 t/(hm2·a), −0.021 t/(hm2·a), −0.253 t/(hm2·a), and −0.005 t/(hm2·a), respectively.
Carbon emissions of building land are calculated by the indirect carbon emission calculation method [34,36], which calculates the carbon emissions generated by energy consumption. Considering the relative scarcity of statistical data on energy consumption at the city level in the study area, we adopt a downscale energy balance table estimation method to obtain the city-level energy balance table (EBT) based on the provincial-level EBT. The specific formula is as follows:
where m is the row in the city-level EBT, representing activity categories of energy consumption; j is the column in the provincial-level EBT, representing energy categories; Ck is city k; p is province; and are the consumption of the j-th energy by the category m activities of the city k and the province p in which they are located, respectively; is the allocation coefficient of energy consumption for the i-th row, indicating the proportion of the allocation index m of city k in the whole province. These allocation indices are selected based on references [37,38] (Table 2).
According to the balance relationship in EBT, the various energy consumptions of cities can be calculated. The specific formula is as follows:
where is the total consumption of energy j in city k; TFC represents the total final consumption, which is the sum of items a–g in Table 2; L is the amount of loss; IO is the energy input and output during the energy processing and conversion process.
The calculation formula for carbon emissions from building land in cities is as follows:
where Ein is the carbon emissions from building land; Ej is the consumption of energy type j; NCVj is the net calorific value of energy type j; CCj is the carbon content per unit of heat for energy type j; COFj is the coefficient of oxidation factor of energy type j. These values can be found in Table 3.
2.3.2. Tapio Decoupling Model
The decoupling elasticity between LUCE and economic development is calculated according to the Tapio decoupling theory. The formula is as follows:
where e is the value of decoupling elasticity between LUCE and economic development; % ΔC and %ΔGDP represent the growth rate of LUCE and GDP, respectively. Decoupling states are divided according to the values of e, ΔC, and ΔGDP (Table 4).
2.3.3. LMDI Model
The LMDI model [25] was employed to decompose the LUCE in the YRB into four influencing factors: energy structure, energy consumption intensity, economic development, and population size. The formula is as follows:
where C is the amount of LUCE; E is total energy consumption (calculated by standard coal consumption); GDP is gross domestic product; P is size of the population; is the carbon emissions per unit of energy, reflecting the effect of the energy structure. is the energy consumption per unit of GDP, reflecting the impact of energy consumption intensity; is per capita GDP, reflecting the influence of economic development. Compared to the multiplicative decomposition, the additive decomposition can more clearly decompose its driving factors [39]. Therefore, we adopt the additive decomposition method in the LMDI model to decompose Equation (7), and the expression is as follows:
where C0 and Ct are the LUCE at the initial period and the t-period. ΔC is the change of LUCE. ΔCES, ΔCEC, ΔCED, and ΔCP represent the partial effects of each influencing factor, and their expressions are as follows: , , , and . L (Ct, C0) in these formulas is defined as follows:
3. Results
3.1. Results of Land-Use Change
The land uses of the YRB are mainly grassland and unused land, and the water area and construction land occupy a relatively small proportion. Compared to 1990, the area of cropland and unused land in the YRB decreased by 14,922 km2 and 30,054 km2, respectively in 2020, but the area of forest land, grassland, water areas, and building land increased. Among them, building land experienced the largest growth rate from 1990 to 2020, increasing from 32,658 km2 in 1990 to 54,718 km2 in 2020, with an average annual growth rate of 2.25%, making it the primary type of land-use change (Table 5).
The area of land-use transformation from 1990 to 2020 in this basin was 169,069.64 km2 (Table 6). Among them, building land experienced significant changes, primarily sourced from cropland and grassland. Grassland was the main type transformed into cropland, representing the change from carbon sink to carbon source. Additionally, in terms of land conversion, there was a tendency for mutual transformation between grassland and unused land. The conversion rate of unused land to grassland was 11.66%. The conversion rate of grassland to unused land was 15.45%.
3.2. Results and Analysis of Spatial and Temporal Characteristics of LUCE
3.2.1. Spatio-Temporal Evolution of LUCE at Different Scales
The amount of LUCE in the YRB exhibited a general increasing trend from 1990 to 2020 (Figure 2a). The LUCE increased from 165 million tons in 1990 to 1.414 billion tons in 2020; the average annual growth rate was 25.12%. The growth process of LUCE went through two stages. From 1990 to 2000, it was a stage of stable growth, and the average annual growth rate was 6.19%, which was relatively small. From 2000 to 2020, it was a stage of swift increase, and the average annual growth rate was 21.37%, which was relatively large. Since the change range of carbon sink land use in this basin is small, with the value much smaller than that of the carbon source amount, the change trend of the net LUCE in the YRB is consistent with that of the carbon source amount (Figure 2).
Among land-use types, cropland and building land are carbon sources, while forest land, grassland, water areas, and unused land are carbon sinks (Figure 3). From the whole spatial scale of the YRB, carbon source regions are predominantly distributed midstream and downstream of this basin. Cropland is the primary land-use type midstream and downstream of the YRB. Although the area mid- and downstream accounts for only 24.27% of this basin (midstream: 18.67%; downstream: 5.6%), the area of cropland mid- and downstream averages 70.89% of the gross cropland area in the YRB (middle reaches: 45.90%; lower reaches: 24.99%). Although the area of building land has the smallest average proportion (1.99%), it is the primary carbon source (Figure 3c), with the carbon emissions proportion increasing from 91.00% in 1990 to 98.90% in 2020, showing a significant increase. Carbon sink regions are predominantly situated upstream of the YRB, and the average area of carbon sinks accounts for 93.35% of upstream regions. Forest land serves as the primary carbon sink in the YRB. The forest land contributed an average of 81.42% to the overall carbon sink from 1990 to 2020, followed by grassland, water area, and unused land; the fluctuations in carbon sink proportions of various types is relatively small.
On the sub-basin scale, the LUCE upstream, midstream, and downstream of the YRB displayed an increasing trend during 1990–2020. The midstream area had the highest emissions, followed by downstream and then upstream. The average proportions of carbon emissions mid-, down-, and upstream were 47.7%, 28.8%, and 23.5%, respectively (Figure 4). In terms of the growth rate of LUCE, from 1990 to 2000, the emissions in all sub-basins increased at a relatively moderate pace. However, from 2000 to 2020, the up- and downstream areas experienced a fast increase in LUCE. Furthermore, the LUCE upstream surpassed those downstream in the period of 2015–2020, while the growth rate downstream gradually slowed down.
On the city scale, the distribution of city-level LUCE upstream during 1990–2005 was relatively concentrated, and the degree of dispersion of carbon emissions during 2010–2020 gradually increased (Figure 5a). In addition, there are some cities with abnormally high values in the upstream region, specifically Lanzhou (1990, 1995), Baotou (2005, 2010, 2015, 2020), Ordos (2005, 2010, 2015, 2020), and Yinchuan (2020). The distribution of city-level LUCE in the midstream region during 1990–2000 was concentrated, and there were abnormally high values in 1990 and 2000, both of which appeared in Taiyuan City. The distribution of the data during 2000–2020 gradually dispersed, and the overall LUCE increased rapidly. In the downstream area, the data distribution was relatively concentrated during the period of 1990–2000, with generally lower values. However, from 2005 to 2020, the data distribution became more dispersed, and the overall LUCE were higher.
The overall spatial distribution of LUCE in the YRB was high in the east and low in the west. From 1990 to 2000, the distribution of cities’ LUCE in the YRB was relatively concentrated, mainly consisting of low carbon emissions. Those regions with high LUCE were mostly located in provincial capitals and their surrounding areas mid- and downstream of the basin, such as Taiyuan, Zhengzhou, Jinan, and their nearby cities. From 2000 to 2020, the number of cities with high LUCE in the YRB increased, primarily in the central and eastern area of the YRB.
3.2.2. Spatial Autocorrelation Analysis of LUCE
We conducted global spatial autocorrelation analysis [40] of the LUCE of cities in the YRB from 1990 to 2020 (Table 7). The results revealed that the Moran’s I values were positive. All Moran’s I values passed the significance test at the 99% level. This indicated that the city-level LUCE in the YRB had a significant positive spatial correlation. That is, those cities with similar LUCE tended to be spatially clustered.
In order to analyze local carbon emissions at the city scale, we used the Local Indications of Spatial Association (LISA) index to identify the types of local spatial clusters and their spatial locations. Based on the LISA clustering results in different years, we identified the aggregation areas of different carbon emissions and clarified the local similarity or difference between the LUCE of cities and their neighboring areas. The spatial clustering of the city-level LUCE in the study area mostly showed no obvious aggregation, and the spatial aggregation modes were primarily characterized by “high–high” and “low–low” (Figure 6).
“High–high” clustering regions were predominantly situated midstream and downstream of the YRB, including cities such as Taiyuan, Jinzhong, Changzhi, and Jinan. During the period of 1990–2000, the “high–high” clustering regions were primarily situated in Shanxi Province, which is an important coal resource base in China. In the YRB, the consumption of coal energy accounted for the highest proportion. Moreover, among fossil fuels, coal possesses the highest carbon emission coefficient, resulting in higher carbon emissions in this region. From 2000 to 2020, the “high–high” clustering regions gradually shifted from Shanxi Province to areas such as Shandong Province and the Inner Mongolia Autonomous Region. Rapid economic development and urbanization processes in cities like Jinan and Zibo in Shandong Province led to increased carbon emissions from energy consumption related to building land, promoting the overall growth in regional LUCE. The progress of urbanization also brings about clustering effects, influencing the development of surrounding cities and generating a high-carbon-emission clustering effect. Hohhot, Baotou, and Ordos, as coal reserve bases following Shanxi Province, experienced an increasing proportion of coal energy consumption, leading to the formation of high-carbon-emission clustering areas.
“Low–low” clustering regions were primarily situated in the southwestern region of the YRB, and their changes were relatively small. Most of these areas were located in the province of Qinghai, Gansu, and Sichuan; these regions contain extensive forest and grassland coverage. These areas have crucial ecological functions, with high carbon sinks in terrestrial ecosystems, resulting in a clustering of low carbon emissions. “High–low” clustering regions were primarily situated in Lanzhou and Gansu Province during the period of 1990–2000.
3.3. Decoupling Results of LUCE and Economic Development
The YRB experienced a WD state for most of the time period, except the EC state during the period of 2000–2005 and the END state during the period of 2015–2020. This indicates a relatively stable level of low-carbon development (Table 8). The upstream region showed a predominantly EC state, while the midstream and downstream regions exhibited a WD state. An EC state suggests that economic growth and LUCE were closely connected, with similar growth rates. An END state indicates that LUCE increased significantly faster than economic growth, which means a high reliance of economic development on carbon emissions. WD signifies that economic growth outpaced the rise in carbon emissions, representing a relative decoupling between economic development and LUCE.
During the period of 1990–1995, most cities in the YRB were in a WD state, indicating a favorable development of low-carbon levels. Some cities even achieved an SD state (Figure 7). An SD state indicates a decrease in LUCE with economic growth, representing an absolute decoupling of economic growth from LUCE. Regions with an SD state have a leading level of low-carbon development. By analyzing the LUCE of cities in the SD state, we found the following:
- The average area of carbon sink land in Alxa League and the Haibei Tibetan Autonomous Prefecture was relatively high, accounting for 99.81% and 97.33%, respectively. Those proportions were far larger than the gross area of carbon sink land in the YRB (82.52%). The carbon sources and carbon sinks of the two cities rose from 1990 to 1995. However, the increase of carbon sink levels was significantly larger than the increase of carbon sources. Therefore, the net carbon emissions of the two cities decreased.
- The decrease of net carbon emissions of other cities in the SD state was primarily attributed to the decrease of carbon sources in building land.
Cities in the SND state were mainly situated in the southwest region of this basin, where economic development was slow and real GDP was declining. LUCE continued to increase during the development, leading to an SND state.
During the period of 1995–2000, there was a notable rise in the number of cities in the SD state. Most cities were in the WD state, with only a few in the EC state or END state. There were no cities in the SND state during this period. Furthermore, those cities that were in the SND state in the period of 1990–1995 transitioned to the SD or WD state, with good low-carbon development levels in the period of 1995–2000. This showed that the economic growth of these cities in the southwest area of the YRB gradually improved during this period.
During the period of 2000–2005, the number of cities in study area in the EC state or END state significantly increased. From 2005 to 2010, the overall carbon emissions decoupling situation in the YRB improved. Most cities in this basin were in a state of low-carbon development, such as WD or SD, and there were fewer cities in the EC or END state.
During the period of 2010–2015, the amounts of cities in the WD state in the YRB experienced a notable decrease, from 54 cities in the period of 2005–2010 to 25. Most of these cities (22/29) underwent a transition to the EC state or END state. The number of cities in the SD state increased during this period. There was one city (Alxa League) that experienced the RD state during this period. During the period of 2015–2020, the number of cities in the SD state further increased, while the number of cities in the WD state further dropped to 13. The number of cities in the EC or END state increased. There were 13 cities in the SND state and 4 cities in the RC state during this period.
3.4. Influencing Factors of LUCE
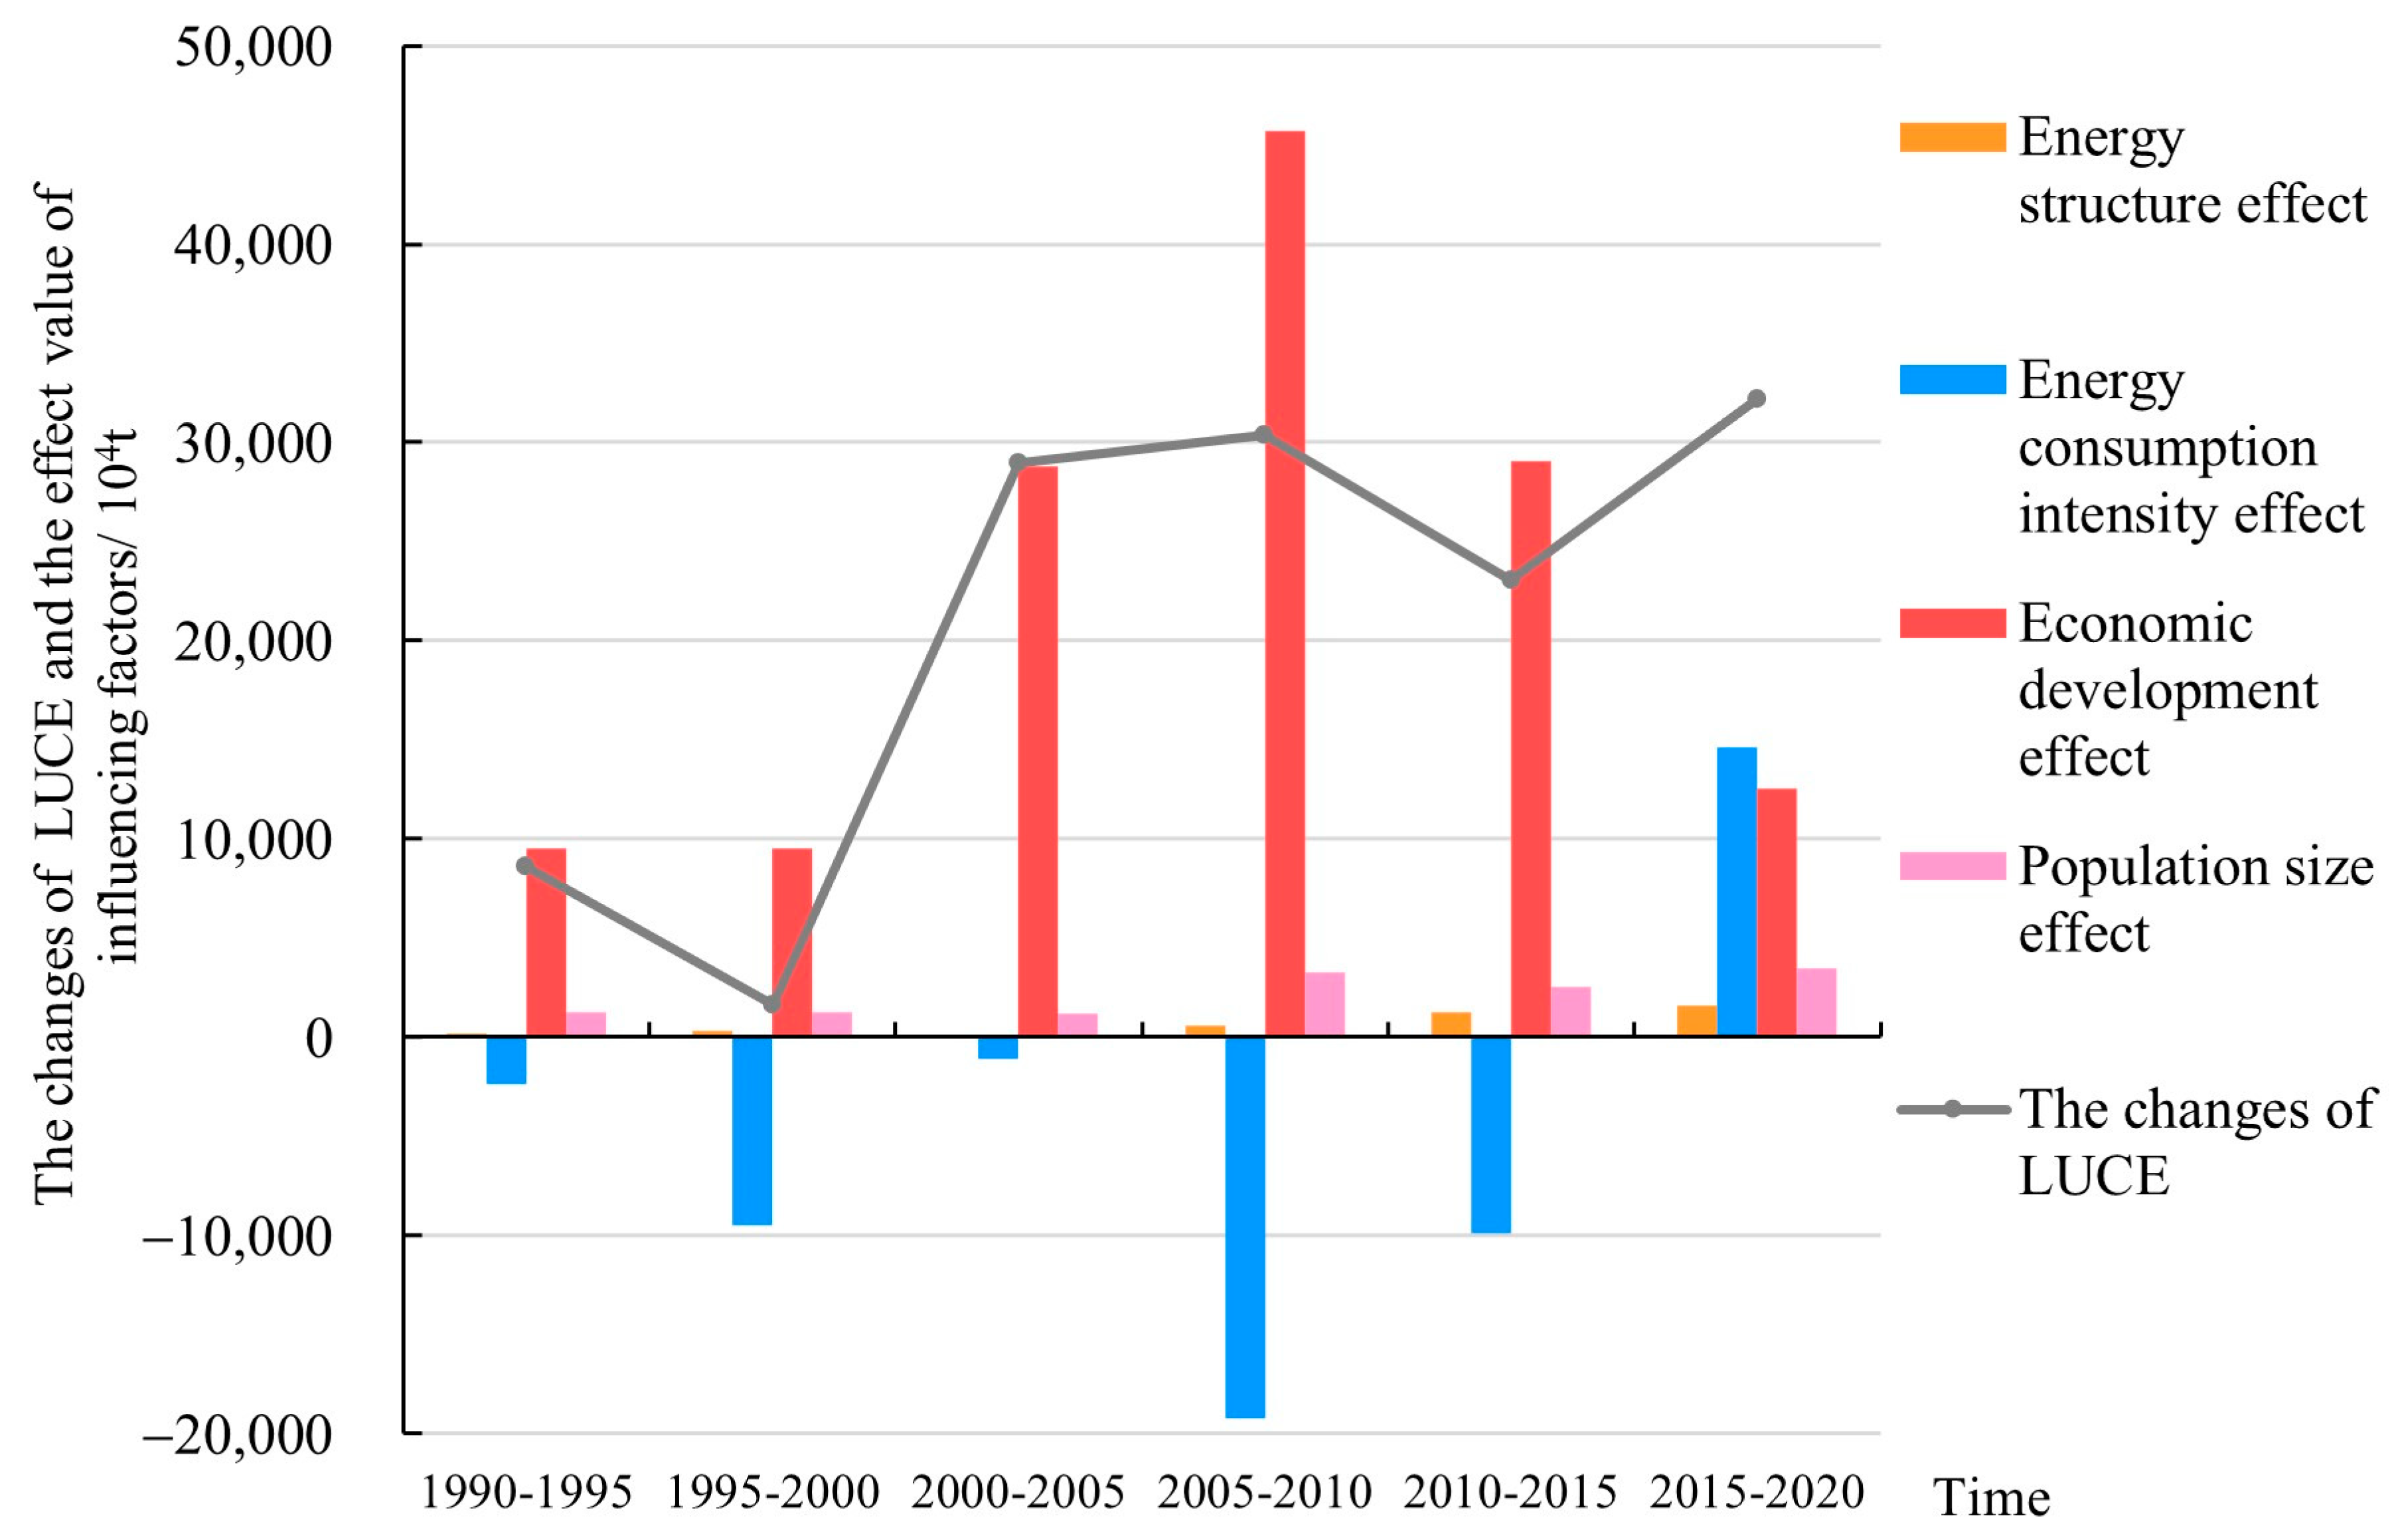
From the results of the LMDI model, we found that the energy structure, economic development, and population size had a positive influence on the growth of LUCE in the YRB (Figure 8). Among these, economic development was the primary driver. The positive impact of economic development on LUCE gradually strengthened from 1990 to 2010, reaching its peak during the period of 2005–2010, and then gradually weakened during the period of 2010–2020. The positive impact of the energy structure on LUCE was relatively small, with an overall fluctuating increasing trend. However, its positive effect during the period of 2000–2005 was significantly smaller than in other stages. The positive effect of population size on LUCE was relatively small but slightly higher than the positive effect of the energy structure. The effect of population size showed a fluctuating increasing trend. Energy consumption intensity primarily exerted a negative effect on the growth of LUCE in the YRB. From 1990 to 2000, the inhibiting effect of energy consumption intensity gradually strengthened. During the period of 2000–2005, the inhibiting effect was relatively small. From 2005 to 2010, it reached its strongest level. From 2010 to 2015, the inhibiting effect gradually weakened. However, from 2015 to 2020, energy consumption intensity exerted a slightly positive impact on the increase of LUCE. The energy consumption per unit of GDP in the YRB continuously decreased from 1990 (9.42 tons of standard coal/CNY 10,000) to 2015 (3.89 tons of standard coal/CNY 10,000). The energy utilization efficiency continuously improved. The energy consumption per unit of GDP rose slightly from 2015 to 2020 (4.37 tons of standard coal/CNY 10,000).
4. Discussion
4.1. Characteristics of LUCE in the YRB
- (1)
- Increasing land-use carbon sink levels is an important complementary approach for reducing carbon dioxide concentration
We comprehensively calculated the net carbon emissions from various land uses at the city level in the YRB. Despite carbon sink land use in the YRB exhibiting a fluctuating increasing trend, carbon source land use in this basin was significantly higher than carbon sink land use. This aligns with the research results of Ma and Liu [41]. The carbon sources of the YRB are mainly from building land (Figure 3). The carbon emissions from building land come mainly from the energy consumption caused by human activities, such as the combustion of energy such as coal, petroleum, and natural gas. As the economic development of the YRB is highly dependent on energy consumption [42], a large amount of carbon emissions were generated in the process of energy consumption. As a result, carbon source levels are significantly higher than carbon sink levels. “Increasing sinks” and “reducing emissions” are the main paths to reduce atmospheric carbon dioxide concentration. In the long run, the carbon sequestration potential of terrestrial ecosystems is limited, as is the space for increasing sinks [43]. Although the carbon sinks of terrestrial ecosystems in forest land, grassland, and other places cannot completely offset the carbon emissions caused by energy consumption in the process of human activities, increasing the carbon sink land use is still a vital supplementary measure compared to “reducing emissions” (such as reducing emissions through improving energy utilization efficiency in industrial processes). For example, scientific afforestation, forest management, and other ecological engineering measures can be adopted to gain a key time window for industrial emission reduction [43].
Moreover, the results of Section 3.1 show that there is a tendency for mutual conversion between two types of land use: unused land and grassland (Table 6). Since grassland has a higher carbon sink capacity per unit area compared to unused land, the conversion process from unused land to grassland would increase carbon sequestration. Therefore, promoting the development and utilization of unused land to grassland can contribute to carbon reduction efforts.
- (2)
- The LUCE in the YRB rapidly increased since 2000
Section 3.2.1 indicated that the growth rate of LUCE in the study area increased significantly since 2000 (Figure 2a). This trend was basically consistent with the net carbon emissions of the nine provinces in the YRB mentioned in reference [28]. One important reason for this change was that, as the international economic situation gradually improved after 2000, China’s economy quickly recovered after the Asian Financial Crisis, and the country joined the World Trade Organization (WTO) in 2001 [44]. The expansion of China’s export scale significantly increased after its accession to the WTO. This significantly increased energy consumption and carbon emissions in the production process. As an important coal energy base in China, the basin accounts for about 75% of the country’s basic coal reserves, which serves not only the development of the basin itself but also serve the economic development of the country. The development and utilization of energy will further lead to the growth of carbon emissions. In order to promote the development of regional economies, China has implemented strategies such as Western Development and the Rise of Central China. For example, two-thirds of the provinces involved in the research area are in the Western Development strategy. These strategies not only promoted the economic development of the YRB but also concentrated a large number of high-energy-consuming and repetitive infrastructure and industrial projects in the early stages of strategy implementation. The economic development model was relatively extensive. Therefore, the energy consumption sharply increased, resulting a swift increase in the growth rate of LUCE.
In the analysis of influencing factors in Section 3.4, it is also evident that the positive driving impact of economic development on LUCE after 2000 was significantly higher than that before 2000. For example, the driving effect of economic development between 2000 and 2005 was almost three times that of between 1995 and 2000 (Figure 8). The overall decoupling state of the YRB also shifted from the WD state during the period of 1995–2000 to the EC state during the period of 2000–2005 (Table 8). This further indicated that the dependence on carbon-intensive industries in the process of rapid economic development after 2000 resulted in a gradual increase in the growth rate of LUCE.
- (3)
- Spatial characteristics of LUCE at different scales in the YRB
From the whole spatial scale of the YRB, the LUCE in the YRB were higher in the east than in the west. From 1990 to 2015, the LUCE in the YRB displayed a spatial differentiation distribution of midstream > downstream > upstream (Figure 4). This result was consistent with the findings of Du [45]. However, during the period of 2015–2020, the LUCE in the upstream area gradually surpassed the downstream, and the up- and midstream areas experienced faster growth rates, while the growth rate in the downstream area slowed down (Figure 4).
- The upstream area experienced a phase of swift economic progress and urbanization. Building land upstream increased from 8955.50 km2 in 1990 to 15,131.33 km2 in 2020, an increase of 68.96%. The rapid expansion of building land was accompanied by a significant increase in energy consumption.
- The LUCE in the midstream area were higher than those downstream and upstream. One important reason was that there were many heavy industrial bases in the midstream regions, such as Datong, Yangquan, Shuozhou, etc., leading to high energy consumption and carbon emissions.
- The growth rate of LUCE in the downstream regions gradually slowed down, mainly due to the transition from an extensive economic development model that was highly dependent on energy input and consumption to a high-quality development model around 2020, as seen in cities like Zhengzhou and Jinan.
4.2. Discussion and Analysis of Influence Factors and Policy Recommendations for Low-Carbon Development
Among the land-use types, building land is the primary carbon source, and building land serves as the primary spatial carrier for energy activities, industrial production, and human life. Therefore, LUCE are closely interconnected with factors such as population, economy, and energy [9]. The negative influence of energy consumption intensity on LUCE during the period of 1995–2000 was about four times that of the period of 1990–1995 (Figure 8). During the period of 1995–2000, the intensity of energy consumption decreased significantly. One important reason was to address the issues of overcapacity and environmental pollution in industries such as coal; the Chinese government banned and shut down a group of small enterprises with outdated technology, serious pollution, and low efficiency. As the main coal production bases at that time, Shanxi and Shaanxi also eliminated a large number of small and medium-sized enterprises with outdated technology, inferior products, and resource waste.
Achieving the targets of carbon peak and carbon neutrality relies on the selection of emission reduction pathways based on regional differentiation [46]. Considering the impact of LUCE at the end of the study period (2015–2020) on the formulation of future carbon emission reduction policies and the carbon emission decoupling state of cities during the other periods, as well as the characteristics of relevant cities, this paper gives different low-carbon-development suggestions for different types of cities. The specific analysis and suggestions are as follows:
- At the end of the study period, nearly half of the cities (30/69) were in a state of SD or WD. Most of these cities (27/30) had experienced poor low-carbon development levels (type I) in the other periods, such as an EC state, END state, etc. Only a few cities (3/30) were in an SD or WD state in all periods during the study timespan (type II). The analysis showed that cities of type I were mainly distributed in midstream areas, and two-thirds of them were resource-based cities. Cities of type I should learn from the experiences and lessons of the period before the end period of the study and continue to maintain low-carbon practices in future development.
- Cities of type II were mainly situated in the provinces of Qinghai and Gansu. These cities had low levels of economic development and relatively lower carbon emissions. They are situated in the upstream area of the YRB, where is rich in clean energy, for example, wind and solar power [47]. Therefore, in their development process, they can leverage the local advantages of clean energy and gradually reduce the proportion of fossil fuel consumption, such as coal and petroleum, to realize regional green and low-carbon development.
- A small number of cities (4/69) were in the RC state (Type III) at the end of the study period. That is, both LUCE and real GDP showed a decreasing trend. These cities had low carbon emission intensity. While pursuing low-carbon development, these cities should also focus on economic growth and realize the change from a recessive decoupling state to a strong decoupling state as soon as possible.
- Approximately one-third of the cities (22/69) were in a poor decoupling state of the EC (Type IV) or END (Type V) type at the end of the study. Comparatively, Type IV cities had a relatively better level of low-carbon development. All cities of type V experienced a period of poor low-carbon development, such as the ED state or END state, in the period before the end period of the study. Additionally, half of the cities of type V had an EC state in the period (2010–2015) before the end period of the study.
- Therefore, cities of type IV need to prioritize addressing the reliance on carbon-intensive industries in future development, accelerating industrial structural upgrades and energy-saving transformations and preventing further deterioration of low-carbon development levels.
- Cities of type V are basically resource-based cities (13/16). These cities may not be able to completely break free from their reliance on coal in the short term. Through the application of innovative technologies, these cities can increase the clean treatment of coal [48]. These measures can also facilitate the optimization and updating of backward industries with heavy pollution, high energy consumption, and low production capacity.
- A portion of cities (13/69) were in the SND state at the end period of the study (type VI). These cities in the study area had higher carbon intensity. Therefore, it is essential for these cities to control the growth of LUCE on the one hand, and strive to improve economic development on the other hand. The measures taken by cities such as Dongying and Zibo in the development process, such as developing service industries and adjusting the industrial structure, suppressed economic growth for a certain period of time but contributed to sustainable low-carbon development. Therefore, these cities should accelerate the optimization and updating of their industrial structure and fulfill the coordinated development of the economy and low-carbon processes.
From the whole spatial scale of the YRB, cities should also prioritize the overall and collaborative low-carbon development of the YRB in the course of differentiated low-carbon development. Coordinated promotion and cooperation among various regions will support low-carbon sustainable development of the YRB.
5. Conclusions
We focused on 69 cities in the YRB, calculating their LUCE from 1990 to 2020. Then, we used the Tapio decoupling model to explore the decoupling state between LUCE and economic development in each period using the whole spatial scale of the YRB, the sub-basin level, and the city level in 5-year intervals. The LMDI model was employed to further explore the influencing factors in each period for the YRB. The research objectives of this paper were achieved. Clarifying the LUCE and economic development of cities in the YRB is conducive to overall planning as well as scientific and effective formulation of regional emission reduction targets. The conclusions are as follows:
- (1)
- The LUCE of the YRB increased from 165 million tons in 1990 to 1.414 billion tons in 2020. From the perspective of land use, building land accounted for a large proportion of carbon sources, showing an increasing trend. Forest land serves as the main carbon sink area. Other carbon sink land uses had relatively stable carbon sink proportions. The LUCE showed a geographic differentiation of midstream > downstream > upstream. City-level LUCE displayed a significant positive spatial correlation. “High–high” aggregation areas were mainly located mid- and downstream. The distribution of “low–low” aggregation areas was primarily located in the southwestern region.
- (2)
- The overall low-carbon development level of the YRB was relatively stable. Most of the time periods were in a state of WD. There was spatial differentiation in the decoupling of LUCE and economic development among cities in the YRB. Most cities in the YRB had a good level of low-carbon development. Except for the period of 2015-2020, most cities in the YRB exhibited a predominantly WD state.
- (3)
- The changes in LUCE were closely related to the economic production activities carried out on land. The energy structure, economic development, and population size had a positive effect on the increase of LUCE in the YRB, with economic development being the main positive driver of this increase. Energy consumption intensity had a negative influence on the increase of LUCE in the YRB.
- (4)
- We found that maintaining a good level of low-carbon development over the long term (type II) was challenging. Most cities inevitably experienced periods of poor low-carbon development, such as EC and END states, as seen in Type I and Type V cities. The provided carbon reduction recommendations consider the decoupling state and specific characteristics of each type of city, which can provide a more sustainable development path for cities.
In future studies, more detailed regional studies on carbon emissions of various land-use types can be carried out to facilitate the precise implementation of carbon reduction programs.
Author Contributions
Conceptualization, X.W.; methodology, X.W., X.Z. (Xue Zhao), and S.S.; data curation, X.Z. (Xue Zhao); software, X.Z. (Xue Zhao); formal analysis, X.Z. (Xue Zhao); validation, X.W. and X.Z. (Xue Zhao); writing—original draft preparation, X.Z. (Xue Zhao) and X.W.; writing—review and editing, X.Z. (Xue Zhao), X.W., and S.Z.; project administration, X.W. and X.Z. (Xiang Zhang). All authors have read and agreed to the published version of the manuscript.
Funding
This research was funded by the Pre-research Project of SongShan Laboratory, grant number YYYY062022001, and the Natural Science Foundation of Henan, grant number 212300410292.
Data Availability Statement
Not applicable.
Conflicts of Interest
The authors declare no conflict of interest.
References
- Masson-Delmotte, V.; Zhai, P.; Pirani, A.; Connors, S.L.; Péan, C.; Berger, S.; Caud, N.; Chen, Y.; Goldfarb, L.; Gomis, M.I.; et al. (Eds.) Climate Change 2021: The Physical Science Basis. Contribution of Working Group I to the Sixth Assessment Report of the Intergovernmental Panel on Climate Change (IPCC, 2021); Cambridge University Press: Cambridge, UK; New York, NY, USA, 2021; Volume 2. [Google Scholar] [CrossRef]
- Simmons, C.; Matthews, H. Assessing the implications of human land-use change for the transient climate response to cumulative carbon emissions. Environ. Res. Lett. 2016, 11, 035001. [Google Scholar] [CrossRef]
- Houghton, R.A.; House, J.I.; Pongratz, J.; Van Der Werf, G.R.; Defries, R.S.; Hansen, M.C.; Le Quéré, C.; Ramankutty, N. Carbon emissions from land use and land-cover change. Biogeosciences 2012, 9, 5125–5142. [Google Scholar] [CrossRef]
- Fang, J.; Guo, Z.; Piao, S.; Chen, A. Terrestrial vegetation carbon sinks in China from 1981 to 2000. Sci. China Ser. D Earth Sci. 2007, 37, 804–812. [Google Scholar] [CrossRef]
- Piao, S.; He, Y.; Wang, X.; Chen, F. Estimation of China’s terrestrial ecosystem carbon sink: Methods, progress and prospects. Sci. China Earth Sci. 2022, 65, 641–651. [Google Scholar] [CrossRef]
- Houghton, R.A. Why are estimates of the terrestrial carbon balance so different? Glob. Chang. Biol. 2003, 9, 500–509. [Google Scholar] [CrossRef]
- Yi, D.; Ou, M.; Guo, J.; Han, Y.; Yi, J.; Ding, G.; Wu, W. Progress and prospect of research on land use carbon emissions and low-carbon optimization. Resour. Sci. 2022, 44, 1545–1559. [Google Scholar] [CrossRef]
- Zhao, R.; Huang, X.; Liu, Y.; Zhong, T.; Ding, M.; Chuai, X. Carbon emission of regional land use and its decomposition analysis: Case study of Nanjing City, China. Chin. Geogr. Sci. 2015, 25, 198–212. [Google Scholar] [CrossRef]
- Cao, W.; Yuan, X. Region-county characteristic of spatial-temporal evolution and influencing factor on land use-related CO2 emissions in Chongqing of China, 1997–2015. J. Clean. Prod. 2019, 231, 619–632. [Google Scholar] [CrossRef]
- Wang, D.; Jing, Y.; Han, S.; Gao, M. Spatio-temporal relationship of land-use carbon emission and ecosystem service value in Nansi Lake Basin based upon a grid square. Acta Ecol. Sin. 2022, 42, 9604–9614. [Google Scholar] [CrossRef]
- Zhao, Z.; Yan, Y.; Liu, J. The approachto achievingthe “Double Carbon” goal in nine provinces and regions in the Yellow River Basin. J. Xi’an Jiaotong Univ. (Soc. Sci.) 2022, 42, 20–29. [Google Scholar] [CrossRef]
- Zhao, R.; Huang, X.; Liu, Y.; Ding, M. Mechanism and policy framework for land regulation of carbon cycle of regional system. China Popul. Resour. Environ. 2014, 24, 51–56. [Google Scholar] [CrossRef]
- Zhou, T.; Shi, P. Indirect impacts of land use change on soil organic carbon change in China. Adv. Earth Sci. 2006, 21, 138–143. [Google Scholar] [CrossRef]
- Huang, X.; Zhang, X.; Lu, X.; Wang, P.; Qin, J.; Jiang, Y.; Liu, Z.; Wang, Z.; Zhu, A. Land development and utilization for carbon neutralization. J. Nat. Resour. 2021, 36, 2995–3006. [Google Scholar] [CrossRef]
- Lin, X.; Ma, J.; Chen, H.; Shen, F.; Ahmad, S.; Li, Z. Carbon emissions estimation and spatiotemporal analysis of china at city level based on multi-dimensional data and machine learning. Remote Sens. 2022, 14, 3014. [Google Scholar] [CrossRef]
- Zhou, Y.; Chen, M.; Tang, Z.; Mei, Z. Urbanization, land use change, and carbon emissions: Quantitative assessments for city-level carbon emissions in Beijing-Tianjin-Hebei region. Sustain. Cities Soc. 2021, 66, 102701. [Google Scholar] [CrossRef]
- The Organisation for Economic Co-operation and Development. Sustainable Development: Indicators to Measure Decoupling of Environmental Pressure from Economic Growth; OECD: Paris, France, 2002. [Google Scholar]
- Tapio, P. Towards a theory of decoupling: Degrees of decoupling in the EU and the case of road traffic in Finland between 1970 and 2001. Transp. Policy 2005, 12, 137–151. [Google Scholar] [CrossRef]
- Feng, B.; Wang, X. Research on carbon decoupling effect and influence factors of provincial construction industry in China. China Popul. Resour. Environ. 2015, 25, 28–34. [Google Scholar] [CrossRef]
- Wu, Y.; Zhu, Q.; Zhu, B. Decoupling analysis of world economic growth and CO2 emissions: A study comparing developed and developing countries. J. Clean. Prod. 2018, 190, 94–103. [Google Scholar] [CrossRef]
- Gao, C.; Ge, H.; Lu, Y.; Wang, W.; Zhang, Y. Decoupling of provincial energy-related CO2 emissions from economic growth in China and its convergence from 1995 to 2017. J. Clean. Prod. 2021, 297, 126627. [Google Scholar] [CrossRef]
- Jiang, Y.; Bai, H.; Feng, X.; Luo, W.; Huang, Y.; Xu, H. How do geographical factors affect energy-related carbon emissions? A Chinese panel analysis. Ecol. Indic. 2018, 93, 1226–1235. [Google Scholar] [CrossRef]
- Song, Y.; Zhang, M.; Shan, C. Research on the decoupling trend and mitigation potential of CO2 emissions from China’s transport sector. Energy 2019, 183, 837–843. [Google Scholar] [CrossRef]
- Dong, J.; Li, C.; Wang, Q. Decomposition of carbon emission and its decoupling analysis and prediction with economic development: A case study of industrial sectors in Henan Province. J. Clean. Prod. 2021, 321, 129019. [Google Scholar] [CrossRef]
- Ang, B.W.; Choi, K.-H. Decomposition of aggregate energy and gas emission intensities for industry: A refined Divisia index method. Energy J. 1997, 18, 59–73. [Google Scholar] [CrossRef]
- Kaya, Y. Impact of Carbon Dioxide Emission on GNP Growth: Interpretation of Proposed Scenarios; Working Paper; IPCC Energy and Industry Subgroup: Paris, France, 1989. [Google Scholar]
- Ang, B.W. Decomposition analysis for policymaking in energy:: Which is the preferred method? Energy Policy 2004, 32, 1131–1139. [Google Scholar] [CrossRef]
- Meng, Q.; Zheng, Y.; Liu, Q.; Li, B.; Wei, H. Analysis of Spatiotemporal Variation and Influencing Factors of Land-Use Carbon Emissions in Nine Provinces of the Yellow River Basin Based on the LMDI Model. Land 2023, 12, 437. [Google Scholar]
- Qin, C.; Li, M. The mechanism of the spatial dissimilarity of regional economy:A theoretical model and its application in the Yellow River Valley. Geogr. Res. 2010, 29, 1780–1792. [Google Scholar] [CrossRef]
- Sun, X. Effects of carbon emission by land use patterns in Hefei’s economic circle of Anhui Province. J. Nat. Resour. 2012, 27, 394–401. [Google Scholar] [CrossRef]
- Lan, J.; Fu, W.; Yuan, B.; Zhang, T.; Peng, J. Analysis of land use patterns on carbon emission and carbon footprint in Chongqing City. J. Soil Water Conserv. 2012, 26, 146–150, 155. [Google Scholar] [CrossRef]
- Zhang, R.; Pu, L.; Wen, J.; Xu, Y. Hypothesis and validation on the Kuznets curve of construction land expansion and carbon emission effect. J. Nat. Resour. 2012, 27, 723–733. [Google Scholar] [CrossRef]
- Zhang, J.; Chen, H.; Liu, D.; Shi, Q.; Geng, T. The spatial and temporal variation and influencing factors of land use carbon emissions at county scale. J. Northwest Univ. (Nat. Sci. Ed.) 2022, 52, 21–31. [Google Scholar] [CrossRef]
- Peng, W.; Zhou, J.; Xu, X.; Luo, H.; Zhao, J. Effect of land use changes on the temporal and spatial patterns of carbon emissions and carbon footprints in the Sichuan Province of Western China, from 1990 to 2010. Acta Ecol. Sin. 2016, 36, 7244–7259. [Google Scholar] [CrossRef]
- Liu, J.; Liu, M.; Zhuang, D.; Zhang, Z.; Deng, X. Study on spatial pattern of land-use change in China during 1995–2000. Sci. China Ser. D Earth Sci. 2003, 46, 373–384. [Google Scholar] [CrossRef]
- Eggleston, H.; Buendia, L.; Miwa, K.; Ngara, T.; Tanabe, K. 2006 IPCC Guidelines for National Greenhouse Gas Inventories; Institute for Global Environmental Strategies: Hayama, Japan, 2006. [Google Scholar]
- Liu, Q.; Cheng, K.; Zhuang, Y. Temporal and spatial differences and evolution characteristics of China′s energy intensity based on prefecture-level city scale. East China Econ. Manag. 2023, 37, 57–66. [Google Scholar] [CrossRef]
- Jing, Q.; Luo, W.; Bai, H.; Xu, H. A method for city-level energy-related CO2 emission estimation. Acta Sci. Circumstantiae 2018, 38, 4879–4886. [Google Scholar] [CrossRef]
- Ang, B.W.; Zhang, F.Q. A survey of index decomposition analysis in energy and environmental studies. Energy 2000, 25, 1149–1176. [Google Scholar] [CrossRef]
- Chen, P.; Zhu, X. Regional inequalities in China at different scales. Acta Geogr. Sin. 2012, 67, 1085–1097. [Google Scholar] [CrossRef]
- Ma, Y.; Liu, Z. Study on the spatial-temporal evolution and influencing factors of land use carbon emissions in the Yellow River Basin. Ecol. Econ. 2021, 37, 35–43. [Google Scholar]
- Ren, B.; Dou, Y. Restrictive factors and path of industrial structure adjustment in the Yellow River Basin under the goal of Carbon Neutralization. Inn. Mong. Soc. Sci. 2022, 43, 121–127. [Google Scholar] [CrossRef]
- Piao, S.; Yue, C.; Ding, J.; Guo, Z. Perspectives on the role of terrestrial ecosystems in the ‘carbon neutrality’ strategy. Sci. Sin. (Terrae) 2022, 52, 1419–1426. [Google Scholar] [CrossRef]
- Zhou, Y.; Yang, Y.; Cheng, B.; Huang, J. Regional differences in the coupling relationship between Chinese economic growth and carbon emissions based on decoupling index and LMDI. J. Univ. Chin. Acad. Sci. 2020, 37, 295–307. [Google Scholar] [CrossRef]
- Du, H.; Wei, W.; Zhang, X.; Ji, X. Spatio-temporal evolution and influencing factors of energy-related carbon emissions in the Yellow River Basin: Based on the DMSP/OLS and NPP/VIIRS nighttime light data. Geogr. Res. 2021, 40, 2051–2065. [Google Scholar] [CrossRef]
- Zhang, Y.; Bai, Y. Regional differ entiated paths for realizing “Double Carbon” targets. Reform 2021, 11, 1–18. [Google Scholar]
- Wu, Z.; Hou, A.; Chang, C.; Huang, X.; Shi, D.; Wang, Z. Environmental impacts of large-scale CSP plants in northwestern China. Environ. Sci. Process. Impacts 2014, 16, 2432–2441. [Google Scholar] [CrossRef] [PubMed]
- Zhang, B.; Wang, J.; Lv, L.; Xia, J.; Yang, Z.; Luo, H. Thoughts on energy transformation of resource-based cities: Taking Taiyuan City as an example. J. Environ. Eng. Technol. 2021, 21, 181–186. [Google Scholar] [CrossRef]
Figure 1.
Study area. Note: The base map of China (review number: GS (2020) 4619, http://bzdt.ch.mnr.gov.cn/browse.html?picId=%224o28b0625501ad13015501ad2bfc0480%22, accessed on 20 June 2023) was sourced from the standard map service system of the Ministry of Natural Resources, and the boundary of the base map has not been modified. The division of the upper, middle, and lower streams of the YRB in this article mainly refers to the literature [30,31].
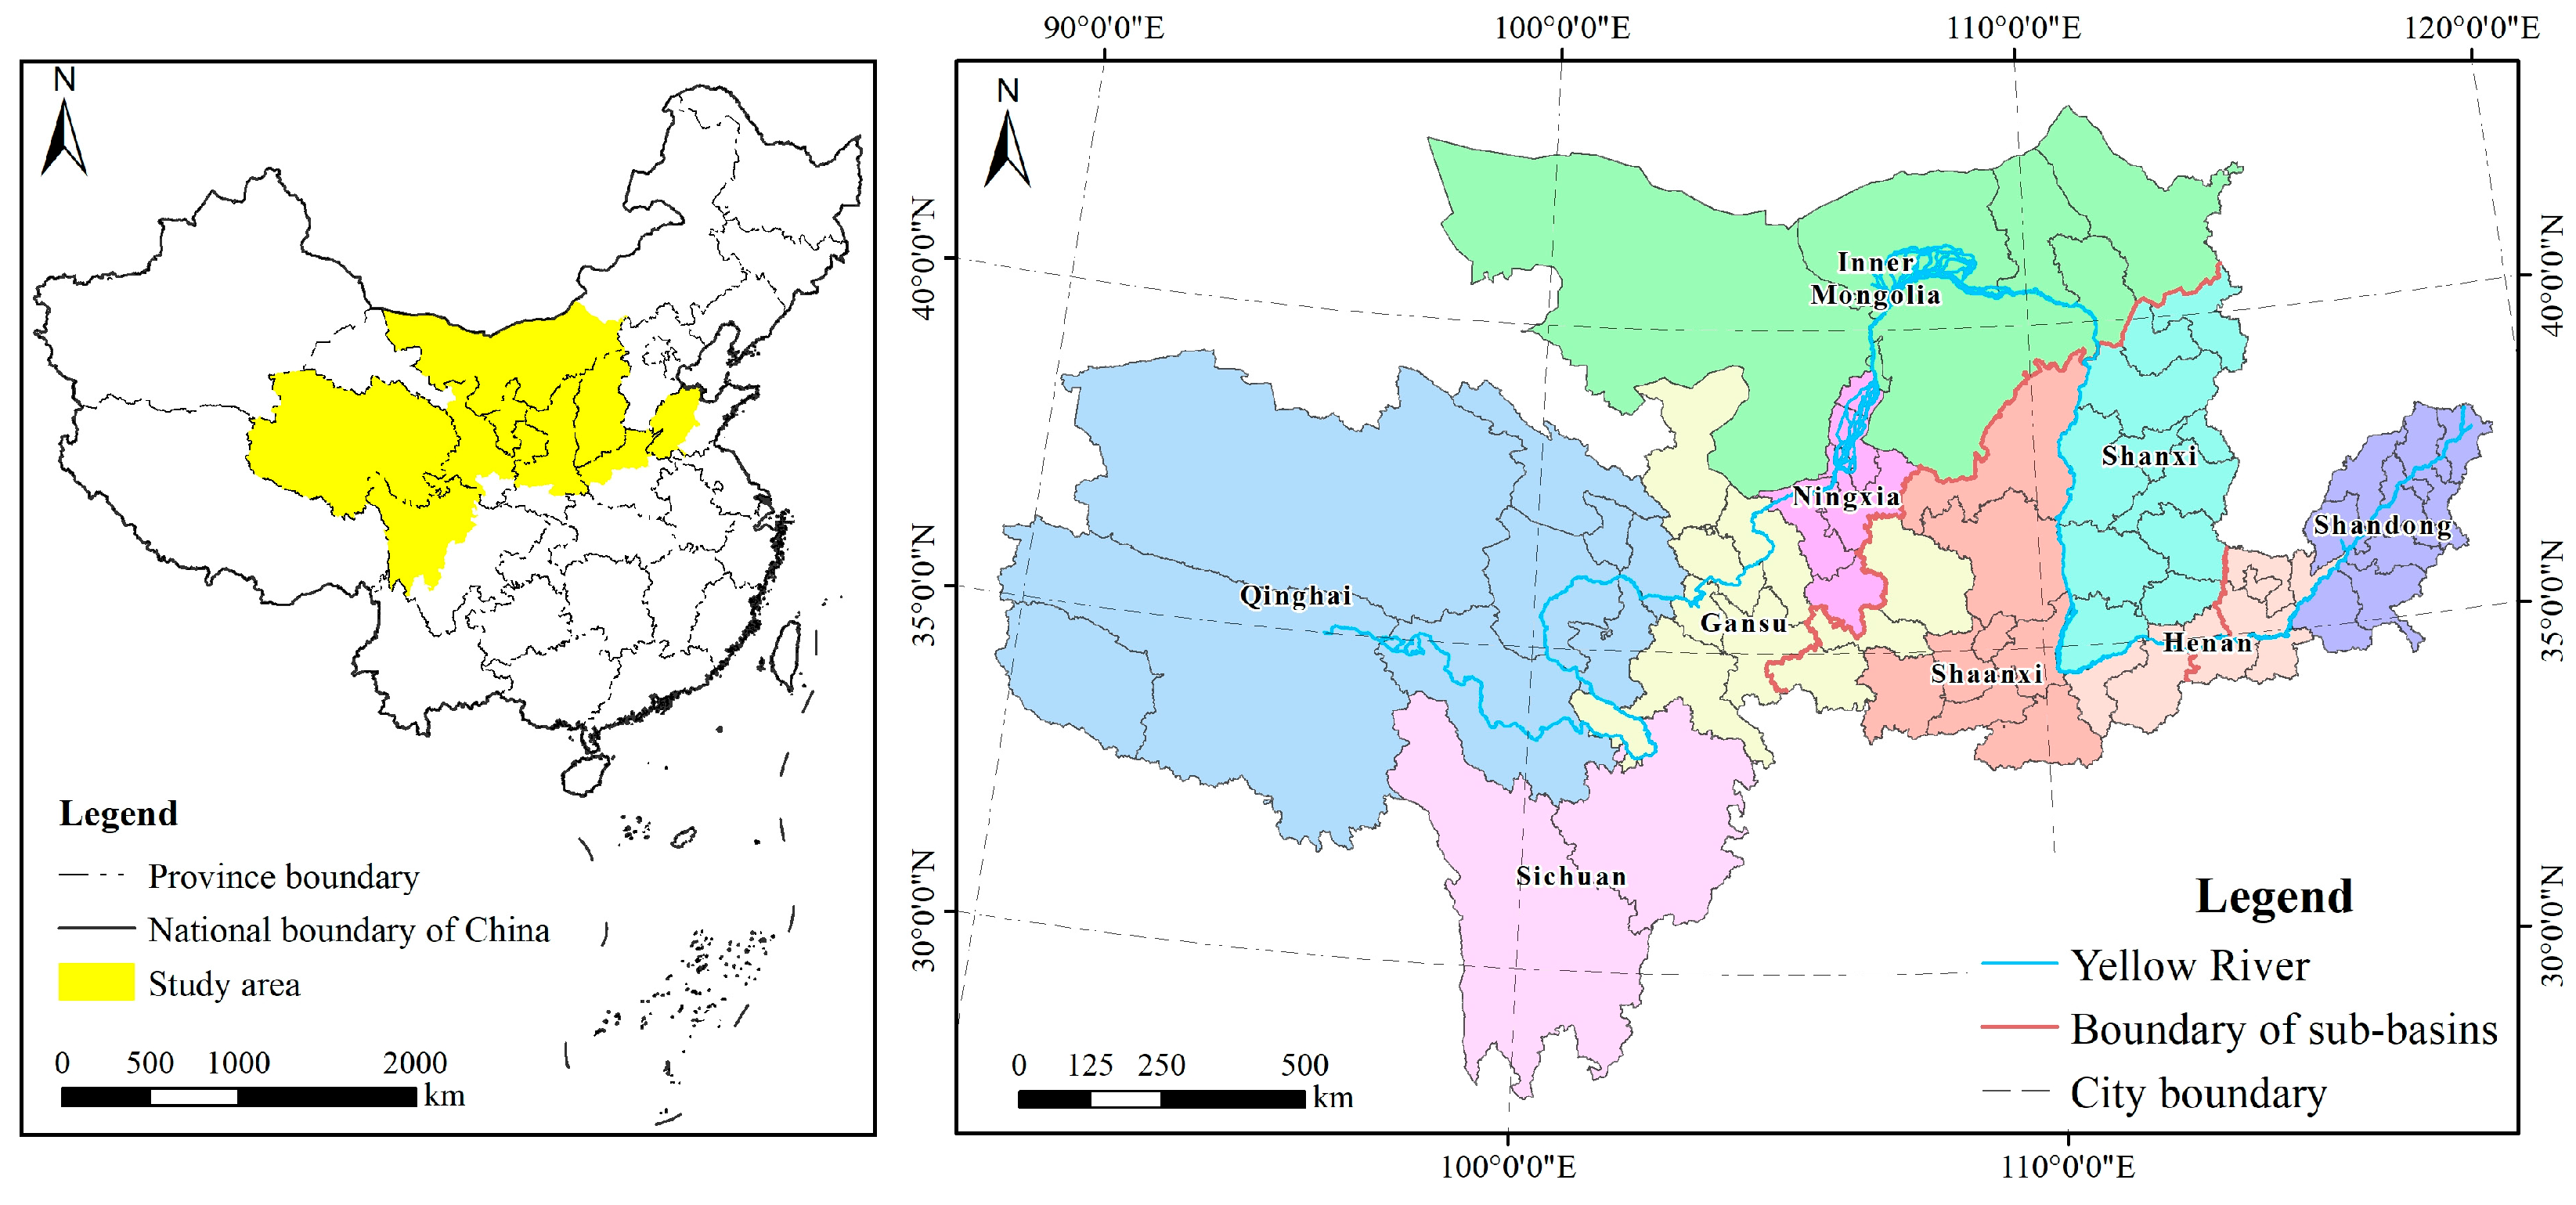
Figure 2.
The net carbon emissions (a), carbon source emissions (b), and carbon sink absorption (c). Note: Net carbon emissions = carbon emissions – absolute value of carbon absorption.
Figure 2.
The net carbon emissions (a), carbon source emissions (b), and carbon sink absorption (c). Note: Net carbon emissions = carbon emissions – absolute value of carbon absorption.
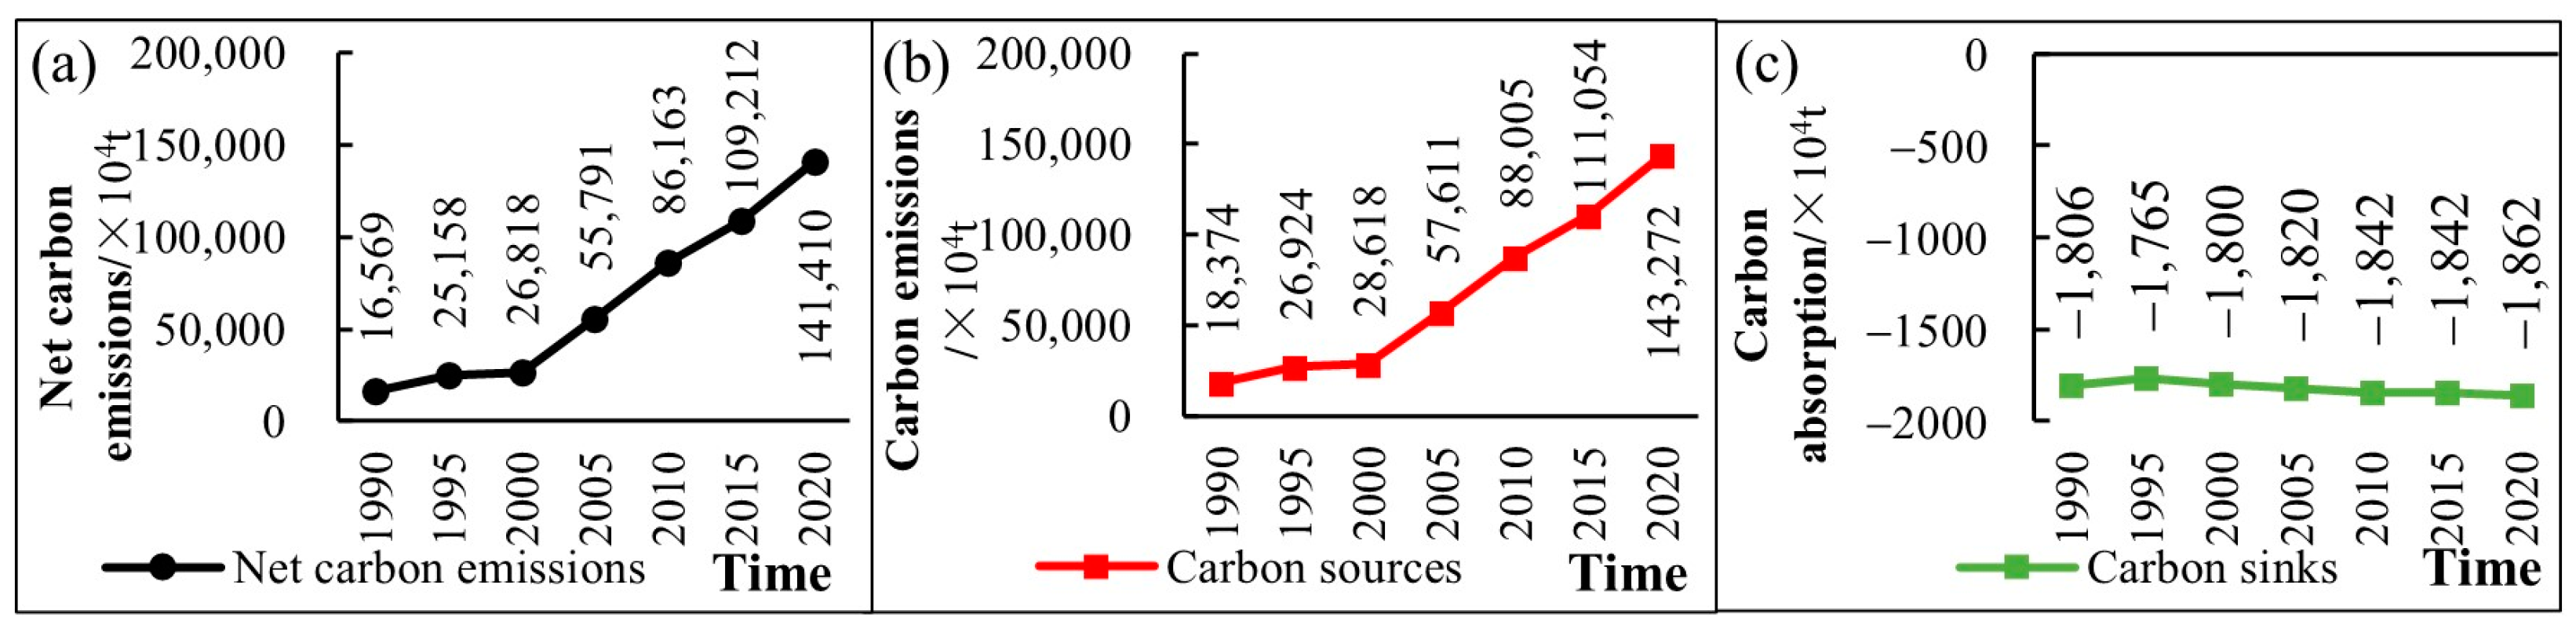
Figure 3.
The distribution of various land-use carbon sources/sinks (a,b,d,e); the proportion of carbon sources/sinks (c,f).
Figure 3.
The distribution of various land-use carbon sources/sinks (a,b,d,e); the proportion of carbon sources/sinks (c,f).
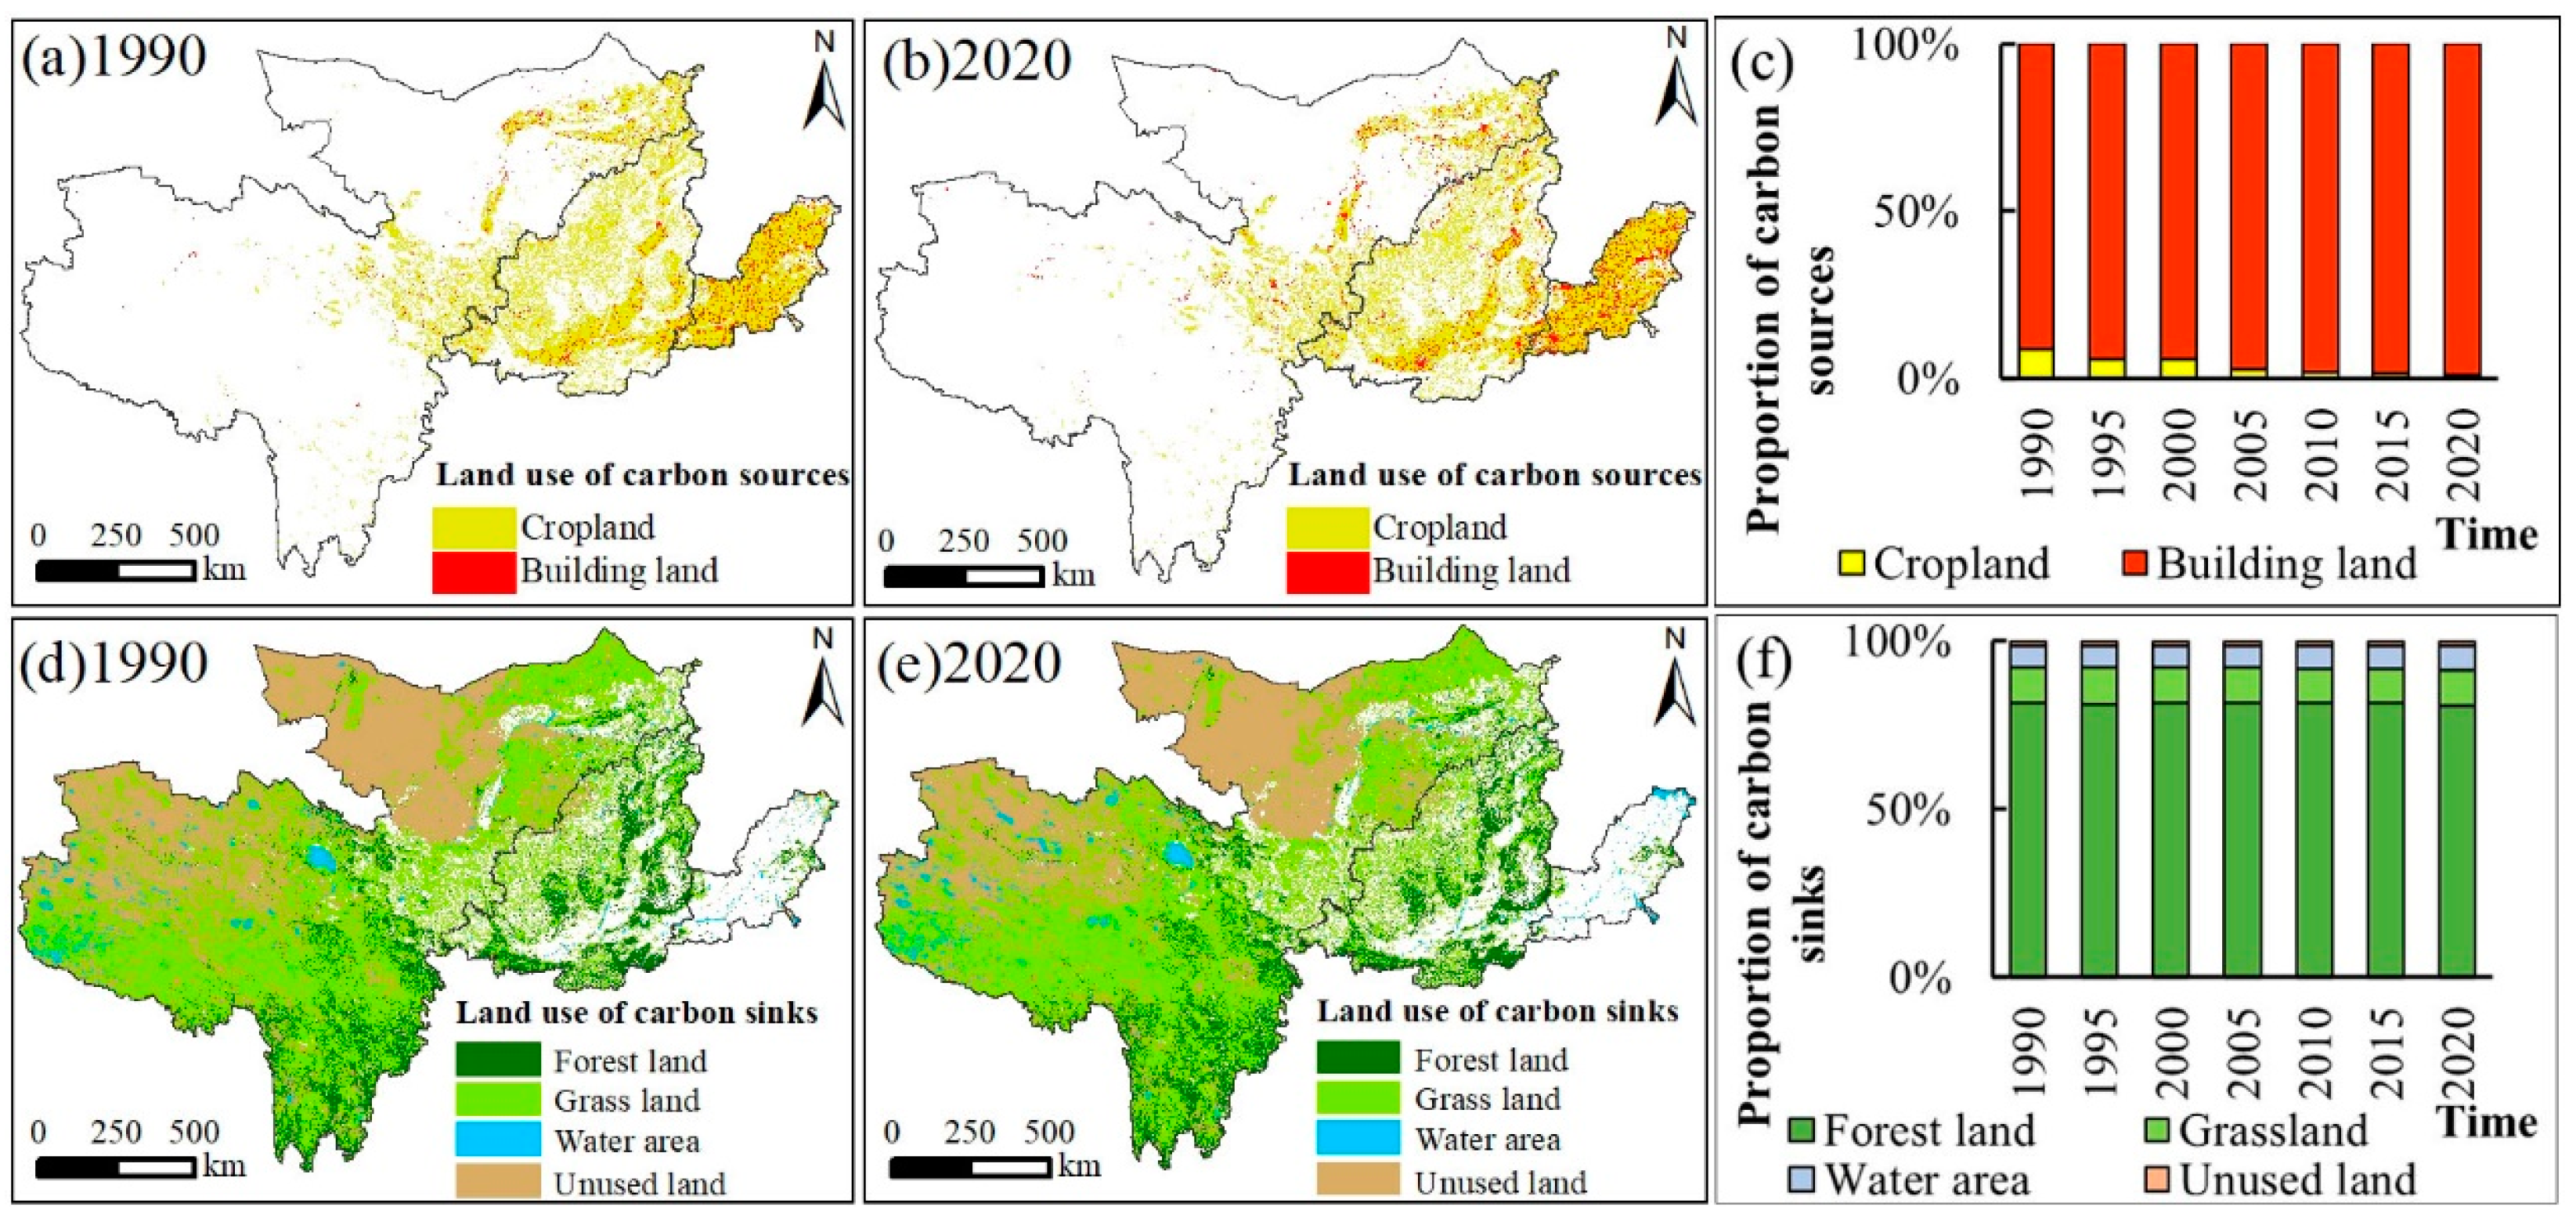
Figure 4.
The proportion of LUCE (a) and the value of LUCE (b) in different basins of the YRB from 1990 to 2020.
Figure 4.
The proportion of LUCE (a) and the value of LUCE (b) in different basins of the YRB from 1990 to 2020.
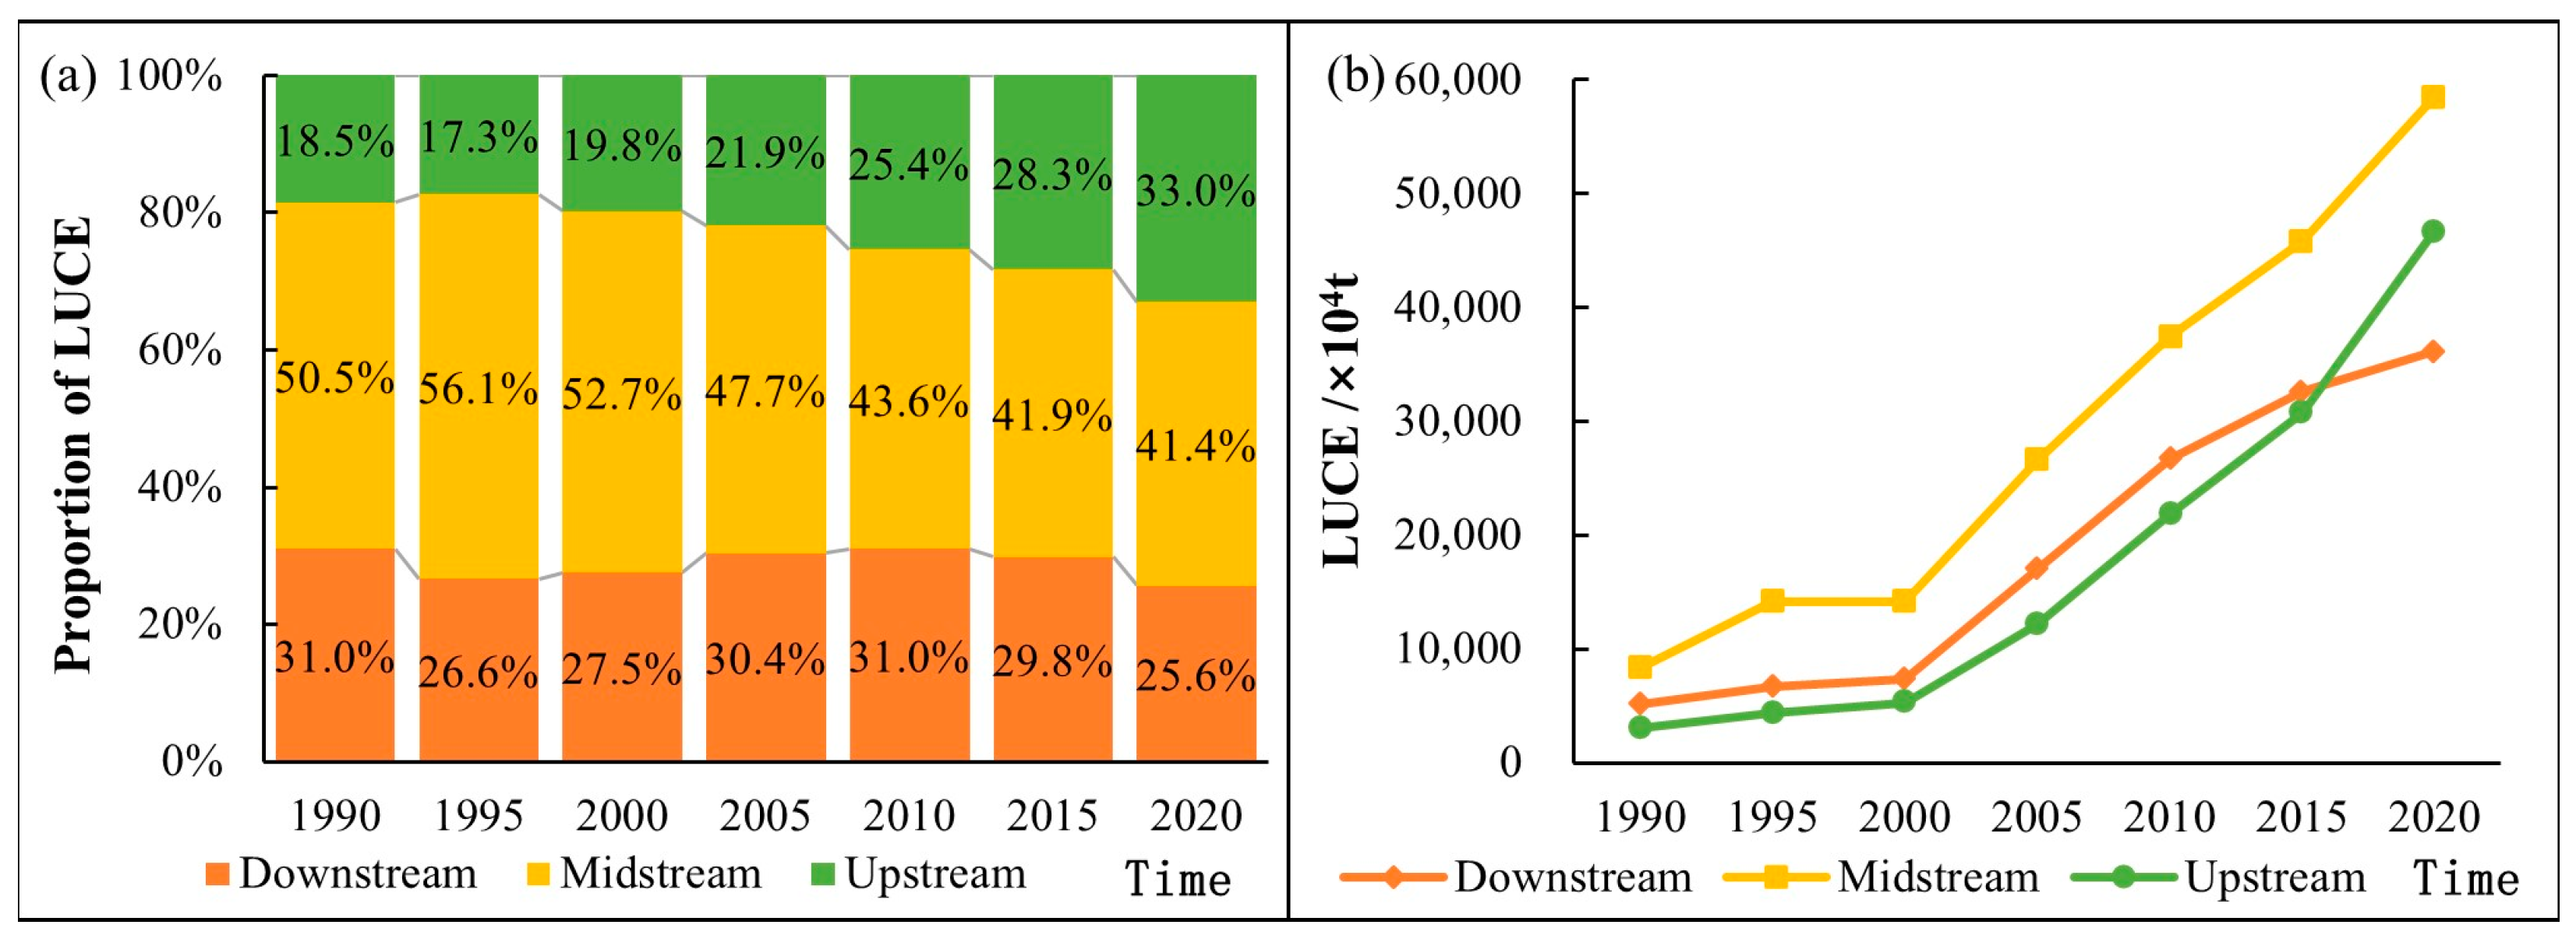
Figure 5.
The cities’ LUCE in different sub-basins of the YRB during different periods (a). The spatial evolution of city-level LUCE in the YRB from 1990 to 2020 (b–h). In figure (a), the middle line of the box represents the median of the data; the upper and lower limits of the box are the upper and lower quartiles of the data, respectively; the two lines above and below the box represent the maximum observed value (upper edge) and the minimum observed value (lower edge), respectively; the dots above the upper edge represent the outliers in the data that exceed the maximum observation values.
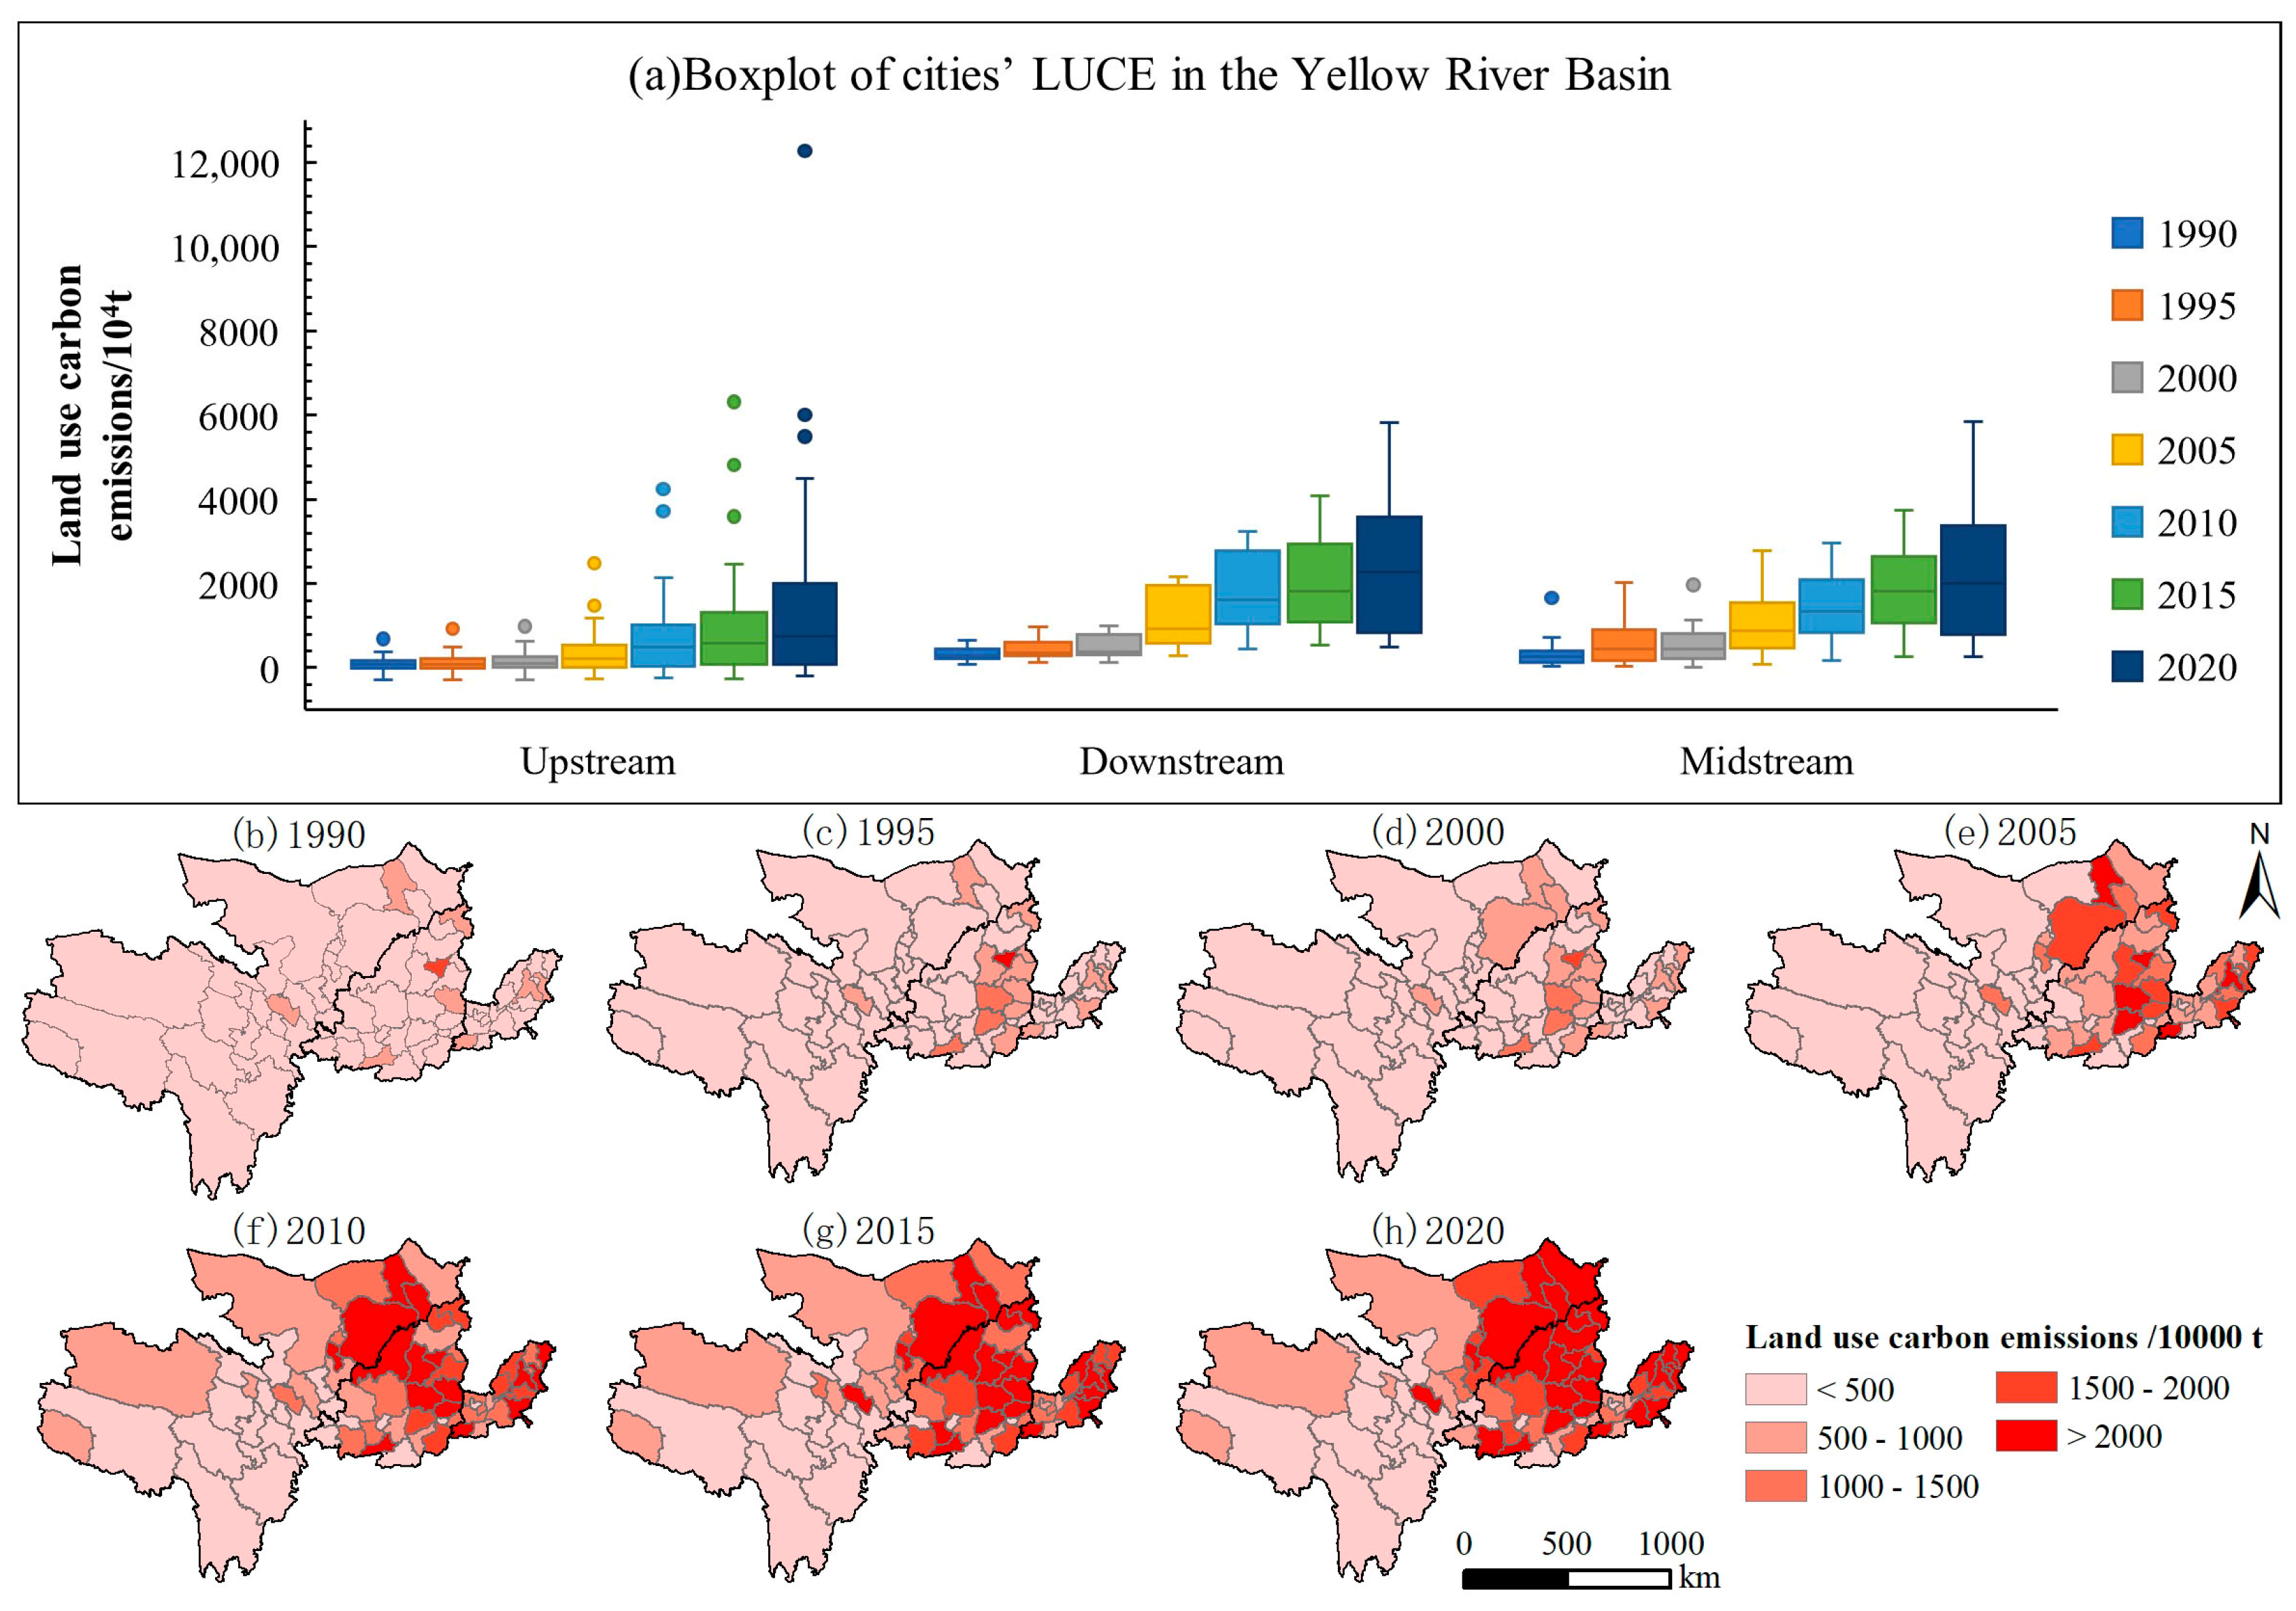
Figure 6.
LISA results of the LUCE of cities in the YRB from 1990 to 2020.

Figure 7.
Decoupling of LUCE and economic development of cities in study area.
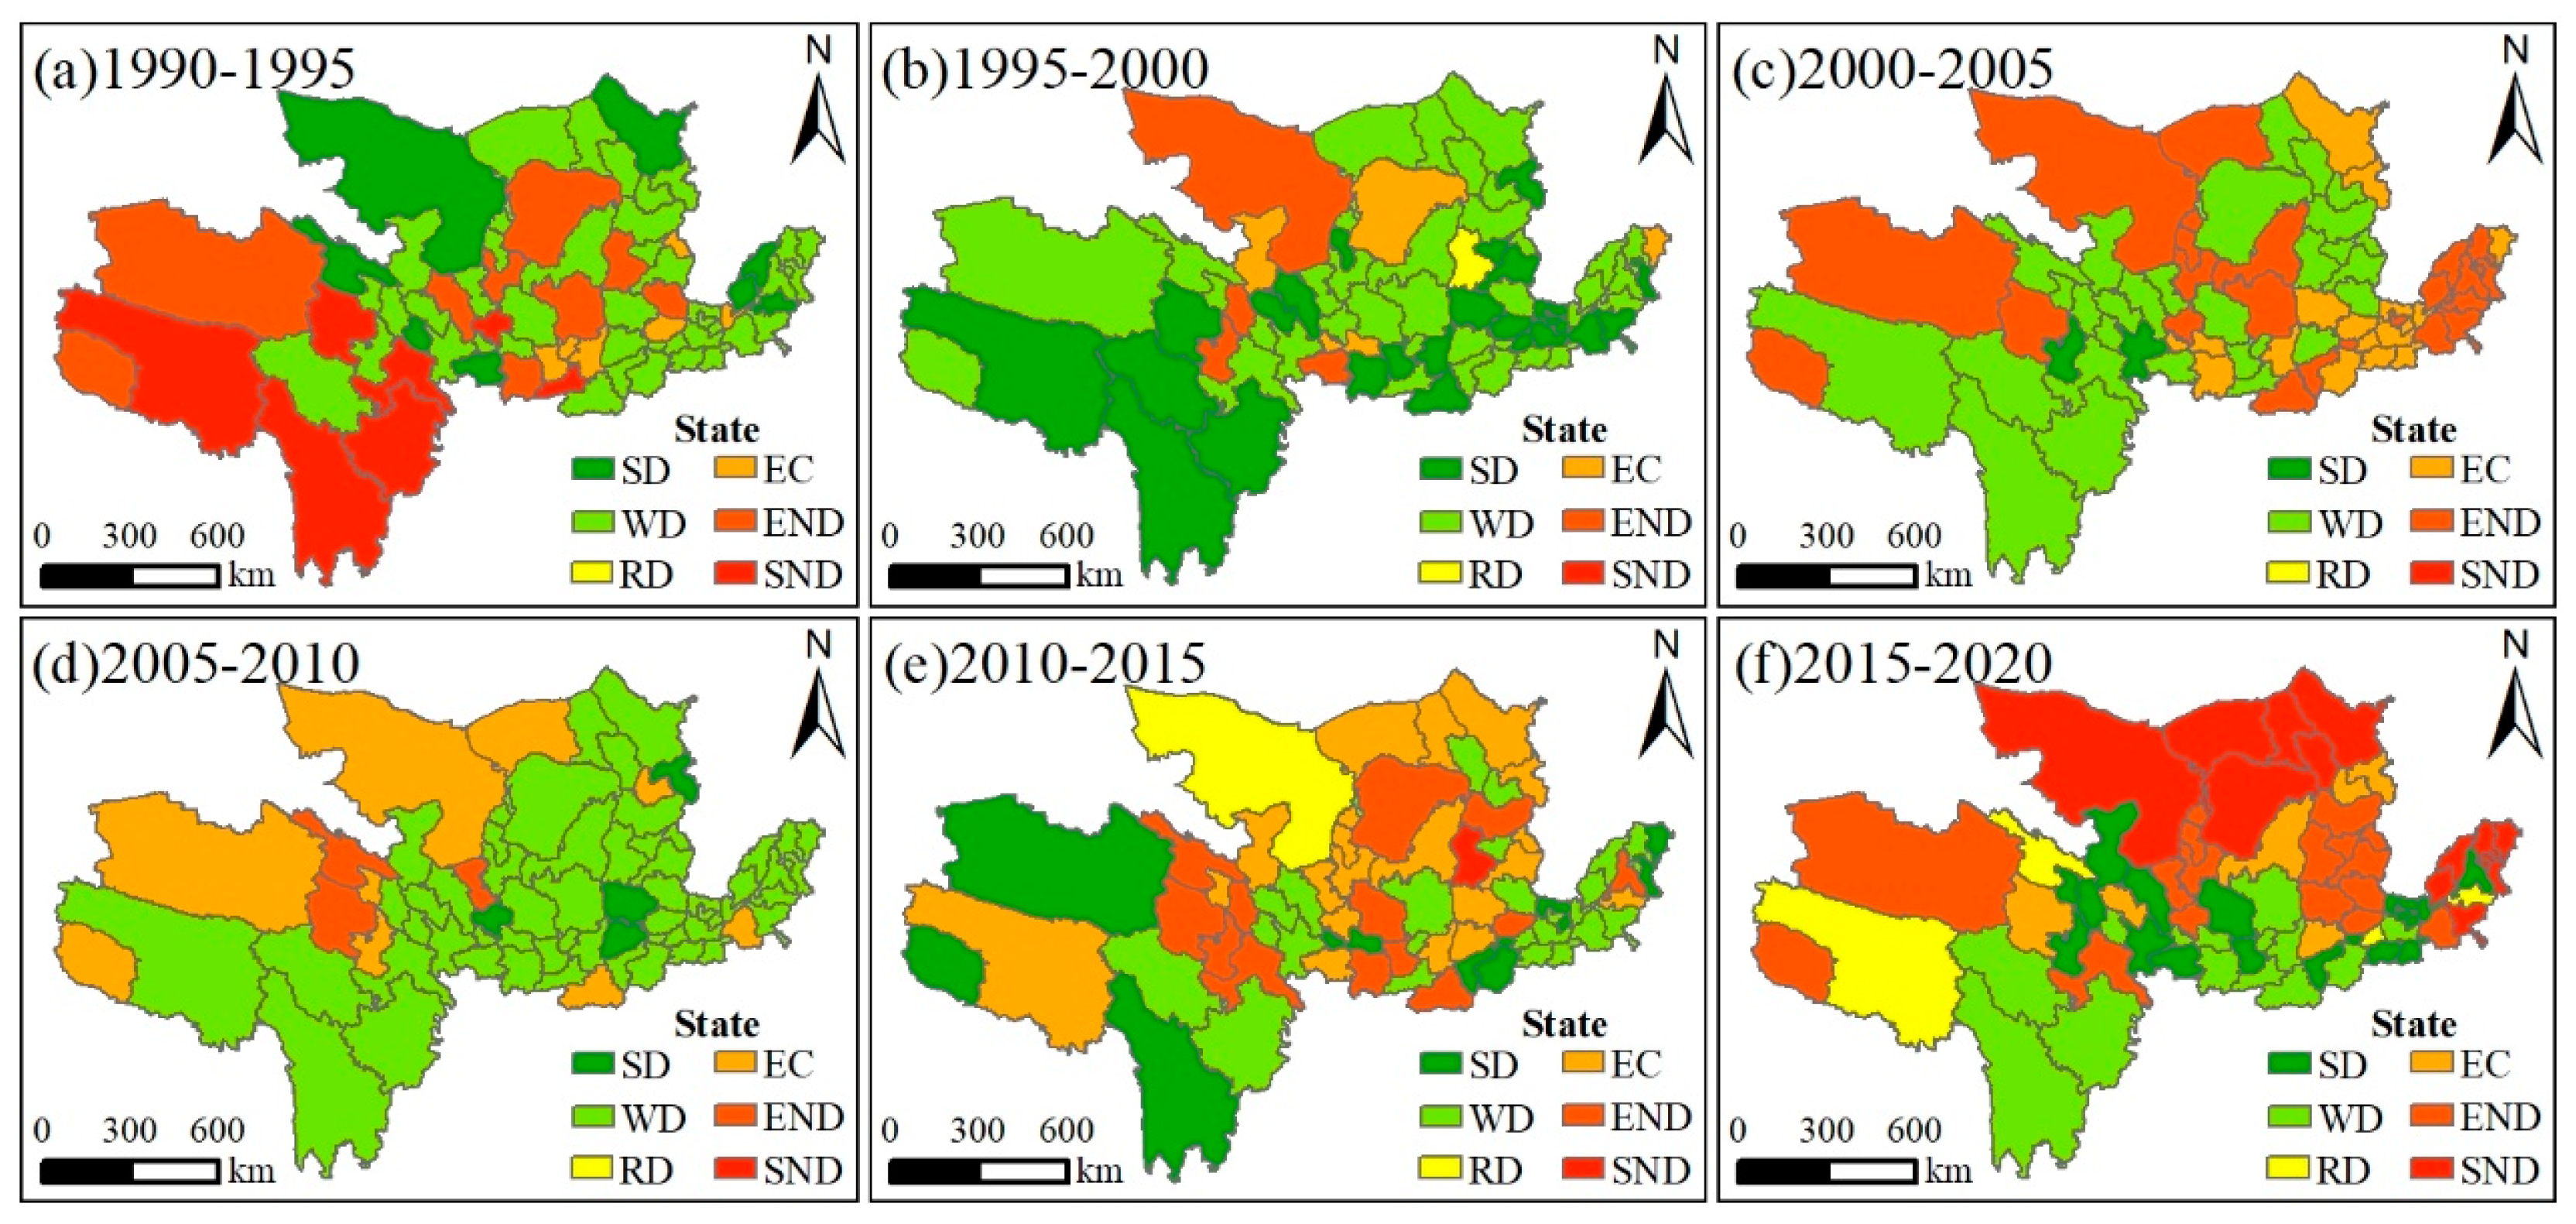
Figure 8.
The changes in LUCE and the effect value of influencing factors. Note: For the colored bars (orange, blue, red, and pink), positive values indicate a promoting effect and negative values indicate an inhibitory effect. The dots on the grey polyline represent the changes of LUCE of the YRB (Numerical unit: 104 t).

Table 1.
Data source and description.
| Category | Name | Spatial Resolution | Unit | Source |
|---|---|---|---|---|
| Land-use data | Remote-sensing monitoring data of land use | 30 m × 30 m | - | RESDC 1 |
| Energy and socio-economic data | Consumption of various types of energy 2 | Provincial level | t | China Energy Statistical Yearbook, China City Statistical Yearbook, China Statistical Yearbook, relevant provincial statistical yearbooks, and statistical bulletin of relevant cities |
| GDP | City level | CNY 10,000 | ||
| Population | City level | 10,000 people | ||
| Output value of industry | City level | CNY 10,000 | ||
| Electricity consumption | City level | Billion kW·h | ||
| Output value of farming, forestry, animal husbandry, and fisheries | City level | CNY 10,000 | ||
| Output value of construction | City level | CNY 10,000 | ||
| Transportation and postal services | City level | CNY 10,000 | ||
| Total retail sales of consumer goods | City level | CNY 10,000 | ||
| Carbon emission coefficient data | Carbon emission coefficient data | - | t/(hm2·a) | [30,31,32,33,34] |
1 RESDC: the Resource and Environment Science and Data Center of the Chinese Academy of Sciences (https://www.resdc.cn/, accessed on 10 July 2023) [35]. 2 The specific energy types include: coal, coke, crude oil, gasoline, kerosene, diesel oil, fuel oil, natural gas, electricity.
Table 2.
EBT energy consumption categories and indicators.
| Item | Allocation Indicators |
|---|---|
| 1. Input (−) and Output (+) of Transformation | Output Value of Industrial |
| 2. Loss | Electricity Consumption |
| 3. Total Final Consumption: | |
| a. Agriculture, Forestry, Animal Husbandry, and Fishery | Output Value of Farming, Forestry, Animal Husbandry, and Fishery |
| b. Industry | Output Value of Industry |
| c. Construction | Output Value of Construction |
| d. Transport, Storage, and Post | Transportation and Postal Services |
| e. Wholesale and Retail Trades, Hotels, and Catering Services | Total Retail Sales of Consumer Goods |
| f. Residential | Population |
| g. Others | Population |
Table 3.
Correlation coefficient of carbon emissions from energy consumption 1.
| Energy Types | Coal | Coke | Crude Oil | Gasoline | Kerosene | Diesel Oil | Fuel Oil | Natural Gas | Electricity |
|---|---|---|---|---|---|---|---|---|---|
| NCV/(kJ/kg) | 20,908 | 28,435 | 41,816 | 43,070 | 43,070 | 42,652 | 41,816 | 38,931 | - |
| CC/(kg/GJ) | 25.8 | 29.2 | 20.0 | 20.2 | 19.5 | 20.2 | 21.1 | 15.3 | - |
| COF | 0.94 | 0.93 | 0.98 | 0.98 | 0.98 | 0.98 | 0.98 | 0.99 | - |
| CEC/(kgC/kg) | 0.5394 | 0.8303 | 0.8363 | 0.8700 | 0.8399 | 0.8616 | 0.8823 | 0.5956 | 1.9623; 1.1666; 1.4804 |
1 (1) Since the provinces covered by the study area are located in different regional power grids, the CEC of provinces is different. Shanxi, Inner Mongolia, and Shandong belong to the North China regional power grid, with a CEC of 0.2412 tC/t. Henan and Sichuan belong to the central China regional power grid, with a CEC of 0.1434 tC/t, and Shaanxi, Gansu, Qinghai, and Ningxia Hui Autonomous Region belong to the northwest regional power grid, with a CEC of 0.1819 tC/t. (2) 1 GJ = 1 × 10⁶ kJ.
Table 4.
Decoupling elasticity and decoupling state.
| State | ΔC | ΔGDP | Decoupling Elasticity (e) | |
|---|---|---|---|---|
| Decoupling | SD 1 | <0 | >0 | <0 |
| WD 2 | >0 | >0 | 0 < e < 0.8 | |
| RD 3 | <0 | <0 | e > 1.2 | |
| Negative decoupling | WND 4 | <0 | <0 | 0 < e < 0.8 |
| SND 5 | >0 | <0 | <0 | |
| END 6 | >0 | >0 | e > 1.2 | |
| Coupling | RC 7 | >0 | >0 | 0.8 < e < 1.2 |
| EC 8 | <0 | <0 | 0.8 < e < 1.2 | |
1 SD: Strong Decoupling. 2 WD: Weak Decoupling. 3 RD: Recessive Decoupling. 4 WND: Weak Negative Decoupling. 5 SND: Strong Negative Decoupling. 6 END: Expansive Negative Decoupling. 7 RC: Recessive Coupling. 8 EC: Expansive Coupling.
Table 5.
Area and change of land-use types in the YRB.
| Time | Item | Cropland | Forest Land | Grass Land | Water Area | Building Land | Unused Land |
|---|---|---|---|---|---|---|---|
| 1990 | Area/km2 | 332,751.7 | 228,748.3 | 909,203.6 | 44,695.3 | 32,658.3 | 569,598.8 |
| 1995 | Area/km2 | 330,148.9 | 222,081.2 | 955,937.1 | 42,532.1 | 33,366.7 | 533,590 |
| 2000 | Area/km2 | 335,246.4 | 228,088.6 | 904,779.1 | 44,606 | 35,426.4 | 569,509.4 |
| 2005 | Area/km2 | 329,966.1 | 230,754.1 | 902,659.5 | 45,858.1 | 38,501.6 | 569,916.6 |
| 2010 | Area/km2 | 326,217.7 | 233,431.6 | 907,064.6 | 47,772.4 | 48,272.4 | 554,897.3 |
| 2015 | Area/km2 | 323,936.2 | 233,218.6 | 906,101 | 48,251.9 | 51,715.7 | 554,432.5 |
| 2020 | Area/km2 | 317,829.3 | 234,045.9 | 918,257.5 | 53,260.9 | 54,717.8 | 539,544.7 |
| 1990–2020 | Average proportion of area/% | 15.49 | 10.86 | 43.20 | 2.21 | 1.99 | 26.25 |
| 1990–2020 | Area change/km2 | −14,922 | 5298 | 9054 | 8566 | 22,059 | −30,054 |
| 1990–2020 | Area change rate/% | −4.48 | 2.32 | 1.00 | 19.16 | 67.55 | −5.28 |
Table 6.
Transfer matrix of land-use types in the YRB from 1990 to 2020, /km2.
| 2020 | ||||||||
|---|---|---|---|---|---|---|---|---|
| Cropland | Forest Land | Grass Land | Water Area | Building Land | Unused Land | Total | ||
| 1990 | Cropland | 291,293.47 | 4827.86 | 14,242.78 | 2099.43 | 19,434.86 * | 853.25 | 332,751.65 |
| Forest land | 2841.54 | 213,105.69 | 11,007.60 | 329.33 | 1017.82 | 446.29 | 228,748.28 | |
| Grass land | 15,056.35 * | 14,991.62 * | 855,354.70 | 3283.83 | 4795.78 | 15,721.34 * | 909,203.62 | |
| Water area | 1760.06 | 133.09 | 1077.81 | 40,109.94 | 434.52 | 1179.88 | 44,695.30 | |
| Building land | 4222.27 | 95.28 | 275.52 | 593.34 | 27,425.29 | 46.64 | 32,658.34 | |
| Unused land | 2655.59 | 892.32 | 36,299.06 * | 6845.05 * | 1609.52 | 521,297.28 | 569,598.81 | |
| Total | 317,829.29 | 234,045.86 | 918,257.46 | 53,260.92 | 54,717.78 | 539,544.68 | 2,117,656.01 | |
* Represents the maximum amount of land change from other land-use types into a certain type of land. This implies the maximum value of each column in the table except the last row and the value of the unchanged land-use type.
Table 7.
Global spatial autocorrelation analysis results of the LUCE of cities in the YRB.
| Time | 1990 | 1995 | 2000 | 2005 | 2010 | 2015 | 2020 |
|---|---|---|---|---|---|---|---|
| Moran’s I | 0.245648 | 0.351241 | 0.342041 | 0.399768 | 0.427718 | 0.348297 | 0.369333 |
| Z score | 3.644686 | 4.901269 | 4.749365 | 5.403033 | 5.766409 | 4.815459 | 5.296949 |
| p value | 0.000268 | 0.000001 | 0.000002 | 0.000000 | 0.000000 | 0.000001 | 0.000000 |
Table 8.
Decoupling state of LUCE and economic development in the YRB and its sub-basins.
| Basin | 1990–1995 | 1995–2000 | 2000–2005 | 2005–2010 | 2010–2015 | 2015–2020 | ||||||
|---|---|---|---|---|---|---|---|---|---|---|---|---|
| e 1 | State | e | State | e | State | e | State | e | State | e | State | |
| YRB | 0.753 | WD | 0.128 | WD | 0.952 | EC | 0.536 | WD | 0.696 | WD | 2.151 | END |
| Upstream | 0.824 | EC | 0.397 | WD | 0.894 | EC | 0.603 | WD | 0.978 | EC | −10.957 | SND |
| Midstream | 1.198 | EC | 0.005 | WD | 0.752 | WD | 0.403 | WD | 0.667 | WD | 0.955 | EC |
| Downstream | 0.353 | WD | 0.184 | WD | 1.283 | END | 0.637 | WD | 0.532 | WD | 1.034 | EC |
1 e: the value of decoupling elasticity.
Disclaimer/Publisher’s Note: The statements, opinions and data contained in all publications are solely those of the individual author(s) and contributor(s) and not of MDPI and/or the editor(s). MDPI and/or the editor(s) disclaim responsibility for any injury to people or property resulting from any ideas, methods, instructions or products referred to in the content. |
© 2023 by the authors. Licensee MDPI, Basel, Switzerland. This article is an open access article distributed under the terms and conditions of the Creative Commons Attribution (CC BY) license (https://creativecommons.org/licenses/by/4.0/).
Share and Cite
MDPI and ACS Style
Wang, X.; Zhao, X.; Zhang, S.; Shi, S.; Zhang, X. Decoupling Effect and Driving Factors of Land-Use Carbon Emissions in the Yellow River Basin Using Remote Sensing Data. Remote Sens. 2023, 15, 4446. https://doi.org/10.3390/rs15184446
AMA Style
Wang X, Zhao X, Zhang S, Shi S, Zhang X. Decoupling Effect and Driving Factors of Land-Use Carbon Emissions in the Yellow River Basin Using Remote Sensing Data. Remote Sensing. 2023; 15(18):4446. https://doi.org/10.3390/rs15184446
Chicago/Turabian StyleWang, Xiaolei, Xue Zhao, Shiru Zhang, Shouhai Shi, and Xiang Zhang. 2023. "Decoupling Effect and Driving Factors of Land-Use Carbon Emissions in the Yellow River Basin Using Remote Sensing Data" Remote Sensing 15, no. 18: 4446. https://doi.org/10.3390/rs15184446
Note that from the first issue of 2016, this journal uses article numbers instead of page numbers. See further details here.