Article

Modeling and Implementation of a Joint Airborne Ground Penetrating Radar and Magnetometer System for Landmine Detection

1
Department of Electronic Engineering, Sogang University, Seoul 04107, Republic of Korea
2
Korea Institute Ocean Science & Technology, Busan 49111, Republic of Korea
*
Author to whom correspondence should be addressed.
Remote Sens. 2023, 15(15), 3813; https://doi.org/10.3390/rs15153813
Submission received: 29 May 2023 / Revised: 20 July 2023 / Accepted: 27 July 2023 / Published: 31 July 2023
(This article belongs to the Special Issue Multi-Data Applied to Near-Surface Geophysics)

Abstract

:
We modeled and implemented a joint airborne system integrating ground penetrating radar (GPR) and magnetometer (MAG) models specifically for landmine detection applications. We conducted both simulations and experimental analyses of the joint airborne GPR and MAG models, with a focus on detecting the metallic components of different types of landmines, including antitank (AT) M15 metallic, antipersonnel (AP) M16 metallic, and AT M19 plastic (minimum-metal) landmines. The GPR model employed the finite-difference time-domain (FDTD) method and was evaluated using a singular value decomposition (SVD) and Kirchhoff migration (KM) with matched filtering (MF). These advanced techniques enabled the automatic identification and precise focusing of the reflected hyperbolic signals emitted by the landmines while considering cross-range resolution. Additionally, the MAGs were utilized based on the magnetic dipole model with a de-trend and a spatial median filtering method to estimate the magnetic anomaly of the landmines while considering various data spatial intervals. The joint airborne GPR and MAG system was implemented by combining and integrating the GPR and MAG models for experimental validation. Through this comprehensive approach, which included experiments, simulations, and data processing, the design parameters of the final system were obtained. These design parameters can be used in the development and application of landmine detection systems based on airborne GPR and MAG technology.

Graphical Abstract

1. Introduction

The threat posed by landmines is a significant concern around the world, with devastating consequences for civilian populations and military personnel. The detection and removal of landmines are challenging tasks that require advanced technologies capable of accurately identifying and locating these hidden hazards. In recent years, promising results have been achieved in the integration of different sensing modalities, potentially improving the effectiveness of landmine detection systems.
Unmanned aerial vehicles (UAVs) and drones have emerged as valuable tools in the field of landmine detection research. Recent studies have explored various detection strategies using lightweight sensors, such as ground penetrating radar (GPR) [1,2], ground penetrating synthetic aperture radar (GPSAR) [3,4,5,6], magnetometers (MAGs) [7,8], metal detectors [9,10], and thermal imaging cameras [11] mounted on UAVs for landmine detection. These techniques have numerous advantages, including precise autonomous flight capabilities; the potential for integrating multiple sensors, innovative avionic systems, and energy-efficient batteries; and substantially reduced costs and maintenance requirements.
Ground penetrating radar is widely used for subsurface sensing, allowing for the high-resolution imaging of buried objects. By emitting electromagnetic pulses and analyzing the resulting reflected signals, GPR can detect variations in dielectric properties and identify buried objects, such as landmines. However, GPR has certain drawbacks that should be considered in landmine detection applications. These include the following [5,6]:
  • Reduced penetration depth in highly conductive or lossy soils: GPR relies on the propagation and reflection of electromagnetic waves to detect buried objects. However, in soils with high conductivity or high dielectric losses, such as clayey or wet soils, the penetration depth of GPR signals can be significantly reduced. This limitation can hamper the detection of landmines buried at greater depths, particularly in challenging soil conditions.
  • Sensitivity to surface clutter and rough terrain: GPR signals can be affected by surface clutter, such as vegetation, rocks, or surface irregularities. Such clutter can scatter the electromagnetic waves, leading to signal distortion or interference and potentially causing false positives or false negatives. Additionally, rough terrain with uneven surfaces can impact the coupling between the GPR antenna and the ground, affecting the quality and accuracy of the collected data.
  • High data processing and analysis requirements: GPR generates large volumes of data due to its high-resolution imaging capabilities. Processing and analyzing these datasets can be computationally intensive and time-consuming, requiring sophisticated algorithms and significant computational resources. Efficient data processing techniques are essential to handling large datasets and accurately extracting meaningful information for landmine detection.
To overcome these limitations, UAV-borne MAGs have recently been applied in landmine detection research in addition to UAV-borne GPR. Magnetometers can detect the magnetic anomalies produced by metallic objects, including plastic landmines with minimum-metallic components, thereby providing valuable information for their detection and localization. Magnetometers measure magnetic anomalies caused by buried targets that are magnetized by the Earth’s magnetic field. These magnetic anomalies are not significantly affected by soil permittivity, and therefore plastic with minimum-metal landmines can be detected using MAGs, even in high-dielectric moist sand environments. However, compared to UAV-borne GPR, UAV-borne MAGs have certain drawbacks that need to be considered in landmine detection applications [7,8]:
  • Limited detection range: MAGs are primarily sensitive to metallic objects and their magnetic anomalies. While this makes them highly effective in detecting metallic landmines, their detection range is limited compared to GPR. The magnetic field strength decreases rapidly with the third power of the distance, resulting in reduced detection capabilities for buried metallic objects at greater depths.
  • Susceptibility to environmental interference: MAGs are susceptible to environmental magnetic interference, such as variations in the Earth’s magnetic field caused by geological structures or nearby ferrous objects, or the electromagnetic interference (EMI) noise that UAVs generate. These interferences can distort the measurements and lead to false positives or false negatives, compromising the accuracy of landmine detection.
  • Lack of imaging capabilities: unlike GPR, which provides high-resolution images of buried objects, MAGs typically measure magnetic anomalies as scalar quantities. This lack of imaging capability makes it challenging to accurately locate and visualize the exact shape and orientation of detected landmines. Consequently, additional techniques or sensor modalities may be required to precisely determine the spatial characteristics of detected objects.
Despite these drawbacks of the GPR and MAG sensing techniques, UAV-borne GPR remains a valuable tool in landmine detection, especially when combined with other complementary sensing modalities such as MAGs. By integrating GPR with MAGs, the limitations of each can be mitigated, allowing for improved detection accuracy, depth penetration, and discrimination. Integrating multiple sensors can enhance the overall performance and reliability of landmine detection systems, leading to more effective and efficient landmine clearance operations.
The use of UAVs equipped with sensors holds great promise for addressing the challenges of landmine detection. From the perspective of working frequency range, fluxgate MAGs usually operate at a few kHz [12] while GPR operates at 0.5–5 GHz [13]; therefore, the devices do not electromagnetically interfere with each other and can work together seamlessly. By combining GPR and MAG, a joint airborne system could improve the overall performance and reliability of landmine detection.
A variety of joint detection systems have been developed and tested based on combinations of ground vehicle, airborne, and/or handheld data collection devices. A UAV-based magnetic detection system and a manual ground cart-based electromagnetic induction (EMI) system have been combined to detect unexploded ordnance (UXOs) [14]. Handheld dual sensor systems combining electromagnetic-induction (EMI) and GPR sensing techniques have been successfully applied for landmine detection [15]. In a dual sensor experiment, a model plastic (minimum-metal) landmine was buried 6 cm deep in sand with a permittivity of approximately 9. The depths of buried landmines detected separately by the EMI and GPR sensors were 6.2 and 9.1 cm, respectively, such that the EMI sensor obtained a more accurate burial depth than the GPR sensor in high-permittivity soil. However, manually interpreting such results is time-consuming and labor intensive, substantially increasing the cost of practical applications at landmine sites. Therefore, a method for efficient, automatic data processing and interpretation is urgently needed to improve combined UAV-borne GPR and MAG systems.
In recent decades, machine learning has attracted significant attention for the automatic detection of underground objects. The interpretation of GPR data tends to rely on supervised deep learning algorithms, such as faster region-based convolutional neural networks (faster R-CNN) [16,17] and you-only-look-once (YOLO) [18,19], and unsupervised algorithms, such as generative adversarial nets (GANs) [20] and principal component analysis (PCA) [21]. Cognitive GPR for subsurface sensing based on edge computing and deep Q-learning networks (DQNs) has been proposed for application to UAV-based GPR systems [22]. To improve the magnetic anomaly detection performance in terms of colored noise and low signal-to-noise ratio (SNR), during MAG data interpretation, magnetic anomaly signals have been simulated using a dipole model by applying support vector machines (SVMs) [23], a fully connected neural network [24], and convolutional neural networks (CNNs) [25]. These simulated magnetic anomaly signal models are based on scenarios in which the MAG is fixed and the target is moving. They cannot be applied for UAV-based landmine detection because they cannot incorporate the relationship between local and global Earth magnetic field variations along survey lines and therefore easily lose data over long periods of time. Recently, deep learning techniques have been adapted for anomaly detection using time-series or sequential data. Some of these methods are purely data-driven techniques for identifying occasional outliers, whereas others are hybrid methods incorporating feature engineering and prior information into systems designed to robustly characterize anomalous behavior [26].
These methods apply deep learning to process and interpret individual GPR and MAG data surveys. Deep learning has not yet been applied to interpret fused data collected using multiple sensing techniques for landmine detection. Therefore, our objective in this study was to combine airborne GPR and MAG models to improve data processing and interpretation, thereby extending the potential application of deep learning to joint UAV-borne MAG and GPR landmine detection and classification systems. The proposed method takes full advantage of the information contained in different types of simulation and measurement data, resulting in accurate UAV-based evaluations of antitank and antipersonnel landmines.
In this study, we modeled and implemented a joint airborne GPR and MAG system for landmine detection. We conducted both simulations and experiments, with an emphasis on detecting metallic components within various types of landmines, such as antitank (AT) M15 metallic, antipersonnel (AP) M16 metallic, and AT M19 plastic (minimum-metal) landmines. We evaluated a GPR model using GprMax software [27] by combining singular value decomposition (SVD) and Kirchhoff migration (KM) with matched filtering (MF) for UAV-borne GPR modeling and simulation to classify M15, M16, and M19 landmines. The open-source software, GprMax, simulates electromagnetic wave propagation using the finite-difference time-domain (FDTD) method to numerically model GPR. The SVD algorithm was developed to locate and identify hyperbolic signals from radargrams. The UAV-borne MAG was used based on the magnetic dipole model with a de-trend and a spatial median filtering method to estimate the magnetic anomaly of the landmines. Various flight spatial data intervals were considered to optimize the performance of the UAV-borne GPR and MAG systems.
The remainder of this paper is structured as follows. Section II presents the methodology adopted for modeling the joint airborne system, including the UAV-borne GPR and MAG models. Section III describes the simulation and experimental setup and presents the results and analysis. Finally, the findings and implications of the study, along with suggestions for future research, are discussed in Section IV.

2. Materials and Methods

2.1. The UAV-Borne GPR Model

The UAV-borne GPR model scheme is depicted in Figure 1. The GPR is bistatic, with both a transmit and receive antenna. The basic idea is to excite the ground and possible targets with electromagnetic energy, then attempt to infer properties of the ground and targets from the scattering information obtained from the B-scan experiment. One of the biggest problems with GPR is the large ground reflection that occurs. Clutter and noise components, such as antenna crosstalk and air–ground interface reflections, must be removed from GPR images to identify their target features. Typically, GPR datasets (B-scan raw data) are very large and contain considerable information that is superfluous to image characterization. Clutter and noise components must be removed from GPR images to identify their target features. Regarding clutter noise removal techniques in GPR datasets, there are two main categories of techniques: classical filtering methods and subspace techniques. Classical filtering methods encompass approaches like average window subtraction and mean filtering [28], time-gating with zero padding [29], and parametric or statistical-based methods [30]. On the other hand, subspace techniques delve into the statistical properties of the data and decompose it into distinct subspaces, separating the useful information from the noise. Examples of subspace techniques include principal component analysis (PCA) [21] and singular value decomposition (SVD) [31].
We applied the SVD algorithm to B-scan raw data to remove air–ground interface reflections and antenna crosstalk. Within the raw B-scan data, specific components associated with ground effects and noise were identified as the primary factors and subsequently eliminated by MATLAB using the SVD function. By utilizing the SVD technique to minimize noise and ground effects, we successfully extracted a GPR hyperbolic signal that encompassed the effects of landmines.
The extracted hyperbolic signals were used to conduct the migration and MF processing for landmine classification. Migration algorithms serve as tools to solve the GPR inverse problem, wherein the algorithm starts with the electric field measured by the radar and produces a result in the form of geometry or material reconstruction. The representative image migration techniques for GPR are hyperbolic summation, KM [32], frequency wavenumber migration [33], stripmap SAR [34], and back-projection algorithm (BPA) [35], but we did not compare these techniques in detail. We used KM and MF [36] for UAV-borne GPR data processing. The fundamental idea of KM is to trace a hyperbola for each subsurface point. The point being traced is considered the apex of the hyperbola, and it is compared to the intersecting energy of the actual signals. The energy along the traced hyperbola is summed and placed at the apex point. The spread of the hyperbola depends on the propagation velocity of the media on the ground subsurface and the positioning of the antenna above the ground surface. The basic idea mentioned here underlies the concept of 2D-KM; for 3D-KM, the same concepts apply, but hyperboloids are used instead of hyperbolas. Equation (1) represents this concept for the 3D-KM, and Equation (2) represents it for the 2D-KM. Here, Pout is the migrated energy at the migrated point (xp, yp, zp), θ g is the angle between the signal ray heading towards the migration point (xp, yp, t = texp) and a perpendicular line to the ground surface (vertical line), r is the total length of the signal ray from the antennas to the migration point, Pin is the input energy (received radar signals) for migration at the migration point, and texp is the expected time for the migration point to be located over an A-Scan for antennas placed at all possible positions.
P o u t x p ,   y p , z p = 1 2 π cos θ g r t P i n x p   , y p   ,     t = t e x p d x   d y
P o u t x p , z p = 1 2 π cos θ g r t P i n x p   ,     t = t e x p d x
In the case of the UAV-borne GPR model, a special consideration for KM is that the antennas are positioned above the ground at a specific height (hant). One limitation of the migration algorithm developed for this study is that it assumes hant to be constant for all antenna positions.
For conventional geophysical and GPR KM, antennas are usually placed at ground level, resulting in no diffraction of the propagating electromagnetic fields from the ground surface. However, in landmine detection, diffraction occurs at the ground surface, causing a change in the ray’s angle at this interface. Consequently, calculating the ray length between the antennas and the migration point (r), the expected time of reflection arrival (texp), and the angles of propagation in the air ( θ a ) and on the ground ( θ g ) becomes a more complex procedure. These angles are calculated for each combination of migration point and antenna position. The equations used to calculate the angles in the UAV-borne GPR bi-static model are described by Equation (3), where (xp, yp, zp) are the coordinates of the migration point, (xTa, yTa, hant), and (xRa, yRa, hant) are the coordinates of the transmit and receive antennas, respectively. The ray length between the antennas and the migration point is calculated using Equation (4). The expected time of reflection arrival is calculated using Equation (5), where vp is the propagation velocity of the waves on the ground and c0 is the propagation velocity of waves in the air.
x p x T a 2 + y p y T a 2 = z p · t a n θ T g + h a n t · t a n a r c s i n ϵ r · s i n θ T g
x p x R a 2 + y p y R a 2 = z p · t a n θ R g + h a n t · t a n a r c s i n ϵ r · s i n θ R g
r T = r T g + r T a = z p c o s θ T g + h a n t c o s θ T a
r R = r R g + r R a = z p c o s θ R g + h a n t c o s θ R a
t e x p = t T g + t T a + t R g + t R a = z p v p c o s θ T g + h a n t c 0 c o s θ T a + z p v p c o s θ R g + h a n t c 0 c o s θ R a
The propagation velocity undergoes a significant change at the ground surface interface. The propagation velocity is inversely proportional to the square root of the relative permittivity ( v p = c 0 / ϵ r ). This is why the trajectory in the air must be calculated using c0, while the trajectory on the ground must be calculated using vp.
Another consideration for KM is the option to perform full 3D migration using Equation (1) or to employ 2D migration for different B-Scans. The primary advantage of 2D-KM over 3D migration is the reduced processing time required to fully migrate multiple B-Scans. This performance difference stems from the fact that the angles are calculated for each combination of antenna position and migration point. By reducing the dimensionality of antenna and point locations by one, the computational load can be significantly improved. However, it is still possible to obtain a 3D image from 2D migration by sequentially staggering the resulting migrations of the B-Scans, a technique known as 2.5D migration.
The matched filter (MF) algorithm is the most basic focusing algorithm used in synthetic aperture radar (SAR) images. Since the SAR and GPR applications are technically similar, the same reconstruction algorithms can be used for both cases. That is why MF, which is the most straightforward method for forming a SAR image, can be adapted to GPR applications. Mathematically, the matched-filter transfer function is expressed as the complex conjugate of the expected received waveform due to the target to which the filter is being matched. When a matched filter is used to calculate the value at a pixel of an image, the SNR is maximized when a specific target exists at that location. In the formulation of the generalized matched filter-based image, this target is a point scatter, while distributed objects are approximated as a collection of independent point scatters.
In the case of a plastic landmine, it could potentially contain multiple scattering centers, and its internal structure may also produce additional scattering effects. To confirm the presence and understand the characteristics of these internal scattering components, an experimental validation was conducted using impulse radar with an autocorrelation function based on the MF [37]. The internal structure of the target can be described as comprising a central element with a regular pattern and a region of high scattering that only covers a portion of it.
The match filter procedure involves correlating the migrated B-scan data P o u t r , t with an impulse response from a point scatter h r T , r , r R , t , where r T is the transmitter location, r is the pixel location of the point scatter, and r R is the receiver location, as shown in Figure 1. When using the matched filter, the pattern of the received signal is an unknown phenomenon. Therefore, the best approach to designing the matched filter is to use a replica of the transmitted signal. A Ricker waveform and an M-sequence impulsive radar [38] were used in GprMax simulation and UAV-borne GPR experimental studies, respectively; we chose them for the impulse response function (h). The MF output (I) is expressed as follows:
I r = h r T , r , r R , t P o u t r , t d r d t
I x p   , z p   = h r T , r , r R , t P o u t x p , t d x t = t e x p

2.2. The UAV-Borne MAG Model

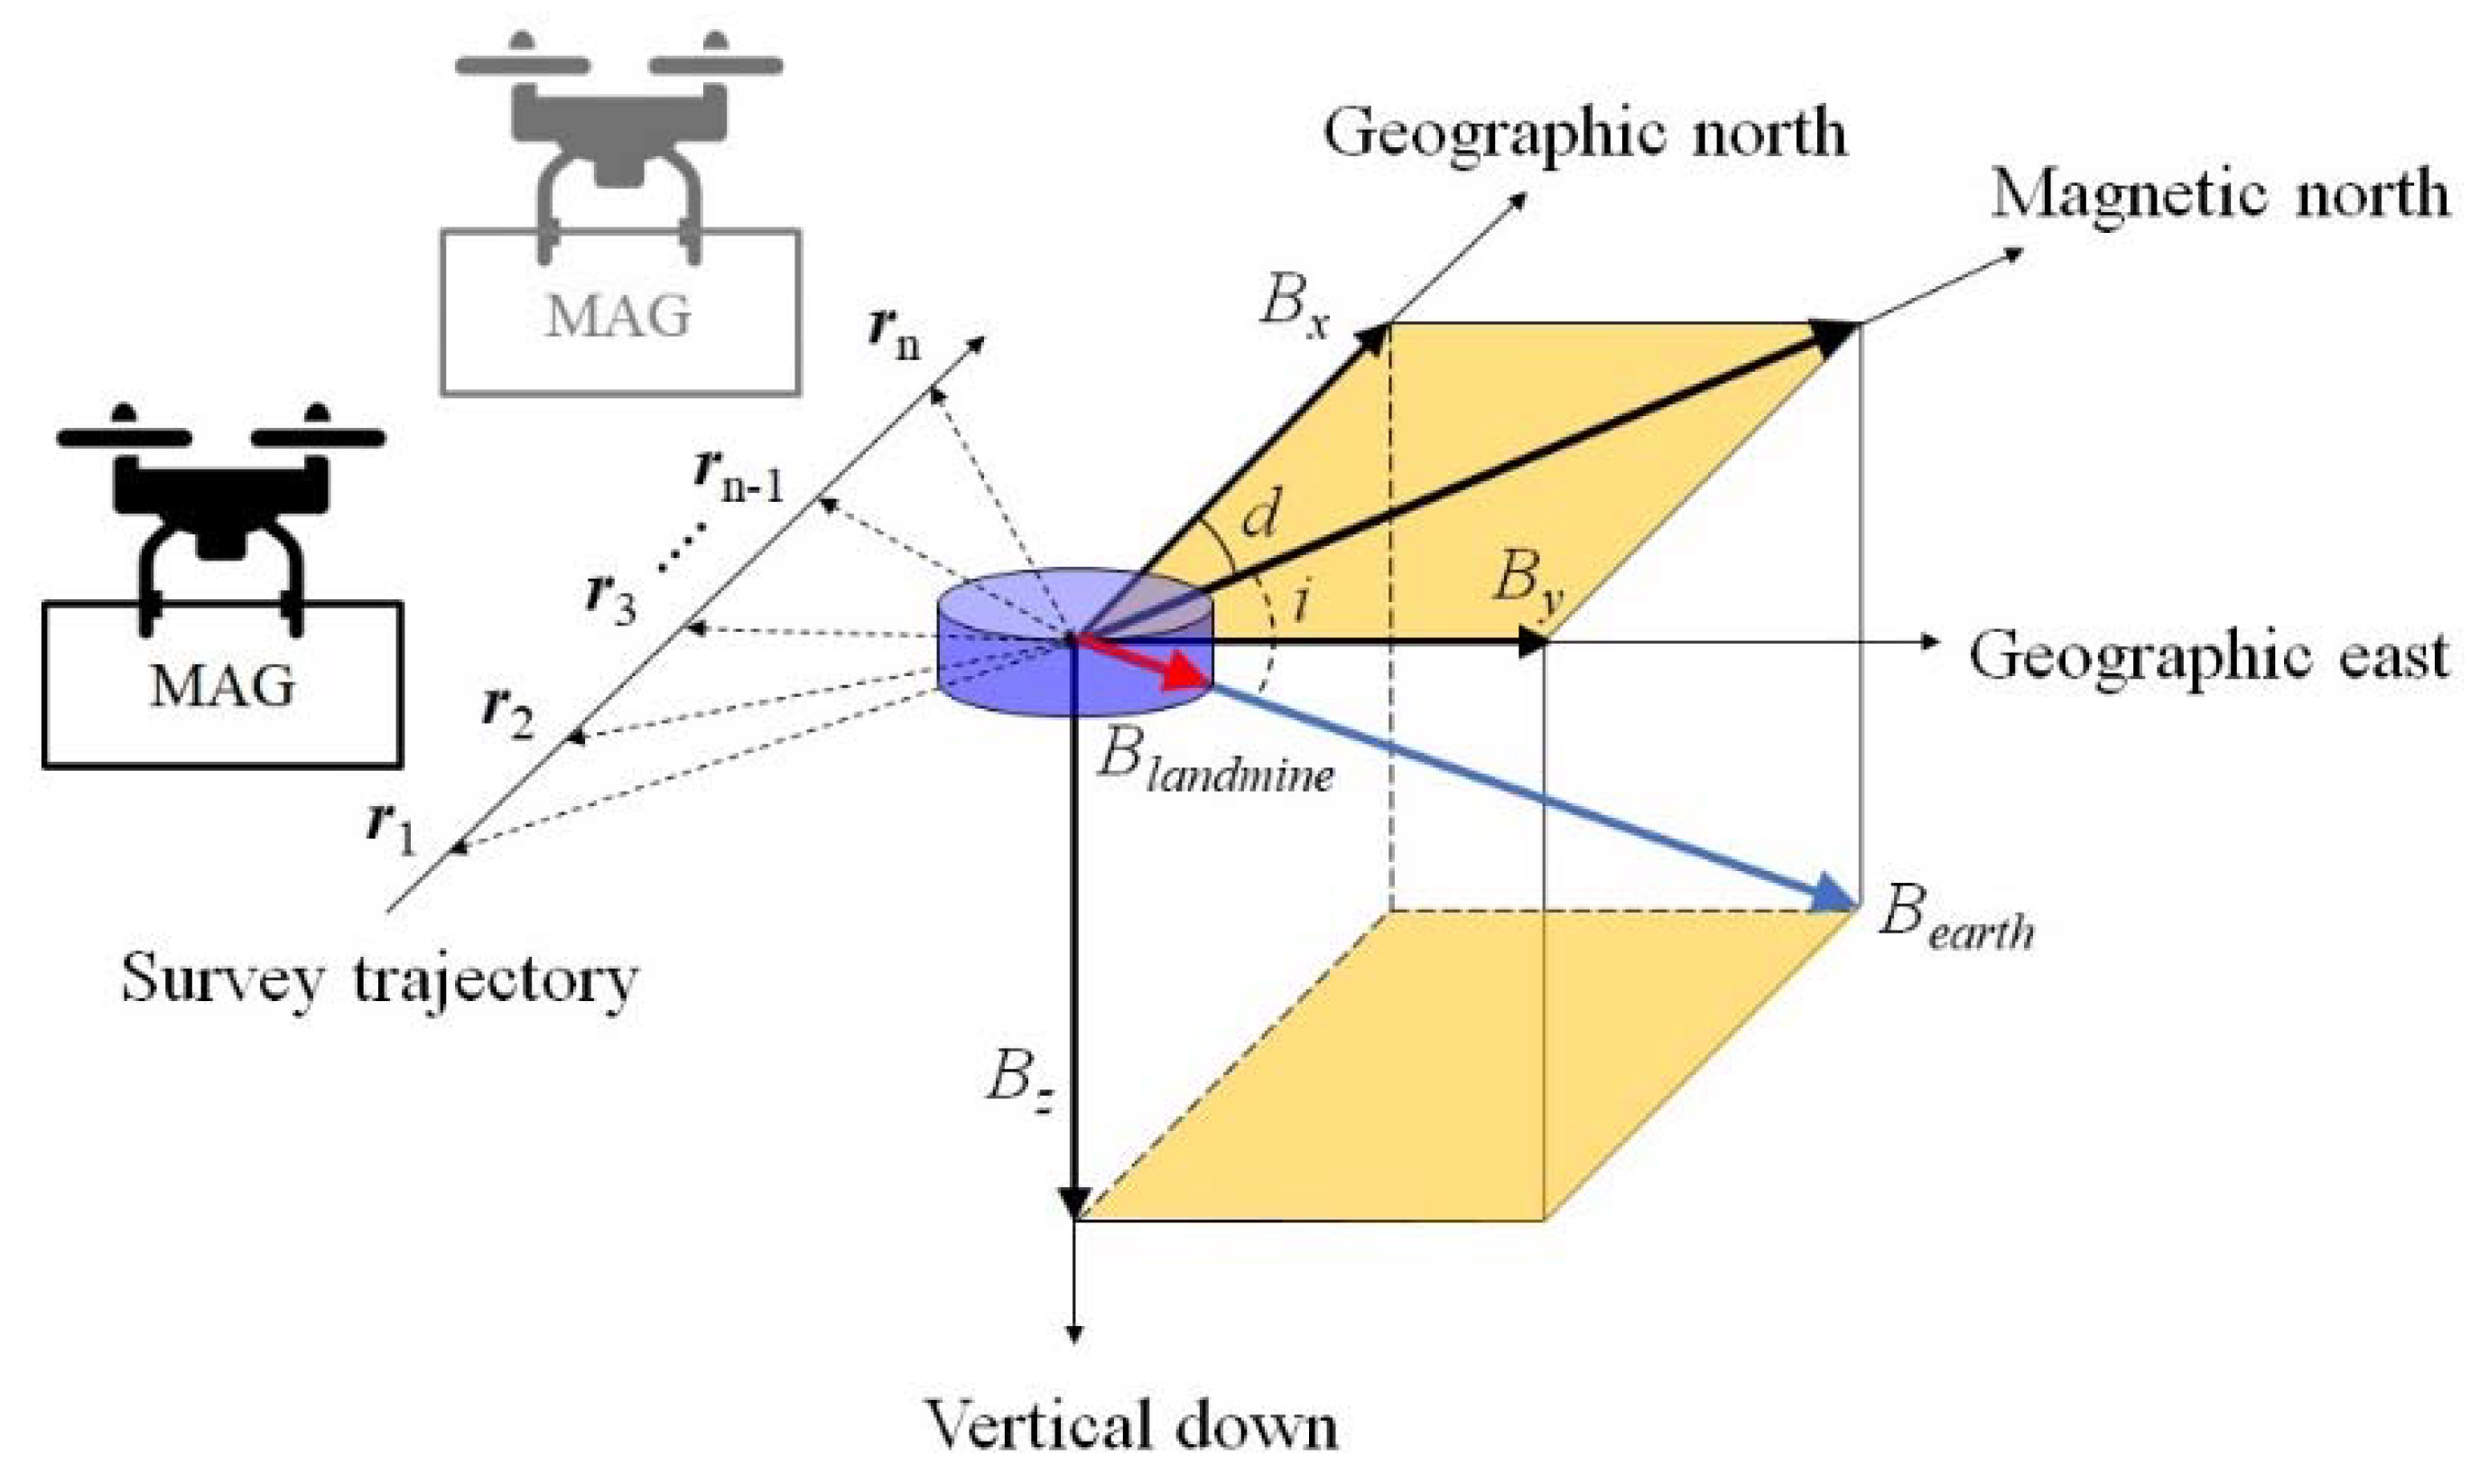
The UAV-borne MAG model scheme is depicted in Figure 2. The fluxgate MAG is a vector MAG capable of simultaneously measuring the direction and magnitude of the three-axis components of the magnetic field. Magnetic anomalies indicating landmines arise from induced magnetization in the present-day geomagnetic field, in a process related to magnetic susceptibility. A ferromagnetic landmine is magnetized by the direction of the Earth’s magnetic field according to the inclination and declination at the landmine position, and an induced magnetic field is generated that disturbs the distribution of the Earth’s magnetic field around it, thus producing a magnetic anomaly signal (Figure 2).
The actual total magnetic field measured by the MAG is Bs, which is calculated as the vector sum of the induced magnetic field (Blandmine) generated by the ferromagnetic landmine and Earth’s magnetic field (Bearth), as follows:
B s = B l a n d m i n e + B e a r t h
B l a n d m i n e = B x c o s d c o s i + B y s i n d c o s i + B z s i n i
where d is the degree of declination and i is the degree of inclination. Total magnetic field intensity is determined using the X-, Y-, and Z-components of the MAG vector data.
The magnetic field of a landmine can be interpreted as a magnetic dipole model. In classical physics, the magnetic field of a dipole is calculated as the limit of either a current loop or a pair of charges as the source shrinks to a point, while keeping the magnetic moment m constant. For the current loop, this limit is mostly easily derived from the vector potential and is expressed at any spatial position as follows:
A = μ 0 4 π r 2 m ^ × r ^ r = μ 0 4 π m ^ × r ^ r 3
                        B = × A = μ 0 4 π 1 r 3 3 m ^ · r ^ r ^ m ^ = μ 0 4 π 3 r ^ m ^ · r ^ r 5 m ^ r 3 ( m ^ = m x x ^ + m y y ^ + m z z ^   ,     r ^ = r x x ^ + r y y ^ + r z z ^ )
where m = 4 3 π × M × W × a 3 , M is the magnetization ( Ampere / meter × gram ; 0.06 for iron components within the M15, M16, and 0.6 for steel components within the M19 landmine), a is the radius of the magnetic dipole sphere, W is the mass (in grams) of the metallic components of the landmine, r is the vector from the landmine to the measurement point (MAG), and μ0 is the permeability of free space.
For a three-axis MAG, each orthogonal axis has its own error, such that the total intensity changes with changes in heading. To remove this influence of lateral direction, spatial filtering was performed. To estimate a landmine’s magnetic anomaly (Blandmine), Earth’s magnetic field (Bearth) must be subtracted from the total measured magnetic field (Bs). However, because local and global geomagnetic fields vary along survey lines, spatial filtering techniques that can extract landmine anomalies within the variation of the geomagnetic field are required.
The moving average method used in our previous study [8] did not consider the variation of the geomagnetic field, which made it difficult to detect anomalies involving geomagnetic field trends. To address this problem, we applied a de-trend and a spatial median filtering method to eliminate geomagnetic field variation along the survey lines and effectively detect the small local magnetic anomalies indicating M15, M16, and M19 landmines.
Magnetic anomalies show different responses at different locations on the Earth (magnetic latitude) because of the magnetic inclination (i). This is the angle at which the magnetic field lines are oriented relative to the Earth’s surface, and it changes with latitude (Figure 2).
A portion of the magnetic anomaly curve was extracted along the survey line, running from south to north and exhibiting varying magnetic inclinations. This extraction was carried out with the declination and the heading both set to zero in order to estimate the depth at which landmines are buried. The estimation was based on the principles of peak amplitude and full width at half height (FWHH) [39] (Figure 3). This analysis can be applied to many types of anomalies, particularly those caused by objects whose diameter is smaller than their distance from the MAG. The distance from a MAG to the middle of a landmine is approximately equal to the width of the anomaly that it causes at half its peak amplitude. The point where the solid green line and anomaly curve intersect is where the landmine is located. When multiple landmines are present, the magnetic anomalies consist of a superposition of the magnetic anomalies from each individual landmine. Therefore, to effectively differentiate between the landmines, they must be positioned at least twice the FWHH apart from one another. Additionally, the theoretical spatial resolution of the MAG corresponds to half of the FWHH of each landmine. The cross-range resolution of GPR depends on the radar operating frequency, while the spatial resolution of a MAG is determined by the FWHH of the landmines themselves.

3. Results

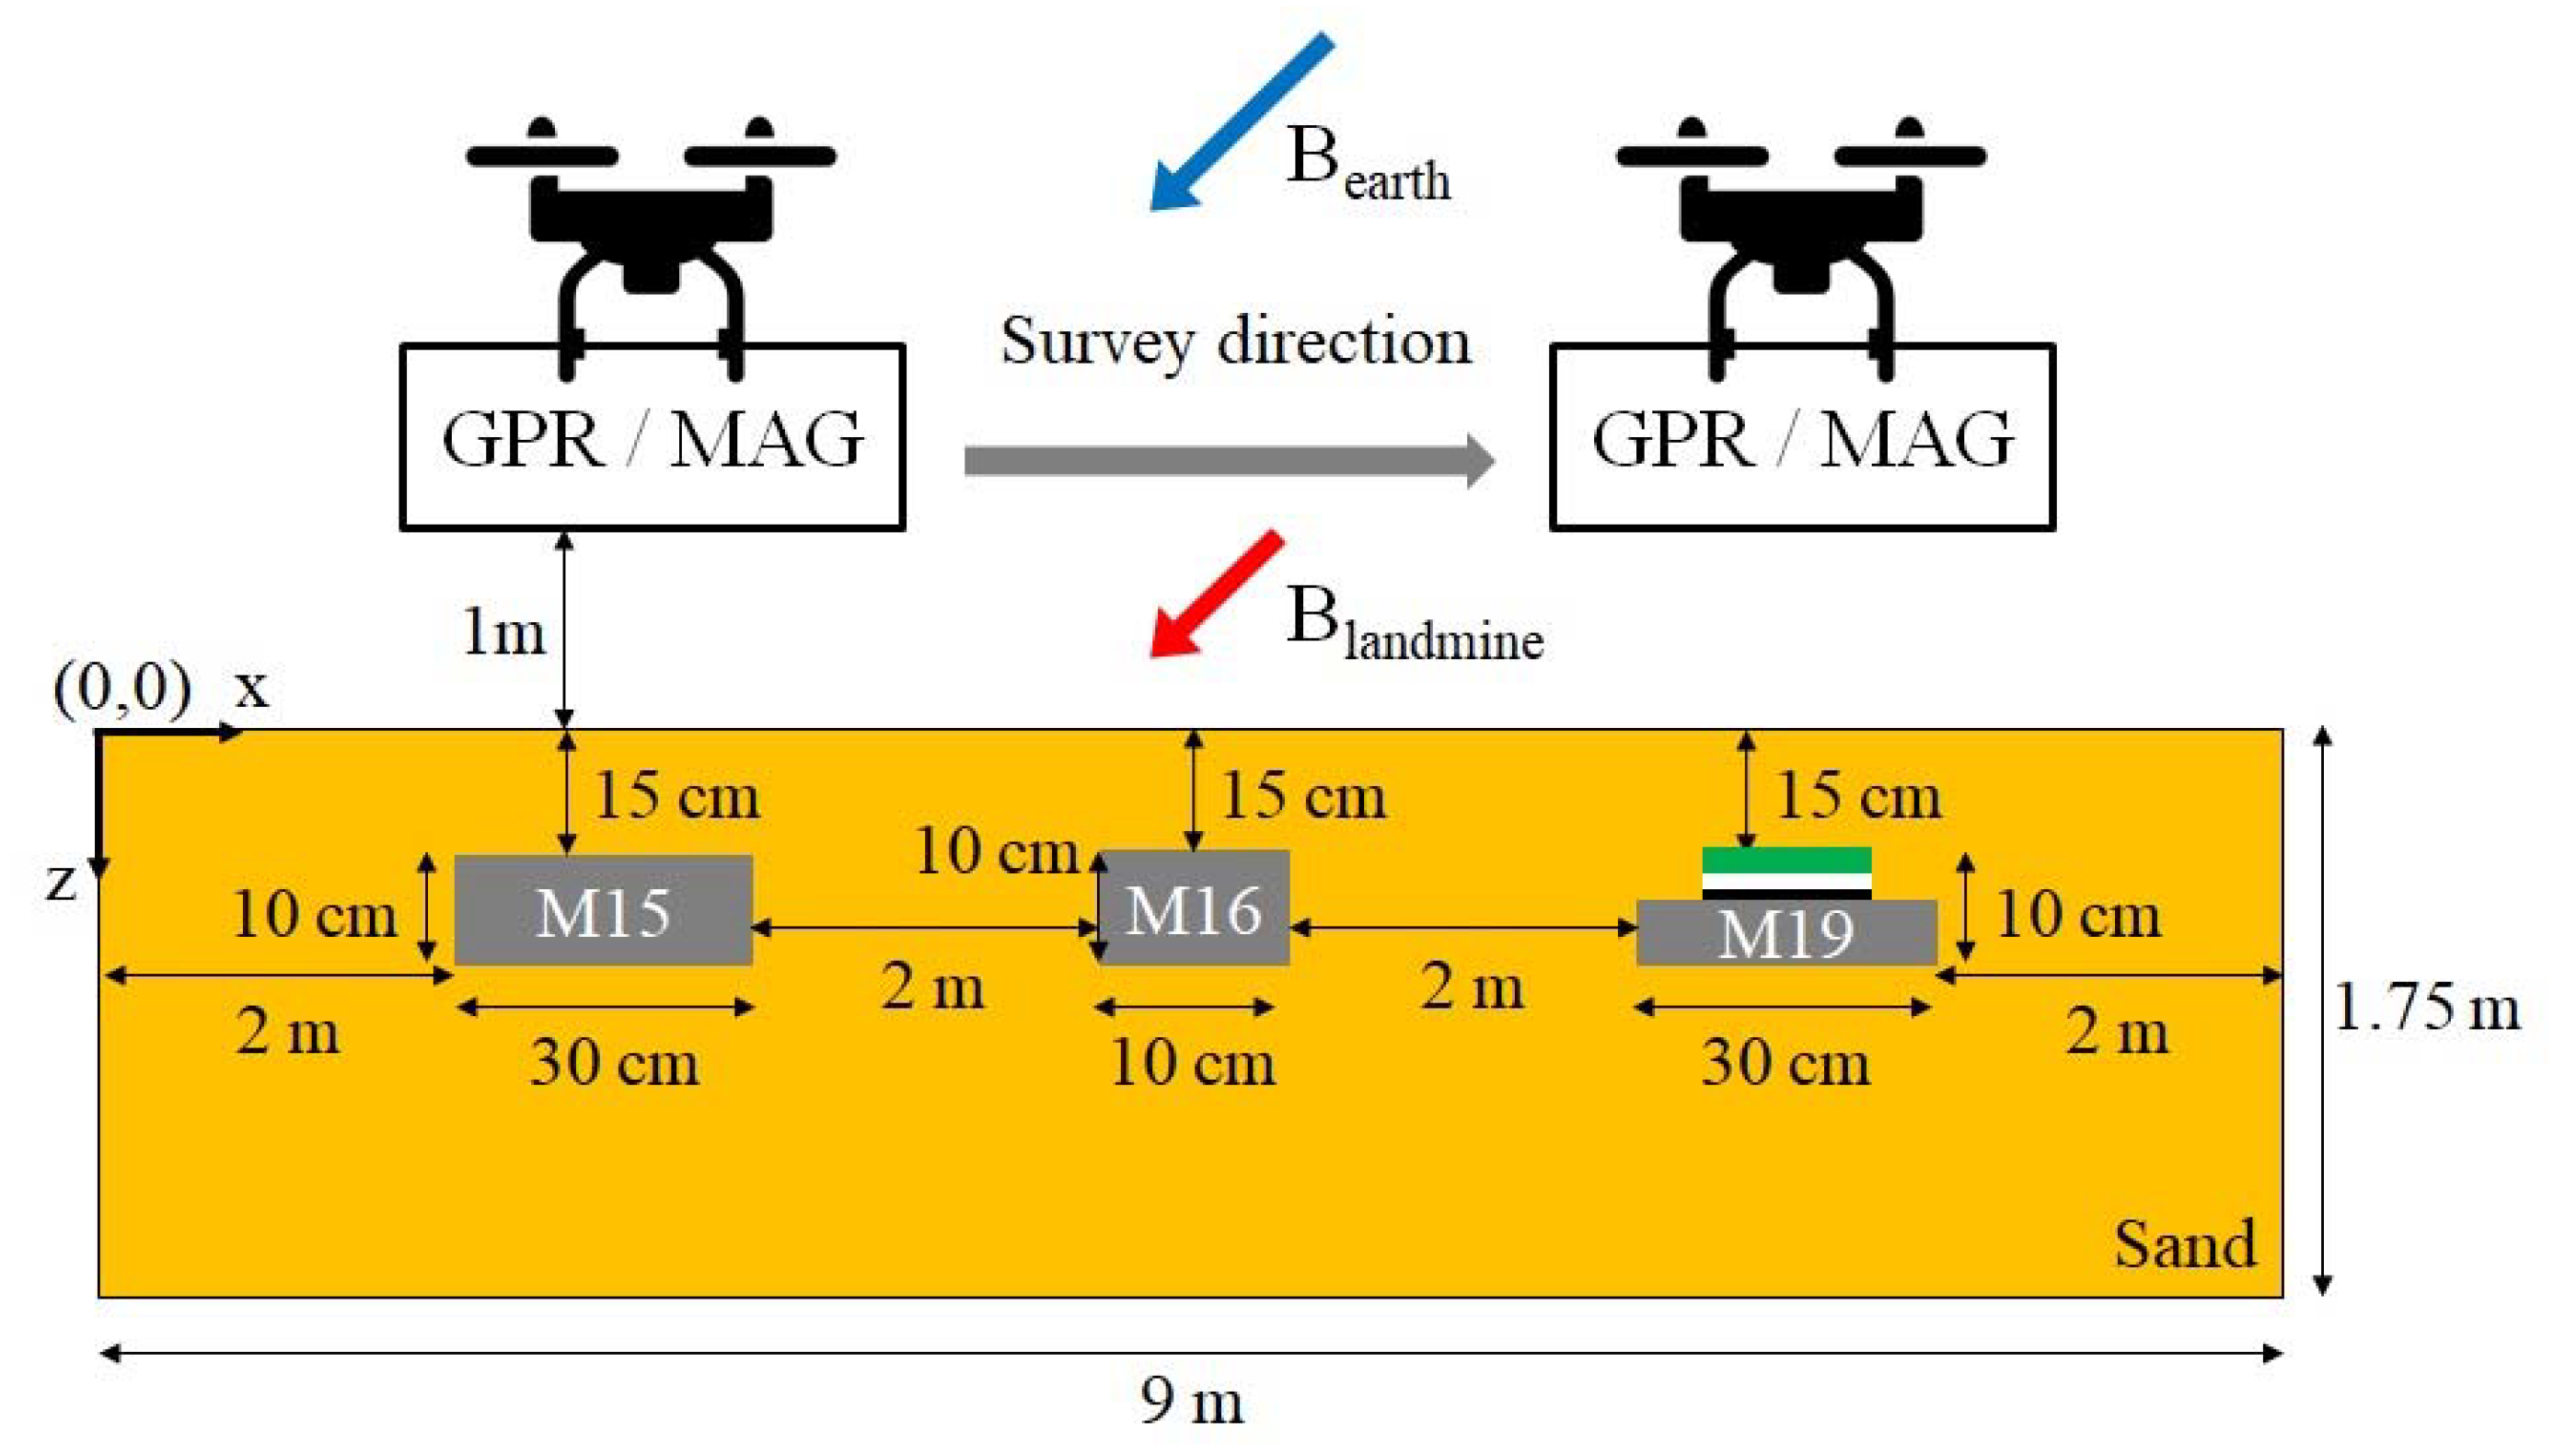
The UAV-borne GPR and MAG models for detecting the M15, M16, and M19 landmines were simulated based on a half-space geometry. The upper region was air with a permittivity of 1 and conductivity of 0, and the lower region was a homogeneous sand subsurface with a relative permittivity and conductivity of 9 and 0.001 S/m, respectively. The geometry of the model, including target landmine positions and the dimensions of the investigated region, is shown in Figure 4.

3.1. Simulation Results of the UAV-Borne GPR Model

Three boxes buried in sand at a depth of 15 cm were used to model M15 [material: perfect conductor (PEC), width: 300 mm, height: 100 mm, burial center position: (2.15 m, 0.2 m)], M16 [material: PEC, width: 100 mm, height: 100 mm, burial center position: (4.35 m, 0.2 m)], and M19 [material#1: polyvinyl chloride (PVC), width: 300 mm, height: 75 mm; material#2: PEC, width: 200 mm, height: 2 mm; material#3: AIR, width: 200 mm, height: 10 mm; material#4: polyvinyl chloride (PVC), width: 200 mm, height: 13 mm, burial center position: (6.55 m, 0.2 m)] landmines. The minimum-metal component within the M19 landmine was modeled as a thin plate based on a physical inspection of the internal structure. The M19 landmine contains a metal plate with a diameter of approximately 100 mm, which significantly impacts the radar cross section (RCS) when compared to a solid, homogeneous plastic cylinder. The M19 landmine has been modeled as being composed of:
  • The pressure pad (green area in Figure 4), characterized as PVC by a relative dielectric constant of 3.3 and a thickness of 13 mm;
  • An air layer representing the internal structure (white area in Figure 4) with a thickness of 10 mm;
  • The minimum-metal component (black area in Figure 4) is characterized as a thin step plate by PEC with a thickness of 2 mm;
  • The main body of the M19 landmine (grey area in Figure 4) characterized PVC by a relative constant of 3.3 and a thickness of 75 mm.
The transmitter and receiver were placed with a separation of 4 cm on the interface at a height of 1 m. The source was a theoretical Hertzian dipole (z-polarized) fed with a Ricker waveform with a center frequency of 1.5 GHz and a 3 GHz bandwidth. The modeled sand area was 1.75 m in depth and 9 m in length. The simulations were run over a 9 × 3 m computational domain. The GPR A-scans, which are measurements of the received field as a function of time at a single location, were recorded at spatial intervals. The resulting B-scans were received as A-scan data as a function of time and antenna position. We simulated the model with spatial intervals of 2, 8, and 16 cm, considering the cross-range resolution. The field measurements were recorded over time windows of 20 ns for the respective spatial intervals.
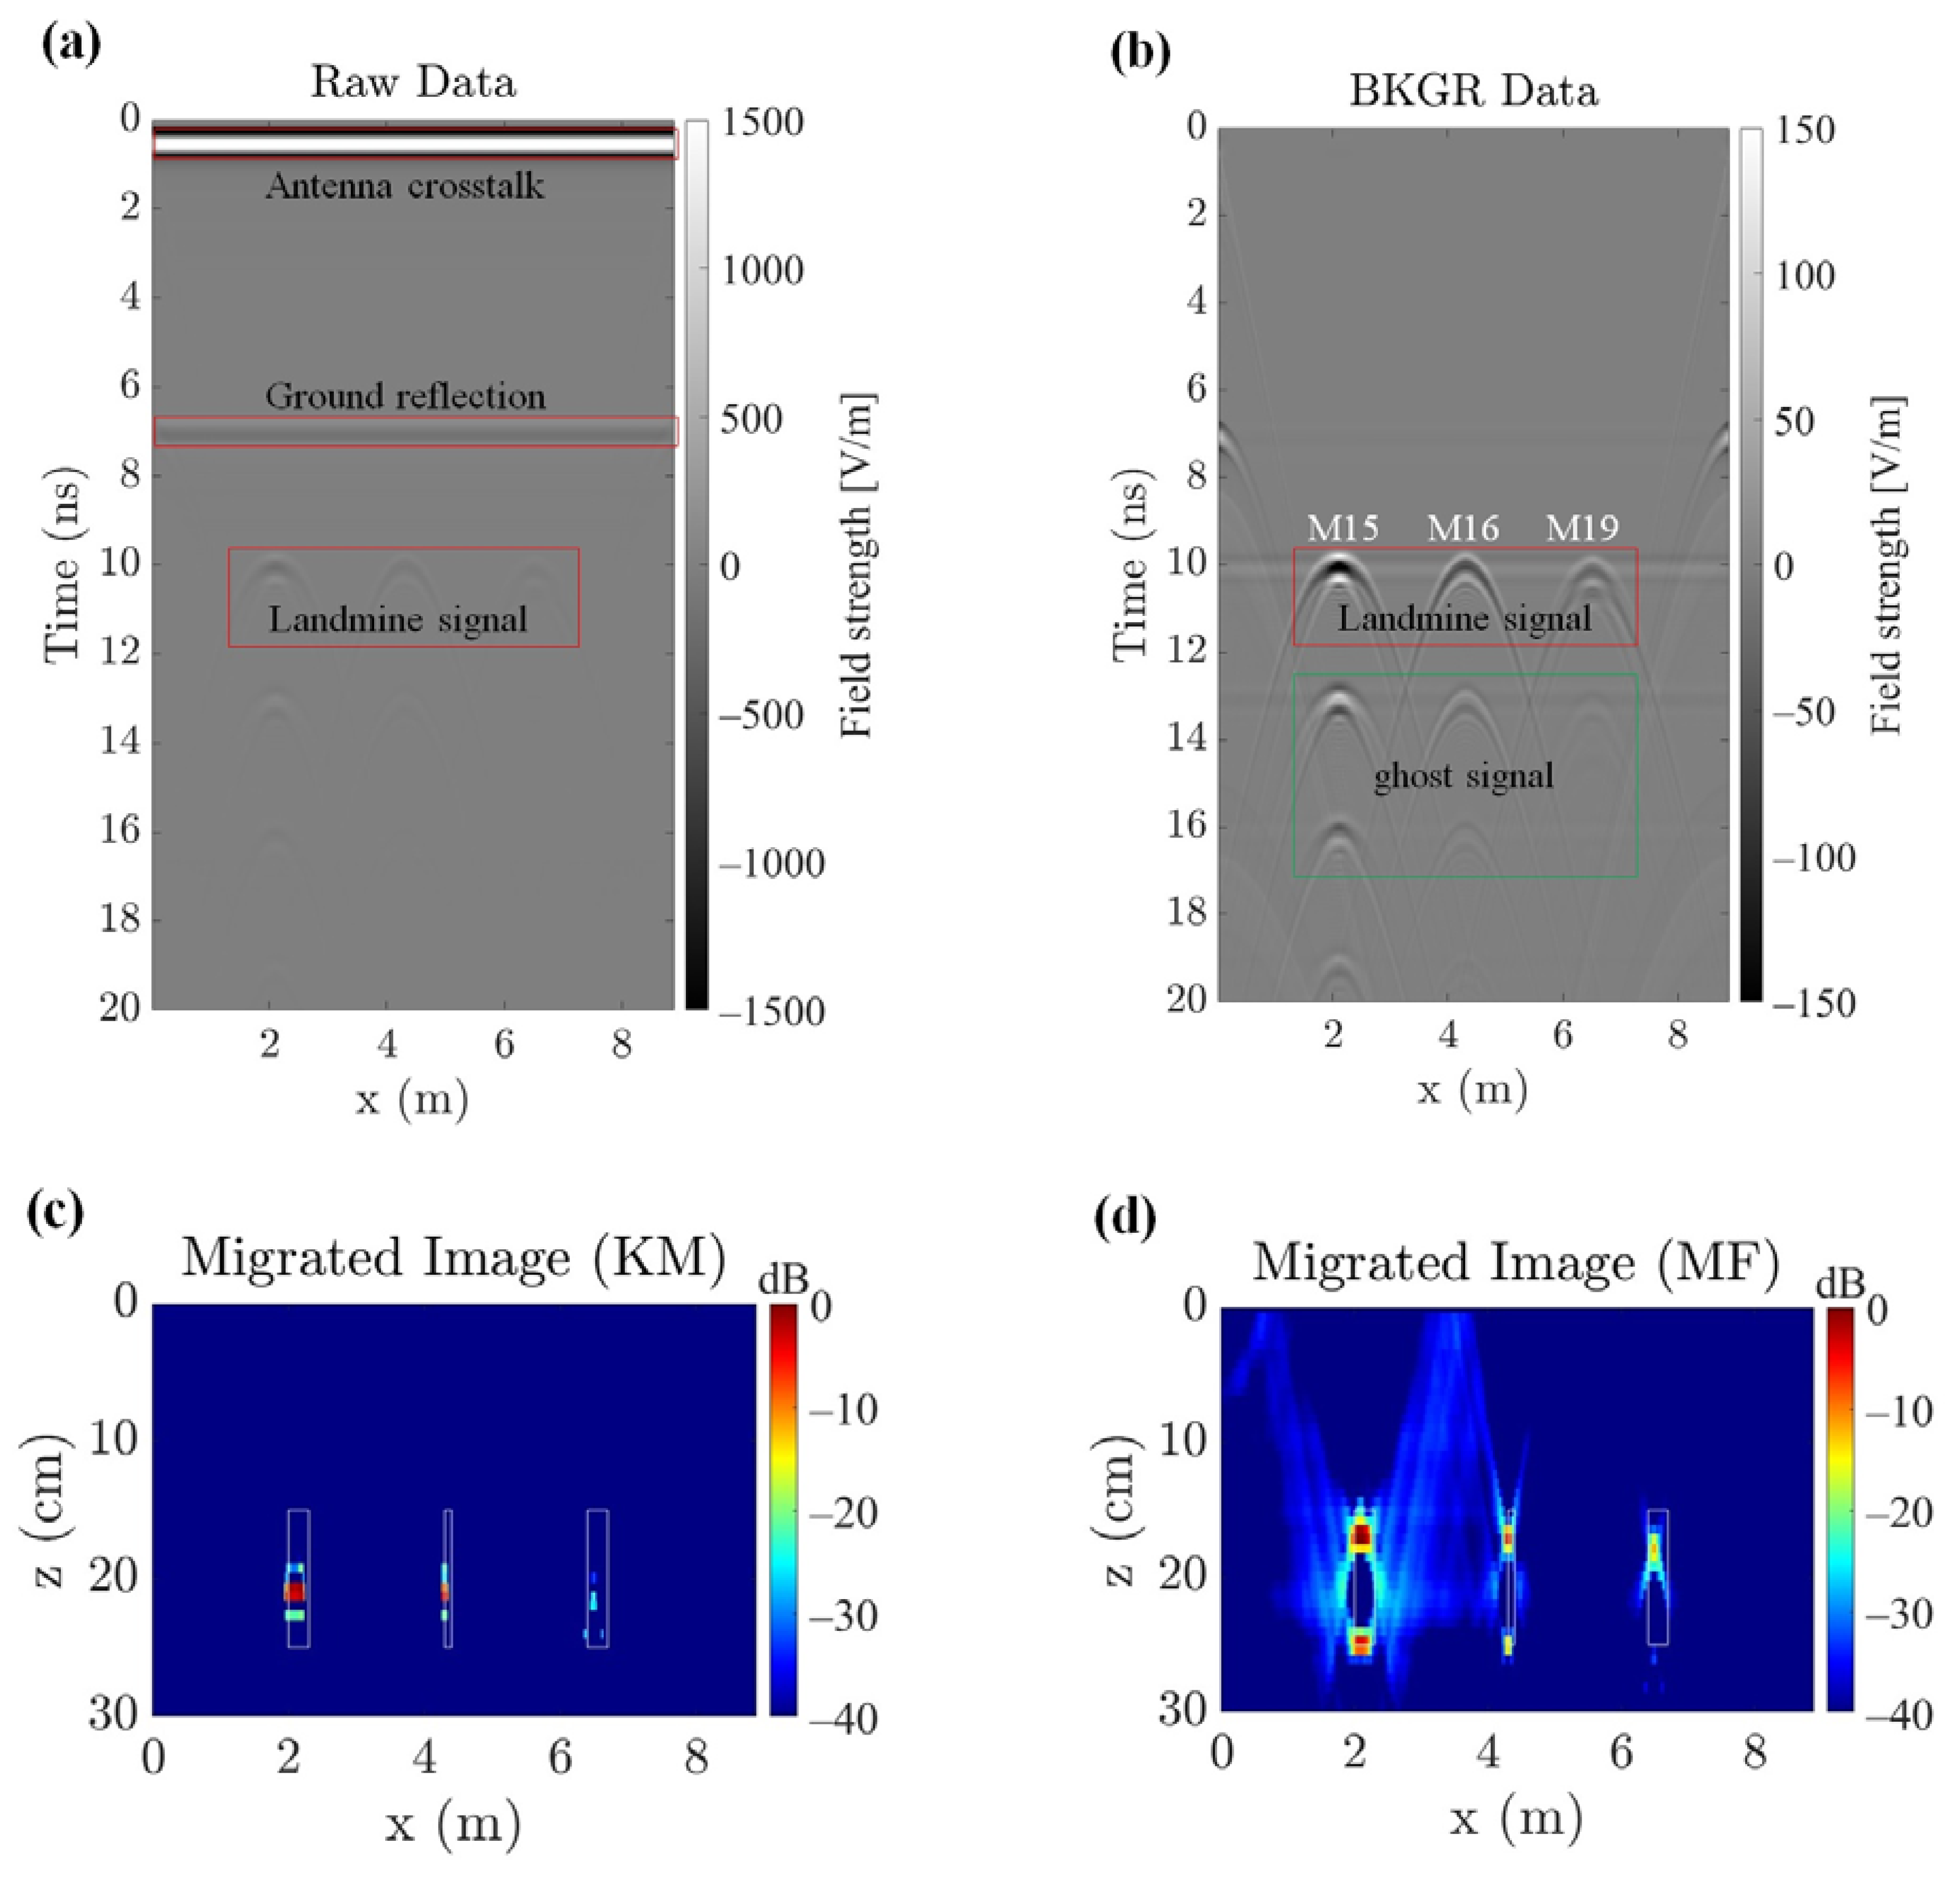
The reflected radar signals from the M15, M16, and M19 landmines at the 2 cm spatial interval are shown in Figure 5. The signals reflected from the landmine could not be distinguished due to high antenna crosstalk and ground reflection (Figure 5a); therefore, the direct wave was removed based on the SVD algorithm to retain only the clear signals reflected from the landmines (Figure 5b).
Each of the three types of landmines exhibited corresponding horizontal lines and ghost hyperbolas. The presence of these horizontal lines and multiple ghost hyperbolas in the model can be attributed to the proximity of buried objects to the surface. The occurrence of multiplication and ringing phenomena is a result of the transmitted signals’ wavelength being longer than the distance of the underground targets from the surface [40].
The hyperbolas were converted into image pixels by considering the RCS using KM (Figure 5c) based on Equation (2). The ghost hyperbolas were removed, and the images of reflected landmine signals were focused using MF based on Equation (6) (Figure 5d). The Ricker waveform source was used for the impulse response function (h) based on Equation (6). Before the MF, the image position of a landmine was slightly different from the landmine installation position (solid-white box), and ghost signals were still present, but after applying MF, the image position more closely matched the installation position, and the ghost signal disappeared.
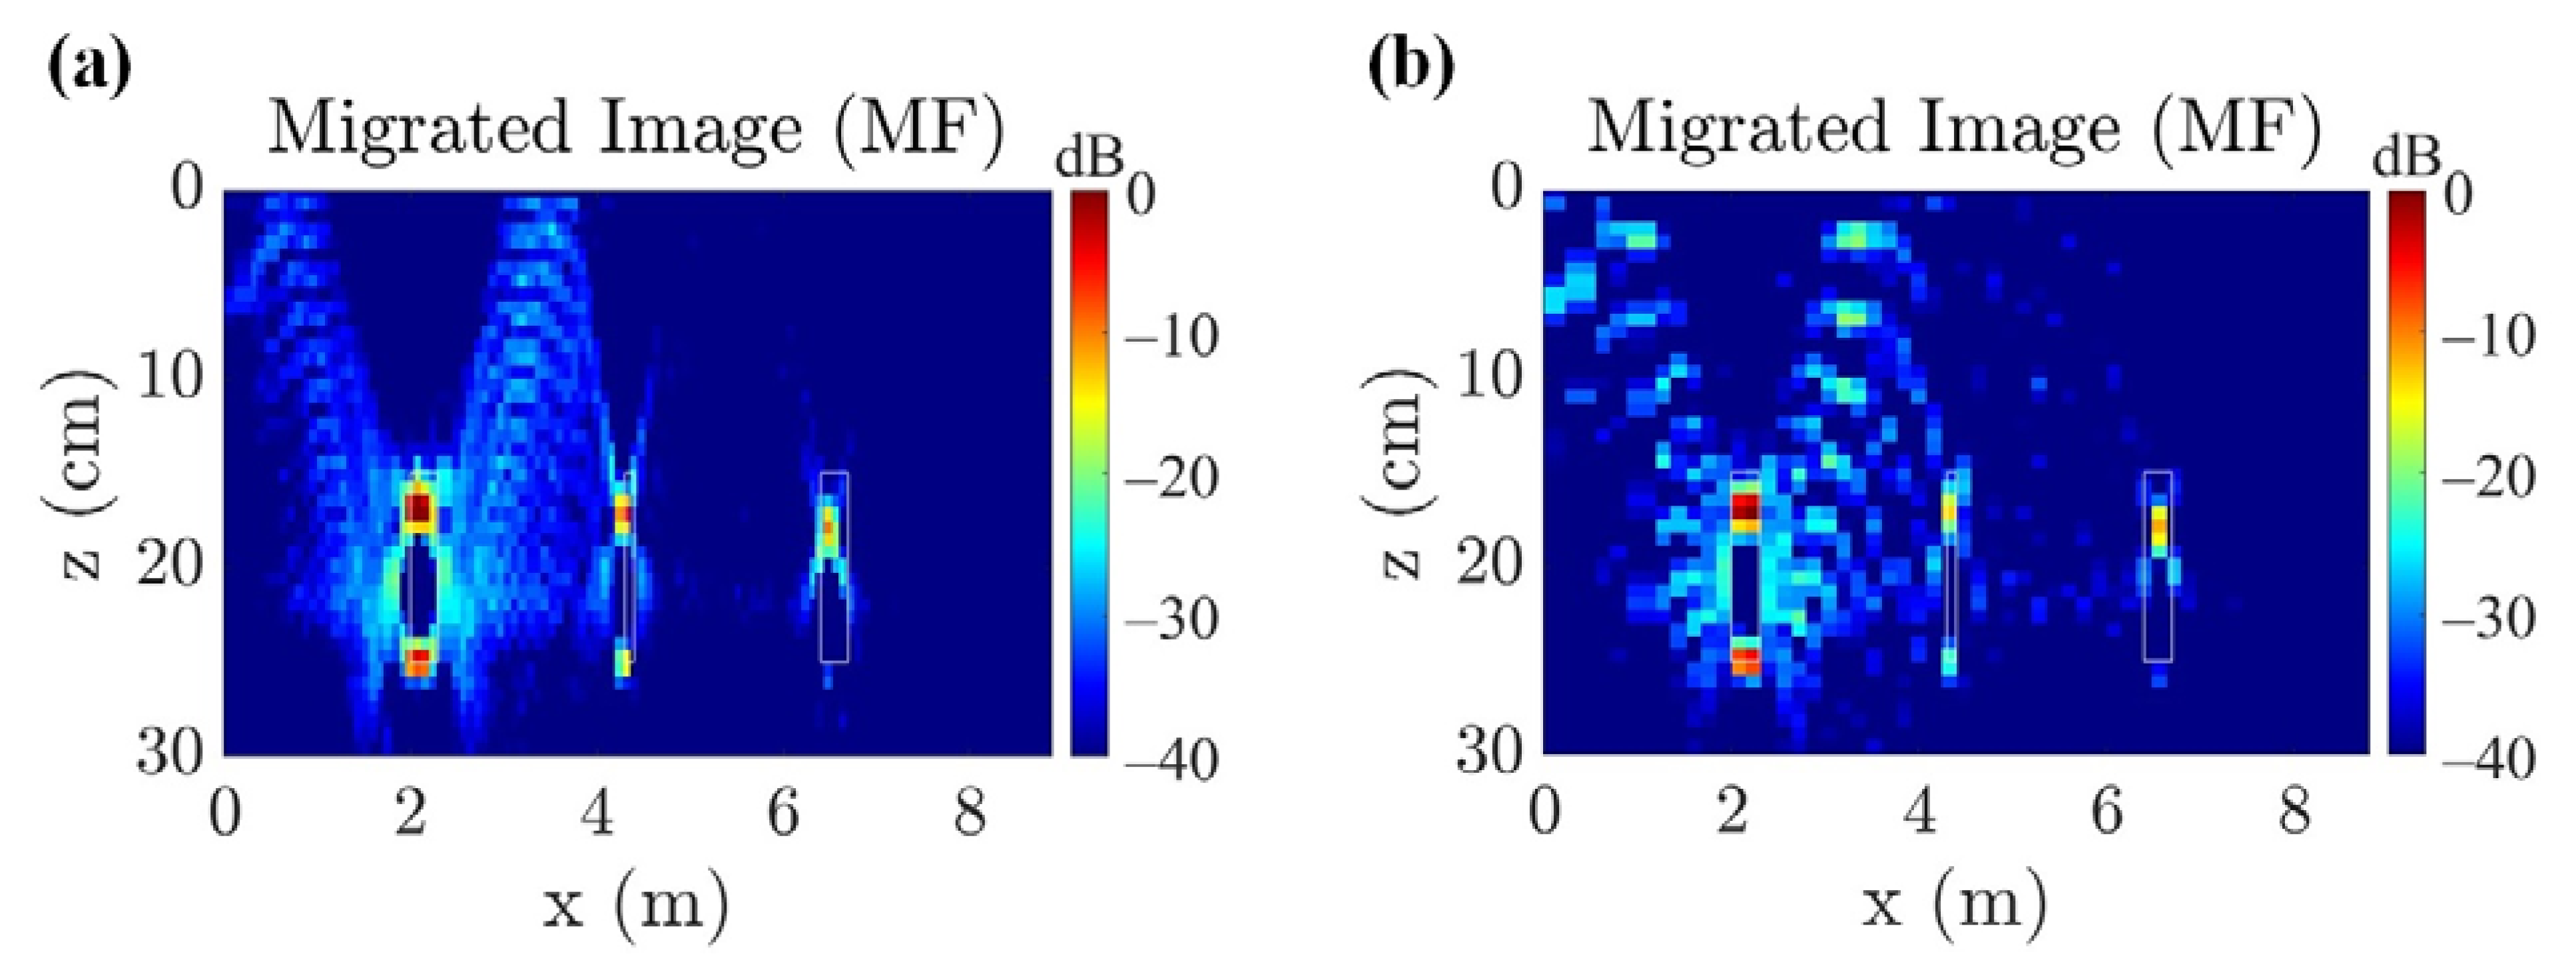
The theoretical cross-range resolution is 10 cm, which is equal to half the wavelength = λ / 2 . Figure 6 shows the MF results of the M15, M16, and M19 landmines, with spatial intervals of 8 and 16 cm. When the spatial intervals for data gathering are larger than the theoretical cross-range resolution, as seen in Figure 6b, the resulting image can become distorted, even after the MF process.

3.2. Simulation Results of the UAV-Borne MAG Model

The geometry of the UAV-borne MAG model was identical to that of the UAV-borne GPR model shown in Figure 4. However, the materials used for landmines in the GPR model, such as PEC and PVC, could not be used in the MAG model. This was due to the need to consider the physical mass of the landmines’ metallic components to calculate the magnetic anomaly based on Equation (8).
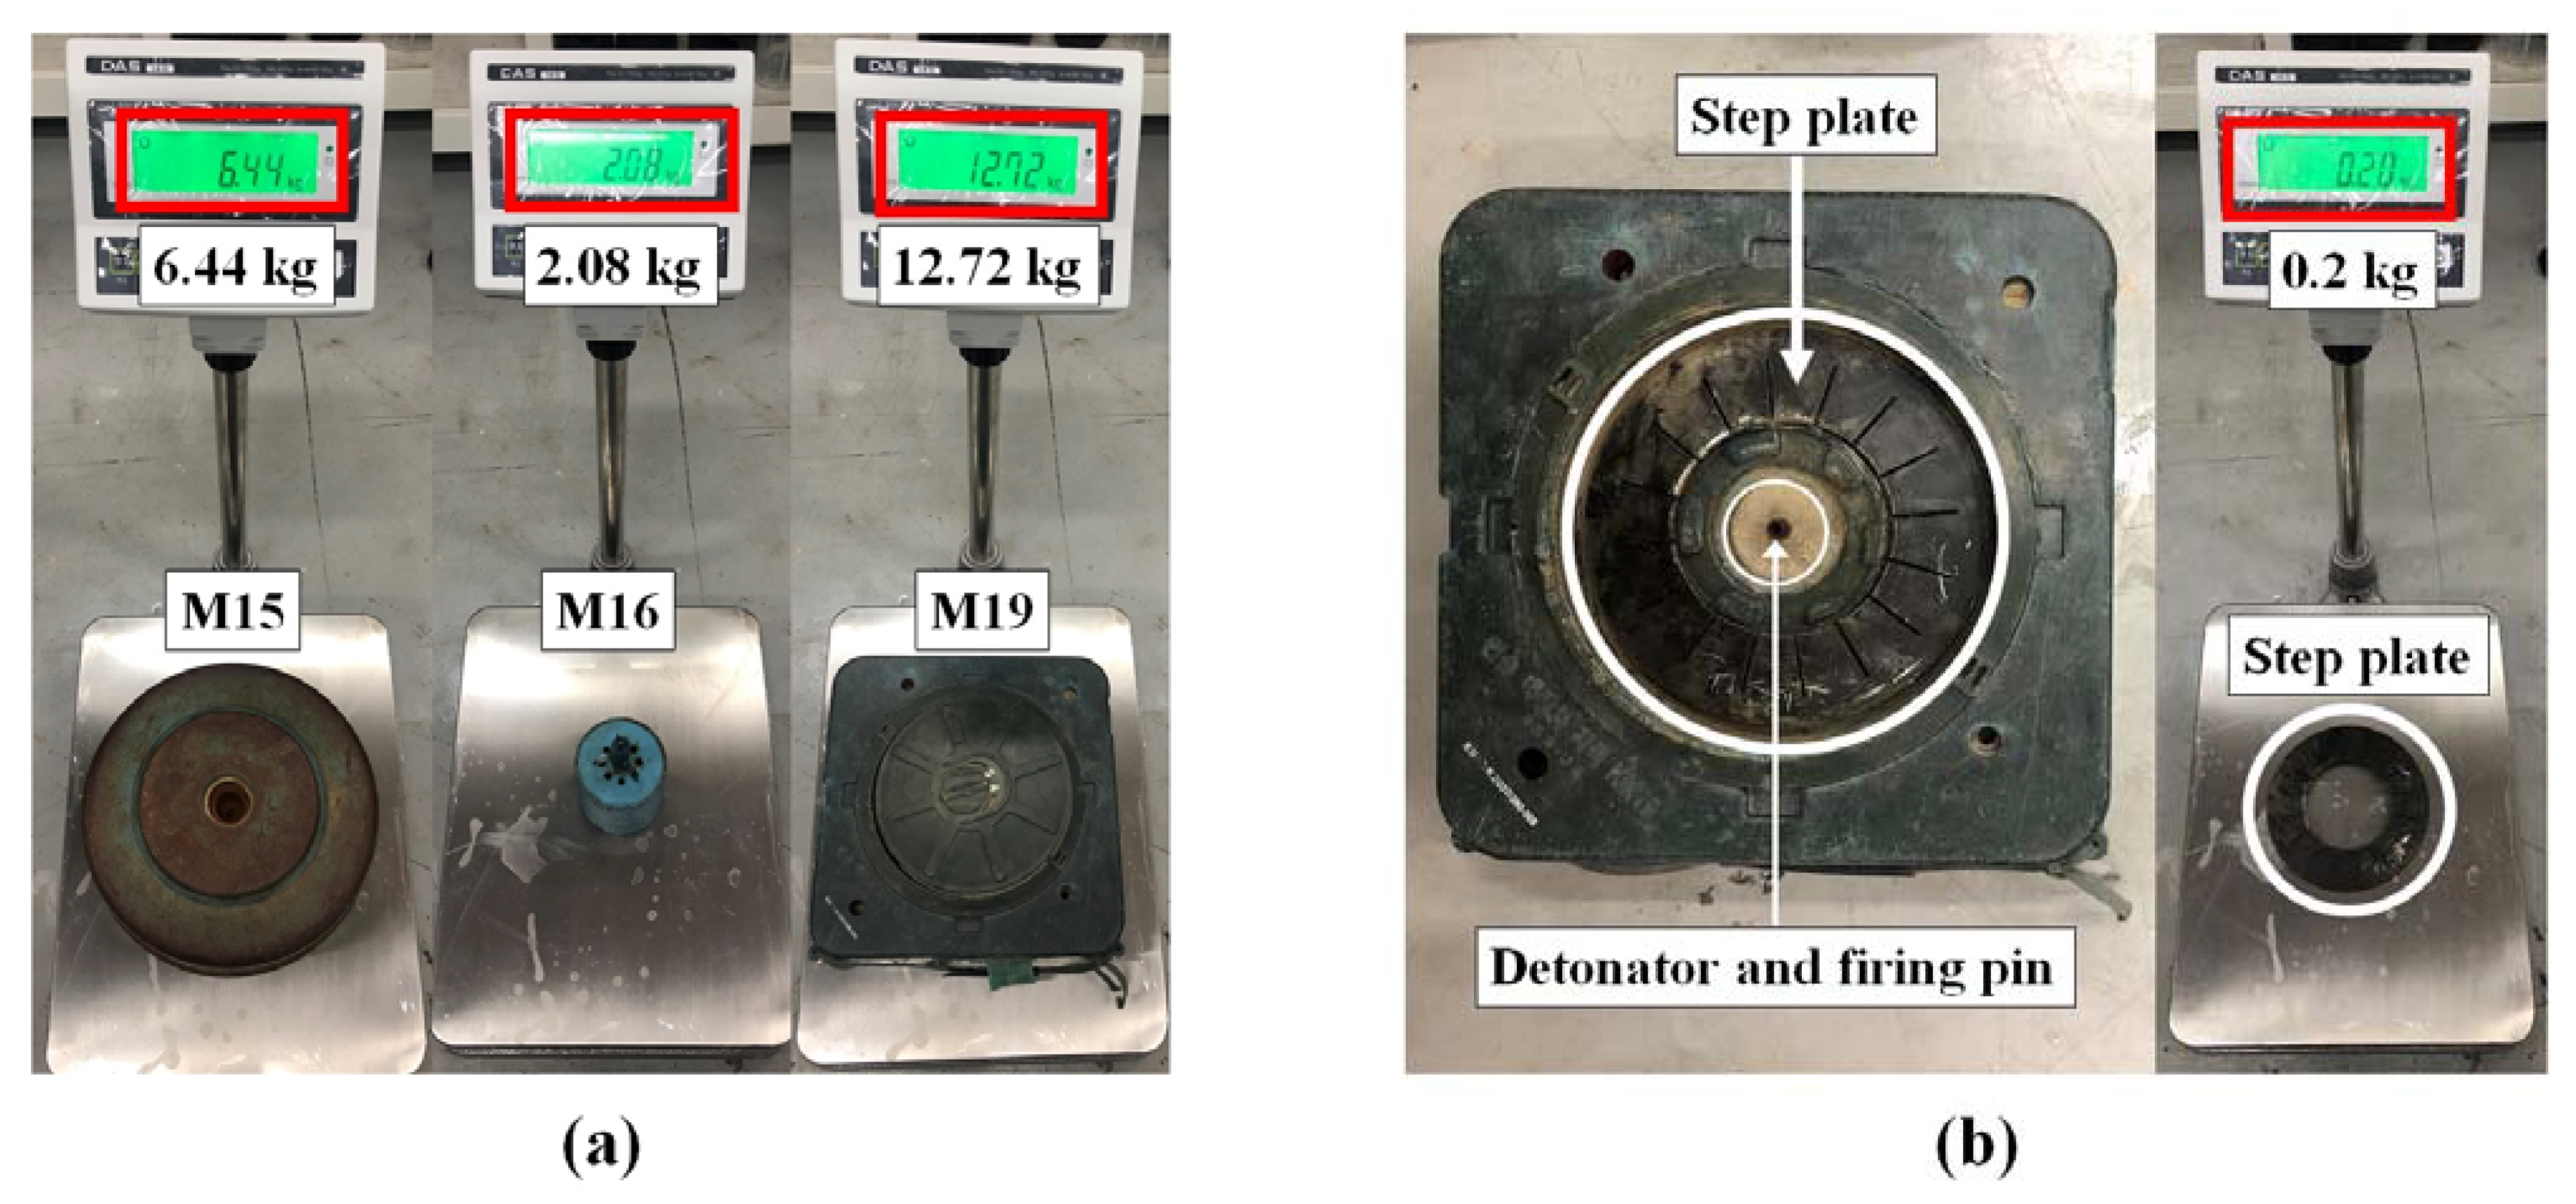
The measured total and metallic component masses of the M15, M16, and M19 landmines are shown in Figure 7. The M15 and M16 metallic landmines were composed of iron. The M19 landmines were mainly composed of plastic, but with a thin, disk-like step plate composed of 0.2 kg of stainless steel (Figure 7b). We were only able to measure the mass of the stainless-steel plate, and not the other metal components, such as the copper detonator capsule and stainless-steel firing pin, which were fixed inside the M19 landmine.
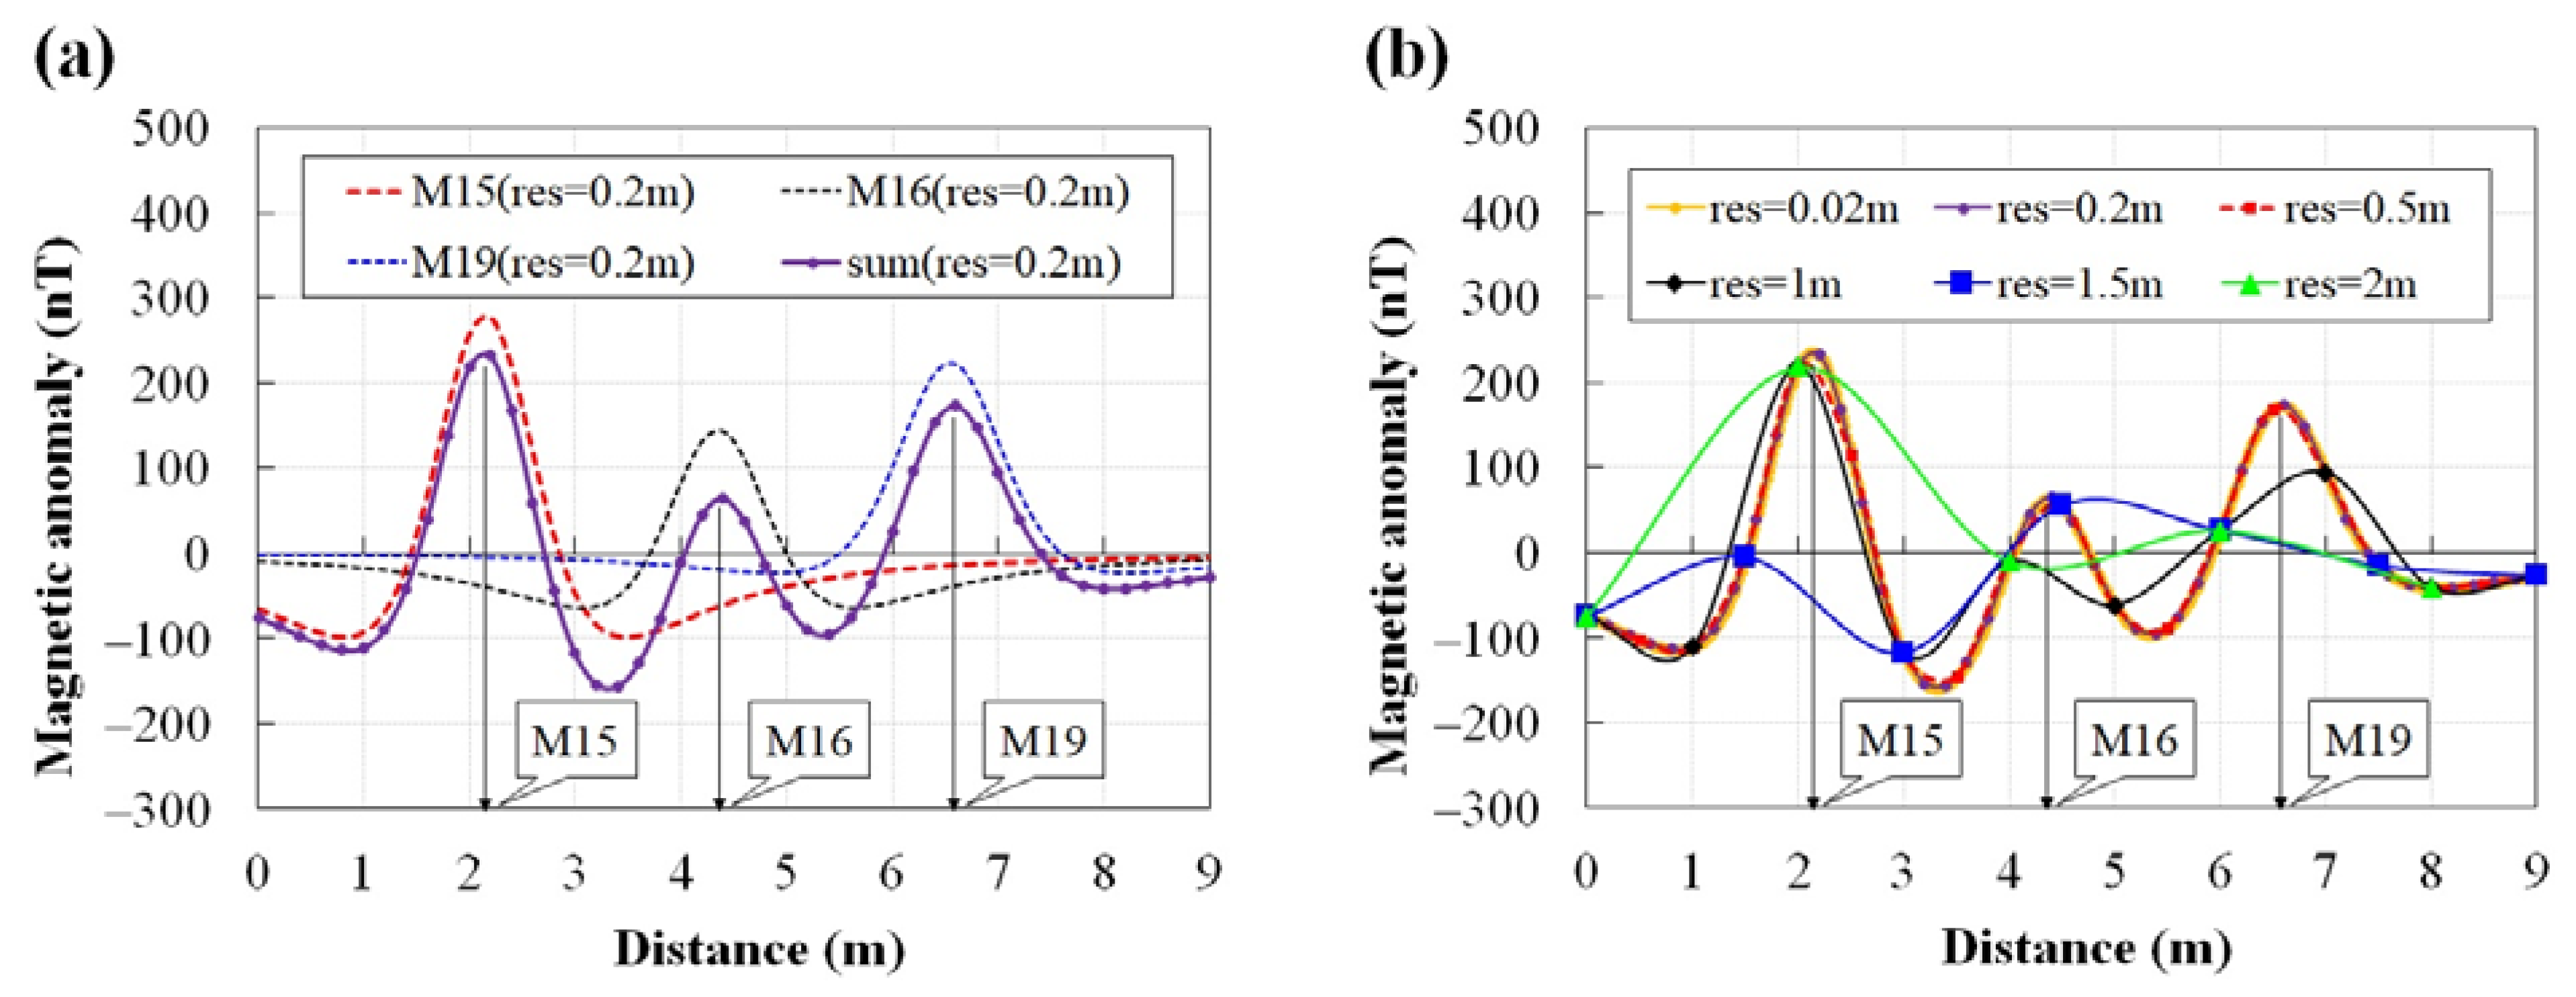
The UAV-borne MAG system simulated its flight, which followed the survey line at an altitude of 1 m with a heading of −72° towards the magnetic north direction (magnetic declination: −8.93°, inclination: 42°). The burial depth center of landmines was 20 cm, and the theoretical spatial resolution for detecting these landmines was determined to be 0.6 m, which was equivalent to half of the FWHH. Figure 8a displays the magnetic anomaly curves obtained from M15, M16, and M19 landmines, with spatial intervals of 0.2 m. Positions identified by the peak magnetic anomaly lines were determined to be landmines. The magnetic anomaly of the M19 landmine indicated a metallic mass that was approximately 6-fold smaller than that of the M16, whereas the magnetization (M) of the stainless-steel components of the M19 was 10-fold higher than that of the iron components of the M16, according to Equation (8). For this reason, the anomaly peak value of the M19 was larger than that of the M16. The resulting magnetic anomaly was a combination of the magnetic anomalies generated by each individual landmine. Due to this superposition effect, the peak value of the landmines appeared to be lower (solid purple line). When the spatial intervals for data gathering exceeded the theoretical spatial resolution, as depicted in Figure 8b, the simulated magnetic anomaly could become distorted to the extent that further data processing might not be applicable.

3.3. Experimental Results of the UAV-Borne GPR and MAG Model

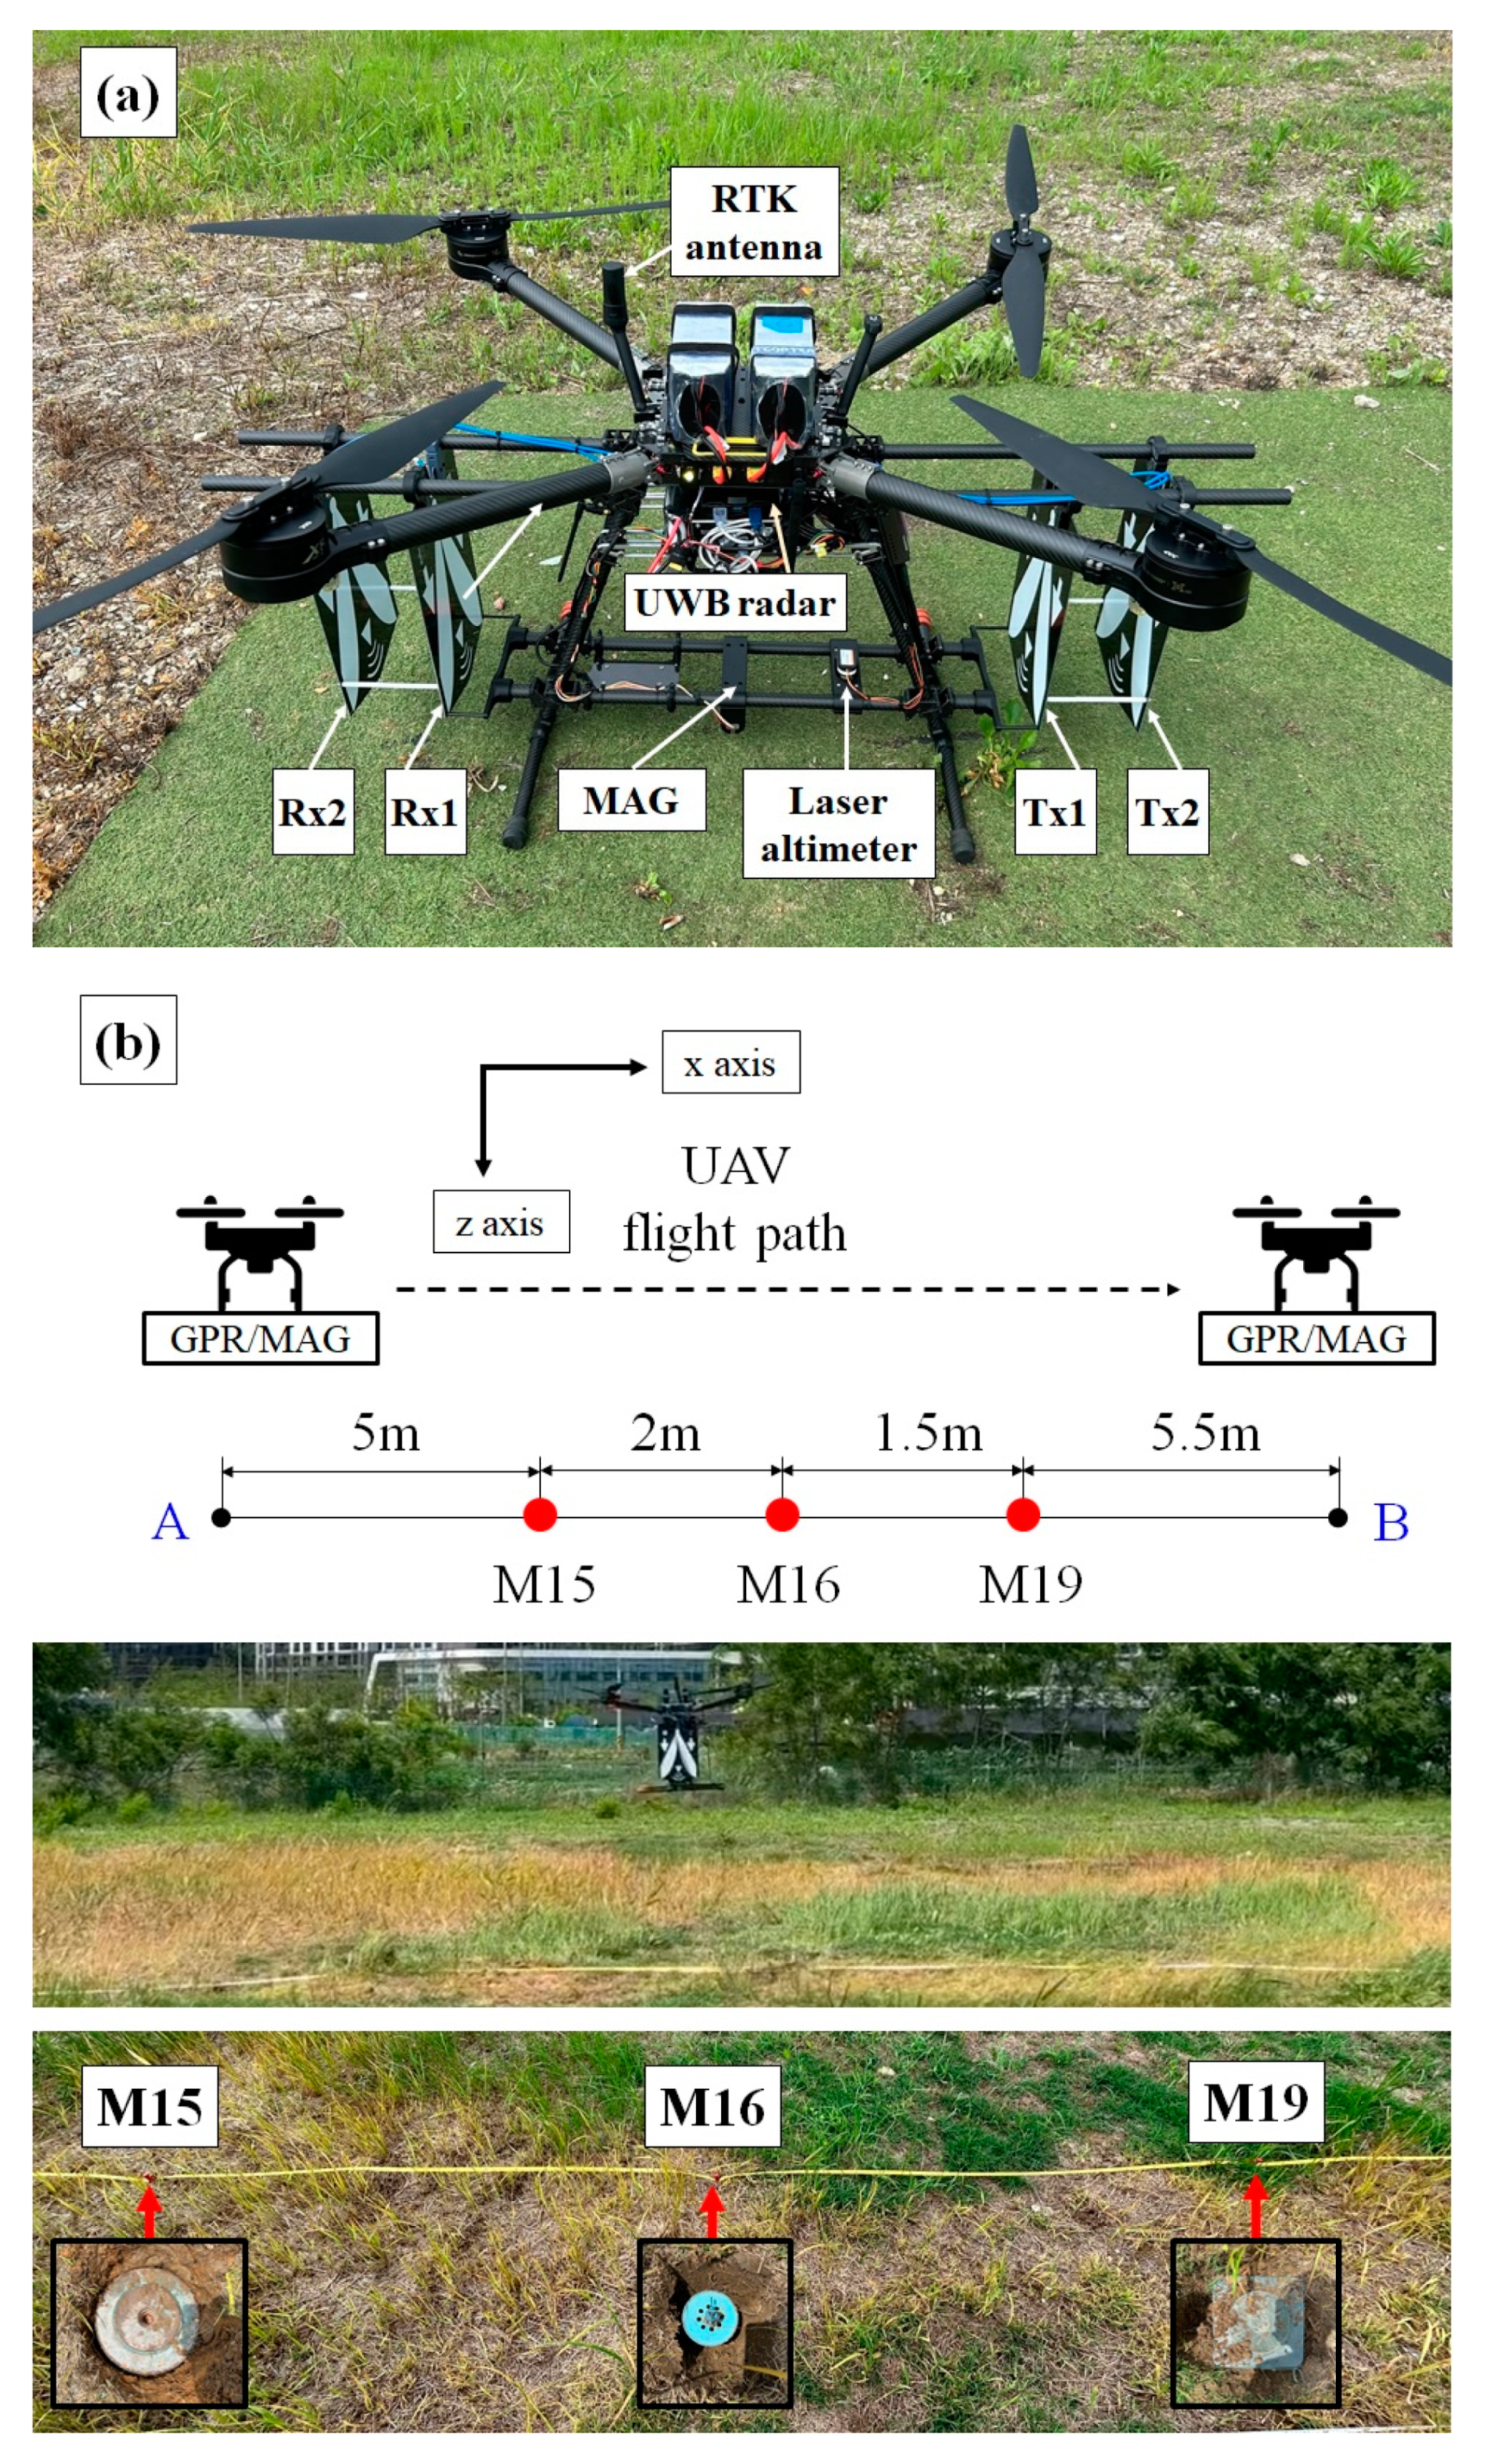
To validate the proposed UAV-borne GPR and MAG model, we developed a joint UAV-borne GPR and MAG measurement system, as shown in Figure 9a. An array of four-element commercial Vivaldi antennas (model TSA600) from RF space [41], along with a 12th-order M-sequence ultra-wide band (UWB) radar module (model SH-3100) from Ilmsens [38] and a fluxgate MAG (model 1540) from Applied Physics Systems [42], were mounted on board the UAV as shown in Figure 9a. The two-channel transmitter and receiver antenna arrays were mounted parallel to each other and separated by 80 cm, satisfying the minimum distance rule dant  >   λ c / 4 [2]. The antenna array was designed and placed for optimal performance, with the antennas positioned 12 cm apart, considering factors such as antenna array gain and crosstalk. Furthermore, to effectively mitigate both the direct coupling of the radar module and the interference from the UAV’s communication link (5.8 GHz) for each receiving antenna, we employed two RF filters (model: SHP-500+) sourced from Minicircuits [43], operating within the 500 MHz to 3.2 GHz range. The UAV was equipped with a real-time kinematic (RTK) system on its upper surface, ensuring precise positioning with an accuracy of 1 cm. Additionally, a laser altimeter was mounted beneath the UAV, accurately measuring the UAV’s altitude with a precision of 1 cm. Full details are presented in Figure 9a. To mitigate the magnetic noise originating from the UAV, a fluxgate MAG was installed at the center of the antenna array, approximately 30 cm below the center of the UAV. Because the MAG operated at around 10 kHz and the radar operated within the frequency range of 0.6–6 GHz, the devices did not electromagnetically interfere with one another. The overall weight of the payload in this system was about 4 kg (excluding batteries), enabling flights of approximately 30 min.
The experimental set-up of the joint UAV-borne GPR and MAG system is shown in Figure 9b. The UAV system uniformly moved at an altitude of 1 m to collect GPR and MAG data from landmines M15, M16, and M19. It maintained a heading of −72° towards the magnetic north direction, considering the magnetic declination of −8.93° and an inclination of 42°. The UAV traversed the surface along survey lines, starting from point A (37.5748234°N, 126.6697246°E) and reaching point B (37.5748576°N, 126.6695722°E). The landmines were buried at designated locations, concealed beneath moist sand at a depth of 3.5 cm. The flight speed was 0.5 m/s, and the sampling distance intervals of the RTK position, GPR, and MAG were 10 cm for the joint GPR and MAG data analysis. Because the experiment was conducted in the northern hemisphere (heading: −72°, declination: −8.93°, inclination: 42°), the magnetic anomaly curve of a landmine changed in the form of negative-positive-negative behavior along the survey path from A to B. The GPR data had a hyperbola-shaped signal regardless of the magnetic latitude.
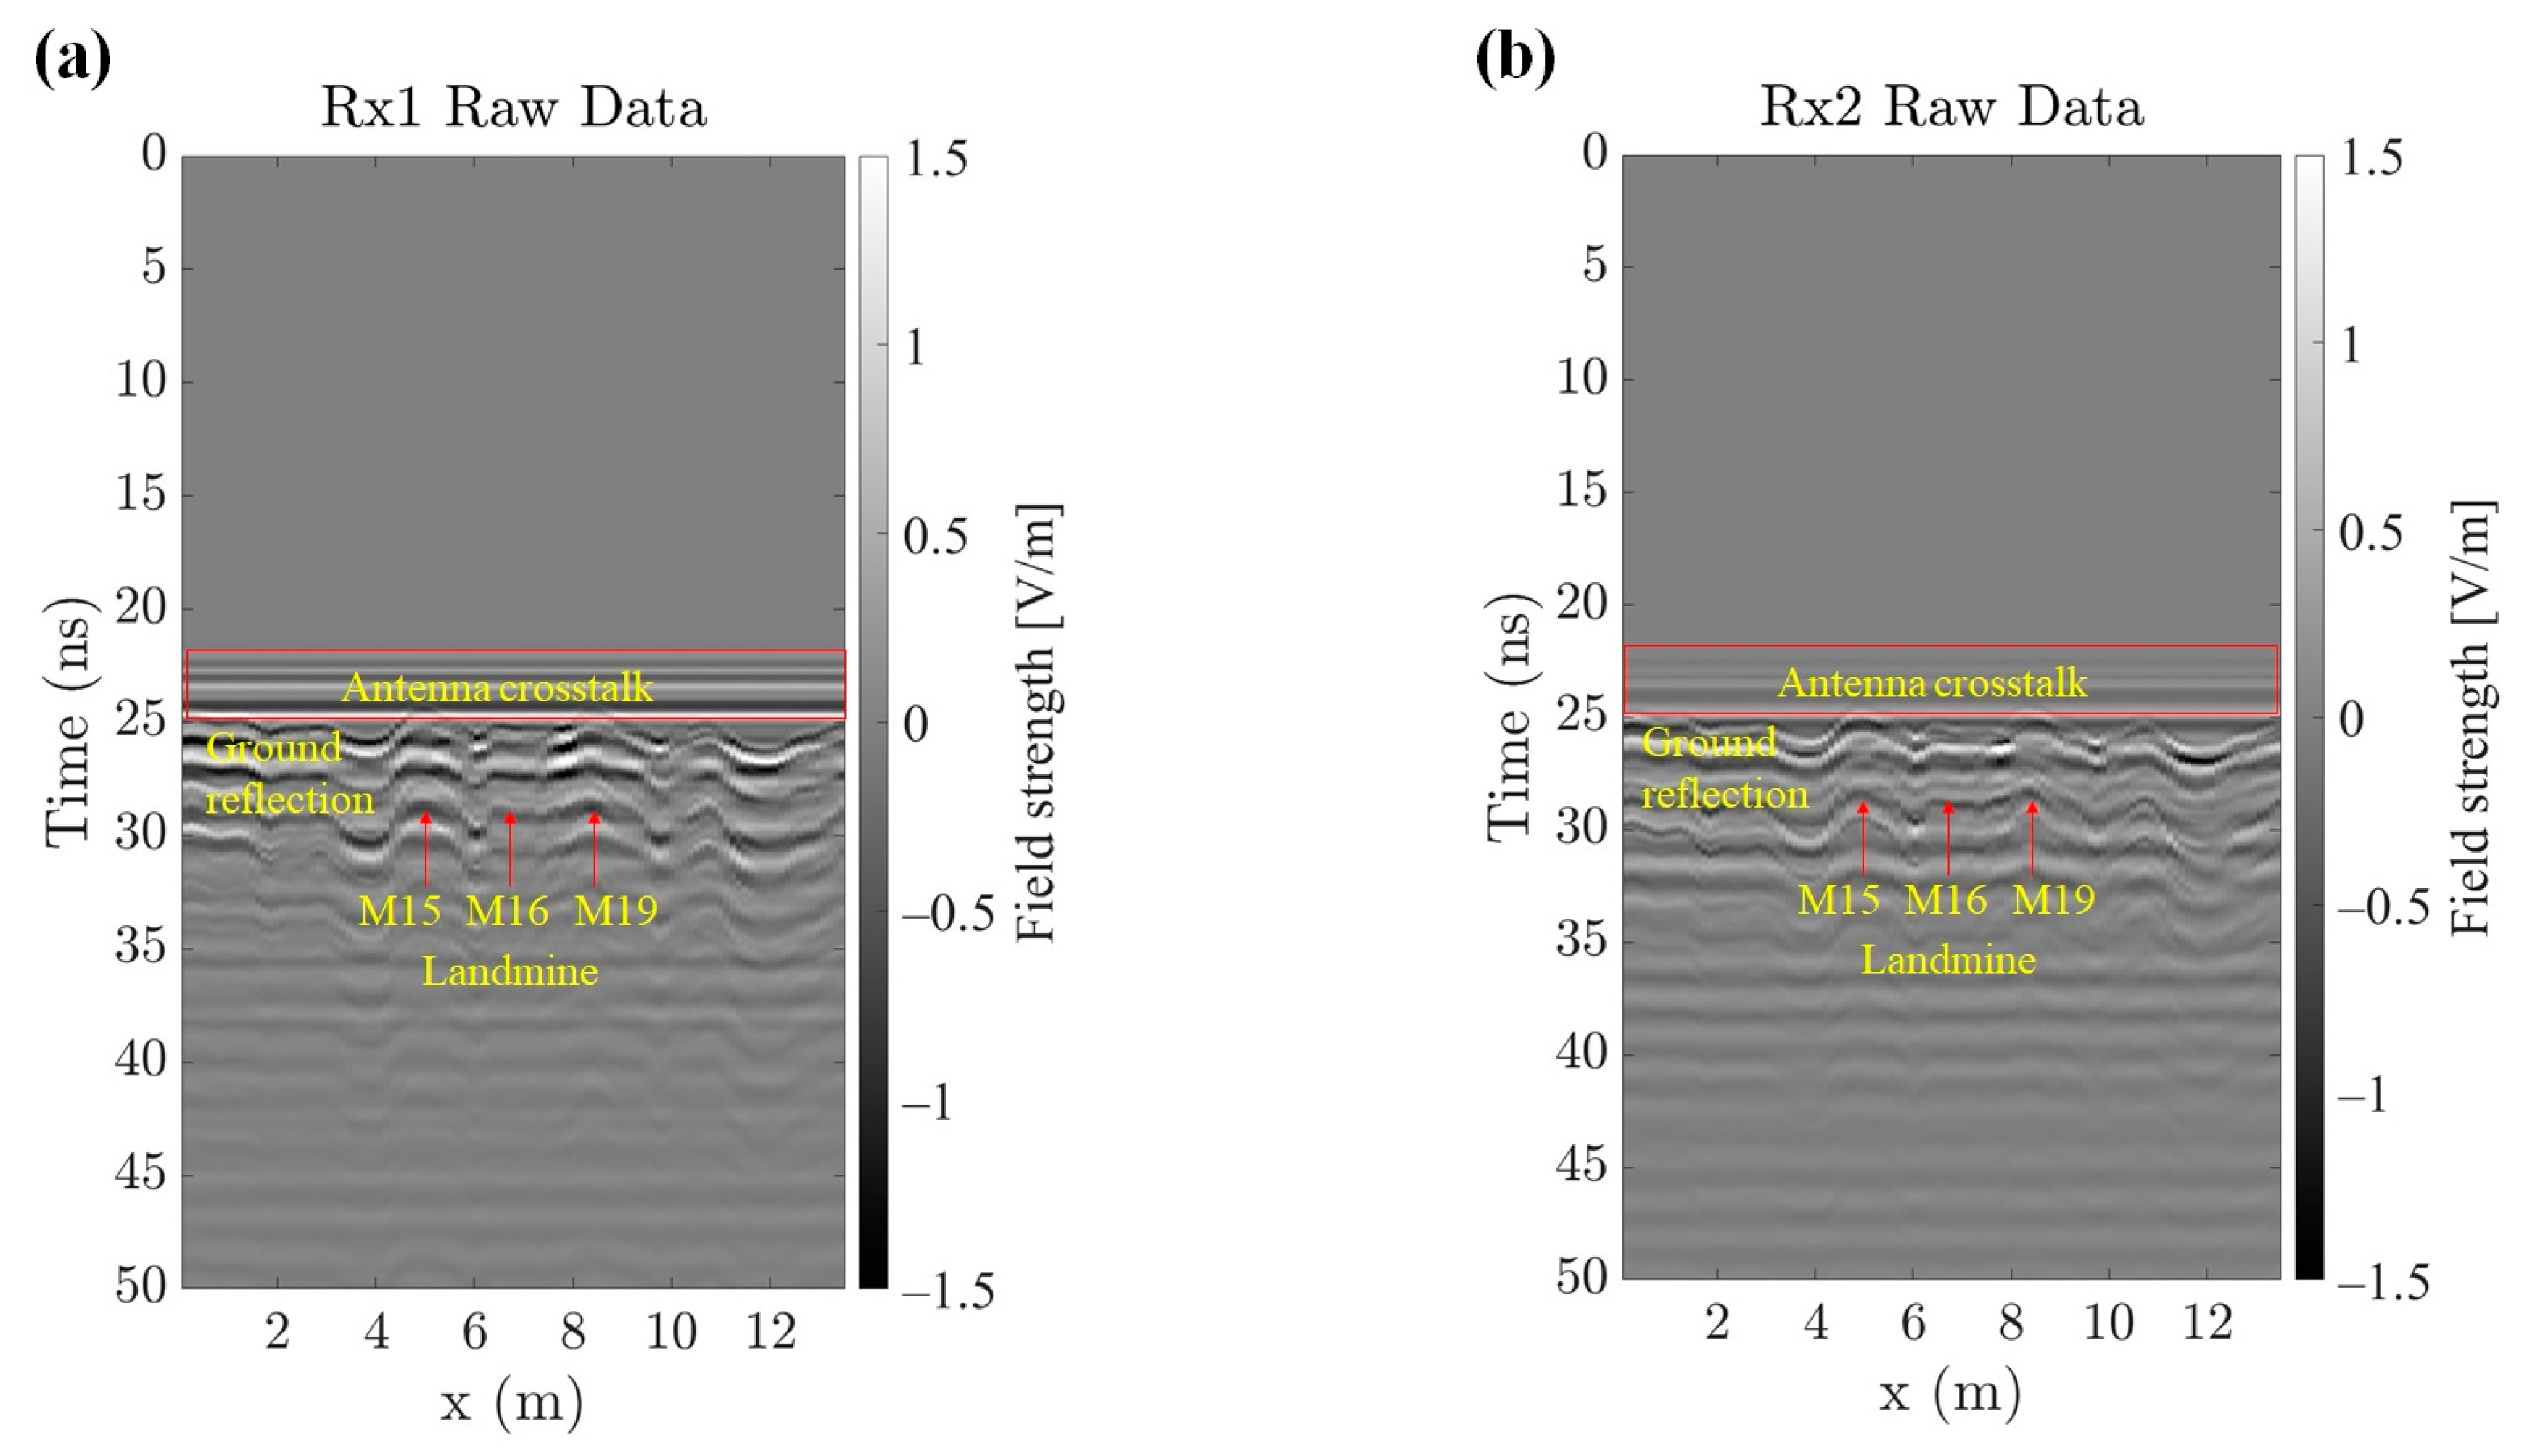
The GPR data collection interval was 10 cm, and the B-scan of the radar measurement data was gathered along a straight path of 14.0 m with 140 discrete spatial points for each landmine due to the high computational load. In the experiment, the M15, M16, and M19 landmines were buried at (x = 5 m, 7 m, and 8.5 m, respectively) along the survey line. The reflected radar raw signals from the M15, M16, and M19 landmines are shown in Figure 10. The GPR consists of two receiving channels. In the acquired B-scan raw data, it is observed that the antenna crosstalk in Rx1 is higher than that in Rx2 (Figure 10). This is mainly due to the shorter distance between the Rx1 and Tx1 antennas in comparison to the distance between the Rx2 and Tx2 antennas. Because the test environment had some multilayer subsurface in addition to the irregular ground surface with the grass, there were some reflections and multiple instances of ground bouncing along the survey line.
Furthermore, the B-scan raw data displays various indications of imperfections in the antenna impulse response, which can be attributed to ringdown or multiple reflections. These imperfections arise due to the group delay caused by the GPR antennas used in conjunction with the RF filters during the experiment. Specifically, the phase center variation of the TSA600 Vivaldi antenna ranged from approximately −10 to 7.5 cm within the frequency range of 500 MHz to 3 GHz [6]. Additionally, the group delay of the RF filter itself within this frequency band ranged from approximately 0.33 to 3.48 ns [43]. As a result, an observable ringdown phenomenon of approximately ~4 ns below the ground reflection was depicted in Figure 10.
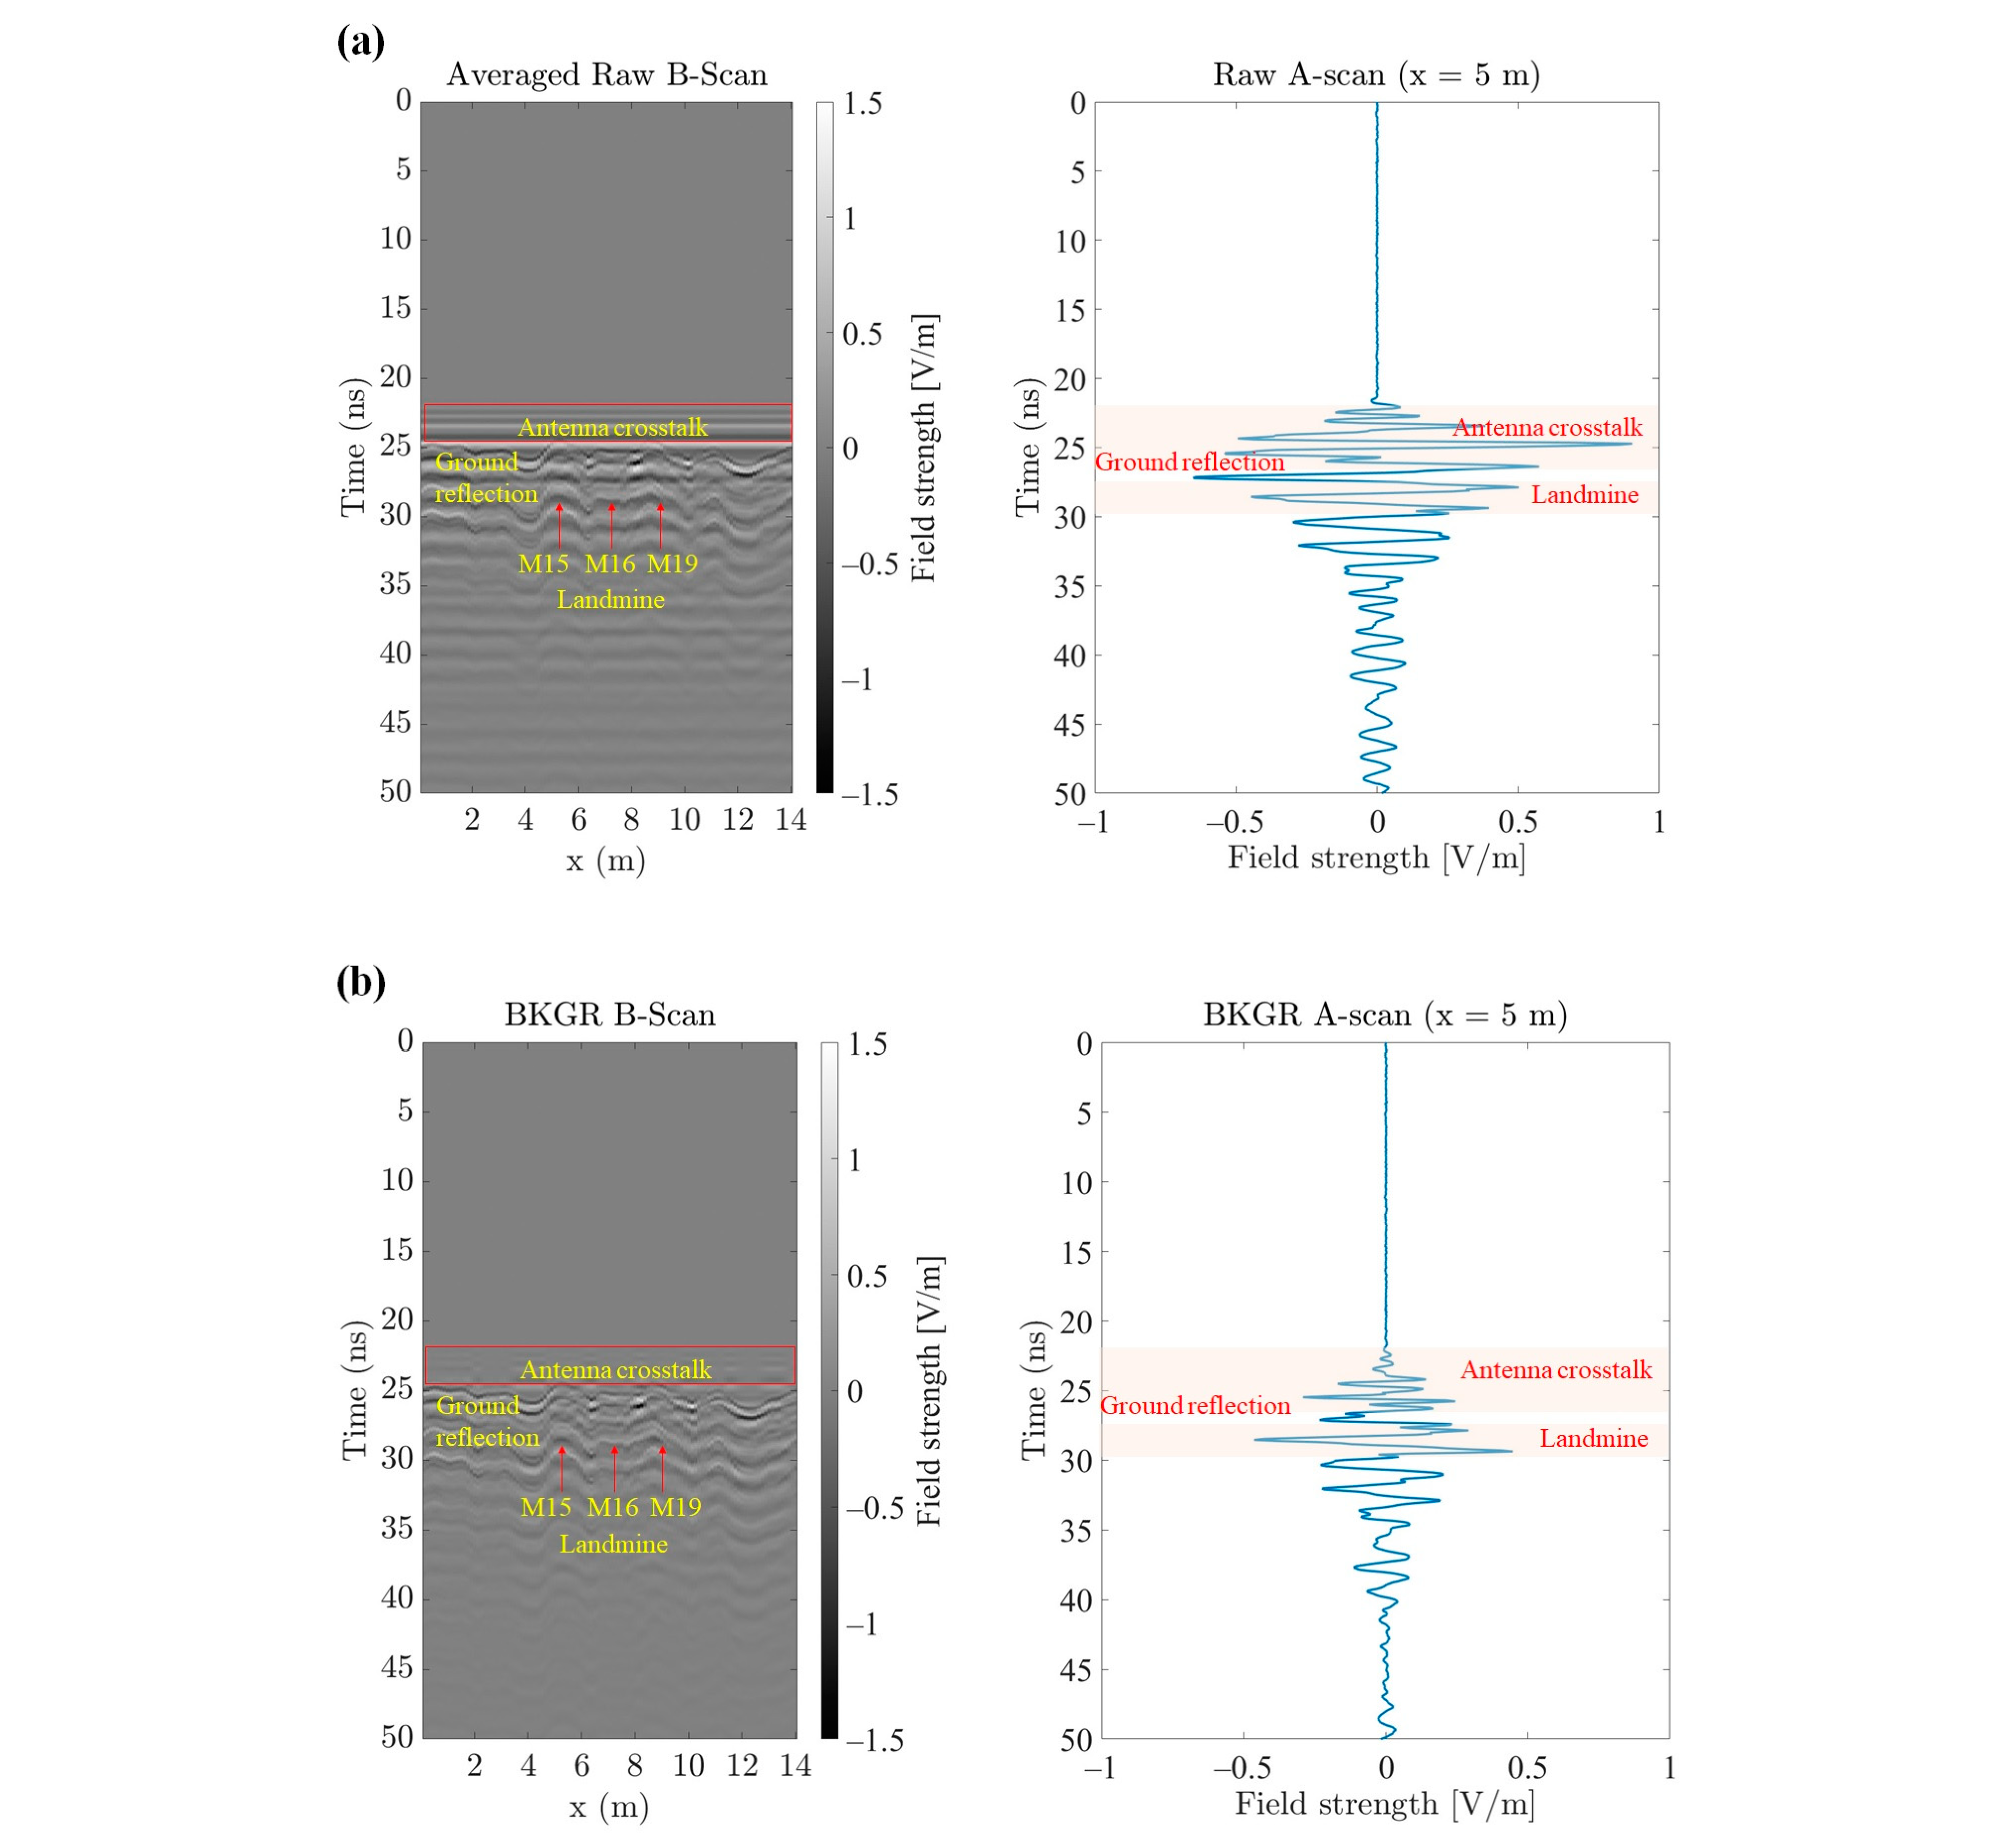
Therefore, the targets were not easily discernible in the raw data B-scan image. To enhance the detection of reflected signals from the landmines, the B-scan data was obtained by averaging the signals from the two receiving channels (Figure 11a). The direct waves from the antenna crosstalk and ground reflection exist at about ~25.62 ns and were removed based on the SVD algorithm (Figure 11b).
The ground reflection ( T G ) and landmine reflection ( T L ) exist about 25.62 ns and 26.66 ns, respectively. By utilizing the given information of the landmine burial depth (d = 3.5 cm) and propagation time T L T G = 1.04   ns , we can estimate the relative permittivity and electromagnetic wave velocity of the ground using Equation (9), where c 0 and v G are the propagation velocities of waves in the air and ground, respectively.
d = c 0 T L T G 2 ϵ r = v G × T L T G 2
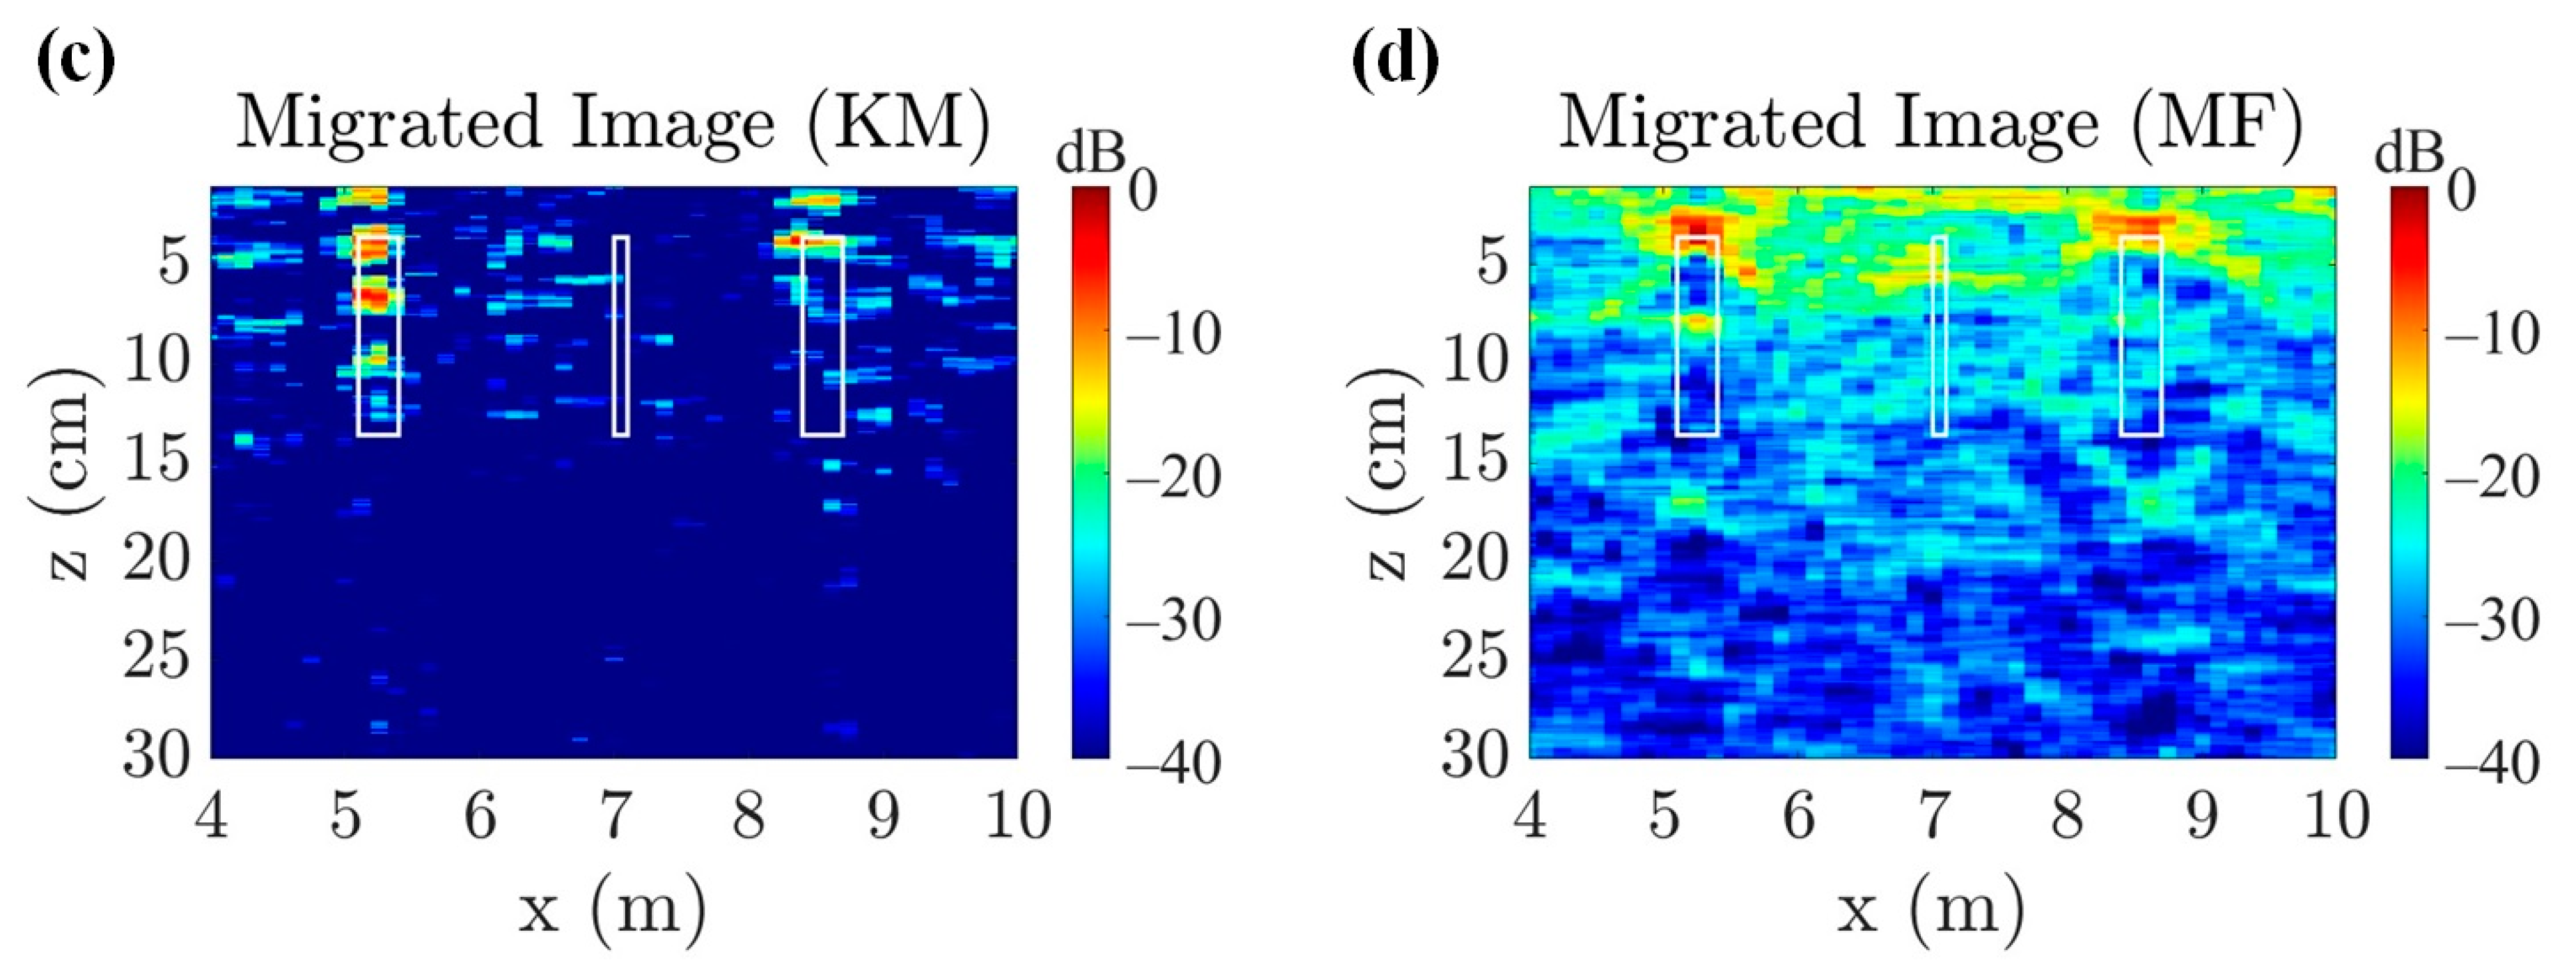
Based on the provided data, the estimated permittivity and velocity of electromagnetic waves in soil were approximately 19.866 and 6.731 cm/ns, respectively. After image migration and MF of the measured data, a GPR image of the M15, M16, and M19 landmines was acquired, as shown in Figure 11c,d. The M-sequence is defined as a pseudo-random sequence generated by a linear generator consisting of an n-bit shift register with appropriate feedback, whereas its periods is N = 2 m 1 chips, where m is the order of the M-sequence [44]. An ideal 12th order M-sequence waveform source was used for the impulse response function (h) based on Equation (7). After applying MF, a focused GPR image was successfully obtained, as shown in Figure 11d. Due to the MF algorithm that was applied, target reflections became more focused around the exact position of the objects except the M16 landmine.
In the experimental environment, the landmines were buried in an irregular multilayer ground surface with grass rather than a homogeneous medium. Additionally, due to the high permittivity ϵ r = 19.866 and the limited sampling distance (10 cm), the quality of the GPR data was significantly compromised, resulting in an inability to detect the M16 landmines. However, the presence of the M16 landmine was detected through analysis of the MAG data, as further explained.
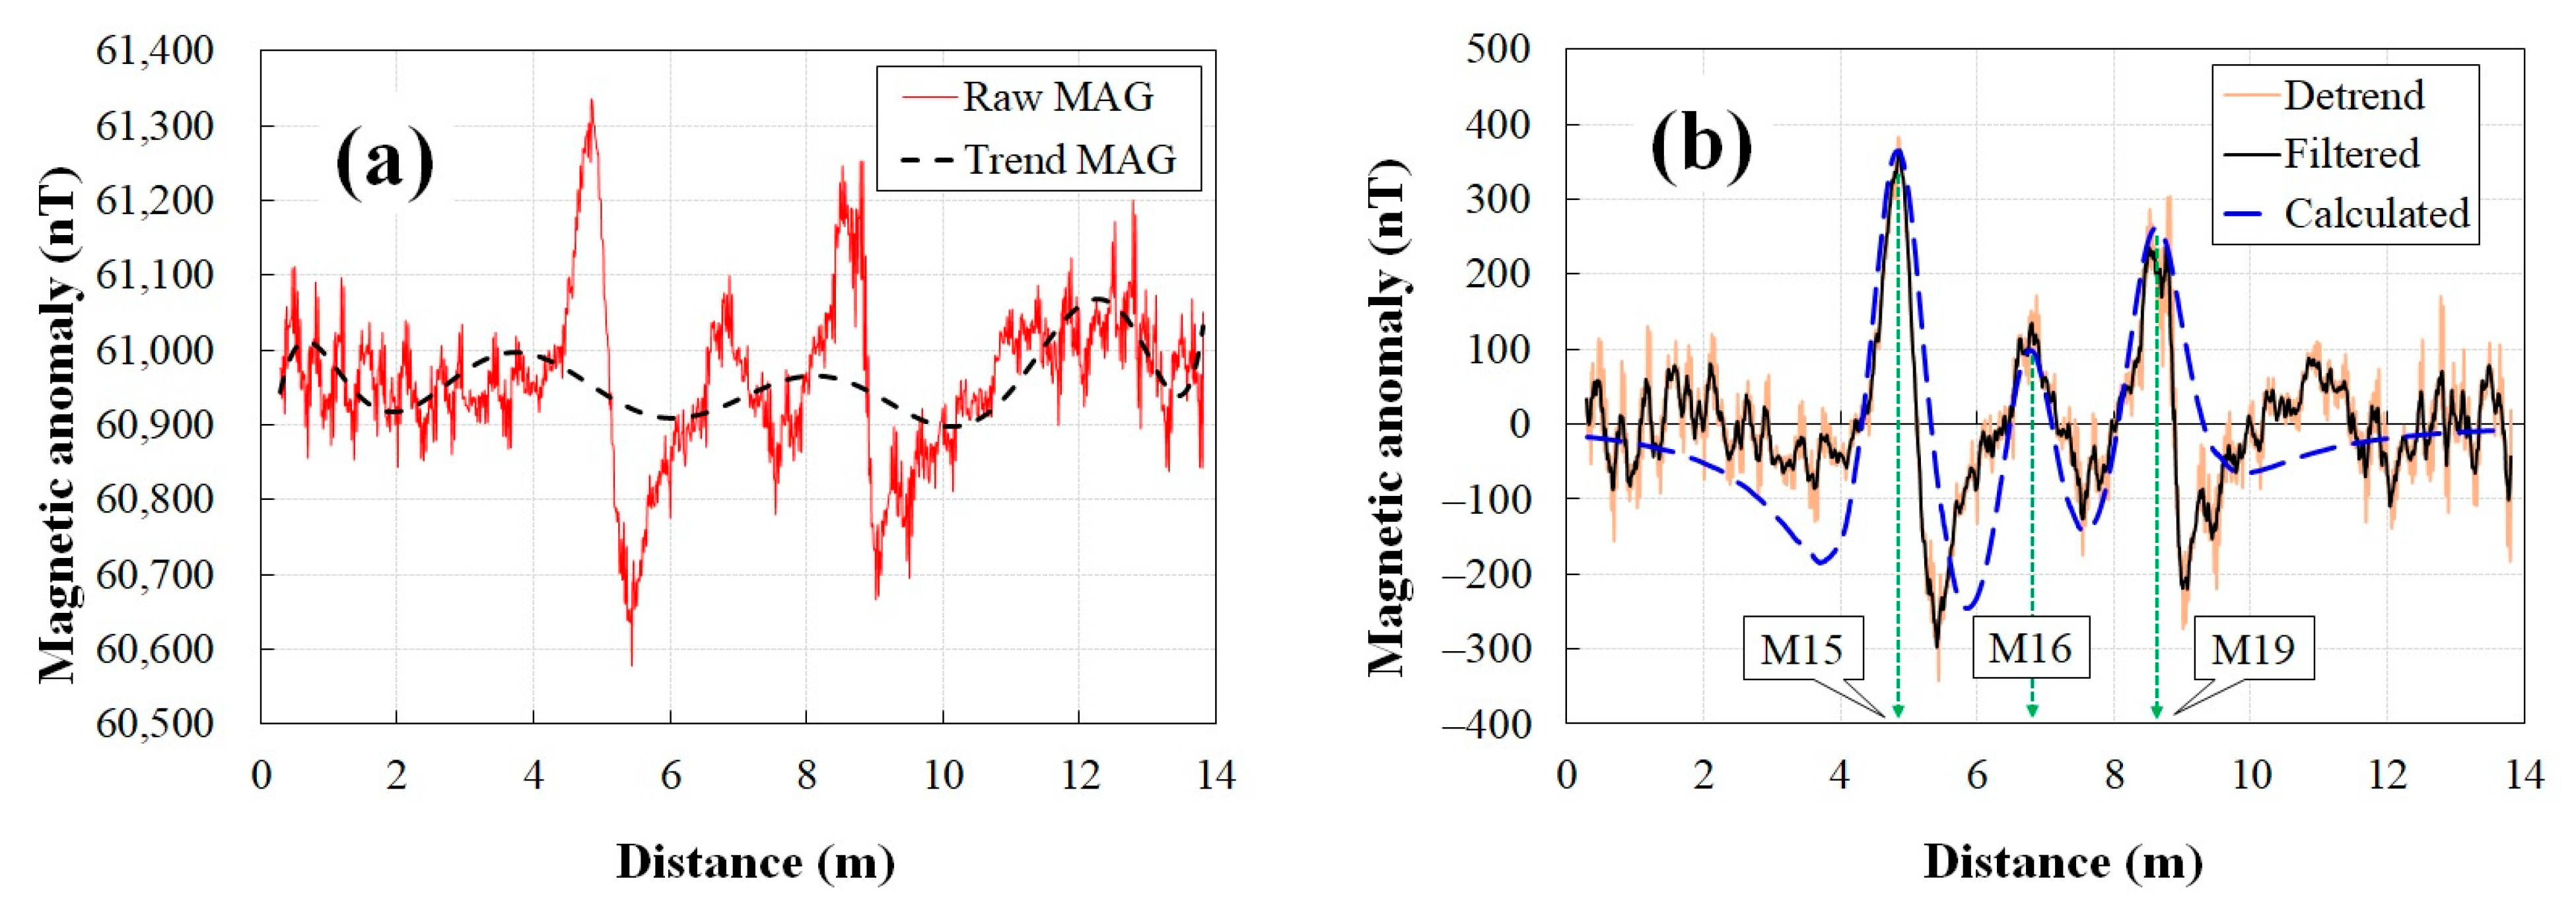
The magnetic anomalies of the M15, M16, and M19 landmines are shown in Figure 12. The collected MAG raw data (solid red lines) consisted of a geomagnetic field with a trend component (dotted black lines) and magnetic anomaly signals (Figure 12a).
The global geomagnetic field was eliminated by removing the trend component (Figure 12b). Positions identified by the peak magnetic anomaly lines were determined to be landmines. By subtracting the global geomagnetic field trend (solid orange lines) and applying the spatial (10 cm) median filter (solid black lines), we extracted landmine anomalies and estimated the FWHH. The estimated FWHH of the landmines closely matched the calculated FWHH based on the MAG model. The extracted magnetic anomaly curves (solid black lines) of the M15, M16, and M19 landmines also corresponded well with the calculated curves (dotted blue lines) based on the MAG model, except for the end of the survey line. It is important to note that the magnetic dipole model exclusively simulates magnetic anomalies caused by landmines. Consequently, a slight disparity arises between the modeled and measured magnetic anomaly values at the end of the survey line, as the magnetic field change occurring there is not taken into consideration during the simulation.

4. Discussion

The results of our M15, M16, and M19 landmine detection simulations and experiments, based on the joint UAV-borne GPR and MAG model, indicated that the proposed method automatically and accurately detected the three types of landmine. Compared with single-detection techniques [5,6,8] based on airborne and ground-based joint detection modes [14], the combined method proposed in this study has significant advantages in terms of its UAV-based positioning accuracy and detection efficiency.
In contrast to UAV-borne GPR exploration, where electromagnetic waves are actively emitted and received, UAV-borne MAG exploration is a passive technique based on the receipt of magnetic fields. In the experiments conducted in this study, we found that in a multilayer medium environment with ground bouncing, GPR had limitations in detecting landmines; however, MAG proved capable of compensating for these limitations.
Compared with a previously described joint detection system [14], the combined UAV-based GPR and MAG detection model and method proposed in this study had a higher survey efficiency than a ground-based survey using the same sensing technique and was more suitable for large-scale surveys and rapid landmine mapping. It was previously reported that the FWHH of a landmine decreases by approximately 0.2 cm when the soil moisture increases from 4.1% (dry) to 18.9% (wet) [45]. However, in real-world landmine detection scenarios, where safety and efficiency are crucial, a change in burial depth of approximately 0.2 cm is not important if the exact location and type of landmine can be determined. Thus, magnetic exploration using a UAV-borne MAG system, followed by exploration with a UAV-borne GPR system, will produce results that facilitate the precise distinction of plastic and metallic landmines according to the mass of their metallic components. Finally, based on a joint UAV-borne GPR and MAG system, the location, burial depth, and type of landmines can be successfully classified and mapped.
In this study, we considered the ground to be a homogeneous medium and did not consider its layered properties when modeling the UAV-borne GPR system. Further research is necessary to develop a new model that combines both the UAV-borne GPR and MAG systems, specifically tailored for this purpose. To achieve optimal performance of the combined sensing technique for landmine detection and classification in the natural environment, a combined UAV-borne GPR–MAG system that can operate adaptively under varying sensing conditions, such as flight speed and altitude, should be developed based on deep learning. Such a system would be able to operate each detection system adaptively and adjust their parameters through real-time interactions with the sensing environment.

5. Conclusions

In this study, we developed a model of a joint airborne GPR and MAG system for detecting and classifying metallic and plastic (minimum-metal) landmines. In the UAV-borne GPR simulation and experiment, AT M15 metallic, AP M16 metallic, and AT M19 plastic (minimum-metal) landmines were detected by SVD analysis. In the UAV-borne MAG simulation and experiment, the magnetic anomaly was estimated from the magnetic characteristics of the M15, M16, and M19 landmines based on the magnetic dipole model with a de-trend and a spatial median filtering process method. Through this comprehensive approach, which included experiments, simulations, and data processing, we obtained valuable design parameters. These design parameters can be used in the development and application of landmine detection systems based on airborne GPR and MAG technology.

Author Contributions

Conceptualization, methodology, software, formal analysis, investigation, resources, data curation, visualization, project administration, funding acquisition, writing—original draft preparation, J.L.; writing—review and editing, supervision, H.L.; validation, S.K., D.J. and J.H. All authors have read and agreed to the published version of the manuscript.

Funding

This work was supported by the National Research Foundation of Korea (NRF) grant funded by the Korea government (MSIT) (2021R1F1A1057455) and promoted by Korea Institute of Ocean Science and Technology (KIOST) (PN91780).

Data Availability Statement

Not applicable.

Conflicts of Interest

The authors declare no conflict of interest.

References

  1. Cerquera, M.R.P.; Montaño, J.D.C.; Mondragón, I.; Canbolat, H. UAV for landmine detection using SDR-based GPR technology. In Robots Operating in Hazardous Environments; IntechOpen: London, UK, 2017; pp. 26–55. [Google Scholar]
  2. Šipoš, D.; Gleich, D. A lightweight and low-power UAV-borne ground penetrating radar design for landmine detection. Sensors 2020, 20, 2234. [Google Scholar] [CrossRef] [PubMed] [Green Version]
  3. Burr, R.; Schartel, M.; Schmidt, P.; Mayer, W.; Walter, T.; Waldschmidt, C. Design and Implementation of a FMCW GPR for UAV-based Mine Detection. In Proceedings of the 2018 IEEE MTT-S International Conference on Microwaves for Intelligent Mobility (ICMIM), Munich, Germany, 15–17 April 2018; pp. 1–4. [Google Scholar]
  4. Garcia-Fernandez, M.; Alvarez-Lopez, Y.; Las Heras, F. Autonomous airborne 3D SAR imaging system for subsurface sensing: UWB-GPR on board a UAV for landmine and IED detection. Remote Sens. 2019, 11, 2357. [Google Scholar] [CrossRef] [Green Version]
  5. Schartel, M.; Burr, R.; Bähnemann, R.; Mayer, W.; Waldschmidt, C. An experimental study on airborne landmine detection using a circular synthetic aperture radar. arXiv 2020, arXiv:2005.02600. [Google Scholar]
  6. Fernández, M.G.; Narciandi, G.Á.; Arboleya, A.; Antuña, C.V.; Andrés, F.L.-H.; López, Y.Á. Development of an Airborne-Based GPR System for Landmine and IED Detection: Antenna Analysis and Intercomparison. IEEE Access 2021, 9, 127382–127396. [Google Scholar] [CrossRef]
  7. Yoo, L.-S.; Lee, J.-H.; Ko, S.-H.; Jung, S.-K.; Lee, S.-H.; Lee, Y.-K. A drone fitted with a magnetometer detects landmines. IEEE Geosci. Remote Sens. Lett. 2020, 17, 2035–2039. [Google Scholar] [CrossRef]
  8. Yoo, L.-S.; Lee, J.-H.; Lee, Y.-K.; Jung, S.-K.; Choi, Y. Application of a drone magnetometer system to military mine detection in the demilitarized zone. Sensors 2021, 21, 3175. [Google Scholar] [CrossRef] [PubMed]
  9. Dobrovolskiy, A. Detection and Localization of Ferrous Underground Objects and Buried Utilities Using Airborne Magnetometers and Metal Detectors. First Break 2021, 39, 79–85. [Google Scholar] [CrossRef]
  10. Joo, M.; Yoon, J.; Junejo, A.R.; Doh, J. Optimization: Drone-Operated Metal Detection Based on Machine Learning and PID Controller. Int. J. Precis. Eng. Manuf. 2022, 23, 503–515. [Google Scholar]
  11. Dena, A.; Ahiska, K.; Aouf, N. Image based visual servoing for landmine detection using quadrotors. In Proceedings of the 2020 15th IEEE Conference on Industrial Electronics and Applications (ICIEA), Kristiansand, Norway, 9–13 November 2020; pp. 527–532. [Google Scholar]
  12. Grosz, A.; Haji-Sheikh, M.J.; Mukhopadhyay, S.C. High Sensitivity Magnetometers; Springer: Berlin/Heidelberg, Germany, 2017; Volume 19. [Google Scholar]
  13. Fischer, C.; Wiesbeck, W. Multistatic GPR for antipersonnel mine detection. In Proceedings of the IGARSS 2001. Scanning the Present and Resolving the Future. Proceedings. IEEE 2001 International Geoscience and Remote Sensing Symposium (Cat. No. 01CH37217), Sydney, NSW, Australia, 9–13 July 2001; pp. 2721–2723. [Google Scholar]
  14. Mu, Y.; Xie, W.; Zhang, X. The joint UAV-borne magnetic detection system and cart-mounted time domain electromagnetic system for UXO detection. Remote Sens. 2021, 13, 2343. [Google Scholar]
  15. Sato, M.; Kikuta, K.; Miller, R.B. Evaluation of ALIS GPR for humanitarian demining in colombia and cambodia. In Proceedings of the 2018 International Conference on Electromagnetics in Advanced Applications (ICEAA), Cartagena, Colombia, 10–14 September 2018; pp. 114–117. [Google Scholar]
  16. Li, H.; Li, N.; Wu, R.; Wang, H.; Gui, Z.; Song, D. GPR-RCNN: An algorithm of subsurface defect detection for airport runway based on GPR. IEEE Robot. Autom. Lett. 2021, 6, 3001–3008. [Google Scholar]
  17. Hou, F.; Lei, W.; Li, S.; Xi, J. Deep learning-based subsurface target detection from GPR scans. IEEE Sens. J. 2021, 21, 8161–8171. [Google Scholar] [CrossRef]
  18. Chen, G.; Bai, X.; Wang, G.; Wang, L.; Luo, X.; Ji, M.; Feng, P.; Zhang, Y. Subsurface Voids Detection from Limited Ground Penetrating Radar Data Using Generative Adversarial Network and YOLOV5. In Proceedings of the 2021 IEEE International Geoscience and Remote Sensing Symposium IGARSS, Brussels, Belgium, 11–16 July 2021; pp. 8600–8603. [Google Scholar]
  19. Liu, Z.; Wu, W.; Gu, X.; Li, S.; Wang, L.; Zhang, T. Application of combining YOLO models and 3D GPR images in road detection and maintenance. Remote Sens. 2021, 13, 1081. [Google Scholar] [CrossRef]
  20. Zhang, X.; Han, L.; Robinson, M.; Gallagher, A. A GANs-based deep learning framework for automatic subsurface object recognition from ground penetrating radar data. IEEE Access 2021, 9, 39009–39018. [Google Scholar] [CrossRef]
  21. Akhaury, U.; Giannakis, I.; Warren, C.; Giannopoulos, A. Machine Learning Based Forward Solver: An Automatic Framework in gprMax. arXiv 2021, arXiv:2111.12148. [Google Scholar]
  22. Omwenga, M.M.; Wu, D.; Liang, Y.; Yang, L.; Huston, D.; Xia, T. Cognitive gpr for subsurface object detection based on deep reinforcement learning. IEEE Internet Things J. 2021, 8, 11594–11606. [Google Scholar] [CrossRef]
  23. Fan, L.; Kang, C.; Wang, H.; Hu, H.; Zhang, X.; Liu, X. Adaptive Magnetic Anomaly Detection Method Using Support Vector Machine. IEEE Geosci. Remote Sens. Lett. 2020, 19, 8001705. [Google Scholar] [CrossRef]
  24. Liu, S.; Chen, Z.; Pan, M.; Zhang, Q.; Liu, Z.; Wang, S.; Chen, D.; Hu, J.; Pan, X.; Hu, J. Magnetic anomaly detection based on full connected neural network. IEEE Access 2019, 7, 182198–182206. [Google Scholar] [CrossRef]
  25. Xu, X.; Huang, L.; Liu, X.; Fang, G. Deepmad: Deep learning for magnetic anomaly detection and denoising. IEEE Access 2020, 8, 121257–121266. [Google Scholar] [CrossRef]
  26. Ruff, L.; Kauffmann, J.R.; Vandermeulen, R.A.; Montavon, G.; Samek, W.; Kloft, M.; Dietterich, T.G.; Müller, K.-R. A unifying review of deep and shallow anomaly detection. Proc. IEEE 2021, 109, 756–795. [Google Scholar]
  27. Giannopoulos, A. Modelling ground penetrating radar by GprMax. Constr. Build. Mater. 2005, 19, 755–762. [Google Scholar] [CrossRef]
  28. Nobes, D.C. Geophysical surveys of burial sites: A case study of the Oaro urupa. Geophysics 1999, 64, 357–367. [Google Scholar] [CrossRef]
  29. Hamran, S.-E.; Gjessing, D.; Hjelmstad, J.; Aarholt, E. Ground penetrating synthetic pulse radar: Dynamic range and modes of operation. J. Appl. Geophys. 1995, 33, 7–14. [Google Scholar] [CrossRef]
  30. Soldovieri, F.; Lopera, O.; Lambot, S. Combination of advanced inversion techniques for an accurate target localization via GPR for demining applications. IEEE Trans. Geosci. Remote Sens. 2010, 49, 451–461. [Google Scholar] [CrossRef]
  31. Oliveira, R.J.; Caldeira, B.; Teixidó, T.; Borges, J.F. GPR clutter reflection noise-filtering through singular value decomposition in the bidimensional spectral domain. Remote Sens. 2021, 13, 2005. [Google Scholar]
  32. Berkhout, A. Wave field extrapolation techniques in seismic migration, a tutorial. Geophysics 1981, 46, 1638–1656. [Google Scholar] [CrossRef]
  33. Stolt, R.H. Migration by Fourier transform. Geophysics 1978, 43, 23–48. [Google Scholar] [CrossRef]
  34. Franceschetti, G.; Lanari, R. Synthetic Aperture Radar Processing; CRC Press: Boca Raton, FL, USA, 2018. [Google Scholar]
  35. Prager, S.; Moghaddam, M. Application of ultra-wideband synthesis in software defined radar for UAV-based landmine detection. In Proceedings of the IGARSS 2019—2019 IEEE International Geoscience and Remote Sensing Symposium; 2019; pp. 10115–10118. [Google Scholar]
  36. Leuschen, C.J.; Plumb, R.G. A matched-filter-based reverse-time migration algorithm for ground-penetrating radar data. IEEE Trans. Geosci. Remote Sens. 2001, 39, 929–936. [Google Scholar] [CrossRef] [Green Version]
  37. Lombardi, F.; Griffiths, H.D.; Lualdi, M.; Balleri, A. Characterization of the internal structure of landmines using ground-penetrating radar. IEEE Geosci. Remote Sens. Lett. 2020, 18, 266–270. [Google Scholar] [CrossRef] [Green Version]
  38. M: Explore UWB Radar from ILMSens. Available online: https://www.ilmsens.com/products/m-explore/ (accessed on 26 July 2023).
  39. Florsch, N.; Camerlynck, C.; Kammenthaler, M.; Muhlach, F. Everyday Applied Geophysics 2: Electromagnetics and Magnetics; ISTE Press Limited-Elsevier Incorporated: Amsterdam, The Netherlands, 2018. [Google Scholar]
  40. Daniels, D.J. Ground Penetrating Radar; Iet: London, UK, 2004; Volume 1. [Google Scholar]
  41. TSA600 Vivaldi Antenna From RFSpace. Available online: http://rfspace.com/RFSPACE/Antennas_files/TSA600.pdf (accessed on 26 July 2023).
  42. 1540 Magnetometer From Applied Physics. Available online: https://appliedphysics.com/wp-content/uploads/2022/10/APS_Model1540_RES_DataSheet_vA.pdf (accessed on 26 July 2023).
  43. SHP-500+ High Pass Filter from Minicircuits. Available online: https://www.minicircuits.com/pdfs/SHP-500+.pdf (accessed on 26 July 2023).
  44. Galajda, P.; Pecovsky, M.; Sokol, M.; Kmec, M.; Kocur, D. Recent advances in asic development for enhanced performance m-sequence uwb systems. Sensors 2020, 20, 4812. [Google Scholar] [CrossRef]
  45. Ege, Y.; Nazlibilek, S.; Kakilli, A.; Çıtak, H.; Kalender, O.; Erturk, K.L.; Sengul, G.; Karacor, D. A magnetic measurement system and identification method for buried magnetic materials within wet and dry soils. IEEE Trans. Geosci. Remote Sens. 2015, 54, 1803–1811. [Google Scholar] [CrossRef]
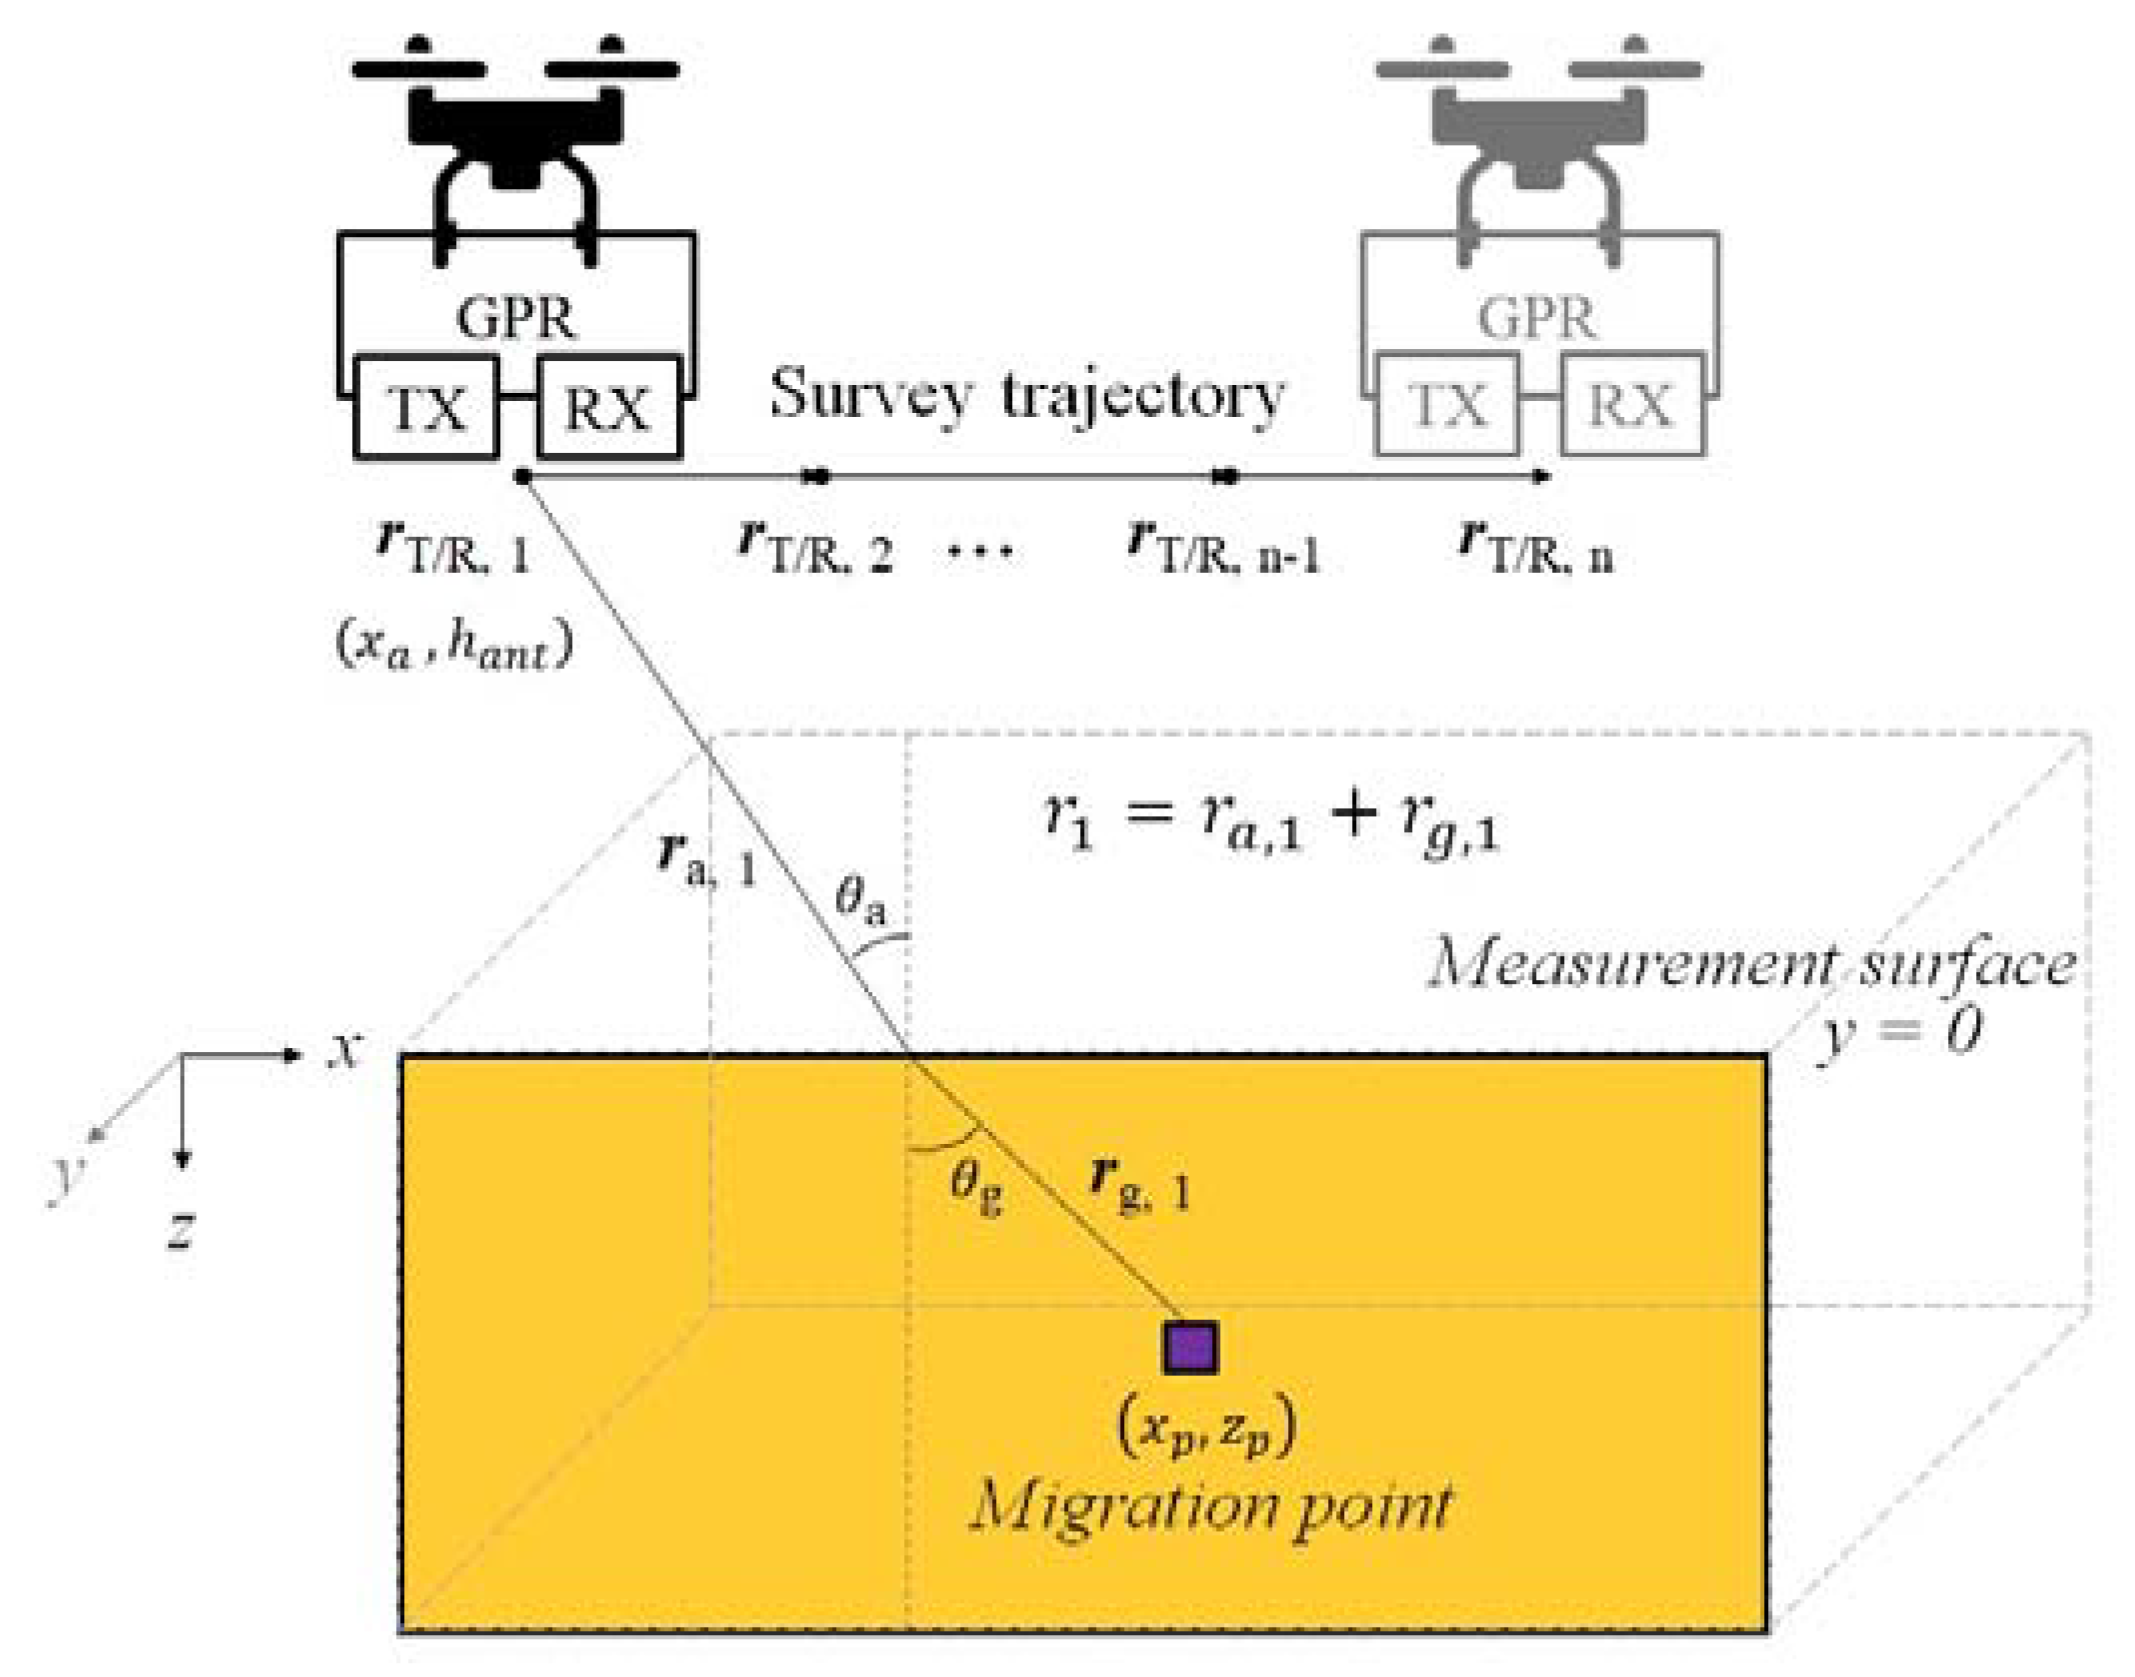
Figure 1. The UAV-borne GPR modeling and measurement scheme.
Remotesensing 15 03813 g001
Figure 2. The UAV-borne MAG modeling and measurement scheme.
Remotesensing 15 03813 g002
Figure 3. Conceptual model of the full width at half height (FWHH) principle used to estimate landmine burial depth.
Remotesensing 15 03813 g003
Figure 4. Geometry of the UAV-borne GPR and MAG models, including the positions of target landmines.
Remotesensing 15 03813 g004
Figure 5. Simulated radar signals reflected from the M15, M16, and M19 landmines with 2 cm spatial intervals (a) before and (b) after removing background noise using SVD. Migrated image results (c) before and (d) after MF.
Remotesensing 15 03813 g005
Figure 6. The MF results for the M15, M16, and M19 landmines at spatial intervals of (a) 8 cm and (b) 16 cm.
Remotesensing 15 03813 g006
Figure 7. Total and metallic component mass measurements for (a) the three types of landmines and (b) the M19 landmine.
Remotesensing 15 03813 g007
Figure 8. Simulated magnetic anomaly curves for the M15, M16, and M19 landmines with (a) a 0.2 m spatial interval and (b) various spatial intervals.
Remotesensing 15 03813 g008
Figure 9. Joint UAV-borne GPR and MAG measurement (a) system and (b) experimental set-up.
Remotesensing 15 03813 g009
Figure 10. Measured radar raw signals reflected from the M15, M16, and M19 landmines for (a) Rx1 and (b) Rx2 channels.
Remotesensing 15 03813 g010
Figure 11. Averaged radar signals reflected from the M15, M16, and M19 landmines (a) before and (b) after removing background noise using SVD. Migrated image results (c) before and (d) after MF.
Remotesensing 15 03813 g011aRemotesensing 15 03813 g011b
Figure 12. Magnetic characteristics of (a) three landmines before removing the geomagnetic field with a trend and (b) after removing the geomagnetic field trend and spatial filtering. The solid orange lines and solid black lines indicate the de-trend and the spatially filtered landmine anomalies without the geomagnetic field, respectively. Dotted blue lines indicate the calculated anomalies based on the MAG model.
Remotesensing 15 03813 g012
Disclaimer/Publisher’s Note: The statements, opinions and data contained in all publications are solely those of the individual author(s) and contributor(s) and not of MDPI and/or the editor(s). MDPI and/or the editor(s) disclaim responsibility for any injury to people or property resulting from any ideas, methods, instructions or products referred to in the content.