Article

Deformation Evaluation of the South-to-North Water Diversion Project (SNWDP) Central Route over Handan in Hebei, China, Based on Sentinel-1A, Radarsat-2, and TerraSAR-X Datasets

1
Guangdong Laboratory of Artificial Intelligence and Digital Economy (SZ), Shenzhen 518107, China
2
College of Civil and Transportation Engineering, Shenzhen University, Shenzhen 518060, China
3
MNR Key Laboratory for Geo-Environmental Monitoring of Great Bay Area & Guangdong Key Laboratory of Urban Informatics & Shenzhen Key Laboratory of Spatial Smart Sensing and Services, Shenzhen University, Shenzhen 518060, China
4
School of Architecture & Urban Planning, Shenzhen University, Shenzhen 518060, China
*
Author to whom correspondence should be addressed.
Remote Sens. 2023, 15(14), 3516; https://doi.org/10.3390/rs15143516
Submission received: 13 June 2023 / Revised: 5 July 2023 / Accepted: 10 July 2023 / Published: 12 July 2023

Abstract

:
The South-to-North Water Diversion Project (SNWDP) is a megaproject which has been constructed to alleviate imbalanced water resource distribution between northern and southern China. It encompasses three routes distributed in the east, central, and west of China, respectively. The central route (CR) of the SNWDP starts from the Danjiangkou Reservoir and ends in Beijing and Tianjin, running through Hubei, Henan, and Hebei Provinces; it has been in service since December 2014. For this type of megaproject, efficient and effective safety monitoring during its operation is highly challenging to the management department. Multitemporal interferometric synthetic aperture radar (MT-InSAR) has been widely applied in monitoring land deformation, especially in a wide area. However, its ability to show the deformation of one specific facility along the SNWD has not been deeply investigated. This study investigates the capability of MT-InSAR in monitoring the deformation of the canal and ancillary facilities along the SNWD-CR over Handan, Hebei Province, in China, using Sentinel-1, Radarsat-2, and TerraSAR-X datasets. Deformation rates from March 2015 to March 2016 are obtained by applying permanent scatterers (PS)-InSAR to these three SAR datasets. After combining the deformation rates derived by the three datasets, deformation along the SNWDP-CR is evaluated using a method encompassing median absolute deviation (MAD) calculation and heatmap. The evaluation result reveals that one part of the western embankment of the open canal is subsiding at up to 10 mm/year, which may be associated with overirrigation. Besides this location, the most dangerous areas assessed by the proposed method are related to ancillary facilities, mainly aqueducts and crossing-canal bridges.

1. Introduction

China’s economy has been soaring in the last few decades, accompanied by many new and large-scale infrastructure projects constructed domestically. The South-to-North Water Diversion Project (SNWDP) is one typical example, which aims to alleviate the water imbalance between northern prosperous regions and southern water-rich regions [1,2]. Running 1276 km from the Danjiangkou Reservoir to Beijing, the SNWDP-CR transferred 30 billion cubic metres of water from the Danjiangkou Reservoir to the northern cities by 3 June 2020 [3,4]. Starting from the Danjiangkou Reservoir, which is about 146 m high, water flows almost by gravity along the SNWDP-CR, which is primarily artificial canals [5]. Construction of the SNWDP-CR includes primarily open canals and intersecting structures, such as aqueducts, siphons, culverts, sluices, and bridges [5]. The canal embankments are made from concrete and shaped like a dam embankment.
For this type of mega-infrastructure, challenges reside not only in its construction but also in safety monitoring during its operational period, which is the focus of its management departments. Conventionally, point-wise measurements and human visual inspection are carried out to investigate the safety status of the infrastructure. Nowadays, sensors such as accelerometers and strain gauges, GPS receivers, fibre optical sensing, image-based monitoring, etc., are used to improve inspection efficiency [6,7,8]. However, the expense of these systems is significantly high when applied to large-scale infrastructures. In this case, satellite observations can provide a low-cost complementary tool that vastly improves the efficiency of safety control of the SNWDP.
Interferometric synthetic aperture radar (InSAR) is now a widely applied satellite remote sensing technique to detect land deformation at millimetre accuracy over large areas [9]. Many multitemporal (MT)-InSAR methods have been developed to extract time series of land deformation from repeat-pass satellite datasets [10,11]. With these methods, long-term land deformations caused by earthquakes, volcanoes, landslides, groundwater withdrawal, etc., can be obtained in an effective and efficient way [12,13,14,15]. MT-InSAR has been successfully applied to monitor land deformation associated with the SNWDP-CR. It has been reported that additional groundwater supply sourced from the SNWDP-CR has primarily led to the alleviation of land subsidence in Beijing [16,17,18,19,20,21,22]. For example, Zhu et al. analysed the land subsidence in Beijing three years after the SNWDP-CR commenced by integrating hydrogeologic information, piezometric records, permanent scatterer (PS)-InSAR, and levelling [16]. They reported that a certain decrease (up to 10 mm/year) in the subsidence rates was observed in the central portion of the north Beijing plain, but the land subsidence continued to increase in the rest of the region [16]. Lyu et al. processed long-time-series Envisat ASAR (2004–2010), Radarsat-2 (2011–2014), and Sentinel-1 (2015–2017) of one central part of Beijing [17]. Their results show that over 57% of the area within the 25 mm/year contour line show decelerating subsidence after 2014, when the SNWDP started to supply water to Beijing [17]. Dong et al. retrieved land subsidence measurements over the past decades (1992–2022) by integrating multisensor C-band InSAR measurements into a logistic model, revealing three major subsidence funnels surrounding downtown in the north, northeast, and east of Beijing [22]. Dong et al. carried out multiscale deformation monitoring along the SNWDP-CR based on the Sentinel-1 dataset. They remarked that the canal bypassed the giant subsidence funnel in the southeast part of Hebei Province while exhibiting overall stability apart from a few sections affected by significant embankment deformation or land subsidence [23].
Apart from regional land deformation monitoring, InSAR techniques have also been increasingly used in direct deformation measurement of various types of infrastructure, such as buildings, bridges, railways, etc. [24,25,26]. These types of infrastructure, made from concrete, provide ideal persistent scatterers, which manifest as high signal-to-noise ratio (SNR) in radar signals. Nevertheless, they are sensitive to temperature variation, leading to a thermal effect on the deformation results [27,28,29,30]. As a water conservancy infrastructure, the thaw and freeze of water running in the canal of the SNWDP may be a cause of the distress in the embankment. This triggers the question of whether we can use satellite SAR observations to measure the deformation of the SNWDP infrastructure and to detect hazards or even dangerous regions.
In this study, we focus on the deformation monitoring of the SNWDP-CR canal and ancillary facilities based on multiple SAR datasets, including Sentinel 1-A (S1A), Radarsat-2 (RSAT2), and TerraSAR-X (TSX) over Handan in Hebei Province, China. The results derived by applying PS-InSAR to these three datasets are combined using a Z-score standardisation. The standardised deformation rates are combined and then evaluated using a median absolute deviation (MAD)-based weighted heatmap to highlight the dangerous areas with large deformation [31,32]. The following section introduces the study area, datasets, and methods. In Section 3, the PS-InSAR results of the study area and close-ups of typical ancillary facilities are presented. Based on these results, the deformation is evaluated, and the derived heatmap is displayed to show the dangerous areas. Finally, the discussion and conclusions based on the results are summarised in Section 4 and Section 5, respectively.

2. Materials and Methods

2.1. Study Area and Datasets

This study focuses on one segment of the SNWDP-CR crossing Handan, as shown in Figure 1, which is in southern Hebei Province, China, at the boundary of the Taihang Mountains. West of the SNWDP-CR, mining activities led to land deformation of up to 90 cm as measured by SAR observations during the period of July 2015 to April 2016 [33]. The SNWD-CR expands about 80 km across Handan, running from Anyang through Zhang River into Ci County in Handan, bypassing Dongwushi Reservoir, then west, parallel to the Jingguang railway, and north into Xingtai through Yongnian County, as shown by the red line in Figure 1. Most parts of the Handan segment are open canals, along which the bottom width of the embankments is 19–31 m, and the surface width is about 100 m. The maximum water depth is intended to be 6 m, with the flow speed designed to be 235 m3/s [34]. Since beginning operation in 2014, it provides 352 million cubic metres of water per year to Handan, of which the per capita water resources reach 192 cubic metres, accounting for only 8.4% of the national average. The SNWDP-CR is designed to provide water resources for eastern Handan City and 13 counties, including 0.6 million people occupying a total area of 7384 km2 [34].
Over the study area, we collected three satellite SAR datasets, and their spatial coverages are presented by the black boxes in Figure 1. The S1A dataset fully covers the SNWD-CR in Handan, while the TSX dataset covers that in Ci County and Handan County, and the RSAT2 dataset covers that in Handan County and Yongnian County. Detailed information about these datasets is listed in Table 1; the RSAT2 and TSX datasets were commercially obtained over a span of only one year. Apart from these two commercial datasets, we also collected 18 Sentinel-1A images, which span from June 2015 to March 2016, to cross-validate results derived from the other two datasets.

2.2. PS-InSAR Processing

SAR images record both the amplitude and phase of the microwave signals returned from ground targets. With multiple repeat-orbit acquisitions, the movement of the target can be measured at an accuracy of millimetres. Phases between two acquisitions contain several components, i.e., topographic phase ϕ t o p , deformation phase ϕ d i s , orbital phase (inaccuracy of orbital ephemeris) ϕ o r b , atmospheric phase (caused by different delays between acquisitions) ϕ a t m , noise phase (caused by thermal noise or incoherent scattering) ϕ n o i , etc., as listed in Equation (1).
ϕ = ϕ t o p + ϕ d i s + ϕ o r b + ϕ a t m + ϕ n o i
With a priori knowledge of the surface height, the topographic phase ϕ t o p can be removed and the deformation of the target can be estimated, as shown in Equation (2).
d = λ 4 π ϕ d i s
where d is the deformation of the target and λ is the wavelength.
One drawback of the InSAR technique is that it is influence by the phase decorrelation phenomenon, i.e., the phase is incoherent due to changing scattering mechanisms of the target, and the atmospheric effect, i.e., the time delay difference of acquisitions contributes to the atmospheric phase, which is very difficult to detangle from the deformation phase. Two classic methods were proposed to deal with these problems: PS-InSAR and small-baseline subset (SBAS). The former method is used to select pixels with a dominant scattering mechanism, whose phase is stable and whose phase noise is ignorable, allowing for the derivation of more reliable long-time-series displacements [35,36]. In this method, interferograms are formed with one common reference acquisition. The latter method selects interferograms with short temporal and spatial baselines [37]; hence, it can deal with datasets with a limited number of acquisitions. In SBAS, multiple reference images are used as reference acquisitions, and resampling of the acquisitions and interferograms is usually needed. Compared to PS-InSAR, which is suitable for urban areas because many artificial targets are permanent scatterers, SBAS is suitable for applications involving rural areas and wide coverage. Since resampling of the original image is carried out during the interferogram formation in SBAS processing, the resolution after resampling is not favourable to reflect the detailed deformation of the SNWDP-CR constructs. Therefore, PS-InSAR is chosen to be applied to the three SAR datasets. PS-InSAR processing encompasses the first two modules shown in Figure 2.
The first module is InSAR processing, during which the input multitemporal SAR acquisitions are coregistered to one common acquisition. With the external shuttle radar terrain mapping (SRTM) digital elevation model (DEM), the coregistered SAR stack is then used to form single reference interferograms, and the geocode information (lat, lon, and dem) can be derived. The first module includes steps 1–4, which are realised based on GAMMA software [38]. The output from the first module is then fed to the second module, which is the Stanford method for PS analysis (StaMPS) [39] with an optional manual delineated region of interest (ROI) to select PS candidates with amplitude dispersion as steps 5 and 6. In the case of the SNWDP, this ROI is selected as a buffer area of 1 km around the central route. In step 7, the phase noises are estimated and used to exclude noisy points. The final step of the PS analysis is phase unwrapping and correction. The key parameters of the PS-InSAR analysis are listed in Table 2.

2.3. Deformation Evaluation Based on Combined PS-InSAR Results

The third module consists of a result combination using the Z-score standardisation and the deformation evaluation using the MAD-based weighted heatmap. The Z-score standardisation returns a normalized value based on the mean and the standard deviation. It is used for standardising scores on the same scale by dividing a score’s deviation by the standard deviation in a dataset. Results derived by using different SAR observations may follow different distributions. Z-score standardisation is used to transform the results to the same scale. For each of the S1A, RSAT2, and TSX results, the expectation and standard deviation of the normal distribution are fitted using the deformation rates v . Then, each deformation rate v in this result is standardised using Equation (3).
v = v μ σ
After standardisation, v is not the physical deformation measured using InSAR processing, although it should follow the trend of the target’s deformation. The three standardised results are then combined directly to be evaluated using the MAD-based weighted heatmap [31]. The MAD-based weighted heatmap is a heatmap derived based on the MAD evaluation of standardised deformation rates, which are weighted using inversion of neighbouring point numbers. Firstly, a MAD is calculated for each point in the combined results using standardised deformation rates. For the i t h point in the combined result, we search the nearest points within a radius R , resulting in a set of N i standardised deformation rates, v = v 1 , v 2 , , v N i . With this set, the MAD for the i t h point can be calculated as Equation (4) [32].
M A D i = b M v M v
where b is a constant set to 1.4826, according to [32], and M · is the median operator. Based on the calculated MAD, a risk index γ i and a risk label L i for the i t h point can be derived using Equations (5) and (6), respectively. Then, a heatmap with a quartic kernel shape and a radius of 50 m is produced to reflect the density of risky points. The set of the radius is arbitrary but should be smaller than the buffer distance. To include the different significance of the risky levels and justify the spatial inhomogeneity of the PS points, the heatmap is weighted by the inversion of the neighbouring point number. The weight is calculated as w i = L i / N i . The heatmap value is approximately zero for the clustered points, with L i = 0 . The larger the number of the risk label L i , the more significance it contributes to the heatmap value. However, for an isolated point with a large risk label value, the weighted heatmap value should be high, and this is the aim to introduce inversion of the neighbouring point numbers.
γ i = v i M v M A D i
L i = 0 γ i < 2 1 2 < γ i < 2.5 2 2.5 < γ i < 3 3 γ i > 3

3. Results

3.1. PS-InSAR Results Derived from Different SAR Datasets

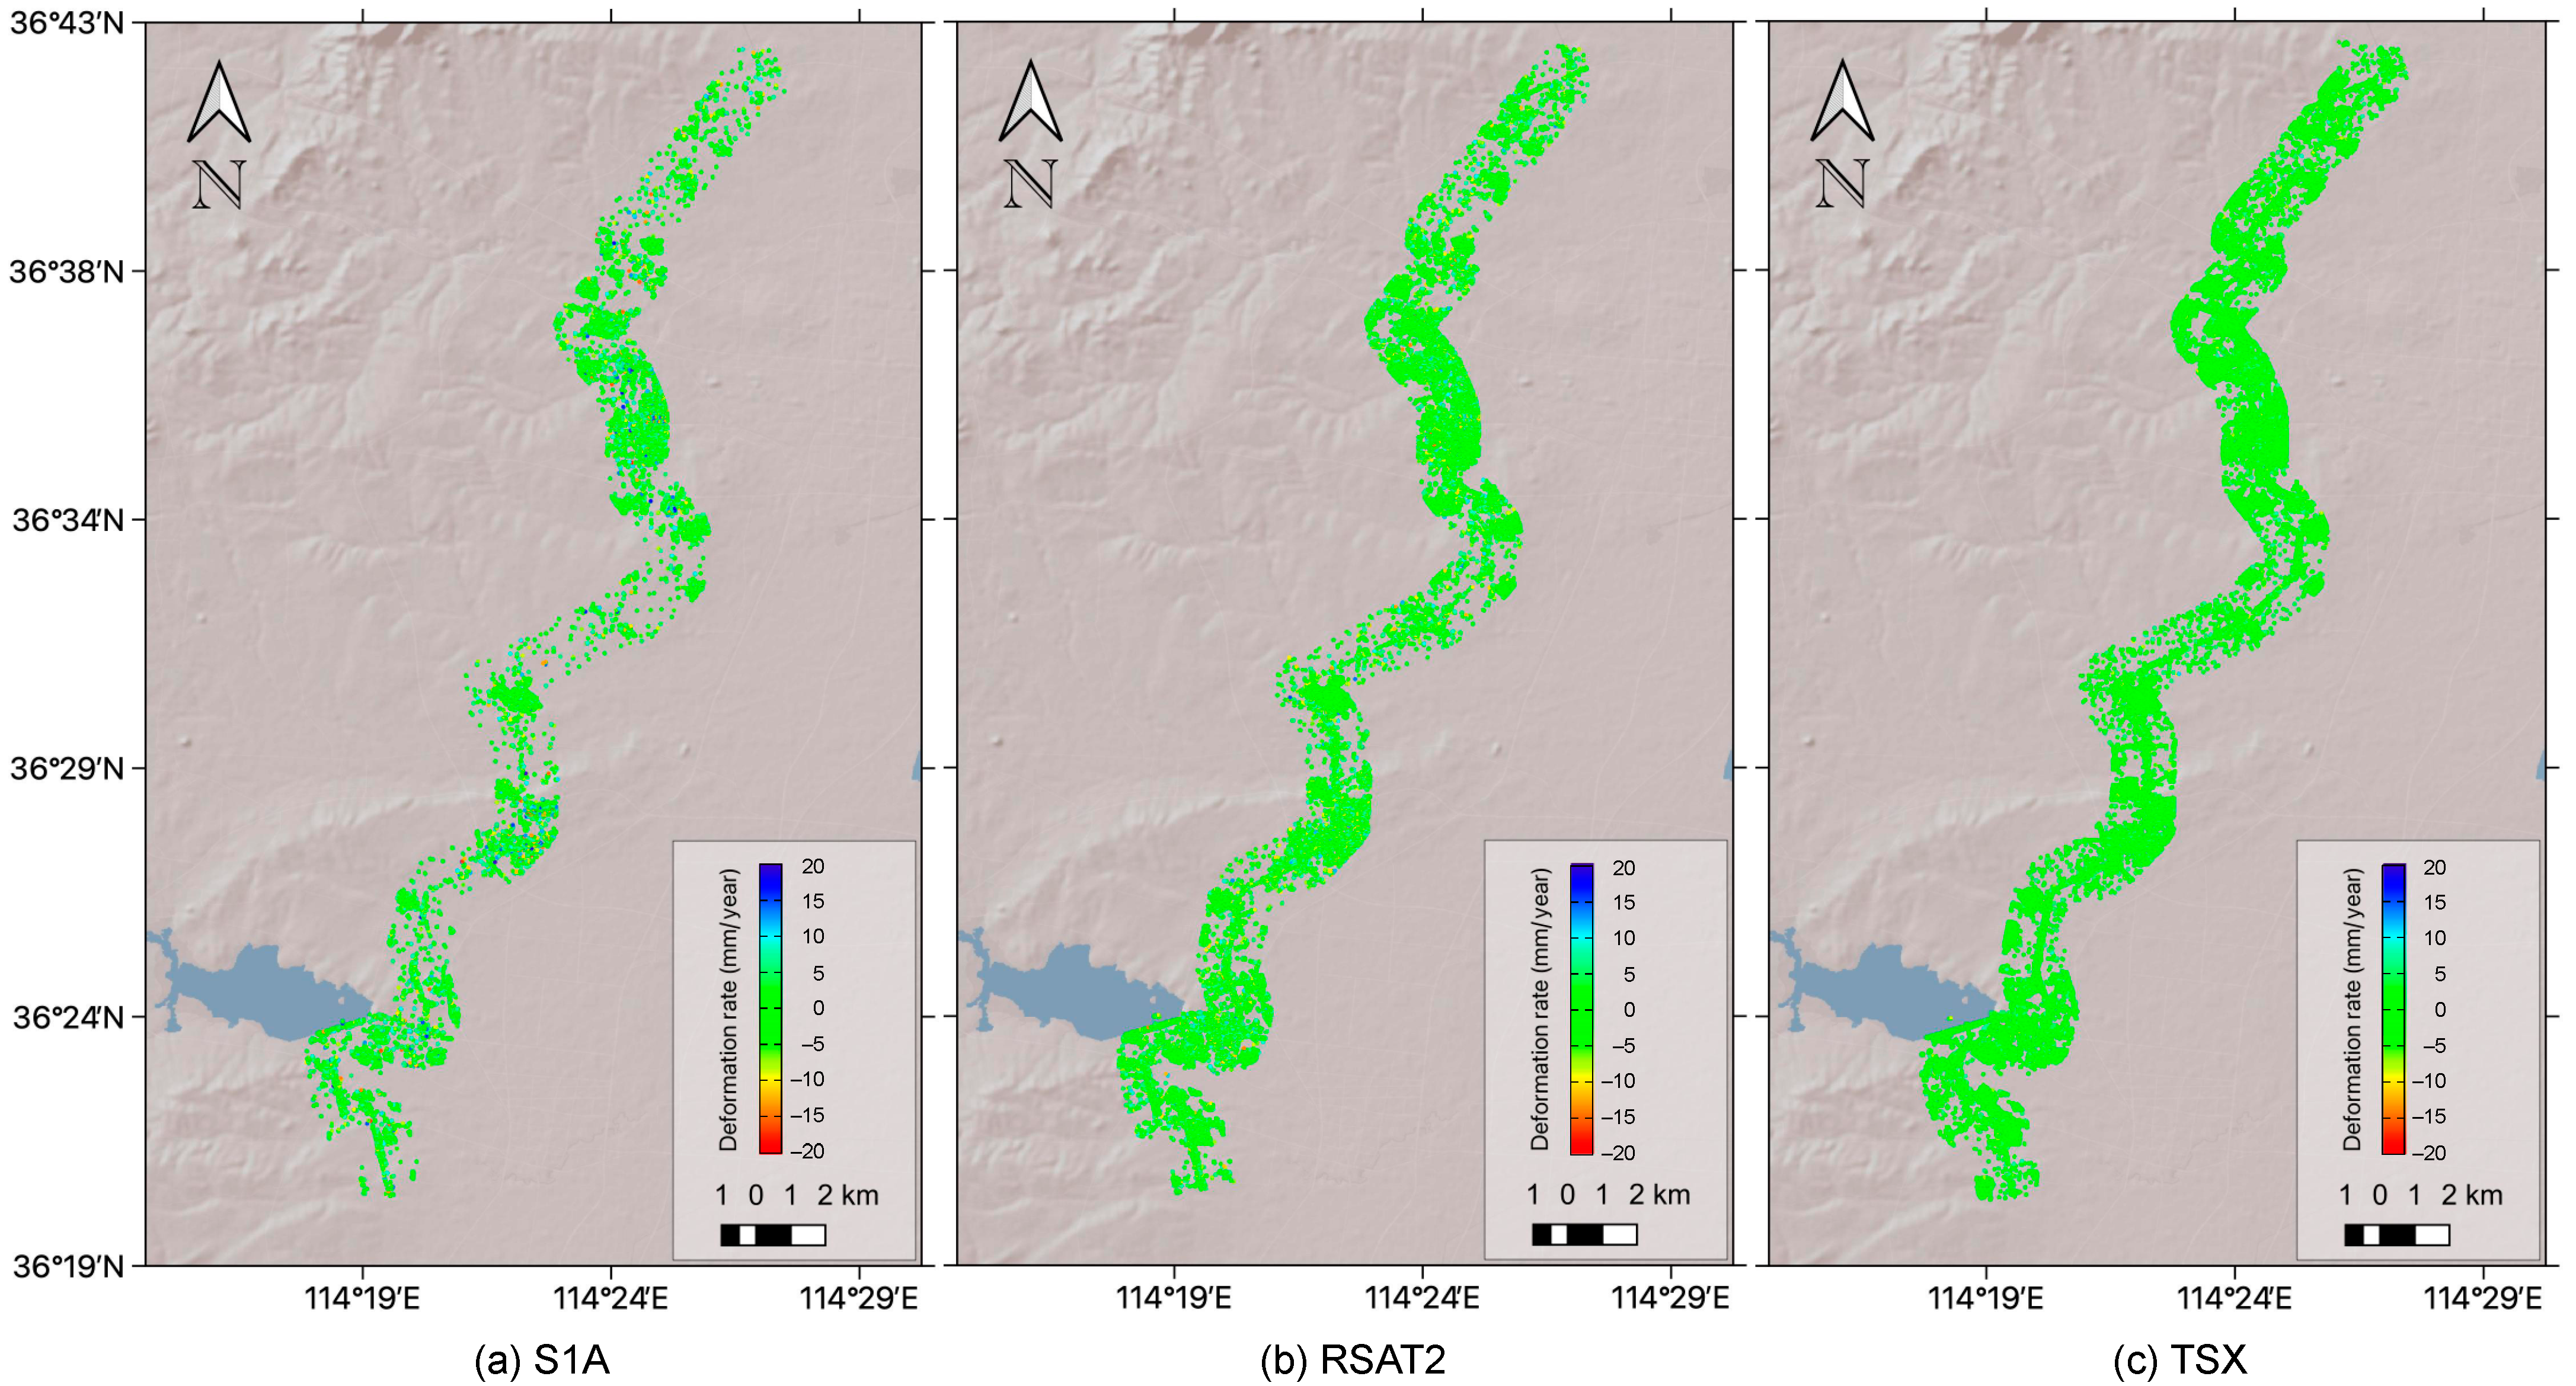
The deformation rates derived by by PS-InSAR analysis on each of the the three datasets within the overlapping area are demonstrated in Figure 3. The deformation is measured along the line of sight (LOS) direction of the spaceborne SAR. The positive values indicate the targets moving towards the sensors, while the negative values indicate moving away.
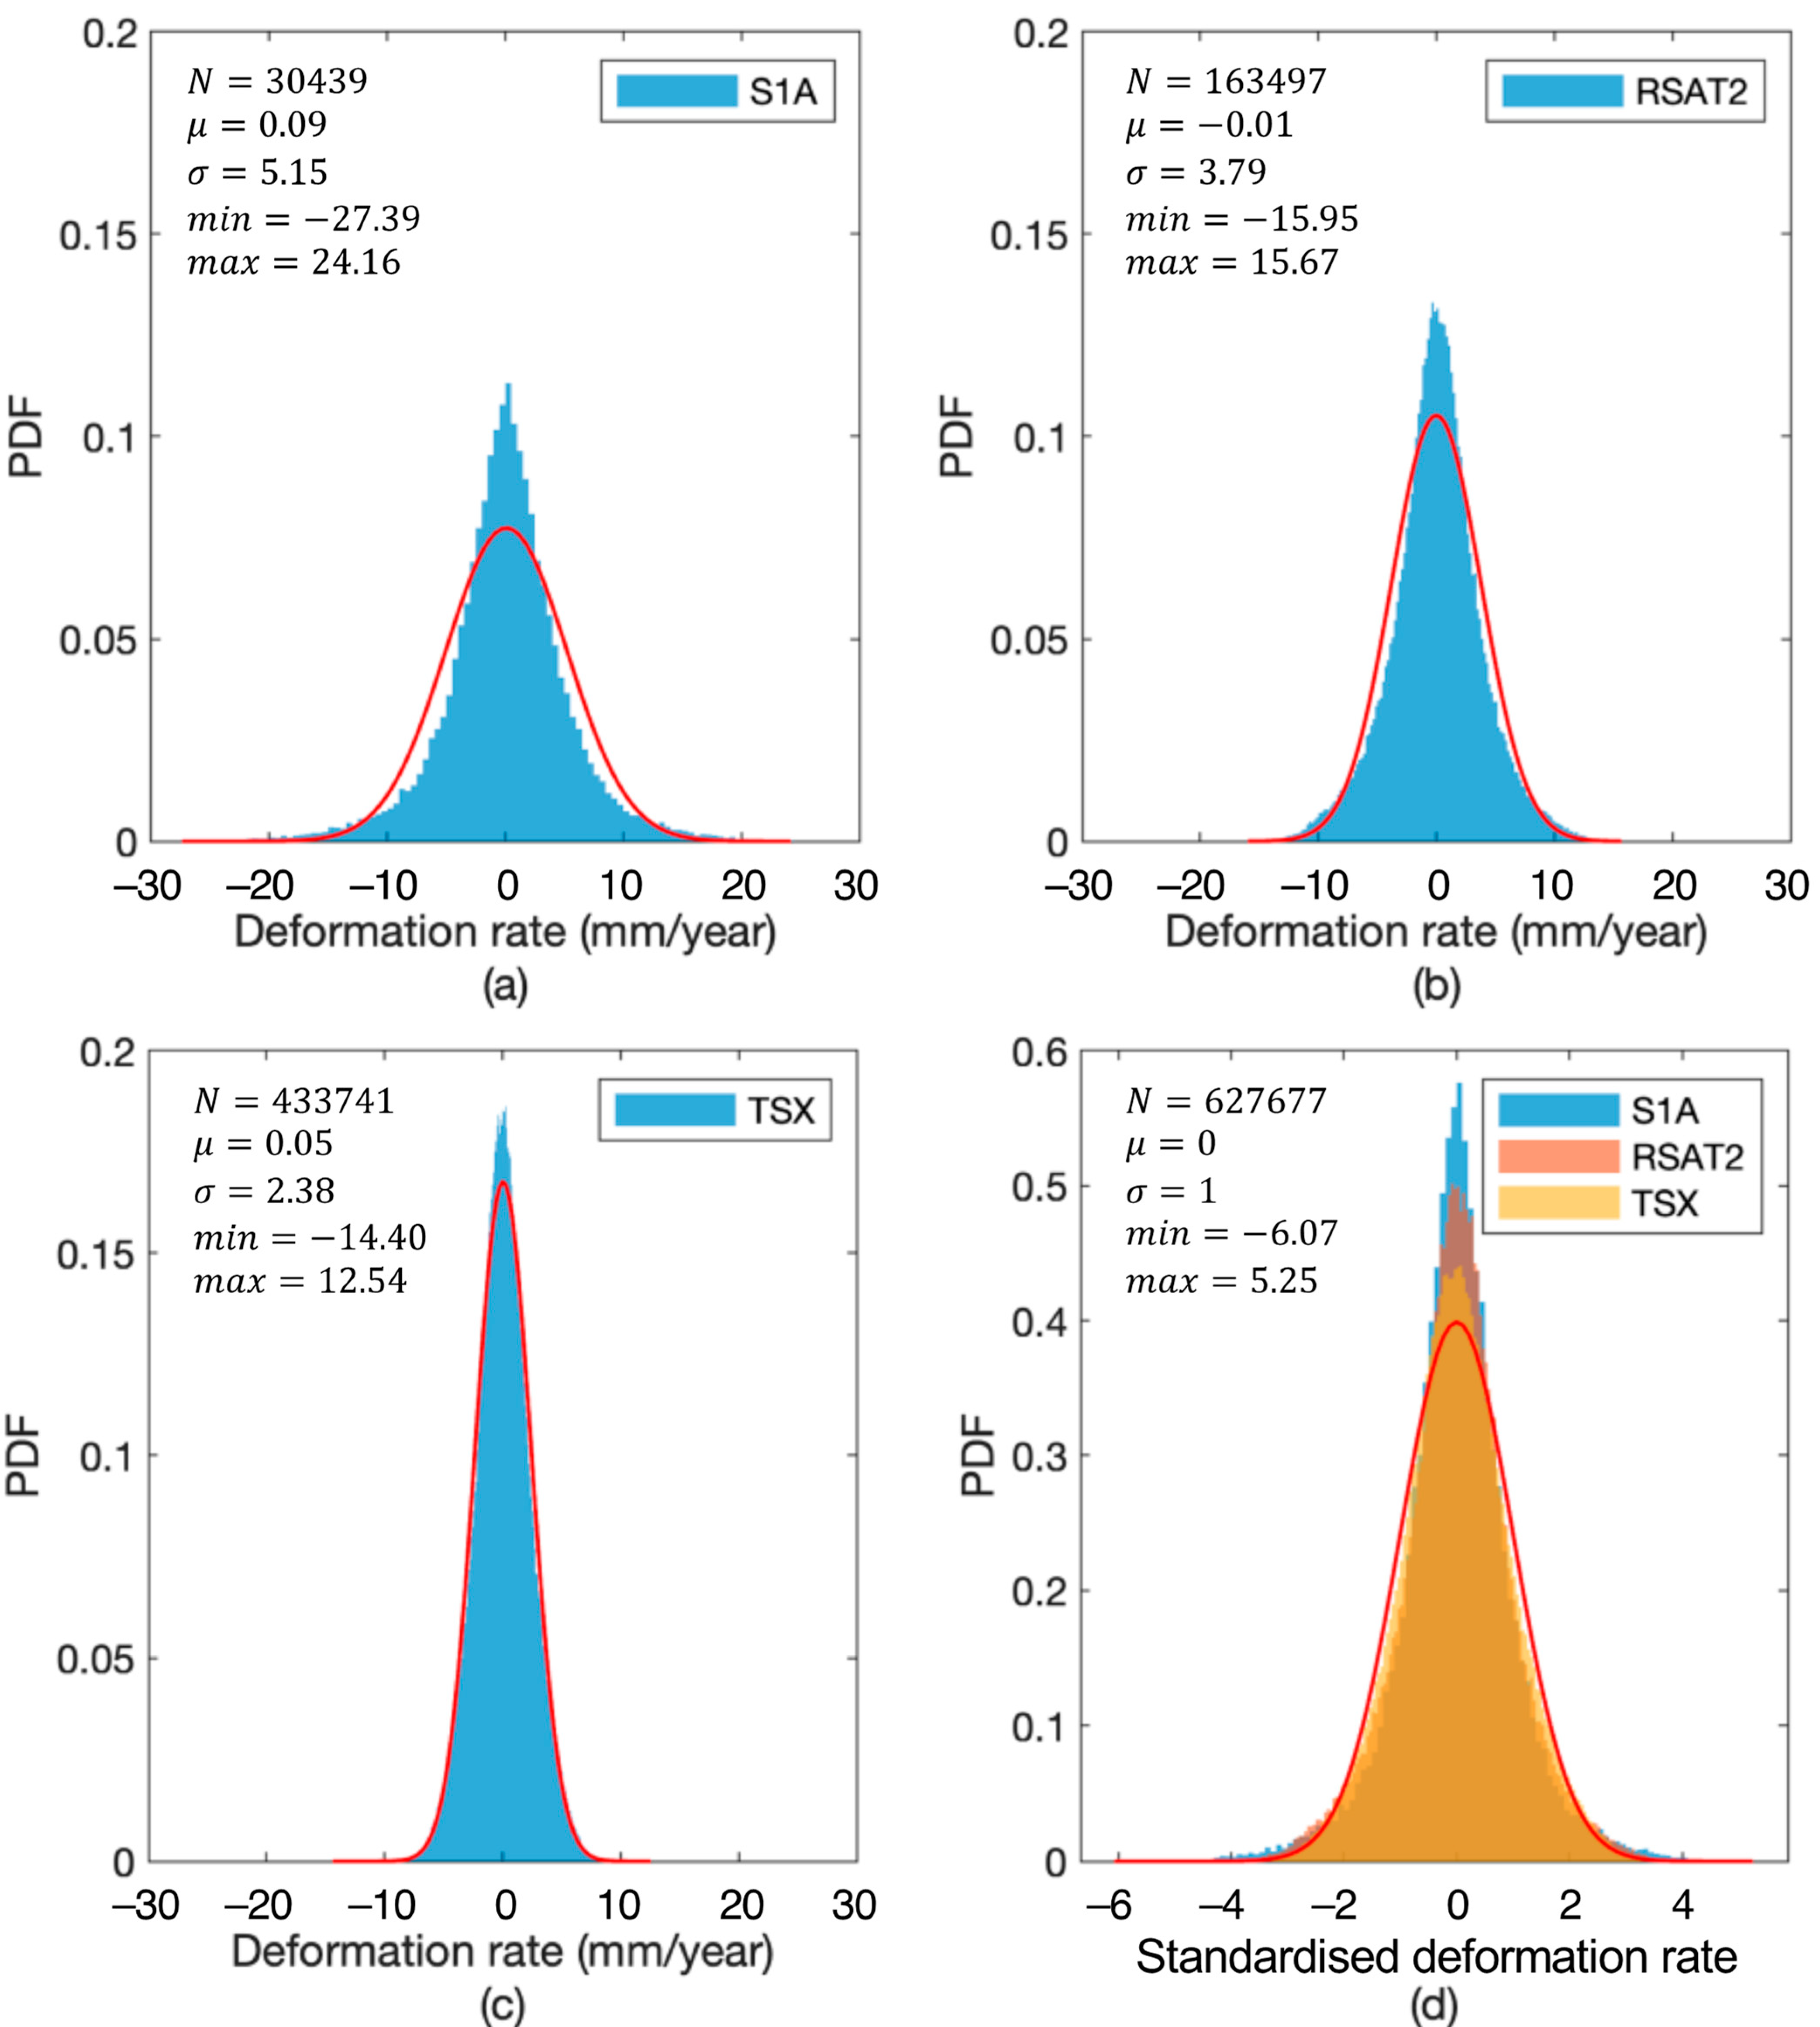
For S1A, RSAT2, and TSX results shown in the Figure 3, 30, 439, 163, 497, and 433, 741 points remained after filtering using phase stability, respectively. The deformation rates are in the range of –27.39~24.16 mm/year when using the S1A dataset, while this range is comparative to –15.95~15.67 mm/year for the RSAT2 dataset and –14.40~12.54 mm/year for the TSX dataset. All three datasets are processed using the same parameters listed in Table 2, resulting in much fewer PS points selected in the S1A results than the other two results. However, relaxing the criteria for PS selection resulted in much noisier PS points in the S1A result; therefore, we retained the current parameter setting. It can be seen from Figure 3 that the SNWD-CR over Handan is overall stable, with deformation rates primarily ranging between –10 and 10 mm/year. However, subtle deformation can still be observed in some specific areas. In this study, we do not focus on the buildings surrounding the route; instead, we will pay attention to the canal embankment and ancillary facilities in the following subsection.

3.1.1. The Open Canal

The main canal of the SNWD-CR is excavated to be inverted trapezoidal, with the embankment filled with earth and lined with concrete. Along the SNWD-CR in the study area, some locations appear unstable, as revealed by the PS-InSAR results. One example is plotted in Figure 4, from which we can observe a subsiding region annotated with P1. This subsidence occurs on the western embankment of the SNWD-CR south of the Dongwushi Reservoir. In this region, the subsiding rate exceeds 10 mm/year in both S1A and RSAT2 results.
The Google satellite map is inspected to investigate the land surface of this region, and its archived images spanning from 26 November, 2016 to May 2, 2019 are shown in Figure 5. Comparing these images reveals an obvious land collapse in the region denoted by red circles. In Figure 5a,b, this region remained intact, while an apparent damaged area can be observed in Figure 5c,d. This damage seems to be repaired with side slope tactionion tools in Figure 5e, and fully repaired in Figure 5f. This region is about 60 m south of the P1 region along the western embankment. Considering that the temporal coverage of the RSAT2 dataset is from 4 April 2015 to 5 March 2016, and the S1A temporal coverage is from 17 June 2015 to 31 May 2016, the large deformation rate at P1 in Figure 4 should have indicated the deforming process underground before the collapse occurred on the land surface.

3.1.2. Ancillary Facilities

Apart from the main canal, hundreds of various ancillary facilities have been built to support the daily operation of the SNWDP-CR in Handan, among which are 78 crossing-canal bridges that have been constructed in the suburbs [40]. In the following sections, we show detailed results of three main types of these ancillary facilities, including aqueducts, crossing-canal bridges, and siphons.
One important type of facility along the SNWDP-CR is the aqueduct, which is a canal built aloft, supported by pillars, for conveying water. Figure 6 shows one aqueduct which is oriented S–N in the study area. S1A and RSAT2 capture the deformation of the western side, while TSX captures the eastern side. The aqueduct is overall stable, except that the two ends that connect with the open canal appear to be slightly subsiding. From the S1A result, P2 and P3 are suffering subsidence at a rate above 10 mm/year. The RSAT2 result shows that the subsiding rate is above 10 mm/year at P3 and ranges between 5 and 10 mm/year at P2. However, the measurements of these deformation rates are smaller in the TSX result.
Bridges, which are transportation facilities that cross the open canal to connect roads and railways, are frequently seen along the SNWDP-CR. Figure 7a–c show the three results of one arch bridge crossing the canal, as shown in the red circle. In the RSAT2 result, the western side of the bridge shows a trend of subsidence, while in the TSX result, this part seems to be slightly uplifting. These two opposite deforming directions are confirmed to be a planar movement of the bridge arch, since RSAT2 and TSX are of different orbit directions.
Figure 8a–c show another two bridges whose displacements are captured in the RSAT2 and TSX results, as denoted by the red circles. In the former, there is no result in the middle bridge, while the latter captured more points on the bridge. These two crossing-canal bridges are overall stable, with deformation rates of –5~5 mm/year.
Figure 9 shows one siphon that controls the transfer of water under a river. More PS points are selected on the western embankment and the northern culverts, while more PS points are on the eastern embankment and the southern culverts. The deformation rates of these two results show that the siphon and related culverts are overall stable, except for a small region on the eastern side of the embankment of the northern culverts, which is slightly subsiding at a rate of around 8 mm/year.

3.2. Deformation Evaluation Combining the three Datasets

S1A, RSAT2, and TSX are of different heading angles, especially TSX, which is of a descending orbit while the other two have ascending orbits; this may lead to different scattering locations of the same target and a significant difference in the number of selected PSs, especially when the canal is at a favourable orientation to one SAR but not to the others. For example, in Figure 4, we can see that many more PS targets are selected when the canal segments are oriented perpendicular to the RSAT2 LOS direction, which is not favourable to the TSX observation. In addition, the different SAR measurements play as different rulers for the same land deformation, as the histograms in Figure 10a–c show different distributions of these three datasets. After standardisation using Equation (3), there are μ = 0 and σ = 1 for the three data distributions, which are plotted in Figure 10d. In this subfigure, the red curve is the fitted normal distribution for the standardised and combined deformation rates.
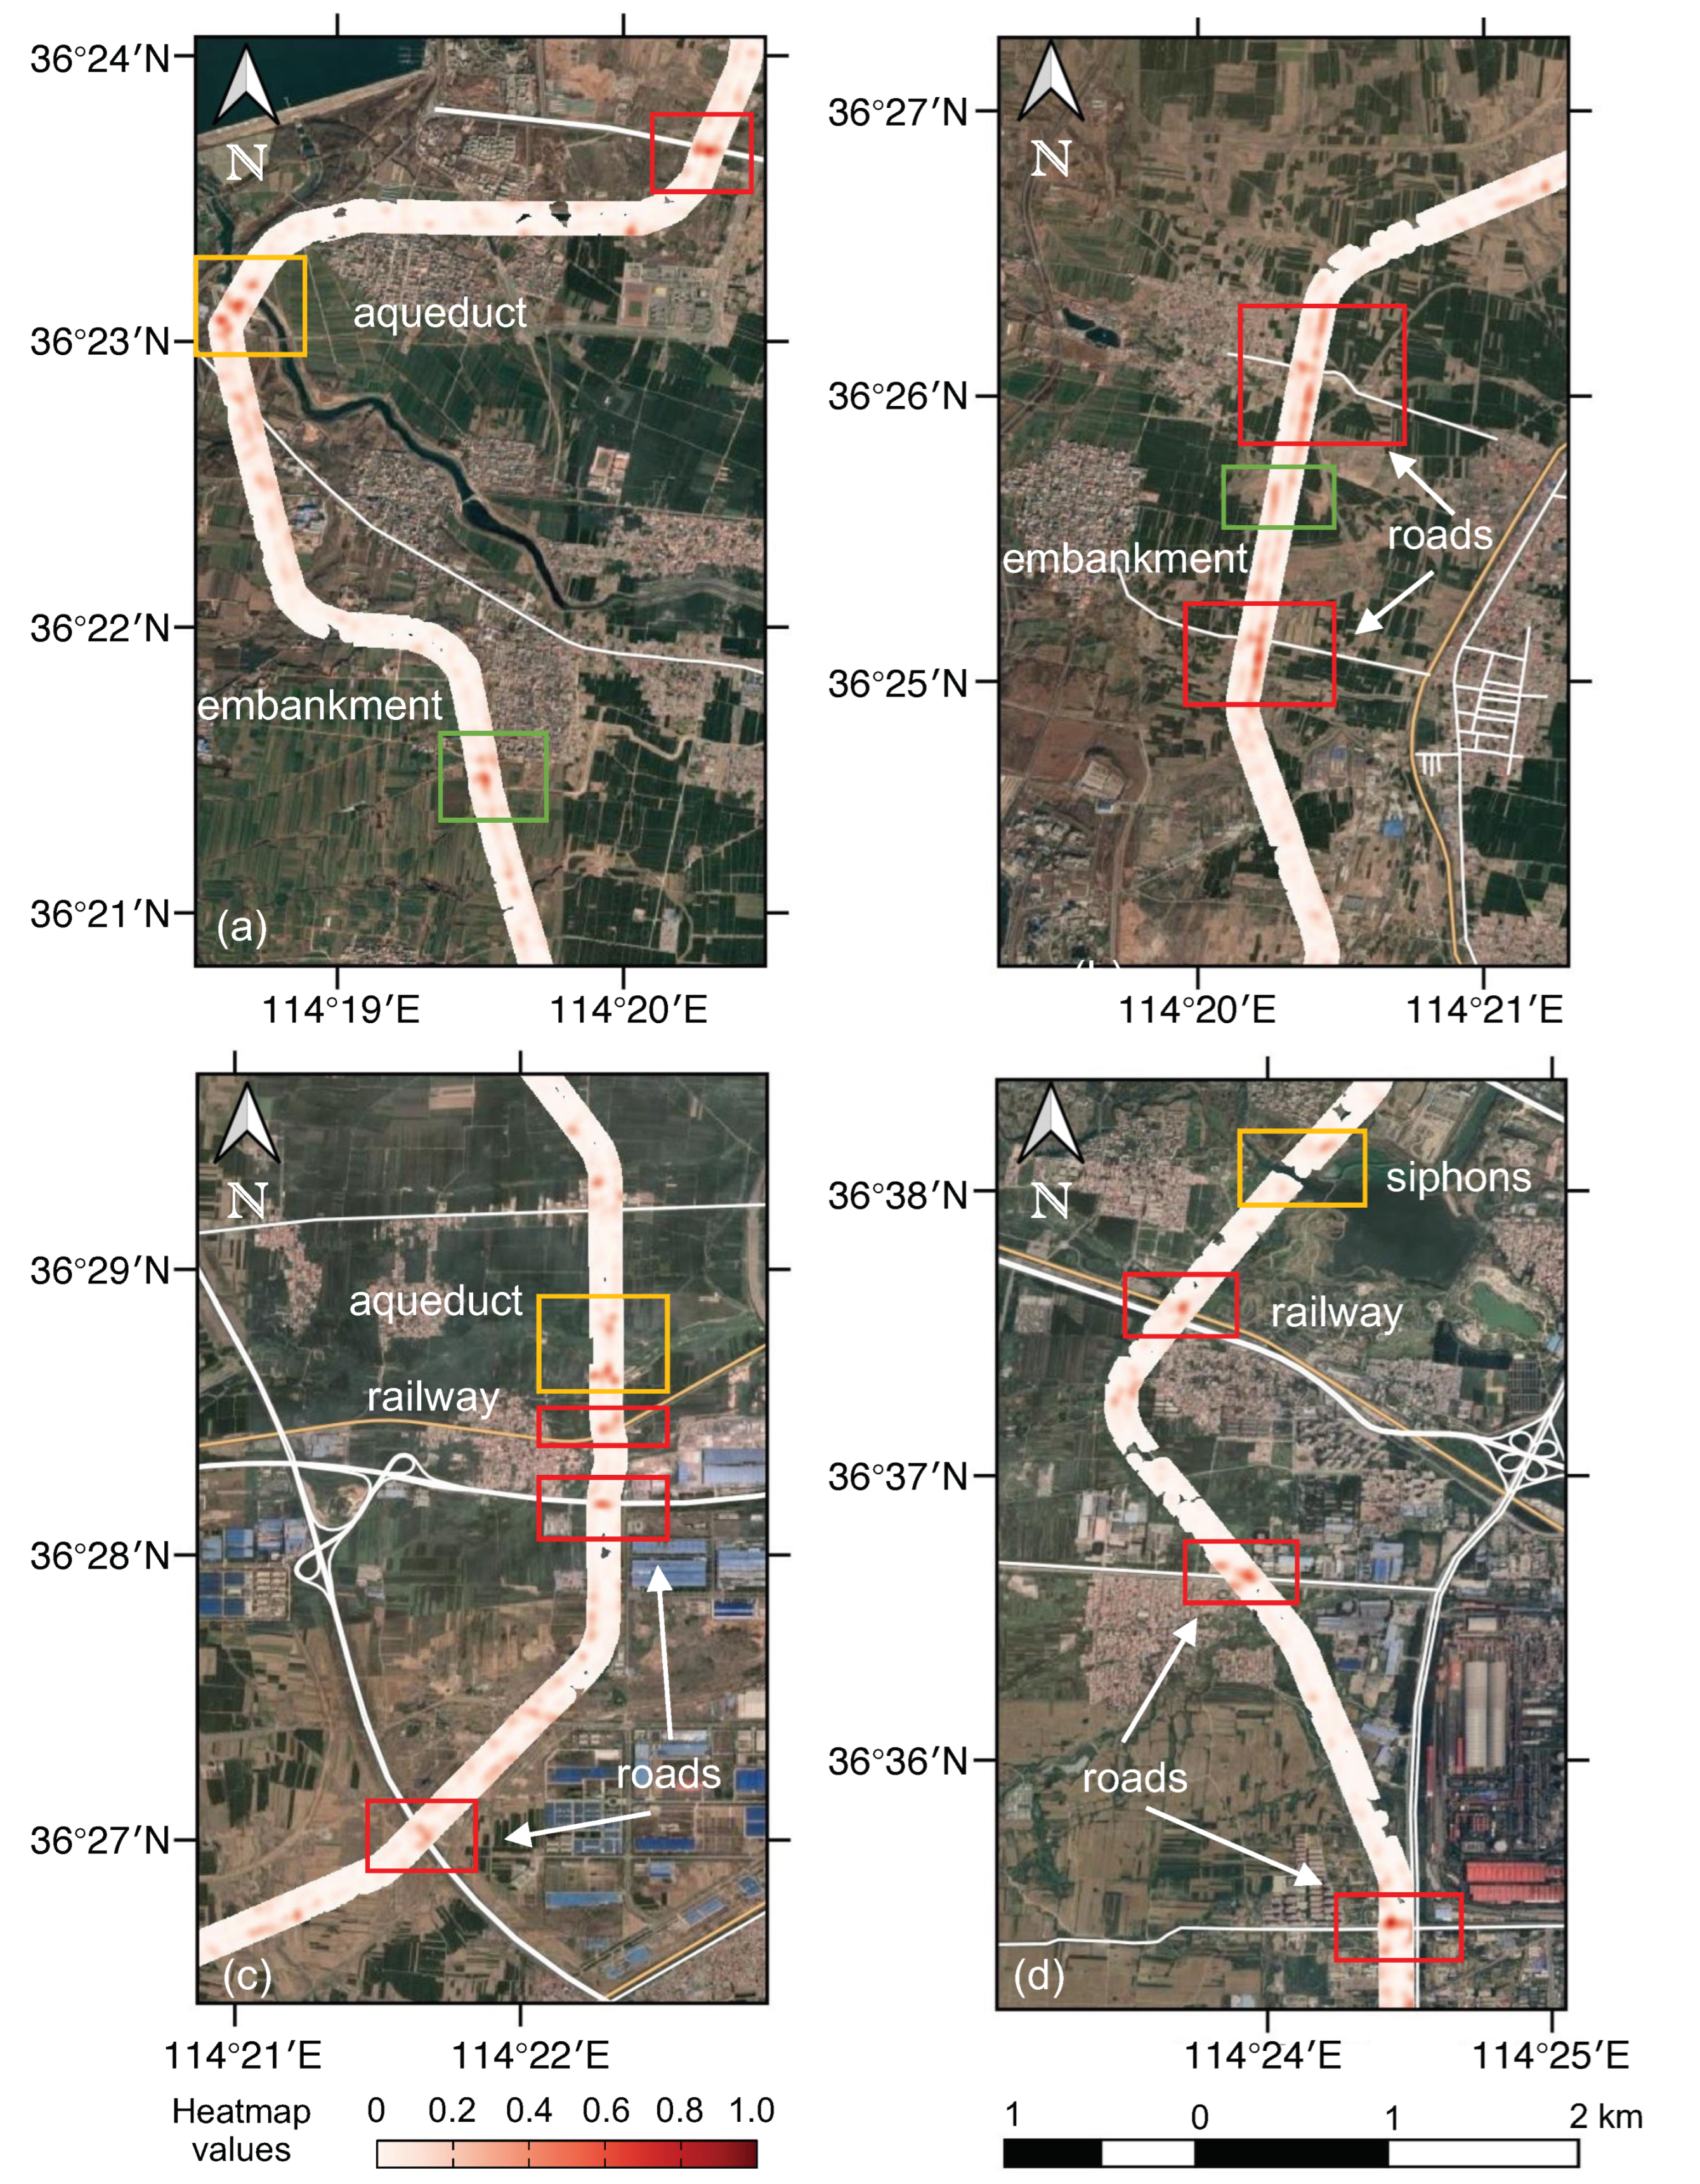
With the standardised and combined deformation rates, the stability of the SNWD-CR is evaluated using a MAD-based weighted heatmap, as shown in Figure 11. Heatmaps of four segments of the central route are presented in Figure 11a–d. The weighted heatmap reflects not only the density of the risky points but also the significance of the risk. The higher the heatmap value, the higher the risk. The white and yellow lines seen on the Google satellite map are roads and railways, respectively. Apart from the two regions located at the canal embankments denoted by green boxes, most risky regions are associated with roads and railways, as denoted by the red boxes. In addition, aqueducts and siphons are other ancillary facilities at high risk of deformation.

3.3. Influence from Different Orbit Directions

It is worthwhile noting that heading angles of the SAR systems largely influence the results, including not only the number of selected PS points, as mentioned in the previous sections, but also the measured deformation direction. Figure 12a,b illustrate three cases (I, II, and III) of measured deformation by S1A/RSAT2 and TSX. In case I, shown in Figure 12a, there is a dominant downward deformation, and the measured deformation is negative for both ascending and descending orbits. The situation is different for cases II and III, shown in Figure 12b, in which the planar movement is dominant. In case II, the measured deformation is positive for the descending orbit and negative for the ascending orbit when the actual deformation occurs in the east direction. In case III, with a westward deformation, the signs of the measured deformation become opposite to those in case II.
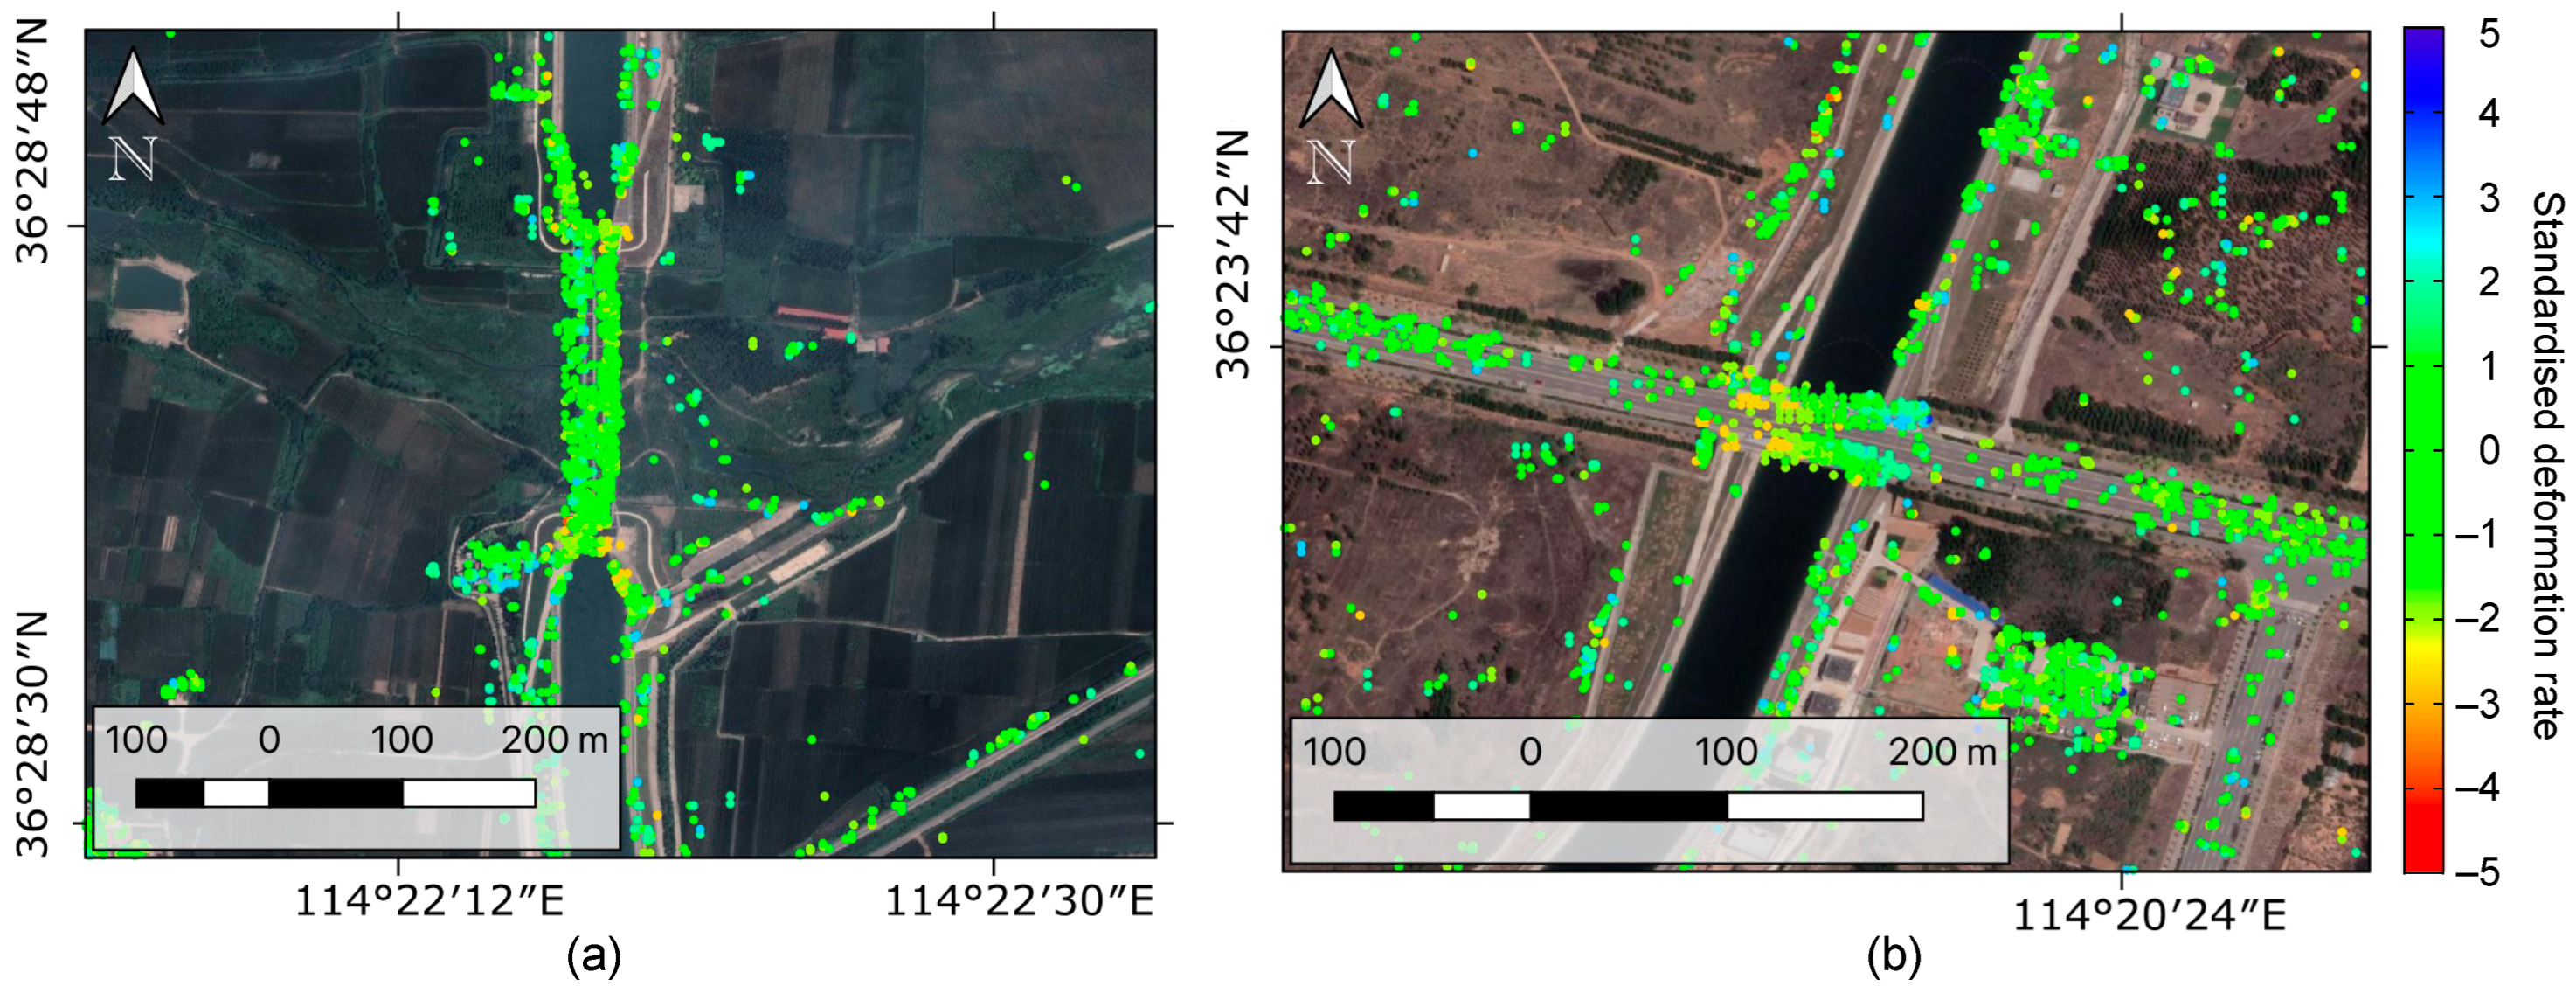
The deformations of the aqueduct and the crossing-canal bridge analysed in Section 3.1 are typical examples illustrating the influence of different orbit directions. Figure 13 shows the standardised and combined results of these two facilities. In case I, the sign of the TSX deformation at the two ends of the aqueduct do not need to be changed in the combination, as shown in Figure 13a. However, the sign needs to be changed for the deformation measured on the crossing-canal bridge in Figure 13b. The deforming parts are two arches of the beam–arch hybrid bridge. The western side of the arches is subsiding, which corresponds to case II, and the eastern side corresponds to case III, implying a contraction of the arches.

4. Discussion

This study presents an application of multitemporal and multifrequency satellite SAR observations to monitor and evaluate deformations of the SNWDP-CR. With the same parameter settings in PS-InSAR processing, RSAT2 and TSX results contain many more PS points than the S1A result, implying better performance of the high-resolution SAR data. Due to the different frequencies and phase noises, the three results follow different distributions, which cannot be directly combined. Another difference between the three SAR observations is the different heading angles. The SNWD is a line structure spanning a wide area from south to north, and its orientation significantly influence the PS-InSAR results. Firstly, the number of selected PSs is considerably larger when the canal orients favourably to the SAR system. The best orientation is when the canal is parallel to the orbit path, and the LOS direction is perpendicular to the canal. Secondly, different aspects of the same target are monitored by ascending and descending orbits. The aqueduct is a good example, for which more PS points are selected on the western side in the RSAT2 result, while more are selected on the eastern side in the TSX result. Thirdly, even if the same deformation occurs on the target being captured, their signs may differ in the ascending and descending orbits. For a dominant vertical deformation, measured deformations are of the same sign. However, when it comes to a planar deformation, the signs are opposite in results from ascending and descending orbits.
To evaluate the deformation and stability of the SNWD-CR over the study area, we combined the three results using a Z-score standardisation and a MAD-based weighted heatmap. The derived heatmap highlights the risky regions as more significant deformation is observed, and the dangerous areas are primarily related to crossing-canal bridges for connecting roads and railways. Aqueducts and siphons are two further types of risky ancillary facilities. The demonstrated example of the aqueduct in Figure 13a subsides at its two ends, which may be related to the pillars at the ends. Another example in Figure 13b is one crossing-canal beam–arch hybrid bridge whose two arches are contracting, which may be associated with the deflection of the beam part. When the deflection occurs, the central beam moves downward, and the sides of the beam move upward; this can push the arches to contract. The main canal is overall stable except for two risky regions on the western embankment. One of them is inferred to be associated with a land collapse which occurred in 2017 by checking the archived images in Google Earth.
Unfortunately, we could not execute any in situ measurements along the SNWD-CR to validate the PS-InSAR results, but the risky evaluation should not be influenced as PS-InSAR results are relative measurements, and risk is a concept about relativity in this study. In addition, we only used the deformation rate derived by using PS-InSAR processing, which also outputs time-series deformation for each PS point. In the future, more advanced methods should be developed to investigate the deformation process utilising time-series deformation, especially regarding long-term deformation monitoring. With the MAD-based weighted heatmap, the dominant direction of the deformation is ignorable in evaluating the risk. Risky targets are then selected based on this heatmap. However, the dominant direction needs to be determined before combining the three results, which still depends on manual comparison in this study. This calls for a way to deal with this task with higher efficiency.

5. Conclusions

This study investigated the application of satellite observations to monitor the deformation of the SNWDP-CR, including S1A, RSAT2, and TSX observations. PS-InSAR was applied to each of the three datasets, and they were standardised and combined to be evaluated with the proposed method for producing a MAD-based weighted heatmap. This heatmap highlighted the risky regions where relatively more significant deformation was developing. Based on the PS-InSAR results and the derived weighted heatmap, the risky deformation along the SNWD-CR was found to be primarily associated with crossing-canal bridges for connecting roads and railways. It was found that one beam–arch hybrid bridge was likely to be suffering from subsidence, causing the arches to deform at a rate of up to 9~10 mm/year. Aqueducts were found to be another type of risky facility, with one example showing a deformation rate of up to 9~10 mm/year at the two ends of the overhead structure. The main canal is overall stable, except for two subsiding regions which were founded on the western embankment of the SNWD-CR. One of these is likely associated with a land collapse occurring about 60 m to the south, which happened in 2017, according to the archived satellite images in Google Earth. This region was subsiding at a rate of up to 15 mm/year.
Although without validation data, we evaluated the deformation of the SNWD canal and its ancillary facilities based on the three PS-InSAR results derived from S1A, RSAT2, and TSX datasets. In practical applications that call for absolute deformation values, in situ validation must be carried out. We expect this to be carried out in future work. Results in this study show that in the specific application scenario of the SNWD, the heading angle and orientation of the construction play an essential role in the results. This calls for more studies in the future that fuse observations from different orbits and frequencies to obtain a comprehensive deformation of the structure. In this study, the observations span only one year, thus only accounting for tens of acquisitions. In the future, observations with a long period up to several years can be processed, and in this case, time-series information is worthwhile to be investigated to show the deformation evolution of risky regions.

Author Contributions

Conceptualization, S.X. and B.Z.; methodology, S.X. and B.Z.; software, S.X., B.Z. and Z.D.; validation, B.Z.; formal analysis, S.X. and B.Z.; investigation, S.X. and B.Z.; resources, S.X., C.W. and B.Z.; data curation, B.Z. and C.W.; writing—original draft preparation, S.X.; writing—review and editing, S.X., B.Z., C.W. and X.Q.; visualization, S.X.; supervision, C.W. and Q.L.; project administration, S.X.; funding acquisition, S.X., B.Z. and C.W. All authors have read and agreed to the published version of the manuscript.

Funding

This research was funded by Shenzhen Scientific Research and Development Funding Programme under Grants JCYJ20190808120005713 and RCYX20210706092140076, and the Guangdong Basic and Applied Basic Research Foundation under Grants 2022A1515110861 and 2021A1515011427. The authors are also grateful for the funding support from the National Natural Science Foundation of China under Grants 41974006 and 42104012, the Open Research Fund from Guangdong Laboratory of Artificial Intelligence and Digital Economy (SZ) under Grant GML-KF-22-15, and the Open Research Fund from MNR Key Laboratory for Geo-Environmental Monitoring of Great Bay Area & Guangdong Key Laboratory of Urban Informatics & Shenzhen Key Laboratory of Spatial Smart Sensing and Services.

Data Availability Statement

The datasets used in this study are available as requested from the third author B.Z. ([email protected]).

Acknowledgments

The authors would like to thank the German Aerospace Centre (DLR) for the TerraSAR-X data under the PI project LAN2979, MDA for the Radarsat-2 data, and Google for the satellite images in Google Earth.

Conflicts of Interest

The authors declare no conflict of interest.

References

  1. Liu, J.; Zang, C.; Tian, S.; Liu, J.; Yang, H.; Jia, S.; You, L.; Liu, B.; Zhang, M. Water conservancy projects in China: Achievements, challenges and way forward. Glob. Environ. Change 2013, 23, 633–643. [Google Scholar] [CrossRef]
  2. Liu, J.; Cao, G.; Zheng, C. Sustainability of groundwater resources in the North China Plain. In Sustaining Groundwater Resources: A Critical Element in the Global Water Crisis; Springer: Dordrecht, The Netherlands, 2011; pp. 69–87. [Google Scholar]
  3. Zhao, Z.Y.; Zuo, J.; Zillante, G. Transformation of water resource management: A case study of the South-to-North Water Diversion project. J. Clean. Prod. 2017, 163, 136–145. [Google Scholar] [CrossRef]
  4. Ministry of Water Resources of People’s Republic of China. 2020. Available online: http://www.mwr.gov.cn/xw/slyw/202006/t20200603_1406672.html (accessed on 22 February 2021).
  5. Office of the South-to-North Water Diversion Project Construction Committee, State Council, PRC. The South-to-North Water Diversion Project. Engineering 2016, 2, 265–267. [Google Scholar] [CrossRef]
  6. Hassani, S.; Dackermann, U. A Systematic Review of Advanced Sensor Technologies for Non-Destructive Testing and Structural Health Monitoring. Sensors 2023, 23, 2204. [Google Scholar] [CrossRef]
  7. Im, S.B.; Hurlebaus, S.; Kang, Y.J. Summary Review of GPS Technology for Structural Health Monitoring. J. Struct. Eng. 2023, 139, 1653–1664. [Google Scholar] [CrossRef]
  8. Hassani, S.; Dackermann, U. A Systematic Review of Optimization Algorithms for Structural Health Monitoring and Optimal Sensor Placement. Sensors 2023, 23, 3293. [Google Scholar] [CrossRef] [PubMed]
  9. Gabriel, A.K.; Goldstein, R.M.; Zebker, H.A. Mapping small elevation changes over large areas: Differential radar interferometry. J. Geophys. Res. 1989, 94, 9183–9191. [Google Scholar] [CrossRef]
  10. Crosetto, M.; Monserrata, O.; Cuevas-González, M.; Devanthéry, N.; Crippa, B. Persistent Scatterer Interferometry: A review. ISPRS J. Photogramm. Remote Sens. 2016, 115, 78–89. [Google Scholar] [CrossRef]
  11. Jia, H.; Liu, L. A technical review on persistent scatterer interferometry. J. Mod. Transp. 2016, 24, 153–158. [Google Scholar] [CrossRef]
  12. Massonnet, D.; Rossi, M.; Carmona, C.; Adragna, F.; Peltzer, G.; Feigl, K.; Rabaute, T. The displacement field of the landers earthquake mapped by radar interferometry. Nature 1993, 364, 138–142. [Google Scholar] [CrossRef]
  13. Lazecký, M.; Spaans, K.; González, P.J.; Maghsoudi, Y.; Morishita, Y.; Albino, F.; Elliott, J.; Greenall, N.; Hatton, E.; Hooper, A.; et al. LiCSAR: An automatic InSAR tool for measuring and monitoring tectonic and volcanic activity. Remote Sensing. 2020, 12, 2430. [Google Scholar] [CrossRef]
  14. Zhao, C.; Lu, Z. Remote Sensing of Landslides—A Review. Remote Sens. 2018, 10, 279. [Google Scholar] [CrossRef]
  15. Qin, H.; Andrews, C.B.; Tian, F.; Cao, G.; Luo, Y.; Liu, J.; Zheng, C. Groundwater-pumping optimization for land-subsidence control in Beijing plain, China. Hydrogeol. J. 2018, 26, 1061–1081. [Google Scholar] [CrossRef]
  16. Zhu, L.; Gong, H.; Chen, Y.; Wang, S.; Ke, Y.; Guo, G.; Li, X.; Chen, B.; Wang, H.; Teatini, P. Effects of water diversion project on groundwater system and land subsidence in Beijing, China. Eng. Geol. 2020, 276, 105763. [Google Scholar] [CrossRef]
  17. Lyu, M.; Ke, Y.; Guo, L.; Li, X.; Zhu, L.; Gong, H.; Constantinos, C. Change in regional land subsidence in Beijing after South-to-North Water Diversion Project observed using satellite radar interferometry. GISci. Remote Sens. 2019, 57, 140–156. [Google Scholar] [CrossRef]
  18. Guo, L.; Gong, H.; Li, J.; Zhu, L.; Xue, A.; Liao, L.; Sun, Y.; Li, Y.; Zhang, Z.; Hu, L.; et al. Understanding uneven land subsidence in Beijing, China, using a novel combination of geophysical prospecting and InSAR. Geophys. Res. Lett. 2020, 47, e2020GL088676. [Google Scholar] [CrossRef]
  19. Du, Z.; Ge, L.; Ng, A.H.-M.; Lian, X.; Zhu, Q.; Horgan, F.G.; Zhang, Q. Analysis of the impact of the South-to-North water diversion project on water balance and land subsidence in Beijing, China between 2007 and 2020. J. Hydrol. 2021, 603, 126990. [Google Scholar] [CrossRef]
  20. Zhang, X.; Chen, B.; Gong, H.; Lei, K.; Zhou, C.; Lu, Z.; Zhao, D. Inversion of Groundwater Storage Variations Considering Lag Effect in Beijing Plain, from RadarSat-2 with SBAS-InSAR Technology. Remote Sens. 2022, 14, 991. [Google Scholar] [CrossRef]
  21. Zheng, Y.; Peng, J.; Chen, X.; Huang, C.; Chen, P.; Li, S.; Su, Y. Spatial and Temporal Evolution of Ground Subsidence in the Beijing Plain Area Using Long Time Series Interferometry. IEEE J. Sel. Top. Appl. Earth Obs. Remote Sens. 2023, 16, 153–165. [Google Scholar] [CrossRef]
  22. Dong, J.; Guo, S.; Wang, N.; Zhang, L.; Ge, D.; Liao, M.; Gong, J. Tri-decadal evolution of land subsidence in the Beijing Plain revealed by multi-epoch satellite InSAR observations. Remote Sens. Environ. 2023, 286, 113446. [Google Scholar] [CrossRef]
  23. Dong, J.; Lai, S.; Wang, N.; Wang, Y.; Zhang, L.; Liao, M. Multi-scale deformation monitoring with Sentinel-1 InSAR analyses along the Middle Route of the South-North Water Diversion Project in China. Int. J. Appl. Earth Obs. Geoinf. 2021, 100, 102324. [Google Scholar] [CrossRef]
  24. Qin, X.; Liao, M.; Zhang, L.; Yang, M. Structural health and stability assessment of high-speed railways via thermal dilation mapping with time-series InSAR analysis. IEEE J. Sel. Top. Appl. Earth Obs. Remote Sens. 2017, 10, 2999–3010. [Google Scholar] [CrossRef]
  25. Ma, P.; Li, T.; Fang, C.; Lin, H. A tentative test for measuring the sub-millimeter settlement and uplift of a high-speed railway bridge using COSMO-SkyMed images. ISPRS J. Photogramm. Remote Sens. 2019, 155, 1–12. [Google Scholar] [CrossRef]
  26. Milillo, P.; Giardina, G.; Perissin, D.; Milillo, G.; Coletta, A.; Terranova, C. Pre-collapse space geodetic observations of critical infrastructure: The Morandi Bridge, Genoa, Italy. Remote Sens. 2019, 11, 1403. [Google Scholar] [CrossRef]
  27. Wegmüller, U.; Werner, C. Mitigation of thermal expansion phase in persistent scatterer interferometry in an urban environment. In Proceedings of the 2015 Joint Urban Remote Sensing Event (JURSE), Lausanne, Switzerland, 30 March 2015–1 April 2015; pp. 3–6. [Google Scholar] [CrossRef]
  28. Crosetto, M.; Monserrat, O.; Cuevas-González, M.; Devanthéry, N.; Luzi, G.; Crippa, B. Measuring thermal expansion using X-band persistent scatterer interferometry. ISPRS J. Photogramm. Remote Sens. 2015, 100, 84–91. [Google Scholar] [CrossRef]
  29. Xiong, S.; Wang, C.S.; Qin, X.Q.; Zhang, B.C.; Li, Q.Q. Time-Series Analysis on Persistent Scatter-Interferometric Synthetic Aperture Radar (PS-InSAR) Derived Displacements of the Hong Kong–Zhuhai–Macao Bridge (HZMB) from Sentinel-1A Observations. Remote Sens. 2021, 13, 546. [Google Scholar] [CrossRef]
  30. Qin, X.; Zhang, L.; Yang, M.; Luo, H.; Liao, M.; Ding, X. Mapping surface deformation and thermal dilation of arch bridges by structure-driven multi-temporal DInSAR analysis. Remote Sens. Environ. 2018, 216, 71–90. [Google Scholar] [CrossRef]
  31. Zhang, B.; Liao, X.; Zhang, J.; Xiong, S.; Wang, C.; Wu, S.; Zhu, C.; Zhu, J.; Li, Q. Megalopolitan-scale ground deformation along metro lines in the Guangdong-Hong Kong-Macao Greater Bay Area, China, revealed by MT-InSAR. Int. J. Appl. Earth Obs. Geoinf. 2023; in press. [Google Scholar]
  32. Leys, C.; Ley, C.; Klein, O.; Bernard, P.; Licata, L. Detecting outliers: Do not use standard deviation around the mean, use absolute deviation around the median. J. Exp. Soc. Psychol. 2013, 49, 764–766. [Google Scholar] [CrossRef]
  33. Zhang, B.; Wu, S.; Ding, X.; Wang, C.; Zhu, J.; Li, Q. Use of multiplatform SAR imagery in mining deformation monitoring with dense vegetation coverage: A case study in the Fengfeng mining area, China. Remote Sens. 2021, 13, 3091. [Google Scholar] [CrossRef]
  34. Wang, B.; Zhao, X.M. Handan Segment of the South to North Water Diversion Project Kicked Off. Available online: https://news.sina.com.cn/c/2010-01-13/073516923855s.shtml (accessed on 12 June 2023). (In Chinese).
  35. Ferretti, A.; Prati, C.; Rocca, F. Nonlinear subsidence rate estimation using permanent scatterers in differential SAR interferometry. IEEE Trans. Geosci. Remote Sens. 2001, 38, 2202–2212. [Google Scholar] [CrossRef]
  36. Ferretti, A.; Prati, C.; Rocca, F. Permanent scatterer in SAR interferometry. IEEE Trans. Geosci. Remote Sens. 2001, 39, 8–20. [Google Scholar] [CrossRef]
  37. Berardino, P.; Fornaro, G.; Lanari, R.; Sansosti, E. A new algorithm for surface deformation monitoring based on small baseline differential SAR interferograms. IEEE Trans. Geosci. Remote Sens. 2002, 40, 2375–2384. [Google Scholar] [CrossRef]
  38. Wegnüller, U.; Werner, C.; Strozzi, T.; Wiesmann, A.; Frey, O.; Santoro, M. Sentinel-1 support in the GAMMA software. Procedia Comput. Sci. 2016, 100, 1305–1312. [Google Scholar] [CrossRef]
  39. Hooper, A.; Zebker, H.; Segall, P.; Kampes, B. A new method for measuring deformation on volcanoes and other natural terrains using InSAR persistent scatterers. Geophys. Res. Lett. 2004, 31, L23611. [Google Scholar] [CrossRef]
  40. Zhao, Y. Construction of 78 Bridges Across the Middle Route of the South-to-North Water Diversion Project in Handan. Available online: https://hebei.hebnews.cn/2011-03/02/content_1694586.htm (accessed on 3 July 2023). (In Chinese).
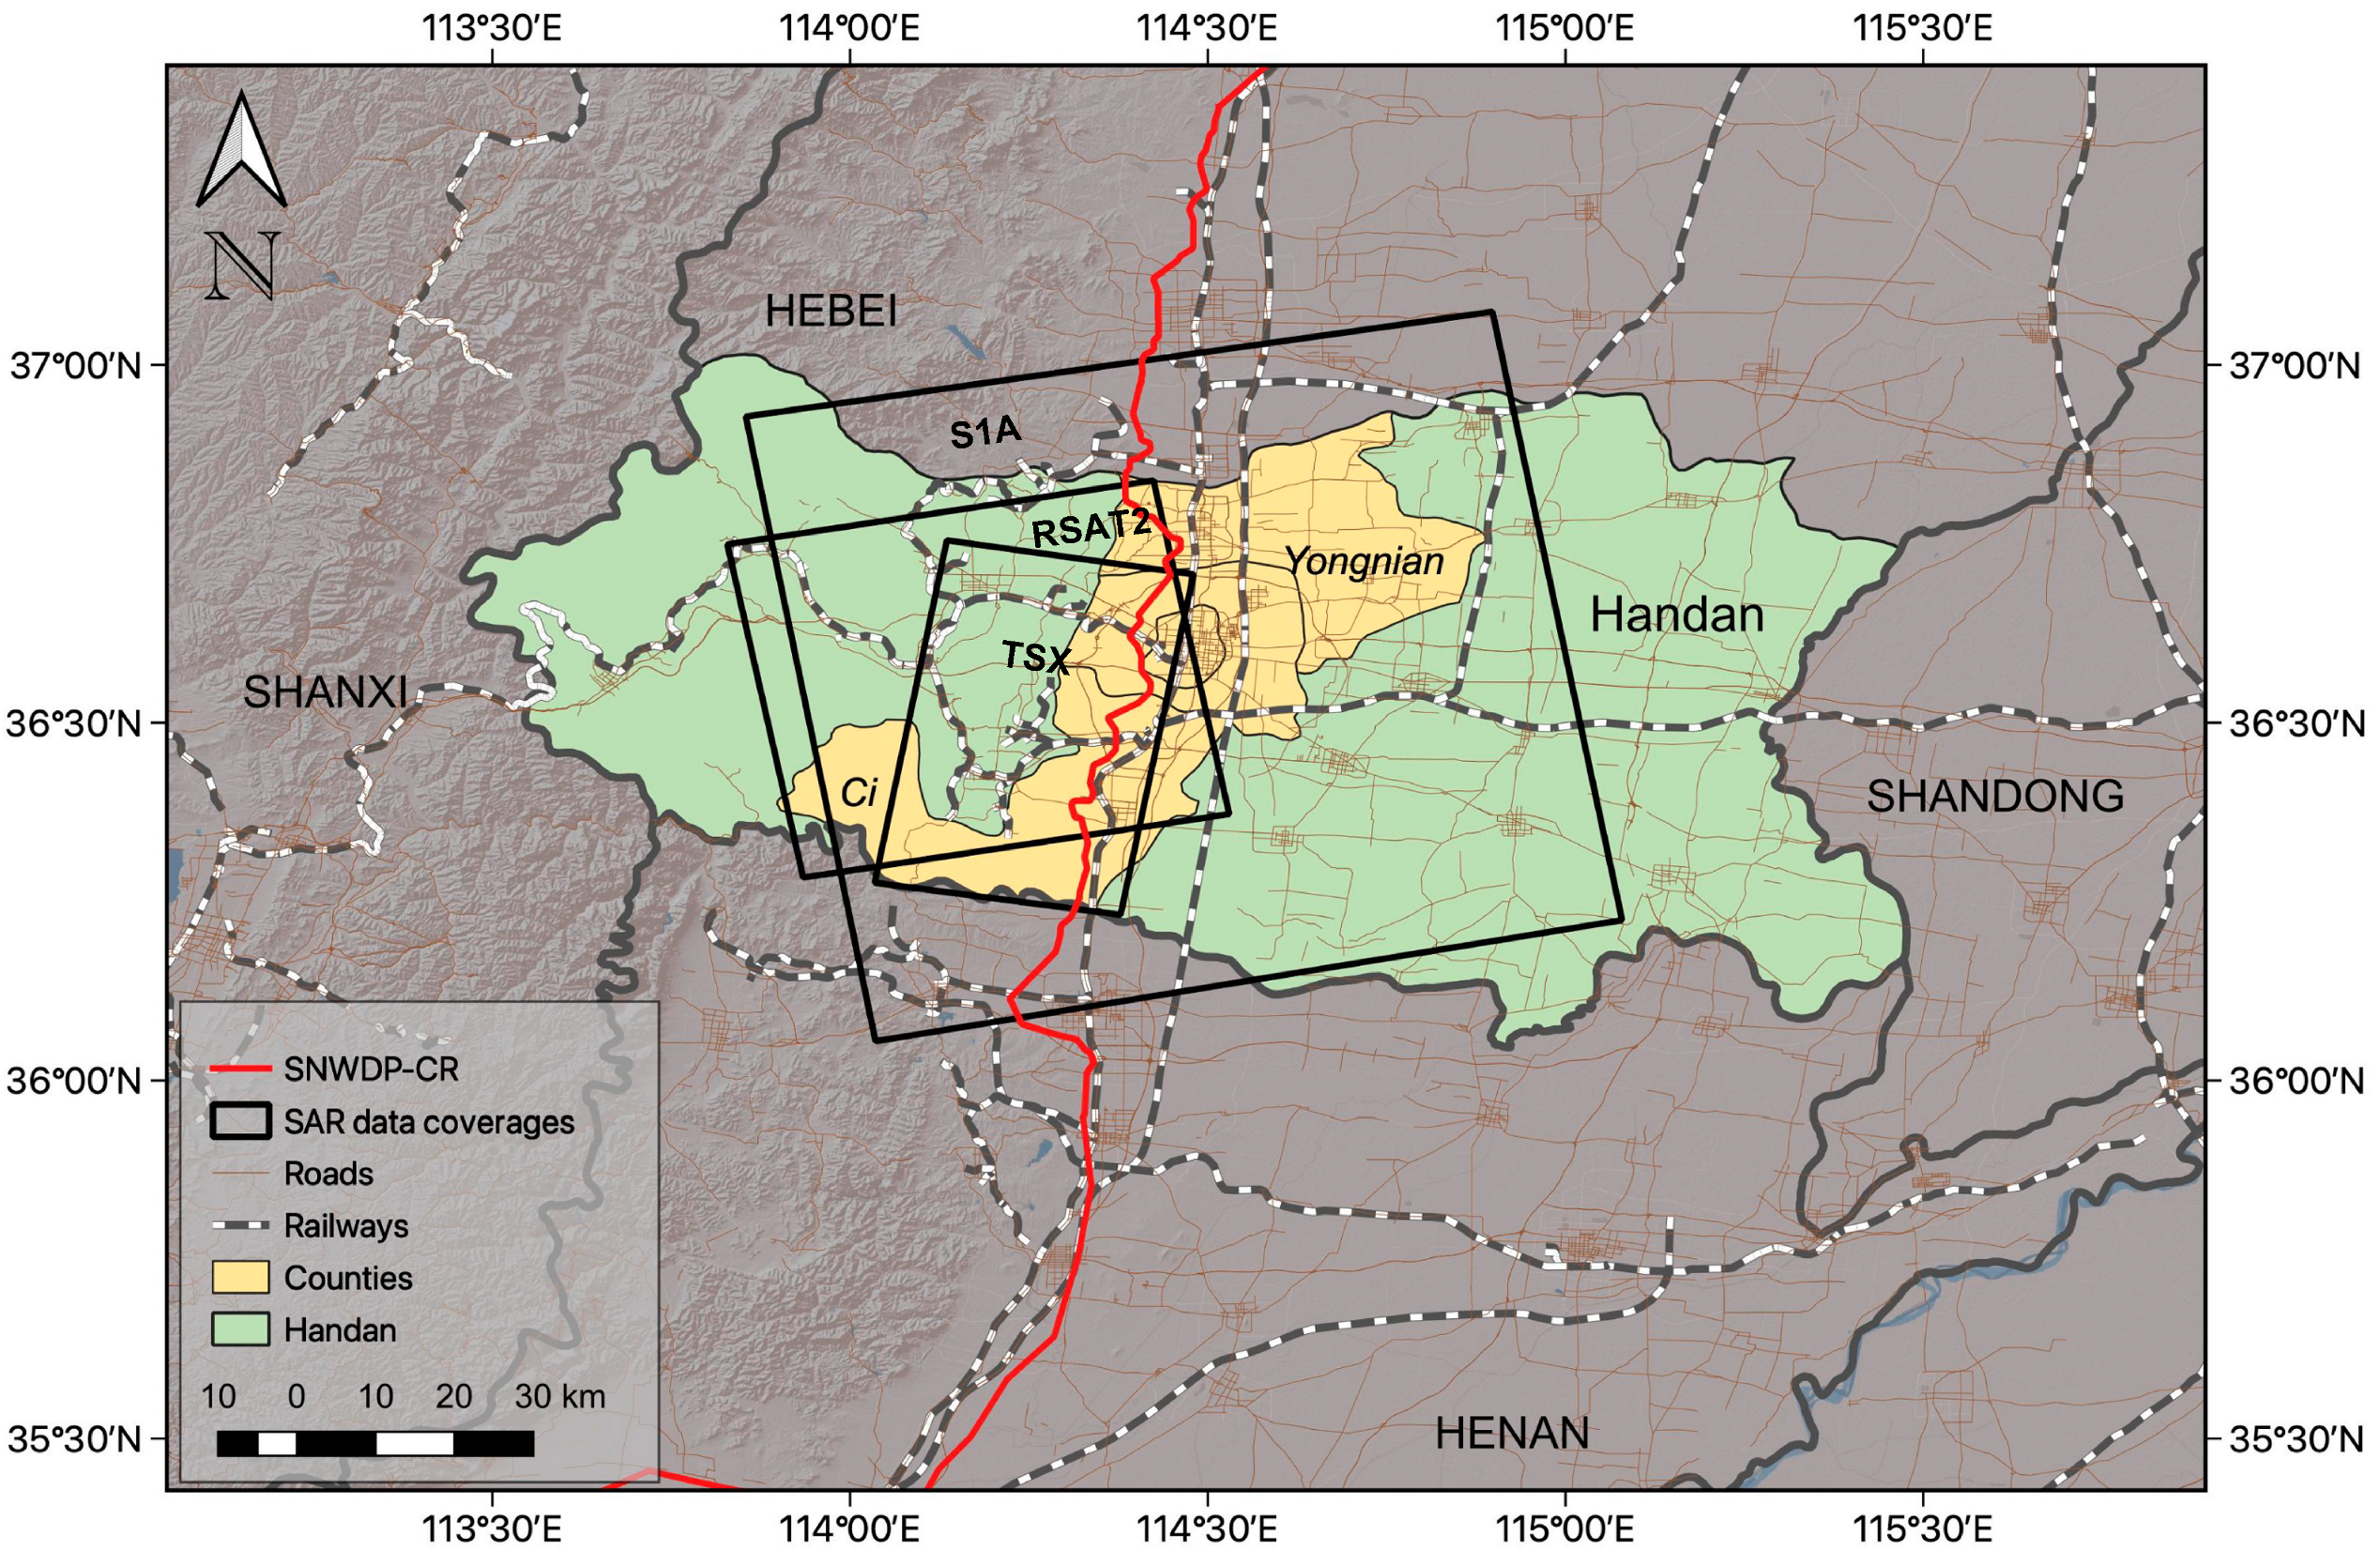
Figure 1. Geographical location of the study area and coverages of SAR datasets.
Remotesensing 15 03516 g001
Figure 2. The flowchart encompasses three modules: (1) the MT-InSAR processing in the dash blue box, (2) the time-series analysis in the dash green box, and (3) the deformation evaluation in the dash orange box. The ROI is the buffer area along the SNWDP-CR, and the buffer area is set to be 1 km around the route in this study. The coloured boxes annotate the input to the first module and final output from the last module.
Remotesensing 15 03516 g002
Figure 3. Deformation rate derived from PS-InSAR processing of (a) S1A, (b) RSAT2, and (c) TSX datasets.
Remotesensing 15 03516 g003
Figure 4. Close-ups of one subsiding area on the western embankment of the SNWDP-CR. The red circles highlight PSs in the S1A and RSAT2 results. The background images are satellite images from Google Earth.
Remotesensing 15 03516 g004
Figure 5. Satellite images from Google Earth showing the change in one land collapse south of P1 location. The red circles in (af) annotate the location where a land collapse evolving on the western embankment. The land surface damage occurred between 25 February 2017 and 28 June 2017. It was repaired on 22 February 2018.
Remotesensing 15 03516 g005
Figure 6. Close-ups of deformation rates of one aqueduct oriented in the south-to-north direction. Red circles are two ends of the aqueduct. The background images are satellite images from Google Earth.
Remotesensing 15 03516 g006
Figure 7. Close-ups show the deformation rates of one crossing-canal arch bridge derived from (a) S1A, (b) RSAT2, and (c) TSX datasets. Red circles highlight the bridge area. The background images are satellite images from Google Earth.
Remotesensing 15 03516 g007
Figure 8. Close-ups show the deformation rates of two crossing-canal dam bridges derived from (a) S1A, (b) RSAT2, and (c) TSX datasets. Red circles highlight the bridge areas. The background images are satellite images from Google Earth.
Remotesensing 15 03516 g008
Figure 9. Close-ups show the deformation rates of one siphon derived from (a) S1A, (b) RSAT2, and (c) TSX datasets. The background images are satellite images from Google Earth.
Remotesensing 15 03516 g009
Figure 10. Histograms showing the deformation rate distributions of (a) S1A, (b) RSAT2, and (c) TSX results (units for μ ,   σ ,   m i n and m a x are mm/year), as well as (d) the distributions of the standardised deformation rates of the three results. The red curves in (ac) are fitted normal distributions for the three results, respectively. The red curve in (d) is the fitted normal distribution for the standardised and combined deformation rates.
Remotesensing 15 03516 g010
Figure 11. Stability evaluation based on the combined results along (ad) four segments from south to north. Dangerous areas related to canal embankment, roads/railways, and aqueducts/siphons are denoted using green, red, and yellow boxes, respectively. The white lines and the yellow lines on the Google Satellite map are roads and railways, respectively.
Remotesensing 15 03516 g011
Figure 12. Schematic map shows measured LOS deformation of (a) vertical movement (case I shown as the black arrow) and (b) horizontal movement (cases II and III indicated as the black arrows) from ascending (the blue arrows showing S1A/RSAT2) and descending (the yellow arrows showing TSX) orbits.
Remotesensing 15 03516 g012
Figure 13. The standardised deformation rates of the merged result of (a) the aqueduct and (b) the crossing-canal bridge.
Remotesensing 15 03516 g013
Table 1. Detailed information of the three satellite SAR datasets.
Sentinel-1A (S1A)Radarsat-2 (RSAT2)TerraSAR-X (TSX)
WavelengthC-band (5.6 cm)C-band (5.6 cm)X-band (3.2 cm)
Range pixel spacing2.3 m2.7 m1.4 m
Azimuth pixel spacing13.9 m2.9 m1.9 m
Heading ( α )347°349°190°
Incident angle ( θ )39°35.5°41°
Repeat orbit12 days24 days11 days
Orbit directionascendingascendingdescending
PolarizationsVVHHHH
Time period20150617–2016033120150404–2016030520150524–20160212
Reference image201510032015082620151014
No. of images181415
Table 2. Key parameters of the PS-InSAR analysis.
Parameters of PS-InSARValues
amplitude dispersion index0.4
filter_grid_size50
density_rand20
weed_standard_dev1.0
weed_max_noise1.0
unwrap_method3D
unwrap_prefilter_flagyes
unwrap_grid_size (m)200
unwrap_gold_n_win32
unwrap_time_win (d)730
Disclaimer/Publisher’s Note: The statements, opinions and data contained in all publications are solely those of the individual author(s) and contributor(s) and not of MDPI and/or the editor(s). MDPI and/or the editor(s) disclaim responsibility for any injury to people or property resulting from any ideas, methods, instructions or products referred to in the content.