


Forecasting Regional Ionospheric TEC Maps over China Using BiConvGRU Deep Learning


1
Faculty of Land Resources Engineering, Kunming University of Science and Technology, Kunming 650093, China
2
School of Transportation Engineering, East China Jiaotong University, Nanchang 330013, China
*
Author to whom correspondence should be addressed.
Remote Sens. 2023, 15(13), 3405; https://doi.org/10.3390/rs15133405
Submission received: 24 May 2023
/
Revised: 2 July 2023
/
Accepted: 3 July 2023
/
Published: 5 July 2023
(This article belongs to the Special Issue International GNSS Service Validation, Application and Calibration)
Abstract
:In this paper, we forecasted the ionospheric total electron content (TEC) over the region of China using the bidirectional convolutional gated recurrent unit (BiConvGRU) model. We first generated the China Regional Ionospheric Maps (CRIMs) using GNSS observations provide by the Crustal Movement Observation Network of China (CMONOC). We then used gridded TEC maps from 2015 to 2018 with a 1 h interval from the CRIMs as the dataset, including quiet periods and storm periods of ionospheric TEC. The BiConvGRU model was then utilized to forecast the ionospheric TEC across China for the year 2018. The forecasted TEC was compared with the TEC from the International Reference Ionosphere (IRI-2016), Convolutional Long Short-Term Memory (ConvLSTM), Convolutional Gated Recurrent Unit (ConvGRU), Bidirectional Convolutional Long Short-Term Memory (BiConvLSTM), and the 1-day Predicted Global Ionospheric Map (C1PG) provided by the Center for Orbit Determination in Europe (CODE). In addition, indices including Kp, ap, Dst and F10.7 were added to the training dataset to improve the forecasting accuracy of the model (-A indicates no indices, while -B indicates with indices). The results verified that the prediction accuracies of the models integrated with these indices were significantly improved, especially during geomagnetic storms. The BiConvGRU-B model presented a decrease of 41.5%, 22.3%, and 13.2% in the root mean square error (RMSE) compared to the IRI-2016, ConvGRU, and BiConvLSTM-B models during geomagnetic storm days. Furthermore, at a specific grid point, the BiConvGRU-B model showed a decrease of 42.6%, 49.1%, and 31.9% in RMSE during geomagnetic quiet days and 30.6%, 34.1%, and 15.1% during geomagnetic storm days compared to the IRI-2016, C1PG, and BiConvLSTM-B models, respectively. In the cumulative percentage analysis, the BiConvGRU-B model had a significantly higher percentage of mean absolute error (MAE) within the range of 0–1 TECU in all seasons compared to the BiConvLSTM-B model. Meanwhile, the BiConvGRU-B model outperformed the BiConvLSTM-B model with lower RMSE for each month of 2018.
1. Introduction
The ionosphere is the region 60–1000 km above the Earth’s surface, where neutral gas molecules are partially or completely ionized by the effects of solar ultraviolet radiation, X-rays, and cosmic particles of higher energy. As a protective barrier, the ionosphere protects life on Earth from direct exposure to solar radiation and energetic particles from space. Additionally, its reflective properties facilitate long-range radio communication. However, disturbances in the ionosphere resulting from external factors can pose substantial risks to radio systems, including aerospace, satellites, and telecommunications. With the increasing demand for precise satellite positioning, accurate and efficient prediction of the ionosphere, especially in condition of ionospheric disturbances, holds great research significance in improving satellite navigation precision. A large amount of observations provided by the Global Navigation Satellite System (GNSS) have been used in various studies, which considered broadcasting or empirical models for ionospheric TEC forecasting, such as the Klobuchar model [1], the Bent model [2], International Reference ionosphere (IRI) model [3], NeQuick model [4], and BDGIM [5]. Unfortunately, these models cannot reach the desired level of accuracy due to their statistical methodologies. The accuracy of daily predictions of total electron content (TEC) from these models cannot be higher than 75% [4,6].
Since the establishment of the International GNSS Service (IGS) working group in 1998, a number of analysis centers, including the Center for Orbit Determination in Europe (CODE), the European Space Agency (ESA), the Jet Propulsion Laboratory (JPL) in the United States, and the Universitat Politecnica de Catalunya (UPC), have been providing Global Ionospheric Map (GIM) to users. These GIMs facilitate the study on highly accurate TEC forecasting models. CODE, ESA, and UPC additionally provide users with TEC maps one day in advance [7,8,9]. Comparing to the conventional empirical ionospheric models, the higher accuracy of GIM provided by these centers benefits many associated studies. Meanwhile, many scholars have been inspired and then conducted studies on building TEC forecasting models with high accuracy. Autoregressive models, such as the Autoregressive Moving Average Model (ARAM) and the Autoregressive Integrated Moving Average Model (ARIMA), are popular due to their simplicity and data efficiency [10,11,12,13]. However, their linearity limits their application in TEC modelling. Machine learning has emerged as a potential solution, as its algorithms can automatically learn the implicit non-linear relationships between TEC values and external metrics, thereby improving prediction performance in extreme conditions. Li et al. [14] introduced an improved model called pix2pixhd, built upon Generative Adversarial Networks (GAN), to specifically forecast TEC over China. The pix2pixhd model forecasts TEC with a 2 h lead time, and its accuracy is higher than the IRI-2016 model in diverse geomagnetic and solar activity scenarios. Liu et al. [15] utilized the convolutional long short-term memory (ConvLSTM) model to develop two strategies for the global TEC forecasting model. One strategy directly forecasts the TEC of the following day, while the other one models the difference between two TEC maps with 24 h interval. Results indicate that the latter approach has a higher accuracy, better than the 1-day forecast product from the CODE. Chen et al. [16] proposed a multi-step auxiliary forecast model based on the LSTM framework to mitigate the accumulation of computational errors inherent in a single-step sliding forecast. This model is able to forecast IGS GIM 6 days in advance, outperforming the IRI empirical model with more days in advance as well as giving a more stable estimation. Tang et al. [17] improved the conventional LSTM model by including convolutional and attention layers. They further incorporated various geomagnetic indices to establish the CNN-LSTM-Attention model to predict TEC at 24 GNSS stations in the Crustal Movement Observation Network of China (CMONOC). Comparing with the NeQuick model and the traditional LSTM model, the improved LSTM model showed more stable forecasting over different months and in various geomagnetic conditions, with a remarkable reduction in root mean square error (RMSE) to 1.87 TECU. Ren et al. [18] investigated the impact of different input time spans on TEC forecasting. They utilized the LSTM network to construct an indirect forecasting model, which forecasts spherical harmonic coefficients and subsequently calculates TEC, alongside a direct forecasting model that forecasts TEC using VTEC. Both models outperformed CODE’s forecast products and the traditional statistical models, in terms of forecasting accuracy. The IRI model is a classical empirical ionospheric model, which is often used to compare with new proposed models for accuracy verification. Xia et al. [19] presented an ED-ConvLSTM model to forecast global ionospheric TEC and compared it with the 1-day forecast model of Beijing University of Aeronautics and Astronautics (BUAA) and the IRI-2016 model. Rajana et al. [20] compared TEC derived from the IRI-2016 model with TEC calculated by Global Positioning System (GPS) observations. The results highlighted that the IRI-2016 model tends to underestimate TEC during periods of intense solar activity in the equatorial and low-latitude regions, especially in spring.
The LSTM model, as a recurrent neural network (RNN) model, has been proven to be highly applicable in temporal sequence forecasting challenges. The aforementioned researchers have successfully developed TEC forecasting models based on LSTM networks to generate good forecasting results. However, the LSTM models suffer from slow training speeds and high demand for computational ability due to the abundance of parameters. In response, the Convolutional Gated Recurrent Unit (GRU) network has emerged to overcome the limitations of the LSTM network. Many studies have been conducted to build TEC forecasting models using GRU networks and promising results have been achieved. The experiments conducted by Chung et al. [21] showed that the total number of GRU units stacked in the model was more than the number of LSTM units when the number of model parameters was similar, and that GRU trains faster than the LSTM model. Iluore et al. [22] employed GPS data from the MAL2 station in Kenya between 2010 and 2018 to construct a GRU-based TEC forecasting model, which was compared to LSTM, IRI-Plas 2017, GIM_TEC, and traditional MLP models. The result verified that the GRU model exhibited higher accuracy than the others, while its training speed was faster than the LSTM model. Lei et al. [23] identified a limitation in traditional RNN models, which is that data from each step contribute equally to the forecast. To overcome this problem, they proposed a bidirectional GRU model incorporating an attention mechanism. The model was verified by comparing its forecast at nine TEC positions with those obtained from LSTM, bidirectional LSTM, and four other models. The result showed that the improved GRU model outperformed the other models in terms of forecasting accuracy at all nine positions.
Various global ionospheric TEC forecasting models have been built based on deep learning algorithms and have achieved high forecast accuracy [17,18,19,24]. However, the detailed features of the regional ionosphere are difficult to learn due to the limitation of low accuracy and resolution of GIM. Therefore, constructing TEC forecasting models with higher accuracy based on the high-precision Regional Ionospheric Maps (RIMs) has become a research hotspot in recent years. The RIMs have been established in different regions, including China [25], the Korean Peninsula [26], Japan [27], India [28,29], Thailand [30], South Africa [31], and so on. Harsha et al. [28] proposed a model which assimilated ground GPS TEC data obtained from the GPS Aided GEO Augmented Navigation (GAGAN) network over the low-latitude Indian subcontinent into the Thermosphere Ionosphere Electrodynamics General Circulation Model (TIEGCM). High-latitude electric field models (Weimer and Heelis) were also utilized to construct the TIEGCM. The results showed that the proposed models successfully presented a negative storm over the Indian region. The correlation between the forecasts and observations was 93% during quiet days and 82% during the main phase of the storm. Sivakrishna et al. [29] used TEC data from 26 GPS stations data over the Indian region to forecast VTEC maps. They proposed an ionospheric TEC forecast model based on a bidirectional LSTM (bi-LSTM) algorithm to generate RIMs, which can capture the downward shift of depleted equatorial ionization anomaly (EIA) TEC structures during storm periods and which outperforms the ANN model and LSTM model. Furthermore, a number of studies have been conducted on forecasting high-precision TEC for single station or single grid point, effectively improving the accuracy of single-point positioning [6,32,33,34,35]. Kaselimi et al. [34] exploited the advantages of LSTM RNN for time series modeling and forecasted the TEC from a station by using a causal, supervised deep-learning method. Natras et al. [35] developed learning algorithms of Decision Tree and ensemble learning of Random Forest, Adaptive Boosting (AdaBoost), and eXtreme Gradient Boosting (XGBoost) and found the developed models performed well in both quiet and storm conditions. The global optimal strategy was not used in the single station models, hence a higher accuracy was obtained than with the regional forecasting model. Currently, studies on forecasting ionospheric TEC over China usually use TEC interpolated from the GIM provided by CODE. In contrast to the sites used by CODE to model the GIM, CMONOC stations are more evenly distributed over China, thereby making it more feasible to build high-precision China Regional Ionospheric Maps (CRIMs), and then to build high-precision ionospheric forecasting over China.
The 1-D vectors of the inputs of conventional LSTM and GRU networks would limit the forecasting of regional TEC. In this paper, we therefore propose a bidirectional convolutional gated recurrent unit (BiConvGRU) network-based model to forecast regional ionospheric TEC over China. We use gridded TEC maps from 2015 to 2018 with a 1 h interval from the CRIMs as the dataset, including quiet periods and storm periods of ionospheric TEC. All fully connected layers in the GRU network are replaced by convolutional computation, enabling the model to extract spatial features. The BiConvGRU model can obtain correlations in both the progressive and regressive directions of the time series, which make the model perform better than the SOTA model-ConvLSTM.
2. Methodology
Traditional backpropagation (BP) networks have a limited capacity to recognize temporal subtleties contained in historical data. To overcome this limitation, Elman [36] introduced the Elman network in 1990, which adds a contextual layer to the three-layer structure in the conventional BP network. This auxiliary layer stores the output information of the hidden layer from the previous time step, allowing exploration and assimilation of temporal patterns in variables undergoing temporal transformations, commonly known as time series data.
The cognition enhanced by technology demonstrates temporal fluctuations and follows specific patterns; thus, it is categorized as a variant of time series data. Nevertheless, the presence of activation functions within the Elman network poses a challenge when attempting to retain information from distant time steps, particularly when the input sequence is long. This challenge can lead to either gradient explosion or vanishing gradients during the training process, limiting its ability to effectively handle long-term data. To solve this challenge, Hochreiter et al. [37] proposed the LSTM model in 1997 based on inspiration from the complex process of remembering and forgetting in human beings.
2.1. BiConvGRU Model
By incorporating the forget gate, input gate, and output gate mechanisms, the LSTM model effectively tackles the problems of gradient explosion or vanishing in conventional RNNs when the input sequences are long. Many researchers have proposed various improved models based on LSTM. Among them, the GRU model, a derivative of LSTM, simplifies the gate structure by updating and resetting gates to modify parameters, hence effectively reducing the gradient explosion and vanishing during the training process [38].
Although traditional LSTM and GRU models perform well in forecasting TEC at a single station or a specific grid point, TEC is also significantly influenced by geographic location. In addition, the data are spatio-temporal sequences instead of the 1-D time series for a single station when modeling regional TEC. Consequently, challenges might be raised in the application of LSTM and GRU models in regional TEC forecasting, as some spatial variations are potentially dismissed during model building. To respond to this challenge, Shi et al. proposed the ConvLSTM and ConvGRU models, which employ convolutional computations instead of matrix operations in the conventional LSTM and GRU models [39,40]. Gao et al. further verified that the ConvLSTM model performs better in forecasting regional TEC than the traditional LSTM model and GRU model [41].
Figure 1a,b illustrate the network structure of the ConvLSTM and ConvGRU models, respectively. In the figures, represent the forget gate, input gate, and output gate of the ConvLSTM network, respectively, while and are the update gate and reset gate, respectively, of the ConvGRU network. Notably, and represent the cell state and hidden state, correspondingly, whereas signifies the candidate memory state. The activation function takes the form of the function, providing output values within the range [0, 1]. Similarly, the activation function exhibits its essence, generating output values in the range [–1, 1]. The elemental operation of the Hadamard product finds its elegant representation as , and the fundamental operation of convolution manifests itself as . The ConvGRU network, in contrast to ConvLSTM, discards one gate structure. The utilization of the update gate preserves the preceding temporal states within the current state. The numbers ‘0’ and ‘1’ symbolize the primal instincts of forgetfulness and unwavering preservation, respectively. Simultaneously, the reset gate regulates the flow of past temporal states into the present state, gracefully presented by the candidate memory state ht1. Moreover, the interplay between and orchestrates a symphony where the preceding hidden state disposes of the recollection remnant while integrating the current candidate memory into the output symphony. Notably, the reset gate has multiple roles including the responsibilities of the input and output gates within the ConvLSTM network, thereby effectively reducing the model’s parameter space and mitigating the challenge of gradient vanishing which commonly exists in recurrent neural networks.
To address the potentially inadequate extraction of correlations between present and past instances within conventional ConvGRU networks in the case of intricate and immensely fluctuating time series, a reverse ConvGRU network can be integrated with the forward ConvGRU network, forming a bidirectional ConvGRU network. This refinement improves the model to extract correlations in both the progressive and regressive directions of the time series, thereby improving its forecasting over the ConvLSTM model and ConvGRU model [42]. The structure of the bidirectional ConvGRU is shown in Figure 2.
The computational formulas for the forward network of BiConvGRU are as follows:
The computational formulas for the backward network are as follows:
In Equations (1) and (2), the symbols and represent the forward and backward networks, respectively. and express the hidden state vectors derived from the preceding and succeeding temporal instances, respectively. , and represent the weight matrices associated with their respective contexts. Ultimately, the hidden state vectors of the forward and backward networks merge to generate the comprehensive hidden state vector, denoted as , and , where and come from the forward and backward networks, respectively.
2.2. Chinese Regional TEC Forecasting Model based on BiConvGRU
2.2.1. Chinese Regional Ionospheric Model
Limited by the small number and uneven distribution of IGS stations in China, the GIM modeled by CODE exhibits low accuracy in the low-latitude areas of China. CMONOC provides a large amount of dual-frequency GNSS observations with a relatively even distribution, which can be used to calculate high-accuracy China RIMs (CRIMs) for further TEC extraction. Currently, prevalent techniques for regional ionospheric modeling include polynomial models, trigonometric series models, and low-degree spherical harmonic models. In this study, we utilized the low-degree spherical harmonic function to establish the CRIM model [43,44]:
where represents the geomagnetic latitude of the ionospheric pierce point, denotes the highest order of the spherical harmonic expansion, and represents the normalized associated Legendre function of degree and order . The sidereal longitude of the pierce point is calculated by , where denotes the geomagnetic longitude and represents the observation time in Universal Time. Notably, the coefficients and are the model parameters for the spherical harmonic functions. Because of the combined efficiency and precision of harmonic models, this study employs a fourth-order spherical harmonic model to construct the CRIM. The study conducted by Yuan et al. [45] demonstrated high accuracy of this option for regional ionospheric modeling.
2.2.2. Data Preparation
Total Electron Content (TEC) not only shows periodic fluctuations with time but also is influenced by geomagnetic and solar activities. In this study, we built BiConvLSTM and BiConvGRU models in two scenarios, without and with integration of geomagnetic and solar activity indices, correspondingly marked by -A and -B in the model names. We sought to incorporate the indices which significantly influence the accuracy of the forecasting model: the Dst index, Kp index, ap index, and solar F10.7 index.
With the dataset of GNSS dual-frequency observations from approximately 250 CMONOC stations, we constructed the CRIM based on the fourth-order spherical harmonics function. The CRIM ranged from 70°E to 140°E in longitude and from 15°N to 55°N in latitude with a grid resolution of 1° in both dimensions. Therefore, a total of 41 × 71 grid points are distributed over the region evenly. To ensure the temporal granularity, a temporal interval of 1 h was employed in the CRIM.
In terms of model training, we selected observations between 1 January 2015 and 23 September 2017 as the training dataset, and observations between 24 September 2017 and 31 December 2017 as the validation dataset. TEC data from 1 January 2018 to 31 December 2018 were then used as a test dataset to evaluate the model. We chose the data from 2015 to 2018, because the Sunspot tends to be more active during this period. Moreover, this period covers relatively quiet and high years of solar activity, which are the common states of space weather. In addition, there are more ionospheric storms during this period. Thus, the generalizational ability of the model may be enhanced, and the model may perform better in normal case.
The input tensor dimensions for the BiConvLSTM-A and BiConvGRU-A models were (N, 24, 41, 71, 1) when geomagnetic and solar activity indices were harmonized with TEC data. Here, N represents the number of samples; each included TEC data over 24 h. The numbers “41” and “71” correspond to the dimensions of the TEC maps, while “1” signifies that TEC is the only input feature.
In the BiConvLSTM-B and BiConvGRU-B models, the input tensor assumed the dimensions were (N, 24, 41, 71, 5) when incorporating Dst index, Kp index, ap index, and F10.7 index as additional input features. The prediction process becomes more complex with more input features. These indices were resampled onto a 41 × 71 map with equal values. The data of these indices with one-hour resolution are available from the GSFC/SPDF OMNIWeb (https://omniweb.gsfc.nasa.gov/form/dx1.html (accessed on 20 December 2022)).
2.2.3. Constructing the BiConvGRU Forecasting Model
The BiConvGRU model adopts an encoder–decoder network structure, as shown in Figure 3. The input of the BiConvGRU model is a tensor of (N, 24, 41, 71, 5). Each BiConvGRU layer is connected by a Conv2d layer (red down arrow) in the encoder, and by DeConv2d (blue up arrow) layer in the decoder [46]. The decoder network copies (black arrow) its initial state from the encoder network. It should be noted that the input tensor of the decoder is the output tensor of the encoder. For example, the input tensor of the BiConvGRU5 in the decoder is the output tensor of BiConvGRU4, which captures information from all 24 maps in the hidden state to generate forecasted TEC maps for the subsequent day. In conclusion, the decoder can be considered as the symmetrical reverse of the encoder. TEC spatio-temporal complexity can be better learnt by the model through stacking BiConvGRU layers in the encoder. Each BiConvGRU layer is equipped with a Batch Normalization layer to avoid overfitting and restriction. Finally, the multi-channel output sequence of BiConvGRU8 is converted to a single-channel output using a deconvolution layer with a kernel size of 1, generating the forecasted CRIM for the next day.
After obtaining the forecasted CRIM of the following day, the differences between the forecasted and measured values are used to calculate the model loss, which is the key parameter to optimize the model. Under the guidance of the optimizer, the network parameters are continuously updated, aiming to improve the model.
2.2.4. Parameter Settings of the BiConvGRU Model and Other Comparison Models
The parameters for the BiConvGRU model and other comparison models were configured based on empirical results: the number of layers was set as {3, 4, 5}, the number of the kernel was {16, 24, 32, 48, 64}, the size of the convolutional kernel was {3, 5, 7}, and the learning rate was {0.01, 0.05, 0.1, 0.2, 0.5}.
The above parameters were determined through a grid search methodology, which involves selection of parameter combinations and evaluation of performance using RMSE on the validation set. The set of parameters with the lowest final error was chosen to build the TEC forecasting model.
The model uses Mean Squared Error (MSE) as the loss function considering that forecasting TEC is a regression process. The optimizer “Adam”, known for its adaptability in adjusting the learning rate during training for efficient convergence, was chosen. The model was trained with a maximum of 400 iterations, and early stopping was employed if the validation loss failed to decrease over the initial 80 iterations.
3. Experiment and Analysis
Previous studies have shown significant advancement of incorporating geomagnetic activity and solar activity indices as supplementary parameters to build forecasting models. Geomagnetic activities result in higher peak values of TEC background in contrast to geomagnetic calm periods, leading to lower accuracy of the forecasted TEC during magnetic storms. Therefore, evaluating the model’s ability to forecast TEC during magnetic storms becomes a crucial measure of its resilience and holds significant importance in the assessing the model’s accuracy.
The variations of geomagnetic activity indices and solar activity indices during Day of Year (DOY) 231–240 in 2018 [47] are illustrated in Figure 4a–d, showing Kp index, ap index, Dst index, and F10.7 index, respectively. Table 1 and Table 2 shows classifications of magnetic storms and solar activities corresponding to specific indices.
In this study, the Dst index was selected as the primary parameter to assess the intensity of magnetic storms. According to the classification criteria in Table 1, a day with Dst index below −30 nT can be defined as a magnetic storm day. Thus, there are 214 days with weak magnetic storms, 105 days with moderate magnetic storms, 16 days with strong magnetic storms, and 3 days with severe magnetic storms among the total 985 days of the training dataset. Taking into account all indices in Figure 4 and classification criteria in Table 1 and Table 2, DOY 231–235 corresponds to quiet days as the Dst index exceeds −30 nT, the ap index is less than 32 nT, and the maximum Kp index is 4. However, during DOY 236–240, the ap and Kp indices increased and the Dst index decreased sharply; the peak values of the ap and Kp indices and the lowest Dst index are observed on DOY 238 with the minimum Dst index of −175 nT, indicating a severe magnetic storm occurred during the period. In addition, the monthly average of the F10.7 index in this month is 71 sfu, suggesting relatively weak solar activity, and hence little solar influence on the variation of ionospheric TEC. This study focuses on analyzing the forecasting model’s accuracy for both quiet days (DOY 231–235) and magnetic storm days (DOY 236–240).
3.1. The Evaluation Metrics for the Model
To evaluate the accuracy of various models during periods of tranquility and storms, RMSE, MAE, and the correlation coefficient are calculated by the following elegant formulas:
where signifies the total number of TEC data. means a specific grid point, and there are grid points in total. and , respectively, indicate the CRIM TEC and the forecasted TEC at time t for a given grid point. and represent the sequences of CRIM TEC and the forecasted TEC, respectively, for all grid points at time . The accuracy of each grid point is first calculated, and then averaged to obtain the error of the forecasting model for the entire region.
3.2. Analysis of Forecast Accuracy on Quiet Days
3.2.1. Analysis of Forecast Accuracy at Different Time Points
This paper takes DOY 233 as an example to analyze forecasting accuracy for quiet days. Figure 5 presents the TEC modeled by CRIM and IRI-2016, and forecasted by the BiConvLSTM-A, BiConvLSTM-B, ConvLSTM-B, ConvGRU-B, BiConvGRU-A, and BiConvGRU-B models at UT 0, UT 6, UT 12, and UT 18 on DOY 233. The corresponding MAE of each model is labeled in the figure. Figure 6 presents the error histogram at UT 6 and UT 12 to analyze the error distribution of different models. The X-coordinate shows the MAE between the forecasted TEC and the CRIM TEC on DOY 233. Y-coordinate shows the percentage of grid points. Figure 7 shows the correlation analysis between the forecasted TEC of each model and the CRIM TEC throughout the 24 h in DOY 233. The scatter density plots in Figure 7a–g represent the IRI-2016, BiConvLSTM-A, ConvLSTM-B, BiConvLSTM-B, BiConvGRU-A, ConvGRU-B and BiConvGRU-B models with CRIM TEC.
From Figure 5, it can be seen that all of the seven forecasting models effectively capture the ionospheric equatorial anomaly in the region of China. Moreover, areas with higher TEC generally exhibit good agreement with CRIM TEC. Notably, the IRI-2016 model demonstrates significantly higher MAE at UT 12 and UT 18 compared to deep learning models. The integration of additional indices in the BiConvLSTM and BiConvGRU models improves their fitting performance, verified by smaller MAEs in BiConvLSTM-B and BiConvGRU-B models in contrast with MAEs in BiConvLSTM-A and BiConvGRU-A, respectively. Except for UT 12, the BiConvGRU model shows lower MAE compared to the BiConvLSTM model. We found that the MAE of BiConvGRU-B model and that of the ConvGRU-B model were very similar, meaning the bidirectional structure is not always effective for feature extraction.
From the examination of Figure 6A(a–g) at UT 6, we can learn that the ConvGRU-B, BiConvGRU-A, and BiConvGRU-B models perform better than the ConvLSTM-B, BiConvLSTM-A, and BiConvLSTM-B models, respectively, because the percentage of grid points with lower MAE is higher. IRI-2016 performs better than the deep learning model without additional indices at UT 6, since the strategy is of global optimization in regional forecasting, which is a trade-off performed by the model. The BiConvGRU-B model has more than 50% of MAE in 0–1 TECU. However, the maximum value of MAE also increases to about 10 TECU. Higher percentages of low MAE and lower percentages of high MAE will make the average MAE lower. In most cases, models with higher accuracy usually have a smaller MAE maximum. From the examination of Figure 6B(a–g) at UT 12, we can learn that the MAE is not so well distributed in the IRI-2016 model, which led to the highest average MAE shown in Figure 5. The BiConvGRU-B model has an MAE ratio of over 60% within 1 TECU. In addition, we can easily find the model with the lower average MAE in Figure 5, mainly because of the high percentage of low MAE. The performance of the bidirectional model with additional indices is better.
In the correlation analysis shown in Figure 7, it can be seen that the majority of TEC values on DOY 233 fall within the range of 0–10 TECU. The correlation coefficient of the IRI-2016 model is notably lower than that of the deep-learning models, while the other models exhibit correlation coefficients around 0.98. The correlation coefficients of the ConvGRU-B model are higher than that of the widely used ConvLSTM-B model. Additionally, it is worth noting that the peak TEC values predicted by the BiConvLSTM-A and BiConvLSTM-B models are higher compared to those predicted by the BiConvGRU-A and BiConvGRU-B models.
For the purpose of providing a more comprehensible comparison of the forecast accuracy among different models, Table 3 is presented, displaying the 24 h average values of various metrics for the models on DOY 233. As per the findings from Table 3, it is evident that the IRI-2016 model exhibits considerably higher RMSE and MAE values compared to the other models. The ConvGRU-B model achieves a reduction of 11.9% in RMSE and 11.1% in MAE in comparison to the ConvLSTM-B model. The BiConvLSTM-B model achieves a noteworthy reduction of 34.7% in both RMSE and MAE when compared to the BiConvLSTM-A model. Similarly, the BiConvGRU-B model showcases a significant reduction of 28.3% in RMSE and 31% in MAE in comparison to the BiConvGRU-A model, as well as a reduction of 26.4% in RMSE and 27.5% in MAE when compared to the ConvGRU-B model. Notably, the BiConvGRU-B model demonstrates a substantial enhancement in forecast accuracy, with a remarkable reduction of 58.1% in RMSE and 60.6% in MAE when compared to the IRI-2016 model, and 35.1% in RMSE and 35.6% in MAE when compared to the classical ConvLSTM-B model.
During the magnetically quiet day, the BiConvGRU-B model exhibits a notable improvement in forecast accuracy when contrasted with the empirical IRI-2016 model. The higher forecast accuracy observed in the BiConvGRU-B model compared to the ConvGRU-B model indicates the effectiveness of the bidirectional mechanism. In addition, the prediction accuracy is somewhat improved compared to the BiConvLSTM-B model.
3.2.2. Analysis of Model Forecast Accuracy Variation with Longitude at Different Latitudes
Figure 8 showcases the RMSE variation of the IRI-2016, ConvLSTM-B, ConvGRU-B, BiConvLSTM-A, BiConvGRU-A, BiConvLSTM-B, and BiConvGRU-B models with longitude across various latitudes on DOY 233. Figure 8a–e correspond to latitudes 15°N, 25°N, 35°N, 45°N, and 55°N, respectively. Table 4 summarizes the RMSE values for these seven models at different latitudes.
Based on the analysis of Figure 8 and Table 4, it can be observed that overall, the RMSE values for all seven models demonstrate a declining trend as latitude increases. The IRI-2016 model consistently exhibits higher RMSE values compared to other deep learning models across various latitudes. The RMSE curves of the BiConvGRU-B model consistently lie below those of the BiConvLSTM-B model. Furthermore, according to Table 4, the RMSE values of the BiConvGRU-B model remain below 2 TECU for all latitude ranges, except at 25°N where it slightly exceeds that of the BiConvLSTM-B model. The RMSE of the ConvLSTM-B model is higher than the BiConvGRU-B across various latitudes. Furthermore, it can be seen that there are small peaks in RMSE for different models near 70°E and 140°E, and an elevation in RMSE at 55°N. This can be attributed to the limited availability of CMONOC stations, which impacts the quality of extracted TEC data in the peripheral region of China. We will add some nearby IGS stations to assist in modeling in a subsequent study and study the variation of RMSE among the models under this condition.
In conclusion, the analysis suggests that the BiConvGRU-B model outperforms the BiConvLSTM-B model and IRI-2016 model in terms of RMSE at different latitudes during quiet days, highlighting its better forecasting performance.
3.2.3. Analysis of Model Forecast Accuracy at Individual Grid Points
To further assess the forecast accuracy of the proposed models for quiet-day TEC, interpolation was conducted using the 1-day Predicted GIM (C1PG) data provided by the CODE center. This enabled TEC predictions for nine specific grid points at various longitudes and latitudes within the Chinese region for DOY 231–235. A comparative analysis was then performed using the TEC predictions of the IRI-2016, BiConvLSTM-B, and BiConvGRU-B models at these corresponding grid points.
Figure 9 showcases the CRIM TEC values at the nine grid points within the Chinese region during quiet days, alongside the 5-day TEC predictions from the four models. Meanwhile, Table 5 presents the RMSE values for the 5-day predictions of the four models. The RMSE in the Table 5 can be calculated by the Equation (5):
where represents the CRIM TEC, and represents the model value of different models.
Based on the analysis of Figure 9 and Table 5, it can be observed that the TEC predictions of the IRI-2016 model exhibit a notable disparity compared to the other three models in the 25°N region, indicating inadequate fitting performance for the TEC minima. Similarly, the C1PG model yields higher TEC predictions than the other three models in the 45°N region. The BiConvLSTM-B model demonstrates poor TEC prediction performance specifically for DOY 233–235. The BiConvLSTM-B model overestimates TEC for the 35°N and 45°N during ionization periods, resulting in large errors. The IRI-2016 model predicts this region second only to the BiConvGRU-B model. On the other hand, the TEC predictions of the BiConvGRU-B model exhibit the closest alignment with the CRIM TEC values, displaying the lowest RMSE among the four models, except at 25°N, 120°E.
The average RMSE values for the nine grid points were computed as follows: IRI-2016-2.42 TECU, C1PG-2.73 TECU, BiConvLSTM-B-2.04 TECU, and BiConvGRU-B-1.39 TECU. In comparison to the IRI-2016, C1PG, and BiConvLSTM-B models, the BiConvGRU-B model achieved reductions in RMSE of 42.6%, 49.1%, and 31.9%, respectively.
3.3. Analysis of Model Forecast Accuracy during Geomagnetic Storm Days
3.3.1. Analysis of Model Forecast Accuracy at Different Time Intervals
Figure 10 shows the TEC values of the CRIM, IRI-2016, BiConvLSTM-A, BiConvLSTM-B, ConvLSTM-B, ConvGRU-B, BiConvGRU-A, and BiConvGRU-B models at different time points (UT 0, UT 6, UT 12, UT 18) on DOY 238, providing a specific illustration of the models’ forecasting accuracy during days of geomagnetic storms. In Figure 10, the CRIM TEC data are presented in a comparison to investigate the feature extraction capability of the model on DOY 238.
Figure 11 presents the error histogram for UT 6 and UT 12 to analyze the error distribution of different models. The X-coordinate indicates the MAE between the model value and the CRIM TEC, and the Y-coordinate indicates the percentage of grid points.
Figure 12 presents a correlation analysis between the 24 h TEC predictions of the various models and the CRIM TEC values for DOY 238. Figure 11a–g display the scatter density plots of the IRI-2016, BiConvLSTM-A, BiConvLSTM-B, ConvLSTM-B, ConvGRU-B, BiConvGRU-A, and BiConvGRU-B models with CMONOC TEC, respectively.
Based on Figure 10, it is evident that TEC values during geomagnetic storms are considerably higher compared to calm days, resulting in lower forecasting accuracy for all five models during such stormy conditions. Among the models, BiConvGRU-B demonstrates relatively better forecasting performance during geomagnetic storms, although the predicted TEC values still remain notably lower than the CRIM TEC values. At UT 6, both BiConvLSTM and BiConvGRU models without exponential factors exhibit higher MAE compared to the IRI-2016 model. However, the incorporation of exponential factors results in a significant reduction in MAE by 19% and 23.9%, respectively, indicating a substantial improvement. Moreover, at this time point, the MAE of models with exponential factors is lower than that of the IRI-2016 model, suggesting that the inclusion of exponential factors enhances forecast accuracy.
From Figure 11A(a–g) at UT 6, we can learn that the ConvGRU-B, BiConvGRU-A, and BiConvGRU-B models perform better than the ConvLSTM-B, BiConvLSTM-A, and BiConvLSTM-B models respectively, which is the same as for calm days. The IRI-2016 model performs better than the deep-learning model without additional indices at UT 6 except for the ConvLSTM-B model, because the ConvLSTM-B model has less than 10% of MAE within 1 TECU, which is the smallest among all models. The maximum MAE of the BiConvGRU-B model at UT 6 is approximately 5 TECU lower than other models. The BiConvGRU-B model has more than 50% of MAE in 0–1 TECU, which is the highest among all the models. From the examination of Figure 11A(a–g) at UT 6, it can be seen that the MAE distribution of the IRI-2016 model is the worst, leading to the highest average MAE in Figure 10. The BiConvLSTM-B model performs better than the BiConvGRU-B model at UT 12, as its MAE within 1 TECU exceeds 30%. A higher percentage of MAE in the range of 10–15 TECU causes the IRI-2016 model, ConvLSTM-B model, BiConvLSTM-A model, ConvGRU-B model, and BiConvGRU-B model to have worse performance compared to the BiConvLSTM-B model and BiConvGRU-B model.
The correlation analysis presented in Figure 12 indicates that the correlation coefficients of the IRI-2016 model are lower compared to the other deep-learning models, even during geomagnetic storms. Despite the presence of storm conditions, the majority of TEC values still fall within the range of 0–10 TECU. While the correlation coefficients of different models slightly decrease compared to calm days, the incorporation of exponential factors leads to improved correlation coefficients for both BiConvLSTM and BiConvGRU models, with BiConvGRU-B exhibiting the highest correlation coefficient among the seven models.
Table 6 provides the average values of various metrics for different models on DOY 238. The results reveal that during magnetic storms, the IRI-2016 model demonstrates higher RMSE and MAE compared to the other models. The BiConvLSTM-B model achieves a reduction of 17.7% in RMSE and 21.9% in MAE compared to the BiConvLSTM-A model. Similarly, the BiConvGRU-B model shows a decrease of 27.4% in RMSE and 24.1% in MAE compared to the BiConvGRU-A model. In comparison to the ConvGRU-B model, the BiConvGRU-B model exhibits a reduction of 22.3% in RMSE and 21.9% in MAE. The BiConvGRU-B model shows a decrease of 24.1% in RMSE and 24.1% in MAE compared to the ConvLSTM-B model. Furthermore, when compared to the IRI-2016 model, the BiConvGRU-B model demonstrates a substantial decrease of 41.5% in RMSE and 49.2% in MAE. Notably, during magnetic storms, only the BiConvGRU-B model achieves an RMSE below 3 TECU, indicating higher forecast accuracy compared to the other five models.
3.3.2. Analysis of the Variation of Model Forecast Accuracy with Longitude at Different Latitudes
Figure 13 presents the variation of RMSE with longitude for the IRI-2016, ConvLSTM-B, ConvGRU-B, BiConvLSTM-A, BiConvGRU-A, BiConvLSTM-B, and BiConvGRU-B models at different latitudes on DOY 238. Table 7 provides a summary of the RMSE values for the three models at various latitudes. Analysis of Figure 13 and Table 7 reveals that during magnetic storms, the RMSE values for all seven models tend to be higher at higher latitudes compared to lower latitudes, indicating the presence of a distinct equatorial anomaly phenomenon. The RMSE curves of the IRI-2016 model consistently lie above other models, with the peak RMSE value reaching 12 TECU. The BiConvLSTM-B and BiConvGRU-B models exhibit peak RMSE values of approximately 9 TECU and 7 TECU, respectively. Moreover, Table 7 indicates that of all the latitude ranges, only at 35°N is the RMSE higher for the BiConvGRU-B model compared to the BiConvLSTM-B model. The most notable improvement in RMSE is observed at 25°N, with a reduction of 62.7% compared to the IRI-2016 model, 30.5% compared to the BiConvLSTM-B model, and 45.9% compared to the ConvLSTM-B model. The difference in forecast accuracy of different models at high latitudes is not significant, and the difference in model performance is mainly reflected in the forecast accuracy at low latitudes. Based on these findings, it can be concluded that during magnetic storms, the BiConvGRU-B model consistently exhibits superior RMSE performance compared to the other models across different latitudes.
3.3.3. The Forecast Accuracy Analysis of a Single-Grid Point Model
Figure 14 shows the CRIM TEC values at nine grid points within the Chinese region, alongside the predicted TEC values derived from the remaining four models during the period of DOY 236–240, amidst the occurrence of a geomagnetic storm. Table 8 provides the average RMSE values for the 5-day predictions offered by the four models. Upon scrutinizing Figure 14 and Table 8, it becomes evident that the IRI-2016 model exhibits subpar fitting performance for the TEC values situated at the trough locations of 25°N and 35°N. In stark contrast, the C1PG model noticeably overestimates the TEC values within the regions of 35°N and 45°N when compared to the other three models. DOY 238 encounters a period of heightened geomagnetic activity, resulting in a prominently elevated peak in the TEC background value in comparison to the other four days, consequently leading to subpar fitting performance across all four forecast models on that particular day. The TEC prediction curve presented by the BiConvGRU-B model closely aligns with the CRIM TEC values overall, exhibiting lower RMSE values in contrast to the other four models, except at (25°N, 100°E). The calculated average RMSE values for the IRI-2016, C1PG, BiConvLSTM-B, and BiConvGRU-B models at the nine grid points are 2.91 TECU, 3.08 TECU, 2.38 TECU, and 2.02 TECU, respectively. The BiConvGRU-B model demonstrated significant enhancements in RMSE as compared to the IRI-2016, C1PG, and BiConvLSTM-B models, with reductions of 30.6%, 34.4%, and 15.1%, respectively. It showcased notable advancements in contrast to the IRI-2016 and C1PG models, as well as a discernible level of improvement in comparison to the BiConvLSTM-B model.
While the BiConvGRU-B model demonstrates superior overall forecast accuracy compared to the other three models, it is noteworthy that the C1PG model successfully captured the occurrence of the geomagnetic storm on DOY 238, exhibiting significantly higher forecast values in comparison to the other four days. However, both the BiConvGRU-B and BiConvLSTM-B models tend to overestimate the geomagnetic disturbance at certain grid points. This phenomenon can be attributed to the fact that only 12.8% of the training dataset comprised samples with moderate-to-severe geomagnetic storms. Despite the inclusion of auxiliary variables such as geomagnetic activity and solar activity indices during model training, the learned features specific to geomagnetic storm days gradually weaken as the number of training samples increases. Consequently, this can lead to false alarms in the predictions.
3.4. Analysis of Forecast Accuracy throughout 2018
To assess the long-term predictive capability of the models, Figure 15 presents the cumulative distribution of Mean Absolute Error (MAE) for the BiConvLSTM-B and BiConvGRU-B models across the seasons of spring (March–May), summer (June–August), autumn (September–November), and winter (December–January/February) in 2018. From the figure, it is evident that the BiConvGRU-B model displays a significantly higher proportion of MAE falling within the range of 0–1 TECU compared to the BiConvLSTM model. Specifically, the BiConvGRU-B model exhibited respective increases of 50%, 47.6%, 61%, and 58.8% in the spring, summer, autumn, and winter seasons. Additionally, the percentage of MAE exceeding 2.5 TECU consistently remains lower for the BiConvGRU-B model compared to the BiConvLSTM-B model across all four seasons. Specifically, the BiConvGRU-B model demonstrated percentages of MAE exceeding 2.5 TECU as 4.8%, 0%, 10.8%, and 1.9% in the spring, summer, autumn, and winter seasons, respectively. The BiConvGRU-B model effectively enhances the proportion of MAE falling within the 0–1 TECU range while reducing the percentage of MAE exceeding 2.5 TECU, thereby indicating superior predictive performance.
In accordance with the classification criteria outlined in Table 1, the validation set for the entirety of 2018 encompassed 365 days. Applying the aforementioned criteria, a total of 46 days in 2018 were categorized as storm days, comprising 36 days with weak storms, 9 days with moderate storms, and 1 day with a severe storm, and constituting 12.6% of the entire year. The remaining 319 days were classified as quiet days. Table 9 provides the RMSE values for the BiConvLSTM-B and BiConvGRU-B models across diverse geomagnetic conditions. It is evident that the RMSE values of the models during storm days notably exceed those during quiet days. Furthermore, the superior forecast accuracy of the BiConvGRU-B model compared to the BiConvLSTM-B model is apparent across various geomagnetic conditions. In addition, the mean RMSE values of the BiConvLSTM-B model and the BiConvGRU-B model during storm days are 2.13 TECU and 1.91 TECU, respectively.
Other studies also show low accuracy in forecasting TEC during magnetic storm periods in the same region. For example, Xia et al. [48] proposed a support vector machine (SVM) model to forecast TEC in the China region, and the RMSE of the model was 2.02 TECU during the storm condition. Shi et al. [49] proposed a bidirectional LSTM model for the China region, and the RMSE was up to 2.07 TECU at low latitudes during the storm condition. The BiConvGRU-B model in our study has better performance compared to the above models. In addition, our research is most similar to the work by Gao et al. [41], which proposed a storm–time ionospheric TEC model for the China region, with multichannel features on the basis of the ConvLSTM network. However, the RIMs they used were generated by CODE’s GIM. The MAE and RMSE values can reach the minimum of 0.98/1.31 TECU in quiet periods and 1.44/1.88 TECU in storm periods. Furthermore, the accuracy of the ConvLSTM models would decrease if the output steps increased.
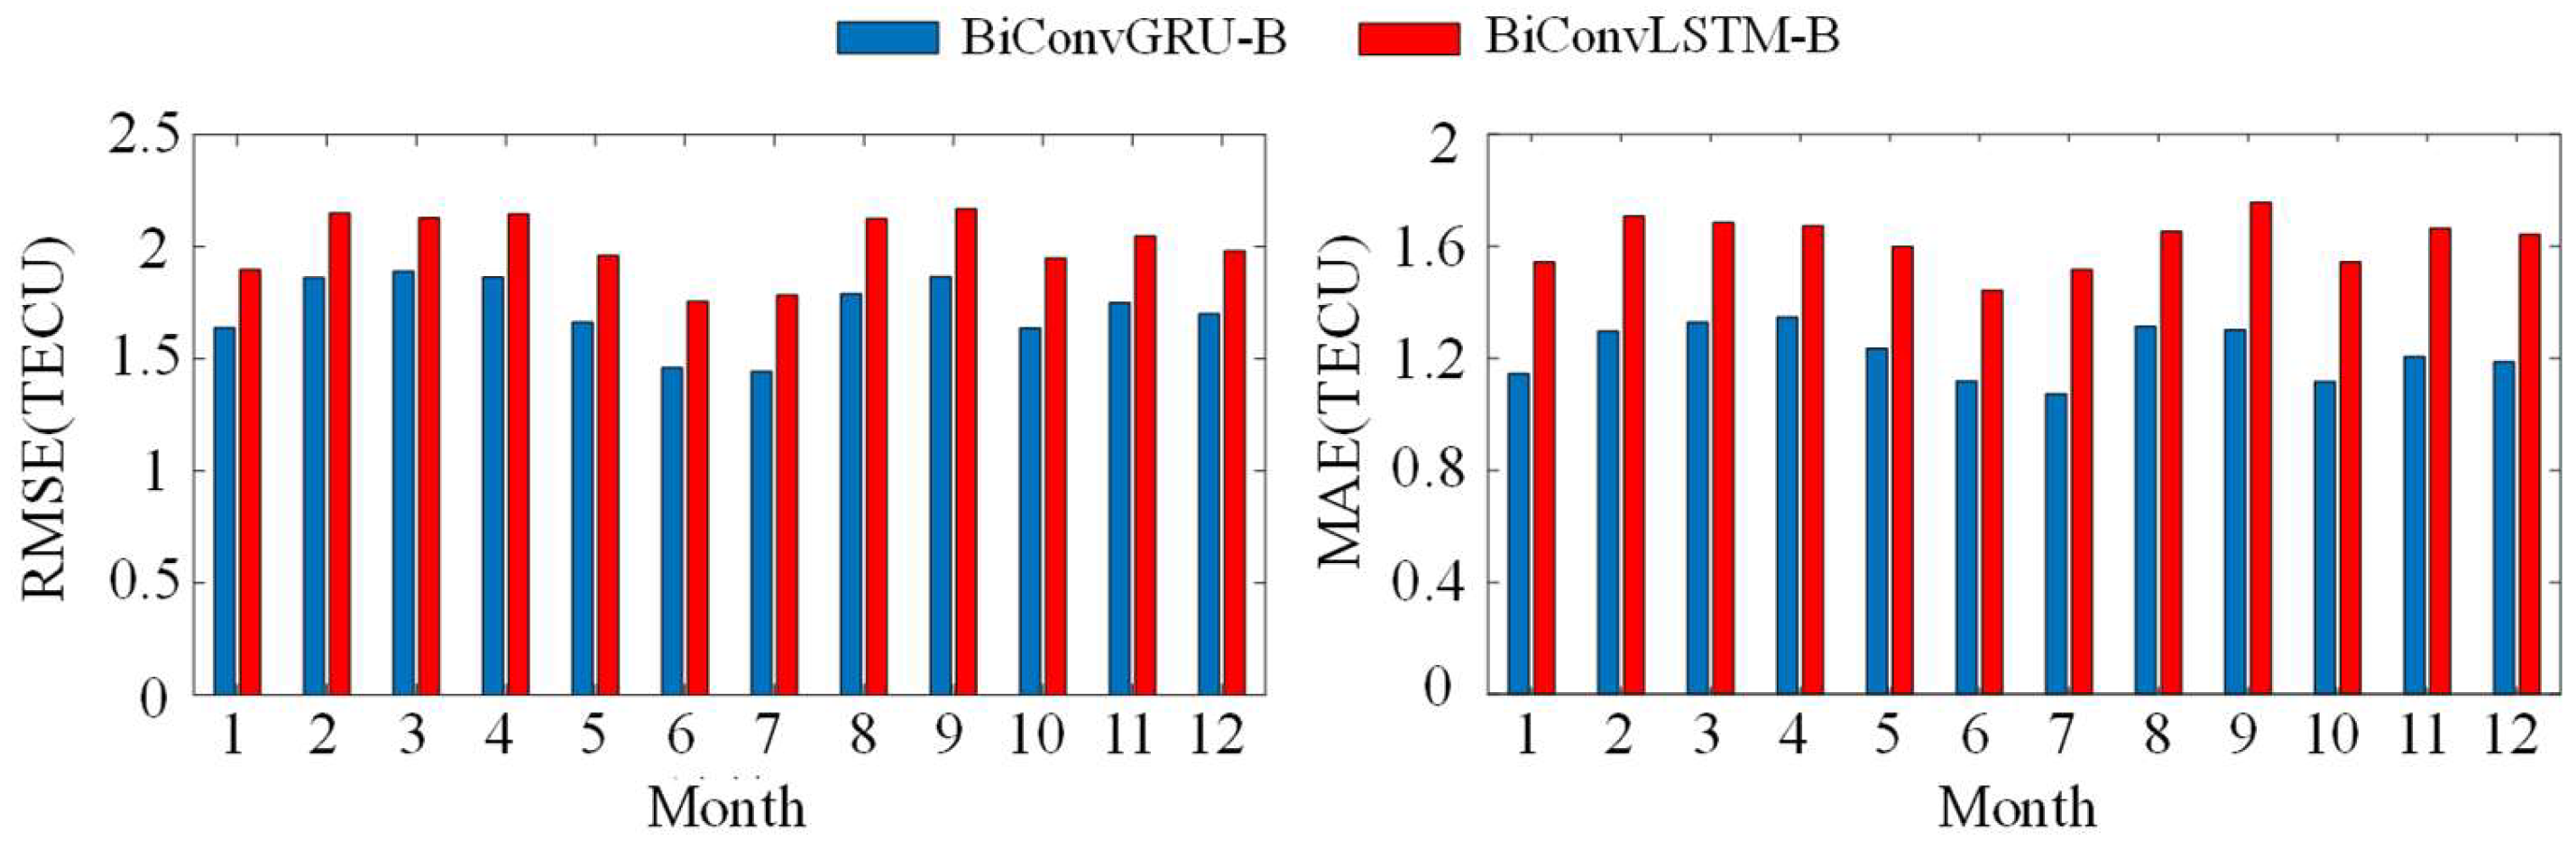
Figure 16 shows the comparative analysis of Root Mean Square Error (RMSE) for Total Electron Content (TEC) predictions between the BiConvLSTM-B and BiConvGRU-B models throughout the twelve months of 2018. It is evident that the BiConvGRU-B model consistently outperforms the BiConvLSTM-B model, exhibiting lower RMSE and Mean Absolute Error (MAE) values across all months. The most substantial improvement in RMSE is observed in July, with a remarkable decrease of 0.34 TECU, while the largest improvement in MAE is observed in November, with a significant decrease of 0.46 TECU. Over the entire year of 2018, the BiConvLSTM-B model demonstrated an RMSE of 2 TECU and an MAE of 1.62 TECU, whereas the BiConvGRU-B model achieved an RMSE of 1.71 TECU and an MAE of 1.22 TECU. Comparatively, the BiConvGRU-B model showed a notable reduction of 14.5% in RMSE and 24.7% in MAE compared to the BiConvLSTM-B model, thereby establishing its superiority in terms of accuracy and stability for long-term forecasting purposes.
Xia et al. [50] have proposed a method of calculating the RMSE and MAE between truth maps of the previous day and the future day as a baseline to analyze the models’ ability to learn the relationship between past TEC maps and future TEC maps. Using this method, we also calculated the RMSE and MAE between CRIMs of the previous day and the future day: the RMSE and MAE were 1.81 TECU and 1.17 TECU, respectively. The RMSE of the BiConvGRU-B model was 5.6% lower than that of the CRIMs, but the MAE was 4.3% higher than CRIMs’ MAE. However, the RMSE and MAE of the BiConvLSTM-B model was 10.5% and 38.5 higher than that of the CRIMs’ RMSE and MAE, respectively. The BiConvGRU-B model learned more of the relationship between past TEC maps and future TEC maps compared to the ConvBiLSTM model.
4. Conclusions
The primary objective of this study is to address the limitation of the traditional ConvGRU model in extracting correlations between the current and historical time steps. A novel approach named as BiConvGRU is introduced to forecast TEC over China. By incorporating a backward ConvGRU network into the existing forward ConvGRU network, the proposed model aims to improve the TEC forecasting specifically over the region of China. By analyzing TEC data throughout the year of 2018, the study gives the following conclusions:
- (1)
- The inclusion of geomagnetic activity and solar activity indices in the construction of the BiConvLSTM-B and BiConvGRU-B models is proved to be effective to improve the accuracy of TEC predictions during both calm and stormy periods, especially during stormy days. The BiConvGRU-B model, which incorporates these indices, demonstrates superior prediction accuracy compared to the ConvGRU model.
- (2)
- Through an examination of the RMSE variation across different longitudes for the BiConvGRU-B, BiConvLSTM-B, and IRI-2016 models at a constant latitude, it is evident that the overall RMSE decreases with increasing latitude, regardless of whether it is a calm or disturbed day. The BiConvGRU-B model outperformed both the BiConvLSTM-B model and the IRI-2016 model in terms of RMSE at different latitudes, demonstrating its superior forecasting capability.
- (3)
- A comprehensive comparison was made with the forecasted results of the BiConvLSTM-B, BiConvGRU-B, IRI-2016, and C1PG models, by interpolating TEC values at nine specific grid points in the Chinese region using the C1PG product provided by the CODE center. The results revealed that the BiConvGRU-B model performed better at a single grid point than the other three models, regardless of whether it was a calm or stormy day. Notably, the forecasting accuracy of the C1PG model was comparatively lower than that of the other models.
- (4)
- An examination of the cumulative frequency of MAE for the BiConvGRU and BiConvLSTM models over different seasons showed that the BiConvGRU-B model had a significantly higher percentage of MAE within the range of 0–1 TECU compared to the BiConvLSTM-B model. Moreover, throughout all four seasons, the BiConvGRU-B model had a consistently lower proportion of MAE over 2.5 TECU compared to the BiConvLSTM-B model.
- (5)
- The BiConvLSTM-B model had an RMSE of 2 TECU over the year of 2018, while the BiConvGRU-B model showed a lower RMSE of 1.71 TECU. Additionally, the BiConvGRU-B model performed better with lower RMSE values compared to the BiConvLSTM-B model in various geomagnetic conditions.
In conclusion, the BiConvGRU-B model proposed in this paper shows better forecasting accuracy compared to the BiConvLSTM-B model and the traditional ConvGRU-B model. It also outperforms both the IRI-2016 model and the C1PG model. However, its accuracy depends heavily on the reliability of the provided TEC data in the first 24 h for application in real-time forecasting. In addition, although the temporal resolution of the GIM from CODE and the CRIM was improved to 1 h in this study, the equatorial plasma bubbles had not yet been extracted from the ionospheric maps because they occurred in a relatively short period; therefore, the temporal resolution of the ionospheric maps should be further improved in future studies.
Author Contributions
J.T. and Z.Z. conceived and designed the experiments; J.T. and Z.Z. performed the experiments; Z.Z. wrote the paper; J.H. analyzed the data; J.T. and X.W. revised the paper. All authors have read and agreed to the published version of the manuscript.
Funding
This research is supported by the National Natural Science Foundation of China (NO. 42261074).
Data Availability Statement
GIM IONEX data files are used from CODE (ftp://ftp.aiub.unibe.ch/CODE/ (accessed on 20 December 2022)). The IRI-2016 data can be downloaded from the IRI official website (http://www.irimodel.org (accessed on 20 December 2022)).
Acknowledgments
The authors acknowledge the Crustal Movement Observation Network of China (CMONOC) for providing GNSS data, the Centre for Orbit Determination in Europe (CODE) for making available ionospheric products, the GSFC/SPDF OMNIWeb for providing the geomagnetic and solar activity data, and the IRI Working group for providing IRI-2016 codes. They would also like to thank the anonymous reviewers for their constructive comments in improving this paper.
Conflicts of Interest
The authors declare no conflict of interest.
References
- Klobuchar, J.A. Ionospheric time-delay algorithm for single-frequency GPS users. IEEE Trans. Aerosp. Elec. Syst. 1987, 23, 325–331. [Google Scholar] [CrossRef]
- Meza, A.M.; Brunini, C.A.; Bosch, W.; VanZele, M.A. Comparing vertical total electron content from GPS, Bent and IRI models with TOPEX-Poseidon. Adv. Space Res. 2002, 30, 401–406. [Google Scholar] [CrossRef]
- Bilitza, D.; Altadill, D.; Truhlik, V.; Shubin, V.; Galkin, I.; Reinisch, B.; Huang, X. International reference ionosphere 2016: From ionospheric climate to real-time weather predictions. Space Weather 2017, 15, 418–429. [Google Scholar] [CrossRef]
- Nava, B.; Coisson, P.; Radicella, S.M. A new version of the NeQuick ionosphere electron density model. J. Atmos. Sol. Terr. Phys. 2008, 70, 1856–1862. [Google Scholar] [CrossRef]
- Yuan, Y.; Wang, N.; Li, Z.; Huo, X. The BeiDou global broadcast ionospheric delay correction model (BDGIM) and its preliminary performance evaluation result. Navigation 2019, 66, 55–69. [Google Scholar] [CrossRef] [Green Version]
- Tang, J.; Li, Y.; Ding, M.; Liu, H.; Yang, D.; Wu, X. An ionospheric TEC forecasting model based on a CNN-LSTM-Attention mechanism neural network. Remote Sens. 2022, 14, 2433. [Google Scholar] [CrossRef]
- García-Rigo, A.; Monte, E.; Hernández-Pajares, M.; Juan, J.M.; Sanz, J.; Aragón-Angel, A.; Salazar, D. Global prediction of the vertical total electron content of the ionosphere based on GPS data. Radio Sci. 2011, 46, RS0D25. [Google Scholar] [CrossRef] [Green Version]
- Roma-Dollase, D.; Hernández-Pajares, M.; Krankowski, A.; Kotulak, K.; Ghoddusi-Fard, R.; Yuan, Y.; Li, Z.; Zhang, H.; Shi, C.; Wang, C.; et al. Consistency of seven different GNSS global ionospheric mapping techniques during one solar cycle. J. Geod. 2018, 92, 691–706. [Google Scholar] [CrossRef] [Green Version]
- Wang, C.; Xue, K.; Wang, Z.; Shi, C.; Fan, L.; Zhang, T. Global ionospheric maps forecasting based on an adaptive autoregressive modeling of grid point VTEC values. Astrophys. Space Sci. 2020, 365, 48. [Google Scholar] [CrossRef]
- Krankowski, A.; Kosek, W.; Baran, L.W.; Popinski, W. Wavelet analysis and forecasting of VTEC obtained with GPS observations over European latitudes. J. Atmos. Sol. Terr. Phys. 2005, 67, 1147–1156. [Google Scholar] [CrossRef]
- Wang, C.; Xin, S.; Liu, X.; Shi, C.; Fan, L. Prediction of global ionospheric VTEC maps using an adaptive autoregressive model. Earth Planets Space 2018, 70, 18. [Google Scholar] [CrossRef] [Green Version]
- Ratnam, D.V.; Otsuka, Y.; Sivavaraprasad, G.; Dabbakuti, J.R.K.K. Development of multivariate ionospheric TEC forecasting algorithm using linear time series model and ARMA over low-latitude GNSS station. Adv. Space Res. 2019, 63, 2848–2856. [Google Scholar] [CrossRef]
- Tang, R.; Zeng, F.; Chen, Z.; Wang, J.; Huang, C.; Wu, Z. The comparison of predicting storm-time ionospheric TEC by three methods: ARIMA, LSTM, and Seq2Seq. Atmosphere 2020, 11, 316. [Google Scholar] [CrossRef] [Green Version]
- Li, Q.; Yang, D.; Fang, H. Two hours ahead prediction of the TEC over China using a deep learning method. Universe 2022, 8, 405. [Google Scholar] [CrossRef]
- Liu, L.; Morton, Y.; Liu, Y. ML prediction of global ionospheric TEC maps. Space Weather 2022, 20, e2022SW003135. [Google Scholar] [CrossRef]
- Chen, Z.; Liao, W.; Li, H.; Wang, J.; Deng, X.; Hong, S. Prediction of global ionospheric TEC based on deep learning. Space Weather 2022, 20, e2021SW002854. [Google Scholar] [CrossRef]
- Tang, J.; Li, Y.; Yang, D.; Ding, M. An approach for predicting global ionospheric TEC using machine learning. Remote Sens. 2022, 14, 1585. [Google Scholar] [CrossRef]
- Ren, X.; Yang, P.; Liu, H.; Chen, J.; Liu, W. Deep learning for global ionospheric TEC forecasting: Different approaches and validation. Space Weather 2022, 20, e2021SW003011. [Google Scholar] [CrossRef]
- Xia, G.; Zhang, F.; Wang, C.; Zhou, C. ED-ConvLSTM: A novel global ionospheric total electron content medium-term forecast model. Space Weather 2022, 20, e2021SW002959. [Google Scholar] [CrossRef]
- Rajana, S.S.K.; Shrungeshwara, T.S.; Vivek, C.G.; Panda, S.K.; Jade, S. Evaluation of long-term variability of ionospheric total electron content from IRI-2016 model over the Indian sub-continent with a latitudinal chain of dual-frequency geodetic GPS observations during 2002 to 2019. Adv. Space Res. 2022, 69, 2111–2125. [Google Scholar] [CrossRef]
- Chung, J.; Gulcehre, C.; Cho, K.; Bengio, Y. Empirical evaluation of gated recurrent neural networks on sequence modeling. arXiv 2014, arXiv:1412.3555. [Google Scholar]
- Iluore, K.; Lu, J. Long short-term memory and gated recurrent neural networks to predict the ionospheric vertical total electron content. Adv. Space Res. 2022, 70, 652–665. [Google Scholar] [CrossRef]
- Lei, D.; Liu, H.; Le, H.; Huang, J.; Yuan, J.; Li, L.; Wang, Y. Ionospheric TEC Prediction Base on Attentional BiGRU. Atmosphere 2022, 13, 1039. [Google Scholar] [CrossRef]
- Liu, L.; Zou, S.; Yao, Y.; Wang, Z. Forecasting Global Ionospheric TEC Using Deep Learning Approach. Space Weather 2020, 18, e2020SW002501. [Google Scholar] [CrossRef]
- Zhu, F.; Yang, J.; Qing, Y.; Li, X. Assessment and analysis of the global ionosphere maps over China based on CMONOC GNSS data. Front. Earth Sci. 2023, 11, 1095754. [Google Scholar] [CrossRef]
- Jeong, S.; Lee, W.K.; Jang, S.; Kil, H.; Kim, J.; Kwak, Y.; Kim, Y.H.; Hong, J.; Choi, B. Reconstruction of the regional total electron content maps over the Korean Peninsula using deep convolutional generative adversarial network and Poisson blending. Space Weather 2022, 20, e2022SW003131. [Google Scholar] [CrossRef]
- Ping, J.; Kono, Y.; Matsumoto, K.; Otsuka, Y.; Saito, A.; Shum, C.; Heki, K.; Kawano, N. Regional ionosphere map over Japanese Islands. Earth Planets Space 2002, 54, e13–e16. [Google Scholar] [CrossRef] [Green Version]
- Harsha, P.; Ratnam, D. Generation of regional ionospheric TEC maps with EIA nowcasting/forecasting capability during geomagnetic storm conditions. IEEE Access 2020, 8, 57879–57890. [Google Scholar] [CrossRef]
- Sivakrishna, K.; Ratnam, D.; Sivavaraprasad, G. A bidirectional deep-learning algorithm to forecast regional ionospheric TEC maps. J. Sel. Top. Appl. Earth Obs. Remote Sens. 2022, 15, 4531–4543. [Google Scholar] [CrossRef]
- Charoenkalunyuta, T.; Satirapod, C. Effect of Thai ionospheric maps (THIM) model on the performance of network based RTK GPS in Thailand. Surv. Rev. 2014, 46, 1–6. [Google Scholar] [CrossRef]
- Okoh, D.; Mckinnell, L.; Cilliers, P. Developing an ionospheric map for south Africa. Ann. Geophys. 2010, 28, 1431–1439. [Google Scholar] [CrossRef] [Green Version]
- Wen, Z.; Li, S.; Li, L.; Wu, B.; Fu, J. Ionospheric TEC prediction using long short-term memory deep learning network. Astrophys. Space Sci. 2021, 366, 3. [Google Scholar] [CrossRef]
- Han, Y.; Wang, L.; Fu, W.; Zhou, H.; Li, T.; Chen, R. Machine learning-based short-term GPS TEC forecasting during high Solar activity and magnetic storm periods. J. Sel. Top. Appl. Earth Obs. Remote Sens. 2022, 15, 115–126. [Google Scholar] [CrossRef]
- Kaselimi, M.; Voulodimos, A.; Doulamis, N.; Doulamis, A.; Delikaraoglou, D. A causal long short-term memory sequence to sequence model for TEC prediction using GNSS observations. Remote Sens. 2020, 12, 1354. [Google Scholar] [CrossRef]
- Natras, R.; Soja, B.; Schmidt, M. Ensemble machine learning of random forest, AdaBoost and XGBoost for vertical total electron content forecasting. Remote Sens. 2022, 14, 3547. [Google Scholar] [CrossRef]
- Elman, J.L. Finding structure in time. Cogn. Sci. 1990, 14, 179–211. [Google Scholar] [CrossRef]
- Hochreiter, S.; Schmidhuber, J. Long short-term memory. Neural. Comput. 1997, 8, 1735–1780. [Google Scholar] [CrossRef]
- Cho, K.; Merrienboer, B.v.; Gulcehre, C.; Bahdanau, D.; Bougares, F.; Schwenk, H.; Bengio, Y. Learning phrase representations using RNN encoder-decoder for statistical machine translation. arXiv 2014, arXiv:1406.1078. [Google Scholar]
- Shi, X.; Chen, Z.; Wang, H.; Yeung, D.Y.; Wong, W.k.; Woo, W.c. Convolutional LSTM network: A machine learning approach for precipitation nowcasting. arXiv 2015, arXiv:1506.04214. [Google Scholar]
- Shi, X.; Gao, Z.; Lausen, L.; Wang, H.; Yeung, D.Y.; Wong, W.K.; Woo, W.C. Deep learning for precipitation nowcasting: A benchmark and a new model. arXiv 2017, arXiv:1706.03458. [Google Scholar]
- Gao, X.; Yao, Y. A storm-time ionospheric TEC model with multichannel features by the spatiotemporal ConvLSTM network. J. Geod. 2023, 97, 9. [Google Scholar] [CrossRef]
- Kumar, A.; Abirami, S.; Trueman, T.E.; Cambria, E. Comment toxicity detection via a multichannel convolutional bidirectional gated recurrent unit. Neurocomputing 2021, 441, 272–278. [Google Scholar] [CrossRef]
- Liu, J.; Chen, R.; Heidi, K.; Wang, Z.; Zhang, H.; Jian, J. A preliminary study on mapping the regional ionospheric TEC using a spherical cap harmonic model in high latitudes and the arctic region. J. Global Positioning Syst. 2010, 9, 22–32. [Google Scholar] [CrossRef]
- Liu, J.; Chen, R.; Wang, Z.; Zhang, H. Spherical cap harmonic model for mapping and predicting regional TEC. GPS Solut. 2011, 15, 109–119. [Google Scholar] [CrossRef]
- Yuan, Y.; Li, Z.; Wang, N.; Zhang, B.; Li, H.; Li, M.; Huo, X.; Ou, J. Monitoring the ionosphere based on the crustal movement observation network of China. Geod. Geodyn. 2015, 6, 73–80. [Google Scholar] [CrossRef] [Green Version]
- Chen, J.; Zhi, N.; Liao, H.; Lu, M.; Feng, S. Global forecasting of ionospheric vertical total electron contents via ConvLSTM with spectrum analysis. GPS Solut. 2022, 26, 69. [Google Scholar] [CrossRef]
- Loewe, C.; Prölss, G. Classification and mean behavior of magnetic storms. J. Geophys. Res. 1997, 102, 14209–14213. [Google Scholar] [CrossRef]
- Xia, G.; Liu, Y.; Wei, T.; Wang, Z.; Huang, W.; Du, Z.; Zhou, C. Ionospheric TEC forecast model based on support vector machine with GPU acceleration in the China region. Adv. Space Res. 2021, 68, 1377–1389. [Google Scholar] [CrossRef]
- Shi, S.; Zhang, K.; Wu, S.; Shi, J.; Hu, A.; Wu, H.; Li, Y. An investigation of ionospheric TEC prediction maps over China using bidirectional long short-term memory method. Space Weather 2022, 20, e2022SW003103. [Google Scholar] [CrossRef]
- Xia, G.; Liu, M.; Zhang, F.; Zhou, C. CAiTST: Conv-attentional image time sequence transformer for ionospheric TEC maps forecast. Remote Sens. 2022, 14, 4223. [Google Scholar] [CrossRef]
Figure 1.
The structure of ConvLSTM and ConvGRU neural networks. (a) ConvLSTM; (b) ConvGRU.
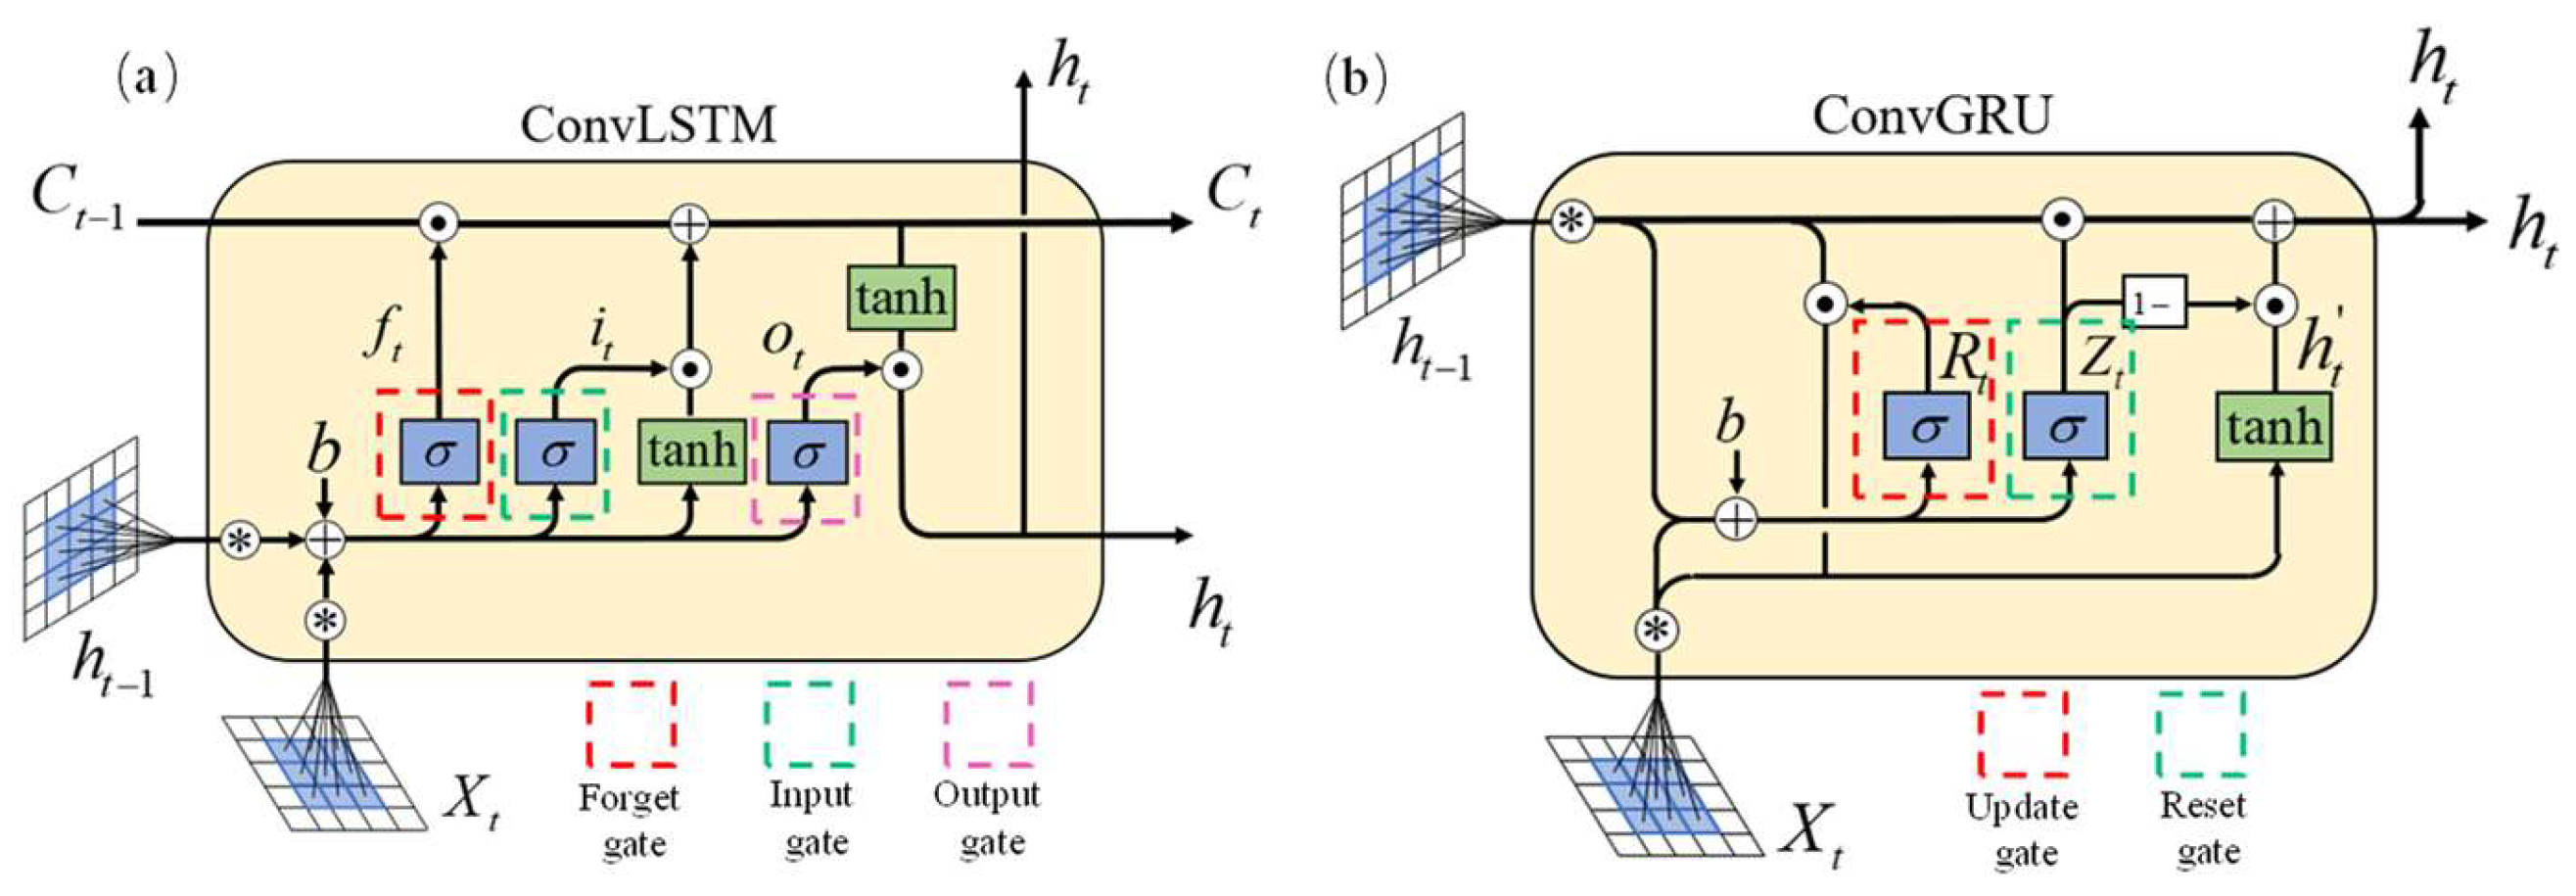
Figure 2.
The structure of BiConvGRU neural network.
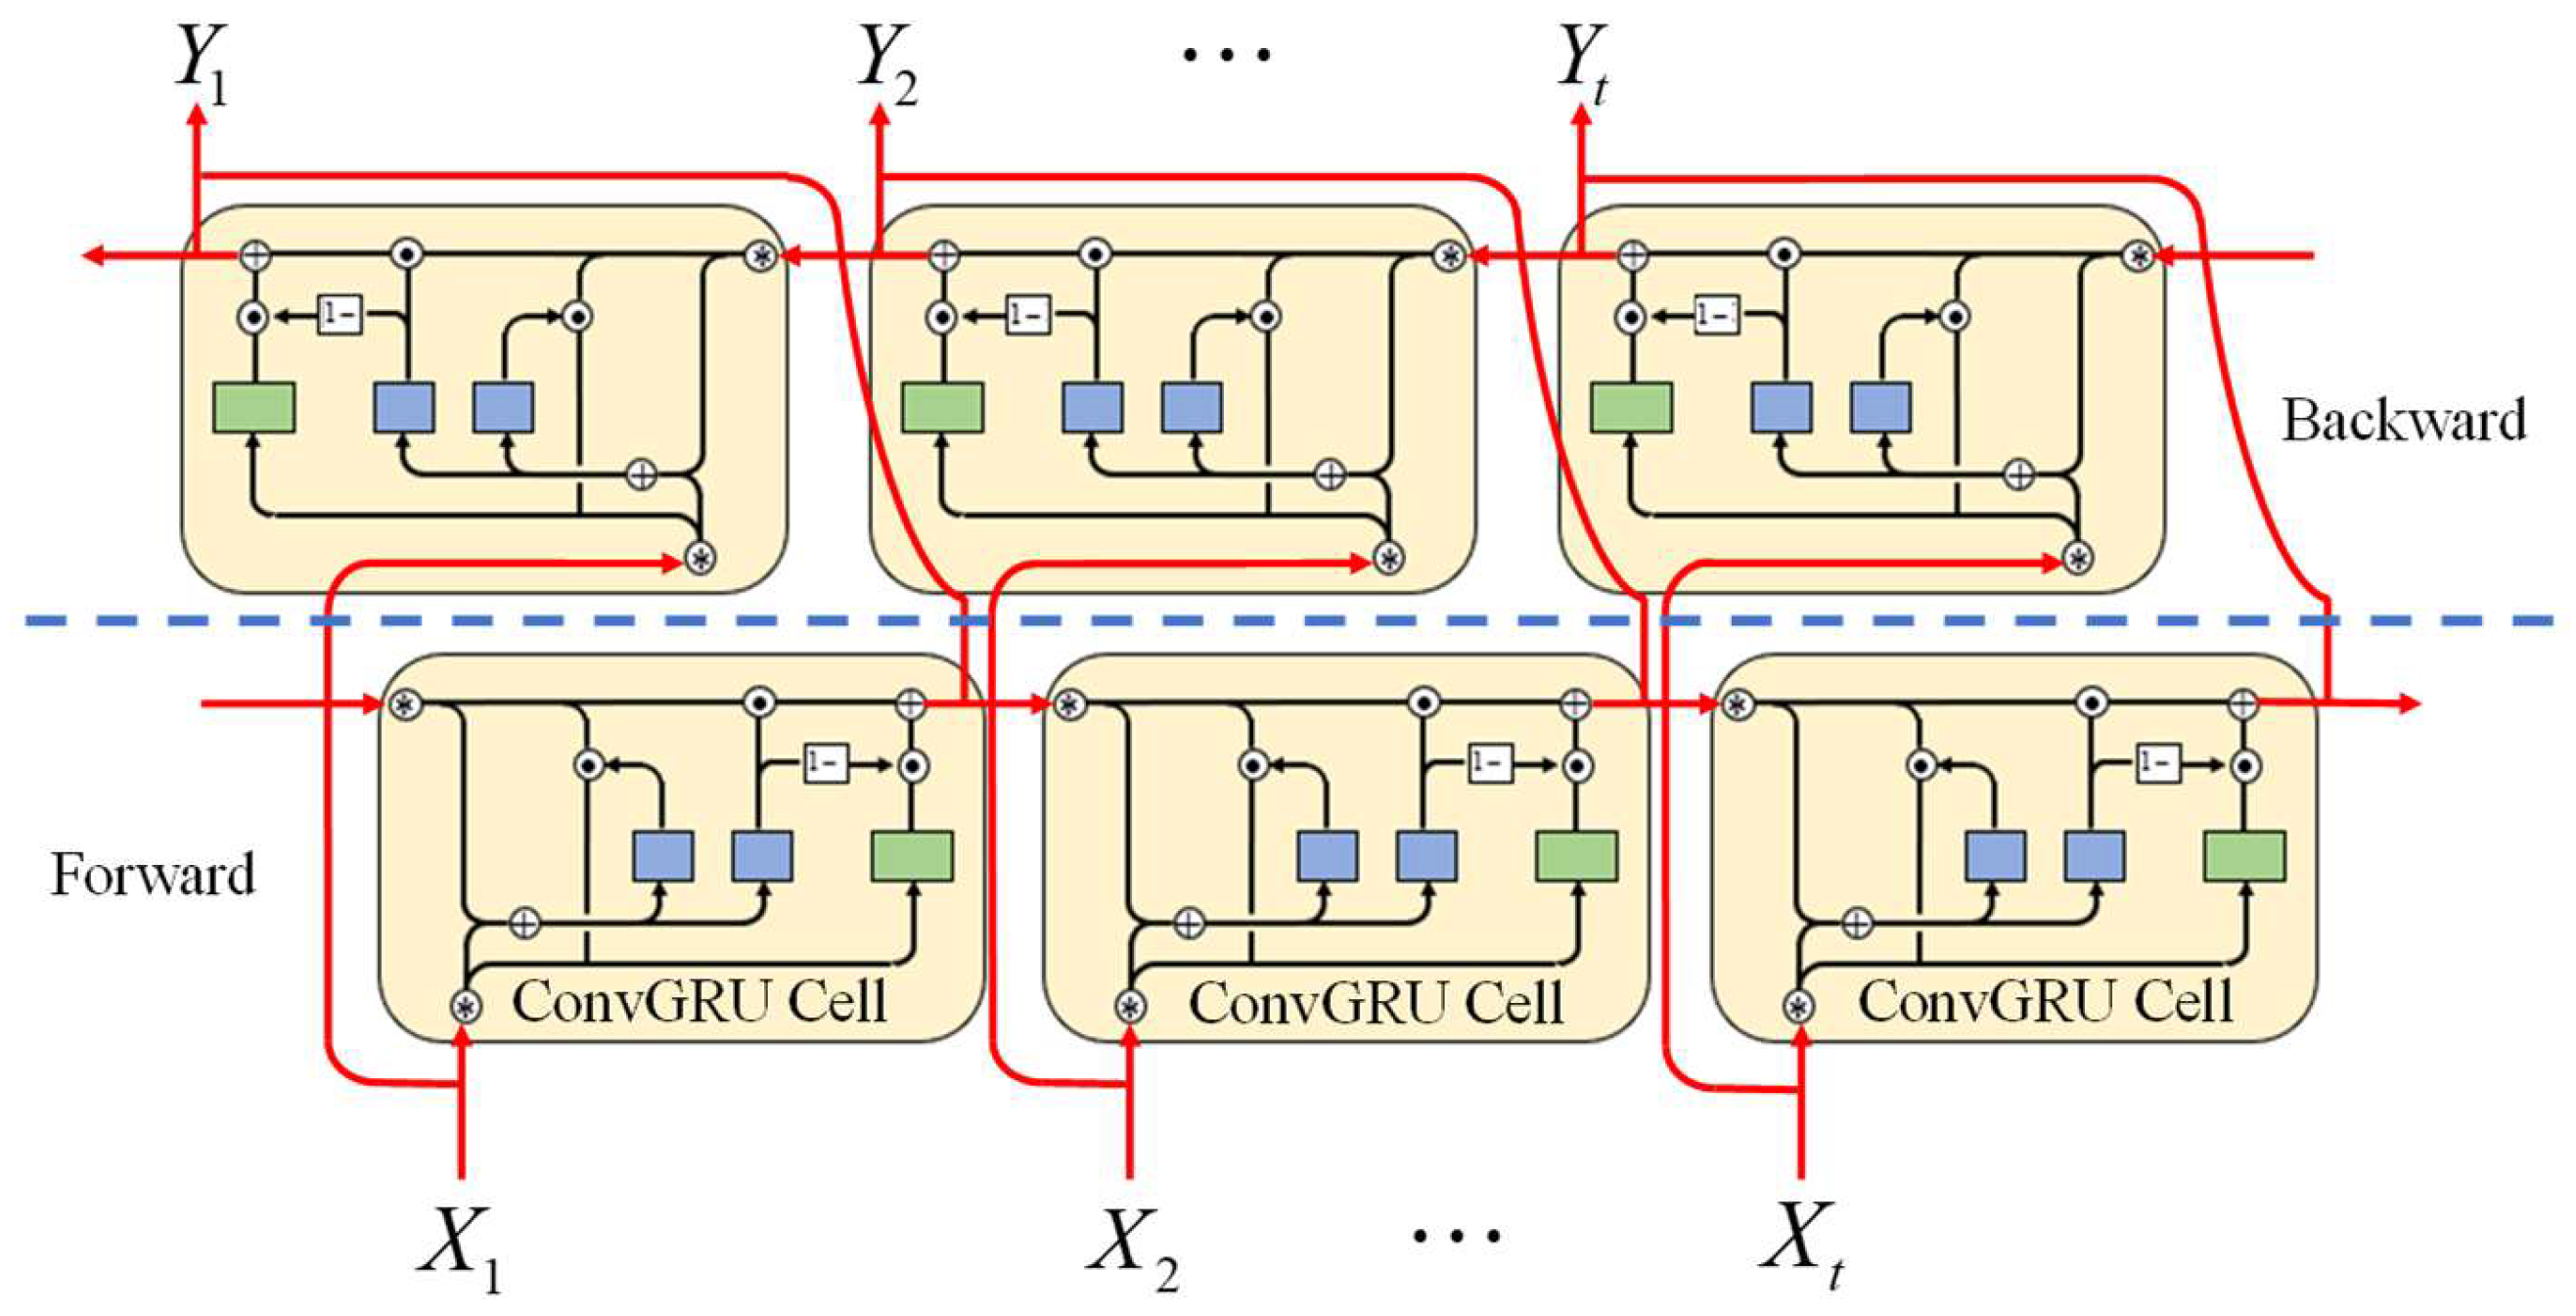
Figure 3.
The structure of Encoder–Decoder BiConvGRU network.

Figure 4.
Geomagnetic activity index and solar activity index (DOY 231–240) in 2018 (a) Kp; (b) ap; (c) Dst; (d) F10.7.
Figure 4.
Geomagnetic activity index and solar activity index (DOY 231–240) in 2018 (a) Kp; (b) ap; (c) Dst; (d) F10.7.
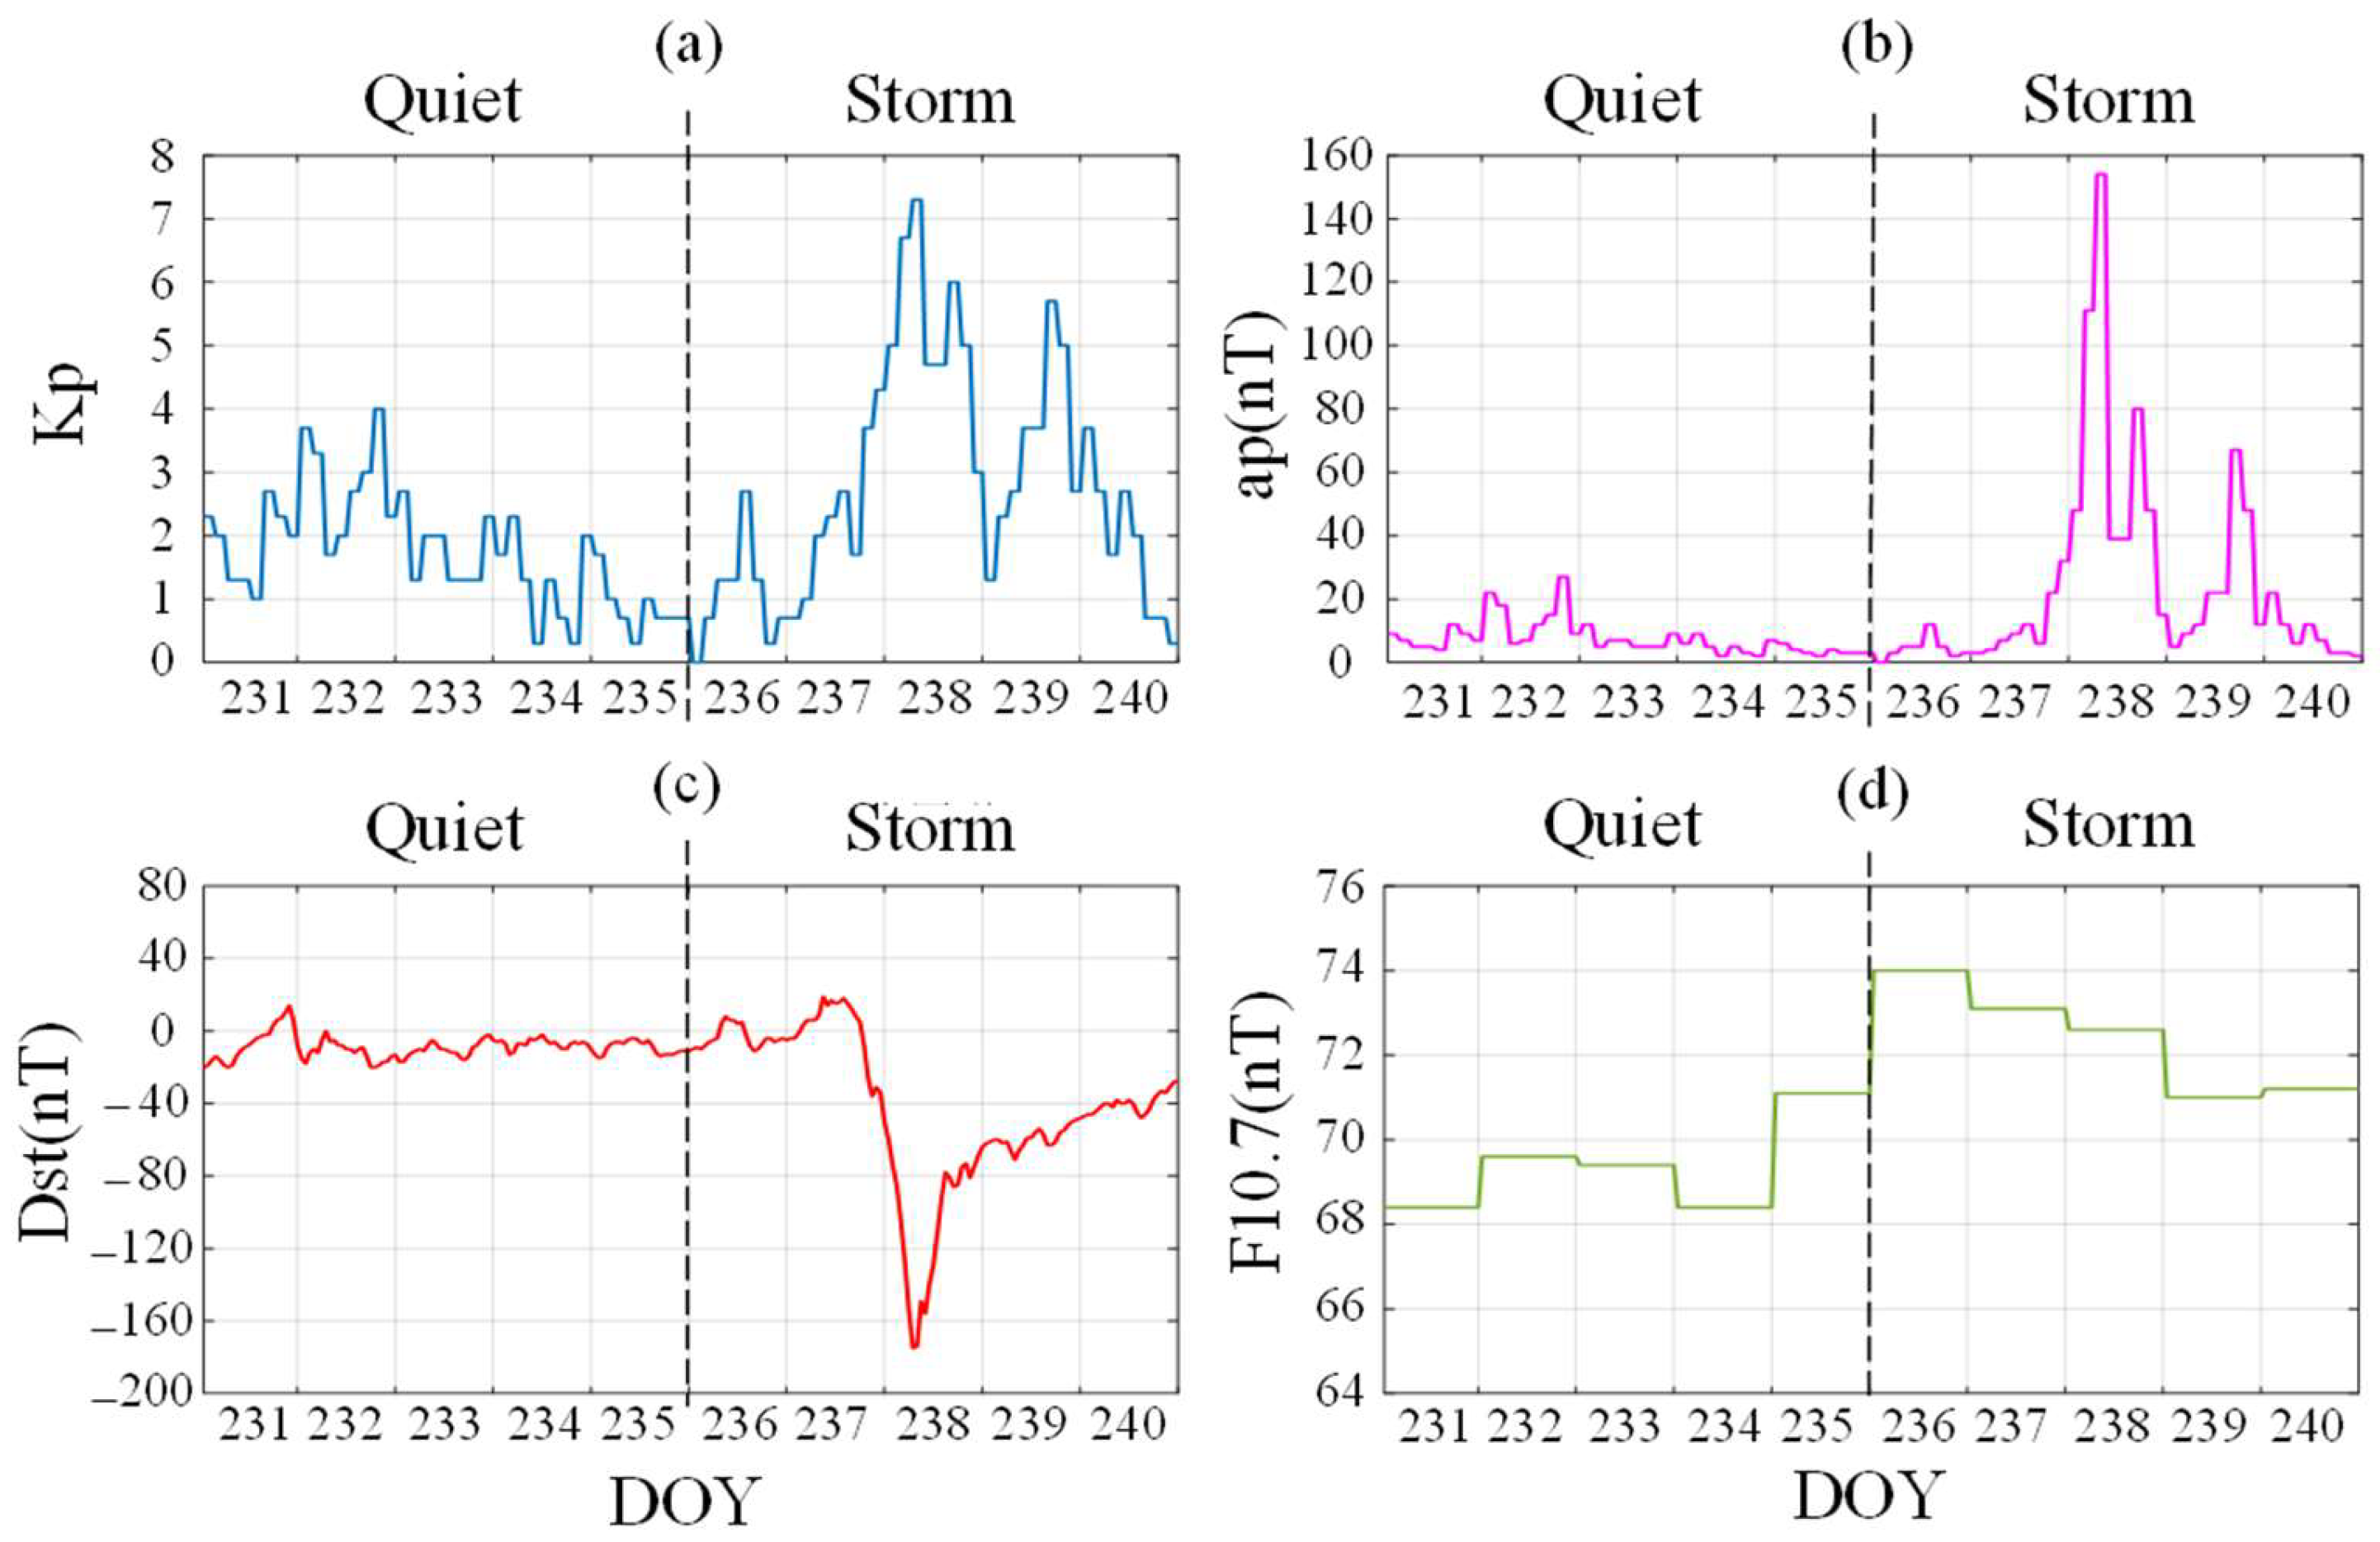
Figure 5.
Comparison of CRIM TEC and the predicted TEC of different models at different times of DOY 233.
Figure 5.
Comparison of CRIM TEC and the predicted TEC of different models at different times of DOY 233.
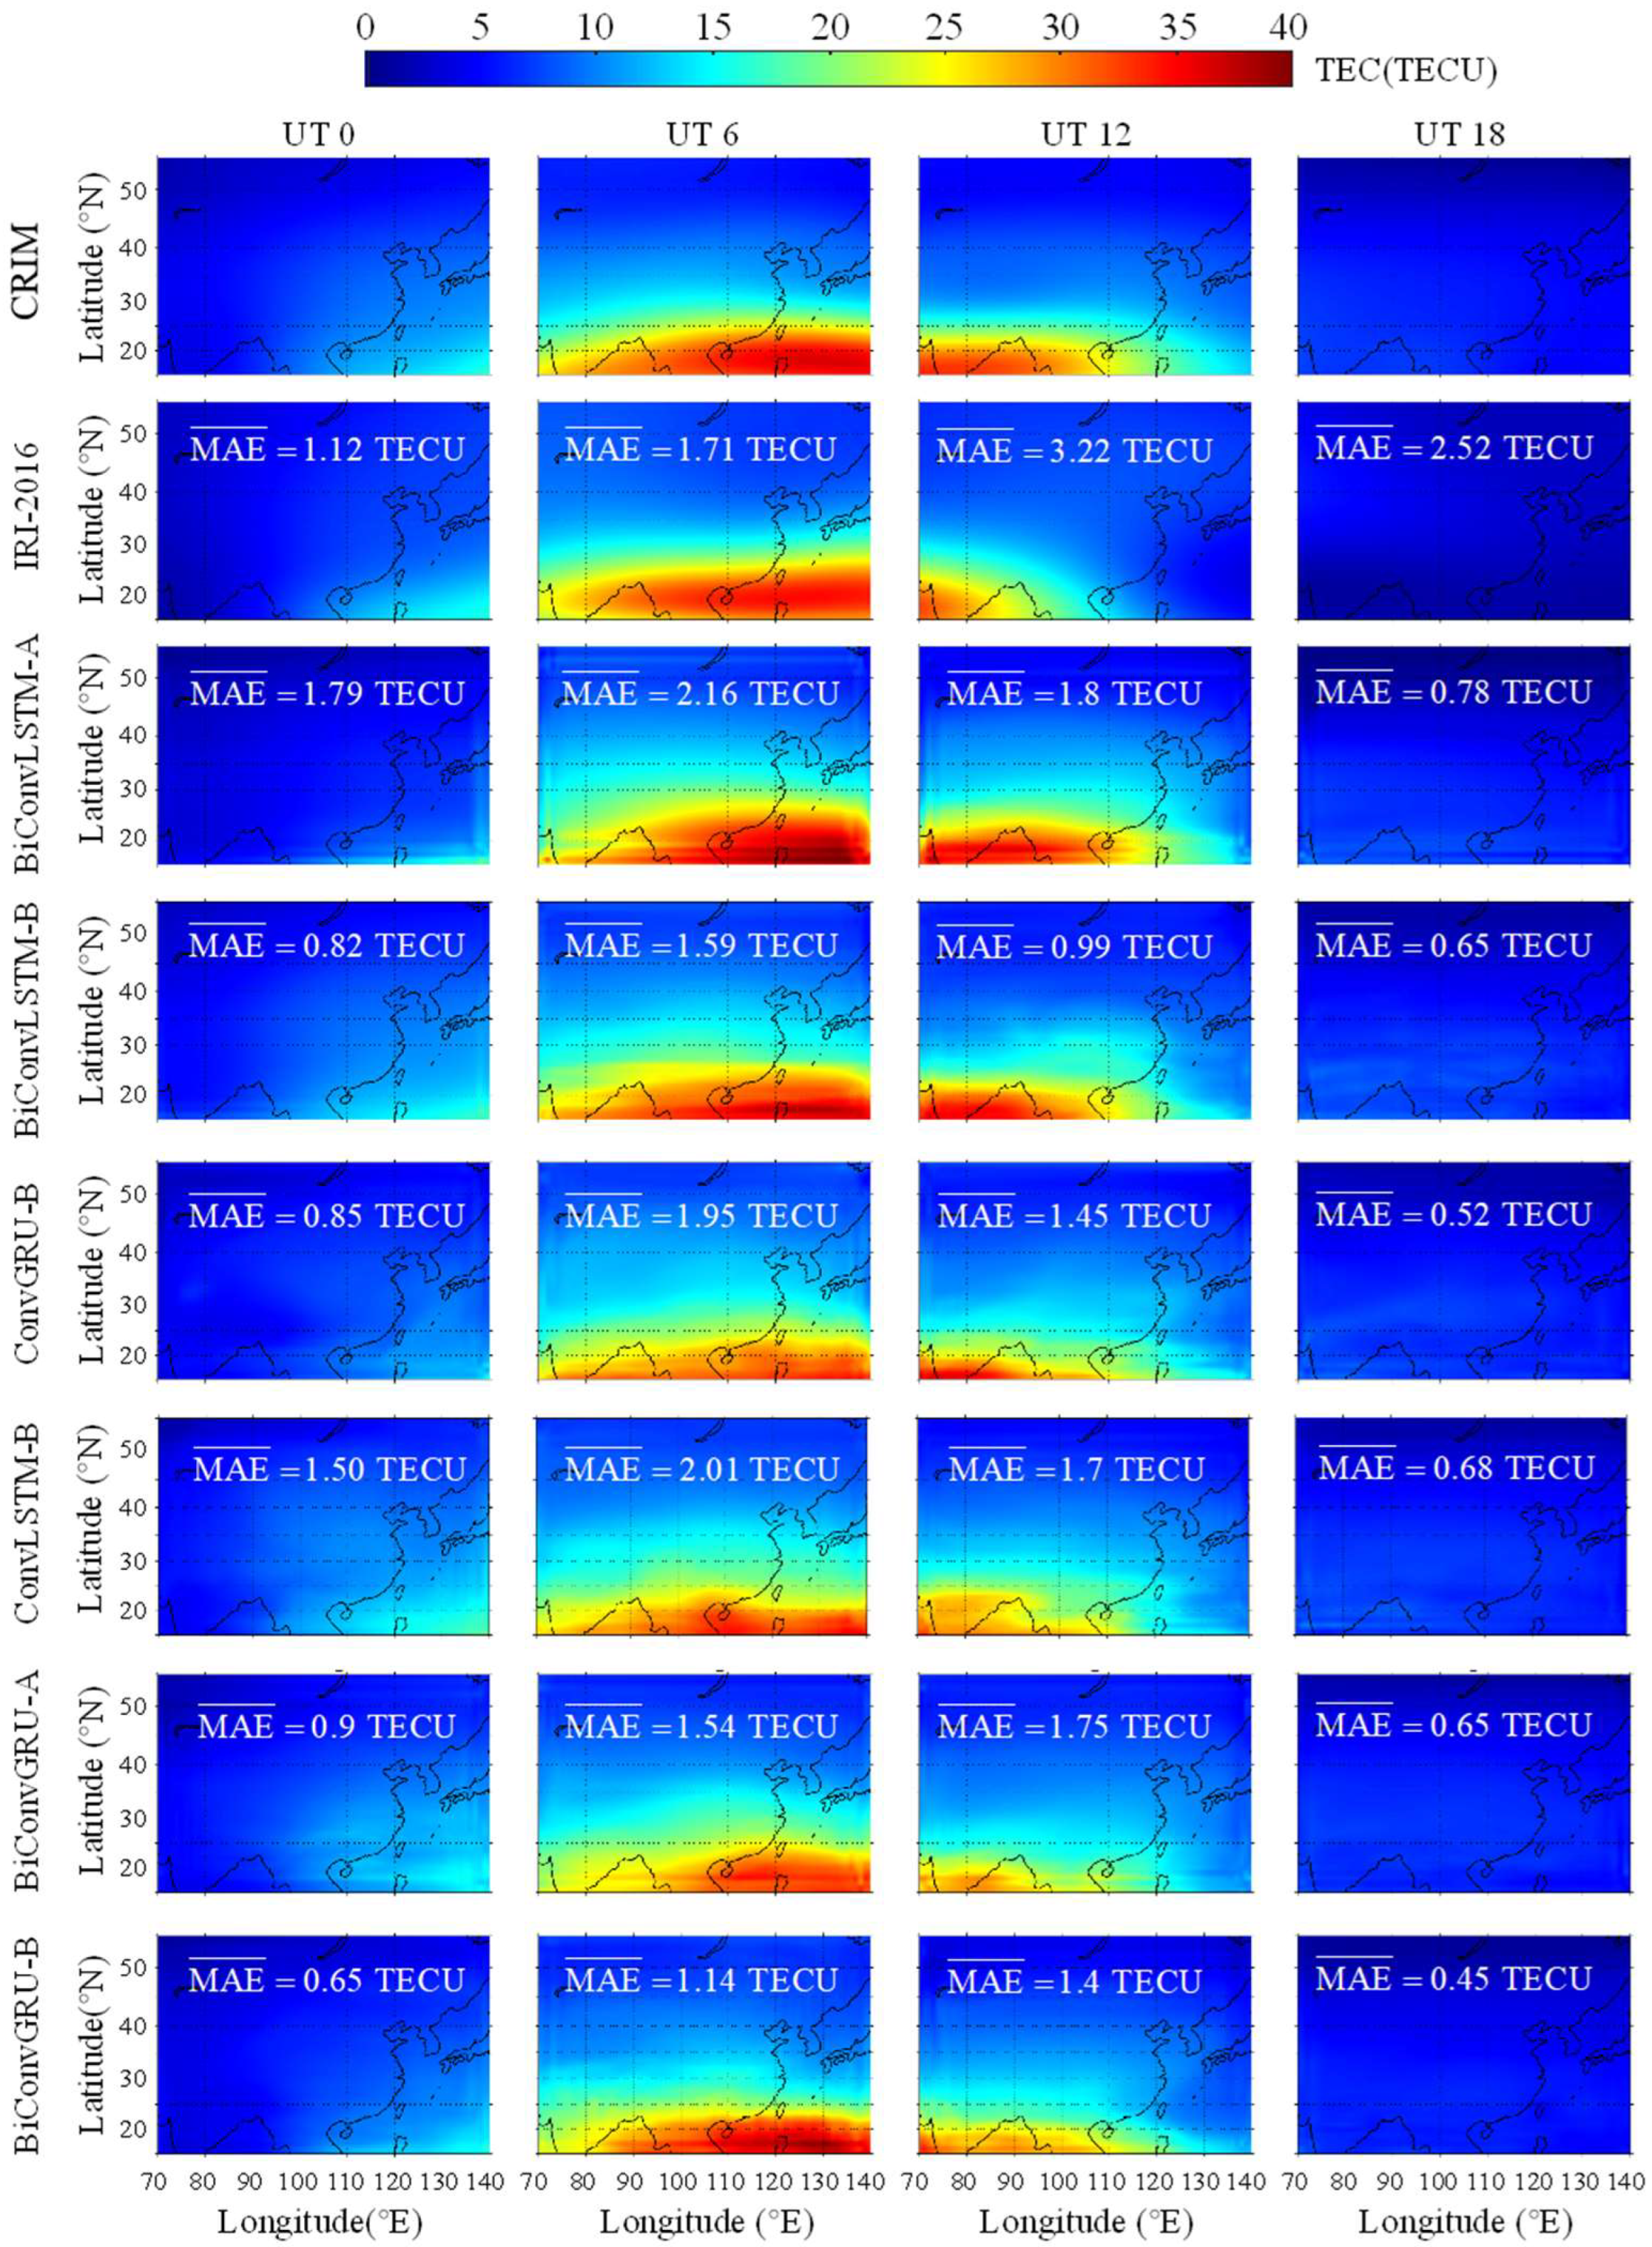
Figure 6.
Error histogram for different models at UT 6 and UT 12 on DOY 233.
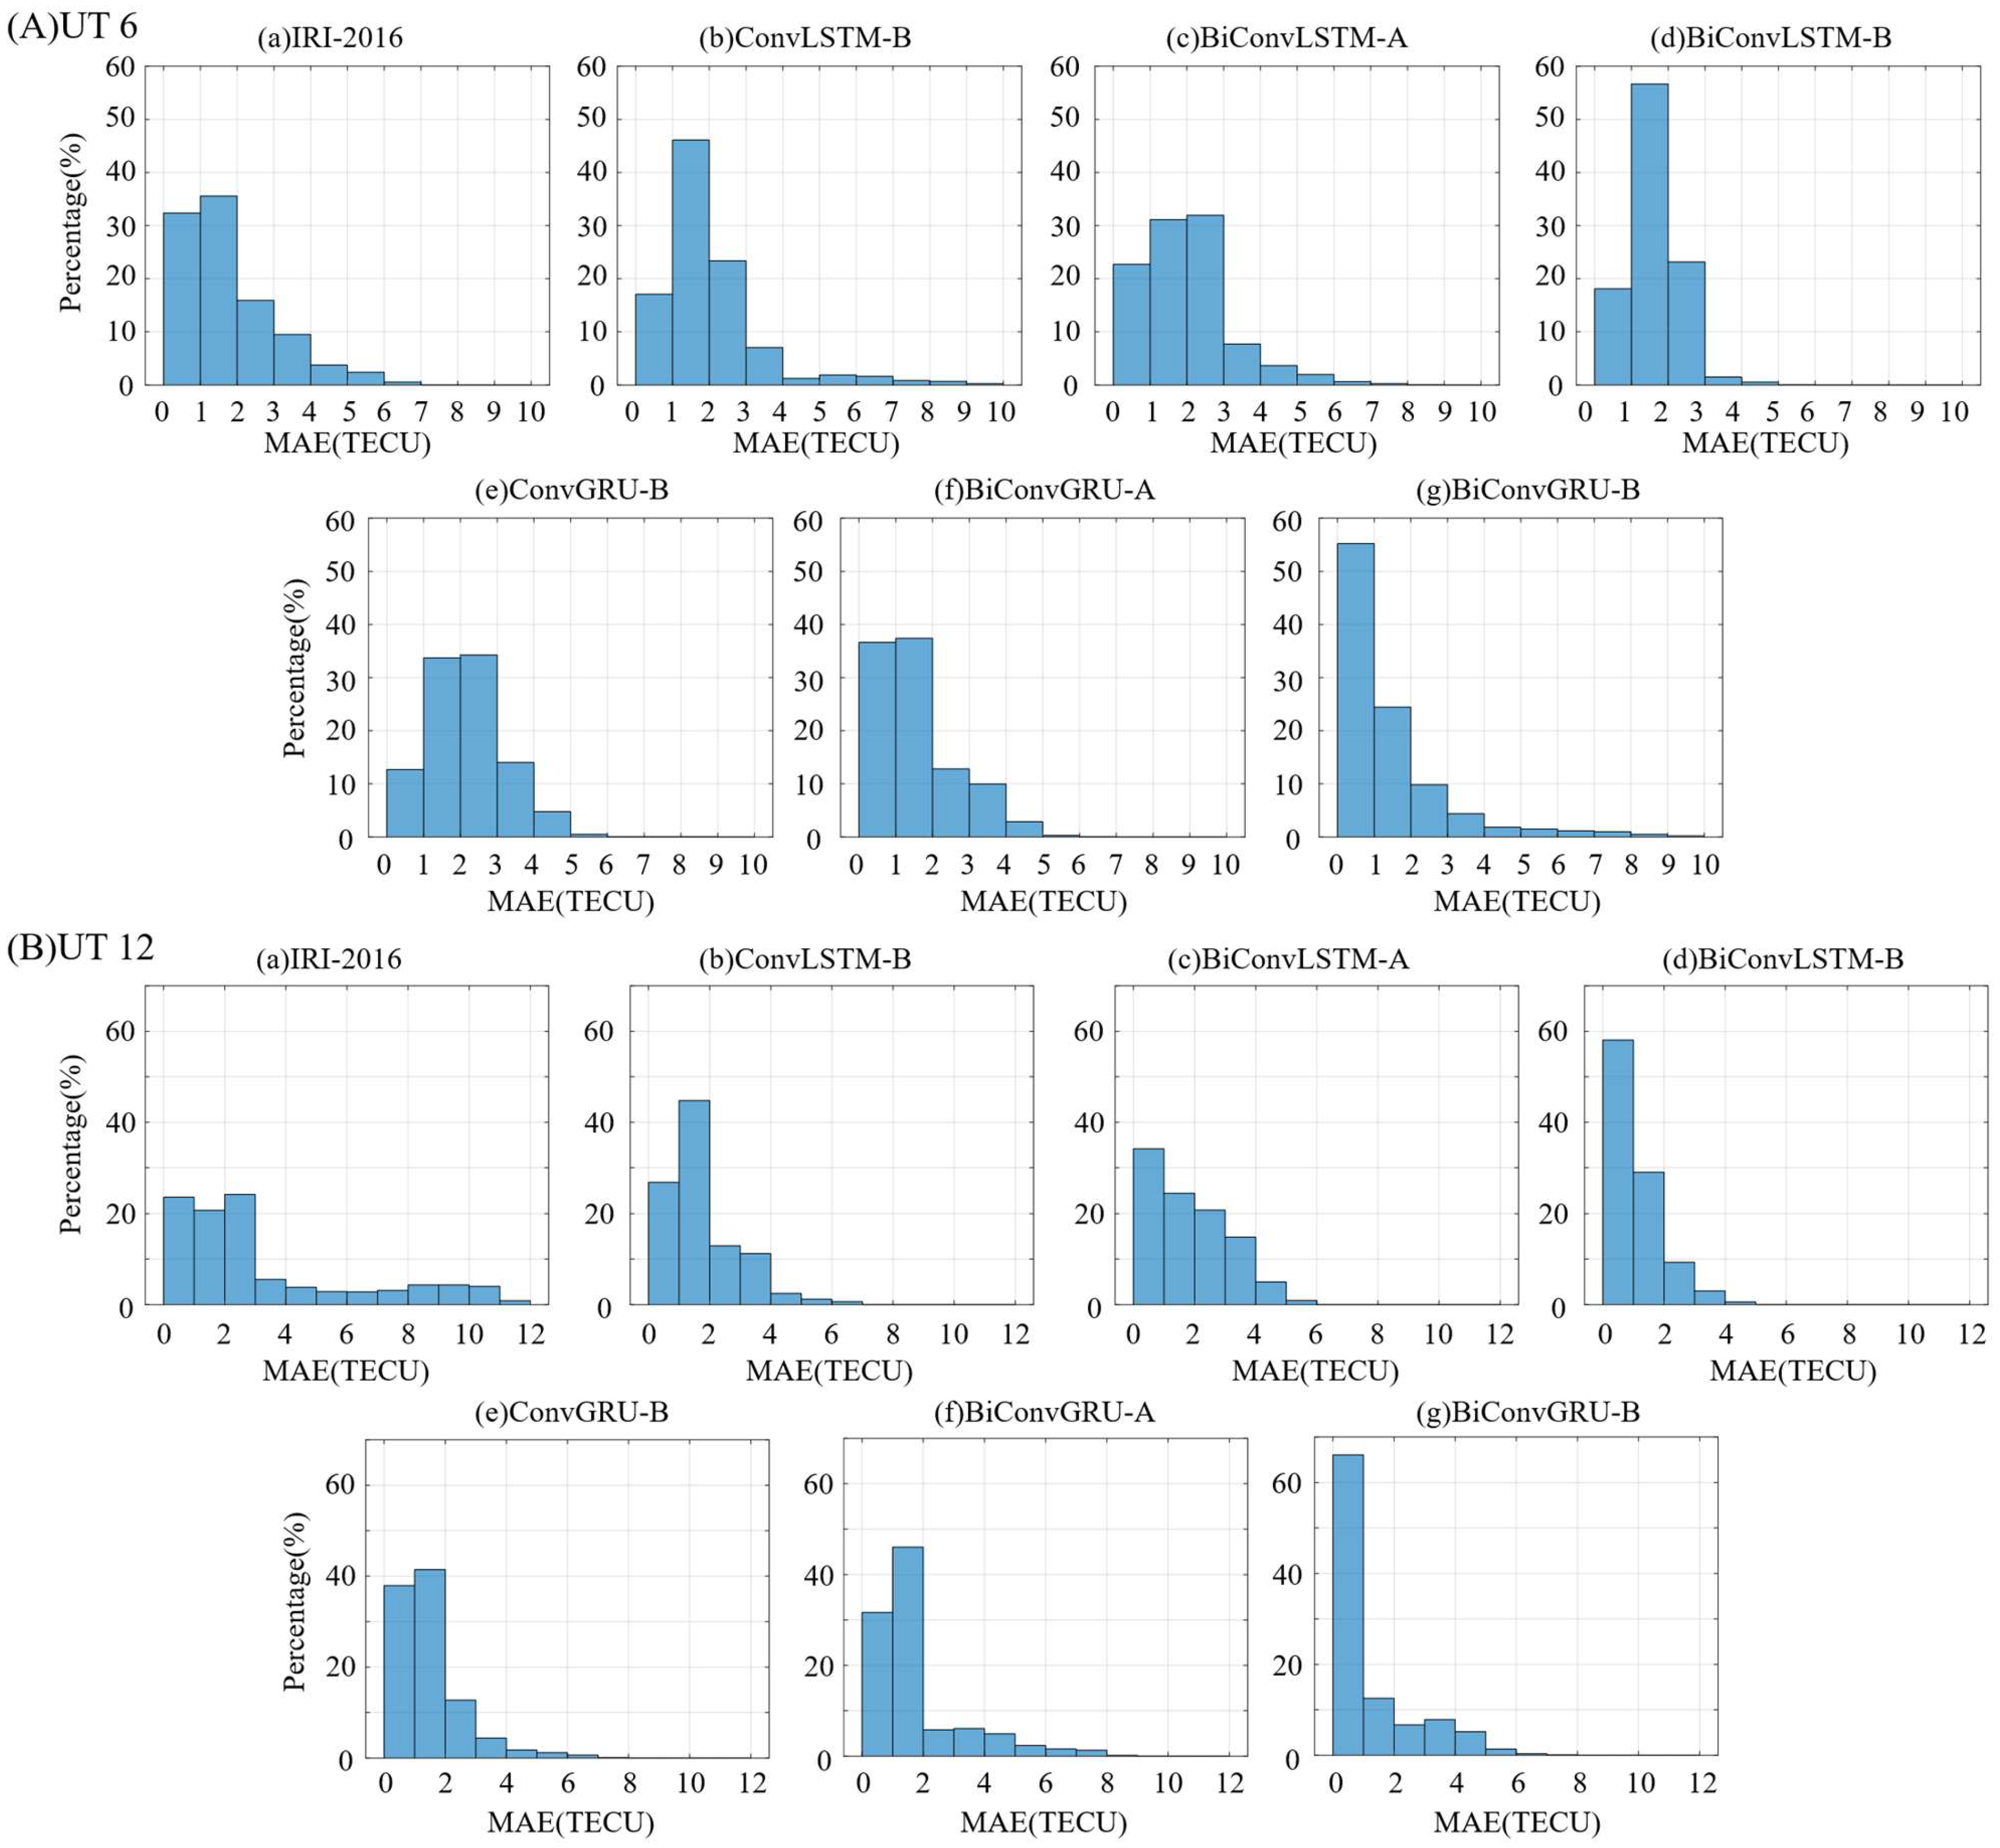
Figure 7.
Correlation analysis between forecasted TEC of each model and the CRIM TEC in DOY 233.

Figure 8.
Curves of RMSE with longitude at different latitudes of DOY 233.
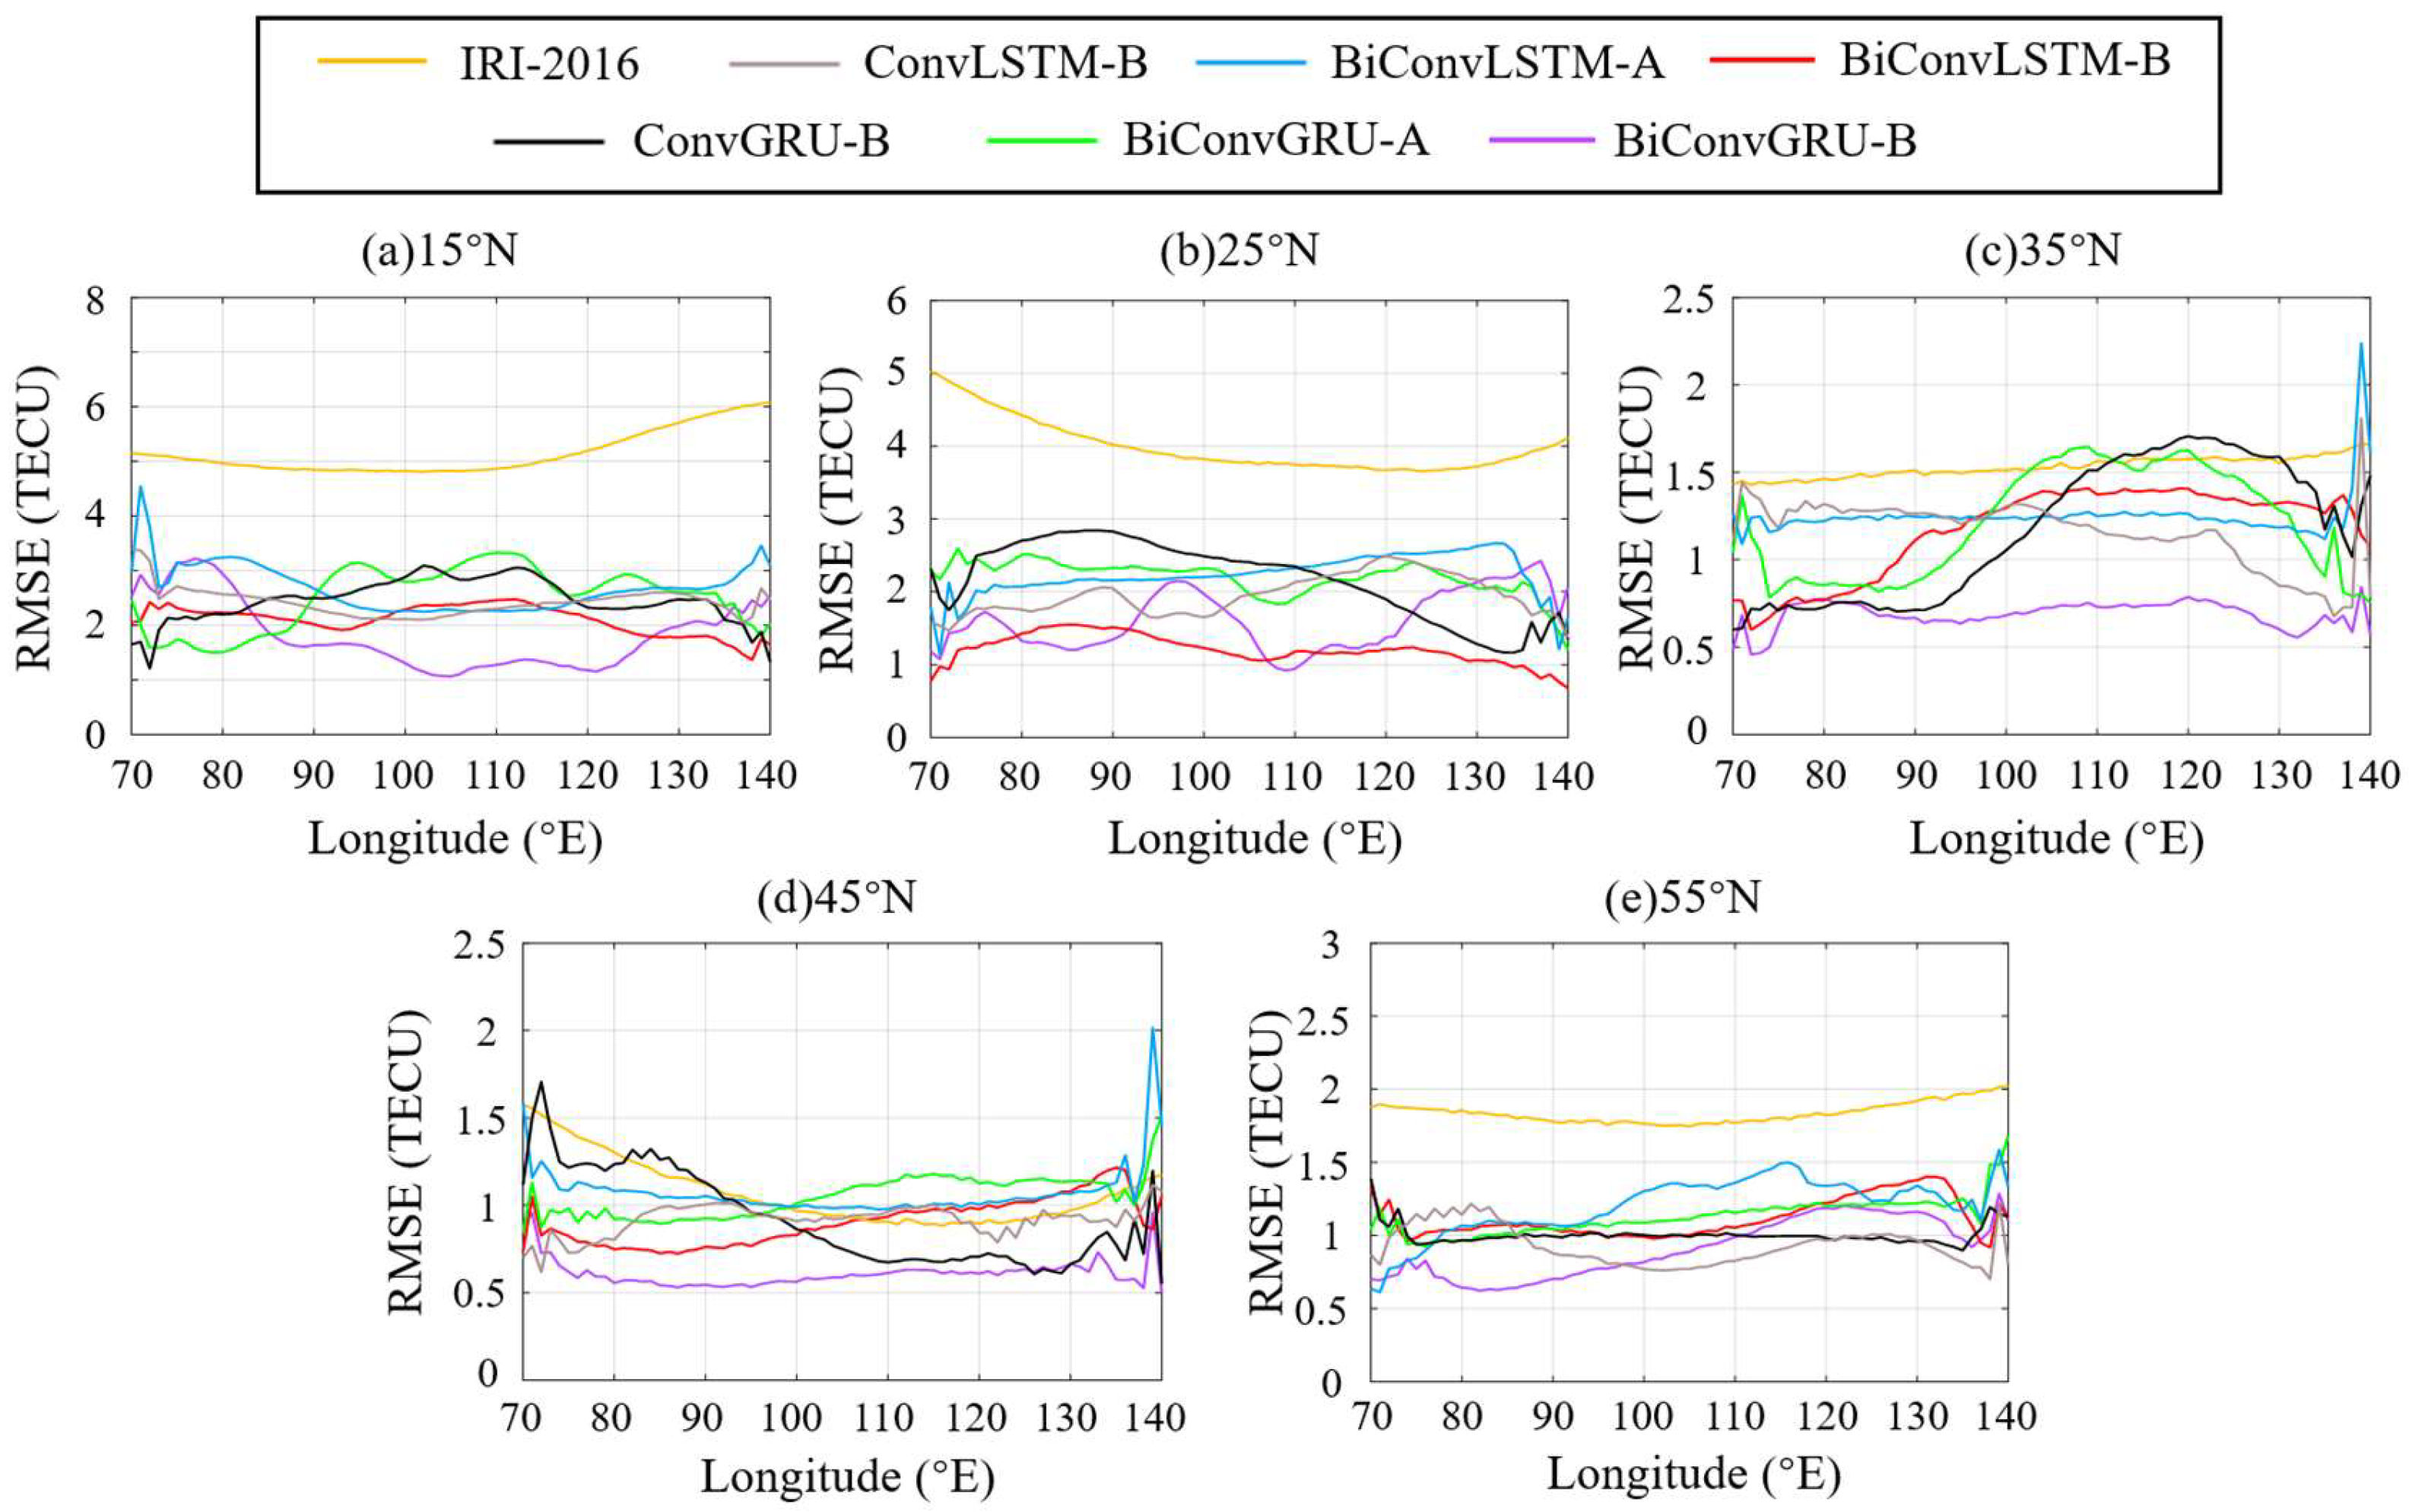
Figure 9.
CRIM TEC and predicted TEC by different models of different grid points during the geomagnetic quiet time.
Figure 9.
CRIM TEC and predicted TEC by different models of different grid points during the geomagnetic quiet time.
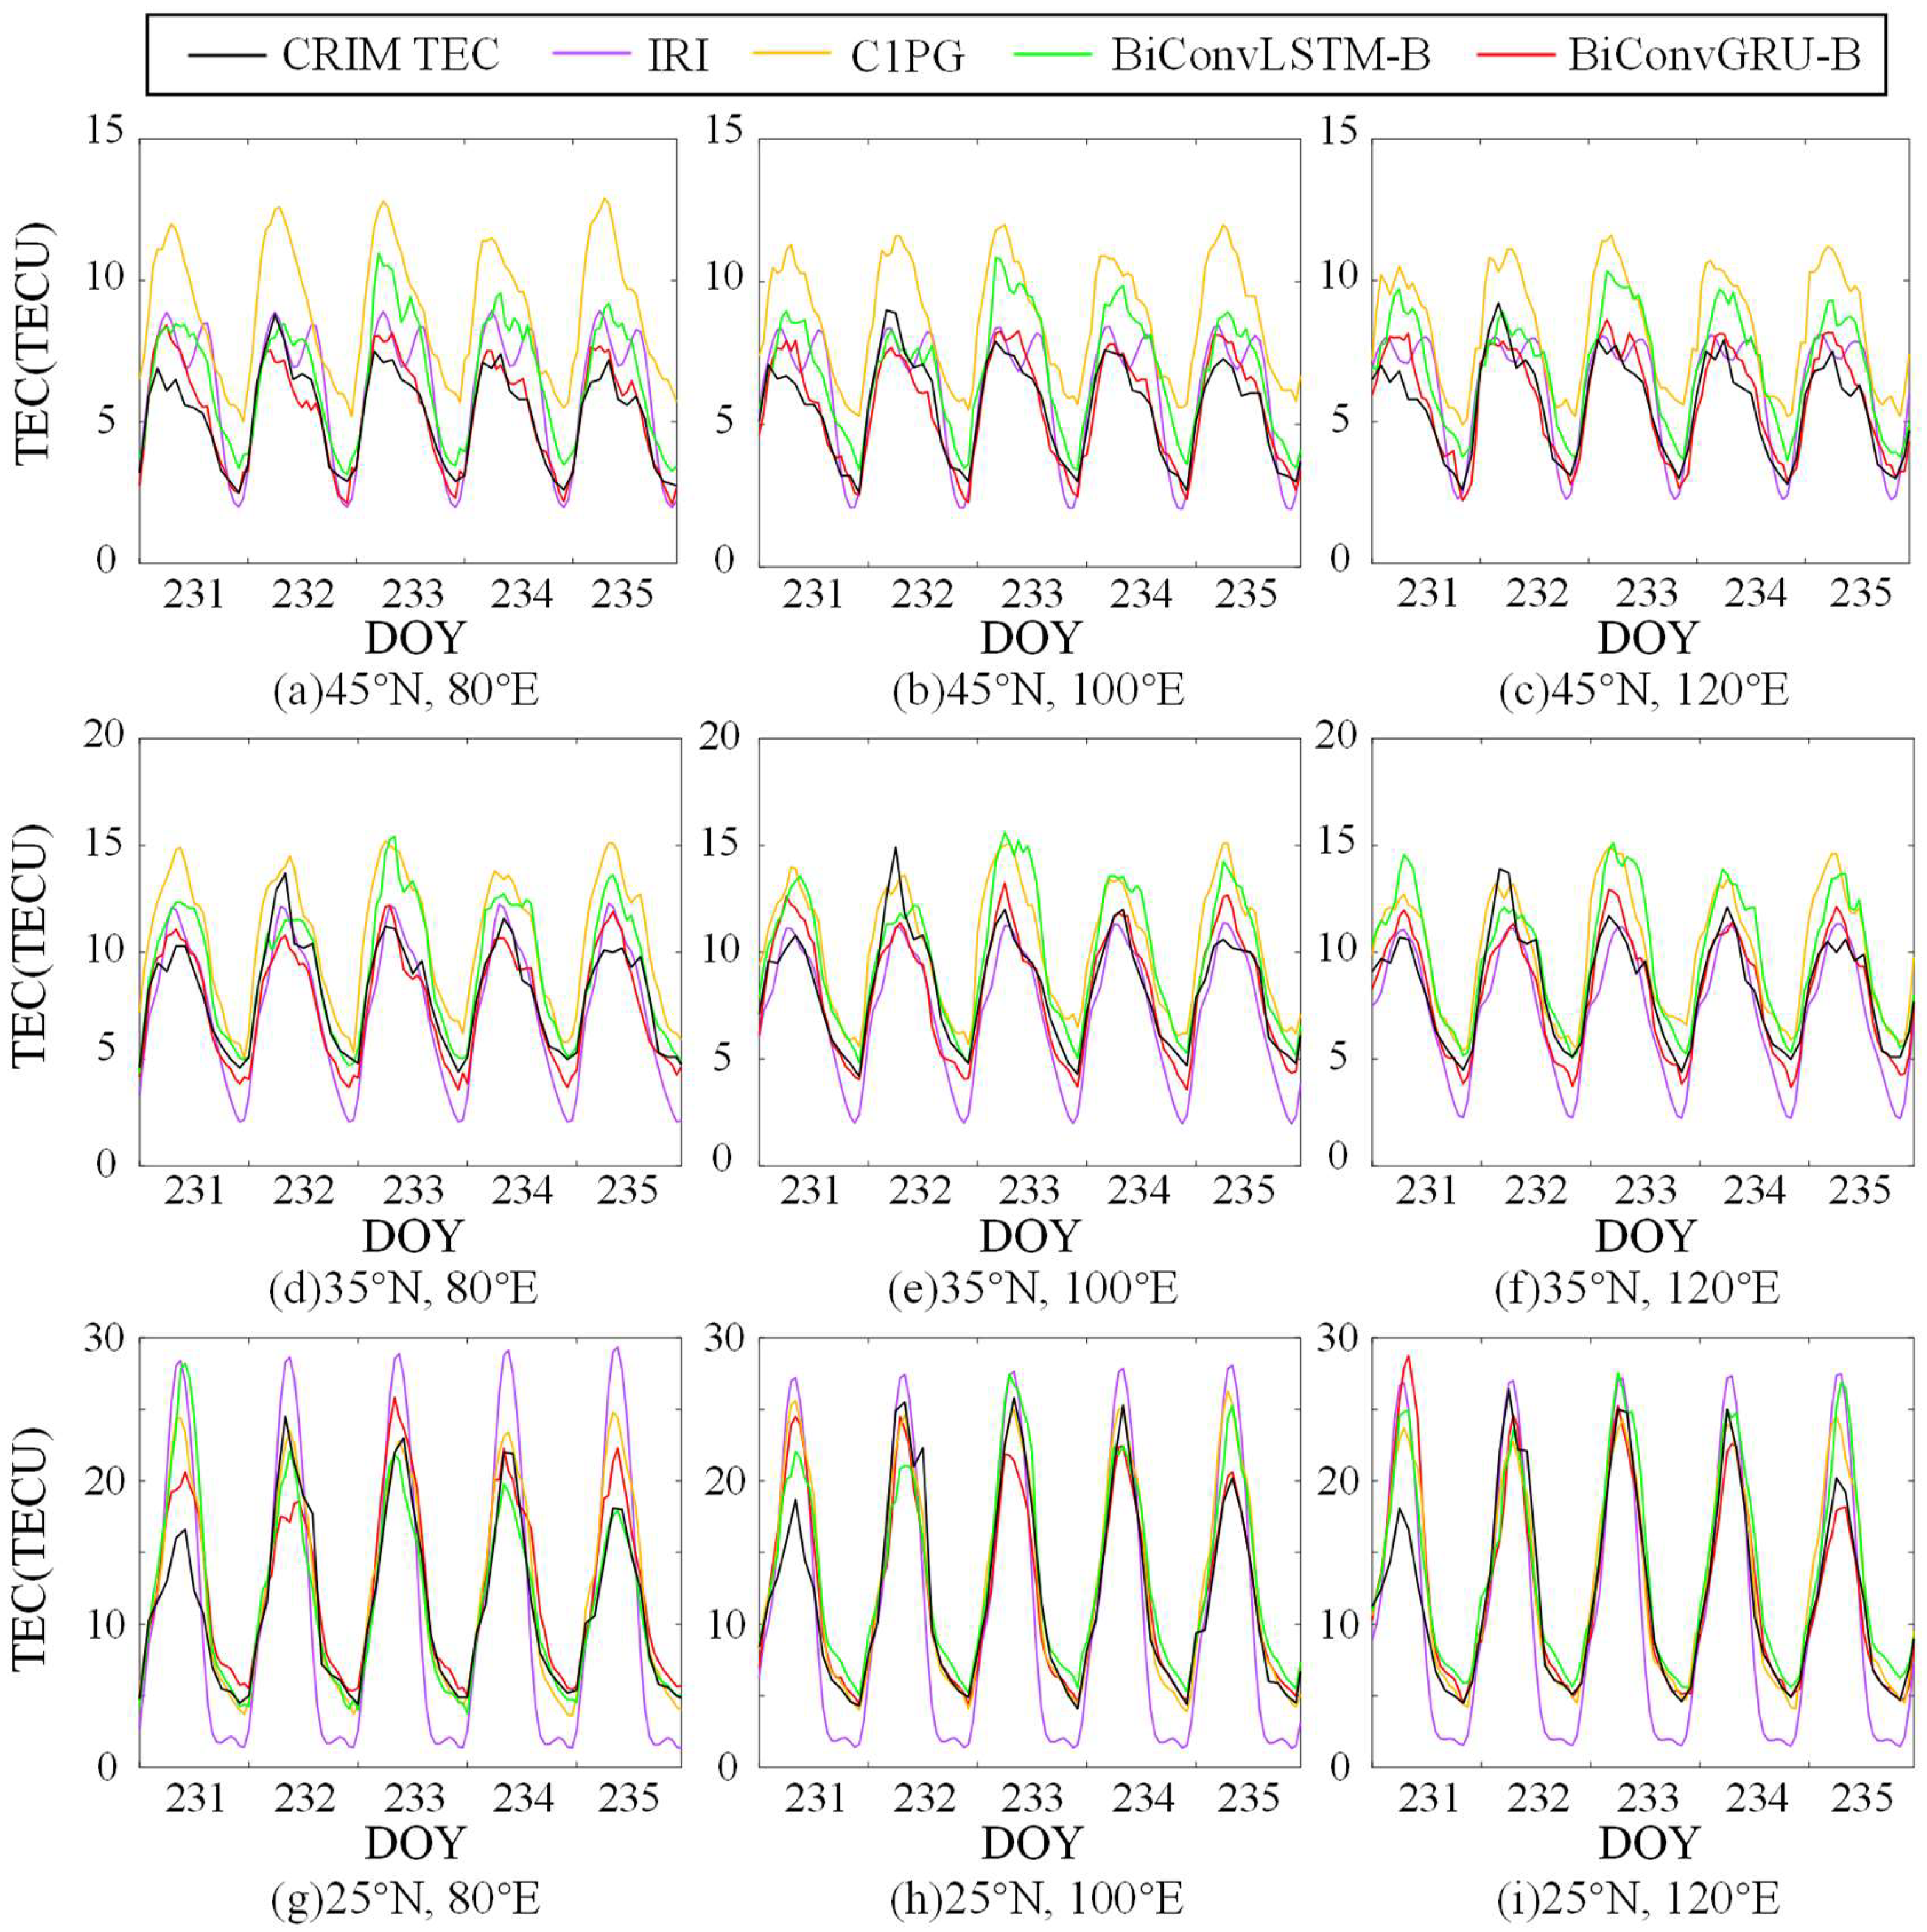
Figure 10.
Comparison of CRIM TEC and the predicted TEC of different models at different times of DOY 238.
Figure 10.
Comparison of CRIM TEC and the predicted TEC of different models at different times of DOY 238.
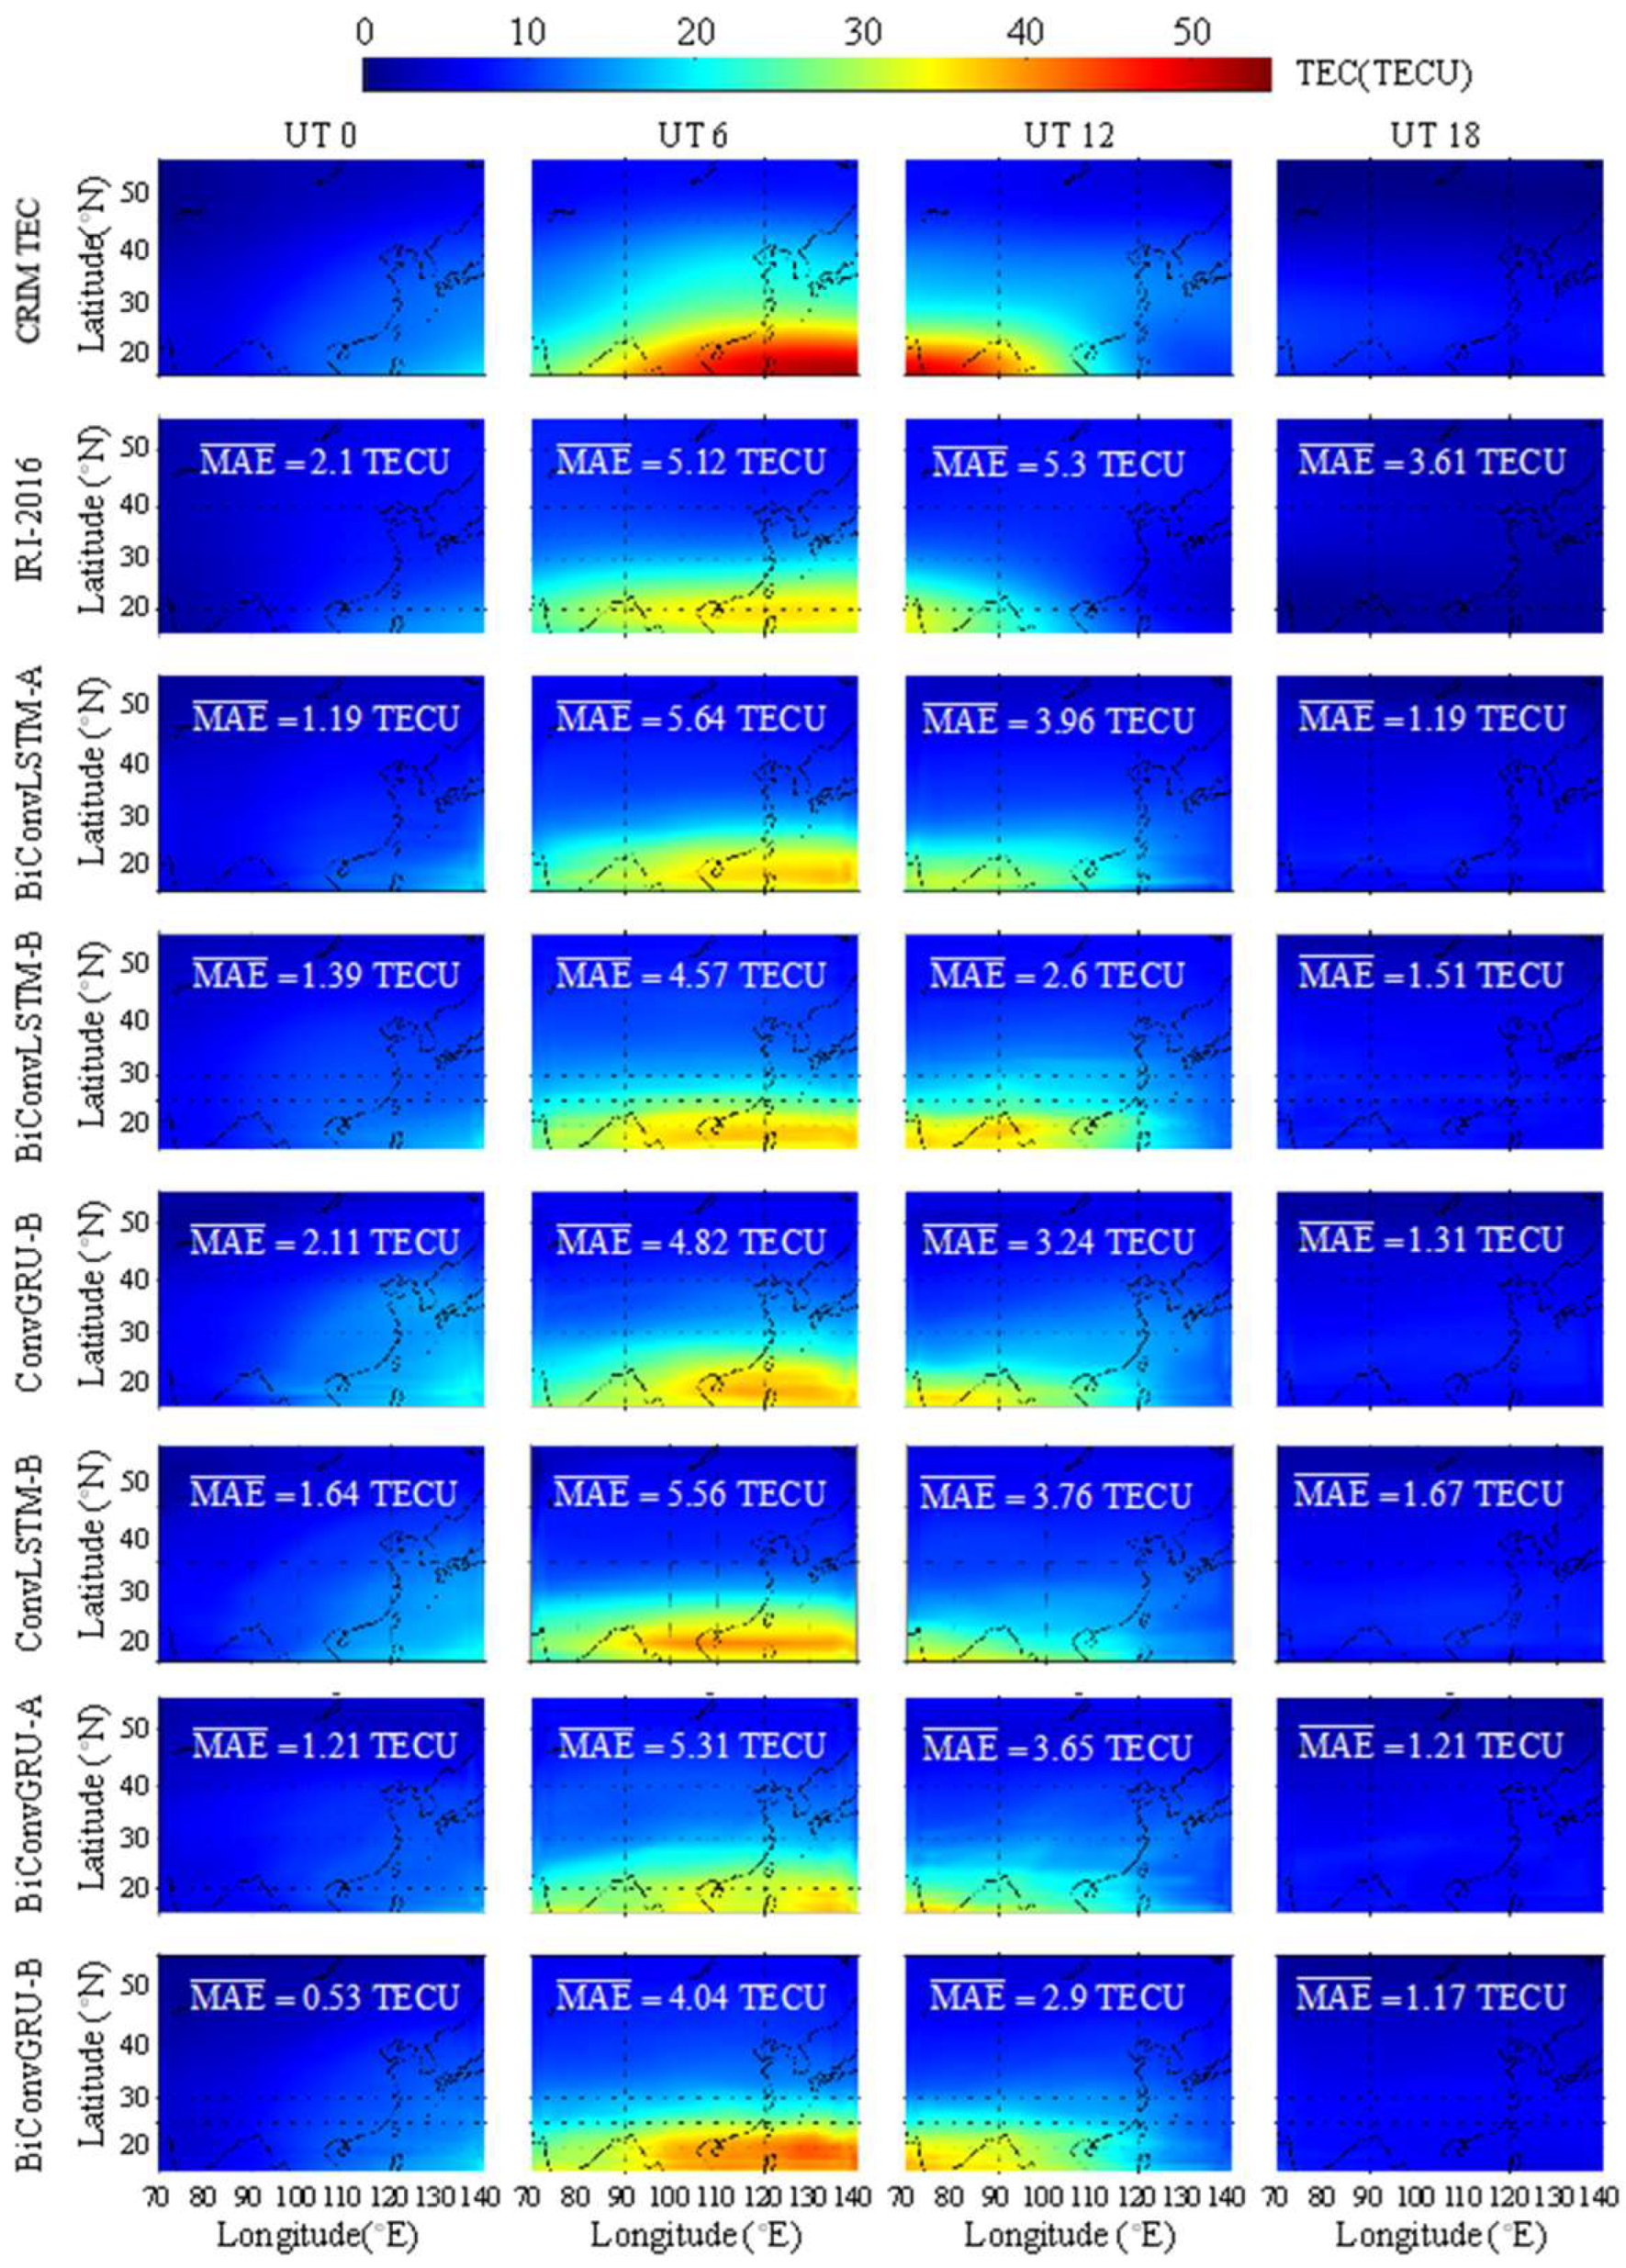
Figure 11.
Error histogram for different models at UT 6 and UT 12 on DOY 238.
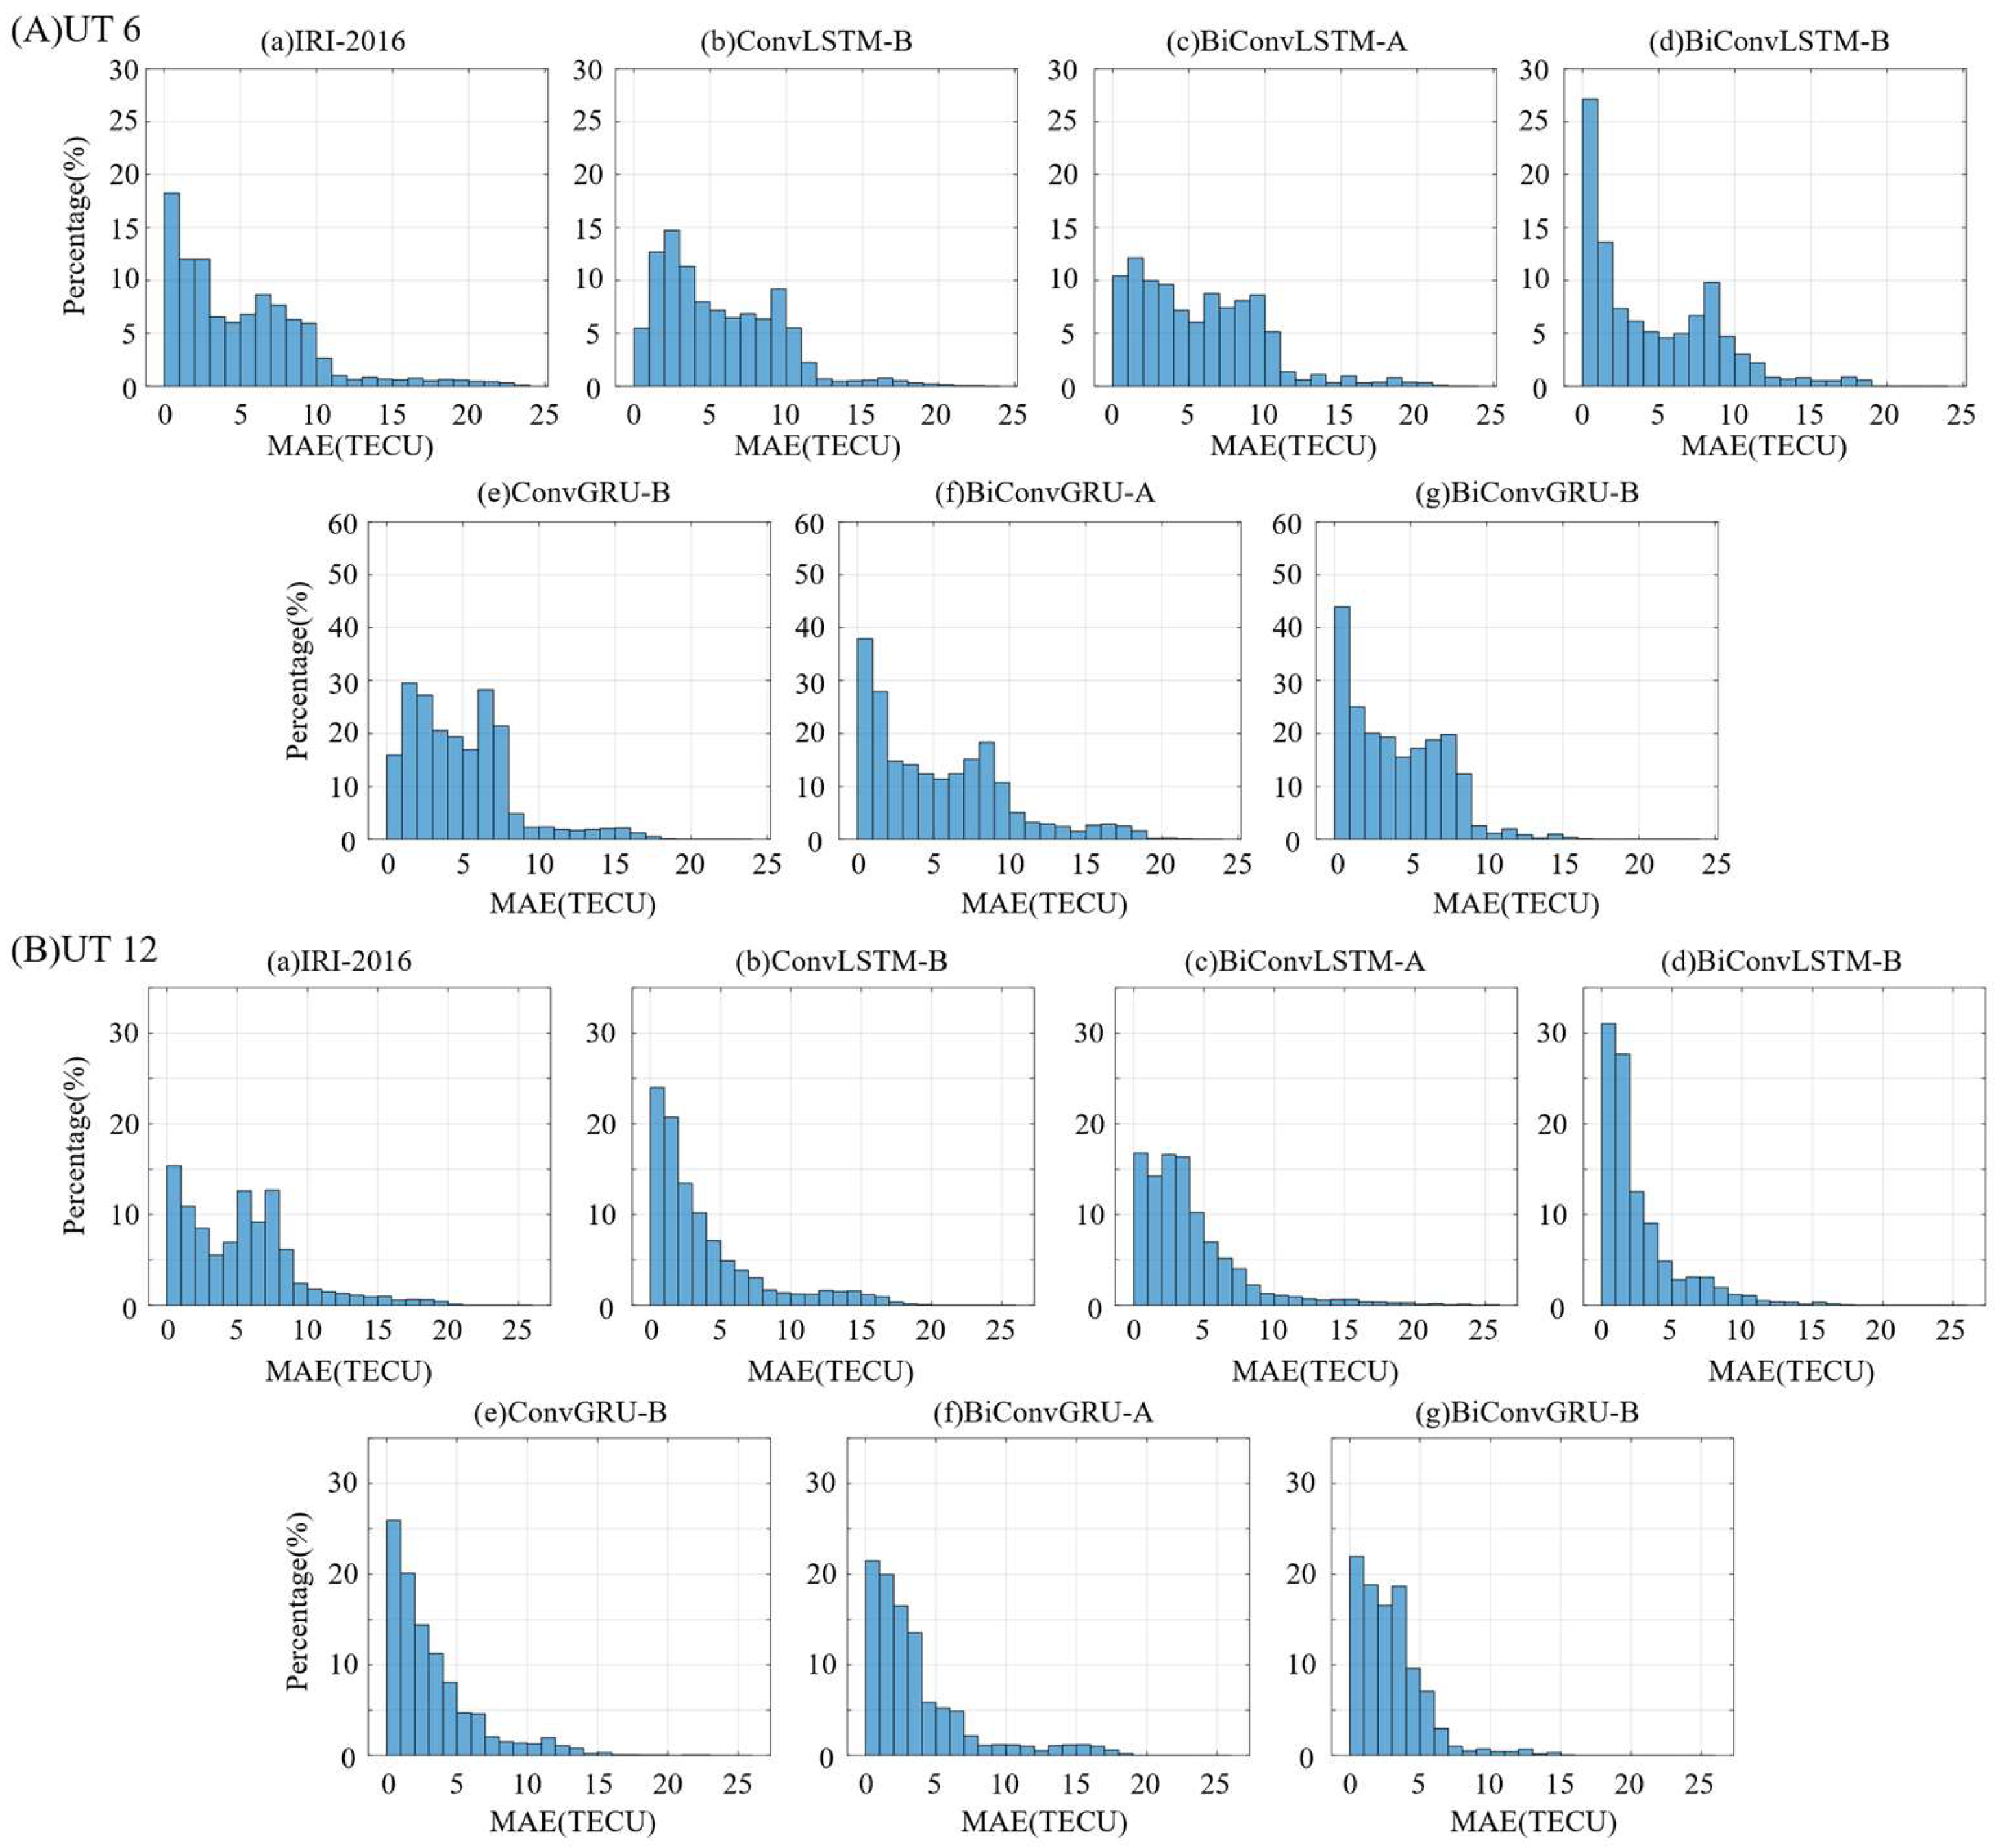
Figure 12.
Correlation analysis between predicted TEC of different models and CRIM TEC of DOY 238.
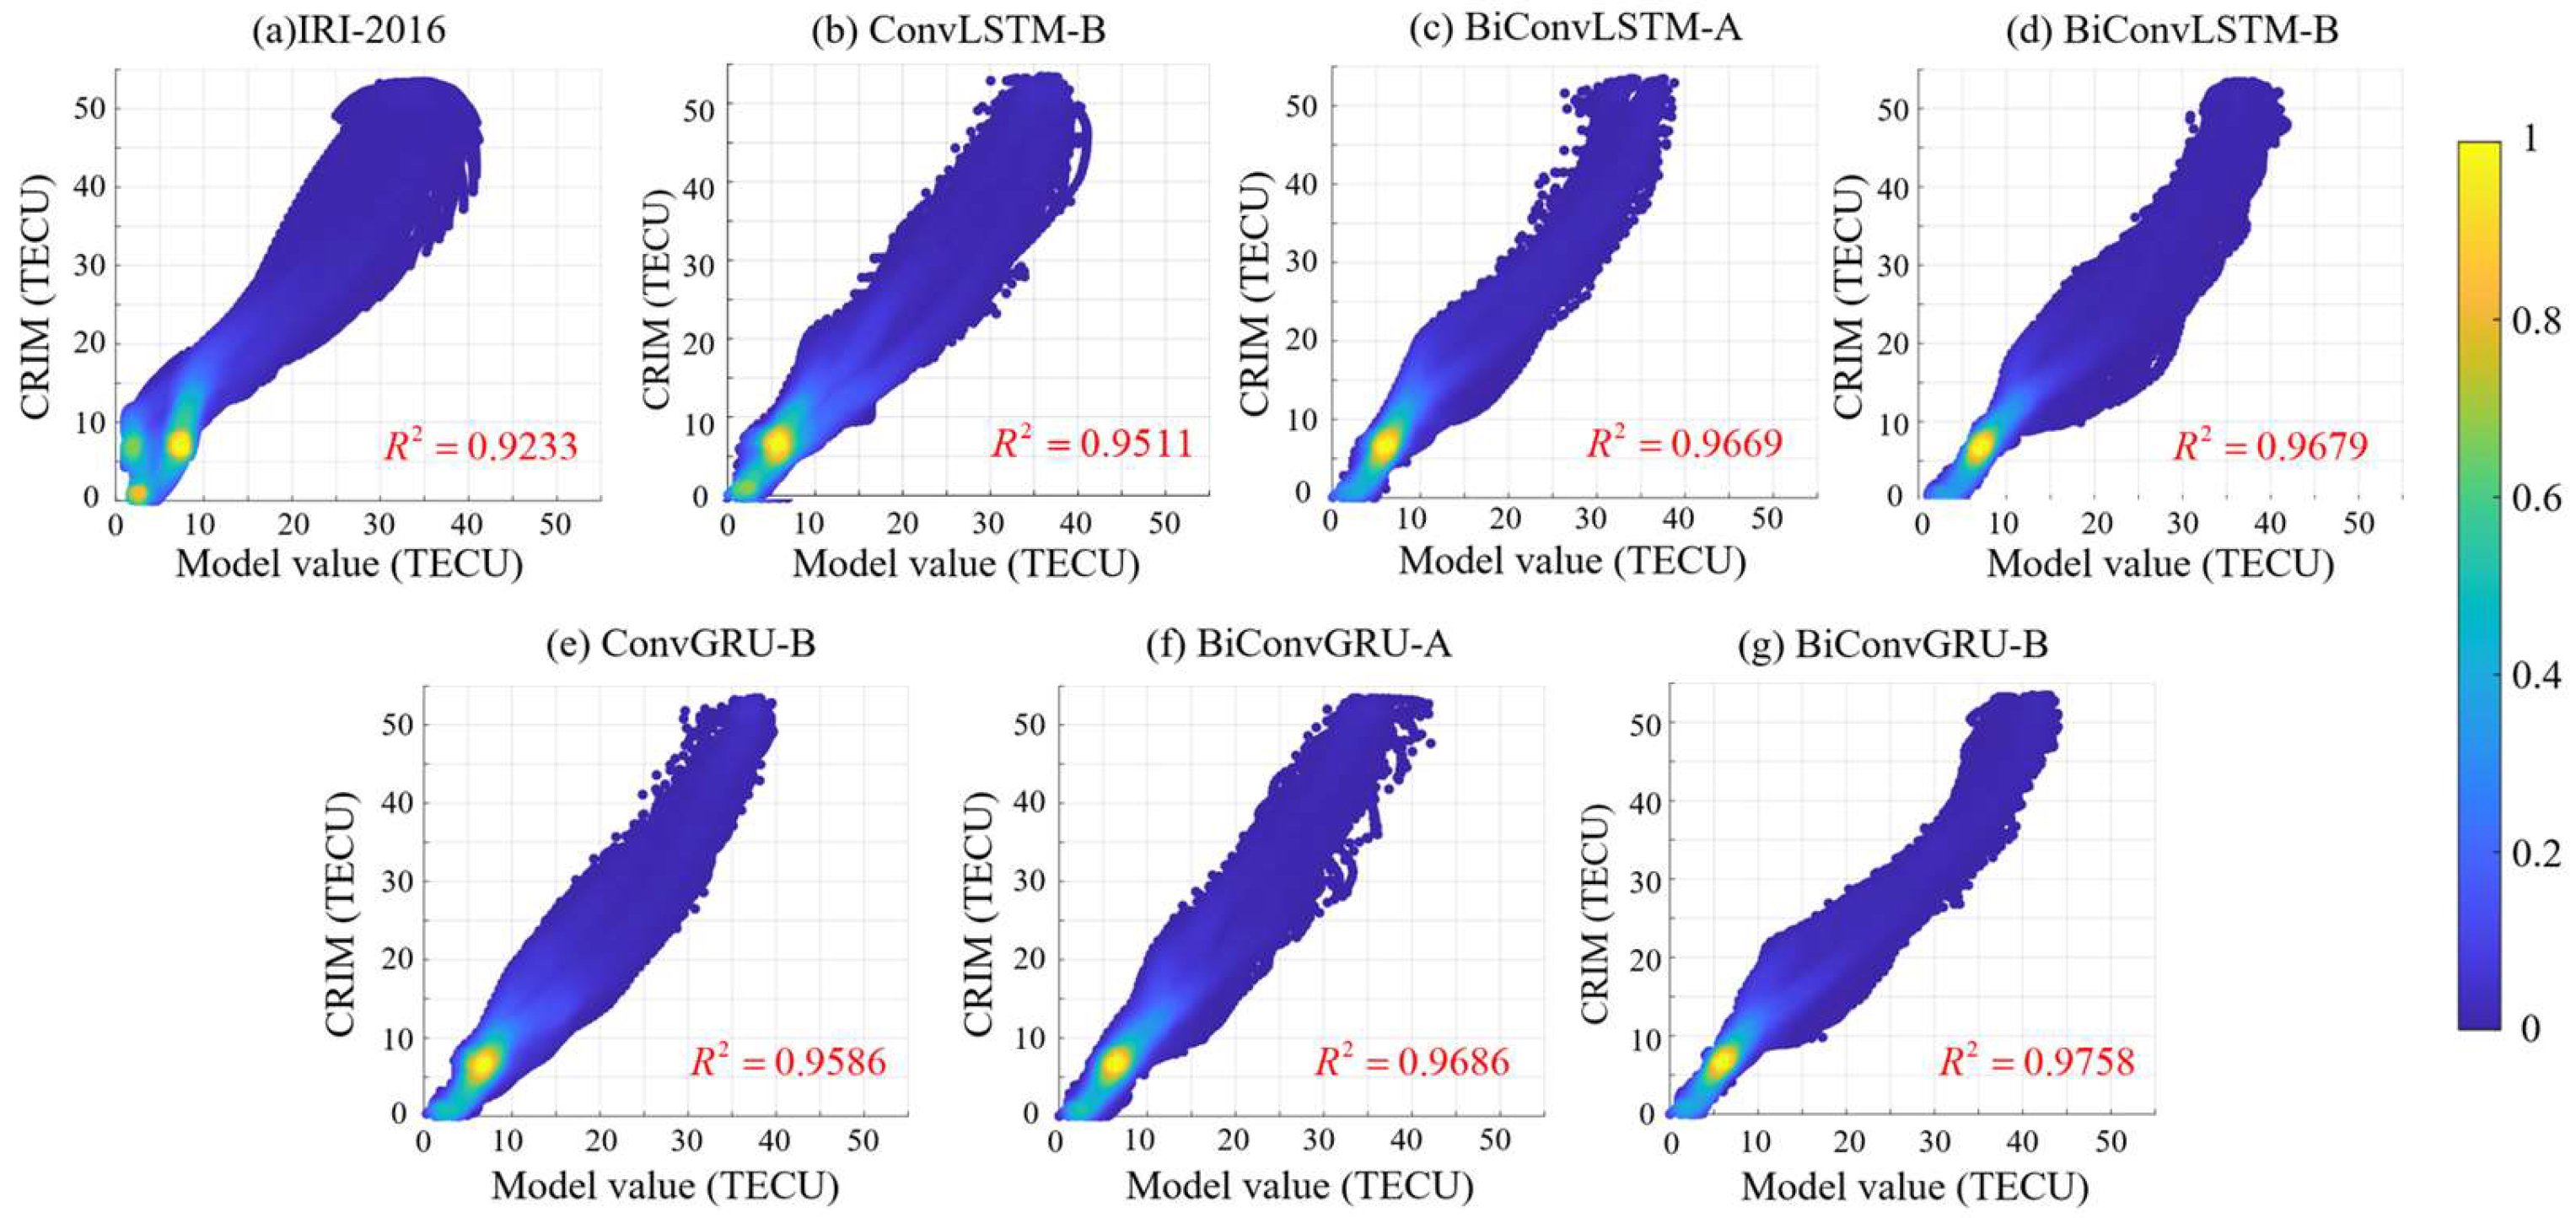
Figure 13.
Curves of RMSE with longitude at different latitudes of DOY 238.
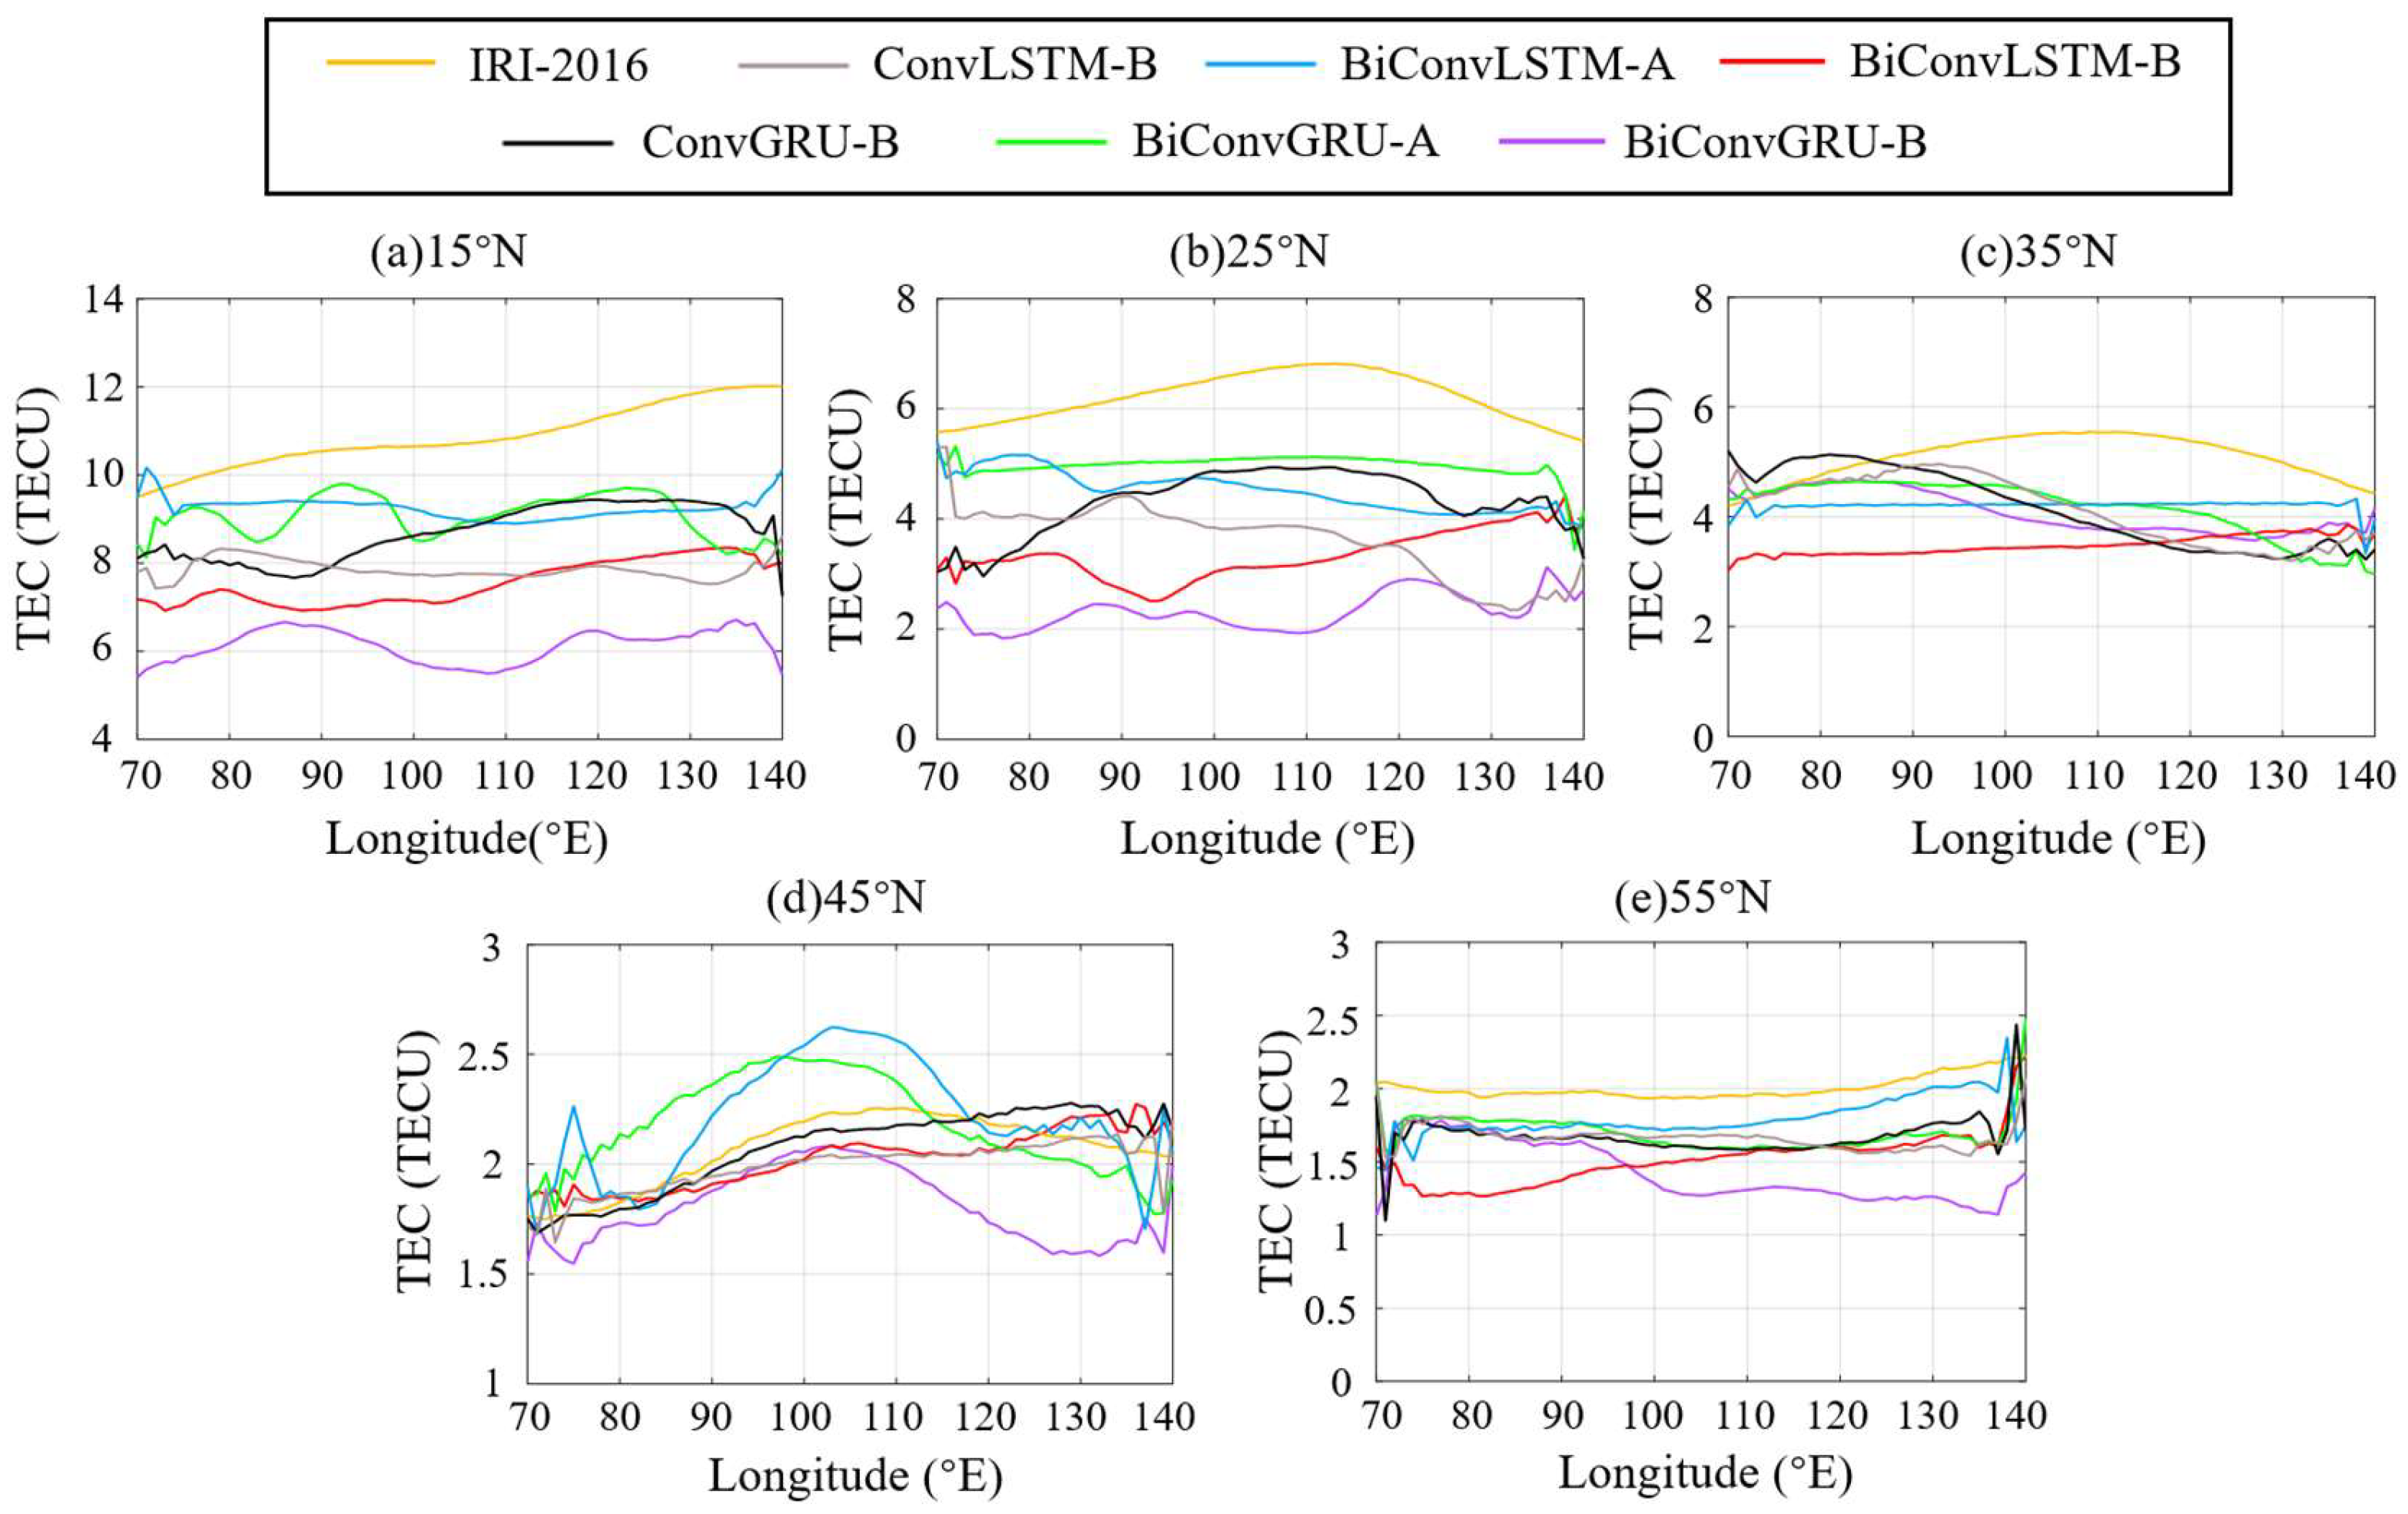
Figure 14.
CRIM TEC and predicted TEC by different models of different grid points during the geomagnetic storm time.
Figure 14.
CRIM TEC and predicted TEC by different models of different grid points during the geomagnetic storm time.

Figure 15.
Cumulative frequency of MAE of the two models under different seasons in 2018.
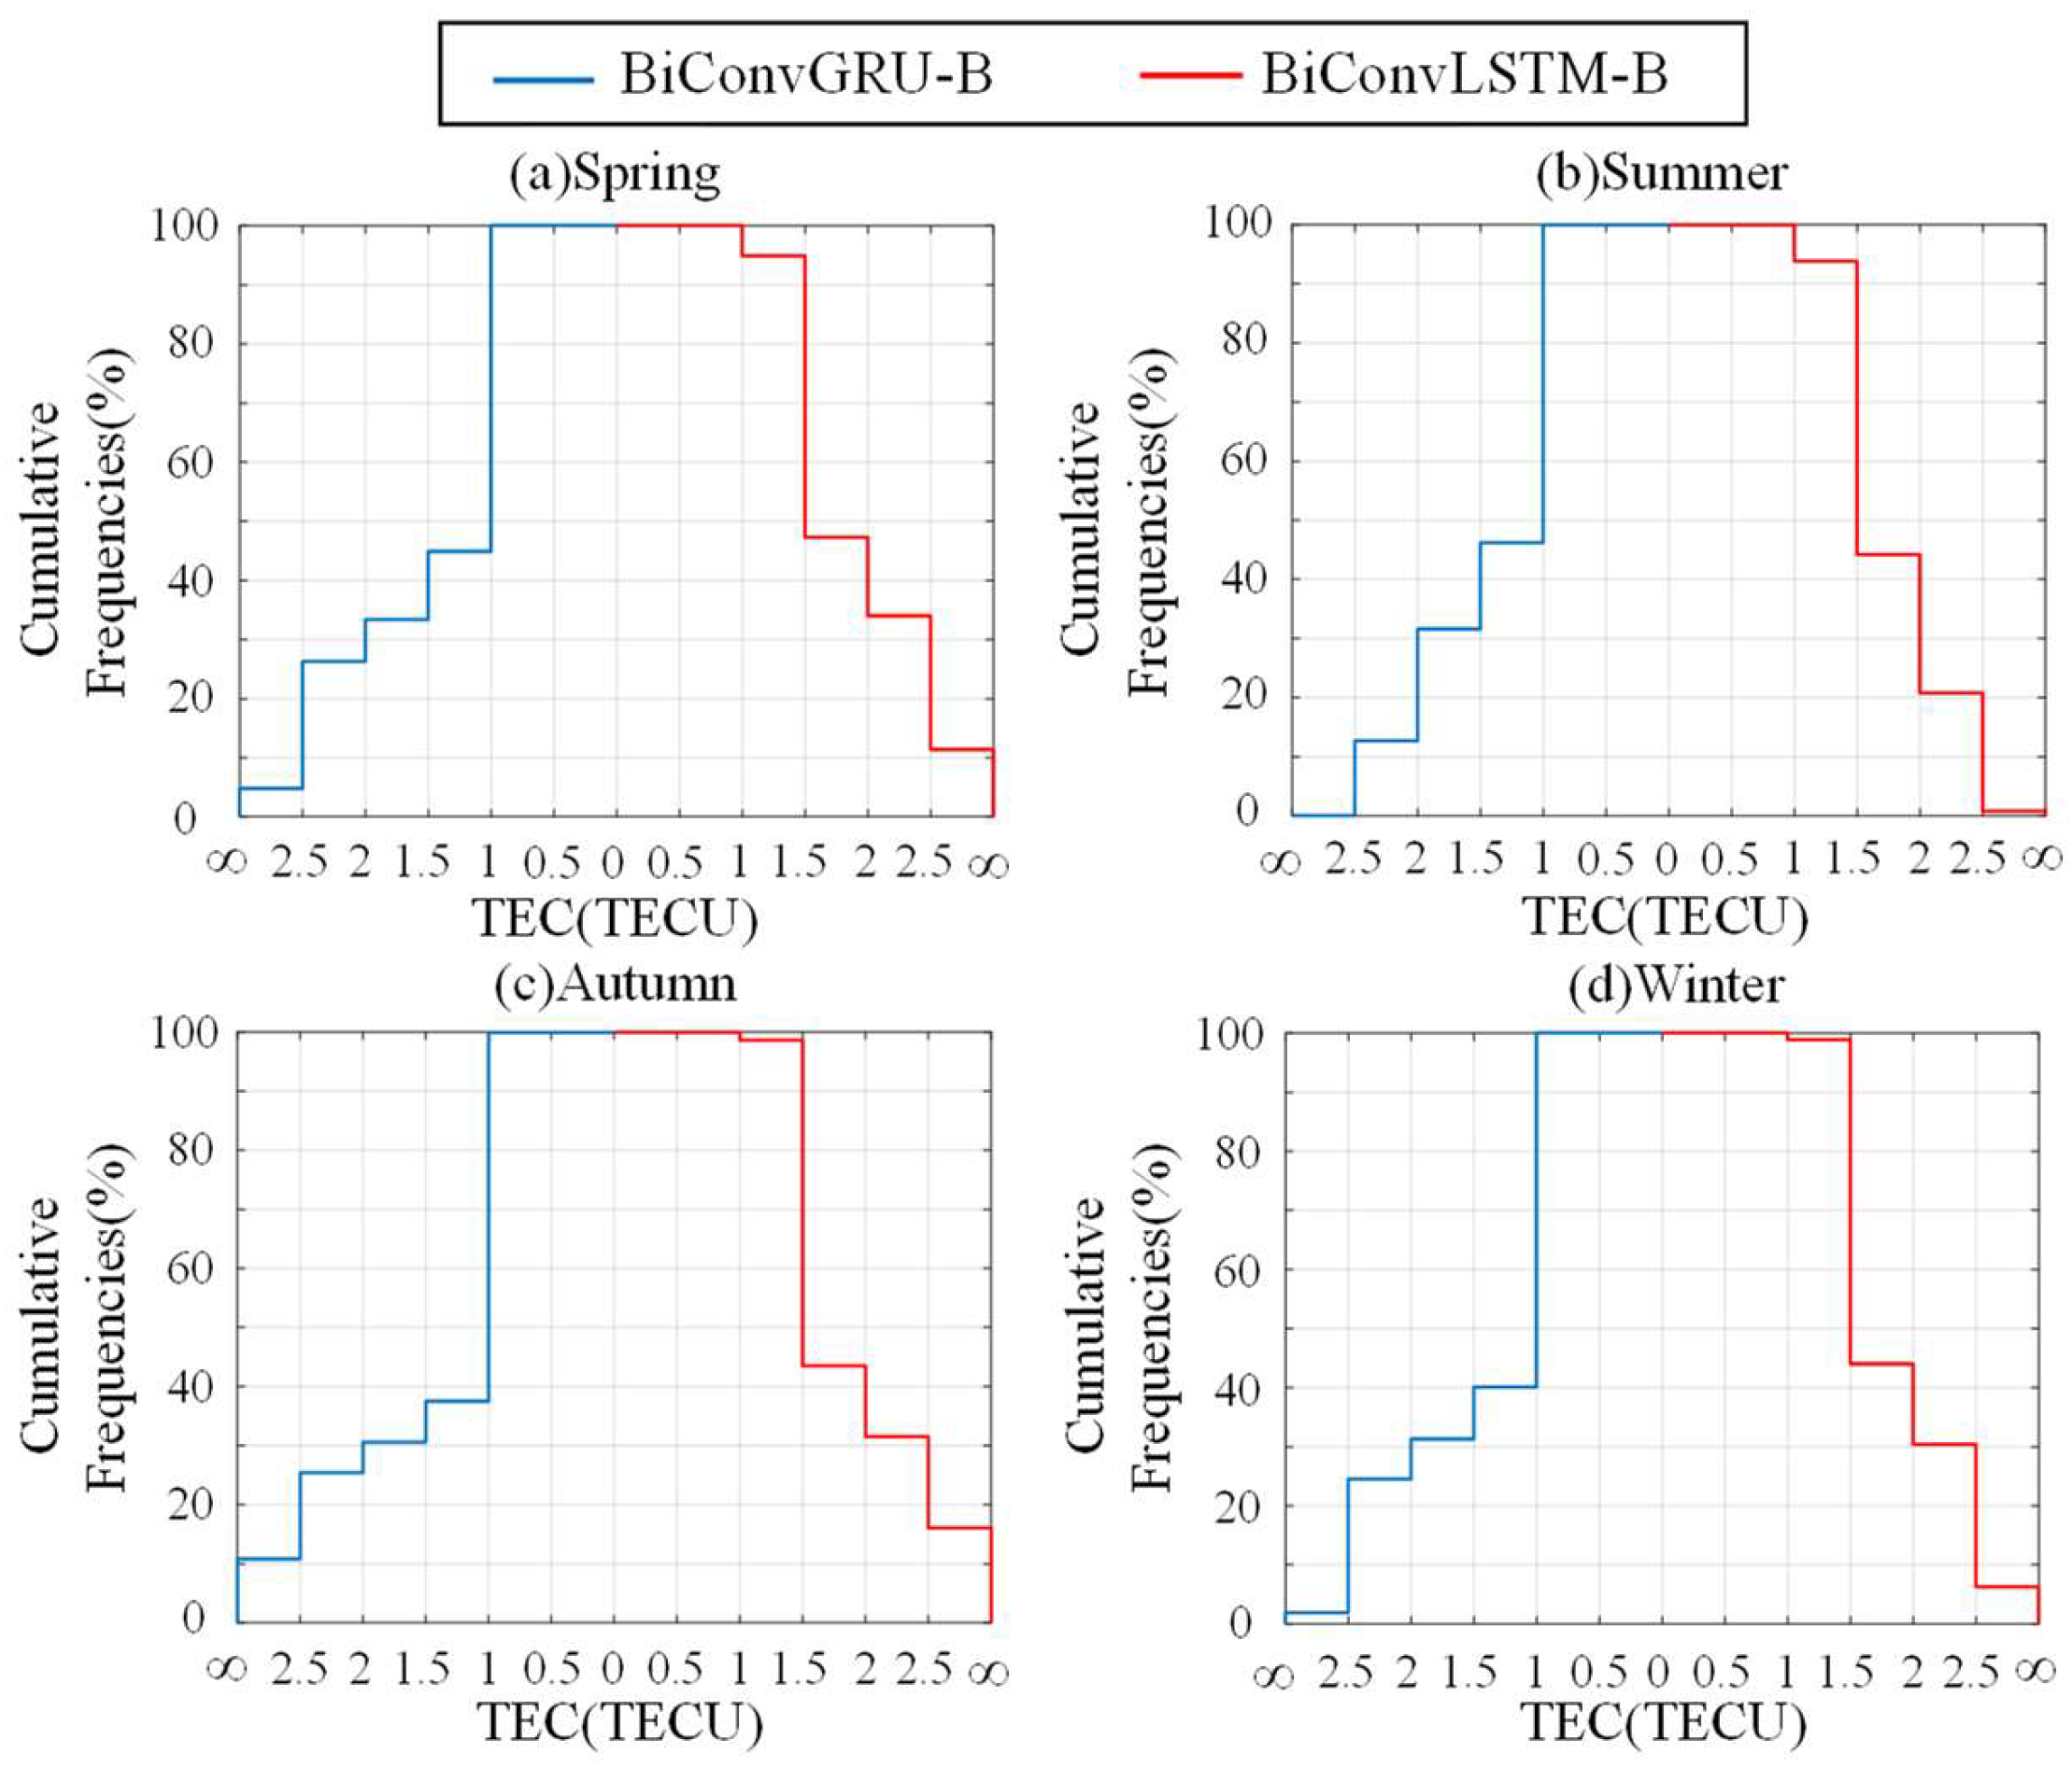
Figure 16.
The RMSE and MAE of the two models in different months of 2018.

Table 1.
Classification of magnetic storms.
| Magnetic Storm Levels: | Kp | ap/nT | Dst/nT |
|---|---|---|---|
| magnetic calm | 0 < Kp ≤ 4 | 0 < ap ≤ 32 | −30 < Dst |
| weak magnetic storm | 4 < Kp ≤ 5 | 32 < ap ≤ 60 | −50 < Dst ≤ −30 |
| moderate magnetic storm | 5 < Kp ≤ 6 | 60 < ap ≤ 100 | −100 < Dst ≤ −50 |
| strong magnetic storm | 6 < Kp ≤ 7 | 100 < ap ≤ 200 | −200 < Dst ≤ −100 |
| severe magnetic storm | 7 < Kp | 200 < ap | −300 < Dst ≤ −200 |
Table 2.
Classification of solar activity.
| Solar Activity | Solar F10.7 Index/sfu |
|---|---|
| very weak | 0 < F10.7 ≤ 70 |
| weak | 70 < F10.7 ≤ 100 |
| moderate | 100 < F10.7 ≤ 150 |
| intense | 150 < F10.7 |
Table 3.
Comparison of prediction errors by different models of DOY 233.
| Forecast Model | Evaluation Metrics | |||
|---|---|---|---|---|
| RMSE/TECU | MAE/TECU | RRMSE | ||
| IRI-2016 | 2.60 | 2.21 | 0.9232 | 13.2% |
| ConvLSTM-B | 1.68 | 1.35 | 0.9727 | 8.5% |
| BiConvLSTM-A | 1.76 | 1.44 | 0.9816 | 8.9% |
| BiConvLSTM-B | 1.15 | 0.94 | 0.9871 | 5.8% |
| ConvGRU-B | 1.48 | 1.2 | 0.9817 | 7.5% |
| BiConvGRU-A | 1.52 | 1.26 | 0.9878 | 7.7% |
| BiConvGRU-B | 1.09 | 0.87 | 0.9864 | 5.5% |
Table 4.
RMSE of three models at different latitudes of DOY 233.
| Forecast Model | Latitude | ||||
|---|---|---|---|---|---|
| 15°N | 25°N | 35°N | 45°N | 55°N | |
| IRI-2016 | 5.15 | 3.99 | 1.53 | 1.08 | 1.84 |
| ConvLSTM-B | 2.45 | 2.17 | 1.17 | 0.92 | 1 |
| ConvGRU-B | 2.42 | 1.95 | 1.16 | 0.92 | 0.93 |
| BiConvLSTM-A | 2.68 | 2.22 | 1.25 | 1.08 | 1.2 |
| BiConvLSTM-B | 2.10 | 1.20 | 1.17 | 0.90 | 1.12 |
| BiConvGRU-A | 2.51 | 2.19 | 1.21 | 1.05 | 1.13 |
| BiConvGRU-B | 1.83 | 1.61 | 0.69 | 0.61 | 0.91 |
Table 5.
The average RMSE of different grid points in the experimental area during the geomagnetic quiet time.
Table 5.
The average RMSE of different grid points in the experimental area during the geomagnetic quiet time.
| Latitude | Longitude | ||
|---|---|---|---|
| 80°E | 100°E | 120°E | |
| 45°N | 1.47/3.81/1.64/0.64 | 1.16/3.18/1.58/0.63 | 1.11/2.81/1.67/0.69 |
| 35°N | 1.54/2.75/1.79/1.05 | 1.61/2.24/2.07/1.08 | 1.63/1.99/1.98/0.99 |
| 25°N | 5.08/2.71/2.96/2.42 | 4.2/2.67/2.41/2.14 | 3.98/2.39/2.23/2.93 |
Note: “·/·/·/·” represents the RMSE values of the IRI-2016/C1PG/BiConvLSTM-B/BiConvGRU-B models.
Table 6.
Comparison of prediction errors by different models of DOY 238.
| Forecast Model | Evaluation Metrics | ||
|---|---|---|---|
| RMSE/TECU | MAE/TECU | ||
| IRI-2016 | 4.84 | 4.15 | 0.9233 |
| ConvLSTM-B | 3.73 | 2.78 | 0.9511 |
| BiConvLSTM-A | 3.96 | 2.97 | 0.9669 |
| BiConvLSTM-B | 3.26 | 2.32 | 0.9679 |
| ConvGRU-B | 3.64 | 2.7 | 0.9586 |
| BiConvGRU-A | 3.9 | 2.78 | 0.9686 |
| BiConvGRU-B | 2.83 | 2.11 | 0.9758 |
Table 7.
RMSE of three models at different latitudes of DOY 238.
| Forecast Model | Latitude | ||||
|---|---|---|---|---|---|
| 15°N | 25°N | 35°N | 45°N | 55°N | |
| IRI-2016 | 10.97 | 6.22 | 5.09 | 2.07 | 2.01 |
| ConvLSTM-B | 8.67 | 4.29 | 4.15 | 2.07 | 1.67 |
| BiConvLSTM-A | 9.25 | 4.96 | 4.2 | 2.2 | 1.79 |
| BiConvLSTM-B | 7.54 | 3.34 | 3.47 | 2.02 | 1.51 |
| ConvGRU-B | 7.85 | 3.63 | 4.14 | 1.99 | 1.67 |
| BiConvGRU-A | 9.06 | 4.51 | 4.17 | 2.18 | 1.70 |
| BiConvGRU-B | 6.12 | 2.32 | 4.07 | 1.80 | 1.42 |
Table 8.
The average RMSE of different grid points in the experimental area during the geomagnetic storm time.
Table 8.
The average RMSE of different grid points in the experimental area during the geomagnetic storm time.
| Latitude | Longitude | ||
|---|---|---|---|
| 80°E | 100°E | 120°E | |
| 45°N | 1.61/4.38/1.46/1.09 | 1.48/3.71/1.53/1.36 | 1.44/3.25/1.58/1.2 |
| 35°N | 2.59/3.24/2.68/2.22 | 2.8/2.75/2.8/2.3 | 2.78/2.45/2.73/2.1 |
| 25°N | 4.63/2.4/2.55/2.33 | 4.45/2.66/2.86/2.83 | 4.4/2.94/3.23/2.79 |
Note: “·/·/·/·” represents the RMSE values of the IRI-2016, C1PG, BiConvLSTM-B, and BiConvGRU-B models.
Table 9.
The RMSE of BiConvLSTM-B model and BiConvGRU-B model under different geomag-netic environments.
Table 9.
The RMSE of BiConvLSTM-B model and BiConvGRU-B model under different geomag-netic environments.
| Model | Magnetic Storm Level | |||
|---|---|---|---|---|
| Quiet | Weak | Moderate | Strong | |
| BiConvLSTM-B | 1.98 | 2.17 | 2.24 | 3.04 |
| BiConvGRU-B | 1.68 | 1.97 | 1.93 | 2.57 |
Disclaimer/Publisher’s Note: The statements, opinions and data contained in all publications are solely those of the individual author(s) and contributor(s) and not of MDPI and/or the editor(s). MDPI and/or the editor(s) disclaim responsibility for any injury to people or property resulting from any ideas, methods, instructions or products referred to in the content. |
© 2023 by the authors. Licensee MDPI, Basel, Switzerland. This article is an open access article distributed under the terms and conditions of the Creative Commons Attribution (CC BY) license (https://creativecommons.org/licenses/by/4.0/).
Share and Cite
MDPI and ACS Style
Tang, J.; Zhong, Z.; Hu, J.; Wu, X. Forecasting Regional Ionospheric TEC Maps over China Using BiConvGRU Deep Learning. Remote Sens. 2023, 15, 3405. https://doi.org/10.3390/rs15133405
AMA Style
Tang J, Zhong Z, Hu J, Wu X. Forecasting Regional Ionospheric TEC Maps over China Using BiConvGRU Deep Learning. Remote Sensing. 2023; 15(13):3405. https://doi.org/10.3390/rs15133405
Chicago/Turabian StyleTang, Jun, Zhengyu Zhong, Jiacheng Hu, and Xuequn Wu. 2023. "Forecasting Regional Ionospheric TEC Maps over China Using BiConvGRU Deep Learning" Remote Sensing 15, no. 13: 3405. https://doi.org/10.3390/rs15133405
Note that from the first issue of 2016, this journal uses article numbers instead of page numbers. See further details here.