Article

Spatial-Convolution Spectral-Transformer Interactive Network for Large-Scale Fast Refined Land Cover Classification and Mapping Based on ZY1-02D Satellite Hyperspectral Imagery

1
Aerospace Information Research Institute, Chinese Academy of Sciences, Beijing 100101, China
2
University of Chinese Academy of Sciences, Beijing 100101, China
3
School of Geography and Remote Sensing, Guangzhou University, Guangzhou 510006, China
*
Author to whom correspondence should be addressed.
Remote Sens. 2023, 15(13), 3269; https://doi.org/10.3390/rs15133269
Submission received: 19 April 2023 / Revised: 8 June 2023 / Accepted: 20 June 2023 / Published: 25 June 2023

Abstract

:
Satellite hyperspectral imagery is an important data source for large-scale refined land cover classification and mapping, but the high spatial heterogeneity and spectral variability at low spatial resolution and the high computation cost for massive data remain challenges in the research community. In recent years, convolutional neural network (CNN) models with the capability for feature extraction have been widely used in hyperspectral image classification. However, incomplete feature extraction, inappropriate feature fusion, and high time consumption are still the major problems for CNN applications in large-scale fine land cover mapping. In this study, a Spatial-Convolution Spectral-Transformer Interactive Network (SCSTIN) was proposed to integrate 2D-CNN and Transformer into a dual-branch network to enhance feature extraction capabilities by exploring spatial context information and spectral sequence signatures in a targeted manner. In addition, spatial-spectral interactive fusion (SSIF) units and category-adaptive weighting (CAW) as two feature fusion modules were also adopted between and after the two feature extraction branches to improve efficiency in feature fusion. The ZY1-02D hyperspectral imagery was collected to conduct the experiments in the study area of the eastern foothills of the Helan Mountains (EFHLM), covering an area of about 8800 km2, which is the largest hyperspectral dataset as far as we know. To explore the potential of the proposed network in terms of accuracy and efficiency, SCSTIN models with different depths (SCSTIN-4 and SCSTIN-2) were performed. The results suggest that compared with the previous eight advanced hyperspectral image classifiers, both SCSTIN models achieved satisfactory performance in accuracy and efficiency aspects with low complexity, where SCSTIN-4 achieved the highest accuracy and SCSTIN-2 obtained higher efficiency. Accordingly, the SCSTIN models are reliable for large-scale fast refined land cover classification and mapping. In addition, the spatial distribution pattern of diverse ground objects in EFHLM is also analyzed.

1. Introduction

Land cover maps with refined categories are of prime importance for geographical conditions monitoring and can support many further applications such as precision agriculture [1,2], land resource management [3], environmental protection [4,5], and disaster assessment [6,7]. In recent years, remote sensing (RS) technology has become one of the most commonly used techniques for large-scale mapping due to its capability to obtain valuable spatial-spectral information over large areas quickly and cheaply. As one of the core technologies of RS, hyperspectral RS uses narrow and continuous spectral channels to continuously image ground objects and can obtain hundreds of bands and rich spectral information about ground objects. Thus, hyperspectral images (HSIs) can classify more detailed ground object categories, especially vegetation categories, which makes a significant contribution to land cover identification tasks [8] and precision agriculture [9]. Moreover, the emergence of various available hyperspectral datasets and the vigorous development of intelligent algorithms in recent years have made it possible to perform large-scale and high-precision fine land cover mapping based on HSIs.
With the development of hyperspectral imaging technology, various imaging spectrometers have been mounted on unmanned aerial vehicles (UAV), aviation, and satellite platforms, and a wealth of HSI data has been obtained [10,11,12]. However, the existing hyperspectral datasets are mostly limited to a small area, resulting in relatively simple classification scenarios [13]. Unlike UAV and airborne HSIs for land cover identification tasks in a small region [14], satellite HSIs are ideal for mapping the distribution of ground objects over a large area. For instance, Su et al. [15] used China GaoFen-5 satellite hyperspectral imagery to map land cover distributions and spatial patterns of three wetlands, and Wei et al. [16] attempted to identify grassland communities using ZY1-02D satellite hyperspectral imagery. Nevertheless, spectral variability and spatial heterogeneity under low spatial resolution and algorithm cost under large amounts of data are still challenging for large-scale refined land cover classification and mapping using satellite HSIs. Furthermore, the high-dimensional characteristics of HSIs and massive data over large areas still necessitate efficient models for future applications in image processing on real-time platforms. Thus, improving the efficiency of classification algorithms while maintaining their performance still needs further exploration.
Over the past few years, the commonly used hyperspectral classification methods have included conventional machine learning algorithms and deep learning algorithms [17,18]. Conventional machine learning algorithms, such as Support Vector Machine (SVM) [19], Random Forest (RF) [20], Sparse Representation (SR) [21], and kernel-based strategies [15,22], are constantly used in hyperspectral classification. Nonetheless, conventional machine learning algorithms cannot achieve satisfactory classification accuracy under high spectral variability and the predicament of the mutual restriction between a relatively small training set and a high-dimensional spectrum (i.e., the Hughes phenomenon) [23] due to weak representation ability, especially in large-scale hyperspectral fine classification. In recent years, deep learning algorithms, including Recurrent Neural Networks (RNN) [24], Convolutional Neural Networks (CNN) [25], Graph Neural Networks (GNN) [26], the newly emerged Transformer [27], and so on, have been innovatively introduced from the computer vision (CV) field to the hyperspectral classification community. The advantages of deep learning algorithms mainly depend on their structure with multiple feature extraction layers, which can extract the semantic features of ground objects from shallow to deep, thereby enhancing the discriminability of the extracted features [28]. The powerful feature extraction ability also alleviates the dilemma caused by high spectral variability and the Hughes phenomenon in hyperspectral classification to a certain extent; thus, deep learning has attracted more attention in the field of hyperspectral classification [29].
According to previous studies [25,30], CNN has a distinguished performance among the deep learning algorithms and has drawn extensive attention in the hyperspectral classification community. With its unique convolution operation, CNN has the characteristics of sparse local connections and weight sharing, which can increase the depth of feature extraction layers while reducing the number of parameters and the complexity of models, thereby leading to the process of automatically extracting hierarchical semantic features layer by layer. These advantages prompted researchers to continuously explore the potential applications of CNN in classification based on hyperspectral images. Specifically, one-dimensional CNN (1D-CNN) takes the spectrum of one pixel as the input to explicitly extract the spectral features of hyperspectral data [31]. However, limited by high spectral variability, the classification accuracy of 1D-CNN hits a bottleneck. In order to alleviate this problem, 2D-CNN was introduced to perform hyperspectral classification on a patch-by-patch basis, considering the spatial correlation between the central pixel and its neighboring pixels [32]. It is worth noting that the above networks consider the spectral or spatial information separately from the HSI, which weakens the original information of the HSI to a certain extent, limiting the ultimate classification accuracy. To fully utilize the original information of 3D HSI data, 3D convolution kernels are applied to extract local characteristics of spatial and spectral dimensions simultaneously. With the ability to extract joint spatial-spectral features, 3D-CNN has significantly improved classification accuracy and dominated the field of deep learning-based hyperspectral classification [33]. All the above studies demonstrate the application potential of CNN models in the field of hyperspectral classification.
Even though the utilization of CNN significantly improves classification accuracy, there are still the following issues in the application of large-scale refined land cover classification and mapping based on the HSI:
  • In the face of high spectral variability, convolution operations cannot reasonably address sequential features and long-distance dependent features in spectral signals [27]. The category information of ground objects is mainly reflected by the spectral sequence curve in the HSI. However, the convolution kernel with a fixed size is restricted to extracting features in the local scope and ignores the global sequence relationship between bands;
  • The computational expense affects the application of CNN-based deep learning methods in large-scale HSI classification. The limited convolution kernel size requires the CNN model to increase the depth to improve its feature extraction ability [34], which leads to a high computational cost and longer training and inference times. Especially for 3D-CNN, the hyperspectral 3D data structure significantly increases the sliding number and size of the convolution kernel, thereby increasing the running time;
  • Simple feature fusion methods inadequately utilize the spatial-spectral characteristics within the HSI patches. The spatial and spectral features extracted by CNN are generally combined by simple addition or connection at the end of the network, which may weaken the integration of these features.
In short, incomplete feature extraction, inappropriate feature fusion, and high time consumption limit the application of CNN-based algorithms in hyperspectral classification.
To address the problems mentioned above, the Transformer network [35] has been introduced to the RS community from the natural language processing (NLP) and CV fields and has shown competitive results in hyperspectral classification [36]. Multi-head self-attention (MHSA) is the most critical module in Transformer, which has the global dependency feature modeling capability of sequence vectors, and the mode of multi-head parallel computing can reduce the computational loss and reduce the running time [37]. Hong et al. [27] flattened patches into sequence vectors as the input of the Transformer to capture spectral sequence relationships of hyperspectral images, which gained better accuracy compared with conventional classifiers. However, only using Transformer for HSI classification ignores the extraction of spatial local features in the image, and CNN can make up for the shortcomings of Transformer. In the process of characterizing HSIs, CNNs naturally equip themselves with the intrinsic inductive bias of scale invariance and locality, which is beneficial to the extraction of spatial texture features [38], while the Transformer has a better extraction effect and efficiency on the spectral sequence features with long-distance dependencies [34]. Thus, more scholars focused on the hybrid model, combining the advantages of both. Sun et al. [39] used a convolution module to extract low-level features, followed by a Gaussian Tokenization Transformer for feature representation and learning. Song et al. [40] designed a dual-branch Bottleneck Transformer to extract spatial and spectral features combined with 3D-CNN. However, most of the current studies combined CNN and Transformer to simultaneously extract spatial features and spectral features without distinction, ignoring the specialty of the two model structures for the respective extraction of spatial context features and spectral sequence features. In addition, these methods only use simple addition or concatenation to achieve the fusion of spatial and spectral features, which will cause information loss. Therefore, successfully fusing spatial and spectral information and combining CNN and the Transformer remain challenges for HSI classification.
In this paper, a Spatial-Convolution Spectral-Transformer Interactive Network (SCSTIN) is proposed to perform hyperspectral refined land cover classification and mapping in the eastern foothills of the Helan Mountains (EFHLM) in northern Ningxia. The study area covers about 8800 km2, which is the largest HSI classification study area known to us. The EFHLM dataset contains a preprocessed hyperspectral image with a size of 1800 × 4900 × 147 collected by the ZY1-02D satellite and ground truth labels with 16 land cover categories. The SCSTIN framework is designed to address the problems of incomplete feature extraction, inappropriate feature fusion, and long-term consumption when the existing CNN model is applied to large-scale satellite hyperspectral classification. Instead of the most commonly used 3D-CNN model, the hybrid STSCIN model combined with 2D-CNN and Transformer was devised to extract the spatial-spectral discriminant features in HSI. This model organically fuses data in two different formats to combine the respective advantages of CNN and Transformer and can improve efficiency while ensuring the accuracy of the algorithm. First, convolution-based dimensionality reduction is performed to refine redundant spectral bands and save computational costs. Afterwards, the backbone of the network integrates the spatial CNN branch and the spectral Transformer branch into a dual-branch network structure to extract spatial context features and spectral sequence features of HSIs, respectively. During the feature extraction process, a spatial-spectral interactive fusion (SSIF) unit is adopted to narrow the semantic gap between the two branches in a continuous and interactive manner. In the end, two kinds of features from two branches are input into the SoftMax classifier in a category-adaptive weighting (CAW) manner to obtain the land object classification results. The major contributions of this paper can be concluded as follows:
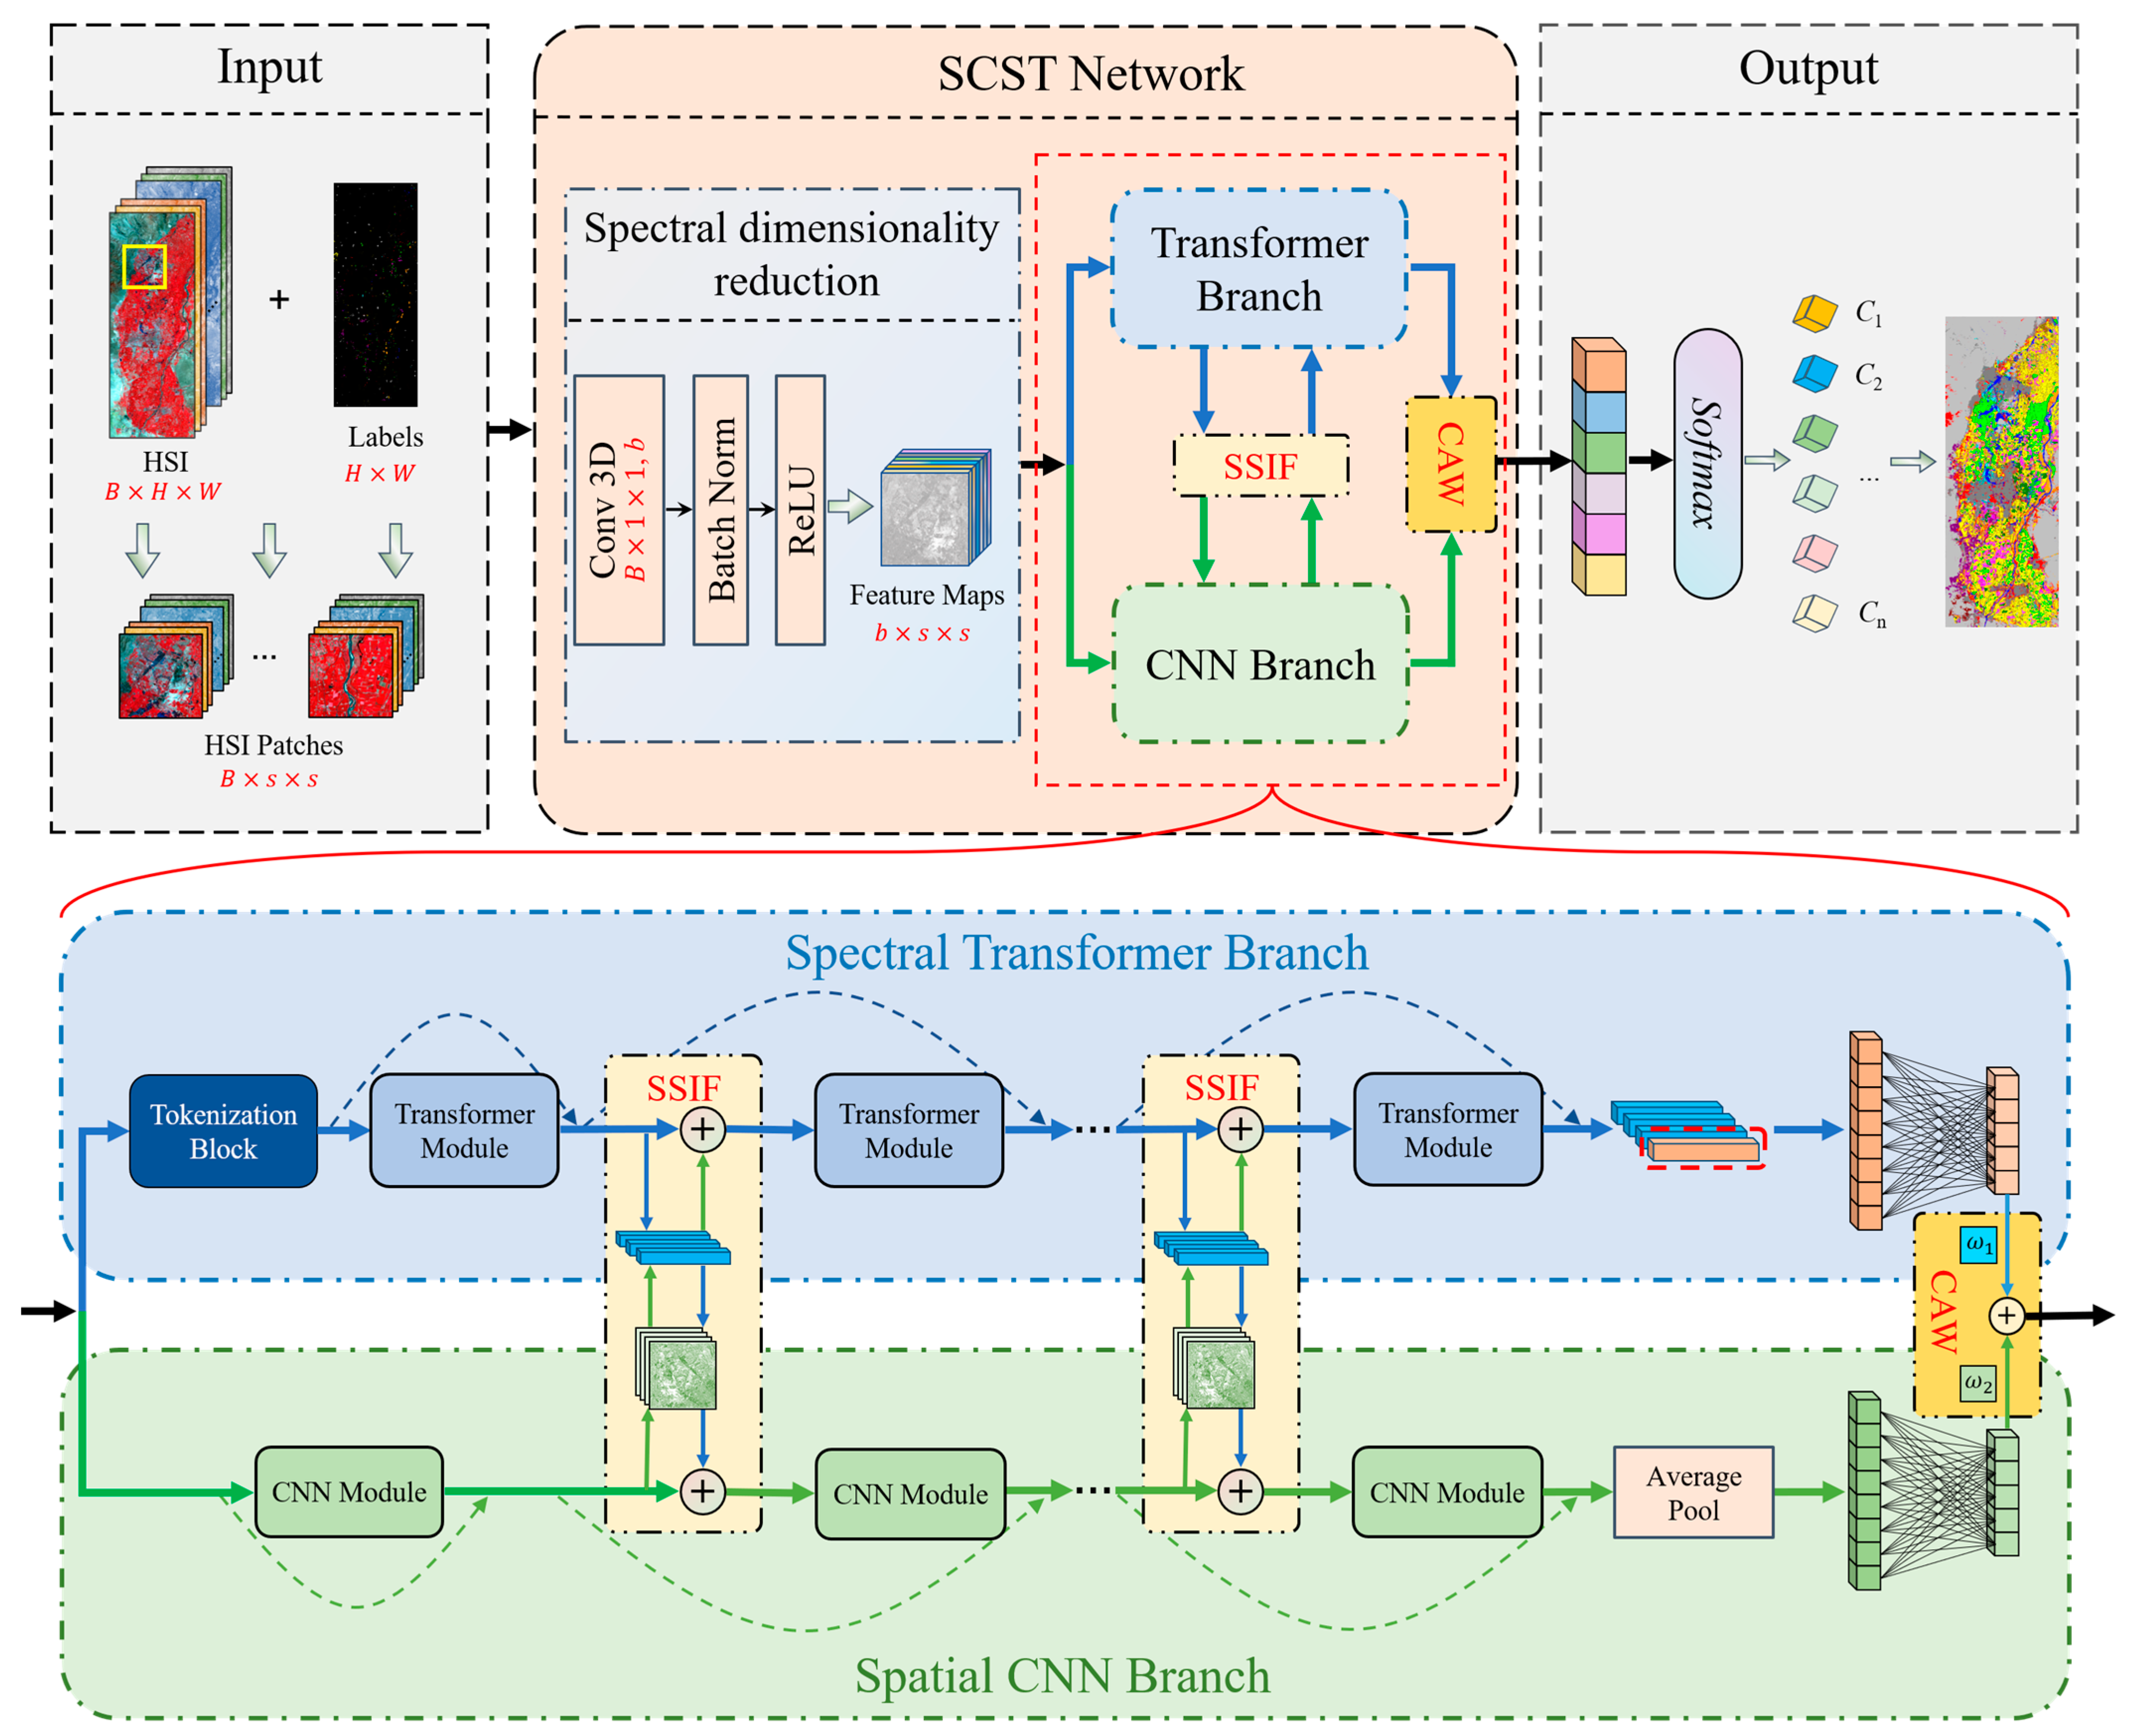
  • As an early attempt, a new Spatial-Convolution Spectral-Transformer Interactive Network (SCSTIN) is proposed for large-scale fast refined land cover classification and mapping using ZY1-02D satellite hyperspectral imagery. The CNN and Transformer are innovatively integrated as dual-branch architectures to efficiently perform hyperspectral image classification tasks;
  • To extract spatial context characteristics and spectral sequence features of HSI according to the data organization format, 2D-CNN and Transformer are performed in the spatial branch and the spectral branch, respectively. This design can make full use of the respective strengths of CNN and the Transformer to extract spatial and spectral semantic information, respectively;
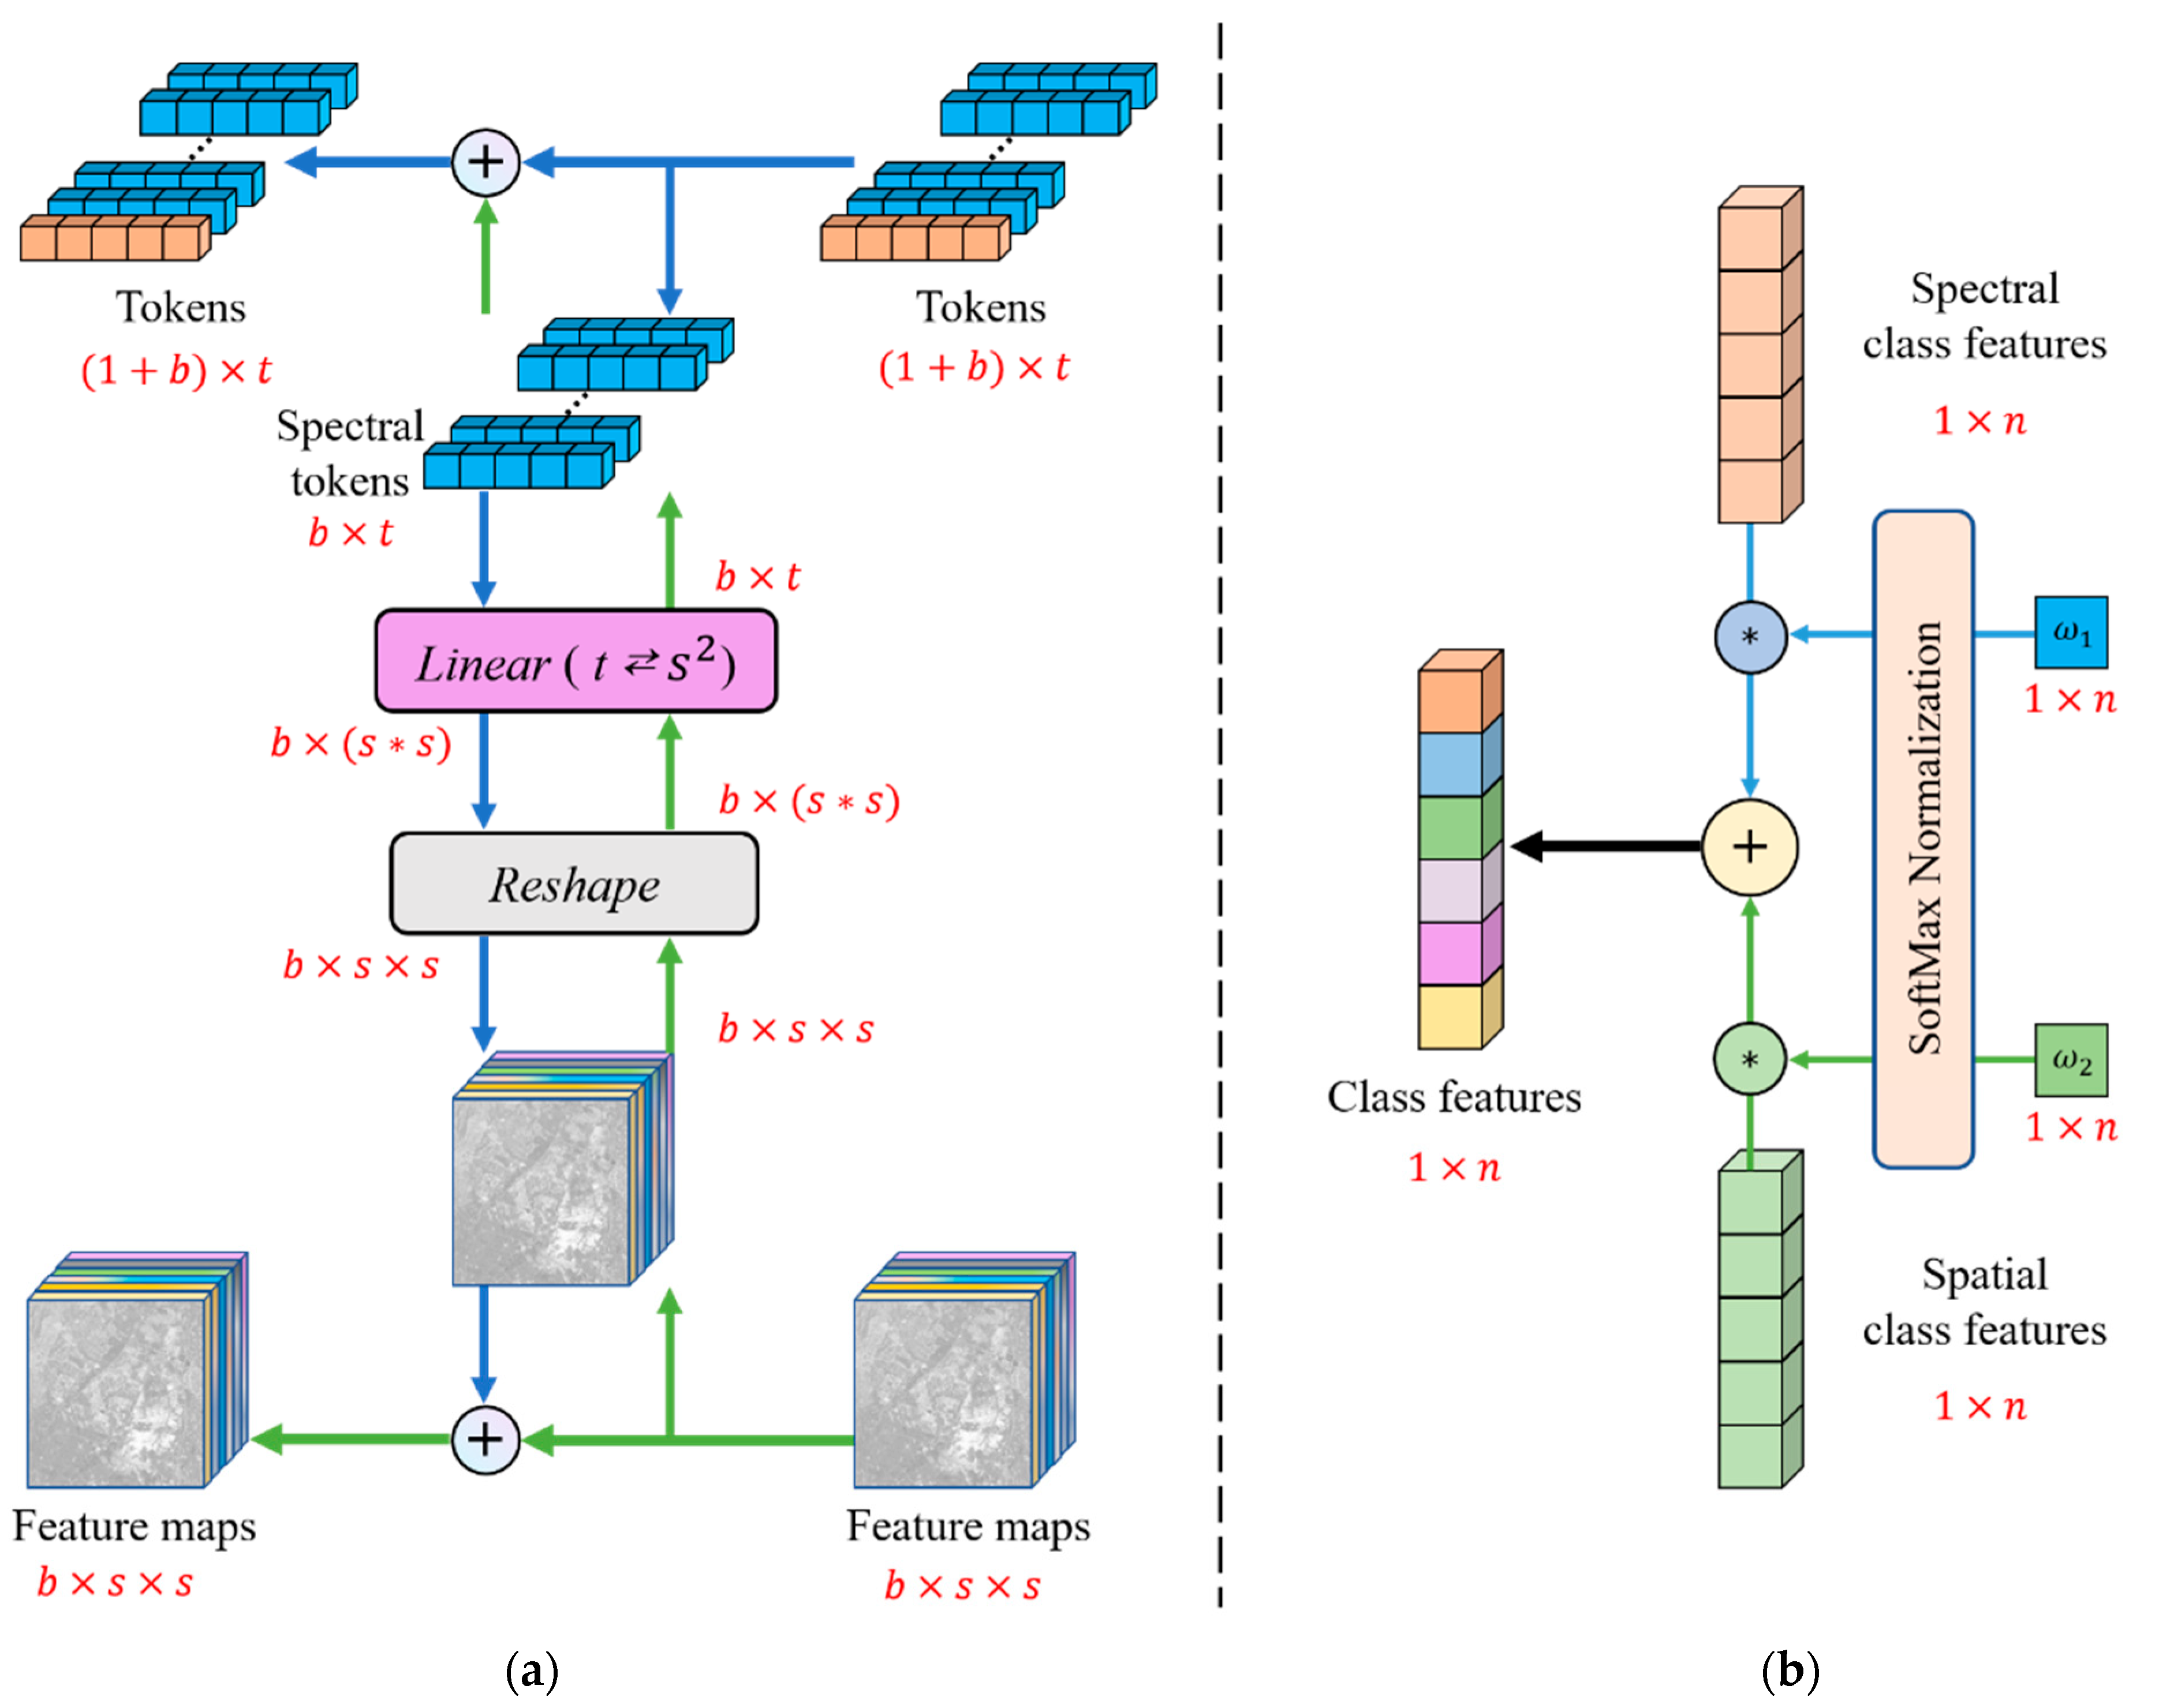
  • Two blocks, including SSIF and CAW, are designed to effectively fuse spatial and spectral features at different stages of SCSTIN. In the process of extracting features from two different branches, SSIF fuses two types of features continuously and interactively. Before the two types of discriminative features are fed into the classifier, the CAW is used to apply adaptive weights to the features for further fusion;
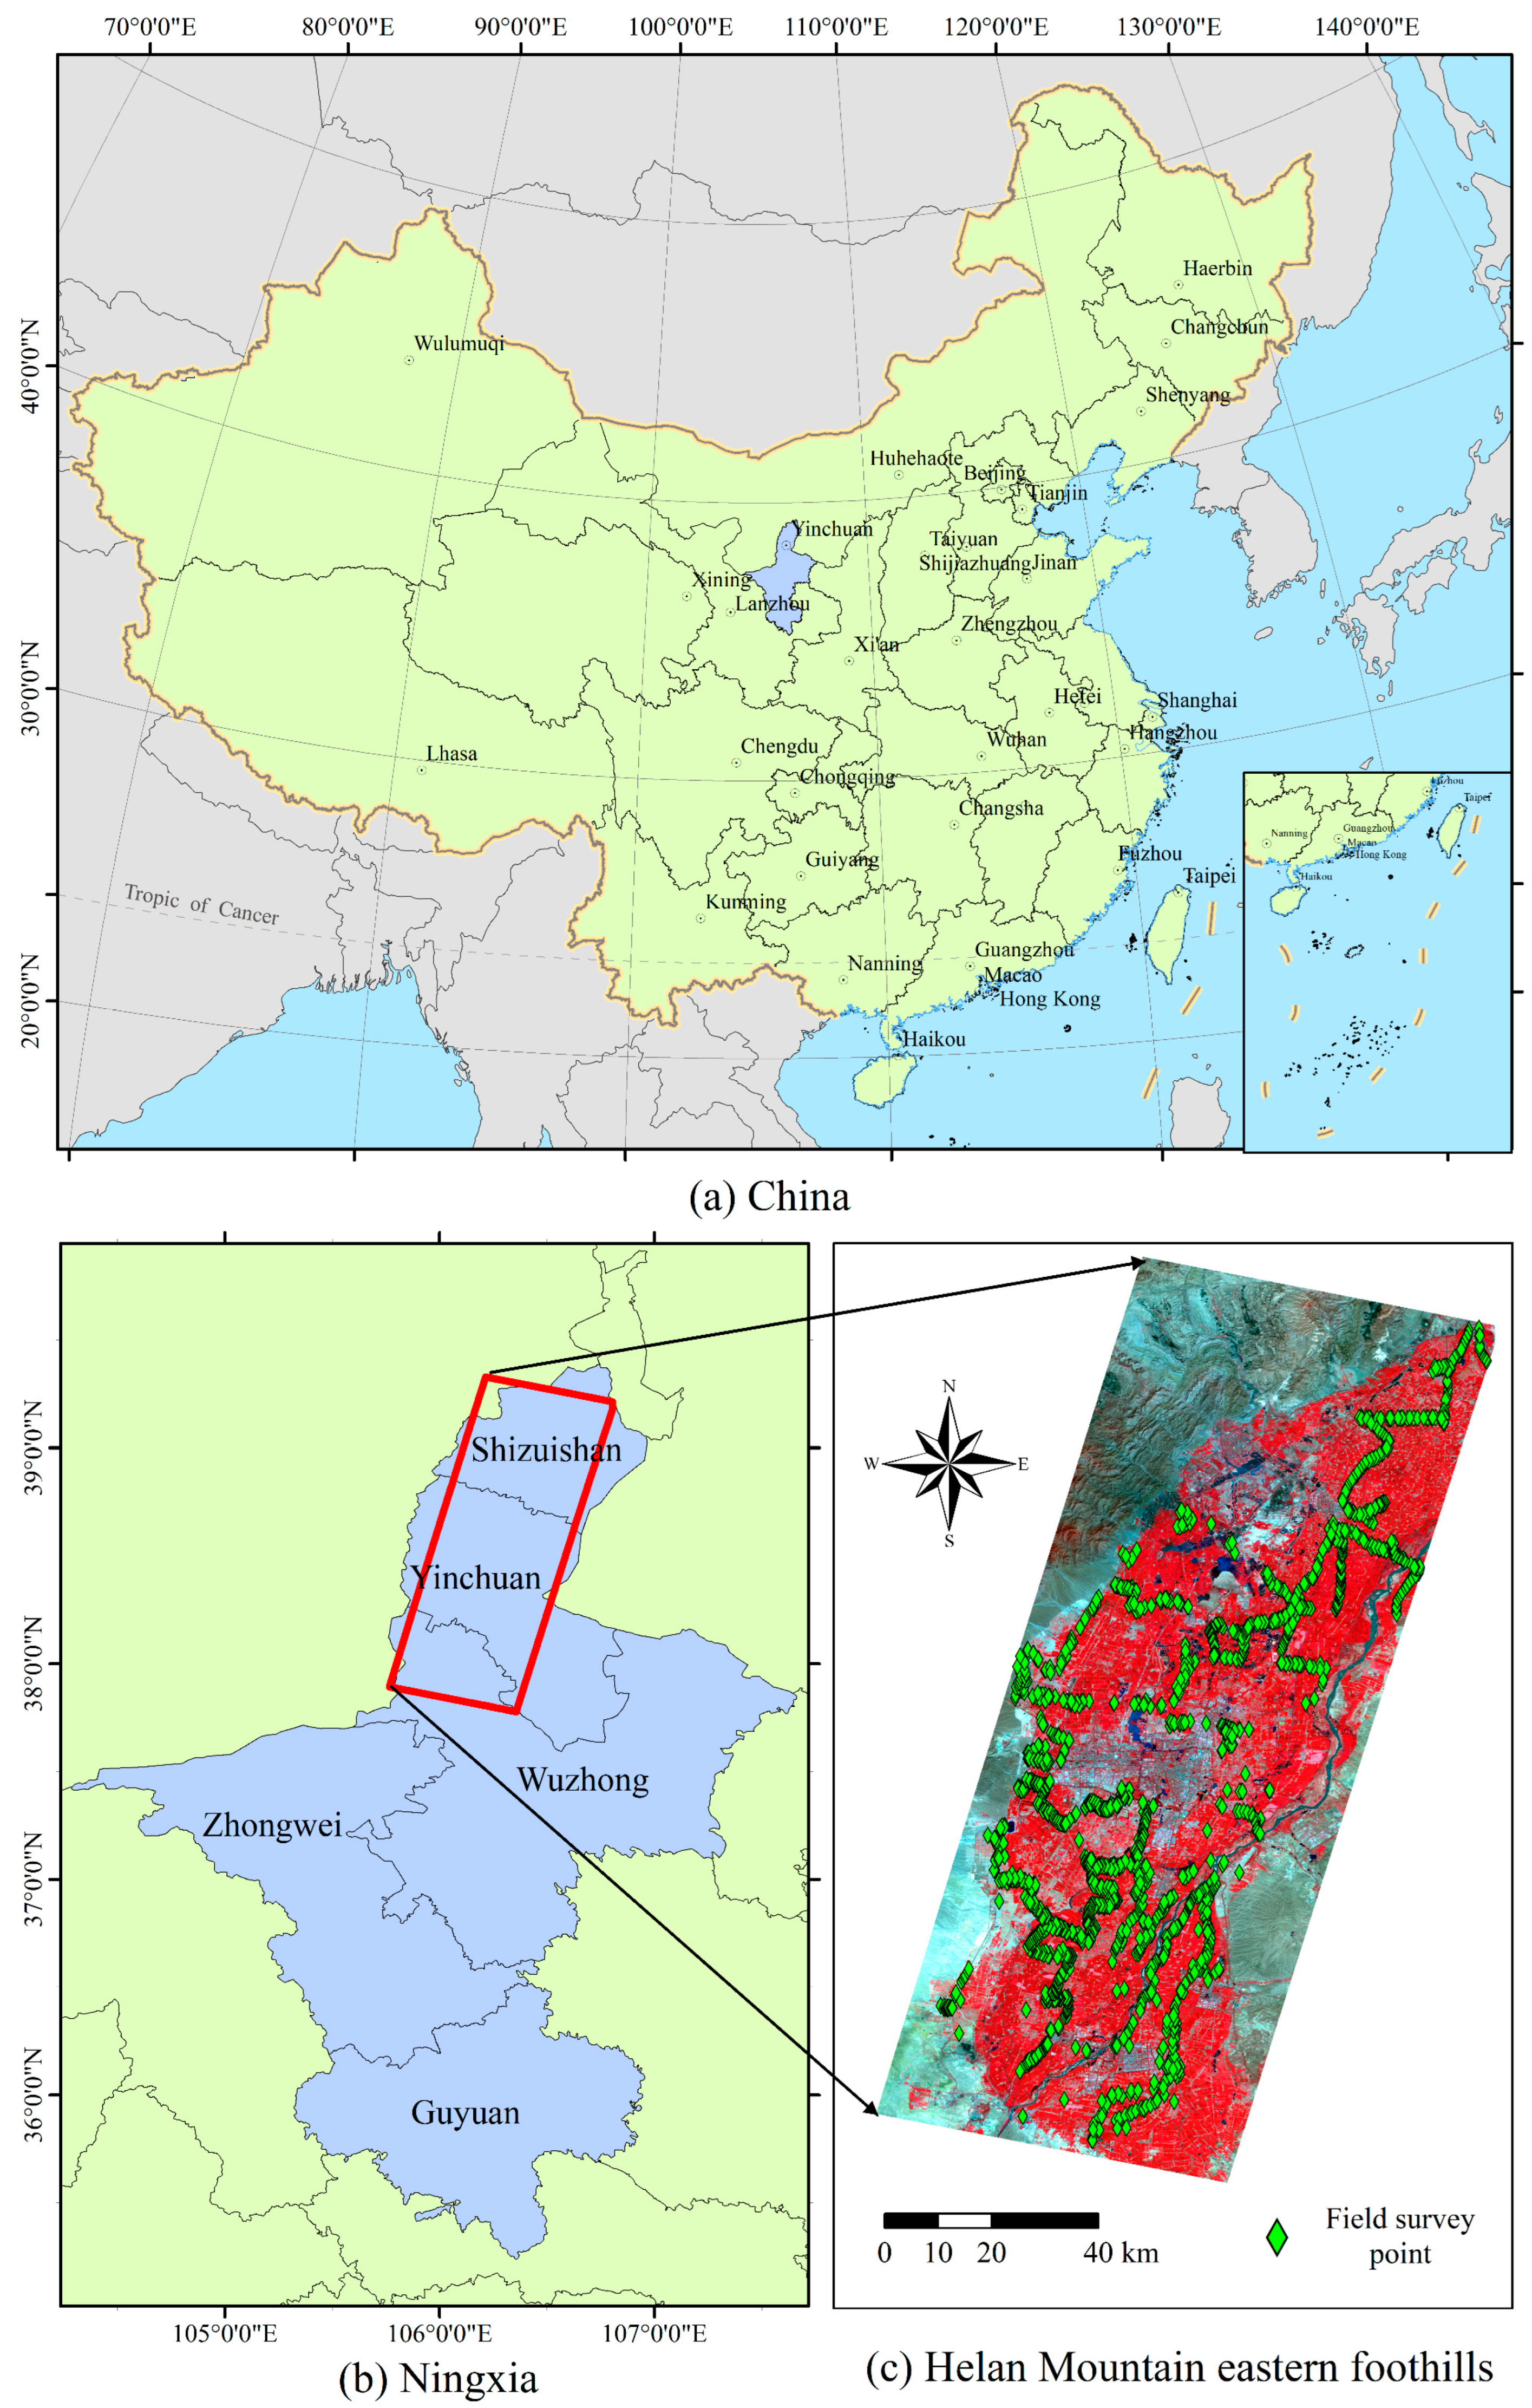
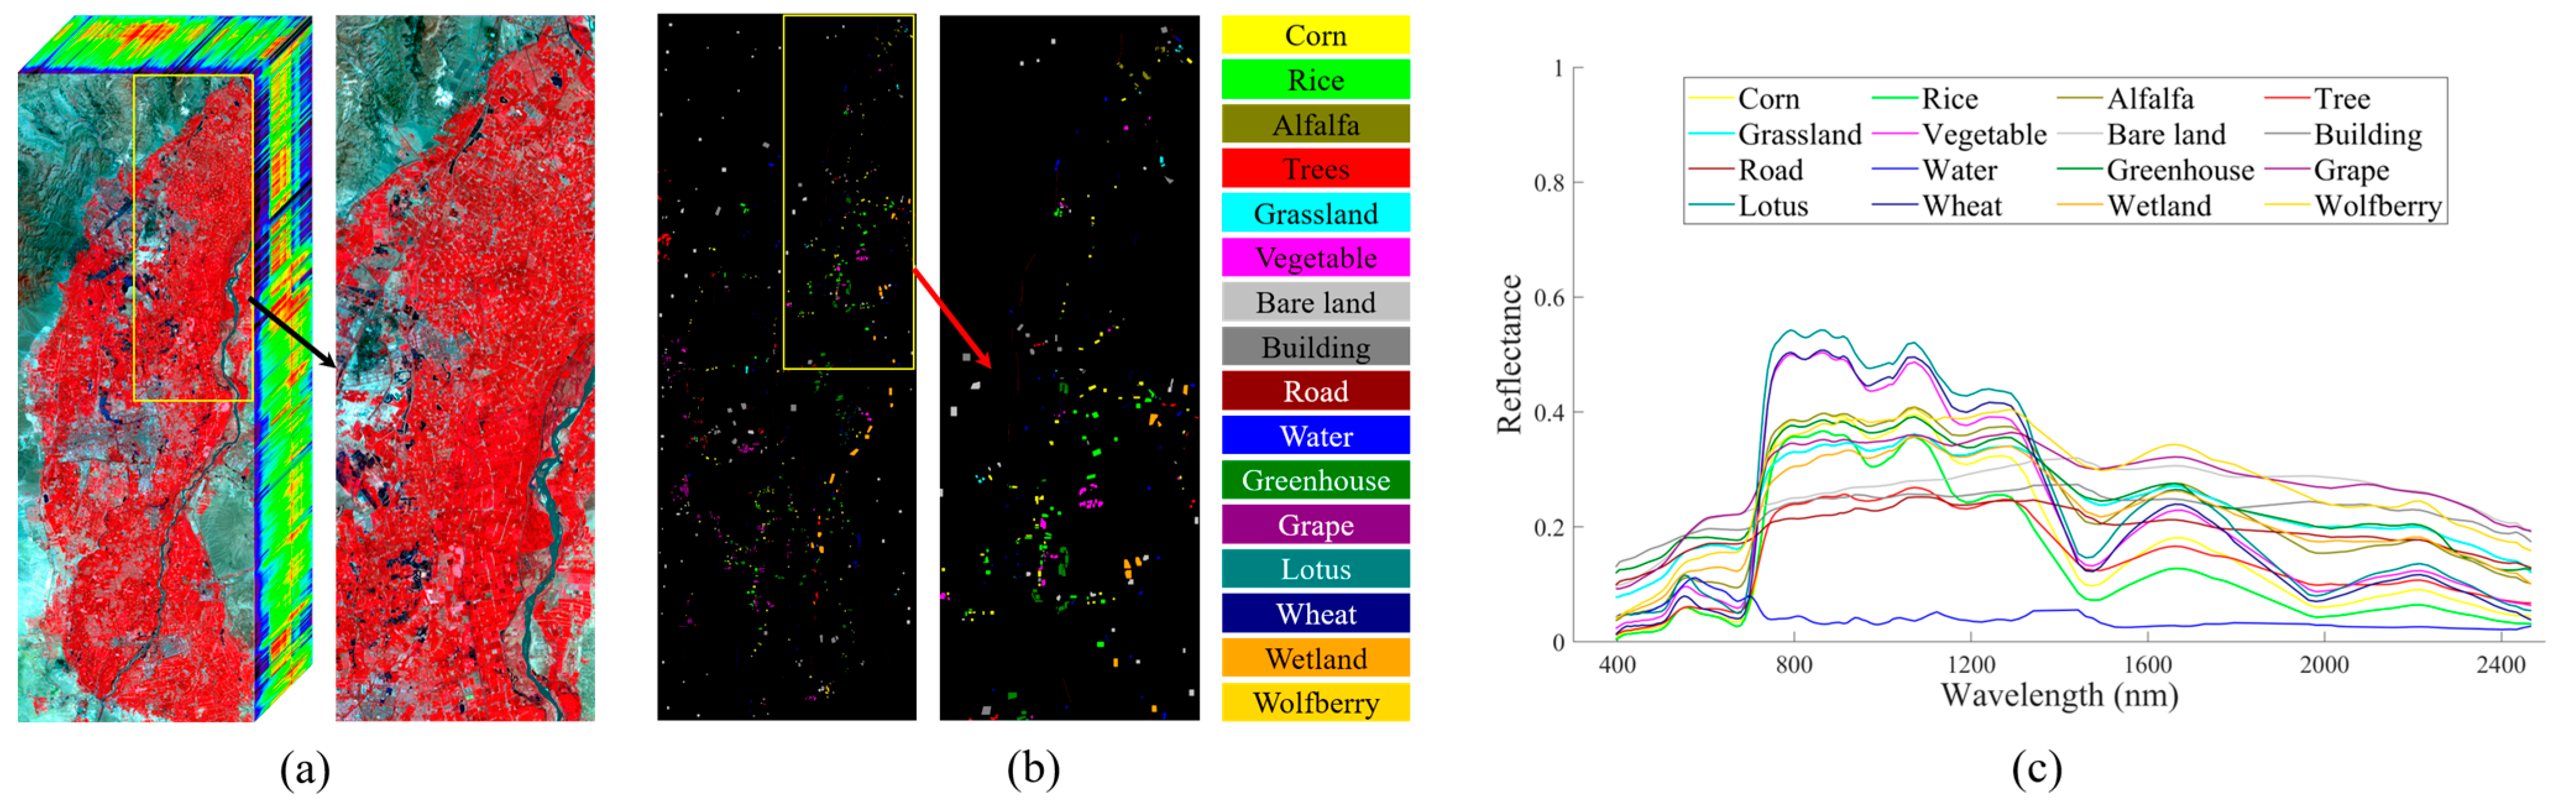
  • The superiority of the proposed SCSTIN framework is experimentally verified and compared with other advanced algorithms on the large-scale eastern foothills of the Helan Mountains (EFHLM) dataset, which covers about 8800 km2 with 16 types of ground objects (the largest dataset to our knowledge). The spatial distribution patterns of ground objects in the EFHLM region are also shown and analyzed. In addition, extended experiments on the EFHLM dataset and two benchmark datasets (i.e., Indian Pines and Botswana) demonstrate that the proposed SCSTIN can achieve satisfactory classification performance with low complexity and high efficiency.

2. Data and Materials

2.1. Study Area

The eastern foothills of the Helan Mountains (EFHLM) are located in the northern part of the Ningxia Hui Autonomous Region in China, as shown in Figure 1a. This is a stripe-like area between the Helan Mountains and the Yellow River floodplain, extending over the three cities of Shizuishan, Yinchuan, and Wuzhong. The study area experiences an arid and semi-arid continental climate, characterized by dryness and low precipitation, high sunshine duration, and large diurnal variation of temperature. The daily temperature fluctuation ranges between 12 and 15 °C, while the annual average precipitation hovers between 150 and 240 mm. However, evapotranspiration can reach as high as 800 mm or even 1000 mm, which is conducive to the accumulation of secondary metabolites. Consequently, the primary land use type in this area is agricultural land, which covers most of the area (Figure 1c). Additionally, diverse crops are cultivated in this area, including corn, rice, alfalfa, etc. More importantly, due to its superior geographical location (37°–39°N in Figure 1b), unique topographical features, and suitable soil and climatic conditions, the EFHLM is considered an ideal “golden zone” for grape cultivation, wine-making, and high-end wine production in the world [41]. Consequently, accurately and finely mapping the vegetation distribution in this study area poses both challenges and significance.

2.2. ZY1-02D Hyperspectral Imagery and Preprocessing

The ZiYuan 1-02D (ZY1-02D) is China’s first civil hyperspectral service satellite [42], carrying a new generation of advanced hyperspectral imager (AHSI) sensor [12], whose detailed configurations are listed in Table 1. It has a total of 166 spectral bands, including 76 bands in visible and near-infrared (VNIR) and 90 bands in shortwave infrared (SWIR), covering the wavelength of 400–2500 nm. Fine spectrograms are obtained by AHSI with spectral resolutions of 10 and 20 nm in the VNIR and SWIR regions, respectively. Moreover, the AHSI has a spatial resolution of 30 m and a high swath width of 60 km, which is suitable for large-scale mapping.
The ZY1-02D hyperspectral images acquired on 15 August 2021, with no clouds, are used for the EFHLM’s refined land cover classification and mapping. These images were L-1A products downloaded from the Natural Resources Satellite Remote Sensing Cloud Service Platform of China (http://sasclouds.com/chinese/normal/, accessed on 15 August 2021). Thus, some preprocessing is needed. First, it is worth noting that the VNIR region and the SWIR region of the hyperspectral curve have overlapping parts. Considering the high spectral resolution in the VNIR region, the 3 spectral bands at 1005–1040 nm in the SWIR region were removed to reduce redundant information. Meanwhile, 16 bands severely affected by water vapor absorption were also removed to improve data quality. Thus, a total of 147 spectral bands were utilized in the EFHLM hyperspectral dataset. Second, the digital number values of the raw hyperspectral image were converted to radiance by radiometric calibration. Additionally, atmospheric correction was done by the Fast Line-of-Sight Atmospheric Analysis of Spectral Hypercubes (FLAASH) method to obtain the spectral reflectance data. Finally, the acquired reflectance images were mosaicked and cropped to form one 1800 × 4900 × 147 image that fully covers the study area. The aforementioned preprocessing operations were all conducted using ENVI 5.3 software on a Windows 10 system with an NVIDIA GeForce RTX 2070 GPU and an Intel Core i9-10900K CPU.
In addition to the ZY1-02D hyperspectral data, another key part of the EFHLM dataset is the ground truth labels of the image. From 14 to 17 August 2021, a field survey covering the entire study area was carried out, collecting field samples (Figure 1c). Combined with field surveys and visual interpretation based on high-spatial-resolution remote sensing images in Google Earth, pixel-level categories in hyperspectral images were labeled. Referring to the labeling principle used by Su et al. [15], discontinuity in space, sufficiency in quantity, and typicality of samples are three important indicators for labeling. The above three criteria were also followed in our labeling process. Finally, a total of 16 types of ground objects were labeled in the EFHLM dataset, and detailed information is listed in Table 2. In addition, 1% of the labeled samples were randomly selected as training samples for subsequent experiments, which will be analyzed in the Section 5.

2.3. EFHLM Dataset

The EFHLM dataset (Figure 2) mainly contains two kinds of data: hyperspectral image cube data and ground truth label data. The size of the EFHLM hyperspectral image is 1800 × 4900 with 30 m spatial resolution. The coverage area of EFHLM is about 8800 km2, which is much larger than the commonly used public hyperspectral datasets. The number of spectral bands is 147 after image preprocessing. The labels of a total of 16 typical ground objects are evenly distributed in the label map, as shown in Figure 2b. In addition, the average reflectance for each type of ground object was calculated and shown in Figure 2c. The EFHLM dataset is used as a benchmark dataset in this paper for large-scale ground object fine classification and mapping based on ZY1-02D satellite hyperspectral data.

3. Methodology

3.1. Overview of the SCSTIN

The overall pipeline of the proposed SCSTIN framework used for HSI classification is shown in Figure 3. SCSTIN is an end-to-end patch-wise classification method, which features a spectral dimensionality reduction block, a spectral Transformer branch, a spatial CNN branch, SSIF modules, and a CAW module. Incomplete feature extraction, inappropriate feature fusion, and longtime consumption are the major challenges for the CNN models to be applied in the classification of large-scale satellite hyperspectral images. These problems are addressed to some extent in the proposed SCSTIN framework.
Before being fed into the network, HSI data with the size of B × H × W ( B represents the number of bands, H represents the height of the image, and W represents the width of the image) is cropped into HSI cube patches with the size of B × s × s ( s represents the size of the cube patch), which take the labeled pixel as the center pixel. In the first stage of the SCSTIN framework, in order to alleviate spectral information redundancy caused by the high correlation between spectral bands and improve the operation efficiency of subsequent stages, a spectral dimensionality reduction block is adopted. During the process of spectral dimensionality reduction, the number of spectral feature bands for the cube patch is refined from B to b ( b represents the number of feature bands, b < B ) by b 3D convolution kernels of B × 1 × 1 size. Batch norm (BN) and ReLU functions are conducted subsequently to achieve regularization and nonlinear activation to improve the performance of the network.
In terms of feature extraction, 3D-CNN is the most commonly used structure in the state-of-the-art hyperspectral classification method to integrally mine the spatial-spectral discrimination features [43]. However, the locally sliding convolution operation of CNN with fixed kernels performs better at characterizing spatial context information and is not suitable for the extraction of spectral sequence features, which will lead to information loss and reduce model efficiency [44]. While the characteristic of Transformer to extract sequence features can make up for this. Furthermore, 2D-CNN and Transformer with MHSA have advantages in speed compared to 3D-CNN. Therefore, considering the need for large-scale mapping, in the SCSTIN framework, the feature extraction stage is purposefully designed to synthesize the respective advantages of the Transformer and 2D-CNN, which consist of a spectral Transformer branch, a spatial CNN branch, and two types of feature fusion modules. The feature maps from the spectral dimensionality reduction block are fed into the spectral Transformer branch and the spatial CNN branch to deep extract spectral features and spatial features layer by layer, respectively. During the feature extraction process, SSIF converts the two forms of data into each other and integrates them together as spatial-spectral features; after the feature extraction process, CAW adaptively aggregates the spectral class features from the Transformer branch and spatial class features from the CNN branch into final classification features. The skip connection (SC) is also adopted to reduce information loss and avoid gradient problems during the propagation of networks (dotted arrow in Figure 3) [45]. At the last stage, the final classification features are input to the SoftMax classifier to obtain the class information for each pixel.
In summary, the whole network adopts the concise and fast Transformer and 2D-CNN to effectively extract spatial and spectral features according to their respective characteristics, leveraging SSIF and CAW to fuse the extracted features at different stages of the network, and finally achieving better performance in both speed and accuracy.

3.2. Spectral Transformer Branch

The spectral Transformer branch is designed to handle the problem of insufficient spectral sequence feature extraction. Benefiting from the powerful global feature extraction capabilities, the Transformer has achieved progressive results in the field of HSI processing [46], in applications such as classification [34], spectral super-resolution [47], change detection [48], unmixing [49], and target detection [50]. However, most of these studies draw on the application of Transformer in the field of CV, focusing on the extraction of global spatial information while ignoring the extraction of spectral sequence information. In the proposed SCSTIN framework, the spectral Transformer branch aims to deep mine spectral sequence features with long-distance dependencies, which is achieved by modeling interaction information between any two spectral feature bands and increasing the weight of the more important bands. Figure 4 shows the structure of the spectral Transformer branch. Firstly, the organization format of data output by the spectral dimensionality reduction block is converted from feature maps to tokens, which is a 1D vector organization format of data that can be received by the Transformer module. Subsequently, tokens from the tokenization block are input into multiple Transformer modules connected in tandem to deep mine the spectral features by considering sequence and dependency characteristics between spectral feature bands. Additionally, from the second Transformer module to the last one, SSIF is performed before it to supplement spatial information from the CNN module. Moreover, the SC structure is applied to each Transformer module to maximize information retention. Lastly, only the vector related to class information in the tokens, called the class token, is taken out to be projected into spectral class features with n (the number of classes) size through a fully connected layer (FC).

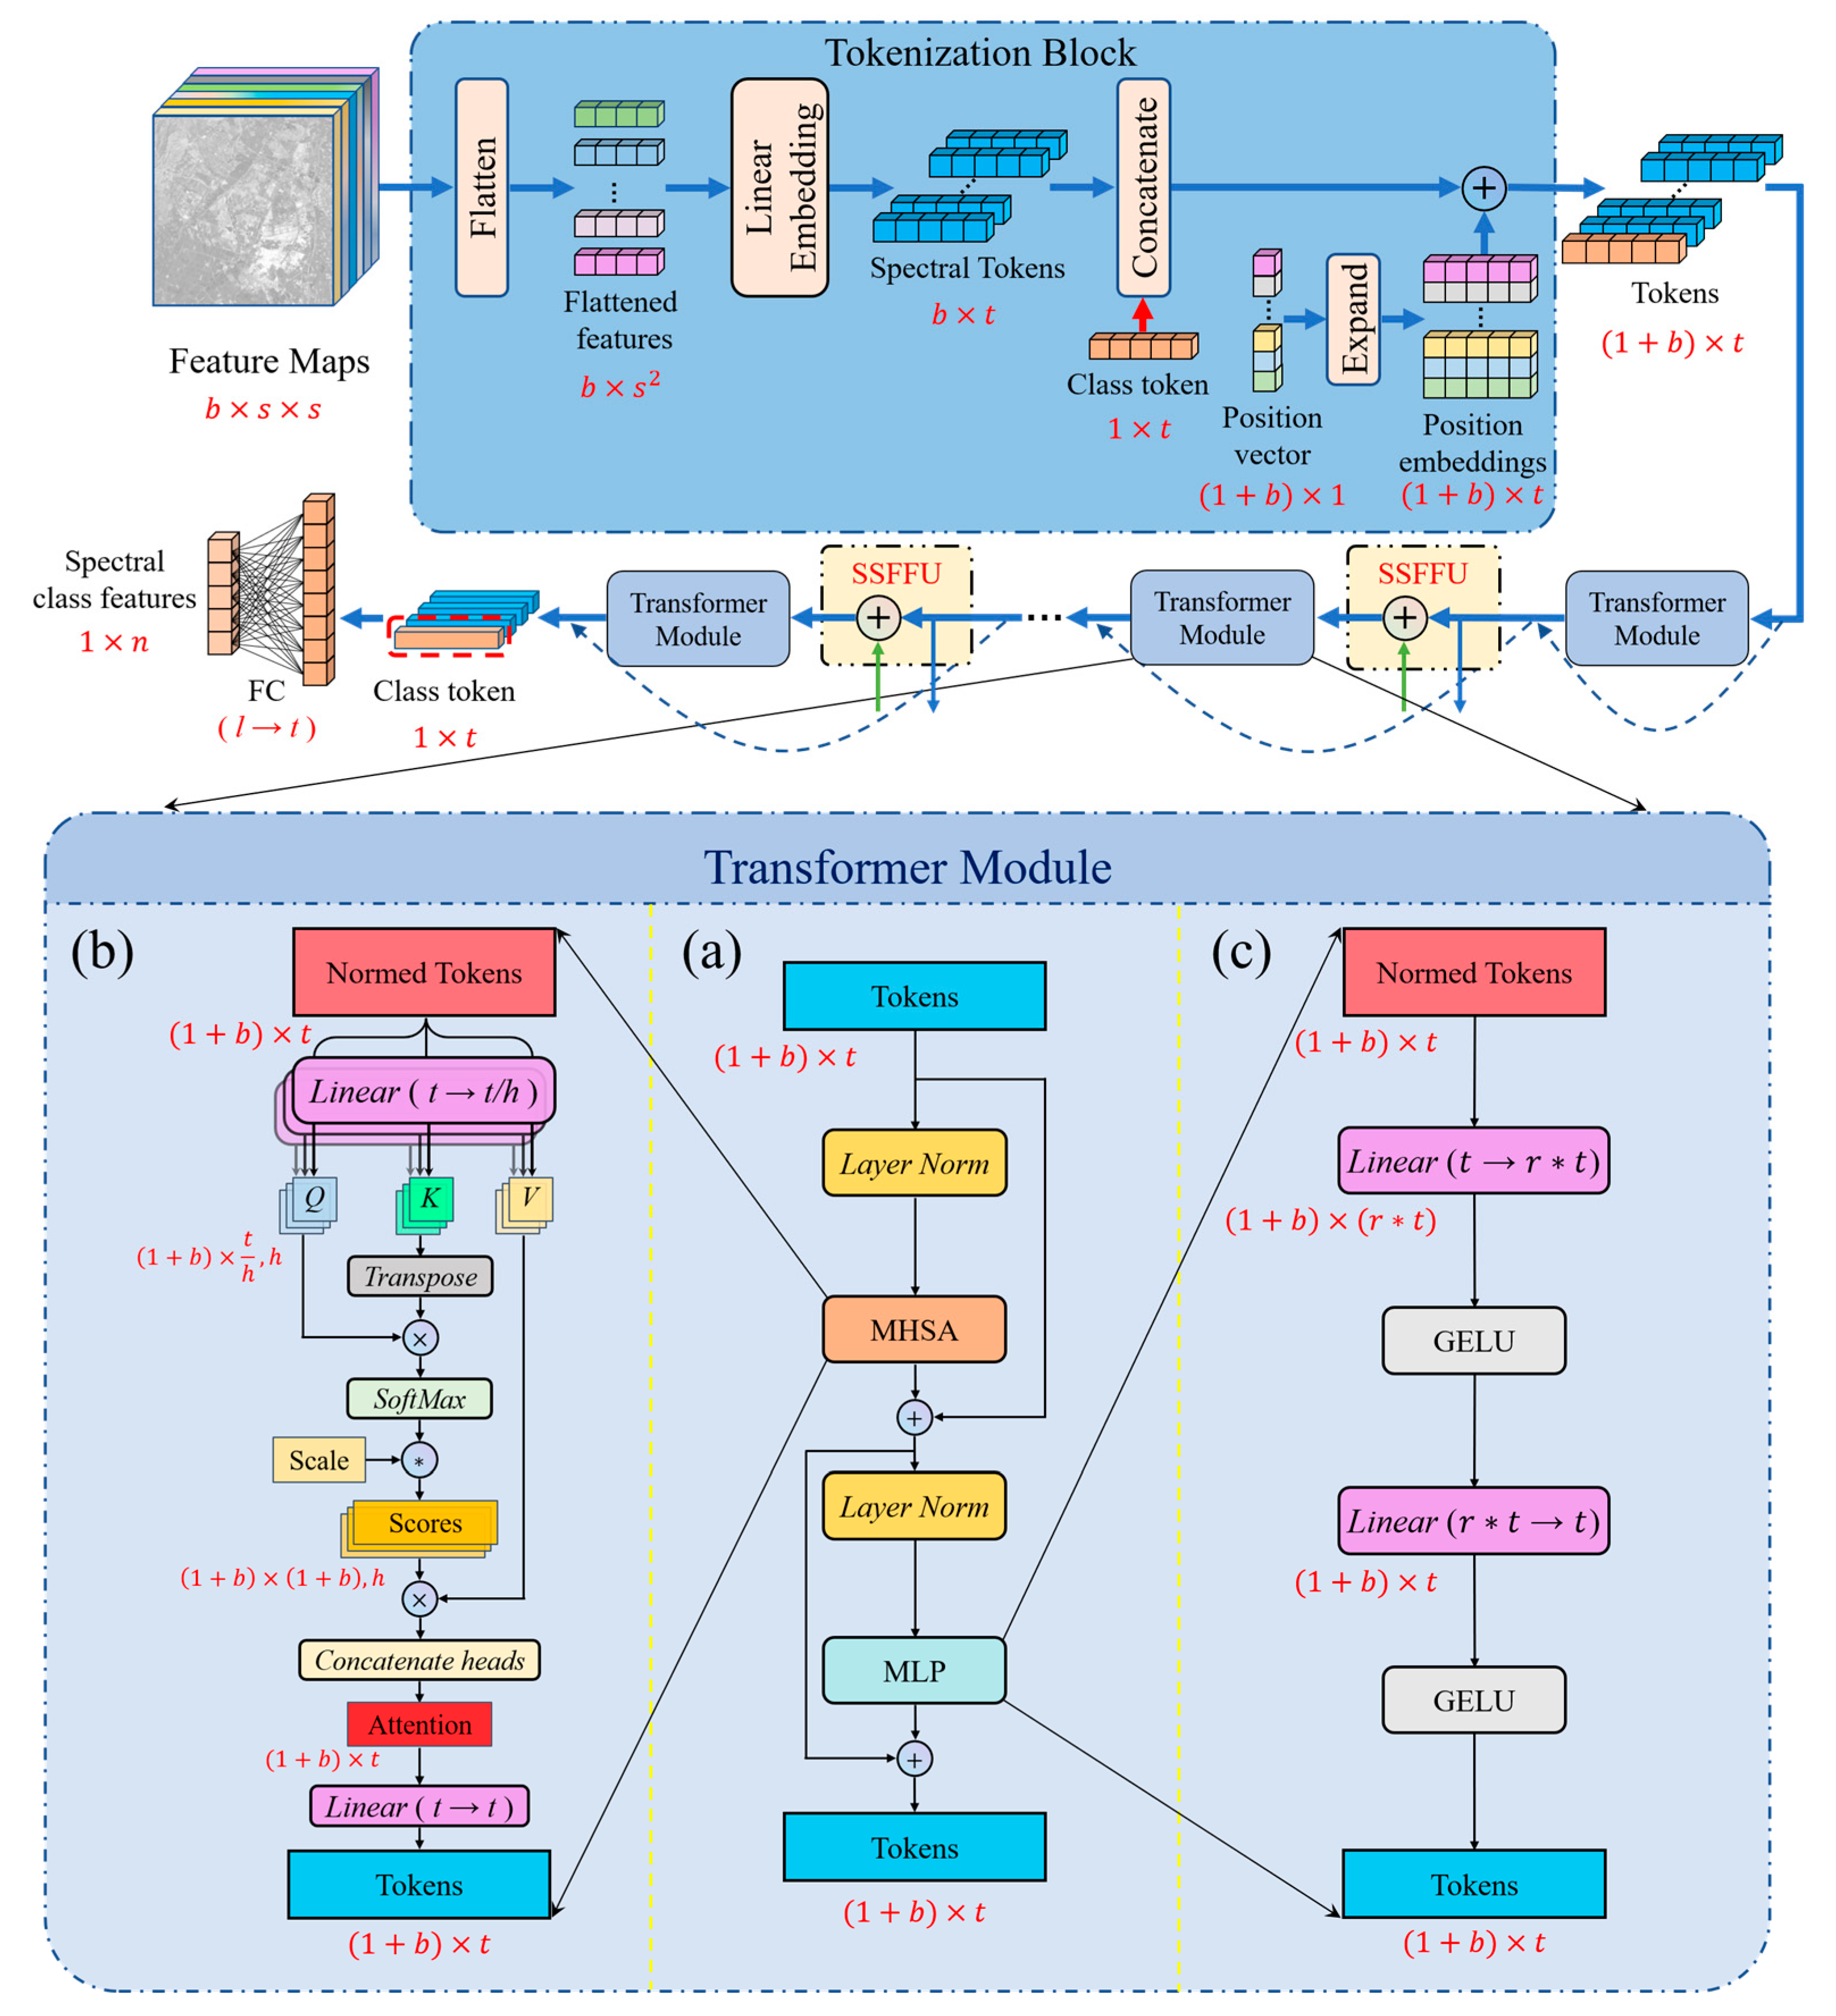
3.2.1. The Tokenization Block

The Transformer module receives 2D tokens as input. To handle 3D feature maps, the tokenization block is designed to perform data format conversion from feature maps to tokens by embedding 2D spatial information into 1D feature vectors and adding learnable supplementary information. “Tokens” originated in the field of NLP, which is used to characterize vectors with sequence relationships, such as words in sentences [35]. Therefore, this data organization format, as the input of the Transformer, is ideal for characterizing spectral bands that have sequence features. In the proposed SCSTIN framework, tokens consist of three components: spectral tokens, the class token, and position embeddings. The spectral tokens are specially designed in this paper to feature spectral information using vectors. As a complement, the class token and position embeddings are learnable parameters that are updated as part of the continuous training of the network. The class token realizes global feature aggregation by aggregating weighted information from all other tokens, and positional embeddings enable the model to perceive sequence information of spectral features by labeling the position of each token [51].
As shown in the upper part of Figure 4, for the input feature maps X R b × s × s , the 2D spatial information map of s × s size is flattened into a 1D feature vector with the size of s 2 . The flattened vectors are then fed into a linear embedding process, which encodes the spatial information of each spectral feature band into the feature representation of the corresponding band, called the spectral token in our net. The spectral tokens have the size b × t , where t is the embedding dimension. Subsequently, a prepended class token with the dimension size of 1 × t , which is a randomly generated learnable vector, is concatenated with the spectral tokens to construct ( 1 + b ) × t size tokens. Importantly, in order to supplement the sequence position information between b + 1 tokens, the element-wise sum is conducted between current tokens and position embeddings with ( 1 + b ) × t size. The position embeddings are expanded from the learnable ( 1 + b ) × 1 size position vector. Finally, the tokens T 0 R ( 1 + b ) × t are the output. In summary, the whole process for the tokenization block is formulated as follows:
T 0 = T c ; T s + P E ; T c R 1 × t ; T s R b × t ; P E R ( 1 + b ) × t
where T c is the randomly generated class token, T s are the spectral tokens, and P E represents the position embedding. ; represents the operation of concatenation. T s and P E are calculated as follows:
T s = f L X F ; X F R b × s 2 X F = F l a t t e n X ; X R b × s × s f L x = x W T + b ; W R t × s 2 , b R t × 1
P E = E x p a n d P V ; P V R ( 1 + b ) × 1
where X F is the flattened feature map and P V is the randomly generated position vector. f L · represents the linear embedding process, where W and b are learnable parameters. E x p a n d ( · ) operation is used to replicate t copies of P V to form P E .

3.2.2. The Transformer Module

Taking tokens as input, the Transformer modules are able to deeply excavate global spectral sequence information layer by layer by applying MHSA and multilayer perceptron (MLP). As is shown in Figure 4a, MHSA first uses the attention mechanism to establish the relationship between any two tokens to realize the modeling of long-distance dependence of features, and MLP is conducted subsequently to weight each token to highlight important spectral feature bands for classification. Layer norm operation is adopted before the two blocks to standardize the spectral feature dimension and speed up the convergence of the network. In addition, the SC structure is also applied in the two blocks to avoid problems of gradient vanishing and exploding. The formula for the Transformer module can be expressed as:
T i = T M H S A + M L P L N T M H S A ; T M H S A R 1 + b × t T M H S A = T i 1 + M H S A L N T i 1 ; T i 1 R 1 + b × t
where T i denotes the output tokens of the ith Transformer module, T M H S A is the output of the MHSA block, M H S A · indicates operation of the MHSA block, and M L P · represents operation of the MLP block.
Figure 4b shows the detailed process for MHSA in the Transformer module. The normed tokens are linearly projected into three elements with a size of ( 1 + b ) × t / h ( h is the number of heads) called query ( Q ), key ( K ), and value ( V ). Scores with a size of ( 1 + b ) × ( 1 + b ) are calculated from Q and K , which can quantitatively reflect the relationship between any two spectral characteristic bands. Then multiply scores by V to get the Attention of one head. After the above process is performed h times in parallel, h Attentions are concatenated together to form the final Attention with a size of ( 1 + b ) × t . In the last step, the final Attention is fed to the linear projection layer to further mine its deep features and is output as new tokens. The formula for the final Attention can be expressed as:
A t t e n t i o n = H 1 ; ; H h ; H i R 1 + b × t h H i = s o f t m a x Q K T s c a l e V ; Q , K , V R 1 + b × t h
where H i represents the attention obtained in each head and s c a l e is a constant that equals t / h .
Figure 4c shows the specific structure for MLP with one hidden layer in the Transformer module. The normed tokens from MHSA are successively sent to two linear projection layers, which can fully excavate deep features for the HSI image. The Gaussian error linear unit (GELU) is used as an activation function after linear projection to introduce non-linear factors into MLP. The formula for the MLP can be expressed as follows:
M L P T = G E L U f L 2 G E L U f L 1 T ; T R 1 + b × t f L 1 x = x W T + b ; W R ( r t ) × t , b R ( r t ) × 1 f L 2 x = x W T + b ; W R t × ( r t ) , b R t × 1 G E L U x = x · Φ x = x · 1 2 1 + erf x 2 erf x = 2 π 0 x e t 2 d t
where r is the increase ratio of neurons for the hidden layer, G E L U · is the GELU activation function, and Φ x represents the standard Gaussian cumulative distribution function.

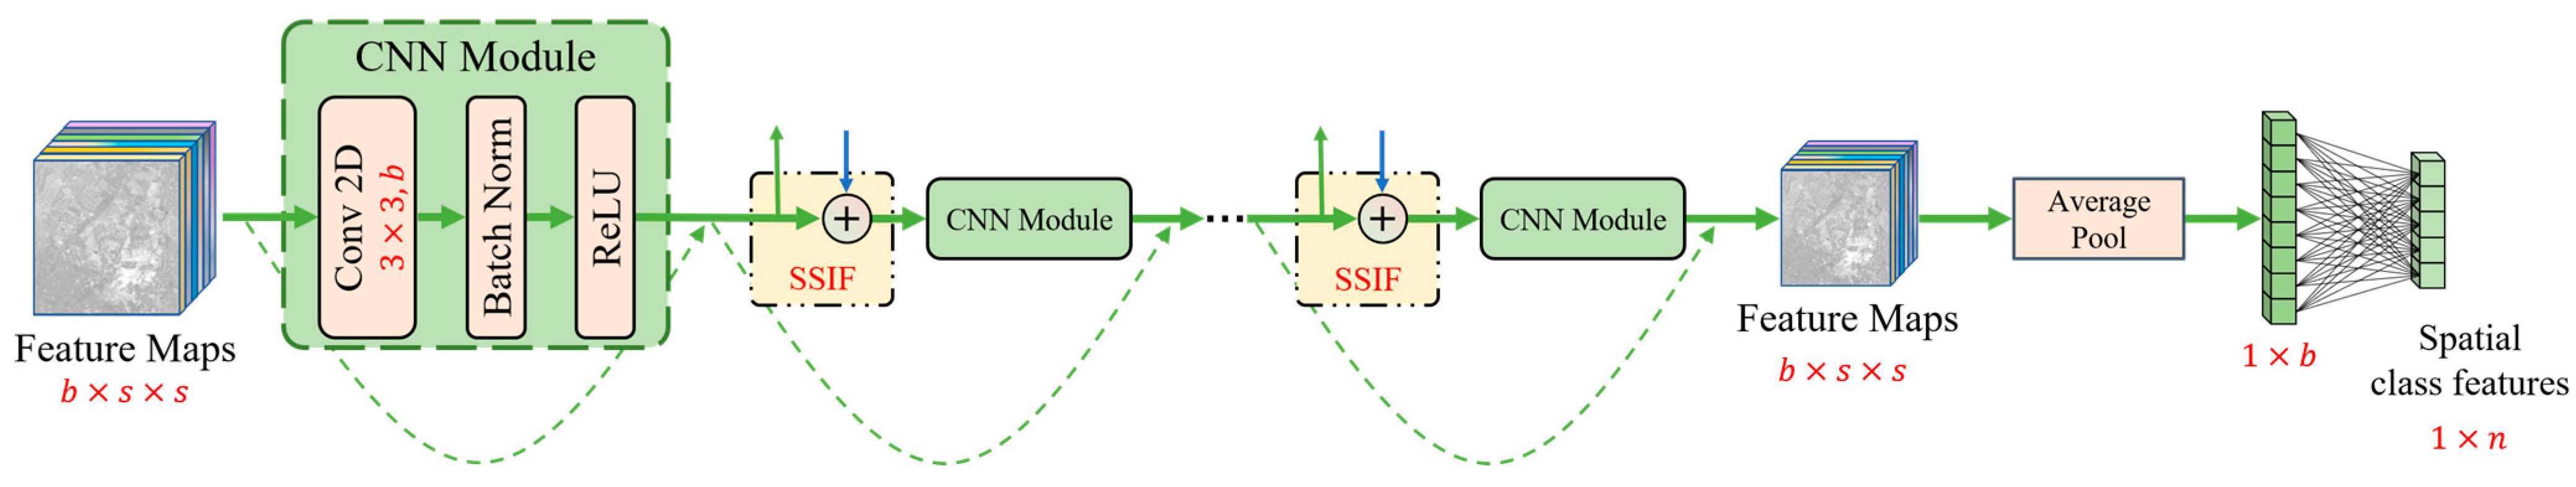
3.3. Spatial CNN Branch

The spatial CNN branch is designed to deeply exploit the 2D spatial features of hyperspectral feature maps, layer by layer. The detailed structure of the spatial CNN branch is shown in Figure 5. Different from the spectral Transformer branch, the feature maps X from the spectral dimensionality can be directly input to the CNN Module without data format conversion. In order to increase the speed of operation, the CNN Module is composed of 2D convolution, BN, and ReLU, which are constructed as concisely as possible, which is conducive to the fast inference of large-scale HSI. The kernel of a 2D convolutional slide in the height and width directions, and the value X i , j x y at position ( x , y ) on the jth feature map in the ith CNN module can be formulated as follows:
X i , j x y = m p P i 1 q Q i 1 w i , j , m p , q X i 1 , m ( x + p ) ( y + q ) + b i , j
where m denotes the feature map related to the current feature map in the ( i 1 )th layer, P i and Q i represent the length and width of the convolution kernel, respectively, the coefficient connected to the mth feature map at the ( p , q ) position in the preceding layer is denoted w i , j , m p , q , and the bias of this kernel is denoted b i , j .
The SC and the SSIF are conducted for the CNN Module in the same way in the Transformer branch. Following the last CNN Module, an average pool is conducted to squeeze feature maps into a 1D vector with b size. Ultimately, the vector is projected onto spatial class features with a size of n . The formula for a 2D average pool is as follows:
F A v e r a g e X = 1 H · W i H j W X i j
where H and W denote the sizes of height and width for feature maps.

3.4. Feature Fusion Method

The integration of spatial and spectral information is a key step in HSI analysis. In common deep learning-based models, the fusion process is placed after feature extraction and prior to the classifier and is implemented by direct addition or concatenation [33]. However, there are two problems with this approach: first, there is no information interchange, which will isolate the spatial and spectral information from each other, resulting in poorly extracted spatial-spectral features; second, direct addition or concatenation without discrimination cannot reflect the preference of different categories of objects for the two types of features (for example, road classification depends more on spatial information, while vegetation classification depends more on spectral information). To solve these, SSIF and CAW are proposed, respectively, in our SCSTIN framework.
The function of SSIF is to realize bidirectional information exchange and feature fusion during the feature extraction process in two branches. Figure 6a shows the detailed structure of SSIF in the SCSTIN framework. Due to the spectral Transformer branch and the spatial CNN branch having different types of data format tokens and feature maps, the core of SSIF is to realize the mutual conversion between the two data formats. In converting tokens to feature maps, b × t size spectral tokens containing spectral information are taken from tokens. Then the spectral tokens are input to linear projection and reshape operations to match the size of the feature maps. Subsequently, the output with b × s × s size is added with the feature maps from the CNN branch to form new feature maps. The procedure for converting feature maps to tokens is reversed. The formula for the SSIF can be expressed as:
X = X + R e s h a p e f L 1 T s ; T s R b × t ; X , X R b × s × s f L 1 x = x W T + b ; W R s 2 × t , b R s 2 × t
T s = T s + f L 2 R e s h a p e X ; X R b × s × s ; T s , T s R b × t f L 2 x = x W + b ; W R t × s 2 , b R t × 1
where X represents input feature maps, X represents output feature maps, T s is input spectral tokens, and T s is output spectral tokens. R e s h a p e · denotes the operation of reshaping the input size.
The CAW module is designed to discriminatively fuse spatial and spectral class features before the classifier. Considering that different ground object types have different preferences for features, it imposes weights with a sum of 1 on the spatial classification features and spectral classification features of each object type. Figure 6b shows the detailed structure of CAW. Spectral class features and spatial class features form two branches that are multiplied by the weight coefficient after SoftMax normalization. The size of the weights is set to 1 × n to indicate that different weights are assigned to each category. The two class features after weighting are added to get the final class features input to the classifier. The formula for the SSIF can be expressed as:
X C = S o f t M a x ω 1 · X 1 + S o f t M a x ω 2 · X 2 ; X C , X 1 , X 2 , ω 1 , ω 2 R 1 × n S o f t M a x ω 1 = e ω 1 e ω 1 + e ω 2 ; S o f t M a x ω 2 = e ω 2 e ω 1 + e ω 2
where X 1 is a spectral class feature, X 2 is a spatial class feature, and X C is the final class feature. ω 1 and ω 2 are learnable weight parameters.

4. Results

To evaluate the performance of the proposed SCSTIN model on a large-scale HSI classification map, eight state-of-the-art HSI classification methods were reproduced for comparison based on the EFHLM dataset. In this section, we first detail the specific structure of the SCSTIN model used on practical classification tasks. Then we quantitively compare the classification results with comparison algorithms. Finally, the trained models were used to draw classification maps of EFHLM to demonstrate visual results and analyze the distribution of ground objects.

4.1. Experimental Settings

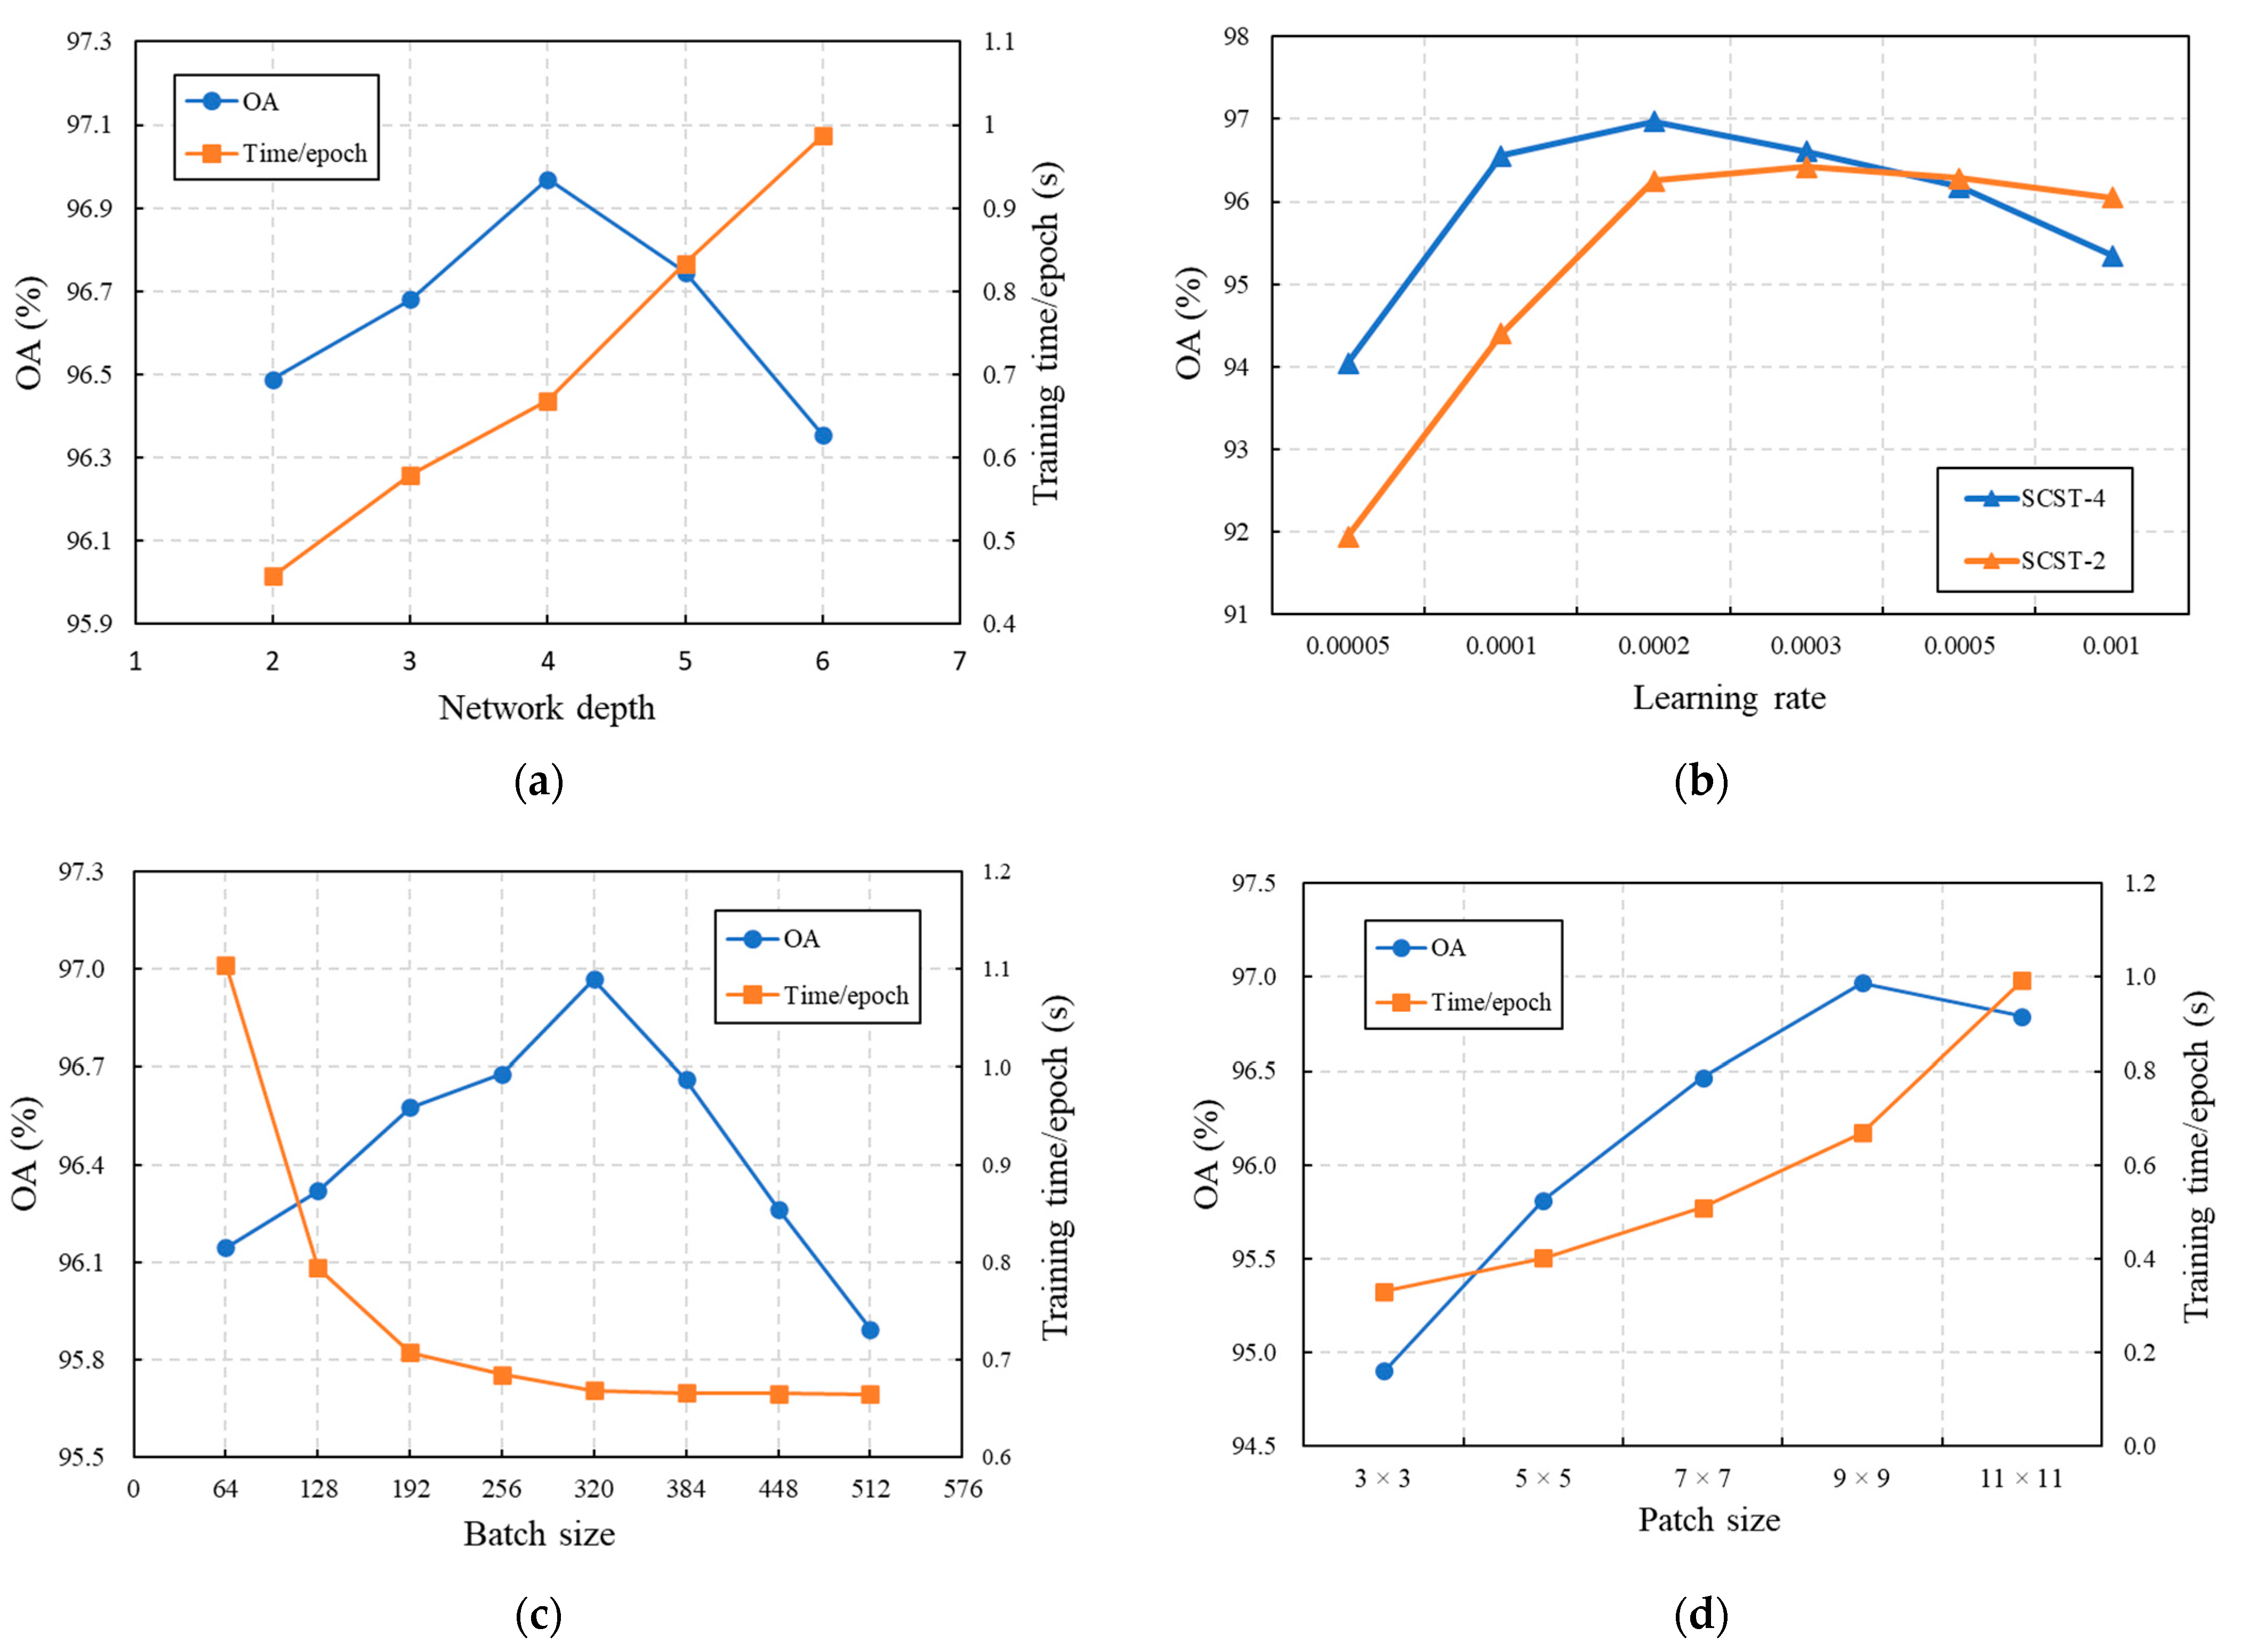
4.1.1. The SCSTIN Framework Parameter Setting

The accuracy and efficiency of deep learning models are closely related to the design of the network structure. For parameters inside the SCSTIN framework, the number of spectral feature bands b after dimensionality reduction is set to 64, the embedding dimension of tokens t is set to 16, the number of heads h for self-attention in MHSA is four, and the increase ratio of MLP hidden layer r is set to four, which means the number of neurons for the hidden layer is 64 in the models. Table 3 shows the detailed parameters for the SCSTIN framework in the experiment. In addition, some hyperparameters have a great impact on accuracy and efficiency, such as training batch size, input patch size, network depth, and learning rate, and their optimal values are selected by controlling variables.
  • Depth of the SCSTIN framework
Network depth is a key parameter that determines the complexity of a deep learning model. Large depth leads to a large number of parameters and high complexity, which can cause high calculation burdens and overfitting problems. Low depth with lower complexity may result in underfitting problems, but fewer parameters can save computing resources, which has advantages in large-scale fine land cover mapping based on satellite HSI. Thus, it is necessary to choose the depth in a targeted manner to balance classification accuracy and model efficiency. Figure 7a shows the model performance of the SCSTIN framework at different depths. The results showed that with the increase in depth from 2 to 6, the average training time per epoch increased linearly from 0.45 s to 0.98 s, and the maximum OA reached 96.97% at the depth of four. Therefore, the SCSTIN model with a depth of four (SCSTIN-4) was selected due to its excellent classification accuracy. Moreover, it is worth noting that the accuracies of all SCSTIN models are above 96.3%, indicating the network has strong robustness in depth. Thus, it could be seen that SCSTIN-2 possessed the fastest training speed but also had good classification accuracy. In conclusion, both SCSTIN-2 and SCSTIN-4 were conducted in the subsequent experiments from the perspectives of efficiency and accuracy, respectively.
  • Learning Rate
As one of the most important hyperparameters in a deep learning algorithm, learning rate controls the convergence speed of the objective function to the local minimum value in the process of back propagation. An appropriate learning rate can make the model converge steadily and quickly. Considering SCSTIN models with different depths may have different responses to changes in learning rate, Figure 7b shows the classification accuracy of both SCSTIN-2 and SCSTIN-4 under different learning rates. It can be seen that when the learning rate is higher than 0.0002, SCSTIN-2 is more stable than SCSTIN-4, indicating that SCSTIN-2 is more convenient to tune the learning rate in practical application. By comparison, 0.002 and 0.003 were selected as the final learning rates with the highest accuracy for the SCSTIN-4 and SCSTIN-2 models, respectively.
  • Training Batch Size
Batch training is a key algorithm for deep learning. It can address multi-input data in parallel to reduce training time and accelerate network convergence. Too small a batch size will lead to a longer running time, while too large will reduce the generalization performance of the model [52]. In order to select the appropriate batch size, we take the SCSTIN-4 model as an example to compare the classification accuracy and efficiency on the EFHLM dataset. Figure 7c shows the performance of SCSTIN-4 with different batch sizes ranging from 64 to 512. For classification accuracy, it is obvious that overall accuracy (OA) reached its highest value when the batch size was 320. While average training time per epoch decreased as batch size increased, the reduction was negligible after 320 batch size. Thus, 320 was chosen as the compromise batch size.
  • Input patch size
The size of the input HSI patches controls the amount of information accepted by the deep learning model. Small sizes may result in insufficient valid information, while large sizes will increase calculation costs and may introduce many distractions. To select a suitable patch size, Figure 7d visualizes the performance of SCSTIN-4 with different patch sizes ranging from 3 × 3 to 11 × 11. It could be seen from the results that the 9 × 9 patch size had the highest accuracy and was acceptable in terms of time consumption. Therefore, 9 × 9 was chosen as the final input batch size.

4.1.2. Comparison Algorithms

Eight HSI classification deep learning methods were reproduced to compare with the SCSTIN-2 and SCSTIN-4 models based on the EFHLM satellite hyperspectral dataset. All ten models were divided into three categories according to the classification strategy. The strategy of the first group adopted the model based on CNN, which contains three commonly used models: contextual deep CNN (CDCNN) [32], the spectral-spatial residual network (SSRN) [53], and the fast dense spectral-spatial CNN (FDSSC) [54]. CDCNN mines spatial features based on 2D convolution, while SSRN and FDSSC extract spatial-spectral features based on 3D convolution. The second group focused on three attention mechanism-based models, which include the double-branch multi-attention mechanism network (DBMA) [55], the double-branch dual-attention mechanism network (DBDA) [33], and the attention-based adaptive spectral-spatial kernel residual network (A2S2K) [56]. The introduction of an attention mechanism can enhance the ability of the algorithm to extract global features. The third group contains four Transformer-based models: Vision Transformer (ViT) [51], Bottleneck spatial-spectral Transformer (BS2T) [40], SCSTIN-2, and SCSTIN-4. As the most original Transformer in the CV field, ViT was applied to the hyperspectral classification in this study. BS2T combined the CNN and Transformer as a multi-head spatial-spectral self-attention module to extract classification features.
To make a fair comparison, the patch size, batch size, and number of iterations were set to 320, 9 × 9 and 300 for all experiments. In addition, we adopted adaptive moment estimation with a decoupled weight decay (AdamW) [57] method as the optimizer for the model parameter optimization. As for learning rate, considering that different model structures have different convergence speeds, each model was tuned to find its optimal learning rate. Finally, the overall accuracy (OA), average accuracy (AA), Kappa coefficient, and producer’s accuracy of each class on the test data were calculated to evaluate the model quantitatively.

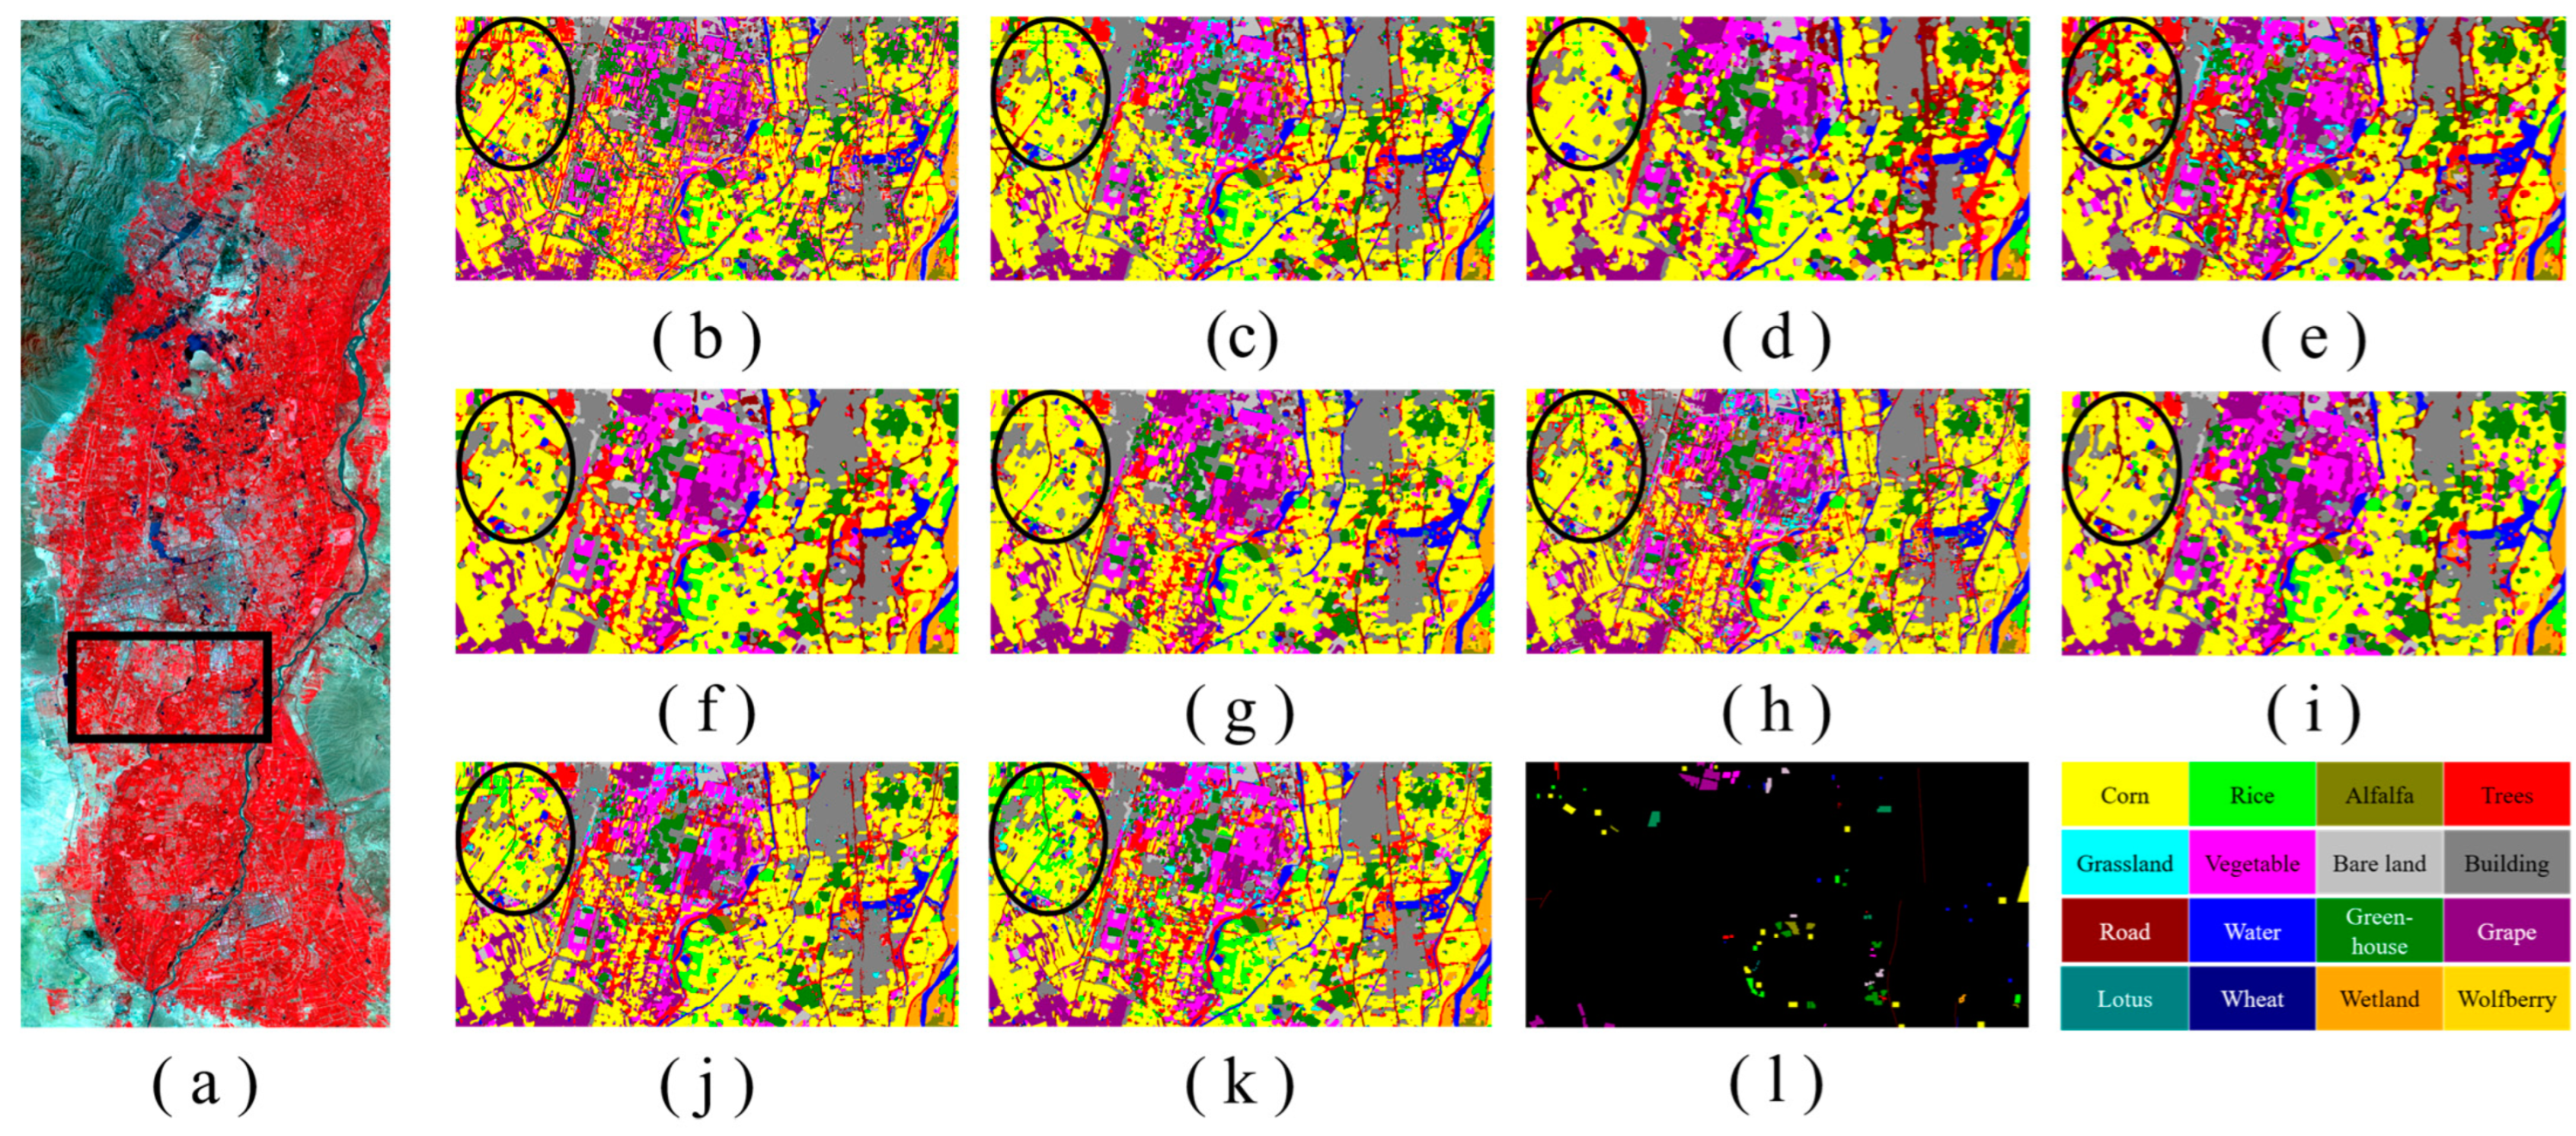
4.2. EFHLM Classification Results

All the algorithms involved were implemented five times using Python 3.8.5 (Python Software Foundation, Fredericksburg, VA, USA) and PyTorch 1.10.1 (Linux Foundation, San Francisco, CA, USA), with an NVIDIA GeForce RTX 2070 GPU and an Intel Core i9-10900K CPU. Of these, the randomly selected training set and verification set account for 1% of the samples, and the remaining samples were used as the test set for the model evaluation, and the collected average result is reported. Table 4 lists the evaluation metrics comparisons of three groups based on different strategies for the EFHLM dataset.

4.2.1. Classification Accuracy Comparison

As can be seen from the quantitative results in Table 4, the SCSTIN-4 model obtains optimal results with OA, AA, and Kappa coefficients reaching 96.98%, 95.01%, and 96.65%, respectively, which is superior to comparison methods. For example, compared with the most basic models, CDCNN, DBMA, and ViT, in the three different strategies, the proposed SCSTIN-4 model yields 7.44%, 3.38%, and 4.03% average absolute improvements in terms of OA, which demonstrates the effectiveness of the organic combination of CNN and Transformer. The SCSTIN-2 model obtains suboptimal OA and Kappa coefficients of 96.49% and 96.11%, respectively. Another hybrid model, BS2T, reaches the suboptimal AA with 93.72%, which also explains the advantages of combining CNN with Transformer.
From the perspective of producer accuracy for each category in Table 4, the SCSTIN-4 model performs the best among all models, especially for rice, alfalfa, grape, wheat, wolfberry, and other vegetation, which benefits from its powerful ability to address spatial context features and spectral sequence features. By comparison with the SCSTIN-4, it can be observed that the SCSTIN-2 conducts a general performance for the classes with a small number of samples, such as alfalfa, grassland, lotus, wheat, and wolfberry, which can be attributed to its shallow feature extraction structure.
In addition, by comparing the classification results between models based on different strategies, it is easy to observe that Transformer-based models possess the best classification results, followed by Attention-based and CNN-based models. As the most popular deep learning algorithm, the performance of the CNN-based models (e.g., SSRN and FDSSC) can basically meet the accuracy requirements of hyperspectral classification. By considering long-distance-dependent features, the introduction of the attention mechanism can improve the classification performance of models to some extent (e.g., DBDA and A2S2K). Additionally, the Transformer, as an improved version of the attention mechanism, can address the spectral sequence features with long-distance dependencies. However, the single transformer model (i.e., ViT) cannot extract spatial context features well and has relatively poor performance. To deal with it, the latest hybrid models (e.g., BS2T) fuse Transformer and CNN together to significantly improve classification accuracy. Our proposed SCSTIN model not only organically combines CNN and Transformer as the dual-branch structure to utilize spatial context features and spectral sequence features, but also introduces two feature fusion modules (SSIF and CAW) to fuse both features rationally. In this way, with more discriminative and representative features extracted, the SCSTIN framework can achieve the best classification accuracy among all the comparison models.

4.2.2. Mapping Time Comparison

The cost of models is also one of the important factors to be considered in the practical application of hyperspectral fine land cover mapping. The time taken by each model to map the distribution of ground objects in the whole EFHLM region is calculated in Table 4. It is obvious that the mapping time of CDCNN with 2D convolution is the least, which proves to a certain extent that 2D convolution has high operational efficiency. However, CDCNN has the lowest classification accuracy and is not suitable for actual hyperspectral fine land cover mapping. On the contrary, the proposed SCSTIN framework not only guarantees high classification accuracy but also keeps mapping time low. The SCSTIN-2 had a suboptimal mapping time of 9.49 min, which is much lower than the mapping time consumed by other comparison models. For example, another Transformer-based model, BS2T, is at the same level of classification accuracy as SCSTIN-2 but takes about eight times as long to map the distribution of EFHLM. This is because SCSTIN reasonably combines 2D CNN and Transformer to improve the efficiency of the model. Even compared with SSRN, the fastest model in comparison models, the mapping time of SCSTIN-2 is only half that of SSRN. In addition, the SCSTIN-4 with the highest classification accuracy possesses a mapping time of 15.72 min, which also exceeds all comparison models.
In summary, compared with the state-of-the-art classification models, the proposed SCSTIN framework achieves satisfactory performance in both classification accuracy and running time, which enables fast fine land cover mapping based on large-scale satellite hyperspectral imagery.

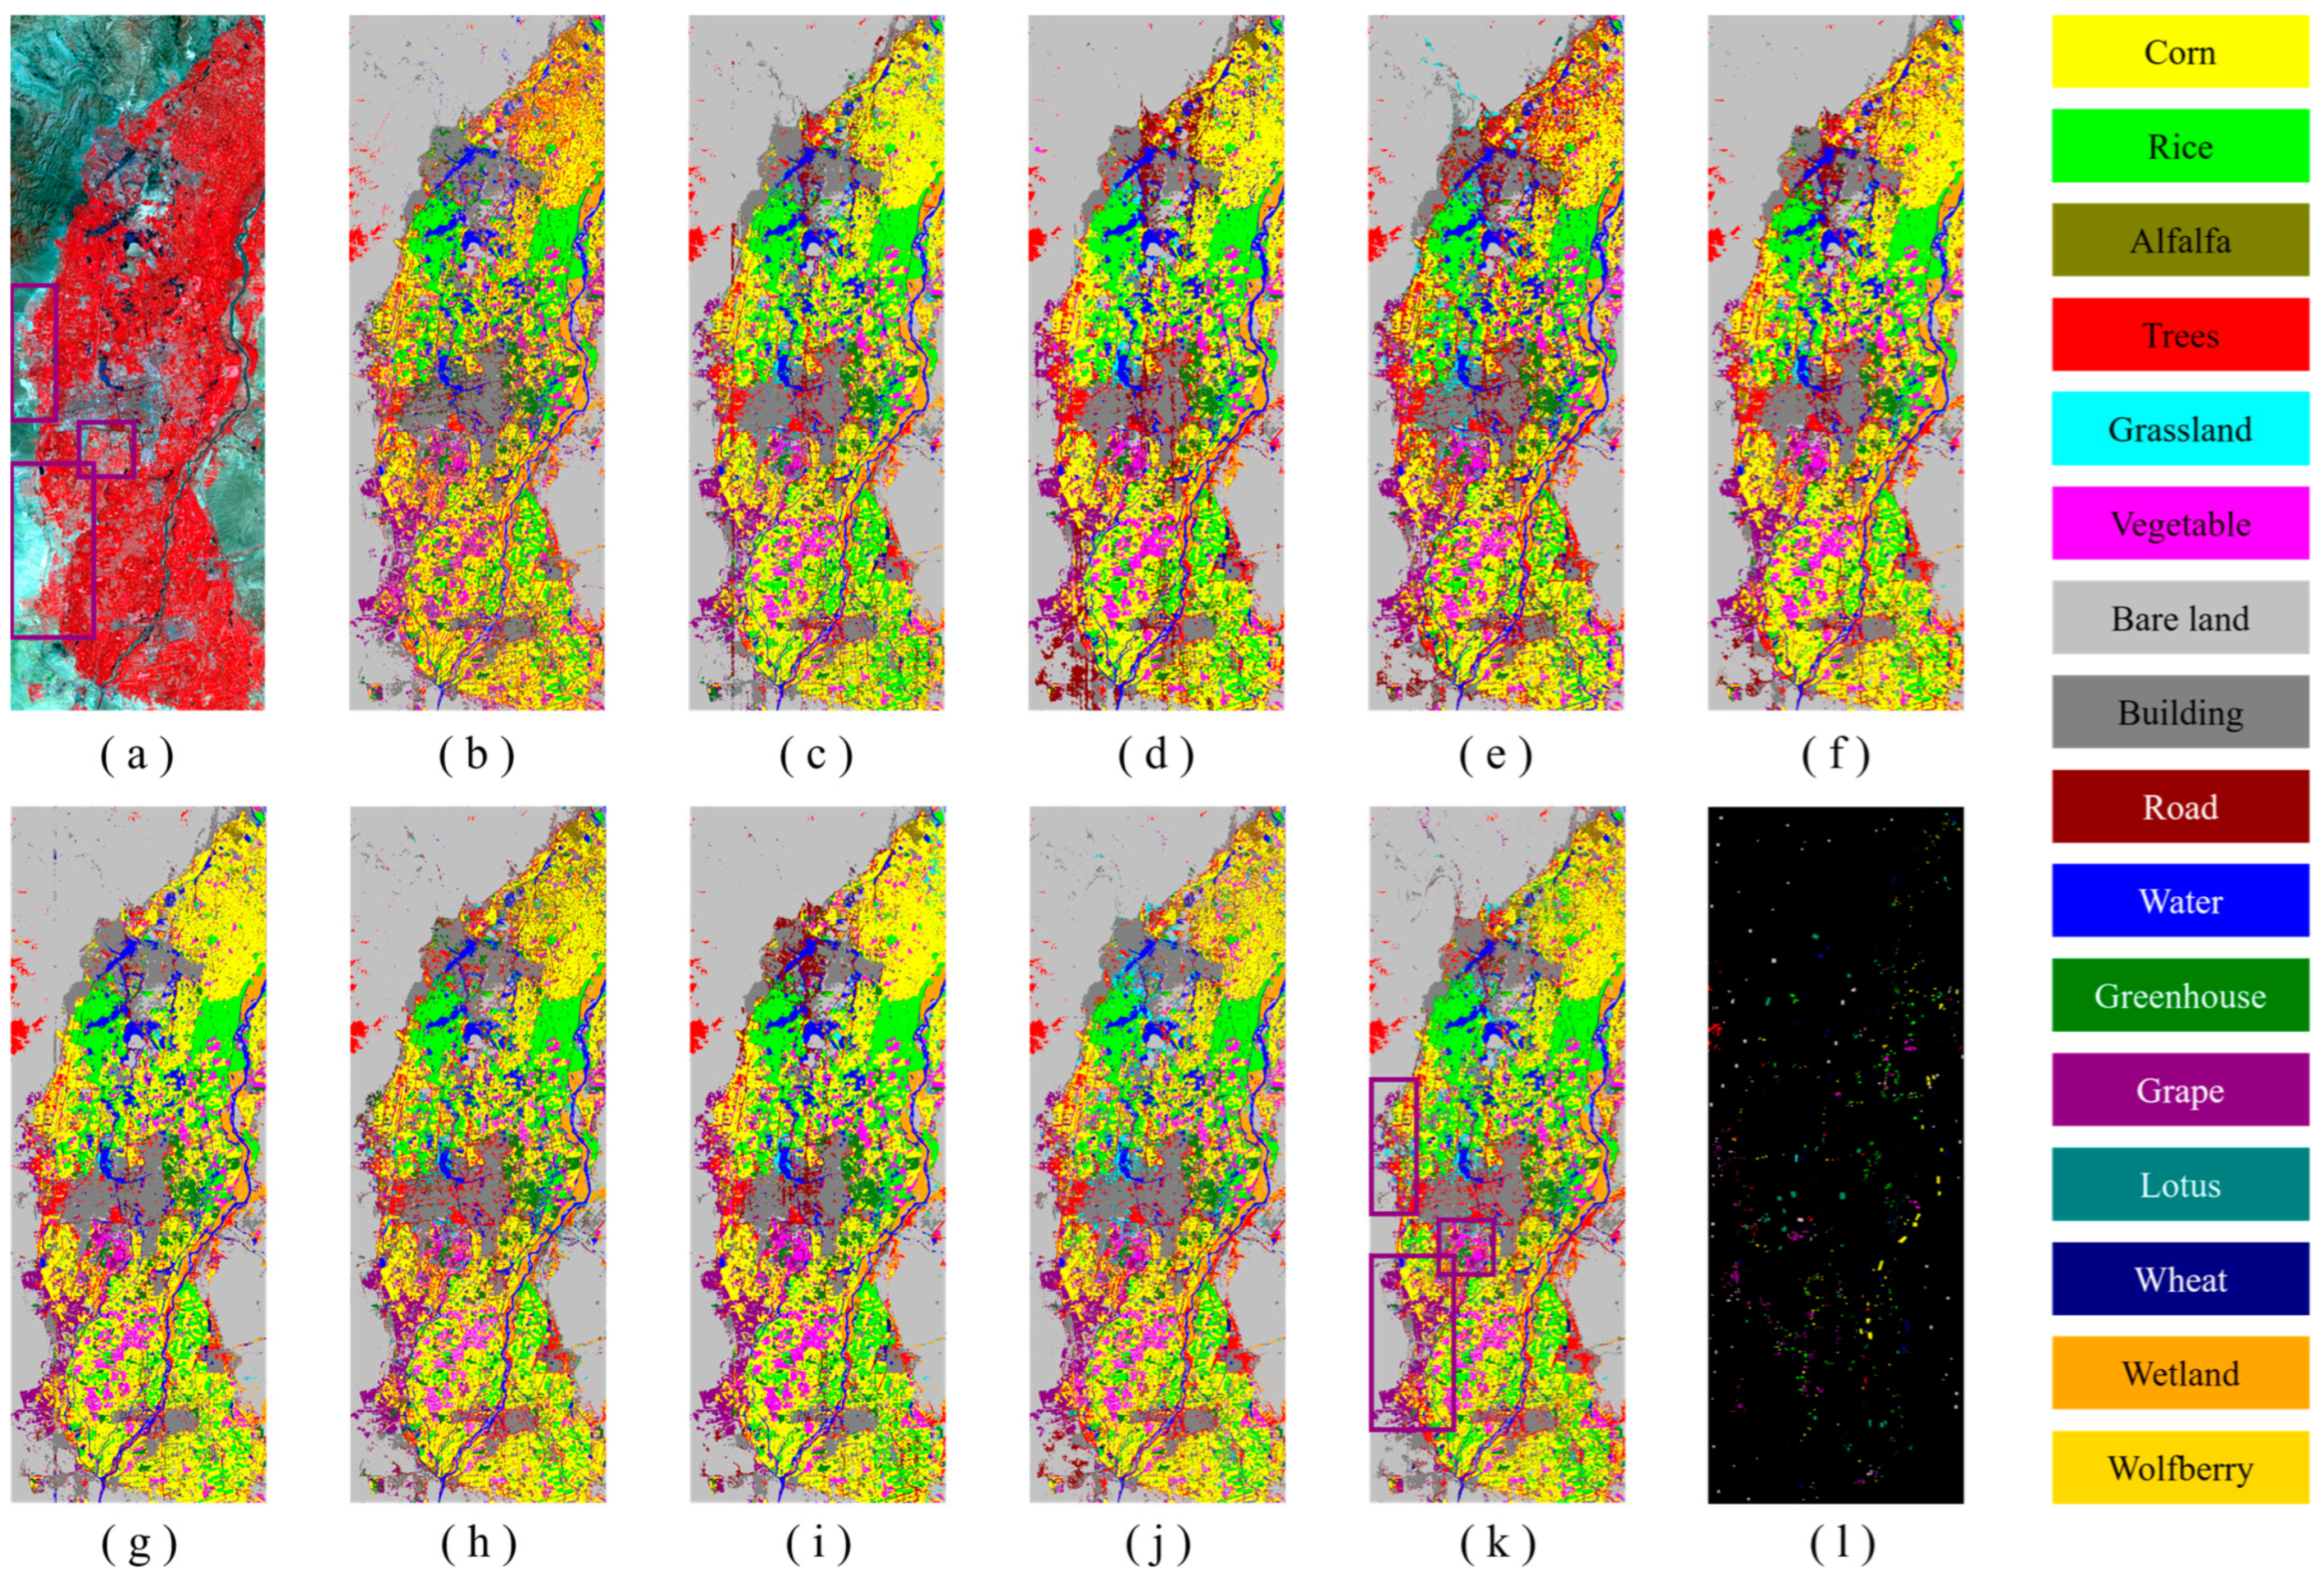
4.3. EFHLM Mapping Results and Distribution Analysis

The distribution maps of ground objects for EFHLM in northern Ningxia are shown in Figure 8 to visualize the classification result of each model. In order to show the details of the distribution maps more clearly, a small region was zoomed in to compare the visualization results of different models, as shown in Figure 9.
According to Figure 8 and Figure 9, the models with different strategies showed different visual effects on the distribution patterns of ground objects. Firstly, it can be observed that maps of basic models CDCNN and ViT, as shown in (b) and (h) of Figure 8 and Figure 9, show a lot of noise and misclassification, which is consistent with the quantitative results reported in Table 4. To reduce noise and misclassification, the CNN-based models SSRN and FDSSC (c) and (d) introduce the 3D convolutional residual network to extract the spatial-spectral features. However, their maps are so smooth that some details are ignored, such as small fields, roads, rivers, and so on, within the black oval in Figure 9, which is mainly caused by their weak spectral sequence feature extraction ability. By adding attention mechanisms, DBMA, DBDA, and A2S2K (e), (f), and (g) models can extract global spatial-spectral information, improving classification accuracy and showing more detailed information on distribution maps. However, without sufficient mining of spectral sequence information, the attention-based models still have the problem of excessive smoothing and some serious misclassification. For instance, some rice paddies within the black oval in the upper left corner of the zoomed distribution maps in Figure 9 were misclassified as corn fields. As for the BS2T model, although the quantified classification results are better than those of other comparison models, the direct structure integration of CNN and Transformer still leads to the problem of unclear boundaries and a lack of details in the distribution maps (i) in Figure 8 and Figure 9. The SCSTIN classification models (j) and (k) exhibit more details in distribution maps due to their ability to fully extract and reasonably fuse 2D spatial features and spectral sequence features. SCSTIN-4 achieves the best visual effect with few misclassifications and the highest classification accuracy, while SCSTIN-2 is affected by categories with small samples, and the classification result was slightly inferior to that of SCSTIN-4.
Furthermore, the spatial distribution pattern of the ground objects in the EFHLM is analyzed based on the SCSTIN-4 classification map. Combined with the false color image of EFHLM and classification map of SCSTIN-4 (a) and (k) in Figure 9, it can be seen that the Helan Mountains are in the upper left corner of the imagery. The Helan Mountains are stony mountains with barren land, many bare rocks, and low vegetation coverage, so only a few trees are distributed in the mountains. EFHLM is located in the upper reaches of the Yellow River, which can be seen running through the imagery from right to bottom. The three cities distributed vertically on the map correspond to Shizuishan City, Yinchuan City, and Wuzhong City in Figure 1b from top to bottom. Importantly, due to suitable geographical and climatic conditions, the EFHLM area is mainly covered by a variety of vegetation. Corn and rice are the main food crops in this area; corn is distributed throughout the region, while rice is found near rivers and lakes due to the need for water. Wetlands are distributed along the Yellow River, including a number of national wetland parks. Alfalfa is planted in a large field in the upper right corner of the imagery. Greenhouses are mainly distributed near Yinchuan City, while vegetables are mostly planted between Yinchuan City and Wuzhong City. Lastly, it is of great significance to study the grape distribution of EFHLM, which is the “golden zone” of grape cultivation. To be more intuitive, the main planting areas of grapes are framed with purple boxes in Figure 9a,k. The two boxes near the imagery edge are mainly open-air grape fields planted in large areas, which is consistent with the study result of Liu et al. [58]. As for the other purple box, it can be seen that this area is close to the town of Yinchuan City. After the on-the-spot investigation, it was found that the grapes in this box were mainly planted on several wine estates.

5. Discussions

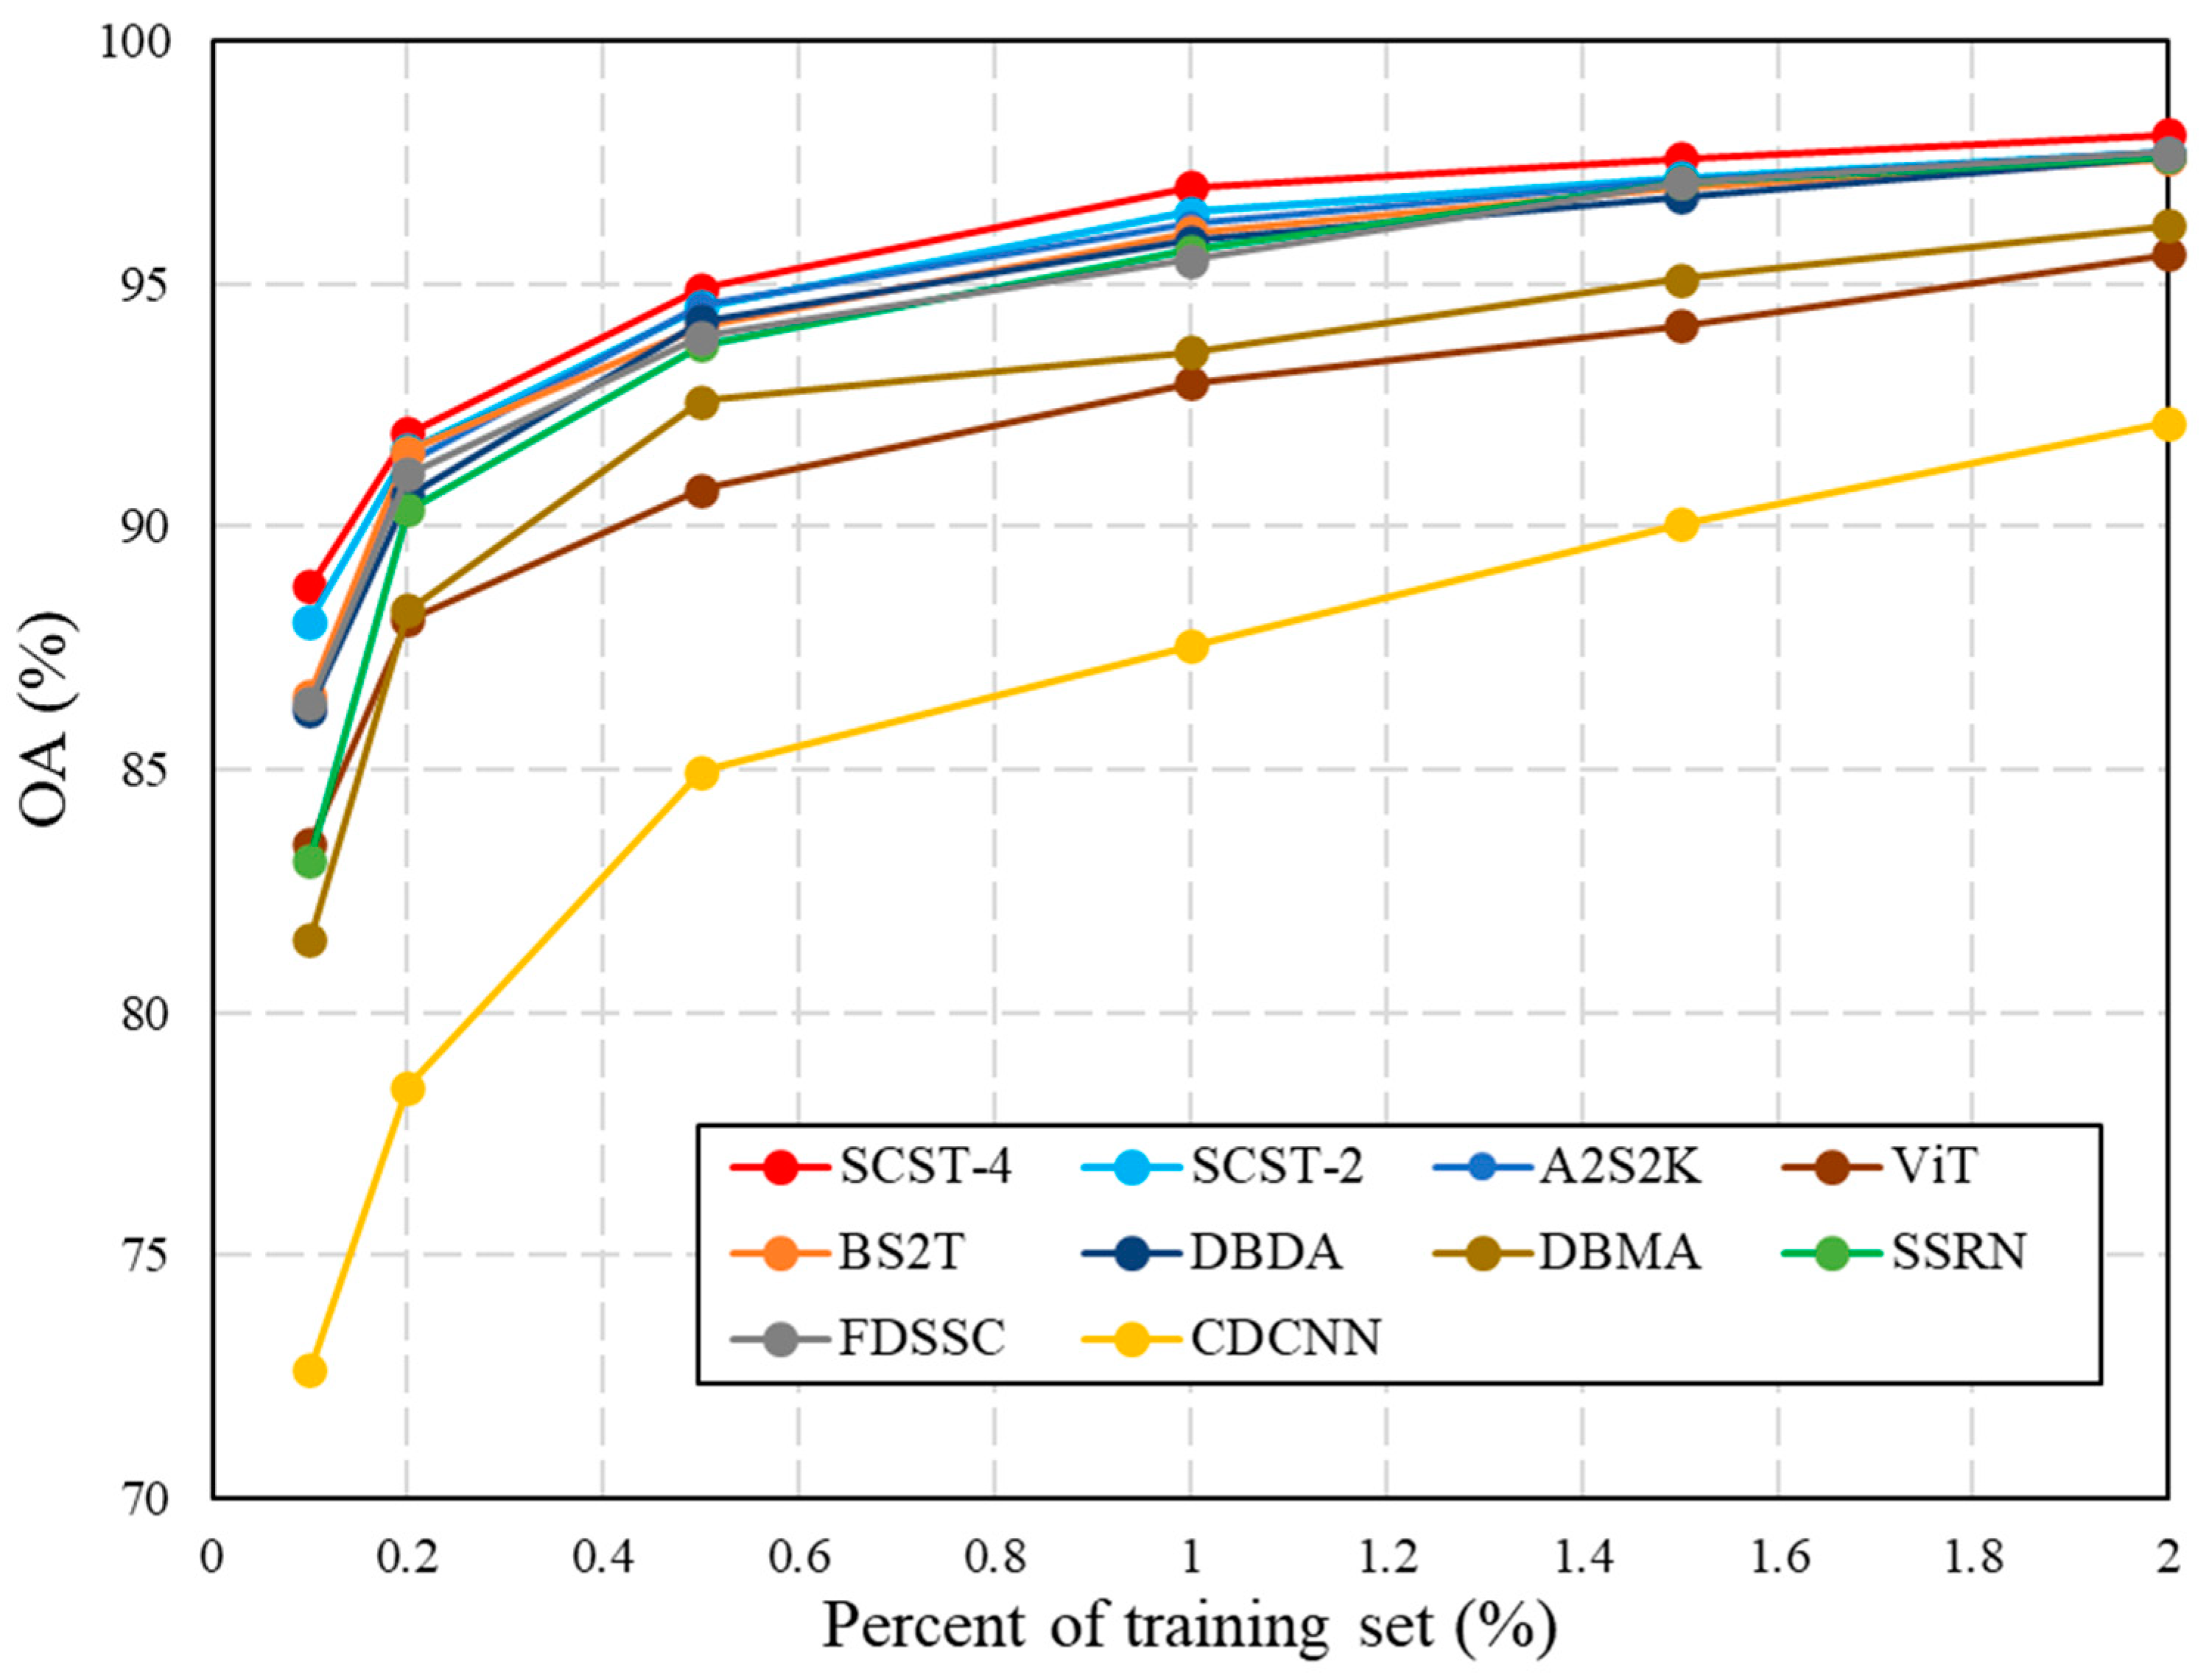
5.1. Analysis of the Training Sample Proportion

The deep learning models perform ground object classification by mining the higher-level spatial-spectral features of HSI in a data-driven way. Thus, the quality of the models is determined by the number of samples involved in parameter training, and the appropriate number of training samples can also save time and manpower without losing classification accuracy. Therefore, we compare the classification performance of different models over different numbers of training samples, as shown in Figure 10. The training sets were set at 0.1%, 0.2%, 0.5%, 1%, 1.5%, and 2%, respectively. It is obvious that the three basic models (i.e., CDCNN, DBMA, and ViT) have relatively poor performance, while the other algorithms have improved the classification accuracy in all percentages of training samples through certain improvements. With a more reasonable hybrid structure between CNN and Transformer, the proposed SCSTIN models perform better in OA. When the percentage is small, the SCSTIN models show significant advantages over other comparison models. For example, when the training set is set to 0.1%, the OA of both SCSTIN-4 and SCSTIN-2 is greater than 88%, far exceeding the OA of other comparison models. As the percentage of training samples increases, the improvement gap between the models narrows. When the percentage of training sets is large, the proposed SCSTIN-4 model still shows competitive results. However, the SCSTIN-2 gradually caught up with other comparison models due to its shallow feature extraction layer. In addition, it is worth noting that the OA of all models is not significantly improved when the percentage of the training set is greater than 1%, so the 1% training set is the most appropriate for the EFHLM dataset. In summary, the proposed SCSTIN models show more significant improvement under limited training samples, and the SCSTIN-4 model is in a leading position under each training sample percentage.

5.2. Ablation Study on Module

The extraction and fusion of spatial and spectral features play an important role in the HSI classification based on the deep learning method. In the proposed SCSTIN framework, two branches and two fusion modules were conducted to mine and integrate spatial-spectral features, respectively. To validate the effectiveness of each part of the SCSTIN model, we take SCSTIN-4 as an example to perform ablation experiments on the EFHLM dataset under the case of 1% training samples. Figure 11 exhibits the results of the ablation study conducted with each module of the SCSTIN model. From the results, it can be observed that the classification accuracy of the two-branched network exceeds that of any single branch, which proves the effectiveness of combining the 2D spatial features and spectral sequence features extracted by CNN and Transformer. Applying any feature fusion module in the model also results in a significant improvement in classification results, which proves that the organic fusion of the two features can also enhance the performance of the model. Furthermore, the SCSTIN-4 model with all four modules achieves the highest accuracy in the EFHLM dataset. In conclusion, the adopted two branches and two feature fusion modules in the SCSTIN-4 model can significantly improve the classification accuracy in the EFHLM dataset, indicating that all modules in the proposed method are effective.

5.3. Model Complexity

With the continuous development of hyperspectral technology, it will be possible to process HSIs on real-time platforms in the future. However, running deep learning models on terminal devices needs to consider the requirements of memory and computing power, so the model complexity analysis needs to be carried out, involving the number of model parameters (spatial complexity), the floating point of operations (FLOPs) (computational complexity), and the training time (time complexity) in this section. Table 5 reports the complexity of models under the EFHLM dataset of 1% training samples.
The number of parameters in the model reflects the storage space occupied by the model when it is saved. It can be observed that SCSTIN-2 possesses the least number of parameters, which will take up the least storage space when placed in the context of the computing platform. For example, the SCSTIN-2 model only has 193,522 parameters, which is nearly 17 times fewer than the ViT model. The SCSTIN-4 with the highest classification accuracy only has 372,212 parameters, which is also at a low level among hyperspectral classification models based on deep learning. Moreover, in terms of training time and FLOPs, both SCSTIN models have better performance compared with other advanced models other than CDCNN. For instance, the FLOPs and training time of another Transformer-based model, BS2T, are almost five times and six times that of the SCSTIN-2, respectively. This is because the proposed framework uses a more sensible combination of 2D-CNN and Transformer. In addition, it is worth noting that two basic models for CNN and Transformer (i.e., CDCNN and ViT) still have less training time in the case of having more parameters, which also confirms the advantages of 2D-CNN and Transformer structures in terms of running speed.
Overall, with low complexity in terms of storage, calculation, and time, the proposed SCSTIN model is capable of attaining advanced performance efficiently for fine land cover classification using large-scale satellite hyperspectral imagery, which is more conducive to future applications on real-time platforms.

5.4. Model Generalization

Model generality refers to the adaptability of one model to different datasets in different scenarios. Models with strong generalization ability will perform well across different datasets. In order to explore the applicability and generality of the proposed model, two public datasets from different platforms, the satellite hyperspectral dataset for Botswana and the airborne hyperspectral dataset for Indiana Pines (both can be downloaded from https://www.ehu.eus/ccwintco/index.php/Hyperspectral_Remote_Sensing_Scenes, accessed on 15 August 2021), were used to conduct generality experiments.
The Botswana dataset, acquired by NASA using the Hyperion sensor on the EO-1 satellite, has a spectral resolution of 10 nm, covering the band range of 400–2500 nm. The size of the Botswana dataset is 1467 × 256, with a spatial resolution of 30 m, covering about 340 km2. A total of 145 bands were used in the experiment after data preprocessing. Figure 12 exhibits the false color image and ground truth distribution of the satellite hyperspectral dataset for Botswana, which contains a total of 14 classes of ground objects.
The Indiana Pines dataset was captured in northwestern Indiana by the AVIRIS sensor equipped on an airborne platform. It is composed of 145 × 145 pixels and 200 spectral bands covering 400–2500 nm after removal of water vapor absorption bands. Figure 13 exhibits the false color image and ground truth distribution of the airborne hyperspectral dataset for Indiana Pines, which contains a total of 16 classes of ground objects.
In this experiment, 1% (42) and 3% (305) samples were randomly selected as training sets for the Botswana and Indiana Pines datasets, respectively. Table 6 lists the classification results for two datasets. It is clear that both SCSTIN-2 and SCSTIN-4 models achieve high classification accuracy and have fast training speeds in two datasets, which is similar to their performance on EFHLM datasets. Specifically, the SCSTIN-4 model possesses the highest values in terms of OA, AA, and Kappa coefficient in both datasets. Moreover, the training speed of the SCSTIN-2 model is about 1.5 times that of the SCSTIN-4 model, ensuring excellent classification accuracy. Therefore, the experimental results with the two types of datasets have verified that the SCSTIN model has good generalization ability.

6. Conclusions

In this study, a novel Spatial-Convolution Spectral-Transformer Interactive Network (SCSTIN) is proposed for large-scale, fast refined land cover classification and mapping based on ZY1-02D satellite hyperspectral data. The SCSTIN framework is designed to address the problems of incomplete feature extraction, inappropriate feature fusion, and long-term consumption when the existing CNN model is applied to large-scale satellite hyperspectral classification. In the SCSTIN framework, the dual-branch structure is adopted to organically combine CNN and Transformer to extract the spatial-spectral features of the hyperspectral image. In addition, two feature fusion modules, SSIF and CAW, are adopted between and after the two branches to organically fuse two types of features through interactive and weighted approaches. Moreover, spectral dimensionality reduction in the front part of SCSTIN, the 2D convolution operation in the CNN branch, and the parallel operation of MHSA in the Transformer branch can improve the computational efficiency of the model. The proposed SCSTIN model can achieve stable and efficient classification and mapping of large-scale hyperspectral images with higher accuracy.
The ZY1-02D satellite hyperspectral image is used as experimental data to map the distribution of ground objects in the eastern foothills of the Helan Mountains (EFHLM). To validate the proposed SCSTIN models, eight state-of-the-art hyperspectral classification methods are used as comparisons. The experimental results demonstrate that both SCSTIN-4 and SCSTIN-2 models achieve excellent performance in terms of classification accuracy and efficiency. Specifically, the SCSTIN-4 model achieves higher accuracy with an overall accuracy (OA) of 96.98%, while the SCSTIN-2 model exhibits higher efficiency with a shorter mapping time of 9.49 min. We have analyzed the spatial pattern of the study area as well as the distribution rules of different ground objects based on the classification map obtained by the SCSTIN-4 model. Furthermore, we discuss the performance of the proposed model from various perspectives, including the setting of training sample proportions, the performance of submodules, model complexity, and generalization ability. The results unequivocally indicate that the proposed model excels in all these aspects. In future work, we will continue to explore large-scale hyperspectral refined land cover classification and mapping in different application scenarios.

Author Contributions

Conceptualization, Y.W., X.Z., C.H. and W.Q.; methodology, Y.W. and W.Q.; software, Y.W. and W.Q.; validation, Y.W., J.W. and X.Y.; formal analysis, S.T. and S.D.; investigation, S.T. and S.D.; resources, X.Z., C.H., J.W. and X.Y.; data curation, Y.W., S.T. and S.D.; writing—original draft preparation, Y.W.; writing—review and editing, Y.W., X.Z., C.H., W.Q., J.W. and X.Y.; supervision, Y.W., X.Z., C.H. and W.Q.; project administration, Y.W., X.Z. and W.Q.; funding acquisition, X.Z., C.H., W.Q., J.W. and X.Y. All authors have read and agreed to the published version of the manuscript.

Funding

This work was funded in part by the National Natural Science Foundation of China under Grant 42201392; in part by the Science and Technology Project for Black Soil Granary (XDA28080500); in part by the Key Research Program of Frontier Sciences, CAS (ZDBS-LY-DQC012); and in part by the National Key R&D Program of China (2021YFE0117300). Changping Huang was funded by the Youth Innovation Promotion Association, CAS (Y2021047).

Data Availability Statement

The public Botswana and Indiana Pines datasets can be downloaded at https://www.ehu.eus/ccwintco/index.php/Hyperspectral_Remote_Sensing_Scenes (accessed on 15 August 2021). Additionally, all ZY1-02D hyperspectral data used in this analysis can be accessed from the Natural Resources Satellite Remote Sensing Cloud Service Platform of China (http://sasclouds.com/chinese/normal/, accessed on 15 August 2021). The EFHLM dataset is available on request.

Conflicts of Interest

The authors declare no conflict of interest.

References

  1. Beeri, O.; Peled, A. Geographical model for precise agriculture monitoring with real-time remote sensing. ISPRS J. Photogramm. Remote Sens. 2009, 64, 47–54. [Google Scholar] [CrossRef]
  2. Pott, L.P.; Amado, T.J.C.; Schwalbert, R.A.; Corassa, G.M.; Ciampitti, I.A. Satellite-based data fusion crop type classification and mapping in Rio Grande do Sul, Brazil. ISPRS J. Photogramm. Remote Sens. 2021, 176, 196–210. [Google Scholar] [CrossRef]
  3. Karpatne, A.; Jiang, Z.; Vatsavai, R.R.; Shekhar, S.; Kumar, V. Monitoring Land-Cover Changes: A Machine-Learning Perspective. IEEE Geosci. Remote Sens. Mag. 2016, 4, 8–21. [Google Scholar] [CrossRef]
  4. Li, J.; Pei, Y.; Zhao, S.; Xiao, R.; Sang, X.; Zhang, C. A Review of Remote Sensing for Environmental Monitoring in China. Remote Sens. 2020, 12, 1130. [Google Scholar] [CrossRef] [Green Version]
  5. Tan, K.; Ma, W.; Chen, L.; Wang, H.; Du, Q.; Du, P.; Yan, B.; Liu, R.; Li, H. Estimating the distribution trend of soil heavy metals in mining area from HyMap airborne hyperspectral imagery based on ensemble learning. J. Hazard. Mater. 2021, 401, 123288. [Google Scholar] [CrossRef]
  6. Brunner, D.; Lemoine, G.; Bruzzone, L. Earthquake Damage Assessment of Buildings Using VHR Optical and SAR Imagery. IEEE Trans. Geosci. Remote Sens. 2010, 48, 2403–2420. [Google Scholar] [CrossRef] [Green Version]
  7. Tellman, B.; Sullivan, J.A.; Kuhn, C.; Kettner, A.J.; Doyle, C.S.; Brakenridge, G.R.; Erickson, T.A.; Slayback, D.A. Satellite imaging reveals increased proportion of population exposed to floods. Nature 2021, 596, 80–86. [Google Scholar] [CrossRef] [PubMed]
  8. Zhao, J.; Zhong, Y.; Jia, T.; Wang, X.; Xu, Y.; Shu, H.; Zhang, L. Spectral-spatial classification of hyperspectral imagery with cooperative game. ISPRS J. Photogramm. Remote Sens. 2018, 135, 31–42. [Google Scholar] [CrossRef]
  9. Xue, Z.; Du, P.; Li, J.; Su, H. Sparse graph regularization for robust crop mapping using hyperspectral remotely sensed imagery with very few in situ data. ISPRS J. Photogramm. Remote Sens. 2017, 124, 1–15. [Google Scholar] [CrossRef]
  10. Bioucas-Dias, J.M.; Plaza, A.; Camps-Valls, G.; Scheunders, P.; Nasrabadi, N.; Chanussot, J. Hyperspectral Remote Sensing Data Analysis and Future Challenges. IEEE Geosci. Remote Sens. Mag. 2013, 1, 6–36. [Google Scholar] [CrossRef] [Green Version]
  11. Zhong, Y.; Hu, X.; Luo, C.; Wang, X.; Zhao, J.; Zhang, L. WHU-Hi: UAV-borne hyperspectral with high spatial resolution (H2) benchmark datasets and classifier for precise crop identification based on deep convolutional neural network with CRF. Remote Sens. Environ. 2020, 250, 1120012. [Google Scholar] [CrossRef]
  12. Zhong, Y.; Wang, X.; Wang, S.; Zhang, L. Advances in spaceborne hyperspectral remote sensing in China. Geo-Spat. Inf. Sci. 2021, 24, 95–120. [Google Scholar] [CrossRef]
  13. Ghamisi, P.; Yokoya, N.; Li, J.; Liao, W.; Liu, S.; Plaza, J.; Rasti, B.; Plaza, A. Advances in Hyperspectral Image and Signal Processing: A Comprehensive Overview of the State of the Art. IEEE Geosci. Remote Sens. Mag. 2017, 5, 37–78. [Google Scholar] [CrossRef] [Green Version]
  14. Hu, X.; Wang, X.; Zhong, Y.; Zhang, L. S3ANet: Spectral-spatial-scale attention network for end-to-end precise crop classification based on UAV-borne H2 imagery. ISPRS J. Photogramm. Remote Sens. 2022, 183, 147–163. [Google Scholar] [CrossRef]
  15. Su, H.; Yao, W.; Wu, Z.; Zheng, P.; Du, Q. Kernel low-rank representation with elastic net for China coastal wetland land cover classification using GF-5 hyperspectral imagery. ISPRS J. Photogramm. Remote Sens. 2021, 171, 238–252. [Google Scholar] [CrossRef]
  16. Wei, D.; Liu, K.; Xiao, C.; Sun, W.; Liu, W.; Liu, L.; Huang, X.; Feng, C. A Systematic Classification Method for Grassland Community Division Using China’s ZY1-02D Hyperspectral Observations. Remote Sens. 2022, 14, 3751. [Google Scholar] [CrossRef]
  17. Datta, D.; Mallick, P.K.; Bhoi, A.K.; Ijaz, M.F.; Shafi, J.; Choi, J. Hyperspectral Image Classification: Potentials, Challenges, and Future Directions. Comput. Intell. Neurosci. 2022, 2022, 3854635. [Google Scholar] [CrossRef]
  18. Xu, Y.; Liu, X.; Cao, X.; Huang, C.; Liu, E.; Qian, S.; Liu, X.; Wu, Y.; Dong, F.; Qiu, C.W.; et al. Artificial intelligence: A powerful paradigm for scientific research. Innovation 2021, 2, 100179. [Google Scholar] [CrossRef]
  19. Melgani, F.; Bruzzone, L. Classification of hyperspectral remote sensing images with support vector machines. IEEE Trans. Geosci. Remote Sens. 2004, 42, 1778–1790. [Google Scholar] [CrossRef] [Green Version]
  20. Ham, J.; Yangchi, C.; Crawford, M.M.; Ghosh, J. Investigation of the random forest framework for classification of hyperspectral data. IEEE Trans. Geosci. Remote Sens. 2005, 43, 492–501. [Google Scholar] [CrossRef] [Green Version]
  21. Chen, Y.; Nasrabadi, N.M.; Tran, T.D. Hyperspectral Image Classification Using Dictionary-Based Sparse Representation. IEEE Trans. Geosci. Remote Sens. 2011, 49, 3973–3985. [Google Scholar] [CrossRef]
  22. Camps-Valls, G.; Bruzzone, L. Kernel-based methods for hyperspectral image classification. IEEE Trans. Geosci. Remote Sens. 2005, 43, 1351–1362. [Google Scholar] [CrossRef]
  23. He, L.; Li, J.; Liu, C.; Li, S. Recent Advances on Spectral–Spatial Hyperspectral Image Classification: An Overview and New Guidelines. IEEE Trans. Geosci. Remote Sens. 2018, 56, 1579–1597. [Google Scholar] [CrossRef]
  24. Mou, L.; Ghamisi, P.; Zhu, X.X. Deep Recurrent Neural Networks for Hyperspectral Image Classification. IEEE Trans. Geosci. Remote Sens. 2017, 55, 3639–3655. [Google Scholar] [CrossRef] [Green Version]
  25. Bera, S.; Shrivastava, V.K.; Chandra Satapathy, S. Advances in Hyperspectral Image Classification Based on Convolutional Neural Networks: A Review. Comput. Model. Eng. Sci. 2022, 133, 219–250. [Google Scholar] [CrossRef]
  26. Ding, Y.; Zhao, X.; Zhang, Z.; Cai, W.; Yang, N.; Zhan, Y. Semi-Supervised Locality Preserving Dense Graph Neural Network With ARMA Filters and Context-Aware Learning for Hyperspectral Image Classification. IEEE Trans. Geosci. Remote Sens. 2022, 60, 1–12. [Google Scholar] [CrossRef]
  27. Hong, D.; Han, Z.; Yao, J.; Gao, L.; Zhang, B.; Plaza, A.; Chanussot, J. SpectralFormer: Rethinking Hyperspectral Image Classification With Transformers. IEEE Trans. Geosci. Remote Sens. 2022, 60, 1–15. [Google Scholar] [CrossRef]
  28. Kattenborn, T.; Leitloff, J.; Schiefer, F.; Hinz, S. Review on Convolutional Neural Networks (CNN) in vegetation remote sensing. J. Photogramm. Remote Sens. 2021, 173, 24–49. [Google Scholar] [CrossRef]
  29. Jaiswal, G.; Sharma, A.; Yadav, S.K. Critical insights into modern hyperspectral image applications through deep learning. WIREs Data Min. Knowl. Discov. 2021, 11, e1426. [Google Scholar] [CrossRef]
  30. Chen, Y.; Jiang, H.; Li, C.; Jia, X.; Ghamisi, P. Deep Feature Extraction and Classification of Hyperspectral Images Based on Convolutional Neural Networks. IEEE Trans. Geosci. Remote Sens. 2016, 54, 6232–6251. [Google Scholar] [CrossRef] [Green Version]
  31. Chen, Y.; Zhu, K.; Zhu, L.; He, X.; Ghamisi, P.; Benediktsson, J.A. Automatic Design of Convolutional Neural Network for Hyperspectral Image Classification. IEEE Trans. Geosci. Remote Sens. 2019, 57, 7048–7066. [Google Scholar] [CrossRef]
  32. Lee, H.; Kwon, H. Going Deeper With Contextual CNN for Hyperspectral Image Classification. IEEE Trans. Image Process. 2017, 26, 4843–4855. [Google Scholar] [CrossRef] [PubMed] [Green Version]
  33. Li, R.; Zheng, S.; Duan, C.; Yang, Y.; Wang, X. Classification of Hyperspectral Image Based on Double-Branch Dual-Attention Mechanism Network. Remote Sens. 2020, 12, 582. [Google Scholar] [CrossRef] [Green Version]
  34. Yu, H.; Xu, Z.; Zheng, K.; Hong, D.; Yang, H.; Song, M. MSTNet: A Multilevel Spectral–Spatial Transformer Network for Hyperspectral Image Classification. IEEE Trans. Geosci. Remote Sens. 2022, 60, 1–13. [Google Scholar] [CrossRef]
  35. Ashish, V.; Noam, S.; Niki, P.; Jakob, U.; Llion, J.; Aidan, N.; Gomez; Lukasz, K.; Illia, P. Attention is all you need. In Proceedings of the 31st International Conference on Neural Information Processing Systems, Long Beach, CA, USA, 4–9 December 2017; pp. 6000–6010. [Google Scholar]
  36. He, X.; Chen, Y.; Lin, Z. Spatial-Spectral Transformer for Hyperspectral Image Classification. Remote Sens. 2021, 13, 498. [Google Scholar] [CrossRef]
  37. Yang, X.; Cao, W.; Lu, Y.; Zhou, Y. Hyperspectral Image Transformer Classification Networks. IEEE Trans. Geosci. Remote Sens. 2022, 60, 1–15. [Google Scholar] [CrossRef]
  38. Xu, Y.; Zhang, Q.; Zhang, J.; Tao, D. ViTAE: Vision Transformer Advanced by Exploring Intrinsic Inductive Bias. In Proceedings of the Advances in Neural Information Processing Systems 34 (NeurIPS 2021), Online, 6–14 December 2021. [Google Scholar]
  39. Sun, L.; Zhao, G.; Zheng, Y.; Wu, Z. Spectral Spatial Feature Tokenization Transformer for Hyperspectral Image Classification. IEEE Trans. Geosci. Remote Sens. 2022, 60, 1–14. [Google Scholar] [CrossRef]
  40. Song, R.; Feng, Y.; Cheng, W.; Mu, Z.; Wang, X. BS2T: Bottleneck Spatial–Spectral Transformer for Hyperspectral Image Classification. IEEE Trans. Geosci. Remote Sens. 2022, 60, 1–17. [Google Scholar] [CrossRef]
  41. Zhang, Y.; Li, X.; Guo, X.; Wang, N.; Geng, K.; Li, D.; Wang, Z. Comparison of Methoxypyrazine Content and Expression Pattern of O-Methyltransferase Genes in Grape Berries and Wines from Six Cultivars (Vitis vinifera L.) in the Eastern Foothill of the Helan Mountain. Plants 2022, 11, 1613. [Google Scholar] [CrossRef] [PubMed]
  42. Lu, L.; Gong, Z.; Liang, Y.; Liang, S. Retrieval of Chlorophyll-a Concentrations of Class II Water Bodies of Inland Lakes and Reservoirs Based on ZY1-02D Satellite Hyperspectral Data. Remote Sens. 2022, 14, 1842. [Google Scholar] [CrossRef]
  43. Paoletti, M.E.; Haut, J.M.; Plaza, J.; Plaza, A. A new deep convolutional neural network for fast hyperspectral image classification. ISPRS J. Photogramm. Remote Sens. 2018, 145, 120–147. [Google Scholar] [CrossRef]
  44. Liu, K.; Sun, W.; Shao, Y.; Liu, W.; Yang, G.; Meng, X.; Peng, J.; Mao, D.; Ren, K. Mapping Coastal Wetlands Using Transformer in Transformer Deep Network on China ZY1-02D Hyperspectral Satellite Images. IEEE J. Sel. Top. Appl. Earth Obs. Remote Sens. 2022, 15, 3891–3903. [Google Scholar] [CrossRef]
  45. He, K.; Zhang, X.; Ren, S.; Sun, J. Deep Residual Learning for Image Recognition. In Proceedings of the 2016 IEEE Conference on Computer Vision and Pattern Recognition (CVPR), Las Vegas, NV, USA, 27–30 June 2016; pp. 770–778. [Google Scholar]
  46. Aleissaee, A.A.; Amandeep, K.; Anwer, R.M.; Salman, K.; Hisham, C.; Xia, G.; Khan, F.S. Transformers in Remote Sensing A Survey. Remote Sens. 2023, 15, 1860. [Google Scholar] [CrossRef]
  47. He, J.; Yuan, Q.; Li, J.; Xiao, Y.; Liu, X.; Zou, Y. DsTer: A dense spectral transformer for remote sensing spectral super-resolution. Int. J. Appl. Earth Obs. Geoinf. 2022, 109. [Google Scholar] [CrossRef]
  48. Wang, Y.; Hong, D.; Sha, J.; Gao, L.; Liu, L.; Zhang, Y.; Rong, X. Spectral–Spatial–Temporal Transformers for Hyperspectral Image Change Detection. IEEE Trans. Geosci. Remote Sens. 2022, 60, 1–14. [Google Scholar] [CrossRef]
  49. Ghosh, P.; Roy, S.K.; Koirala, B.; Rasti, B.; Scheunders, P. Hyperspectral Unmixing Using Transformer Network. IEEE Trans. Geosci. Remote Sens. 2022, 60, 1–16. [Google Scholar] [CrossRef]
  50. Rao, W.; Gao, L.; Qu, Y.; Sun, X.; Zhang, B.; Chanussot, J. Siamese Transformer Network for Hyperspectral Image Target Detection. IEEE Trans. Geosci. Remote Sens. 2022, 60, 1–19. [Google Scholar] [CrossRef]
  51. Alexey, D.; Lucas, B.; Alexander, K.; Dirk, W.; Zhai, X.; Thomas; Unterthiner; Mostafa, D.; Matthias, M.; Georg, H.; et al. An image is worth 16 × 16 words. arXiv 2021, arXiv:2010.11929. [Google Scholar]
  52. Keskar, N.S.; Mudigere, D.; Nocedal, J.; Smelyanskiy, M.; Tang, P.T.P. On Large-Batch Training for Deep Learning: Generalization Gap and Sharp Minima. In Proceedings of the 5th International Conference on Learning Representations, ICLR 2017, Toulon, France, 24–26 April 2017. [Google Scholar]
  53. Zhong, Z.; Li, J.; Luo, Z.; Chapman, M. Spectral–Spatial Residual Network for Hyperspectral Image Classification: A 3-D Deep Learning Framework. IEEE Trans. Geosci. Remote Sens. 2018, 56, 847–858. [Google Scholar] [CrossRef]
  54. Wang, W.; Dou, S.; Jiang, Z.; Sun, L. A Fast Dense Spectral–Spatial Convolution Network Framework for Hyperspectral Images Classification. Remote Sens. 2018, 10, 1068. [Google Scholar] [CrossRef] [Green Version]
  55. Ma, W.; Yang, Q.; Wu, Y.; Zhao, W.; Zhang, X. Double-Branch Multi-Attention Mechanism Network for Hyperspectral Image Classification. Remote Sens. 2019, 11, 1307. [Google Scholar] [CrossRef] [Green Version]
  56. Roy, S.K.; Manna, S.; Song, T.; Bruzzone, L. Attention-Based Adaptive Spectral–Spatial Kernel ResNet for Hyperspectral Image Classification. IEEE Trans. Geosci. Remote Sens. 2021, 59, 7831–7843. [Google Scholar] [CrossRef]
  57. Loshchilov, I.; Hutter, F. Decoupled Weight Decay Regularization. arXiv 2017, arXiv:1711.05101. [Google Scholar]
  58. Liu, W.; Zhang, X.; He, F.; Xiong, Q.; Zan, X.; Liu, Z.; Sha, D.; Yang, C.; Li, S.; Zhao, Y. Open-air grape classification and its application in parcel-level risk assessment of late frost in the eastern Helan Mountains. ISPRS J. Photogramm. Remote Sens. 2021, 174, 132–150. [Google Scholar] [CrossRef]
Figure 1. Location maps of the study area. (a) Map of China. (b) Map of Ningxia. (c) A false color image (859.68 nm for blue, 662.29 nm for green, and 559.23 nm for red) of ZY1-02D hyperspectral data for the EFHLM area, with the green diamond symbol representing the field survey points.
Remotesensing 15 03269 g001
Figure 2. EFHLM dataset. (a) Image cube. (b) Ground truth. (c) Average reflectance for each type of ground object.
Remotesensing 15 03269 g002
Figure 3. Flowchart of the proposed SCSTIN for classification based on the HSI image.
Remotesensing 15 03269 g003
Figure 4. Network structure of the spectral Transformer branch. (a) Framework of the Transformer module. (b) Framework of the MHSA. (c) Framework of the MLP.
Remotesensing 15 03269 g004
Figure 5. Network structure of the spatial CNN branch.
Remotesensing 15 03269 g005
Figure 6. Network structure of the two types of feature fusion modules in SCSTIN. (a) Structure of SSIF. (b) Structure of CAW.
Remotesensing 15 03269 g006
Figure 7. Performance comparison of the SCSTIN-4 model with different parameter settings. (a) Network depth. (b) Learning rate. (c) Batch size. (d) Patch size.
Remotesensing 15 03269 g007
Figure 8. The ground object distribution maps for the EFHLM dataset, with purple boxes indicating the main planting areas of grapes. (a) False color image. (b) CDCNN (OA = 89.54%). (c) SSRN (OA = 95.19%). (d) FDSSC (OA = 95.50%). (e) DBMA (OA = 93.60%). (f) DBDA (OA = 95.89%). (g) A2S2K (OA = 96.24%). (h) ViT (OA = 92.95%). (i) BS2T (OA = 96.06%). (j) SCSTIN-2 (OA = 96.49%). (k) SCSTIN-4 (OA = 96.98%). (l) Ground truth.
Remotesensing 15 03269 g008
Figure 9. Zoomed-in maps for the black box region of EFHLM, with the black box indicating the zoomed region. (a) False color image. (b) CDCNN (OA = 89.54%). (c) SSRN (OA = 95.19%). (d) FDSSC (OA = 95.50%). (e) DBMA (OA = 93.60%). (f) DBDA (OA = 95.89%). (g) A2S2K (OA = 96.24%). (h) ViT (OA = 92.95%). (i) BS2T (OA = 96.06%). (j) SCSTIN-2 (OA = 96.49%). (k) SCSTIN-4 (OA = 96.98%). (l) Ground truth.
Remotesensing 15 03269 g009
Figure 10. Comparison of model performance over different percentages of training samples on the EFHLM dataset.
Remotesensing 15 03269 g010
Figure 11. Ablation study for the SCSTIN-4 model with the EFHLM dataset. A two-branched network is the combination model of two branches without two feature fusion modules.
Remotesensing 15 03269 g011
Figure 12. The false color image and ground truth map of the satellite hyperspectral dataset for Botswana.
Remotesensing 15 03269 g012
Figure 13. The false color image and ground truth map of the airborne hyperspectral dataset for Indiana Pines.
Remotesensing 15 03269 g013
Table 1. The configurations of the AHSI sensor on the ZY1-02D satellite.
ConfigurationsZY1-02D AHSI
VNIRSWIR
Wavelength400–1040 nm1005–2500 nm
Spectral resolution10 nm20 nm
Spatial resolution30 m30 m
Bands7690
Swath width60 km60 km
Table 2. Sample information from the EFHLM dataset.
Class NumberGround ObjectNumber of Samples
1Corn13,686
2Rice13,241
3Alfalfa3480
4Trees9658
5Grassland2103
6Vegetable10,383
7Bare land26,306
8Building23,291
9Road4689
10Water7823
11Greenhouse14,368
12Grape13,113
13Lotus1545
14Wheat2413
15Wetland13,691
16Wolfberry825
Total 160,615
Table 3. Detailed parameters for the SCSTIN framework in the experiment, where MHSA-4 is multi-head self-attention with four heads and MLP-4 denotes the multilayer perceptron whose increase ratio of hidden layer neurons is four.
StageCNN BranchSSIFTransformer Branch
Input s × s × B
Spectral dimension reductionThree-dimensional Conv [ 1 × 1 × B , 64 ]
Batch Norm
ReLU
Output s × s × 64
TokenizationTokenization block----
Output 65 × 16 -- s × s × 64
Depth 1Layer Norm
MHSA-4
Layer Norm
MLP-4
--Two-dimensional
Conv [ 3 × 3 , 64 ]
Batch Norm
ReLU
Output 65 × 16 16 ⇄ s × s s × s × 64
Depth 2Layer Norm
MHSA-4
Layer Norm
MLP-4
--Two-dimensional
Conv [ 3 × 3 , 64 ]
Batch Norm
ReLU
Output 65 × 16 16 ⇄ s × s s × s × 64
Depth mLayer Norm
MHSA-4
Layer Norm
MLP-4
--Two-dimensional
Conv [ 3 × 3 , 64 ]
Batch Norm
ReLU
Output 65 × 16 -- s × s × 64
Last LayerClass token Two-dimensional average pool
F C ( 16 n ) F C ( 64 n )
CAW
Output 1 × n
Table 4. Comparisons of classification results among different models for the EFHLM dataset.
ClassTraining
Samples
CNN-Based ModelsAttention-Based ModelsTransformer-Based Models
CDCNNSSRNFDSSCDBMADBDAA2S2KViTBS2TSCSTIN-2SCSTIN-4
Corn13697.3998.1897.9897.3798.7398.7698.7698.7599.00 **98.84 *
Rice13293.4796.6996.8695.3197.2497.95 *95.1997.5896.4098.06 **
Alfalfa3461.3885.8390.34 *82.6388.4487.8082.0289.7489.6391.45 **
Trees9679.0391.4992.2688.7592.2092.2988.7991.6795.96 **95.64 *
Grassland2123.2282.10 *82.0375.4980.5479.1569.6880.9079.7682.12 **
Vegetable10388.0195.4995.5092.1395.5595.99 **87.7195.58 *94.8295.26
Bare land26389.4794.8095.7794.5296.8996.6492.4096.1197.08 *97.39 **
Building23293.0797.2897.1596.8197.5598.03 **95.9297.8997.7297.97 *
Road4668.7274.0370.1763.0669.6473.4180.0875.6082.47 **82.35 *
Water7894.4395.1594.6692.6995.0597.0296.9695.4697.13 *97.53 **
Greenhouse14396.9598.1098.2498.3098.9199.20 *98.4899.29 **98.9899.14
Grape13192.0297.6197.6695.7698.0998.34 *93.9797.9398.0498.47 **
Lotus1546.8989.1991.39 *86.4291.0189.1484.4690.7288.2892.18 **
Wheat2410.5096.5798.33 *90.3397.8497.4063.0298.0392.1598.91 **
Wetland13692.2296.6098.76 *96.6498.5698.0497.1198.4298.5398.85 **
Wolfberry89.8894.6394.3589.3993.7293.6571.1295.82 *92.2196.00 **
OA (%) 89.5495.1995.5093.6095.8996.2492.9596.0696.49 *96.98 **
AA (%) 71.0492.7393.2189.7393.1293.3087.2393.72 *93.6795.01 **
Kappa 86.1894.7895.1392.9295.4595.8492.1995.6496.11 *96.65 **
Mapping Time (min) 6.80 **21.5726.5332.6131.7728.6855.0075.799.49 *15.72
** indicates the optimal value, and * indicates the suboptimal value.
Table 5. Model complexity comparison in the EFHLM dataset.
ModelsParametersFLOPs (MMac)Training Time/Epoch (s)
CDCNN2,181,13615.000.30
SSRN284,296116.300.88
FDSSC915,490129.751.28
DBMA449,309211.422.80
DBDA294,83699.691.72
A2S2K289,661125.981.16
ViT3,576,976291.851.53
BS2T282,90478.192.86
SCSTIN-2193,52215.680.46
SCSTIN-4372,21230.320.67
Table 6. Classification accuracies on the Botswana and Indiana Pines datasets.
ModelsBotswanaIndiana Pines
OAAAKappaTraining Time/Epoch (s)OAAAKappaTraining Time/Epoch (s)
CDCNN75.6176.2373.640.0567.3950.3862.180.11
SSRN91.9191.8091.230.1194.5893.4293.820.42
FDSSC93.9993.7593.490.1295.5890.0694.953.00
DBMA95.8895.8995.540.1289.9988.9988.591.29
DBDA95.8695.7995.510.1396.0795.9295.530.73
A2S2K92.6392.7192.010.1193.7490.2892.850.50
ViT91.9992.3891.320.1486.6587.2884.740.52
BS2T95.9796.2095.630.3895.6594.4095.031.29
SCSTIN-295.8495.7495.500.0795.8493.7395.250.12
SCSTIN-496.5496.5696.250.0996.3295.9995.800.18
Disclaimer/Publisher’s Note: The statements, opinions and data contained in all publications are solely those of the individual author(s) and contributor(s) and not of MDPI and/or the editor(s). MDPI and/or the editor(s) disclaim responsibility for any injury to people or property resulting from any ideas, methods, instructions or products referred to in the content.

