Abstract
Ground-penetrating radar (GPR) is an important tool for measuring soil water content (SWC) at the field scale. The amplitude analysis of the early time signal (ETS) of GPR may provide a rapid way to estimate SWC. By assuming a homogeneous medium, various studies have been conducted on the relationship between the amplitude of ETS and the topsoil layer’s electromagnetic parameters (dielectric permittivity and conductivity) through numerical simulations, laboratory experiments, and field experiments. Soil is a typical inhomogeneous medium, and soil cultivation is a factor affecting its heterogeneity. In this context, we discuss the ability of the amplitude of ETS to estimate the water content of heterogeneous soil. First, we establish a multi-scale stochastic medium model with the inhomogeneous distribution of dielectric permittivity and conductivity and simulate the GPR response by the finite-difference time-domain (FDTD) method to observe the influence of medium heterogeneity on the GPR response. The heterogeneity of the soil models is evaluated by a geostatistical analysis described by two parameters, correlation length and variability. Then, we analyze the relationship between variability and the average envelope amplitude (AEA) of ETS. A strong soil heterogeneity increases the error of the AEA method in estimating SWC. Finally, the AEA method is used to estimate the SWC of two adjacent fields with different heterogeneities, which were caused by different cultivation methods. The results of the numerical simulation and field experiment indicate that the soil heterogeneity can have an impact on the estimation of SWC using EST, with an error lower than 3% within a depth range of 1/2 λ to λ (wavelength). This suggests that the EST of GPR can be applied to soil layers with relatively large lateral changes in water content.
1. Introduction
The conventional methods for measuring soil water content (SWC), such as the thermo-gravimetric method, the neutron scattering method, and the time-domain reflectometry (TDR) method, are single-point measurements that make it difficult to directly obtain the continuous variation and spatial distribution of SWC in a planar area [1,2,3]. Remote sensing techniques are suitable for characterizing changes in SWC at the regional or large scale, but with a lower detection accuracy [4,5]. Therefore, there is a need for a SWC estimation technology that can be implemented intensively, quickly, and accurately in a medium-scale range, which is crucial for soil and water conservation and precision agriculture in farmland.
Ground-penetrating radar (GPR) is a non-destructive and efficient tool that uses high-frequency electromagnetic (EM) waves to detect SWC. Conventional methods for GPR detection of SWC mainly include the reflected wave method, the ground wave method, and the surface reflection method [6,7,8,9,10,11,12,13]. The reflected wave method is widely used in detecting SWC, but it requires clear GPR reflections from the interface [6,9]. The ground wave method uses data collected by the wide-angle method to obtain the EM wave velocity and requires assuming the near surface as a homogeneous medium [12]. The surface reflection method requires antenna-to-ground measurements that are susceptible to the influence of ground roughness and vegetation [13].
A method has been proposed to estimate the distribution of shallow SWC by utilizing the early time signal (ETS) from common-offset data of a ground-coupled GPR system [14]. The ETS is generally considered to be the overlap of air and ground waves, and its shape, amplitude, and duration are influenced by the soil dielectric permittivity [15]. Compared with other methods, the ETS method is more suitable for estimating SWC in soil media with high EM wave attenuation, unclear reflection signals, and ineffective separation of ground waves and air waves [16]. The amplitude of the ETS of GPR is dimensionless, and not only varies with the EM properties of the subsurface media, but also depends on GPR system and center-frequency of the antenna, which determines that it cannot be directly used to quantitatively estimate the dielectric properties of the media. Therefore, statistical methods are generally used to quantify the relationship between ETS and soil dielectric properties. For example, the average envelope amplitude (AEA) of ETS can be used once the statistical relationship is determined between the soil dielectric permittivity and the AEA through on-site calibration (such as using TDR), and then the SWC can be estimated. The feasibility of this method has been evaluated by multiple researchers through numerical simulations, laboratory experiments, and field experiments [17,18,19].
The above-mentioned studies on the AEA method are mostly based on the assumption of homogeneous media. However, soil is a typical heterogeneous medium, especially agricultural soil affected by cultivation, which has strong heterogeneity. Moreover, compared with traditional hydrogeological applications, GPR needs to detect shallower objects in soil and agriculture, whose applications require higher resolution and sensitivity. Therefore, antennas with relatively high frequencies are usually preferred. At higher frequencies, GPR is more sensitive to the heterogeneity of the soil, and the presence of heterogeneities has an impact on the signals as they pass by. The heterogeneities extract energy as the EM field passes and scatter it in all directions. EM waves passing through heterogeneous soil may result in energy loss due to unnecessary scattering, causing changes in the amplitude of ETS [20,21,22].
In this article, we analyze the heterogeneity of the soil model established based on the stochastic medium, and the influence of soil permittivity and conductivity on the ETS of GPR in soil models with different heterogeneities. Then, we conducted field studies on two cultivated lands with different soil heterogeneities to demonstrate the applicability of the AEA method in estimating the spatial distribution of SWC.
2. Materials and Methods
2.1. The Multi-Scale Stochastic Model
Soil can be described by the multi-scale stochastic model. The inhomogeneous body in the soil is regarded as a spatial stochastic process, and the stochastic medium model is defined as the inhomogeneous distribution of the medium described by statistical methods. Consider a model as composed of two different scales of inhomogeneous media. In this case, the scale is a relative concept, and large-scale heterogeneity is used to characterize the average medium characteristics of the background; on the other hand, small-scale heterogeneity characterizes the random characteristics of the detected target medium properties, which are widely and irregularly distributed in the medium [23]. The parameters of random components have the characteristic of drastic changes, and a combination model is often used to describe it, that is, the inhomogeneous medium model is composed of a homogeneous medium (background) and a random disturbance ( satisfies Gaussian distribution). The stochastic medium model can be described as follows [24]:
where the 2D spatial position vector is represented as and represents the relative perturbation characteristics of this stochastic medium, with .
The Gaussian elliptical autocorrelation function is adopted with small-scale heterogeneity to establish the stochastic medium model:
where r represents the roughness factor (Gaussian elliptic autocorrelation function when r = 0, exponential elliptic autocorrelation function when r = 1, and intermixed elliptic autocorrelation function when 0 < r < 1); and A and B represent the autocorrelation lengths in the x and z directions, respectively. After 2D Fourier transform, the autocorrelation equation becomes the energy spectrum function:
where . Then, random phase is added and the power spectrum function is obtained:
Then, an inverse Fourier transform is performed on Equation (4), based on the mean value and variance:
By using the above equations and setting the parameters a, b, and r, a 2D stochastic model with its corresponding scale can be obtained. The autocorrelation lengths A and B, respectively, describe the average scale of heterogeneity anomalies in the horizontal (x) and depth (z) directions of stochastic media [25]. Therefore, the heterogeneity of stochastic media can be simulated by controlling the autocorrelation lengths A and B.
2.2. Principles for Estimating SWC with ETS
The ETS is commonly regarded as the overlapping signals of direct air and ground waves, which generally occurs in common-offset measurements. The topsoil layer’s EM parameters strongly influence ETS [14,15,16,17,18,19]. The AEA of ETS is the average envelope amplitude. In general, a change in SWC determines the soil dielectric permittivity [6]. Figure 1 shows the processing flow of the AEA method based on ETS for estimating SWC. It includes the following steps:
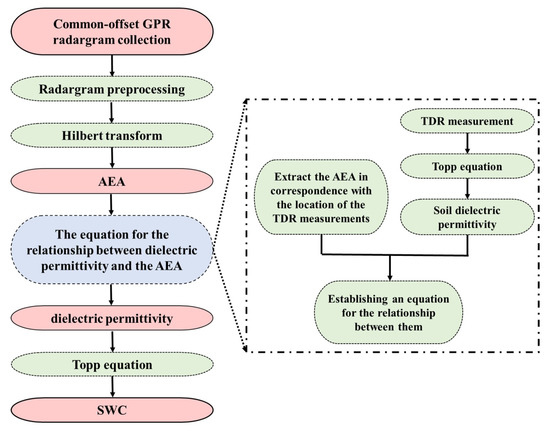
Figure 1.
The data-processing procedure of the AEA method based on the ETS of GPR for estimating SWC.
- (1)
- The obtained GPR common-offset data is preprocessed by DC filter, Band pass filter, and trace averaging to obtain ETS data that are suitable for SWC estimation.
- (2)
- To obtain the AEA, a Hilbert transform is performed on the ETS of GPR [14]. Assuming the signal obtained by GPR is , the Hilbert transform is described by:
After the Hilbert transform of signal data, the phase spectrum needs 90° phase shift, which is equivalent to a filter. Its analytic signal is:
The envelope amplitude is:
The AEA is the average value of the envelope amplitude of ETS.
- (3)
- A relationship is established between the dielectric permittivity and the AEA by extracting the AEA in correspondence with the location of the TDR measurements. The Topp equation [26] is used to covert the volumetric SWC by TDR measurements into the soil dielectric permittivity , which is:where is the volumetric SWC.
- (4)
- The of the soil can be estimated using the statistical relationship in step (3) with the AEA value of ETS. Then, the SWC can be calculated using the Topp equation.
2.3. Soil Models and Heterogeneity Analysis
Four soil models were established by stochastic modeling method (autocorrelation length A = B = 0.10), as shown in Figure 2. We assumed the models were irrigated with a conductive water solution ( = 0.30 S/m) and the volumetric water content ranged from 0.24 to 0.34 m3/m3 for all models [27]. Then, the corresponding ranged from 13 to 19 (Figure 2a,c,e,g), which were calculated via the Topp equation. The static electric conductivity ranged from 0.05 to 0.10 S/m (Figure 2b,d,f,h), which was calculated using the following relationship [28]:
where is the electrical conductivity of the dry soil (0.002 S/m) and is the tortuosity factor ( [27]).
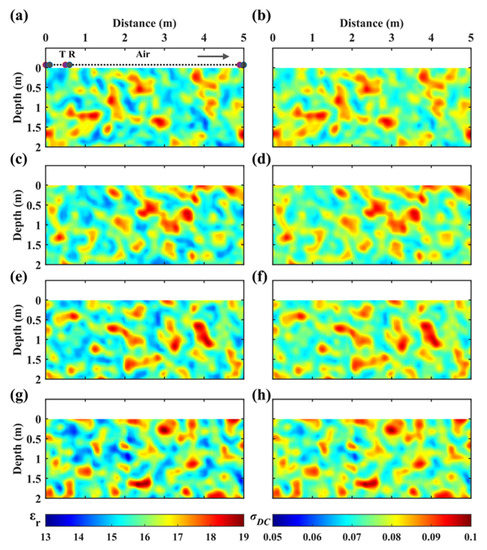
Figure 2.
Stochastic soil models. The left column (a,c,e,g) represents the distribution of the of model 1 to model 4; the right column (b,d,f,h) represents the distribution of the of model 1 to model 4, respectively. (a) T: transmitter; R: receiver; we assumed a separation of 0.10 m between T and R, and the air layer = 1 and = 0 S/m.
The semivariance function is a key function in geostatistics for studying soil variability and can be used to quantify heterogeneity. For 1D distribution ε(x), the semivariogram is expressed by [29]:
where is the lag distance between two data points, and ; and is the number of data pairs with a constant lag distance from all data points. Usually, the semivariance function increases with the increase in the lag distance until it reaches a certain value and then becomes constant, as shown in Figure 3. For the lag distance , the semivariance that becomes constant is called the sill ; the corresponding is called range . The range represents the average distance between data pairs that are no longer relevant, thus is equivalent to the correlation length and characteristic length [30]. The sill corresponds to the maximum variance in the dataset and thus is an indicator of variability. The exponential semivariogram model without the nugget effect is expressed by [29]:
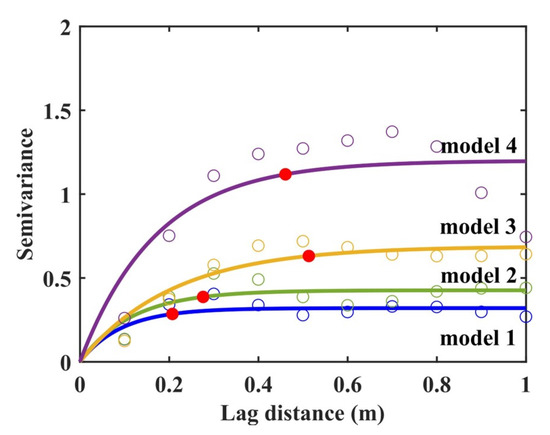
Figure 3.
Variogram analysis of the distribution of the of the four models in Figure 2. The circles show the semivariogram, the curves show the fitted exponential semivariogram model, and the red dots indicate the determined practical range and sill , where the semivariance becomes constant.
We fitted it into the calculated semivariograms to determine the range and sill of the soil. The exponential semivariogram model was employed in this modeling because the distribution of soil boundaries, which is the principal source of the variation, was expected to exhibit exponential distribution [31]. Since the exponential model gradually approaches its sill, the practical range is defined as the distance at which the modeled semivariance reaches 95% of the sill [32].
The heterogeneity was quantified by geostatistics analysis according to the spatial distribution of the of the models. Figure 3 shows the semivariance plot of four stochastic soil models, within a depth range of 0.10 m (expressed by Equation (11)). The correlation length and sill were determined by fitting the exponential model (Equation (12)) to the experimental variogram. From the red dots shown in Figure 3, it can be seen that the sill values from model 1 to model 4 gradually increase, which means that the varibilities of model 1 and model 4 are the smallest and the largest, respectively.
3. Results
3.1. Forward Modeling and Analysis
3.1.1. FDTD Forward Modeling and ETS Characteristics
We used the FDTD codes from Irving et al. (2006) to perform forward modeling [33]. The center-frequency of the antenna was 500 MHz. The time window was 50 ns with a sampling interval of 0.02 ns, and 99 traces were collected with a trace spacing of 0.05 m. The antenna was located on the ground with a separation of 0.10 m between the transmitter and receiver. Figure 4 shows the forward modeling data of the four models. There is a strong variation in the amplitude of the ETS. The continuity of ETS amplitude in the horizontal direction is better in models 1 and 2 than in models 3 and 4. This corresponds to the heterogeneities of the four models, i.e., the variability of model 1 < model 2 < model 3 < model 4.
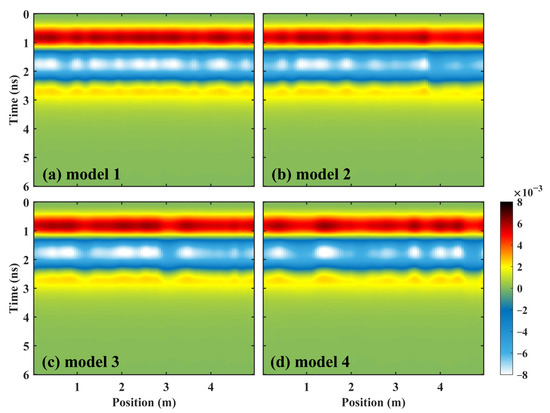
Figure 4.
Forward modeling results. (a–d) Model 1–model 4.
3.1.2. ETS Characteristics and Conductivity
To better understand the impact of on the ETS of GPR in stochastic media, we established extra models according to the following distributions of and : (1) = 7–9 and = 0.02–0.03 S/m (dry condition); (2) = 7–9 and = 0.06–0.08 S/m; (3) = 14–16 and = 0.02–0.03 S/m; and (4) = 14–16 and = 0.06–0.08 S/m (humid condition). The autocorrelation length of A and B used in these stochastic models were equal to 0.10. We simulated these models and obtained the GPR trace from each stochastic model, as shown in Figure 5. A time window of 0–4 ns was used to better visualize the amplitude, shape, and duration of different traces.
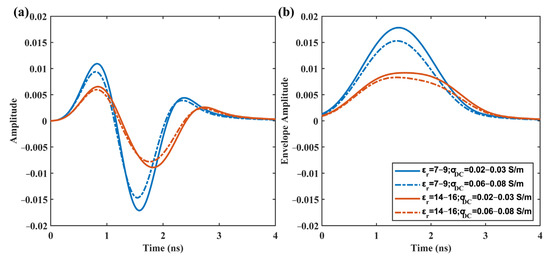
Figure 5.
Simulated GPR traces from the models by considering the following factors: (1) dry condition (blue solid line); (2) low and high (blue dashed line); (3) high and low (red solid line); (4) humid condition (red dashed line). (a) Amplitude of single trace data; (b) the envelope amplitude of traces in (a).
The waveforms in Figure 5 show that has a more significant impact on the ETS of GPR than . The change in conductivity mainly affects the amplitude of the trace, but the change in affects its amplitude, shape, and duration. Therefore, this article mainly analyzed the influence of on ETS, ignoring the influence of conductivity on ETS.
3.1.3. ETS Characteristics and Dielectric Permittivity
Two GPR traces in the same range of = 16.5–18.0 were selected from model 1 (Figure 4a) and model 4 (Figure 4d). As shown in Figure 6, their waveforms vary in amplitude and exhibit different time durations. The amplitude of the signal from model 1 is slightly higher than that from model 4, while the time duration of the signal from model 4 is slightly longer than that from model 1. The differences between two traces should be related to soil heterogeneity since they have same range. The trace from model 1 with a low soil heterogeneity shows a higher amplitude and shorter time duration.
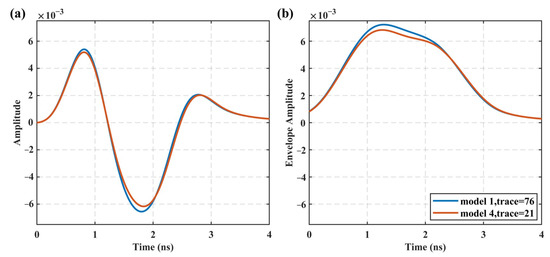
Figure 6.
Single trace from model 1 and model 4. (a) Amplitude; (b) envelope amplitude.
3.1.4. Detectable Depth of the AEA Method in Stochastic Media
The study by Di Matteo et al. (2013) showed that the AEA of the first positive half cycle is most closely related to the dielectric permittivity [15]. Therefore, we established the relationship between the AEA of the first positive half cycle of ETS with the .
Figure 7 shows the correlation between AEA (inverse scale drawing) of the first positive half cycle and of model 1 (left column) and model 4 (right column). The average values of within depths of 0.08 m, 0.12 m, 0.16 m, and 0.20 m (dashed lines) were compared with AEA. The change in along the survey line reflects the heterogeneity of the medium, and the AEA value also changes accordingly. The AEA is inversely proportional to the dielectric permittivity.
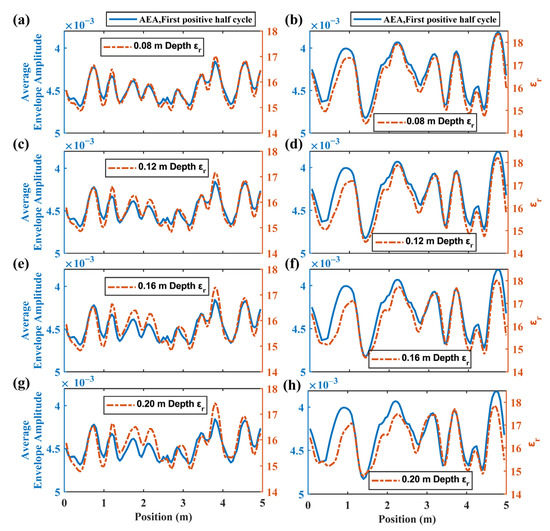
Figure 7.
Correlation between the AEA of the first positive half cycle and the of model 1 and model 4. The left (a,c,e,g) and right columns (b,d,f,h) correspond to the at depths of 0.08, 0.12, 0.16, and 0.20 m in model 1 and model 4, respectively (AEA inverse scale drawing).
We used the Pearson correlation coefficient method to evaluate the strength of the linear relationship between AEA−1 (reciprocal of AEA) and [14,15], and the residual norm (RN) to evaluate the magnitude of their fitting error.
The correlation between the soil EM properties and AEA−1 of GPR is quantitatively estimated by the coefficient r, which is calculated using the pairs of values associated with each model:
where and represent the covariance and variance operators, respectively. is the soil value and is the AEA−1 of GPR.
In statistics, the RN is a measure of the difference between the observed values and the values predicted by a model. It is often used in linear regression to assess the goodness of fit of the model.
The RN is defined as the Euclidean norm of the residual vector , which is expressed by:
where n is the number of data points, is the AEA−1 value at , and is the predicted value of based on the model. The sum is taken over all n data points. In this case, we normalized the values of AEA−1 before calculating the RN values.
A smaller RN indicates a better fit of the model to the data. The RN can also be used to identify outliers or influential points that may affect the fit of the model. The AEA−1 and satisfy a linear fitting relationship [15]. The soil heterogeneity is equivalent to having outliers in linear regression fitting. Therefore, the RN was used to represent the influence of medium heterogeneity on the fitting relationship between AEA−1 and . The larger the RN, the greater the impact of medium heterogeneity.
Table 1 summarizes the correlation coefficients r between the AEA−1 and of model 1 to model 4 at different depths. All models showed a good correlation (≥0.82) between AEA−1 and . As the depth increases, the correlation between AEA−1 and decreases. Within a depth of 0.20 m, the minimum of the soil is 14, resulting in an EM wave velocity of approximately 0.08 m/ns. Thus, the maximum wavelength λ should be 0.16 m. Therefore, it can be inferred from Table 1 that there is a good correlation between AEA−1 and within a depth equal to 1/2 λ to λ. Table 1 shows the lowest RN in model 1 and the highest RN in model 4. This indicates that a strong heterogeneity of the soil can reduce the fitting degree between AEA−1 and .

Table 1.
Correlation coefficient r and RN between the AEA−1 of the first positive half cycle of the four models and the within various depths.
3.1.5. AEA Estimation of SWC in Stochastic Media
A fitting procedure was used to build a direct relationship between AEA−1 and . For model 1 and model 4, we chose the average values at every 0.50 m along the measurement direction, and then fitted them with the AEA−1 values of the GPR signals acquired at the same positions. The relationship shown in Figure 8 was used to estimate . Then, the SWC values were obtained using the model and the estimated by Topp equation, as shown in Figure 9. From Figure 9, it can be seen that the estimated SWC of both models has a good consistency with the actual SWC, which is better in model 1 than in model 4.
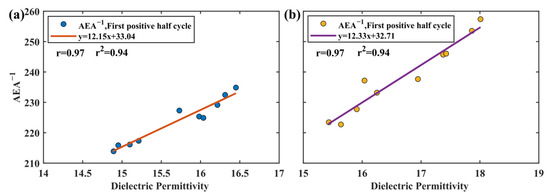
Figure 8.
The fitting curve of the AEA−1 of the first positive half cycle and the average within a depth of 0.10 m. (a) Model 1; (b) model 4.
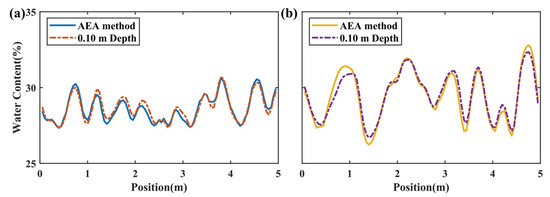
Figure 9.
AEA method predicts the average water content and actual average water content within a depth of 0.10 m. (a) Model 1; (b) model 4.
Figure 10 shows that the variability (sill ) of each model is compared with the root-mean-squared error (RMSE) of the estimated water content based on the AEA method. The variabilities of the four models are shown in Figure 3. It was found that the estimation error increases as the variability (heterogeneity) increases from model 1 to model 4. However, the estimated errors for all models within a depth of 0.10 m are less than 1. This indicates that the AEA method is still applicable in heterogenous media.
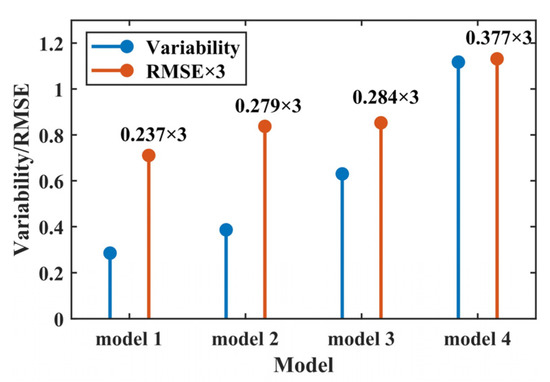
Figure 10.
Comparison of the variabilities and the RMSE of SWC estimation for the four models. The RMSE is multiplied by a factor of 3 for better visibility.
3.2. The Field Exploration Example
3.2.1. Field Experiment Data Collection
A soil detection experiment on a cultivated land was conducted in Gongzhuling City, Jilin, China, in November 2021. This experimental site belongs to the Jilin Academy of Agricultural Sciences, and two adjacent arable lands were farmed with two different cultivation methods, which are shown in Figure 11. The purpose of these cultivation methods is to understand which one is more conducive to protecting the soil and achieving a higher corn yield. The site is located in a semi-humid climate region with a mean annual precipitation range from 500 to 600 mm, of which approximately 90% falls as rain between April and September. It is a black soil developed on a loess-like parent material. The thickness of the black soil layer is 0.30–0.40 m, including a transition layer of 0.10 m, below which is the loess (original soil).
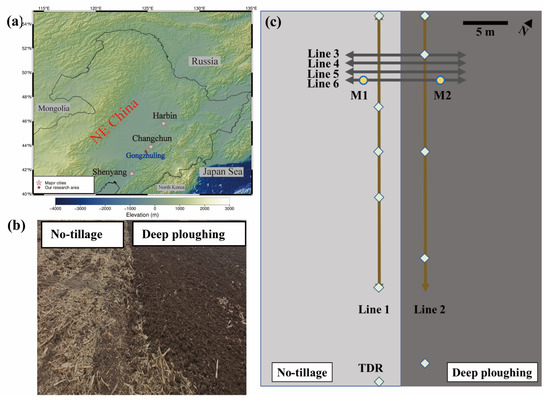
Figure 11.
Field trial area. (a) Research area map; (b) experimental field; (c) schematic diagram of the GPR detection area.
Two different cultivation methods, no-tillage and deep ploughing, on this site have been applied for more than 10 years (Figure 11b). Our experiment was conducted in November after the autumn harvest. At this time, in the no-tillage field, the soil was compact and the surface was covered with a thin layer of crushed straw. In the deep ploughing field, the black soil containing some incompletely crushed straw was exposed to the air and the top 0.20 m of soil layer, especially within a depth range of 0.10 m, was very loose with many pores due to being plowed deeply. Many studies have shown that the soil and water conservation ability of no-tillage farmland is stronger than that of deep ploughing farmland (such as Hu et al. (2009) [34]). We used TDR to measure the volumetric SWC of two fields. The SWC in the no-tillage field ranged from 25.60% to 32.91%, while the SWC in the deep ploughing field was from 12.19% to 20.86%. Two soil samples at a depth of 0.5–0.15 m were taken from the two fields and their mass water contents (MWCs) were measured by the thermo-gravimetric method. It was found that the MWC was 23.17% in the no-tillage field and 22.12% in the deep ploughing field. Then, the MWC values were converted into volumetric water content, which was 28.21% in the no-tillage field and 19.38% in the deep ploughing field. Therefore, this indicates that the large amount of air pores in the soil of the deep ploughing field contributes to its lower volumetric water content. The TDR points and soil sampling points (M1 and M2) are shown in Figure 11c.
GPR survey lines are shown in Figure 11c. Two GPR measuring lines were set parallel to each other with Line 1 in the no-tillage area and Line 2 in the deep ploughing area, with a length of 30 m and a 5 m interval between them. Lines 3–6 (with an interval of 1 m) crossed two fields and were 13 m long, passing vertically through Lines 1 and 2. The experiment employed a GPR system with a center-frequency of 500 MHz. Data were collected by the common-offset method, with a time window of 40 ns, a sampling interval of 0.075 ns, and a trace interval of 0.05 m. Following the GPR measurement, the TDR measured SWC within 0.15 m depth at the locations along Line 1 (0, 10, 15, 20, 30, and 40 m) and Line 2 (0, 5, 15, 27, and 38 m).
3.2.2. GPR Data Preprocessing
The GPR data were processed by DC filter, Band pass filter, and trace averaging to remove noise and horizontal interference. The preprocessed GPR data are shown in Figure 12.
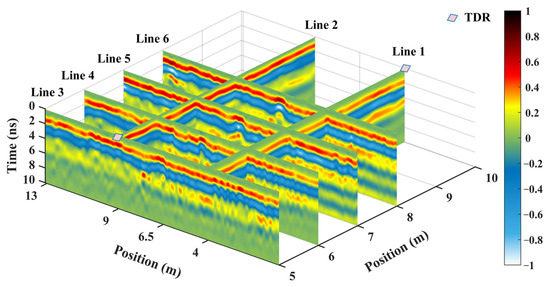
Figure 12.
GPR preprocessing results.
From Figure 12, it can be seen that, after preprocessing the GPR data of each survey line, the EST time window was about 0–6 ns and the detection depth was about 0.20 m. The 0–2 ns GPR amplitude in the deep ploughing area (Line 2 area) was greater than that in the no-tillage area (Line 1 area). This indicates that the and of the soil in the deep ploughing area are smaller than those in the non-tillage area.
The average traces from Lines 1 and 2 are shown in Figure 13a, and their envelop amplitudes are shown Figure 13b. Compared to Line 1, Line 2 exhibited a larger amplitude and an earlier radar amplitude signal takeoff. This corresponds to lower and and a higher wave velocity.
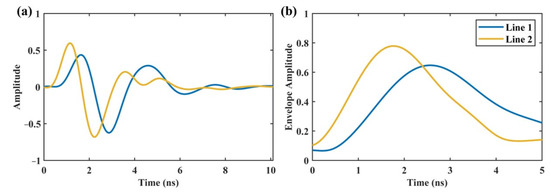
Figure 13.
Average traces from Line 1 (blue line) and Line 2 (yellow line) (a) and their envelope amplitude (b).
3.2.3. Fitting Relationship between the Dielectric Permittivity and AEA
The water content measured by the TDR was converted into the using the Topp equation. These from Lines 1 and 2 were used to fit with the AEA−1 of the first positive half cycle of the GPR data, and the fitting relationship is shown in Figure 14. From the figure, it can be seen that the correlation coefficient of the fitted curve is relatively high (r value above 0.90 and value above 0.85). This fitting relationship can be used to convert the AEA−1 of each survey line data into , thus obtaining the water content.
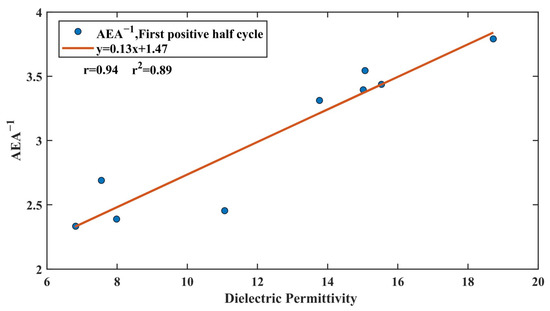
Figure 14.
The fitting curve of the AEA−1 of the first positive half cycle and .
3.2.4. Soil Heterogeneity
We analyzed the soil heterogeneity using the obtained of the soil from Lines 1 and 2. Figure 15a shows the distribution of along part of the survey Lines 1 and 2. The semivariance plots are expressed by Equation (11), as shown in Figure 15b. The correlation length and sill C were determined by fitting the exponential model (Equation (12)) to the variation function. The variability (sill C) of Line 2 in the deep ploughing field is larger than that of Line 1 in the no-tillage field. This indicates that the soil heterogeneity of the deep ploughing field is stronger than that of the no-tillage field.
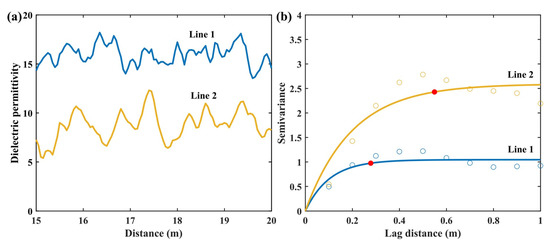
Figure 15.
Analysis of soil heterogeneities in the area where Lines 1 and 2 are located. (a) Calculation of the distribution of the measuring line 15–20 m using the fitting equation in Figure 14. (b) Variogram analysis of the soil distribution, with circles representing the semivariogram, curves representing the fitted exponential semivariogram model, and red dots representing the practical range a and sill C of the two determined measurement lines (where the semivariance becomes constant).
3.2.5. Estimation of SWC
We estimated the SWC of the area where Lines 3 to 6 are located using the AEA method. According to the fitting relationship shown in Figure 14, the water content in this area was estimated, as shown in Figure 16. The average volumetric SWC retrieved by the AEA method was 28.67% in the no-tillage area (left side of Figure 16) and 18.80% in the deep ploughing area (right side of Figure 16). The average volumetric SWC by TDR was 29.07% in the no-tillage area and 16.48% in the deep ploughing area. The difference in the average of SWC in both fields was less than 3%. The volumetric SWC of M1 and M2 were 28.21% in the no-tillage area and 19.38% in the deep ploughing area, respectively. Comparing SWC from the AEA method estimation at the same location with the latter, the errors were 1.42% in the no-tillage area and 2.75% in the deep ploughing area. This shows a lager estimation error in SWC in the deep ploughing area. This may suggest that soil heterogeneity has an impact on the estimation of SWC by the AEA method, and strongly heterogeneous soils increase the estimation error of water content by the AEA method. However, the differences in water content were both within 3% compared with the AEA method. Therefore, the AEA method can detect water content in heterogeneous cultivated soil.
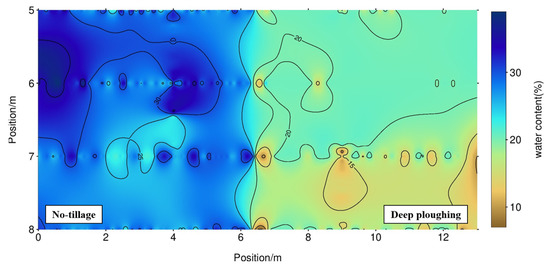
Figure 16.
AEA method for estimation of the average SWC within a depth of 0.10 m.
Within a depth range of 0.10 m, the soil structure of the no-tillage area was dense, and the soil of deep ploughing area was soft and porous, and the large pores were full of air. Therefore, the volumetric SWC in the no-tillage area was greater than that in the deep ploughing area. Through the AEA method, we can clearly understand the continuous changes and distribution of SWC in farmland under different cultivation modes. The distribution of SWC in the two locations indicates that no-tillage-covered farmland has a better soil water retention capacity than deep ploughing farmland.
4. Discussion
The present study investigated the heterogeneities of stochastic medium models using geostatistical analysis. Four stochastic soil models were designed with different random perturbations at the same scale and the volumetric water content ranged from 0.24 to 0.34 m3/m3. The results indicate that the variability of the stochastic medium models can be used to evaluate the heterogeneity of the soil. Overall, the geostatistics analysis conducted in this study provided insights into the heterogeneity of soil, which is crucial for various applications in geoscience, such as soil moisture monitoring and groundwater modeling. The approach employed in this study could be extended to other types of soil media and can be useful in developing better soil modeling.
We obtained the simulated GPR profiles of each model. We found that there was a strong variation in the ETS (0–2 ns) amplitude of the GPR profiles of the four models, equal to the heterogeneities from model 1 to model 4. Similar to previous works [15,16], the correlation between AEA of the first positive half cycle and was studied in the four models, and the results show that the high values of AEA correspond to a low . The has a more significant impact on the ETS of GPR than . The influence of on ETS was analyzed, and the results show that the amplitude and duration of the GPR signal varied with changes in soil heterogeneity. The AEA of the first positive half cycle of ETS was found to be inversely proportional to the dielectric permittivity. There was also a strong correlation between AEA−1 and within a depth equal to 1/2 λ to λ. In conclusion, this study provides valuable insights into the impact of soil heterogeneity on the GPR signal characteristics in stochastic media, and the results suggest that the AEA−1 of the first positive half cycle of ETS could be used to establish a statistical relationship with the of the soil model. The findings could have important implications for the interpretation of GPR data in soil and environmental studies. They could be further useful for the detection of soil heterogeneity and could aid in the interpretation of GPR signals in practical applications.
We used fitting relationships to estimate the water content of the models [16,18] and compared them with the actual water content. The results show that the estimation error of the water content is directly proportional to the heterogeneity of the medium. However, the estimation errors of water content in all models were lower than 1. The results demonstrate the feasibility of using the AEA method of GPR for estimating SWC in a heterogeneous medium, with reasonable accuracy. These findings provide useful insights into the potential of using the AEA method of GPR for the non-invasive monitoring of SWC.
The aim of this study was to investigate the impact of different cultivation methods on soil properties, specifically focusing on SWC, using GPR techniques. GPR was used to measure the soil dielectric permittivity, which is related to SWC, and TDR was used to directly measure the volumetric SWC. The soil heterogeneity of the deep ploughing field was stronger than that of the no-tillage field. The results of the GPR survey show that the no-tillage field had a higher dielectric permittivity than the deep ploughing field, which is indicative of a higher SWC. In both fields, the AEA method can accurately estimate SWC. The results from two fields suggest that different cultivation methods have a significant impact on SWC, and that no-tillage cultivation may be a more sustainable and efficient method for soil water conservation.
5. Conclusions
ETS is the first arrival wave collected by ground-coupled radar with a tightly fixed antenna in a simple configuration, and has been widely tested as a possible advantageous alternative method for monitoring and plotting the characteristics of small- and medium-sized shallow surfaces.
- (1)
- The combination of the stochastic medium modeling of GPR with the geostatistics method is useful to describe the heterogeneity of the soil medium, which can help to analyze the usability of the AEA method in heterogeneous soil. The greater the heterogeneity of the soil, the greater the error in estimating water content using the AEA method of ETS. Therefore, the soil heterogeneity should be considered when using the AEA method for estimating SWC using GPR.
- (2)
- Dielectric permittivity has a greater impact on ETS. Conductivity affects the amplitude, while dielectric permittivity affects the amplitude and time. There is a good correlation between AEA−1 and dielectric permittivity within a depth range of 1/2 λ to λ (wavelength). Therefore, the AEA method can be used to estimate SWC within a depth of 1/2 λ to λ (wavelength).
- (3)
- The AEA method based on ETS was used to estimate the SWC for two different heterogeneous farmland soils. The estimated results were compared with the TDR-measured water content, and the difference in water content was within 3%. The estimated results were compared the water content values obtained by the thermo-gravimetric method, and the difference in water content was within 3%. Although heterogeneity can increase the error value in estimating SWC using the AEA method, this error is acceptable. Therefore, the AEA method can be used for soils with moderate heterogeneity.
Author Contributions
Conceptualization, Q.L., K.L., Z.Z., S.L., R.L. and L.X.; methodology, Q.L. and K.L.; validation, Q.L., K.L., Z.Z. and S.L.; writing—original draft preparation, Q.L. and K.L.; writing—review and editing, Z.Z., S.L., R.L., L.X., S.G. and Z.L. All authors have read and agreed to the published version of the manuscript.
Funding
This work was funded by the Natural Science Foundation of China (grant number 42274190), the Technology Innovation Center for Land Engineering and Human Settlements, Shaanxi Land Engineering Construction Group Co., Ltd., and Xi’an Jiaotong University (grant number 2021WHZ0080).
Data Availability Statement
Not applicable.
Acknowledgments
The authors would like to thank the editors and reviewers for their valuable comments and suggestions. In addition, the authors also want to thank the individuals who participated in the GPR data measurement.
Conflicts of Interest
The authors declare no conflict of interest.
References
- Vereecken, H.; Huisman, J.; Bogena, H.; Vanderborght, J.; Vrugt, J.; Hopmans, J. On the value of soil moisture measurements in vadose zone hydrology: A review. Water Resour. Res. 2008, 44, 4. [Google Scholar] [CrossRef]
- Robinson, D.A.; Campbell, C.S.; Hopmans, J.W.; Hornbuckle, B.K.; Jones, S.B.; Knight, R.; Ogden, F.; Selker, J.; Wendroth, O. Soil moisture measurement for ecological and hydrological watershed-scale observatories: A review. Vadose Zone J. 2008, 7, 358–389. [Google Scholar] [CrossRef]
- SU, S.L.; Singh, D.N.; Baghini, M.S. A critical review of soil moisture measurement. Measurement 2014, 54, 92–105. [Google Scholar] [CrossRef]
- Peng, J.; Loew, A.; Merlin, O.; Verhoest, N.E. A review of spatial downscaling of satellite remotely sensed soil moisture. Rev. Geophys. 2017, 55, 341–366. [Google Scholar] [CrossRef]
- Wang, L.; Qu, J.J. Satellite remote sensing applications for surface soil moisture monitoring: A review. Front. Earth Sci. China 2009, 3, 237–247. [Google Scholar] [CrossRef]
- Huisman, J.A.; Hubbard, S.S.; Redman, J.D.; Annan, A.P. Measuring soil water content with ground penetrating radar: A review. Vadose Zone J. 2003, 2, 476–491. [Google Scholar] [CrossRef]
- Weihermüller, L.; Huisman, J.; Lambot, S.; Herbst, M.; Vereecken, H. Mapping the spatial variation of soil water content at the field scale with different ground penetrating radar techniques. J. Hydrol. 2007, 340, 205–216. [Google Scholar] [CrossRef]
- Bian, Z.; Lei, S.; Inyang, H.I.; Chang, L.; Zhang, R.; Zhou, C.; He, X. Integrated method of RS and GPR for monitoring the changes in the soil moisture and groundwater environment due to underground coal mining. Environ. Geol. 2009, 57, 131–142. [Google Scholar] [CrossRef]
- Weiler, K.W.; Steenhuis, T.S.; Boll, J.; Kung, K.J.S. Comparison of Ground Penetrating Radar and Time-Domain Reflectometry as Soil Water Sensors. Soil Sci. Soc. Am. J. 1998, 62, 1237–1239. [Google Scholar] [CrossRef]
- Turesson, A. Water content and porosity estimated from ground-penetrating radar and resistivity. J. Appl. Geophys. 2006, 58, 99–111. [Google Scholar] [CrossRef]
- Huisman, J.; Sperl, C.; Bouten, W.; Verstraten, J. Soil water content measurements at different scales: Accuracy of time domain reflectometry and ground-penetrating radar. J. Hydrol. 2001, 245, 48–58. [Google Scholar] [CrossRef]
- Grote, K.; Hubbard, S.; Rubin, Y. Field-scale estimation of volumetric water content using ground-penetrating radar ground wave techniques. Water Resour. Res. 2003, 39. [Google Scholar] [CrossRef]
- Serbin, G.; Or, D. Near-surface soil water content measurements using horn antenna radar: Methodology and overview. Vadose Zone J. 2003, 2, 500–510. [Google Scholar] [CrossRef]
- Pettinelli, E.; Vannaroni, G.; Di Pasquo, B.; Mattei, E.; Di Matteo, A.; De Santis, A.; Annan, P.A. Correlation between near-surface electromagnetic soil parameters and early-time GPR signals: An experimental study. Geophysics 2007, 72, A25–A28. [Google Scholar] [CrossRef]
- Di Matteo, A.; Pettinelli, E.; Slob, E. Early-time GPR signal attributes to estimate soil dielectric permittivity: A theoretical study. IEEE Trans. Geosci. Remote Sens. 2013, 51, 1643–1654. [Google Scholar] [CrossRef]
- Ferrara, C.; Barone, P.; Steelman, C.; Pettinelli, E.; Endres, A. Monitoring shallow soil water content under natural field conditions using the early-time GPR signal technique. Vadose Zone J. 2013, 12, 1–9. [Google Scholar] [CrossRef]
- Pettinelli, E.; Di Matteo, A.; Beaubien, S.E.; Mattei, E.; Lauro, S.E.; Galli, A.; Vannaroni, G. A controlled experiment to investigate the correlation between early-time signal attributes of ground-coupled radar and soil dielectric properties. J. Appl. Geophys. 2014, 101, 68–76. [Google Scholar] [CrossRef]
- Algeo, J.; Van Dam, R.L.; Slater, L. Early-Time GPR: A method to monitor spatial variations in soil water content during irrigation in clay soils. Vadose Zone J. 2016, 15, 1–9. [Google Scholar] [CrossRef]
- Comite, D.; Galli, A.; Lauro, S.E.; Mattei, E.; Pettinelli, E. Analysis of GPR early-time signal features for the evaluation of soil permittivity through numerical and experimental surveys. IEEE J. Sel. Top. Appl. Earth Obs. Remote Sens. 2015, 9, 178–187. [Google Scholar] [CrossRef]
- Takahashi, K.; Igel, J.; Preetz, H.; Sato, M. Sensitivity analysis of soil heterogeneity for ground-penetrating radar measurements by means of a simple modeling. Radio Sci. 2015, 50, 79–86. [Google Scholar] [CrossRef]
- Deutsch, C.V.; Wang, L. Hierarchical object-based stochastic modeling of fluvial reservoirs. Math. Geol. 1996, 28, 857–880. [Google Scholar] [CrossRef]
- Ikelle, L.; Yung, S.; Daube, F. 2-D random media with ellipsoidal autocorrelation functions. Geophysics 1993, 58, 1359–1372. [Google Scholar] [CrossRef]
- Zhu, P.; Fung, A.; Wong, K. Effective propagation constants in dense random media under effective medium approximation. Radio Sci. 1987, 22, 234–250. [Google Scholar] [CrossRef]
- Jiang, Z.; Zeng, Z.; Li, J.; Liu, F.; Li, W. Simulation and analysis of GPR signal based on stochastic media model with an ellipsoidal autocorrelation function. J. Appl. Geophys. 2013, 99, 91–97. [Google Scholar] [CrossRef]
- Zhang, L.; Xu, Y.; Zeng, Z.; Li, J.; Zhang, D. Simulation of Martian near-surface structure and imaging of future GPR data from Mars. IEEE Trans. Geosci. Remote Sens. 2021, 60, 1–12. [Google Scholar] [CrossRef]
- Topp, G.C.; Davis, J.; Annan, A.P. Electromagnetic determination of soil water content: Measurements in coaxial transmission lines. Water Resour. Res. 1980, 16, 574–582. [Google Scholar] [CrossRef]
- Noborio, K.; McInnes, K.; Heilman, J. Field measurements of soil electrical conductivity and water content by time-domain reflectometry. Comput. Electron. Agric. 1994, 11, 131–142. [Google Scholar] [CrossRef]
- Rhoades, J.; Raats, P.; Prather, R. Effects of liquid-phase electrical conductivity, water content, and surface conductivity on bulk soil electrical conductivity. Soil Sci. Soc. Am. J. 1976, 40, 651–655. [Google Scholar] [CrossRef]
- Deutsch, C.V.; Journel, A.G. Geostatistical Software Library and User’s Guide; Oxford University Press: Oxford, UK, 1992; Volume 8. [Google Scholar]
- Rea, J.; Knight, R. Geostatistical analysis of ground-penetrating radar data: A means of describing spatial variation in the subsurface. Water Resour. Res. 1998, 34, 329–339. [Google Scholar] [CrossRef]
- McBratney, A.; Webster, R. Choosing functions for semi-variograms of soil properties and fitting them to sampling estimates. J. Soil Sci. 1986, 37, 617–639. [Google Scholar] [CrossRef]
- Goovaerts, P. Geostatistics for Natural Resources Evaluation; Oxford University Press: Oxford, UK, 1997. [Google Scholar]
- Irving, J.; Knight, R. Numerical modeling of ground-penetrating radar in 2-D using MATLAB. Comput. Geosci. 2006, 32, 1247–1258. [Google Scholar] [CrossRef]
- Zhou, H.; Li, B.; Lu, Y. Micromorphological analysis of soil structure under no tillage management in the black soil zone of Northeast China. J. Mt. Sci. 2009, 6, 173–180. [Google Scholar] [CrossRef]
Disclaimer/Publisher’s Note: The statements, opinions and data contained in all publications are solely those of the individual author(s) and contributor(s) and not of MDPI and/or the editor(s). MDPI and/or the editor(s) disclaim responsibility for any injury to people or property resulting from any ideas, methods, instructions or products referred to in the content. |
© 2023 by the authors. Licensee MDPI, Basel, Switzerland. This article is an open access article distributed under the terms and conditions of the Creative Commons Attribution (CC BY) license (https://creativecommons.org/licenses/by/4.0/).