1. Introduction
This study evaluates the viability of NASA’s Black Marble VIIRS/NPP Gap-Filled Lunar BRDF-Adjusted Nighttime Lights Daily L3 Global 500 m Linear Lat Lon Grid (VNP46A2) nighttime lights product (NTL) at varying periods (days, weeks, months, and years) to improve population (Pop) studies and modeling, as well as disaster mitigation and adaptation planning, which often inform decision- and policy-making processes. We compared NTL to Pop datasets available in a set of case studies with varying observation periods and spatial scales to evaluate how well NTL data capture shifts in populations caused by a variety of factors. The findings of our study affirm that remote sensing of NTL serves as an indicator of human activity, which is useful in various applications including urban development research, disaster and conflict monitoring, and detecting power outages indicating disruption of electrical services. NTL demonstrated the ability to capture urban expansion that correlated with in-migration, but our study highlights that the signals of out-migration and displacement are more complex and may require additional ancillary data to measure.
Human migration has increased over the first two decades of the 21st century, in both scope and complexity, with significant social, economic, and political implications across the world [
1,
2,
3,
4,
5,
6,
7,
8,
9,
10]. The International Organization for Migration (IOM)’s World Migration Report 2020 estimated a total of 272 million international migrants in 2020, an 81% increase from 150 million in 2000 [
3]. Global migrations and demographic changes tend to be primarily driven by economic disparities, social and cultural factors, and environmental change [
7,
9,
10]. Studies by McLeman (2011) estimate that future worst-case scenarios of environmental and climate change could create 200 million to one billion “distress migrants” worldwide by the midcentury [
4,
7,
11,
12].
Most migration actually occurs within national boundaries [
13]. The United Nations (UN) estimated 740 million internal migrants in 2009 [
3]. Some migratory events occur at smaller spatial or temporal scales and are latently observed; alternatively, these events can even become invisible to censuses or other estimates, e.g., internal displacement caused by conflict, violence, and disasters [
1], the under-investigated migration patterns of women refugees fleeing armed conflicts [
14], irregular migratory flows including human trafficking and smuggling [
15], and the undocumented migration of women who partake in unreported seasonal and household work and who often experience employment discrimination without recourse [
16,
17]. These types of migration events can expose migrants to many forms of exploitation and abuse, which may lead to violations of civil and human rights [
1,
15,
16,
17].
The 2030 Sustainable Development Agenda (2030 Agenda) of the UN Sustainable Development Group (UNSDG) holds as a cornerstone the principle of “leaving no one behind” [
18]. It requires that all people are counted and accounted for in the place they live. The 2030 Agenda recognized the importance of migration for sustainable development within the Sustainable Development Goals (SDGs). SDG 10.7 makes explicit the need for “orderly, safe, regular, and responsible migration and displacement of people, including through the implementation of planned and well-managed migration policies” [
19]. Migration, in the form of “managed retreat”, can be a critical aspect of sustainable development when used as a response to climate variability and environmental change, and it is widely regarded as having potential benefits for economic and social development [
20,
21,
22]. It is clear that more reliable, disaggregated, and frequent Pop data are needed to make evidence-based policies and decisions at the right times. For example, humanitarian actors need data on the locations and numbers of displaced people. Such datasets should be reproducible and should provide information in a timely manner in order to be operationalized at the international, intranational, and local levels.
Recent studies have used NTL to understand temporal shifts in population related to human displacement. In the domain of public health, Bharti et al. (2011) used Defense Meteorological Satellite Program Operational Linescan System (DMSP OLS) imagery to understand seasonal movements of population in Niger that are associated with measles outbreaks, and Stokes and Roman (2022) compared daily Visible/Infrared Imaging Radiometer Suite (VIIRS) Day/Night Band (DNB) Black Marble records with Google mobile phone data during COVID-19-related lockdowns to understand levels of adherence to restrictions in the Middle East [
23,
24]. There have also been applications related to disaster displacement, as detailed in the Oaxaca case study in
Section 3.2. For example, Enenkel et al. (2019) used the spatial extent of power outages as detected by VIIRS DNB imagery as a proxy for disaster impacts and a potential driver for displacement related to Cyclone Idai (March 2019) in Beira, Mozambique. VIIRS DNB has also been used to estimate migration in Europe [
25] and summertime shifts in population in Russia [
26].
We leveraged Black Marble NTL data’s high spatiotemporal resolution to evaluate its fitness for evidence-based decision-making processes, particularly in modeling and monitoring of population and migration patterns, disaster management, or monitoring SDG progress. To contribute to the nascent literature addressing the applicability of nighttime lights for characterizing population displacement, we applied NTL to three study areas in a variety of contexts in order to assess their utility for estimating changes in population. We compared daily observations in NTL against the United Nations High Commissioner for Refugees (UNHCR) population counts of the Za’atari Refugee Camp, located in Jordan. In the state of Oaxaca, Mexico we performed two evaluations: (1) we compared weekly changes in NTL against geolocated mobile phone data before and after an earthquake (EQ); (2) we compared semi-decadal changes in NTL against the 2010 census and 2015 Pop estimates. Lastly, we compared monthly NTL averages in Qatar against the Qatar Planning and Statistics Authority’s (PSA) monthly Pop counts to evaluate the usefulness of NTL for measuring seasonal fluctuations in Pop.
This paper is broken up into the following sections:
Section 2 covers materials, and
Section 3 covers the methods, results, and discussion for each of the three case studies;
Section 4 provides conclusions and recommendations for future work.
3. Methods and Results by Case Study
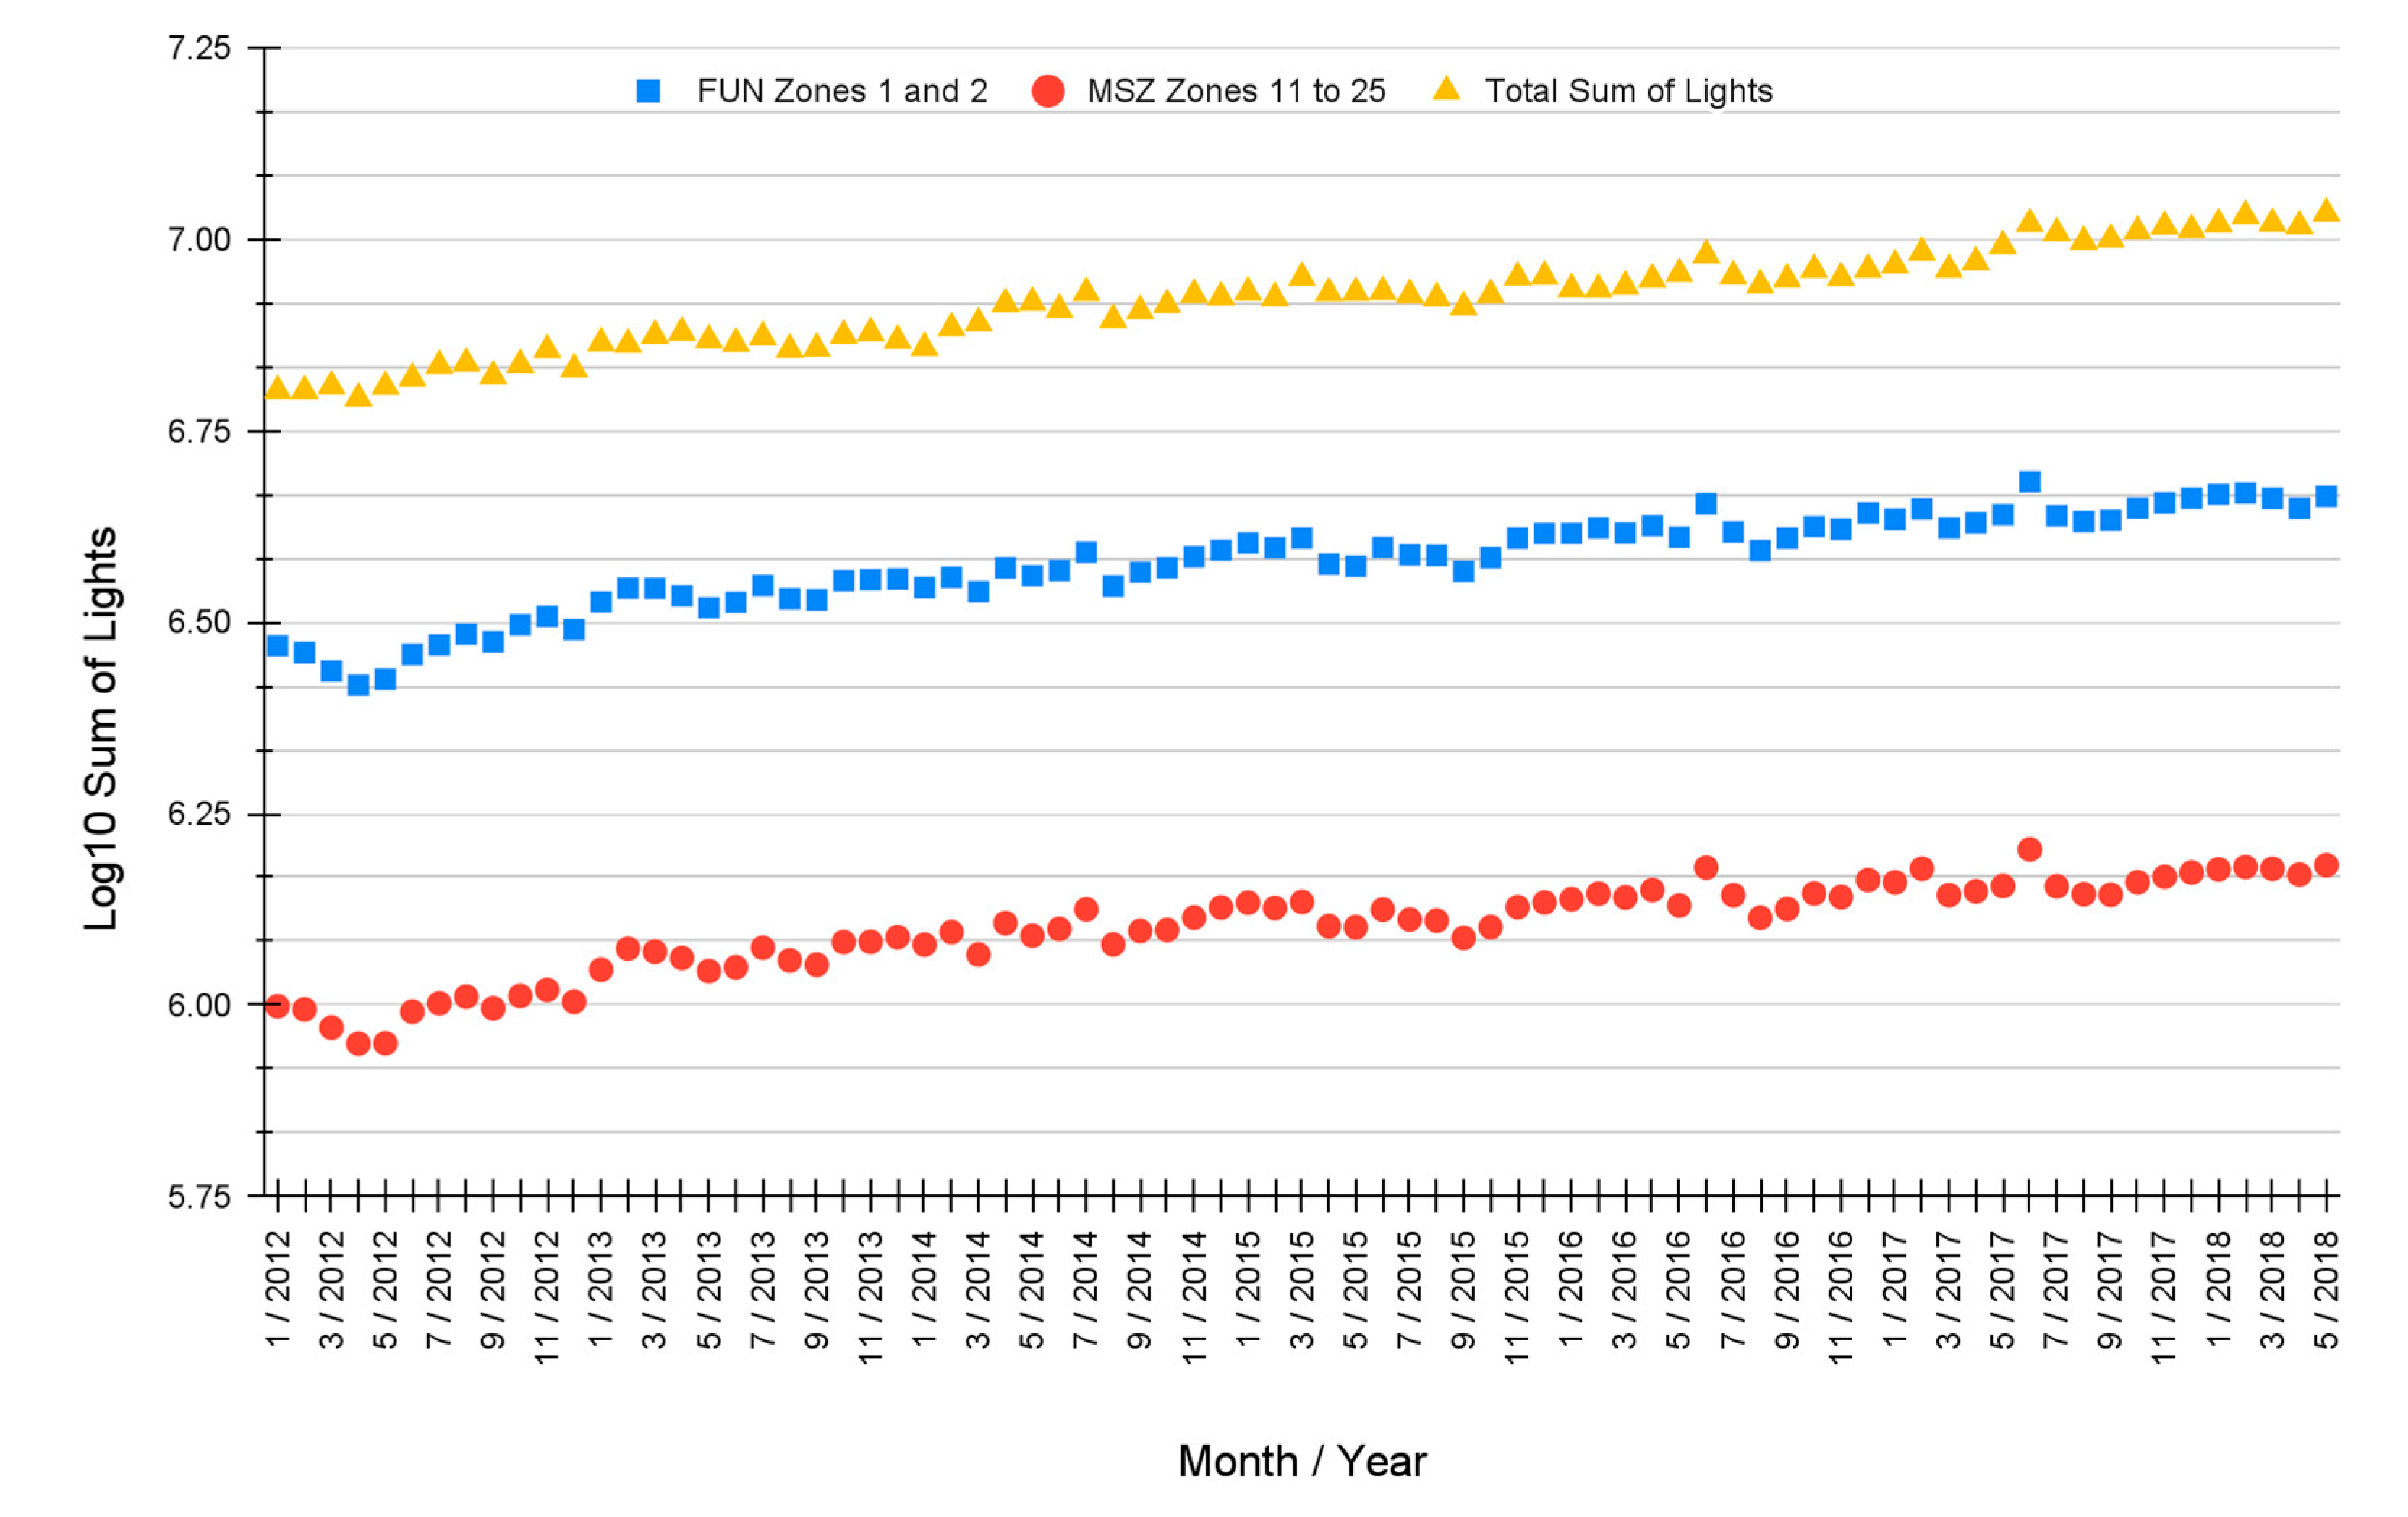
We integrated the NASA Black Marble NTL (which sometimes included temporal averaging of the NTL) to match the resolution of the Pop, mobile phone, and administrative geography data available specific to each case study (
Figure 1). The Sum of Lights (SoL) approach follows Ghosh et al. (2013), as a basis for summarizing NTL data for different geographies [
32]. It must be noted that, if SoL is used over a large area of nonurban pixels in Black Marble products, as performed in this study, the background NTL noise significantly influences the absolute magnitude of radiance recorded and could decrease the signal-to-noise ratios; thus, including non-built-up areas in SoL could reduce the quality of the data. Because we focused on the changes in light rather than the absolute values of NTL, the issue of background noise was less important for our studies, since the noise existed at all timepoints. In order to determine whether the SoL approach could have led us to erroneous results, we tested whether including non-built-up areas would influence our results and found that the relative change in luminosity was consistent whether non-built-up pixels were included in the analysis or not. We concluded that, for the data used in our study, the issue of background noise did not lead to erroneous results (
Appendix B). We used administrative geographic boundaries to isolate areas of interest and subset the NTL and Pop datasets that were ultimately compared according to their temporal change using the ratio change equation:
where
is the change in ratio,
is the initial value, and
is the final value. The SoL approach is applied as a spatial summary of the NTL values for corresponding geographies and not to aggregate NTL observations over time. Equation (1) is utilized in a case-specific manner for each case study as described below except in Za’atari because this case study focused on the daily changes inherent in the original data.
In Za’atari (
Figure 1, far left), we calculated the SoL using the UNHCR’s Za’atari boundaries and compared daily NTL changes against Za’atari Pop counts. In the Oaxaca Earthquake (EQ) case study (middle left), we calculated the mean NTL of 5 day periods for the pre- and post-EQ days selected; we then used the National Institute of Statistics and Geography (INEGI) urban localities geographic boundaries to find the SoL and the sum of mobile phone location points for pre- and post-EQ, and compared changes of both sums for each locality. In the Oaxaca migration case study (middle right), we found the annual mean NTL for 2012 and 2015 by averaging daily observations, used the INEGI municipality boundaries to find the SoL of each year, and then compared changes between the 2 years in NTL against changes in Pop for each municipality. In Qatar (far right), we calculated the monthly NTL average using daily observations, used Qatar’s administrative boundaries to calculate the country’s monthly mean SoL, and then compared the monthly changes in NTL to monthly Pop counts for the country.
3.1. The Za’atari Refugee Camp and UNHCR Daily Population Counts
3.1.1. Za’atari Introduction
The total number of international refugees grew 85% in the last two decades from 14 million refugees in 2000 to 25.9 million refugees in 2020 [
3]. The increase in the international refugee Pop is attributed to growing conflicts at regional and country levels. Between 2013 and 2020, the greatest number of annual global refugees came from the Syrian Arab Republic due to the Syrian Civil War, which began in 2011 [
33]. A significant increase in Jordan’s refugee Pop occurred in 2012, giving Jordan the highest number of refugees in the world in 2015 with over 2.8 million refugees, of which 92% were Syrian in origin [
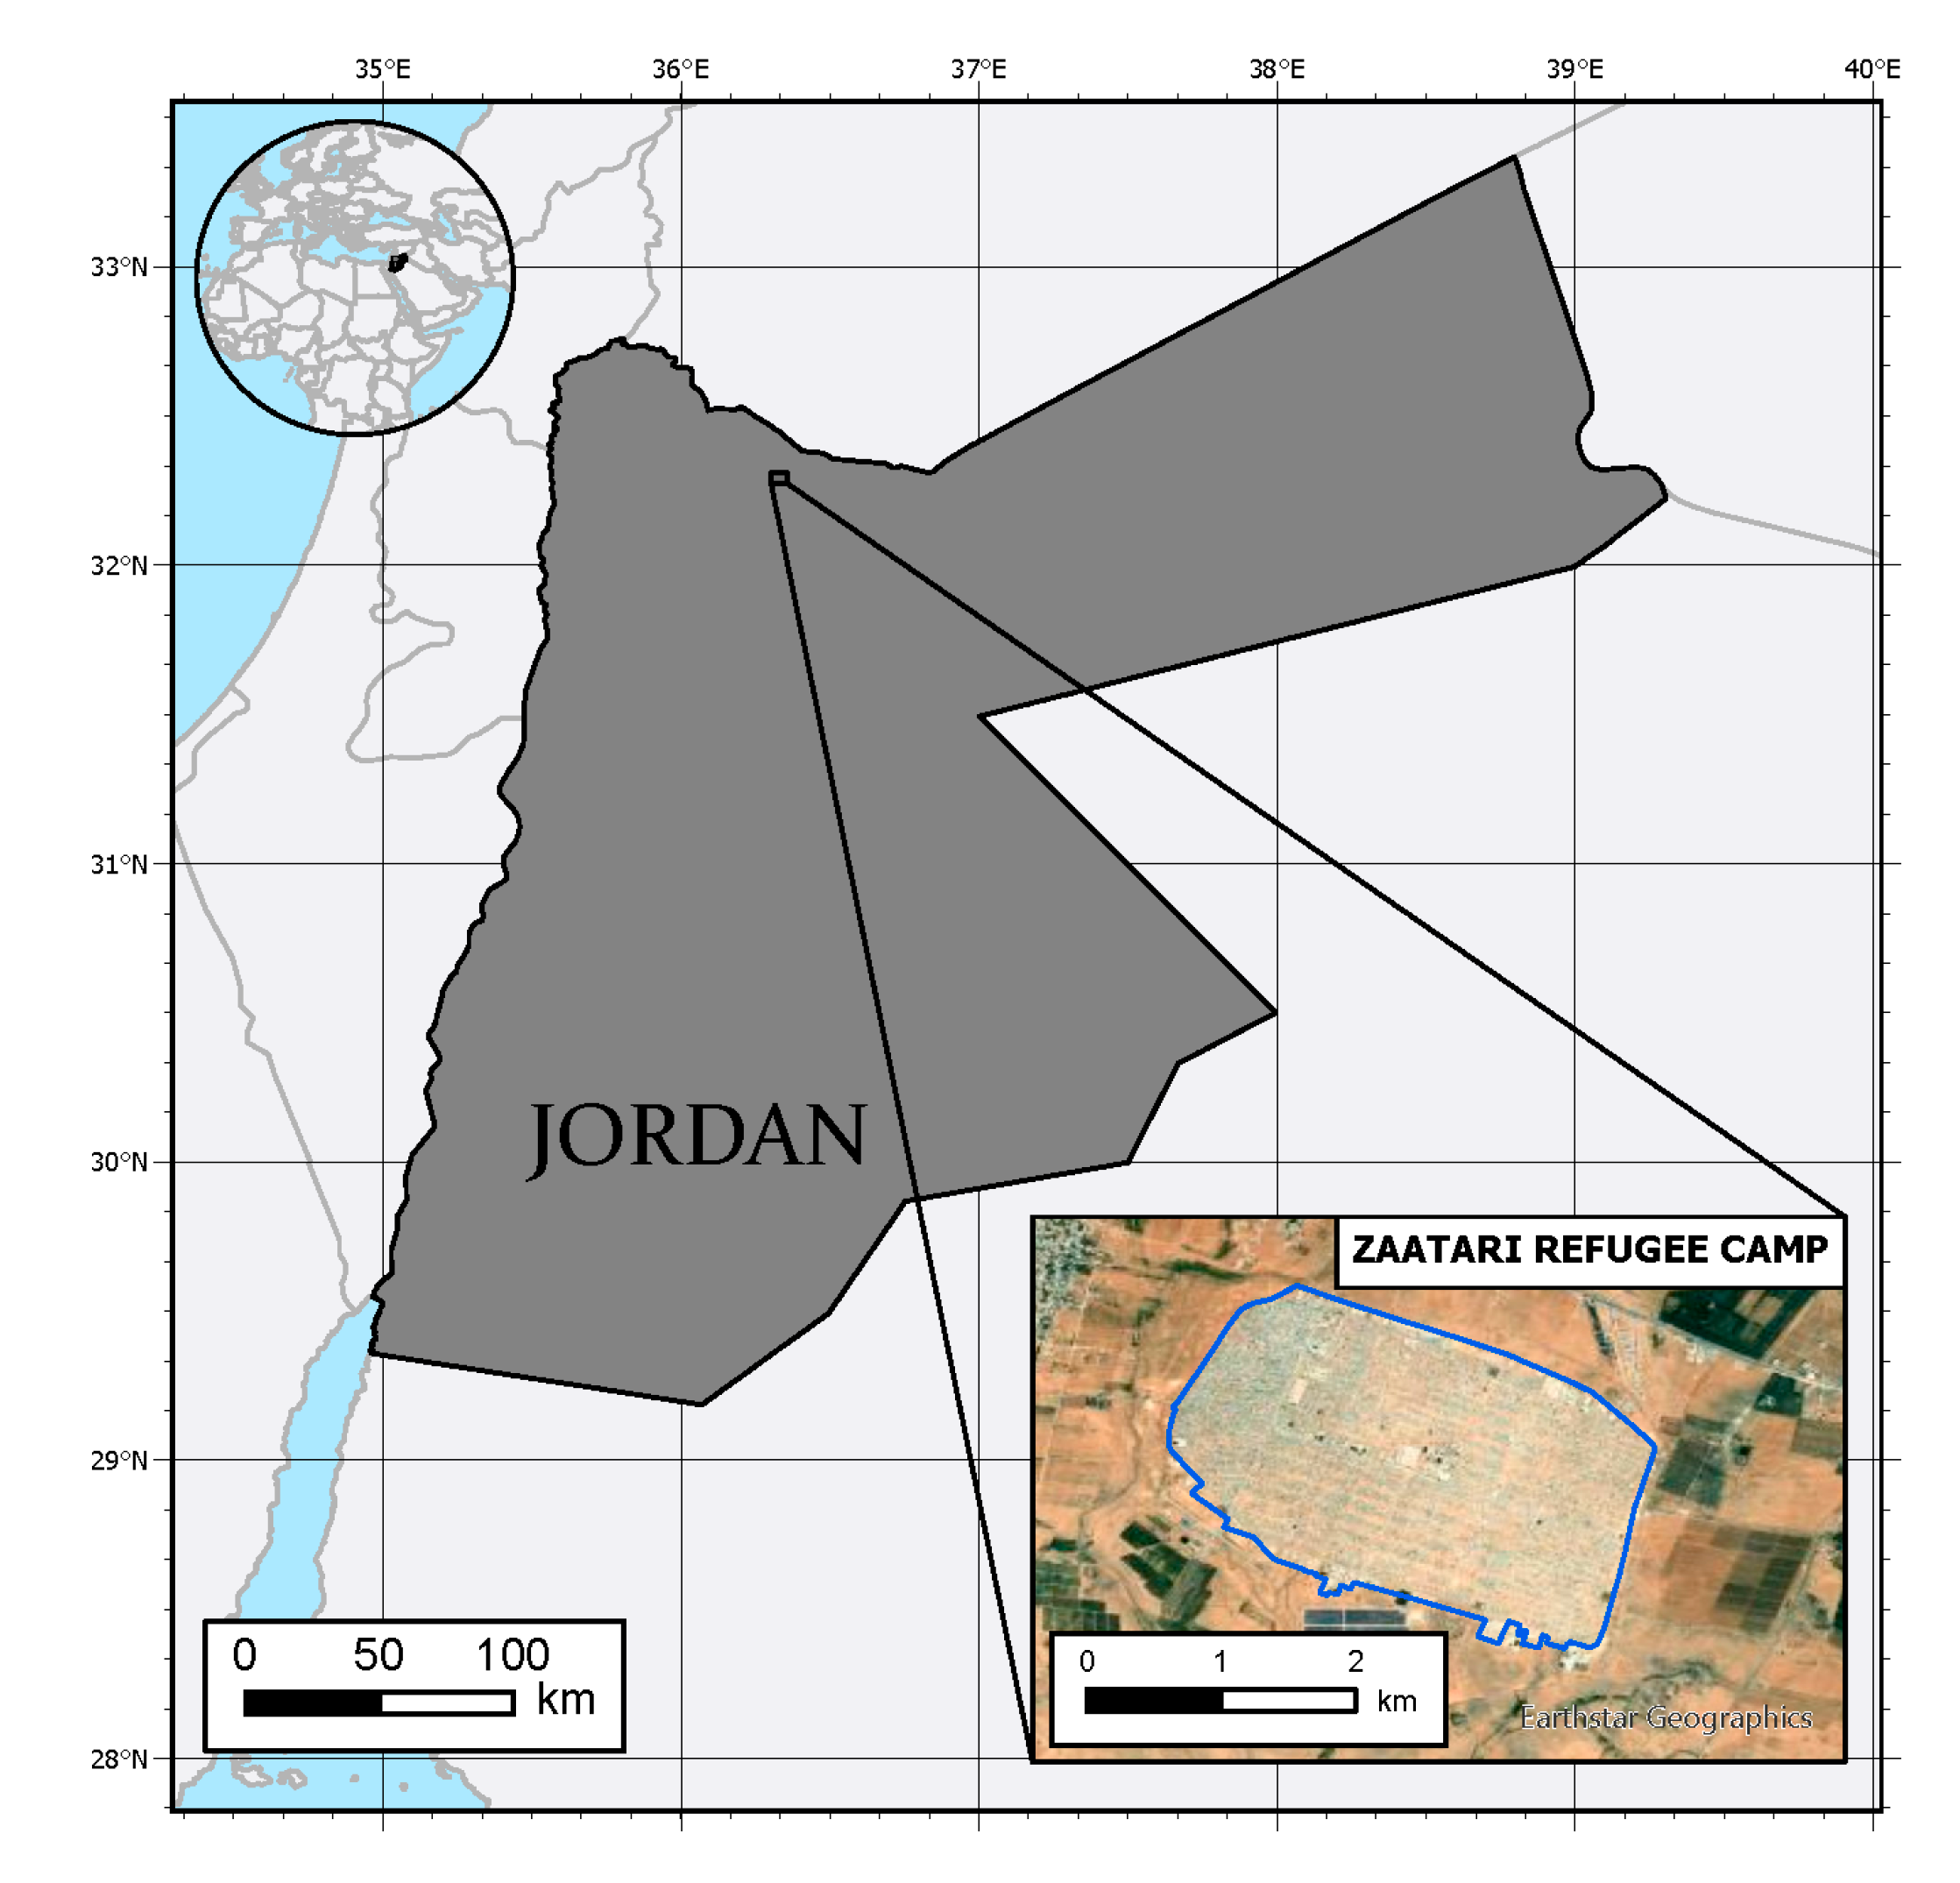
34,
35]. The influx of refugees prompted the Jordanian government and UNHCR to construct numerous refugee camps in Jordan, including the Za’atari Refugee Camp, a 5.34 km
2 camp constructed in 9 days and opened on 28 July 2012 in the Mafraq Governorate, northern Jordan, near the Syrian border (
Figure 2) [
36,
37,
38]. The sudden development of Za’atari was captured by NTL in previous research showing how it became one of the largest cities in Jordan [
29]. UNHCR administers refugee camps in conjunction with the Syrian Refugee Affairs Directorate, and manages Za’atari along other UN agencies, international and national NGOs, community-based organizations, refugees, and Jordanian host communities [
39].
3.1.2. Za’atari Materials and Methods
We compared daily NTL values against Za’atari Pop counts produced by UNHCR [
40]. Between 11 March 2013 and 15 March 2017, 279 Pop counts of the camp were recorded at inconsistent frequencies averaging 0.4—twice every 5 days—and decreased after March 2015 to an average frequency of 0.19—once every 5 or 6 days for the entire time period observed. The Za’atari geographic boundaries shapefile was produced by the United Nations Operational Satellite Applications Program (UNOSAP), dated 7 January 2014. The shapefile was extracted from the United Nations Office for the Coordination of Humanitarian Affairs (OCHA) Humanitarian Data Exchange [
41]. The Zonal Statistics tool in ArcGIS Pro was used to calculate the SoL of the NTL cells that were within or intersected the Za’atari camp boundaries for each day. To compare these values, a natural log (ln) transformation was applied because it reduces the impact of the high outlier values and enhances the variance in the low values [
42,
43]. Temporal changes in daily SoL and Pop counts were compared.
3.1.3. Za’atari Results
The results in the Za’atari Refugee Camp case study showed no discernible relationship between daily Pop counts and the NTL radiance values (
Figure 3). Available Pop counts of Za’atari showed a rapid increase of Pop in the early days after the camp’s opening from 156,557 on 11 March 2013 to its peak at nearly 202,993 refugees on 25 April 2013 [
40], thus becoming Jordan’s fourth-largest urban center in 2013 [
44,
45]. The Pop of Za’atari had a gradual reduction after April 2013 until it leveled off at 80,000 refugees in June 2014 until the time of this writing [
40]. Despite this, NTL continued to fluctuate sporadically through the entire temporal range observed, even after considering a 30 day moving average (30-d.m.a.). NTL’s range is more than an order of magnitude wide. The minimum was 337 nW·cm
−2·sr
−1 on 1 March 2017, and the maximum was 15,322 nW·cm
−2·sr
−1 on 19 September 2016. The NTL data showed peaks and troughs through the entire temporal range.
A review of the mandatory quality flags that accompanied the NTL data found that all of the pixels for all of the days observed were classified as having “good quality” observations. Thus, why do we see oscillation in NTL while Pop counts remain constant? News articles and UNHCR reports identified events on the ground, i.e., upgrades to the electrical system, that could have caused the de-electrification of the camp and resulted in the variation of NTL observed. Events identified are annotated in
Figure 3 [
46,
47,
48]. These sociopolitical events correspond to patterns seen in the NTL and are further discussed in the next section.
3.1.4. Za’atari Discussion
The results revealed no discernible relationship between Pop and NTL in the Za’atari case study. However, observed fluctuations in the NTL data may imply other causes. For more than half of the timeline observed, after spring of 2014, the Pop of Za’atari remained relatively stable, yet NTL varied significantly. NTL may have been influenced by several events at the camp. Protests and riots that resulted in damaged infrastructure occurred in September and October of 2013 and in April 2014, mainly over poor living conditions [
47,
48]. Upgrades by the UNHCR in 2015, due to safety concerns and increasing costs, caused the electrical system to be disconnected, reconstructed, and connected again in July 2016 [
39]. Electrical upgrades continued with the completion of a 12.9 MW solar plant in 2017 [
46]. Usually, planned developments such as Za’atari show increases in infrastructure and NTL, which often predate the increases in population. Once the infrastructure is built, it stays stable except in the cases where electricity is not reliable or in massive population decreases. Characteristics of the type of settlement being developed or the type of urbanization occurring—residential and nonresidential development, electrification, vertical growth, land cultivation, redevelopment, or informal development and their opposites—can influence how NTL changes, sometimes causing it to increase or decrease [
49].
Lighting at night is crucial to the safety and livelihoods of the refugees within the camp. In fact, UNHCR invests 20% of its electricity to provide lighting at night because it contributes positively to many dimensions of the wellbeing for refugees of all ages [
39]. NTL shows potential for remote monitoring of Za’atari and other refugee camps alike to provide evidence on the conditions of the camp infrastructure and the wellbeing (or lack thereof) of the refugees who live there. The evidence that NTL provides on the conditions on the ground could be beneficial to all stakeholders, from the government agencies and international organizations that manage refugee camps around the world, to NGOs and refugee advocacy groups that are investing resources, and to the refugees themselves who struggle daily for access to services, water, food, and shelter.
3.2. Oaxaca Earthquake (EQ)
3.2.1. Oaxaca EQ Introduction
Oaxaca is historically the state with the highest seismic activity within the Republic of Mexico, accounting for 25% of recorded EQs [
50]. On Friday, 16 February 2018 at 23:39:39 Coordinated Universal Time (UTC) (local time: 5:39 p.m., CST), a 7.2 magnitude EQ struck Mexico’s southern Pacific Coast at a depth of approximately 22.0 km, shaking buildings about 360 km away in Mexico City [
51]. While no reported deaths were directly attributed to the EQ, significant damage occurred in the nearby urban centers of Pinotepa Nacional, Río Grande, Jamiltepec, and San José del Progreso. A major road that connects Pinotepa Nacional, the nearest urban locality to the EQ, and Puerto Escondido, one of the most important tourist attractions on the southern Oaxacan coast, was reportedly cut off as a direct result of the EQ [
52].
As mentioned in
Section 1, Pop census and estimates are not able to provide information useful for the mitigation of natural events with the potential for disaster such as EQs because these events tend to happen in shorter temporal scales. Recent studies have shown that smart phones could be leveraged as mobile sensors with high spatiotemporal detail. Furthermore, 93% of the world’s Pop has access to a mobile broadband network. Today, there are around 5.9 billion unique mobile subscribers with eight billion mobile subscriptions, of which six billion are associated with smartphones [
53] (p. 5). This type of collective sensing has the potential to shed light on local short-term human–environment interactions, particularly when used as supplemental to other environmental and social data [
54]. The United Nations Development Program defines mobility as “a fundamental element of human freedom […] to seek opportunities to improve living standards, and health and education outcomes, and/or to live in safer, more responsive communities” [
55]. Moreover, mobility, in terms of computer information technology, is a structure that provides position and timing information sourced from cell phones. For the present study, we leveraged mobile phone check-in data that were obtained through a nondisclosure agreement. We analyzed the position of mobile phone devices recorded through Wi-Fi check-ins within Oaxaca’s urban localities (
Figure 4) and compared the changes against changes in SoL before and after the EQ.
3.2.2. Oaxaca EQ Materials
The time of the EQ and the coordinates of the hypocenter were provided by the United States Geological Survey (USGS) [
51]. The INEGI 2010 census from the Sistema para la Consulta de Información Censal 2010 (SCINCE, an online census information system) provided a geodatabase with a feature class that outlines what are described as “urban localities”, the administrative unit of urban centers that have 2500+ residents [
56]. Mobile phone location data covering the state of Oaxaca were collected at an hourly frequency for 14 days from midnight Sunday, 11 February 2018 to Saturday, 24 February 2018 23:00 (UTC). The data were provided as a multipoint feature, which included the fields “day of the month (DoM)” and the “hour of the day (HoD)”. Daily NTL data were collected for the same temporal range.
3.2.3. Oaxaca EQ Methods
We created a fishnet feature made up of grid cells with a unique ID named “gridcode” that mirrored the cell size and alignment of the NTL rasters and covered Oaxaca’s geography. Because the study’s timeframe fell within the time that Oaxaca observes CST (between 25 October through 5 April), the mobile phone location data’s timeframe was translated from UTC to CST (10 February 2018 18:00 CST to 24 February 2018 17:00 CST). Using the SearchCursor tool, we extracted the gridcode, DoM, and HoD for each data point from the multipoint features. Summary statistics provided each grid cell with a count of mobile phone Wi-Fi check-ins for each hour. The NTL data were joined to the fishnet using zonal statistics.
We took into consideration time-of-day and weekend/weekday characteristics of the data points because they tend to influence mobility patterns. Two 5 day frames within the available data, one pre-EQ and one post-EQ, were selected that included the same days of the week: Sunday, 11 February 2018 through Thursday, 15 February 2018 and Sunday, 18 February 2018 through Thursday, 22 February 2018, respectively. Hourly mobile phone counts that fell within these two timeframes were summed using the INEGI urban localities geographies. The NTL averages for each cell were calculated for pre- and post- EQ timeframes by summing the corresponding daily rasters and dividing by the number of days. We calculated the SoL for both timeframes for each urban locality. The urban localities with fewer than two mobile phone check-ins in either timeframe were removed; of 559 original urban localities, 135 remained.
Using Equation (1), the change, C, in NTL post-EQ was compared with C in mobile phone check-ins where the pre-EQ values for each urban locality were the initial values (x1) and the post-EQ values were the final values (x2). Oaxaca’s urban localities were classified using a bivariate symbology dependent on C of both mobile phone data and NTL, where C < −0.1 or C > 0.1 is considered significant; if the change was less than 0.1, then the result was classified insignificant. Additionally, the distances of each urban locality to the EQ hypocenter were calculated. The localities were classified according to their distance to the hypocenter in increments of 50 km.
Summary statistics for changes in mobile phone check-ins and NTL post-EQ in Oaxaca’s urban localities showing significant differences between the two variables (
Table 2). Most notably, the variance in
C of mobile phone check-ins was significantly wider than that of NTL, 5.4429 and 0.1039, respectively. NTL’s median (0.0441) and mean (0.0587) were relatively close to each other when compared to the mobile phone data median (0.1607) and mean (0.8985). This suggests that, while distribution of NTL
C is normal, the mobile phone data’s
C distribution is right-skewed. A Rosner outlier test performed with R detected that the mobile phone data had 12 outliers and NTL had one, confirming the skewness of the mobile phone data; as a result, ln transformation was applied by setting the minimum (negative) value to 0 and adding 1 [
42,
43].
3.2.4. Oaxaca EQ Results
The linear correlation between changes in mobile phone data and NTL for each urban locality because of the EQ was weak (
Figure 5b). However, just nine (6.7%) of 135 urban localities had insignificant changes in both mobile phone check-ins and NTL. Eighty (59.3%) localities showed a gain in mobile phone check-ins; 79 (58.5%) localities showed a gain in NTL. In short, mobile phone activity and NTL were higher after the EQ in the majority of urban localities, but localities with positive changes in one metric did not necessarily have a proportional change in the other.
Of 135 localities, 26 (19.3%) showed a significant positive
C (>0.1) in both metrics (
Figure 5b, top right); these localities tended to be near roads [
57] that link large urban centers, such as Oaxaca State’s capital, Oaxaca De Juárez (
Figure 5(a2)), and Puerto Escondido (
Figure 5(a3)). Fourteen (10.4%) localities had a significant negative
C (<−0.1) in mobility and a significant positive
C in NTL (
Figure 5b, top left), and they were randomly distributed throughout Oaxaca; one of them, San Juan Colorado, was the closest locality to the EQ hypocenter. Just 12 (8.9%) urban localities had significant negative
C in both metrics (
Figure 5b, bottom left); two were found to be <50 km away from the EQ hypocenter north of Santiago Pinotepa Nacional (
Figure 5(a1)), and two others were further north of the hypocenter; the remaining were found along roads around Oaxaca De Juarez (
Figure 5(a2)). Seventeen (12.6%) localities had a significant positive
C in mobile phone check-ins and a significant negative
C in NTL (
Figure 5b, bottom right), of which three localities were <50 km away from the EQ hypocenter to the south along roads that connect Santiago Pinotepa Nacional and Puerto Escondido.
Results of
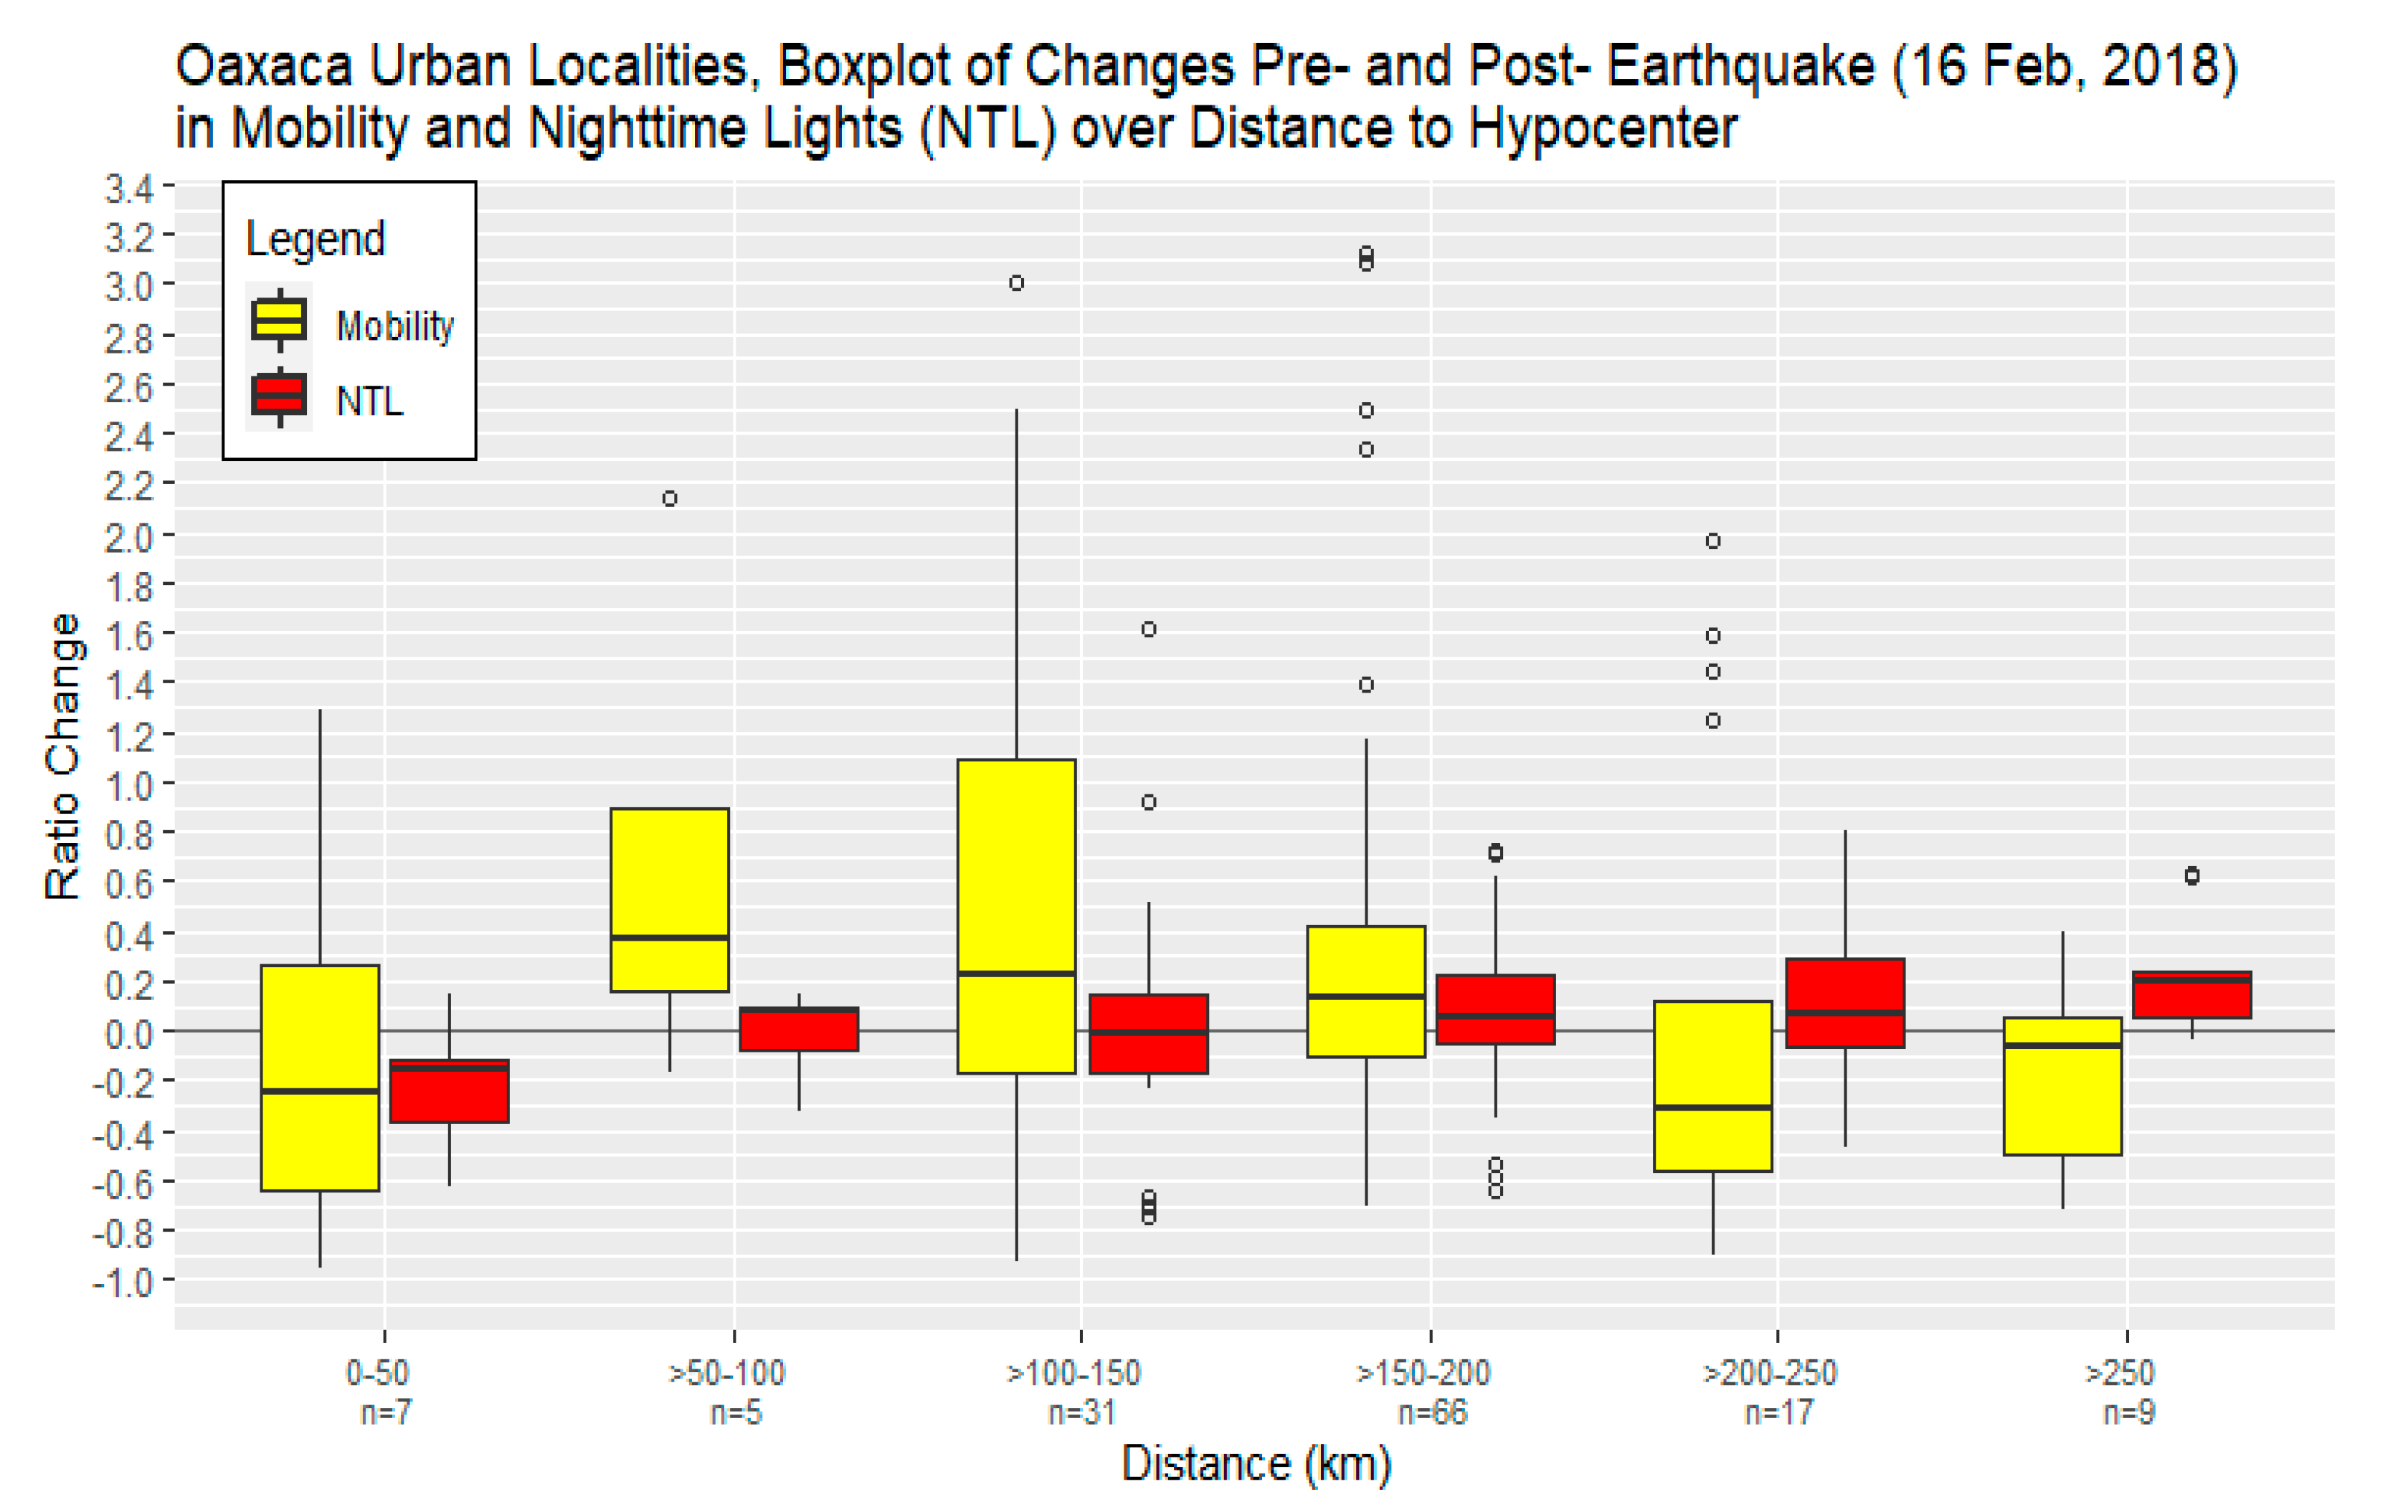
C for mobility and NTL in urban localities were classified into boxplots by 50 km increments according to the distance to the EQ hypocenter (
Figure 6). All of the localities that showed significant positive
C in both metrics were >50 km from the EQ hypocenter. The low variance in NTL is highlighted by the relatively small size of the IQRs, shaded red, when compared to the variance in the mobility IQRs, shaded yellow. The 0–50 km boxplots show that the majority of localities in this group had significant negative
C for both NTL and mobile phone check-ins. The 0–50 km mobile phone boxplot showed more variance in its IQR, which reached significant positive
C values, when compared to NTL. The remaining bins showed a similar trend. NTL boxplots >50 km had their medians at or near zero, which was considered insignificant, or at positive values. Mobile phone boxplots had wider variances as shown by the IQR ranges showing both positive and negative
C values.
3.2.5. Oaxaca EQ Discussion
The EQ of 16 February 2018 caused no direct deaths but caused structural damage in nearby areas of Oaxaca [
52]. Changes in NTL and mobile phone check-ins because the EQ did not have a direct correlation, but a spatial analysis showed that urban localities in Oaxaca with significant increases in NTL and mobile phone check-ins tended to be along roads connecting major urban centers. Most urban localities that were closest to the EQ hypocenter showed significant decreases in NTL and mobile phone check-ins, but varied widely in mobile phone check-in values. The localities due north of the EQ hypocenter showed significant increases in NTL and significant decreases in mobile phone check-ins. Urban localities due east of the EQ hypocenter showed moderate decreases in NTL but significant increases in mobile phone check-ins.
In the present study, NTL and mobile phone check-in datasets may have provided different context for the same event. NTL changes near the EQ could have informed infrastructure disruptions while mobile phone check-ins could have signaled a reaction to those disruptions, or to the EQ itself. The results showed that NTL appeared to be sensitive to disruptions due to the EQ, as shown by the significant decreases in NTL in urban localities near the EQ hypocenter. NTL also provided a consistent and reliable signal as shown by the small variance in the results. On the other hand, mobile phone check-ins showed an increased activity in urban localities that were located along roads cut off as a result of the EQ, but wide variance in the mobile phone check-in boxplots in
Figure 6 did not show a clear spatial signal sensitive to the EQ.
The use of NTL with mobile phone check-in data provided valuable insights into how conditions on the ground change as a result of environmental changes or natural disasters. While NTL may not have been a direct proxy of population fluctuations in this study, NTL’s temporal consistency and frequency can continue to provide data that may become critical for monitoring slower-moving natural and manmade disasters, such as the impacts of climate change.
3.3. Oaxaca Semi-Decadal Migration
3.3.1. Oaxaca Migration Introduction
In IOM’s 2019 World Migration Report, Mexico was the second-largest country of origin for international migrants after India and ahead of China, and it was by far the largest emigrating country in Latin America and the Caribbean during 2009–2019, with over 12 million Mexicans living abroad in 2019 [
3]. Mexico’s geolocation makes it an important migrant corridor for people wishing to emigrate from the Northern Triangle of Central America—Guatemala, El Salvador, and Honduras—and other Latin American and Caribbean countries into the United States. IOM identified three major migrant corridors that run north through Mexico, two of which traverse through the State of Oaxaca, located in the south of Mexico.
Oaxaca, like the majority of the country, is experiencing a demographic transition characterized by diminishing Pop growth rate from 1% between 2000 and 2010 to 0.9% between 2010–2015. Additionally, between 2000 and 2010, the intensity of emigration out of Oaxaca increased [
58]. Oaxaca’s government recognizes the challenges it faces in promoting a sustainable development agenda and meeting its SDGs due in part to the impacts that international politics can have on the uncertainty of migration patterns within and throughout Oaxaca, particularly with respect to the US migration policies [
59].
3.3.2. Oaxaca Migration Materials and Methods
The INEGI 2010 census from the Sistema para la Consulta de Información Censal 2010 (SCINCE, an online census information system) and 2015 Pop Estimates for Oaxaca were downloaded from the INEGI Archives; the Pop counts were provided for each municipality. Pop densities were calculated by dividing the total Pop by the spatial area (in km) of a given municipality.
Since VIIRS-based NTL data are not available for 2010, we used the earliest data available from 2012 as a proxy. For 2012, the annual NTL mean for each pixel were calculated using daily NTL rasters from 19 January 2012 to 31 December 2012; for 2015, the annual NTL mean for each pixel was calculated using daily NTL rasters from 1 January 2015 to 31 December 2015 (see
Appendix A for discussion of NTL aggregations). The SCINCE shapefile of Oaxaca was used to calculate the SoL using the NTL pixels that intersected each municipality. The NTL densities in each municipality for each year were calculated by dividing the SoL by the corresponding spatial area (in km
2). We used Equation (1) to calculate
C for Pop density and NTL density, where 2010 and 2012 are the initial years (
), respectively, and 2015 reflects the final values (
). We compared the changes in Pop density within each municipality between 2010 and 2015, as well as the matching changes in NTL density between 2012 and 2015. Changes in Pop and NTL were classified as significant if
C < −0.1 or
C > 0.1.
3.3.3. Oaxaca Migration Results
For the municipalities in Oaxaca, a weak linear relationship between changes in Pop and NTL during 2010–2015 and 2012–2015, respectively, was found. A hotspot analysis performed in ArcGIS Pro using the changes in the Oaxaca’s Pop counts between 2010 and 2015 revealed a coldspot to the west in the Mixteca region and a hotspot in the central Oaxaca valley where the capital is located (
Figure 7). Municipalities that showed significant positive
C in both Pop and NTL tended to be clustered west of Oaxaca de Juarez; they tended to have relatively moderate Pop densities (100–1000 people per km
2) and were next to a cluster of municipalities with relatively high Pop density (>1000 people per km
2) (
Figure 7a, inset 2). The majority of municipalities (59%) in Oaxaca simultaneously showed no significant change in Pop and NTL (
Figure 7, white). The Mixteca region showed mainly municipalities with significant negative change in Pop but they did not show similar significant decreases in NTL (
Figure 7a, inset 1); these municipalities tended to be in rural regions with relatively low Pop densities (<100 people per km). No municipality showed a significant negative change in NTL and a significant positive change in Pop. These patterns suggest that the Pop of Oaxaca transitioned toward becoming more urbanized and expanded the urban footprints of densely populated cities; simultaneously, Pop in rural areas decreased but the footprints of NTL remained.
Only the San Cristobal Amoltepec municipality, located in the Mixteca region, experienced significant negative
C in both Pop and NTL. Amoltepec had a population of 1283 and 1004 in 2010 and 2015, respectively, or a Pop
C of −0.217 (a loss of 279 people). The SoL in Amoltepec was 1045.21 and 648.30 nW·cm
−2·sr
−1 in 2012 and 2015, respectively, or an NTL
C of −0.380 (a loss of −396.91 nW·cm
−2·sr
−1). San Cristóbal Amoltepec is a rural urban center in the mountains of the Mixteca region at an altitude of 2200 m. Amoltepec has a relatively low population density (31.6 people per km
2) composed mainly of highly marginalized indigenous residents (in 2015, 77.6% spoke an indigenous language, predominantly Mixtec). More than one-quarter (27.9%) of the population experienced extreme poverty, and the majority of residents lacked access to critical infrastructure (93% of residents had no sewage system) [
58,
60].
3.3.4. Oaxaca Migration Discussion
The present study showed that municipalities which experienced growth in NTL and Pop tended to have moderate Pop densities and were adjacent to the urban centers with high Pop density. Additionally, a reduction in NTL did not necessarily correlate with a reduction in Pop. Just 28 municipalities showed a significant reduction in NTL when compared to 72 municipalities that had a significant reduction in Pop, which suggests that infrastructure, once it is in place, tends to remain there despite out-migration occurring in the same area. This is particularly true in rural areas, which tended to see decreases in Pop and stagnation of NTL.
While NTL may not have been strongly correlated to Pop counts over this period in Oaxaca, the use of these two datasets in tandem demonstrated underlying patterns of mobility and development that would have otherwise been hard to detect. Migration patterns in Oaxaca demonstrated a global trend of Pop moving from suburban areas into urban areas [
9,
13,
61] despite half of Oaxaca’s Pop living in rural regions within this timeframe. Analyzing migration with NTL revealed how and where the movement of Pop increased infrastructure development when people migrated to new areas, or through the stagnation of infrastructure development when people left.
3.4. Qatar’s Monthly Population
3.4.1. Qatar Introduction
Qatar is located in the Middle East and makes up part of the Arabian Peninsula. In the last three decades, Qatar saw unprecedented political and economic reforms that made its GDP per capita grow sevenfold from
$11,705.00 in 1990 to
$97,912.69 by 2007, measured in international dollars in 2011 prices, making it the country with the highest GDP per capita in the world. This growth was mainly attributed to its massive oil and gas reserves [
62,
63]. Between 2011 and 2014, Qatar’s economy continued to expand despite political instability in the region until a steep decline in oil prices at the end of 2014 caused a reversal in its economic growth such that the nominal GDP growth rate declined 20% in 2015 [
64]. Since the reforms took place, Qatar has had some success in transforming its economy away from dependence on hydrocarbon production; non-oil GDP now makes up over half the total.
Qatar’s sustainable development plan includes diversifying its economy, diminishing dependence on hydrocarbons, and developing a knowledge-based economy and private sectors [
64]. However, Qatar’s current economic growth model is driven primarily by a significant inflow of expatriate migrant labor, particularly labor for the expansion and modernization of the country’s infrastructure [
62,
64]. Qatar’s government recognizes that, without changing this economic growth model that relies primarily on migrant workers, Qatar “will not be able to move to an advanced development stage” [
64].
Qatar saw a near tripling of its migrant Pop from 2005 to 2015, and international migrants now make up 75% of Qatar’s total Pop, second in the world only to the UAE [
65], which, at the time of this writing, constituted approximately 95% of Qatar’s current workforce [
66]. The influx of migrant workers to Qatar was largely fueled by the construction boom in preparation for the 2022 World Cup hosted in Qatar. In 2020, Qatar had a migrant workforce of more than two million, of which approximately one million were employed by the construction sector [
67]. Other predominant sectors of migrant employment were the hospitality and domestic service sectors [
66,
67].
A large number of deaths of migrant workers due to heat stress spurred the reinforcement of Qatar’s summer work ban instituted in 2007 [
68,
69]. The summer work ban prohibits companies from allowing workers to work for more than 5 h in the morning or between 11:30 a.m. and 3:00 p.m., between 15 June and 31 August, as the midday heat of Qatar’s summer is dangerous and sometimes fatal to those exposed [
69]. With limitations on work availability during the summer months, migrant workers often leave Qatar during the summer and return in the fall season. Since migrant workers constituted three-fourths of Qatar’s Pop, seasonal fluctuations in Qatar’s migrant Pop had a notable effect on Qatar’s total Pop on a monthly basis.
3.4.2. Qatar Materials and Methods
Monthly Pop counts were collected from PSA’s monthly Pop figures. Monthly Pop counts were available from January 2012 to May 2018. Pop counts for August, September, October, November, and December of 2015 were missing from the PSA’s website; these missing months were acquired by contacting PSA via email at
[email protected].
Daily NTL data were collected for the same time period in raster format. We calculated the monthly mean radiance for each NTL raster cell using the available days for each respective month. The monthly SoL for Qatar were calculated by summing all of the monthly mean NTL cells that intersected Qatar’s geographic boundaries provided by the Gridded Population of the World v.4.11 (GPW) dataset [
70].
The Pop and NTL values were ln-transformed to reduce the influence of outliers; additionally, a constant of −1.3 was added to NTL in order to align the initial ln Pop and ln NTL values at the initial observation. We determined the month-to-month change for NTL and Pop using Equation (1), where the initial value (x1) was the previous month and the final value (x2) was the month measured. We classified the monthly values for both Pop and NTL by month of the year (MoY), January through December, to observe seasonal patterns, such as the summer work ban, and we created boxplots using the MoY classification scheme.
3.4.3. Qatar Results
A scatterplot between Qatar’s monthly Pop and SoL showed a strong positive correlation (
Figure 8). The linear model had a slope of 0.929 with an R
2 of 0.87. Qatar’s Pop increased an average of 11,246 people per month, or a monthly average growth rate (MAGR) of 0.64%; Qatar’s NTL monthly SoL increased at an average of 52,805 nW·cm
−2·sr
−1 or 4.703 nW·cm
−2·sr
−1 per square kilometer per month, or an MAGR of 0.75%. The plot also revealed a year-to-year increase in both Pop and NTL, revealing the months of 2012 with the lowest values through 2018 with the highest.
Growth remained consistent between 2012 and 2017 for both Pop and NTL, despite seasonal fluctuations, but Pop showed a slowing growth and diversion from NTL within the later months of 2017 and into 2018. NTL remained more consistent throughout. In the years before 2017, the Pop grew after the summer migrations, typically August and September, which tended to be the months where the Pop counts returned to that year’s spring levels; however, Qatar saw a drastic reduction during the summer of 2017. On the other hand, NTL experienced similar seasonal fluctuations between 2012 and 2016 with increases in the winter and spring months and a reduction in the summer months; however, unlike Pop, NTL showed consistent growth in the early months of 2017 and relatively little reduction during the summer months. NTL growth in 2018 remained consistent with previous years.
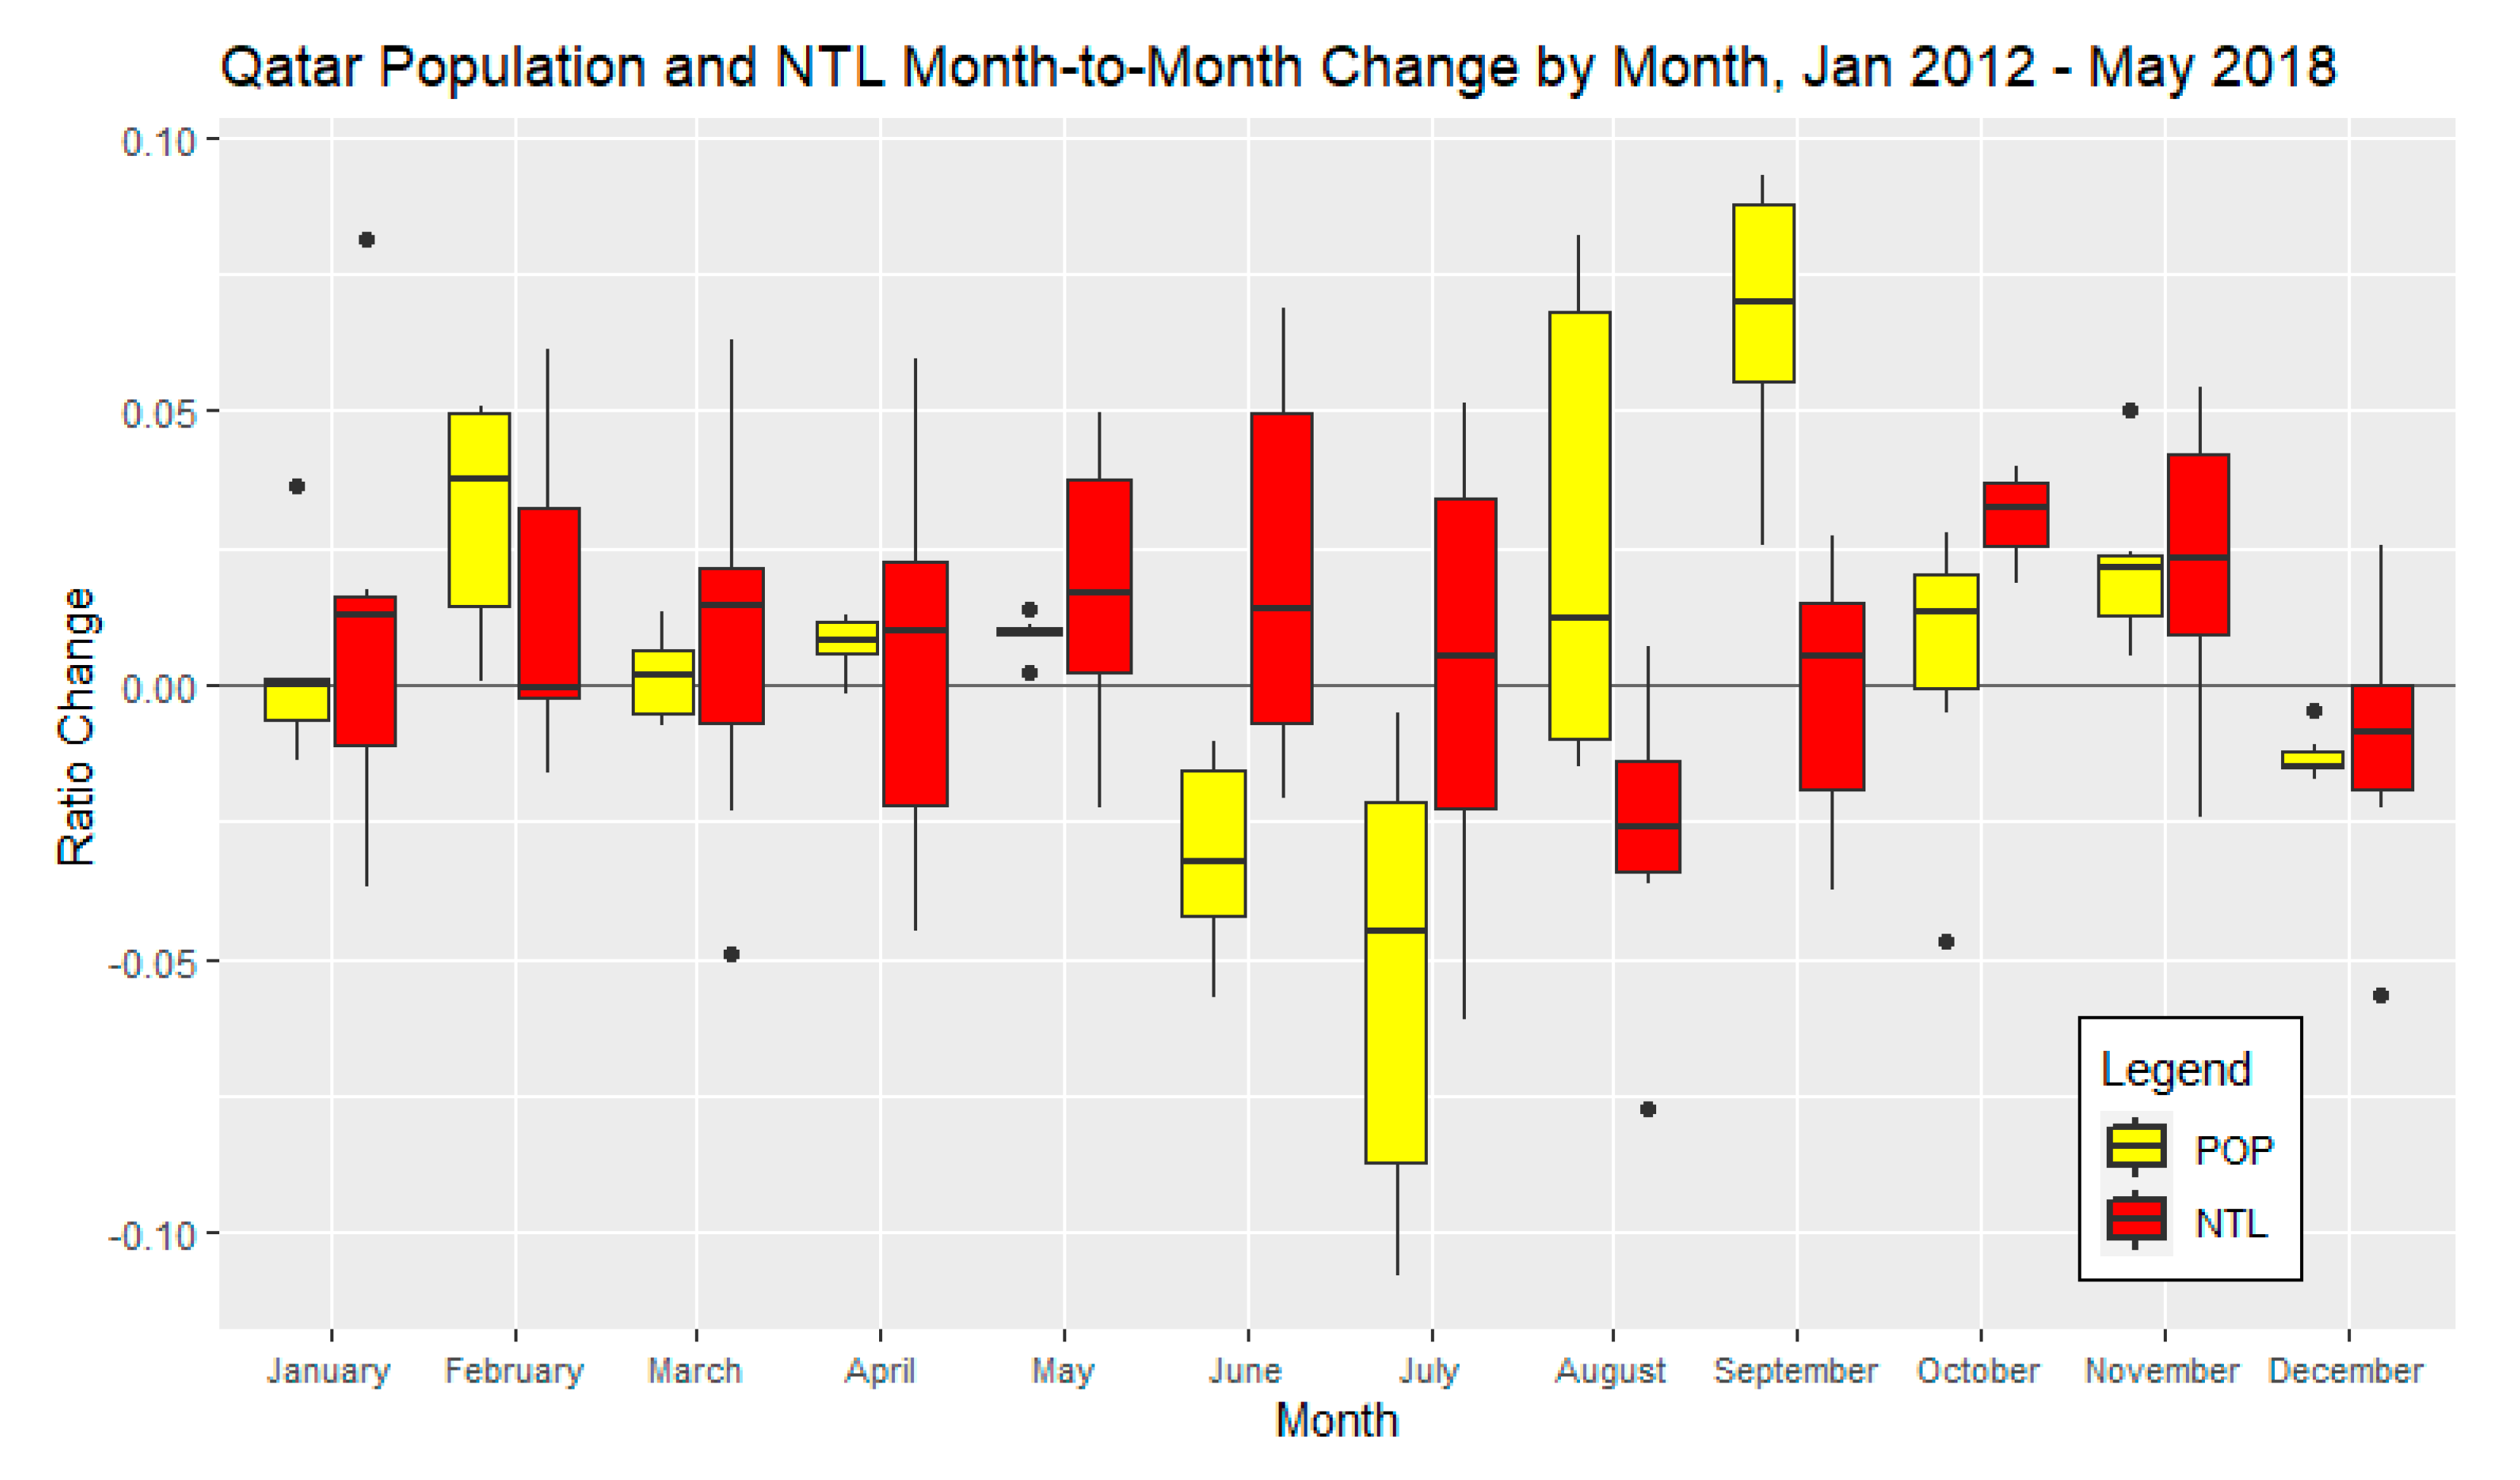
Seasonal patterns in both Pop and NTL are consistent with known seasonal migratory patterns, particularly with regard to migrant workers in Qatar and the summer work ban. We compared month-to-month changes by grouping values into boxplots according to the MoY (
Figure 9). For most months, boxplots for both Pop and NTL showed positive median values. For Pop, September exhibited the highest positive
C of all the months with its IQR above a 0.05
C; the June, July, and December IQRs were all negative, with July having the lowest median and its lower whisker going below −0.10
C. NTL followed a similar seasonal pattern as Pop, but NTL showed that the variance in NTL
C was more subtle, staying between −0.10 and 0.10
C. All of the NTL IQRs stayed between −0.05 and −0.05
C. Moreover, NTL’s peaks and troughs in the results appeared to be delayed by 1 month when compared to Pop counts. For example, the lowest boxplot median for Pop was July, while the lowest boxplot median for NTL was August. Similarly, the highest boxplot medians for Pop and NTL were September and October, respectively.
The correlation between changes in Pop and NTL appeared to be strong in Qatar; however, changes in NTL at the pixel-level resolution showed that the highest increases in NTL values in Qatar were attributed to economic activity rather than as a signal of where the Pop were settling (
Figure 10). For example, pixels that saw a fivefold increase or greater in NTL tended to be attributed to newly constructed roads, stadiums, emerging tourist towns, and industrial development (
Figure 10b). Additionally, NTL pixels in Qatar that saw a reduction by more than half tended to be in areas known to produce hydrocarbons.
Qatar’s PSA 2010 and 2015 censuses provide Pop counts for what they term “zone” levels, the highest-resolution administrative level publicly available [
71]. Qatar’s Pop overall grew consistently but the zones in which the proportion of Pop grew significantly were not consistent with the areas shown to have increased in NTL. For example, significant NTL decreases in Dukhan were attributed to areas of hydrocarbon production, while an NTL increase in the region is attributed to a new camel racetrack (
Figure 10(b1)). Dukhan’s Pop, however, showed a moderate increase when compared to other zones. Just west of Doha in Al Rayyan, significant increases in NTL could be attributed to a new stadium for the 2022 World Cup and roads that link towns and stadiums throughout the country. Doha’s residential zones also saw increases in Pop, but the NTL in those areas did not show significant positive
C in NTL, unlike the zones in the outskirts of Doha where new development of highways and stadiums occurred (
Figure 10(b2)). To the south of Doha, Al Wukair is an area that experienced both Pop and NTL growth. Although Al Wukai’s city center grew in Pop and NTL, the new roads were primarily responsible for the significant growth in NTL (
Figure 10(b3)), particularly roads linking the southeastern industrial harbors and ports to Doha and the rest of the country.
3.4.4. Qatar Discussion
The present study demonstrated patterns of seasonal fluctuations in Pop and NTL. The linear correlation found between monthly Pop counts and monthly NTL averages was strong. Both tended to have a greater variance in the summer months, a result that is consistent with seasonal migration patterns of migrant workers. This could imply that NTL values may not be correlated to Pop counts but rather economic activity and seasonal migrations. Further research that extends beyond the 2022 World Cup would shed more light on whether there is a continued correlation between Pop and NTL.
Qatar’s PSA does not publish monthly migrant-worker counts. PSA’s semi-decadal censuses count the number of people living in “labor camps”, although this number may not account for all of the migrant workers living in Qatar, such as household workers. PSA does provide Pop counts of “non-Qatari workers”. For example, in their 2015 census, PSA reported a total Pop of 2,404,776 of which 1,442,882 lived in labor camps; it also reported that 83% of the Pop of working age (15+) in Qatar constitutes non-Qatari employee workers [
71].
With the international spotlight on Qatar and the World Cup organizers, the legal rights, wellbeing, and working conditions of migrant workers in Qatar came under scrutiny over wages and human rights abuses [
68]. Following the initiation of World Cup infrastructure projects, there were constant reports of squalid conditions in labor camps [
72], of labor and workers rights violations as a result of the kafala (sponsorship) system [
73] that was reformed in August 2020 [
74,
75,
76], and of human rights abuses that the migrant workers experienced as a result [
77].
The results of NTL changes at the pixel level are consistent with the Qatari government’s plans to diversify their economy away from hydrocarbons and into tourism and commerce sectors, including preparations for the 2022 World Cup. If NTL values continue to increase despite a drastic reduction in Qatar’s migrant worker Pop after 2022, then the correlation found in this study may just be coincidental. However, if NTL stagnates as migrant worker Pop is reduced, then a more direct relationship between economic development—in the form of increased NTL—and the migrant-worker Pop may be established. In this context, NTL could serve as a way to quantify the contributions of migrant workers toward the economic development of Qatar and could help to monitor the progress toward meeting the 2030 SDGs. Quantifying these contributions could inform policies that directly impact the lives of migrant workers in Qatar, as well as workers in the Gulf Cooperation Council countries.
4. Conclusions
We sought to determine how NASA’s Black Marble VNP46A2 product could be used for Pop studies and modeling, and we found great potential for multiple applications including urban development research, conflict resolution, SDG monitoring, disaster management and adaptation planning, and detection of power outages indicating disruption of electrical services. The Black Marble suite of products can provide valuable information on ground conditions, which can inform researchers and decision makers alike. Black Marble has made it possible to evaluate the efficacy of NTL at a variety of spatial (locality, region, country, etc.) and temporal (days, weeks, months, years, etc.) scales. The case studies demonstrated several examples where NTL is not a direct signal of Pop location or spatial distribution; rather, NTL captures a complex relationship between Pop and infrastructure.
For example, the results of the Oaxaca migration study, where we compared changes in INEGI censuses against changes in NTL, found municipalities that had significant increases in Pop and increases in NTL. Most of these areas had moderate Pop densities and were adjacent to densely populated municipalities in the urban center of the capital, suggesting urban expansion. However, municipalities with significant decreases in Pop did not exhibit proportional decreases in NTL. These municipalities tended to be in rural areas with relatively low Pop densities. NTL was useful in identifying new settlement development, but was not able to unequivocally identify outflows of Pop from existing settlements, because, in some cases, lit infrastructure remained even after people departed.
In the Oaxaca EQ case, mobile phone Wi-Fi check-ins and NTL data provided context as to the locations of disruptions in electrical services, implying infrastructure damage, with a clear indication of more damage in areas near the EQ epicenter. The mobile phone check-ins demonstrated a similar relationship based on distance from the epicenter; however, the check-ins tended to exhibit a larger variance in their signal. NTL was useful in clearly identifying infrastructure impacts (as exhibited by the smaller variance and distance from epicenter relationship) from the EQ, and it showed some potential to detect and monitor the impacts of natural disasters on infrastructure and population movement when used in tandem with mobile phone data [
29]. This information could be critical in planning and providing emergency services.
Analyzing changes in NTL was very useful in identifying seasonal work migration patterns, as we saw in the Qatar case study. We demonstrated a strong linear correlation between NTL averages and monthly Pop counts with observed seasonal patterns in both. This study showed a strong linear correlation between Pop and NTL year-over-year, but it must be noted that this was in the context of concurrent economic development. Notably, changes in NTL were linked to a diversification of economic sectors, with increases in NTL observed in areas of tourism and commerce infrastructure development, and decreases in NTL seen in areas of hydrocarbon production, suggesting NTL’s potential to monitor migration patterns, economic development plans, and SDGs. However, this case did not provide evidence that NTL would be an effective proxy for seasonal Pop in the absence of economic development—a question that merits further research. Furthermore, the change in brightness over time may be attributed to limitations of the SNPP-VIIRS/DNB sensors or errors stemming from seasonal variations and environmental factors [
78,
79]. The NPP satellite’s DNB sensors, which supply data for the VIIRS Black Marble, have a limited range of EM wavelengths between 0.5 µm to 0.9 µm [
80]. This could create bias favorable to incandescent light bulbs, which operate within the sensor’s range, over light-emitting diodes (LEDs), which tend to emit light below 0.5 µm. The latter can lead to increased skyglow and reduced upward radiance recorded by satellites [
81,
82].
In the Za’atari Refugee Camp, NTL was able to capture the creation of the camp and provided information on the stability of nighttime electricity, linked to the wellbeing of camp residents of all ages, but it did not correlate to the changes in Pop in that camp. This could be because refugee camp infrastructure is often constructed upfront. Further research is needed to clarify whether NTL can be a proxy for Pop in refugee camps.
We sought to determine the practicality and limitations of NASA’s Black Marble for population studies at different spatial and temporal scales. We surmise our findings as follows: NASA’s Black Marble is an Earth-observing tool with an exceptional ability to detect a variety of anthropogenic activity even at low levels of light, in part due to its ability to capture data with near-global coverage at a daily frequency with a high radiometric range. We demonstrated that Black Marble can be applied to a wide range of applications in disaster mitigation, SDG monitoring, settlement detection, and economic development. The NTL product captured seasonal changes in light, as well as larger trends of infrastructure and settlement development; however, NTL was limited in correlation to changes in populations in certain cases. In the Qatar case study, the monthly population estimates correlated strongly to SoL NTL values, but a pixel analysis revealed that the dense urban areas did not increase in luminosity; rather, the increases in NTL were attributed to economic development and diversification in industrial areas where population density is low. The signal of NTL is not a direct signature of population, but the qualities of the data provide invaluable context on the light conditions on the ground. Despite the challenges facing remote sensing data, both physical and in terms of calibration and validation, NTL demonstrates that, under the proper context, it can provide detailed information that can help to answer a multitude of research questions on the conditions of people.
It is clear that the spatial and temporal scales of application of NTL have major impacts on fitness for use for Pop modeling. The overall result of the case studies suggest that NTL may be used as a direct proxy of Pop counts in certain contexts, such as in areas of urban expansion, or when population movements are associated with economic activities. However, the cases also highlight NTL’s limitations in detecting immigration into already developed urban centers or emigration out of rural areas, as well as the difficulties in applying NTL to Pop modeling at small spatiotemporal scales. NTL was useful at local scales when used in tandem with other human location data (cell phone check-ins) to evaluate infrastructure in relation to population movement, thereby providing a more contextual understanding of what was happening on the ground during an unfolding disaster. Leaders around the world will continue to require more accurate and timely data to make informed decisions and to meet SDGs, especially as climate change poses increased risks and challenges. Datasets such as NASA’s Black Marble will become increasingly necessary and useful. The present study explored some ways in which NTL had the ability to be applied at varying spatiotemporal scales. NTL proved to have significant potential to monitor conditions on the ground. Additionally, NTL’s variance was stable across all case studies, confirming it as a reliable source of quality high-resolution information on a variety of human activities. Nighttime lights, afterall, are anthropogenic phenomena linked to a variety of network infrastructures around the world. These networks rely upon the stability of the environment to sustain connectivity that, in some ways, shows the stability of our human interconnectivity. If there is instability in a region, either by way of natural disaster or by anthropogenic causes, NTL is able to record the impacts and disruptions to these critical connections. As the impacts of climate change become more pronounced on the environment and on people’s wellbeing, it becomes more imperative that data are not only able to inform quickly and accurately on the conditions on the ground but that they also inspire us to take action with equity for people and the environment in mind and an eye toward a more sustainable future.


 ,
, 


