Article

Assessing the Potential of Long, Multi-Temporal SAR Interferometry Time Series for Slope Instability Monitoring: Two Case Studies in Southern Italy

1
National Research Council of Italy, CNR-IREA, Via Amendola 122, 70126 Bari, Italy
2
GAP S.R.L., 70125 Bari, Italy
*
Author to whom correspondence should be addressed.
Remote Sens. 2022, 14(7), 1677; https://doi.org/10.3390/rs14071677
Submission received: 2 March 2022 / Revised: 22 March 2022 / Accepted: 23 March 2022 / Published: 31 March 2022
(This article belongs to the Special Issue Remote Sensing Analysis of Geologic Hazards)

Abstract

:
Multi-temporal SAR interferometry (MTInSAR), by providing both mean displacement maps and displacement time series over coherent objects on the Earth’s surface, allows analyzing wide areas, identifying ground displacements, and studying the phenomenon evolution at a long time scale. This technique has also been proven to be very useful for detecting and monitoring slope instabilities. For this type of hazard, detection of velocity variations over short time intervals should be useful for early warning of damaging events. In this work, we present the results obtained by using both COSMO-SkyMed (CSK) and Sentinel-1 (S1) data for investigating the ground stability of two hilly villages located in the Southern Italian Apennines (Basilicata region), namely the towns of Montescaglioso and Pomarico. In these two municipalities, landslides occurred in the recent past (in Montescaglioso in 2013) and more recently (in Pomarico in 2019), causing damage to houses, commercial buildings, and infrastructures. SAR datasets acquired by CSK and S1 from both ascending and descending orbits were processed using the SPINUA MTInSAR algorithm. Mean velocity maps and displacement time series were analyzed, also by means of innovative ad hoc procedures, looking, in particular, for non-linear trends. Results evidenced the presence of nonlinear displacements in correspondence of some key infrastructures. In particular, the analysis of accelerations and decelerations of PS objects corresponding to structures affected by recent stabilization measures helps to shed new light in relation to known events that occurred in the area of interest.

1. Introduction

For more than two decades, multi-temporal SAR interferometry (MTInSAR) techniques have provided both mean displacement maps and displacement time series over coherent objects on the Earth’s surface, allowing analysis of wide areas to identify ground displacements, and to study phenomena evolution at decadal time scales [1,2]. These techniques are among the most promising and reliable in the detection and monitoring of slope instabilities [3,4], and a long record of applications and case studies can be found in the literature, especially in Italy (e.g., [5] and references therein). Landslides are among the most difficult types of ground displacements to be investigated through remote sensing techniques, as their velocity rates may cover several orders of magnitude, from very low creeping to sudden catastrophic failures [6], thus pushing the detection performances to the limits. Further challenges related to the application of MTInSAR analysis for slope instability monitoring concern (i) the lack of a sufficient spatial density of coherent targets (man-made structures, rock outcrops, homogeneous distributed scatterers) due to vegetation or variable land cover; and (ii) the advanced time series analysis required for identifying complex kinematics (related, for instance, to early warning signals) [7].
Currently, several satellite data are available, from both past and current missions, providing stacks of interferometric SAR images at different wavelengths, spatial resolutions, and revisit times [8]. Recent satellite missions have improved the monitoring of unstable slopes. L-band missions such as ALOS-2/PALSAR-2 [9] and SAOCOM [10] provide interesting monitoring capabilities over vegetated areas, despite the low sensitivity to small displacements and the limited revisit time. The high-resolution X-Band COSMO-SkyMed (CSK) constellation [11], and the upcoming COSMO-SkyMed second generation [12], acquire data with a spatial resolution reaching metric values, and provide revisit times of up to a few days, leading to an increase in the density of the measurable targets, thus improving the monitoring of local scale events and the detection of non-linear displacement trends. The Sentinel-1 (S1) C-band mission from the European Space Agency (ESA) [13] provides a spatial resolution comparable to that of previous ESA missions, but a nominal revisit time reduced to 6 days. On December 2021, a failure on Sentinel-1B occurred, leading to a doubling in the revisit time. Nonetheless, by offering regular global-scale coverage, better temporal resolution, and freely available imagery, S1 improves the performance of MTInSAR for ground displacement investigations. In particular, the short revisit time allows a better time series analysis by improving the temporal sampling and the chances to identify pre-failure signals characterized by a high-rate and non-linear behavior. Moreover, it allows collecting large data stacks in a short time, thus improving the MTInSAR performance in emergency (post-event) scenarios. These characteristics are very promising for early warning of slope failure events and monitoring subsequent displacement trends, in the larger framework of Disaster Risk Reduction (DRR). However, when dealing with large data stacks, the distinction between the sensitivity and significance of the measurements is essential. Indeed, detection of velocity changes can be related to changes in the equilibrium of forces affecting terrain stability, provided that all variations due to other natural phenomena (e.g., thermal expansion and differences in soil moisture) have been excluded. Consequently, reliable monitoring and early warning require a detailed analysis of the displacement time series looking for signals actually related to ground instabilities.
In this work, we present the results obtained by analyzing displacement time series from both CSK and S1 for investigating the ground stability of hilly villages located in the Southern Italian Apennines (Basilicata region). In the area of interest, landslides are endemic. Many events occurred in the recent past, causing damage to houses, commercial buildings, and infrastructures, and several have been investigated through various remote sensing techniques [14,15,16,17,18]. We focus here on two test sites in the province of Matera, one on the outskirts of the town of Montescaglioso, where a landslide occurred in 2013, and one near Pomarico, affected by an event in 2019.
SAR datasets acquired by CSK and S1 from both ascending and descending orbits were processed by using the SPINUA MTInSAR algorithm [19], in order to exploit the potential of these two satellite missions to investigate ground displacements related to the slope instabilities in pre- and post-failure stages. Monitoring of the displacement rates is the main tool to detect the type and causes of a slope failure [20] and to plan further restoration measures, if possible, of the involved areas. Mean velocity maps and displacement time series were analyzed, looking, in particular, for non-linear trends that are possibly related to relevant ground instabilities and, due to the high spatial resolution, useful in terms of early warning. This analysis was also supported by automated procedures recently developed for identifying targets with peculiar, nonlinear motions. Specifically, this article illustrates an example of slope pre-failure monitoring on the Pomarico landslide, an example of slope post-failure monitoring on the Montescaglioso landslide, and a few examples of structures in both locations (such as buildings and roads) affected by instability related to different causes (soil swelling, for example).

2. Materials and Methods

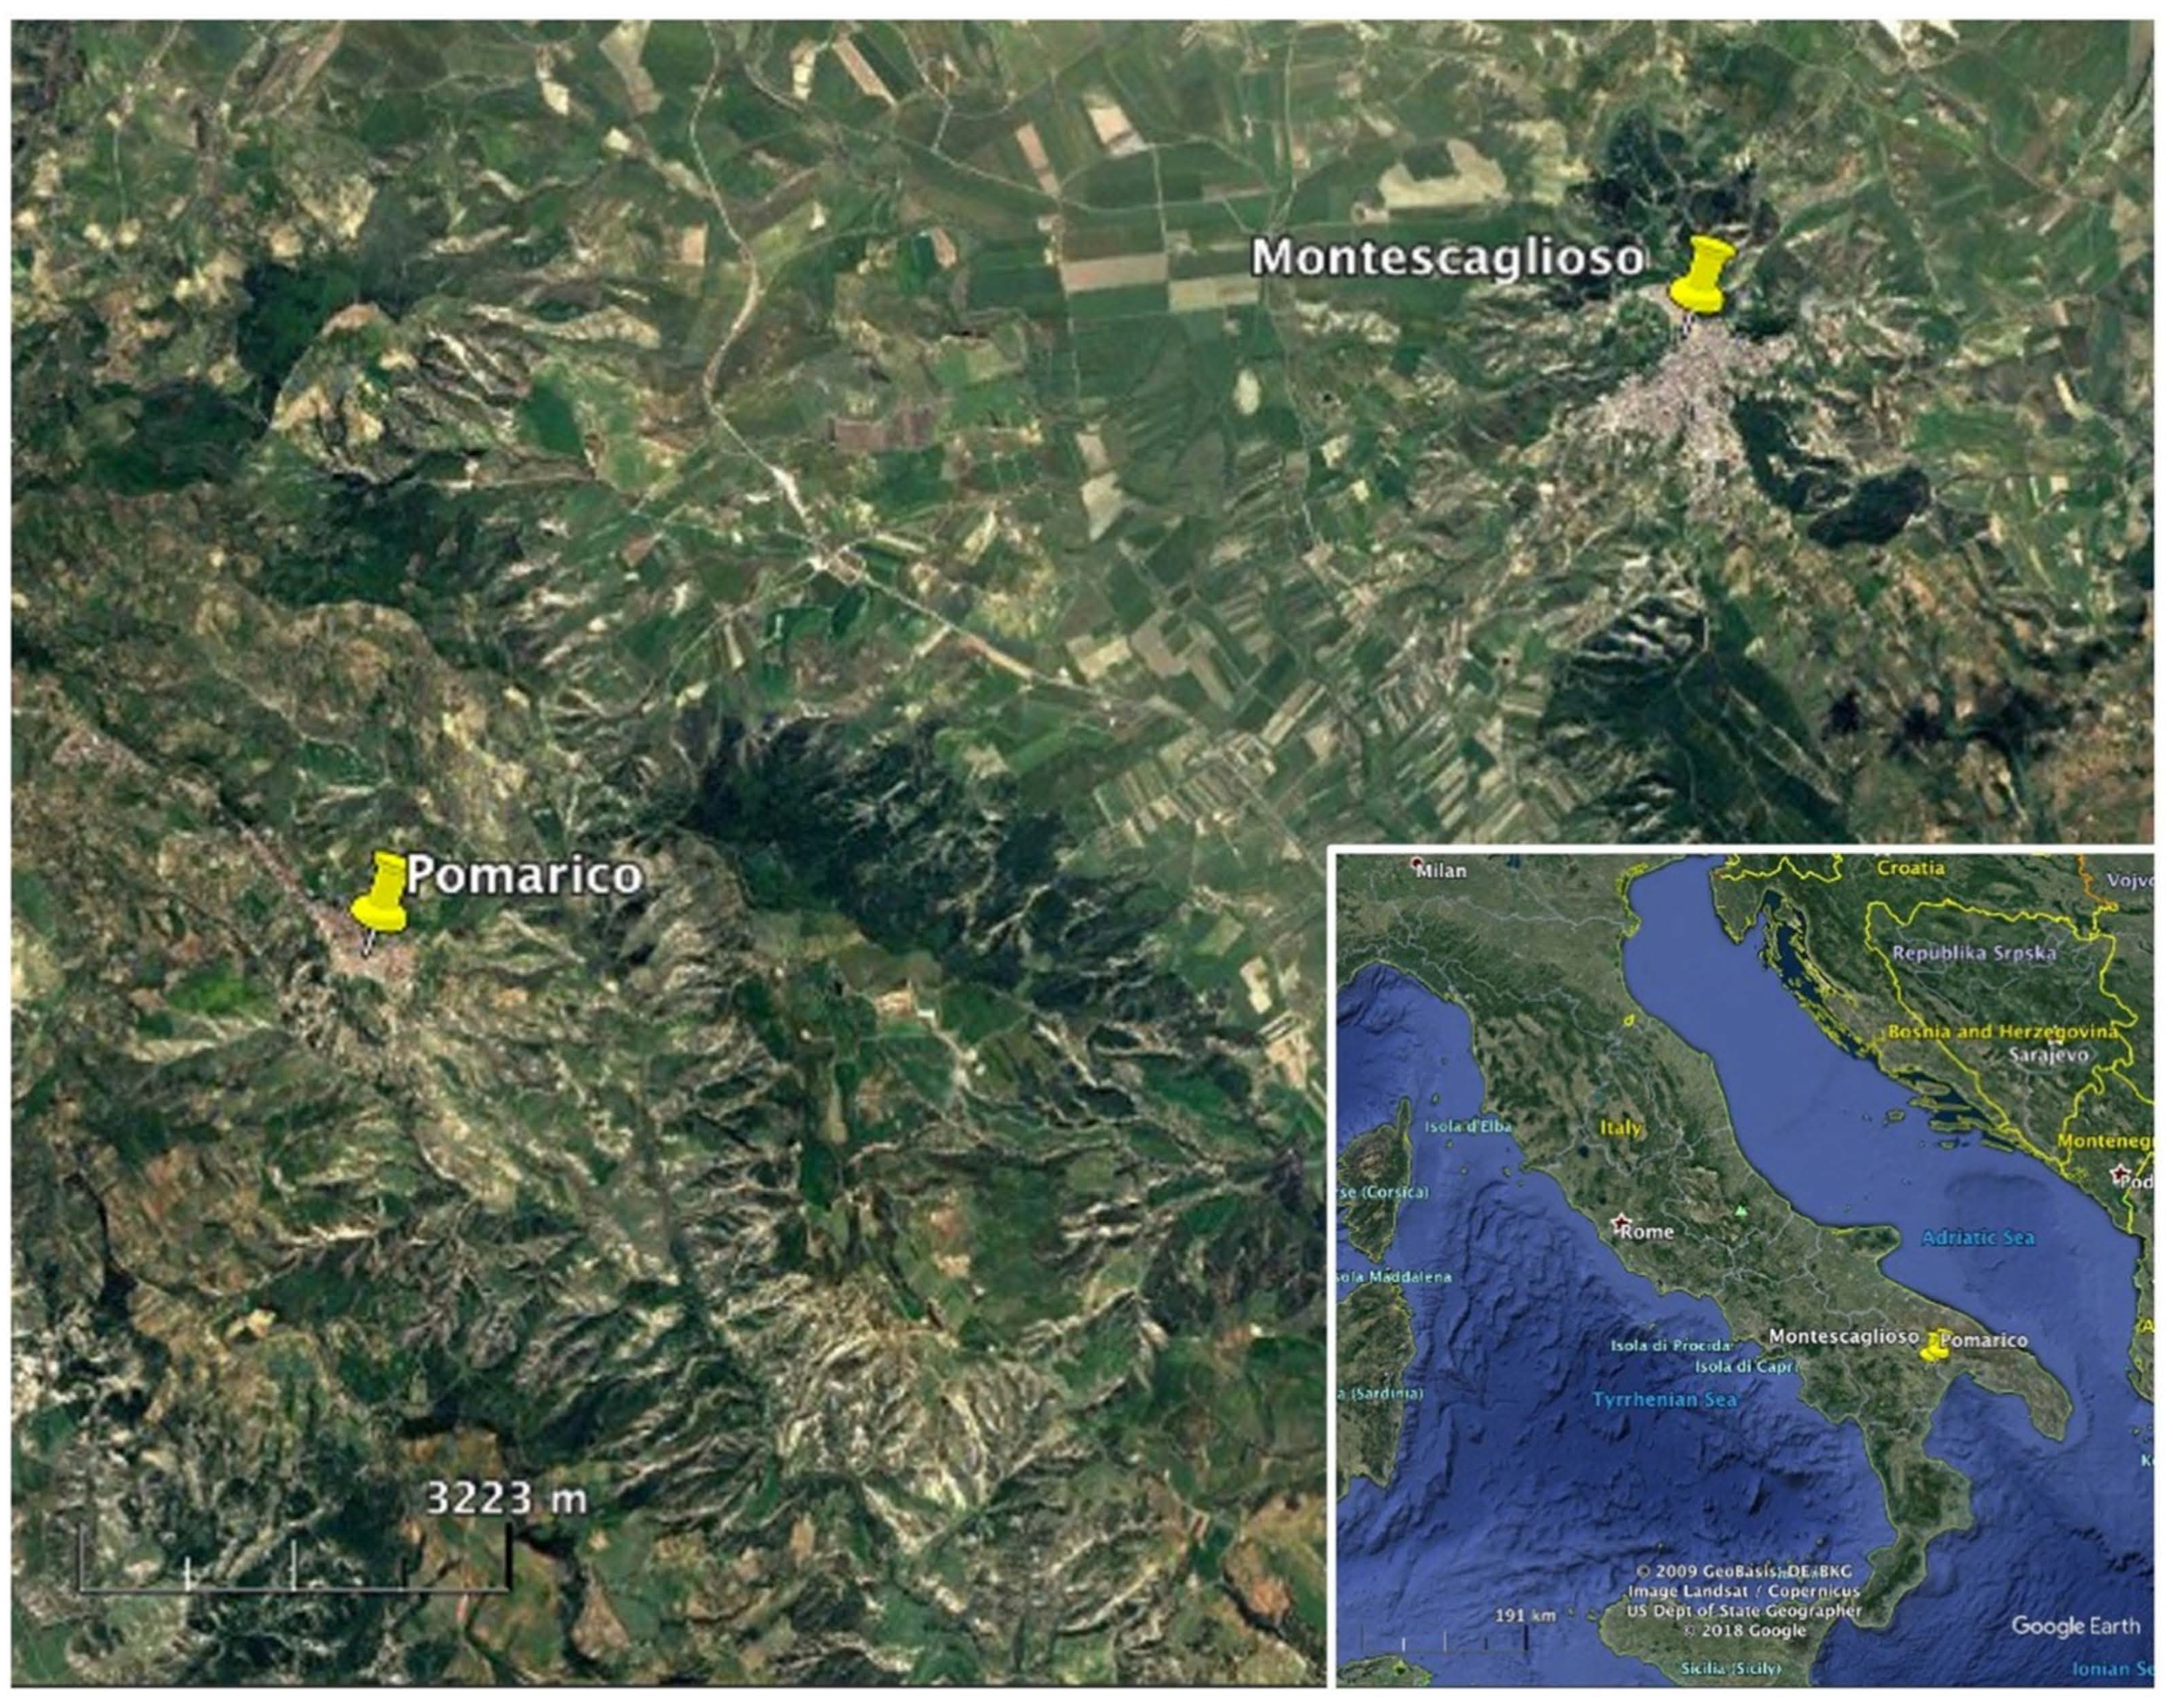
2.1. Test Sites Description

The Montescaglioso and Pomarico villages are located in southern Italy, in the southern portion of the Basilicata region (Figure 1). This area is characterized by regressive sediments, generally coarsening upward, consisting of sand and conglomerate levels unconformably overlying the Pliocene—Middle Pleistocene Sub-Apennine Clay Formation, filling a deep tectonic trough [21].
The tectonic history has influenced the geological setting of the area. In the presence of monoclinal strata, the hydraulic conditions worsened by the slope may coincide to cause sliding of large clods on the underlying and impermeable clays. This is the case of the Montescaglioso landslide, in addition to other landslides that occurred in neighboring villages, such as Aliano [22].
Instead, the presence of cemented overburden leads to progressive failure phenomena: first there are fissures of the rigid cover layer and subsequently the destructive evolution of the phenomenon. An example is the Pomarico landslide (2019) [18], in addition to those of Pisticci (1976) [23] and Senise (1986) [24,25], which also caused casualties.
Furthermore, the presence of ancient and quiescent landslides, as reported in national and regional databases [26,27,28], contributes to an anisotropy of the masses which, correlated to the strength and permeability, is relevant in the kinematics of landslides: landslide bodies tend to expand with a retrogressive behavior, often after intense rainfall periods [29,30] and evolve downstream in earthflows [31,32].

2.2. MTInSAR Datasets

Table 1 reports schematically the datasets used in the present work. S1 data are acquired in interferometric wide-swath (IW) mode, with a ground pixel size of about 5 × 20 m2 (range × azimuth). CSK data are acquired in stripmap mode, with a ground pixel size of about 3 × 3 m2. CSK scenes are acquired with an average time interval of 16 days, whereas the S1 acquisition schedule is more frequent, with an acquisition interval of 12 days, and reaching 6 days from 2017, when the second satellite of the constellation, Sentinel-1B, was launched. In fact, S1 series cover a shorter time interval than CSK, as they all start in October 2014, whereas CSK series start two years earlier, but with a considerably higher number of acquisitions, and almost double in the case of the Montescaglioso ascending dataset.
All data series cover a time period that ends in 2018 since they are those available at the time when the MTInSAR processing was carried out. Although several more years would have been useful for assessing the ground instability of the case studies at a more recent time, the results derived by exploiting the available datasets are suitable for the time series analysis we present in the following, and perfectly suit the aim of this work.

2.3. MTInSAR Time Series Analysis

As previously mentioned, all data series were processed through the SPINUA MTInSAR processing suite [19]. As with most MTInSAR processing algorithms, the result of the processing consists of a large set of SAR pixels corresponding to coherent objects on the ground, characterized by their coordinates and by a merit figure such as the temporal coherence, and featuring the residual height and the mean line-of-sight (LOS) velocity, in addition to the complete time series of relative LOS displacements at each acquisition date. The temporal coherence is defined as γ t = 1 N t j = 1 N t exp i ( ϕ j ϕ ^ j ) , where ϕ j , with j = 1 , , N t , are the InSAR phases of the time series, and ϕ ^ j are obtained from a model trend.
The model has to be postulated a priori in order to define the coherence figure. The most common choice, often adopted to minimize processing times, is to use a linear model, or e.g., a low-order polynomial. Clearly, such models are not suited for the type of nonlinearities involved in ground displacement phenomena such as those investigated here. Therefore, when no ad hoc, computation-intensive processing can be performed on limited datasets involving, e.g., libraries of more complex phase models, selecting targets to investigate time series trends is usually carried out by adopting low threshold values for the provided γ t figure (which results in a large number of selected targets), and relying on the analysis of experts with knowledge of the area, or by integration of ancillary data taken on the ground or by other means.
In these cases, automated procedures may help identifying a few targets with peculiar, nonlinear motions that may signal, e.g., previously undetected phenomena, or reactivations/deactivation phases of known landslides. Most approaches adopt some parameterization of the time series trends, relying on statistical tests to assess the most suitable representation of each time series, e.g., through piecewise-linear or polynomial functions (e.g., [33,34]).
In particular, in [34] a procedure is proposed, based on the Fisher distribution, that is able to automatically detect nonlinearities such as piecewise-linear trends, which are typical of warning signals preceding the failure of natural and artificial structures. This nonlinear trend analysis (hereafter referred to as NLTA) processes the displacement time series derived by a generic MTInSAR algorithm and provides as output the coefficients of the polynomial model of degree n ¯ p   selected for describing the time series, and an index F A based on the Fisher statistics, which allows evaluating the quality of the approximation and the temporal coherence γ t ,   OUT computed by using the selected polynomial model. The polynomial degree is selected as:
n ¯ p = min n p | F n p F α   F A n p F A α
where F is the standard Fisher test, and F α and F A α are threshold values that can be set according to both the number of samples (N) composing the time series and the significance level α of the statistical test [34]. In this work, the threshold values are set to F α = F A α = 4 . The polynomial model selected by the NLTA procedure generally improves the fit with respect to the model provided by the MTInSAR algorithm that generated the time series, leading to higher values of the output coherence γ t ,   OUT with respect to the input coherence γ t ,   IN . According to this, a subset of coherent targets showing interesting temporal behavior ( PS NLTA ), can be derived by exploring the values of γ t ,   OUT and γ t ,   IN as, for instance, in the following:
PS NLTA = γ t ,   IN < γ t , I N T h     γ t ,   OUT γ t , O U T T h     γ t ,   OUT γ t ,   IN Δ γ T h
where γ t , I N T h , γ t , O U T T h , and Δ γ T h are threshold values that for the present study are set respectively to 0.7, 0.8, and 0.1.
Furthermore, recently, an index based on the fuzzy entropy (FE) has been used [35] for measuring the degree of regularity of a given time series; the FE basically evaluates the gain in “information” by comparing segments of m + 1 samples with segments of m samples, according to some distance measure. The FE index, without postulating any a priori model, allows highlighting time series which show “interesting”, i.e., locally smooth, trends, including strong non linearities, jumps related to phase unwrapping errors, and the so-called partially coherent scatterers. Also in this case, a subset of interesting coherent targets ( P S F E ) can be selected through the FE index values according to a threshold value derived in [35] for time series of the type used in this work:
PS F E = F E < 0.5             with     m = 2
Both NLTA and the FE index were adopted for analyzing the MTInSAR displacement time series described in Section 2.2. In particular, the MTInSAR targets were selected through a model-independent procedure based on FE [35] and classified according to the polynomial order selected through the NLTA procedure [34]. By identifying and correcting phase unwrapping errors through FE, and by refining the displacement model through NLTA, the proposed post-processing scheme allows decreasing the residual processing errors and thus also the noise affecting the final displacement estimation. This is proved by the final temporal coherence values, which are generally higher than those coming from the standard MTInSAR processing [34,35]. This estimation refinement leads to an increase in the accuracy of the derived displacement products. Moreover, this post-processing scheme allows a focus on a smaller set of coherent targets affected by nonlinear displacements, and potentially deserving further geophysical or geotechnical analysis. Finally, it is well suited for catching warning signals such as, for example, those preceding the failure of natural and artificial structures.

3. Results

In this section we present the displacement maps and time series obtained over Montescaglioso and Pomarico villages.

3.1. Montescaglioso Test Site

Figure 2 shows the mean LOS displacement rate maps derived by processing, through the SPINUA algorithm, the S1 ascending (Figure 2a), S1 descending (Figure 2b), and CSK ascending (Figure 2c) datasets over the Montescaglioso test site.
Differences between previously published MTInSAR results [36,37], covering a period up to 2013, and ours, reaching 2018, are minimal: all three maps show mostly stable points, i.e., green dots, with low displacement rates, ranging between −2 and +2 mm/y. This means that no major, large-scale processes are ongoing on the area. The target spatial distributions confirm that CSK is more effective over artificial structures (buildings, roads). S1 data are able to capture signals from targets located on the landslide body (indicated by the red contour on the maps). Both CSK and S1 provide interesting deformation time series with nonlinear trends, which are investigated in detail in the following.
A few points with high displacement rates, reaching in some cases ± 10 mm/y (red and blue dots), can be discerned on the maps in Figure 2. Starting from these local displacements, we focused on four different situations: (i) post-landslide monitoring; (ii) monitoring of displacement evolution over a built-up area (a cemetery); (iii) monitoring of a structurally damaged building; (iv) monitoring of displacement evolution over a section of a connecting road.

3.1.1. Post-Landslide Monitoring

The SW hillslope of the Montescaglioso village is characterized by two main natural drainage networks and by a continuous cover layer of variable depth (sands, conglomerates and materials produced by human activities) overlying the impermeable Sub-Apennine Clay Formation in a monoclinal setting. The landslide, which occurred on 3 December 2013 after 56 h of continuous rain, covers an area of about 42 ha, caused severe failures along the road connecting Montescaglioso to the SP175 provincial road, and damaged some buildings for residential and productive use [17].
Despite the relatively wide area affected by the phenomenon and the presence of several man-made artifacts, the three datasets (S1 ascending and descending, CSK ascending) in Figure 2 show few targets over the landslide area. However, average displacement rates over these few points indicate a situation of general ground stability in the landslide area. Focusing on the S1 ascending displacement map (Figure 3a), it is possible to identify local displacements in correspondence of the Capoiazzo stream scarp (targets in the area delimited by a white polygon in Figure 3a) occurring with rates ranging between −4 and −10 mm/y.
The displacement time series in this area were further processed using both the FE and the NLTA, introduced in Section 2.3 and devoted to the automatic identification of nonlinear trends. Figure 3b,c show, respectively, the targets selected though the FE index according to (3), and those selected though the NLTA according to (2). The colors are representative of the FE values and of the polynomial degree selected by the NLTA, according to the color bars in the figures. In order to demonstrate the potential provided by these advanced approaches in support of the analysis of MTInSAR products, the time series corresponding to two targets, labeled P1 and P2, are shown in Figure 3. Target P1 was selected through the FE index and its displacement time series is sketched in yellow squares in Figure 3d. A discontinuity of about 28 mm is clearly visible, occurring in August 2018, which is due to an error in the phase unwrapping processing step. The red squares represent the displacement values obtained by subtracting the interferometric range of ambiguity ( λ / 2 = 28 mm) from the samples after the discontinuity, and thus provide the correctly unwrapped values. Hence, in this case, the FE index selection method was able to identify a target with a mostly smooth trend, but affected by a processing error, that, after proper correction, shows an interesting nonlinear continuous displacement trend, which can be now suitably fitted by a polynomial model, shown by the dotted black line in the figure. The NLTA was not able to select this target, since the discontinuity introduced by the phase unwrapping error does not allow the satisfactory modeling of the time series using a polynomial model. On the contrary, target P2, not affected by such an error, was properly selected by the NLTA, which models its displacement trend using a polynomial model of the third degree. Figure 3e shows the displacement values of target P2 as black dots and the polynomial curve as a red dotted line. Due to this more accurate model, the target temporal coherence increases, in the terms explained in Section 2.3. Both displacement times series of targets P1 (corrected for the phase unwrapping error) and P2 show a continuous trend with a marked change in rate in the first half of the 2018, which causes an increase in downward velocities.

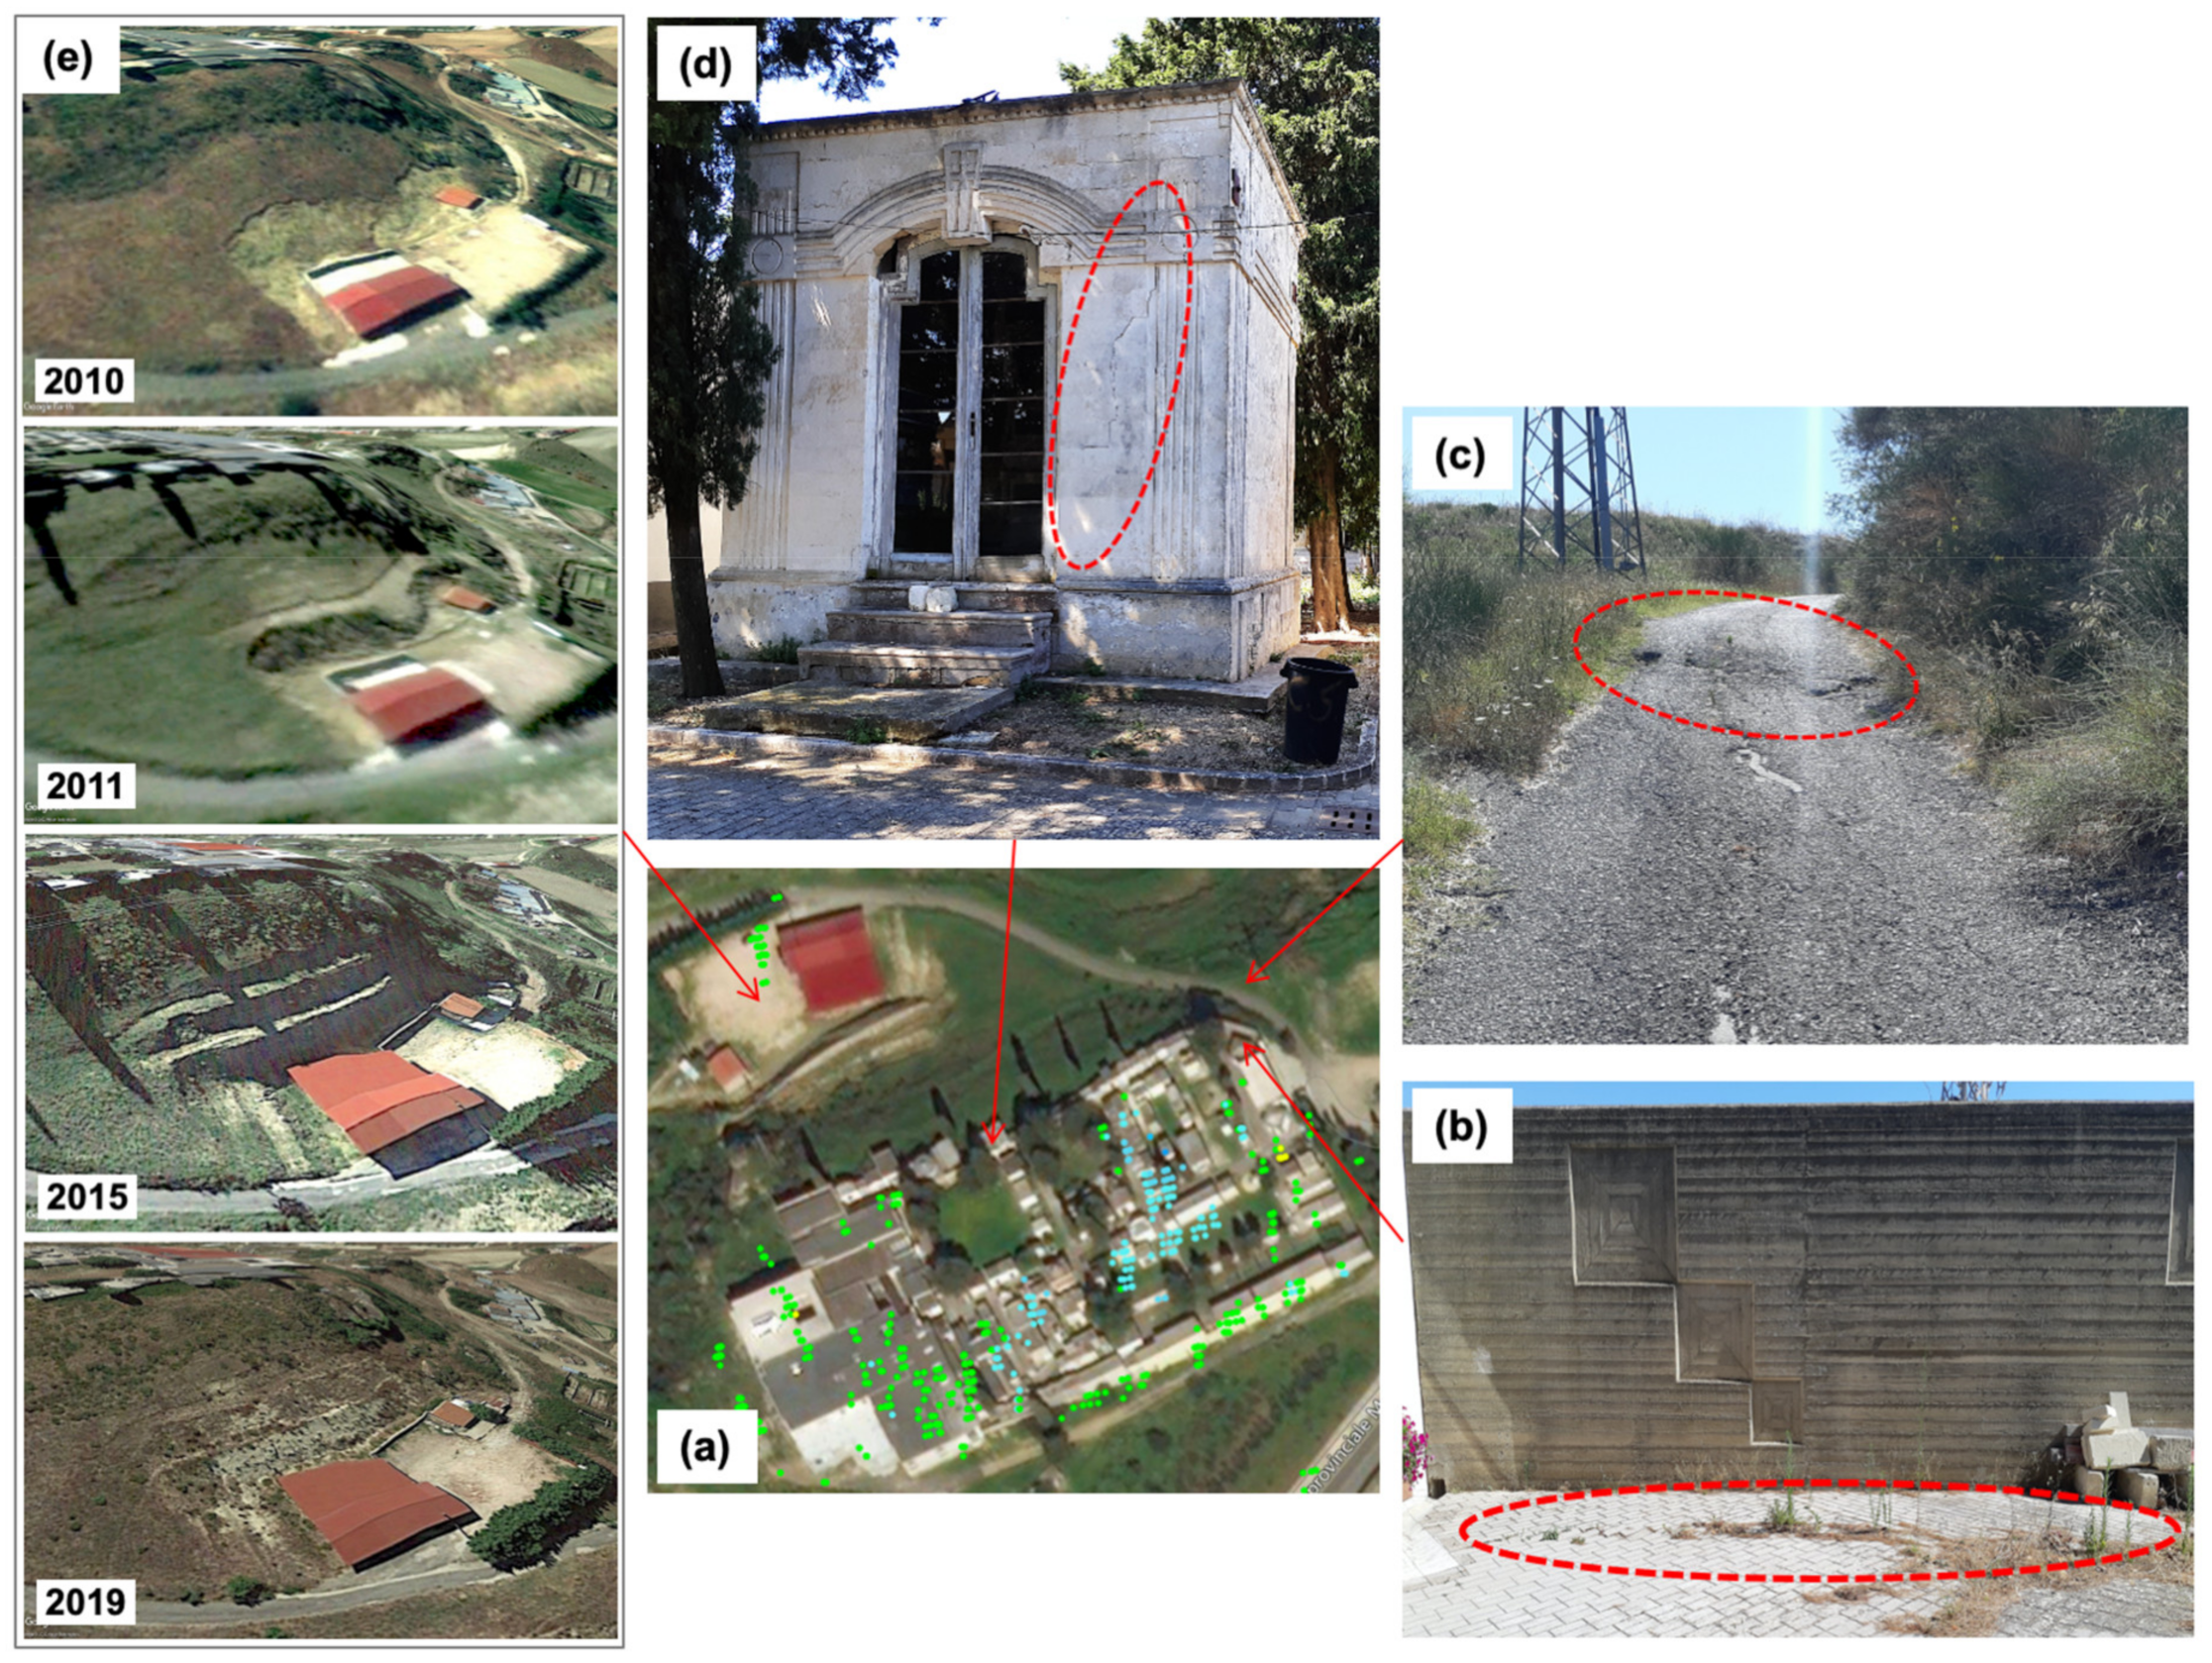
3.1.2. Cemetery Area

The MTInSAR datasets show SAR pixels over the Montescaglioso cemetery with high displacement rates (blue dots in Figure 4a) ranging between 6 and 10 mm/y. Local displacements were identified with MTInSAR datasets on the NW slope of the hill. Several displacement time series show a rate change at the end of 2013 with an increase in velocity, and a further one towards the end of 2014, with a decrease in velocity. As example of such behavior, in Figure 4b the displacement time series of the target labeled P1 in Figure 4a is reported.

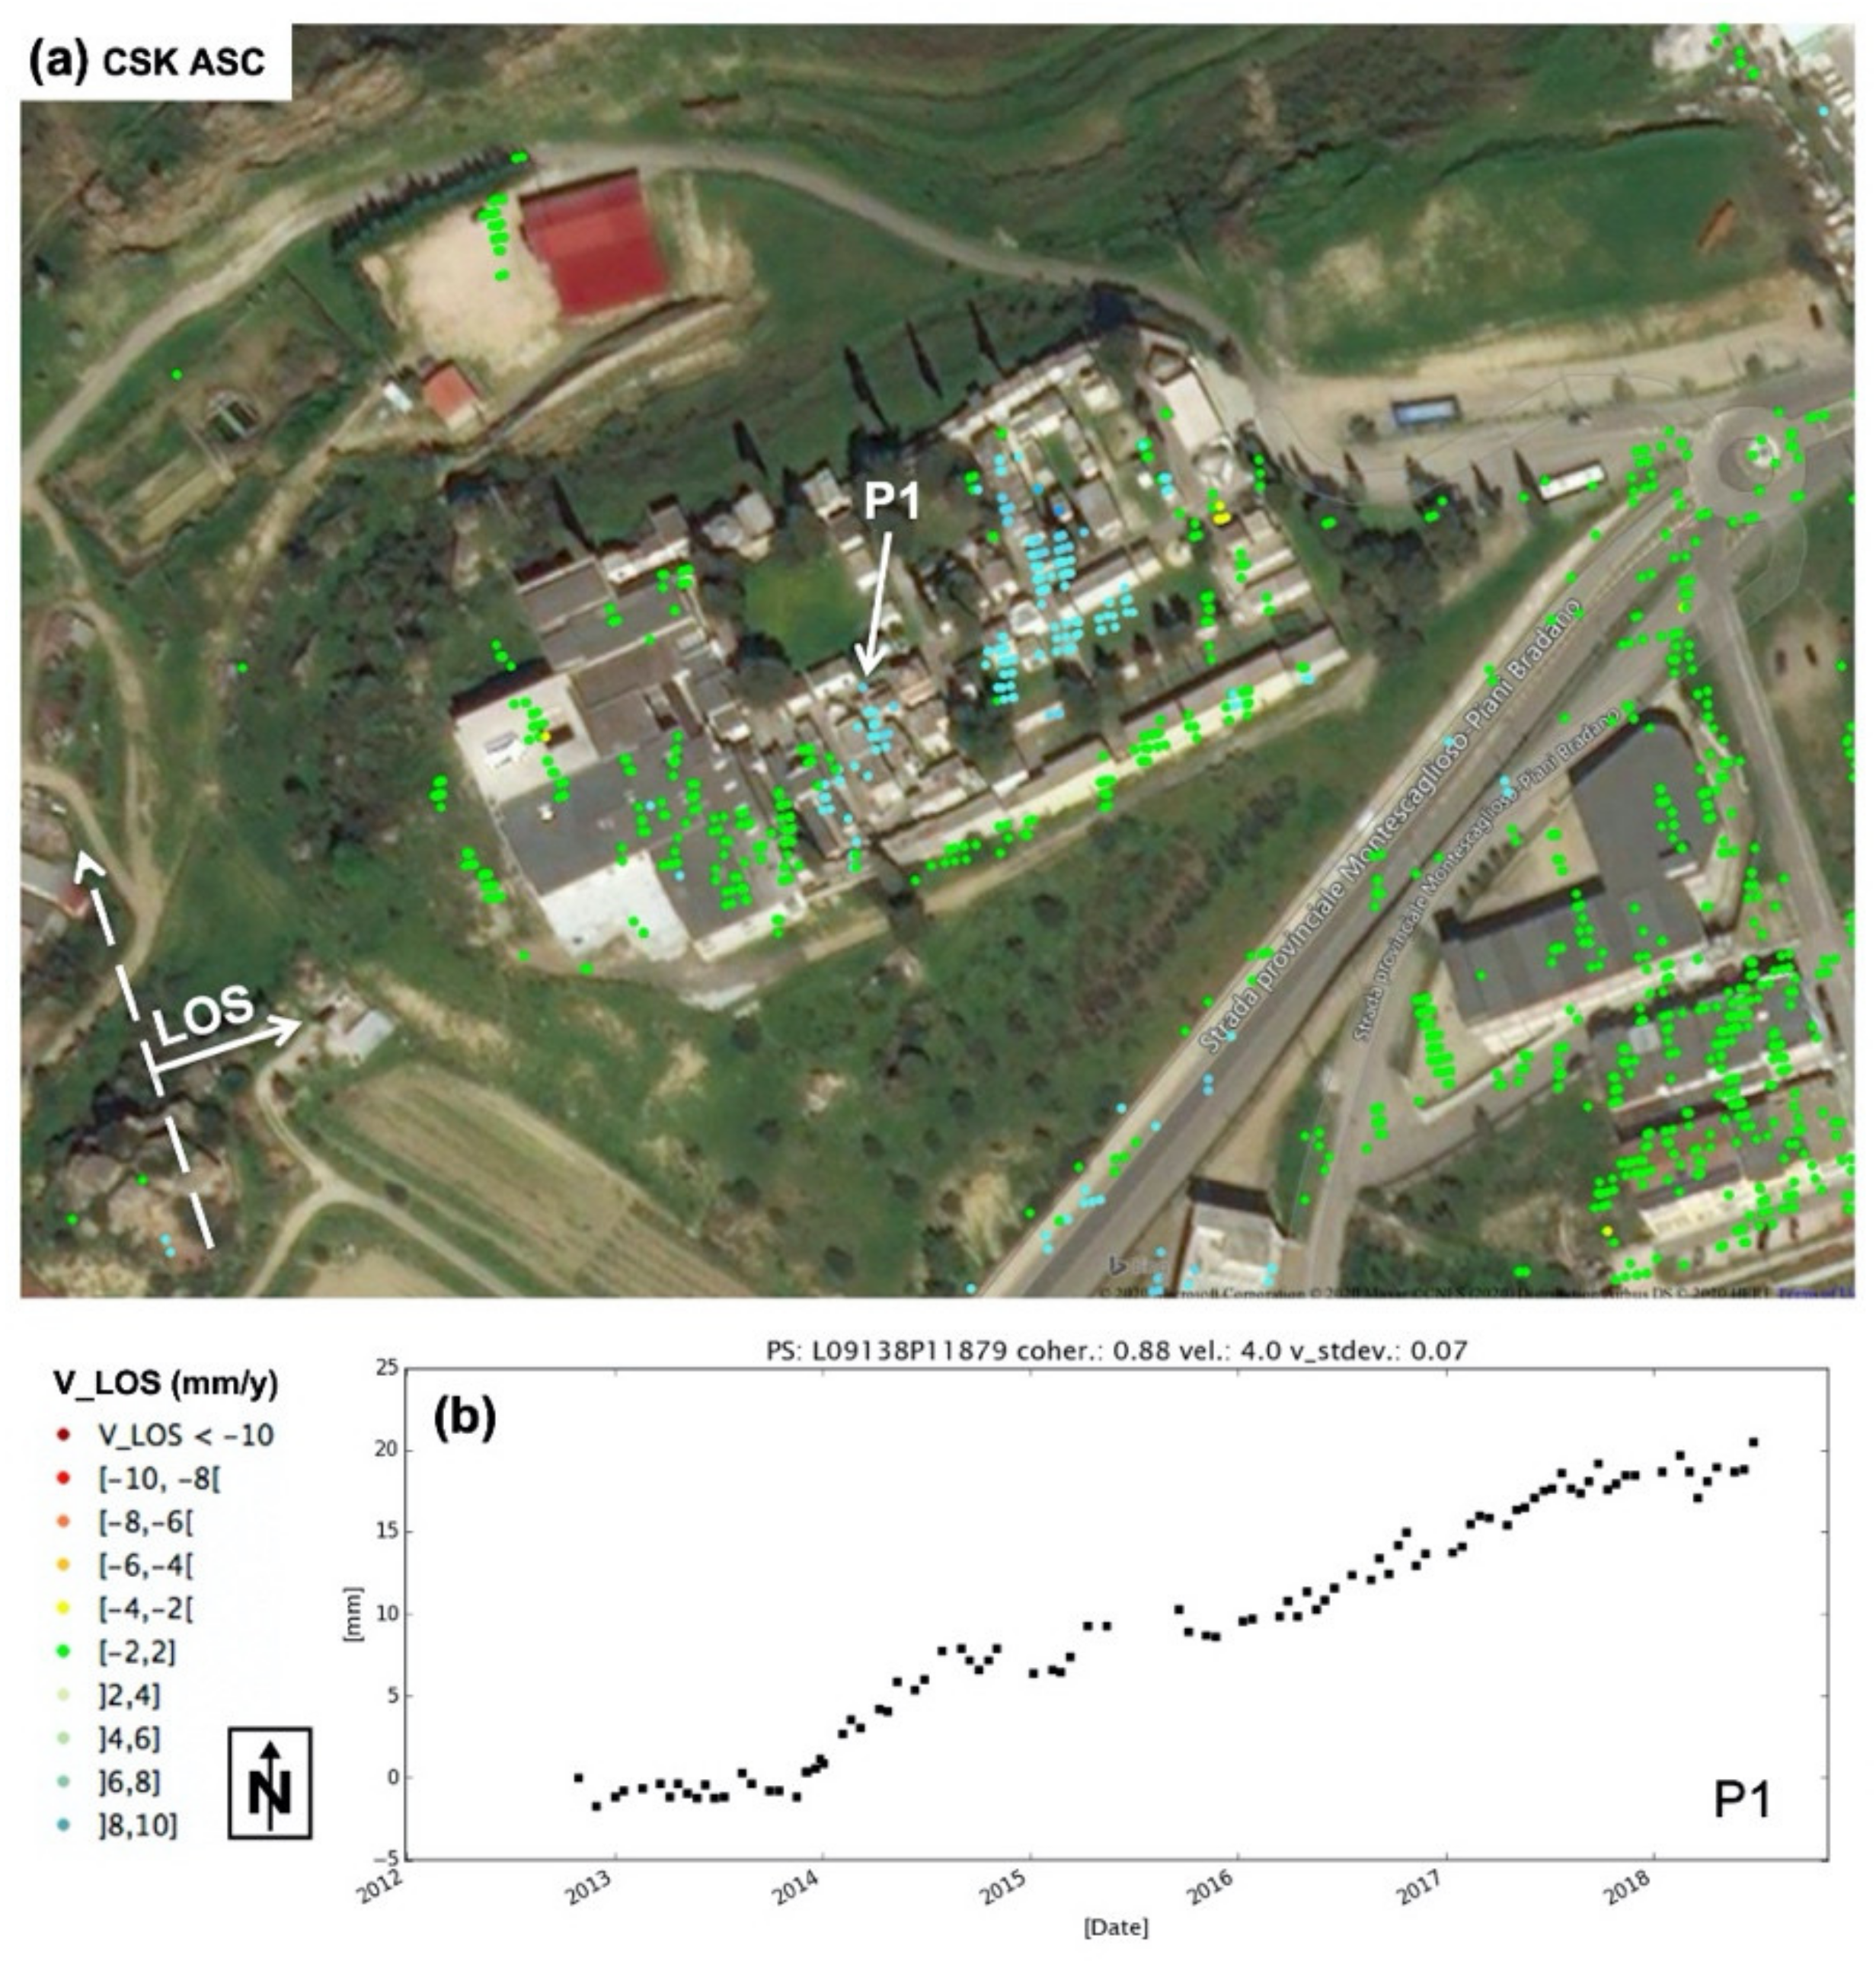
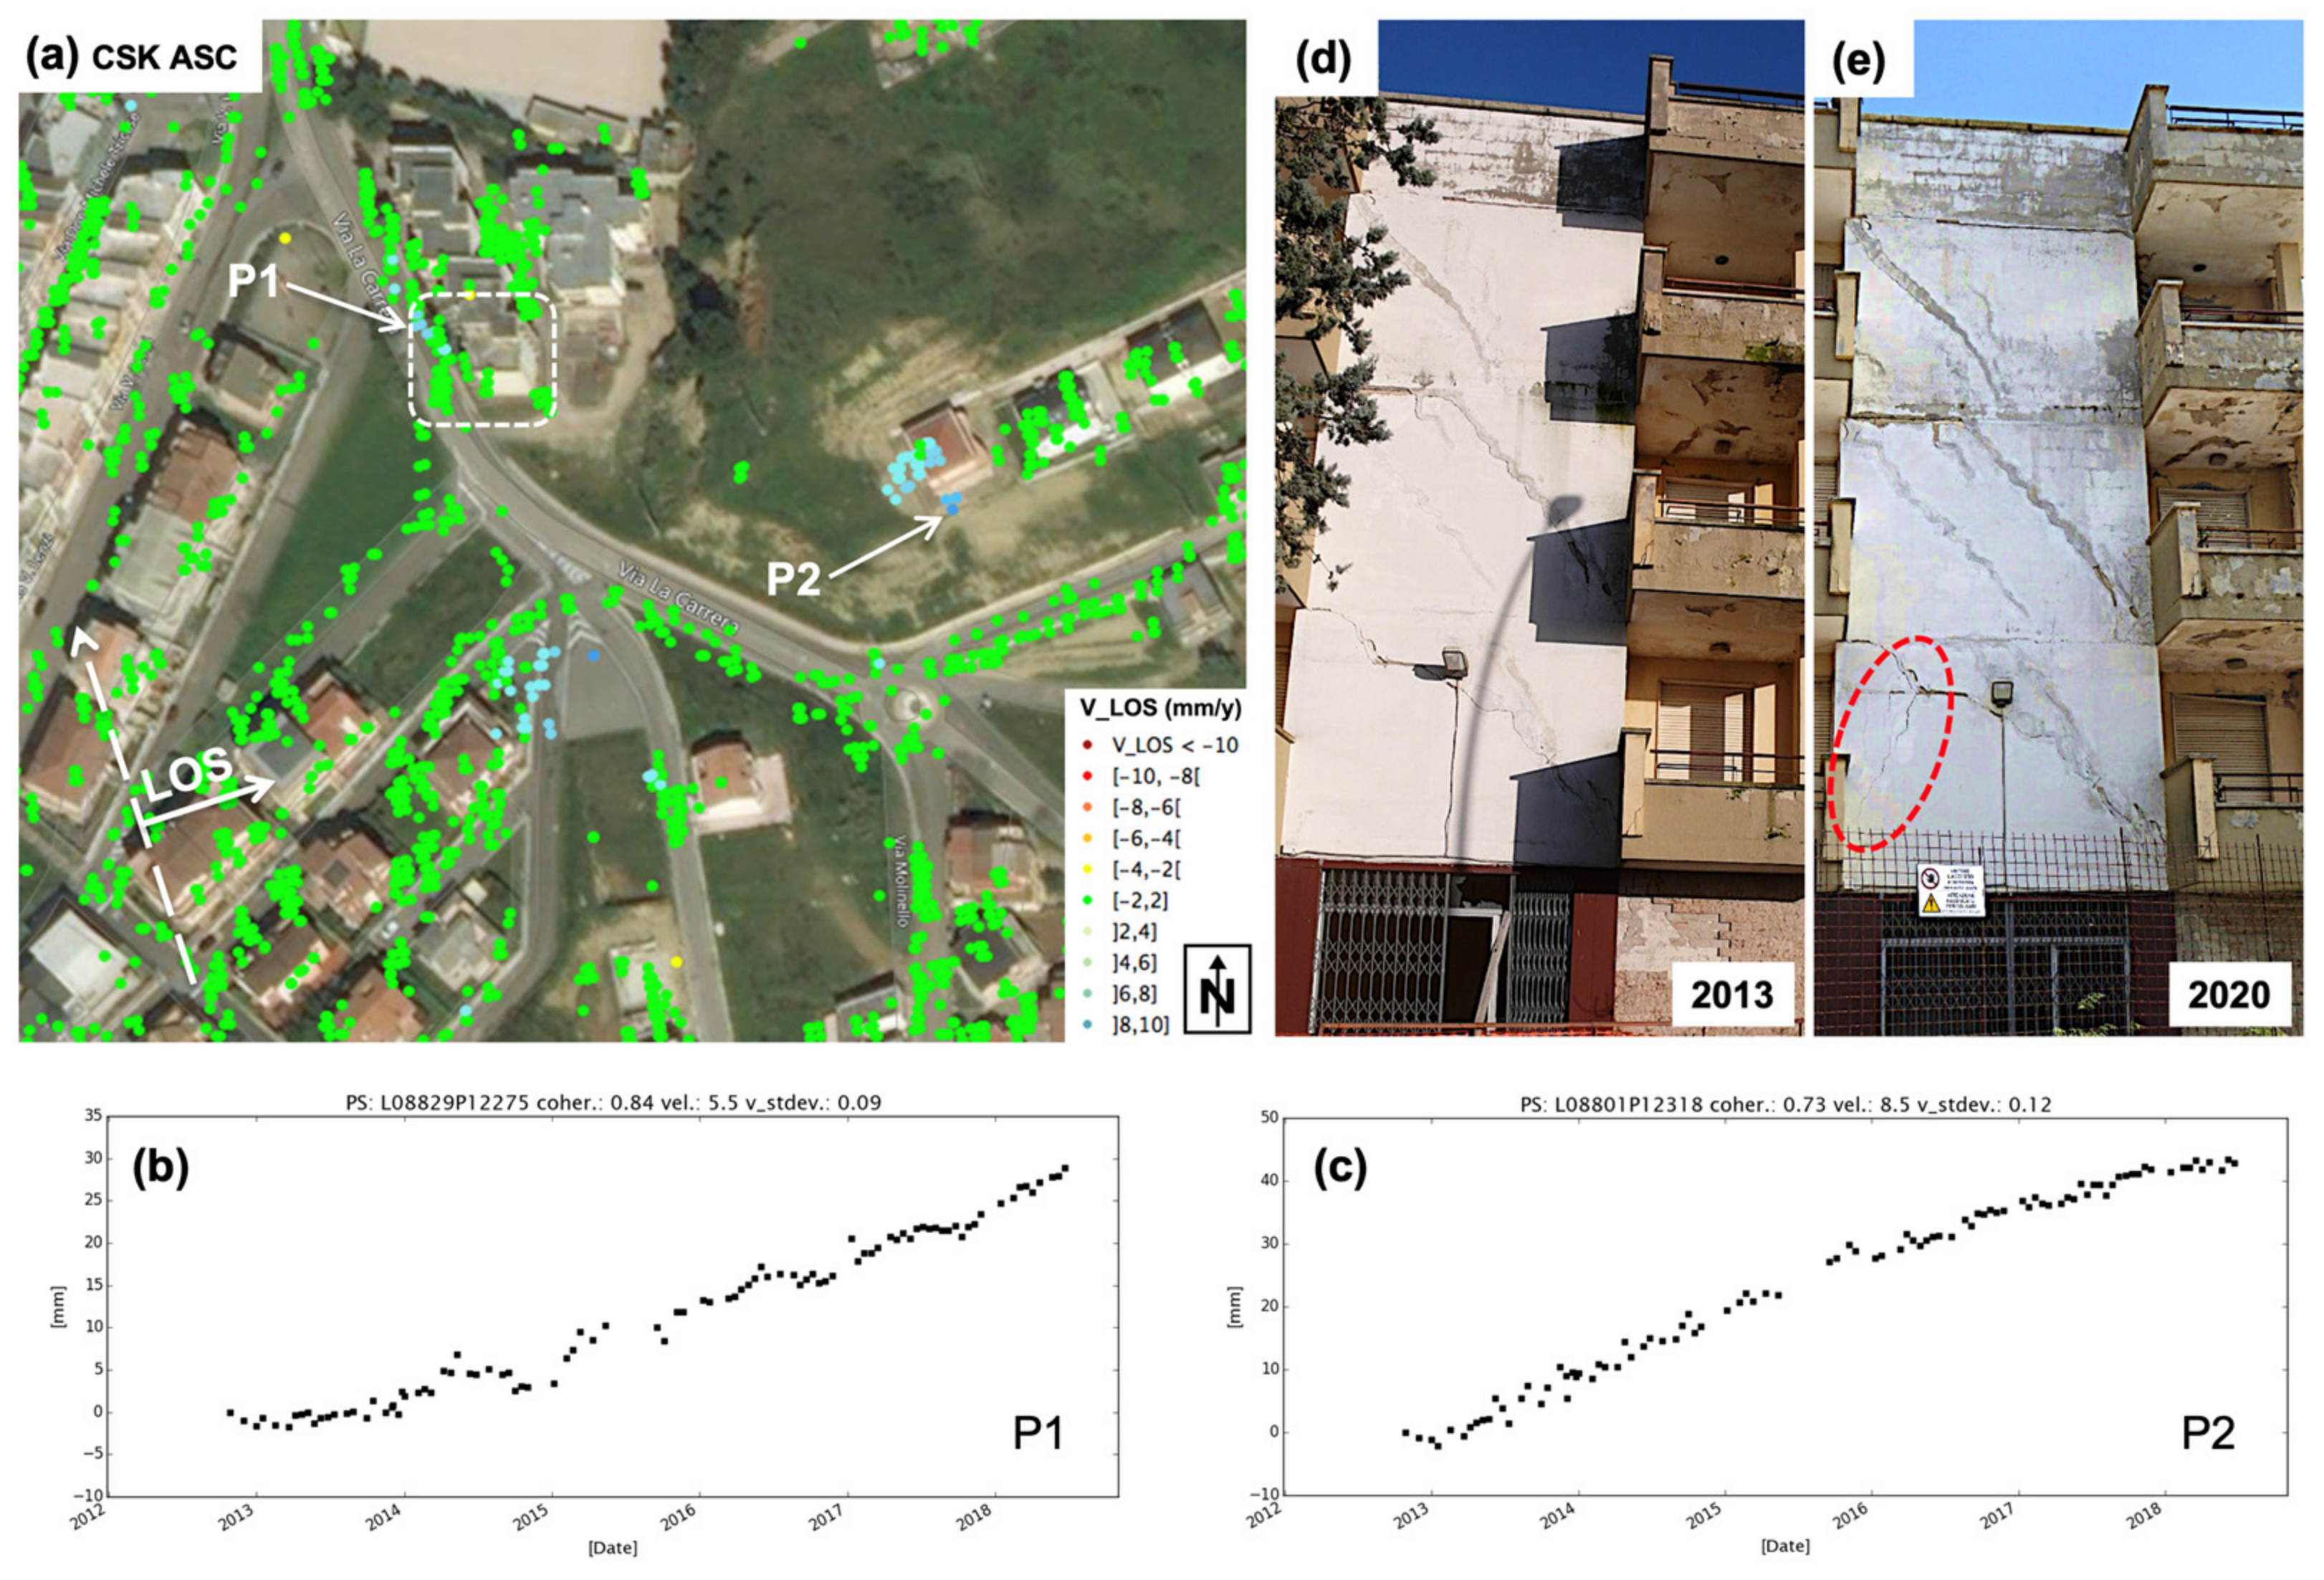
3.1.3. Structurally Damaged Building

Figure 5a shows an enlargement of the mean LOS displacement map in Figure 2c, derived by the CSK ascending dataset, over an area containing a structurally damaged building, which was uninhabitable since 2013 (delimited by the dotted line in Figure 5a). The analyzed displacement time series shows a continuous and constant increase in displacements (with a mean velocity of 5.5 mm/y), as shown by temporal trends of P1 (Figure 5b).

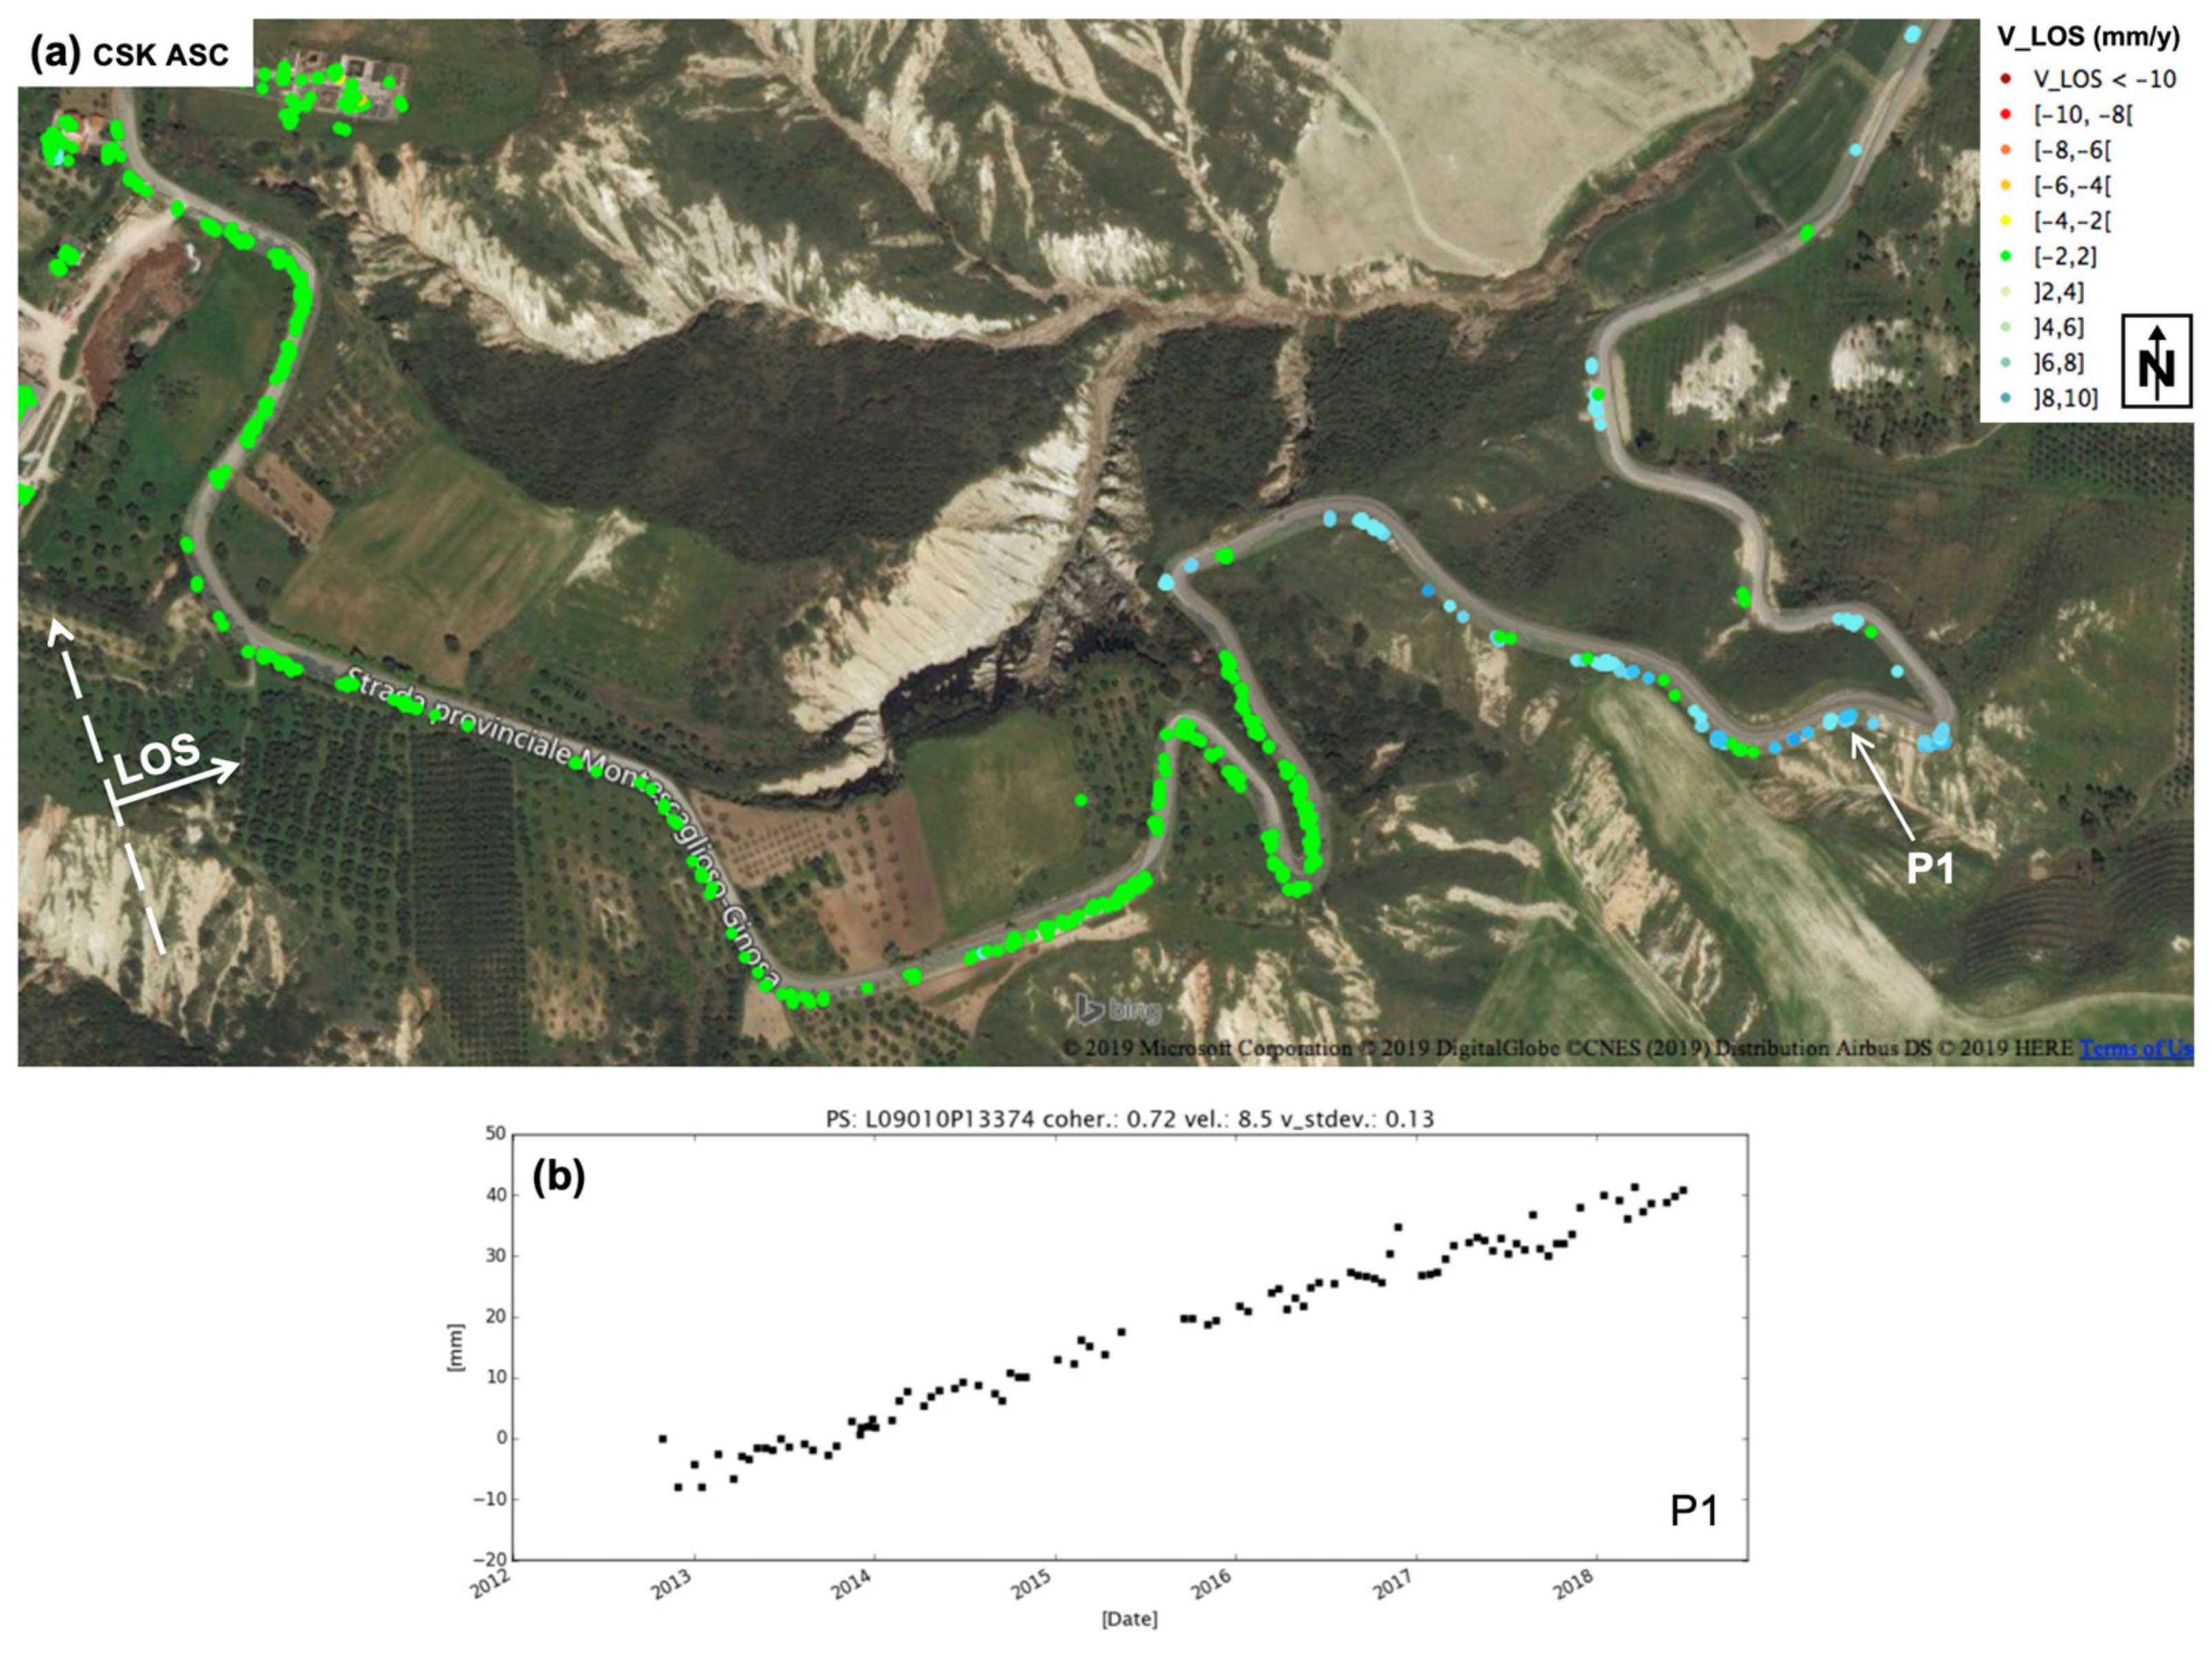
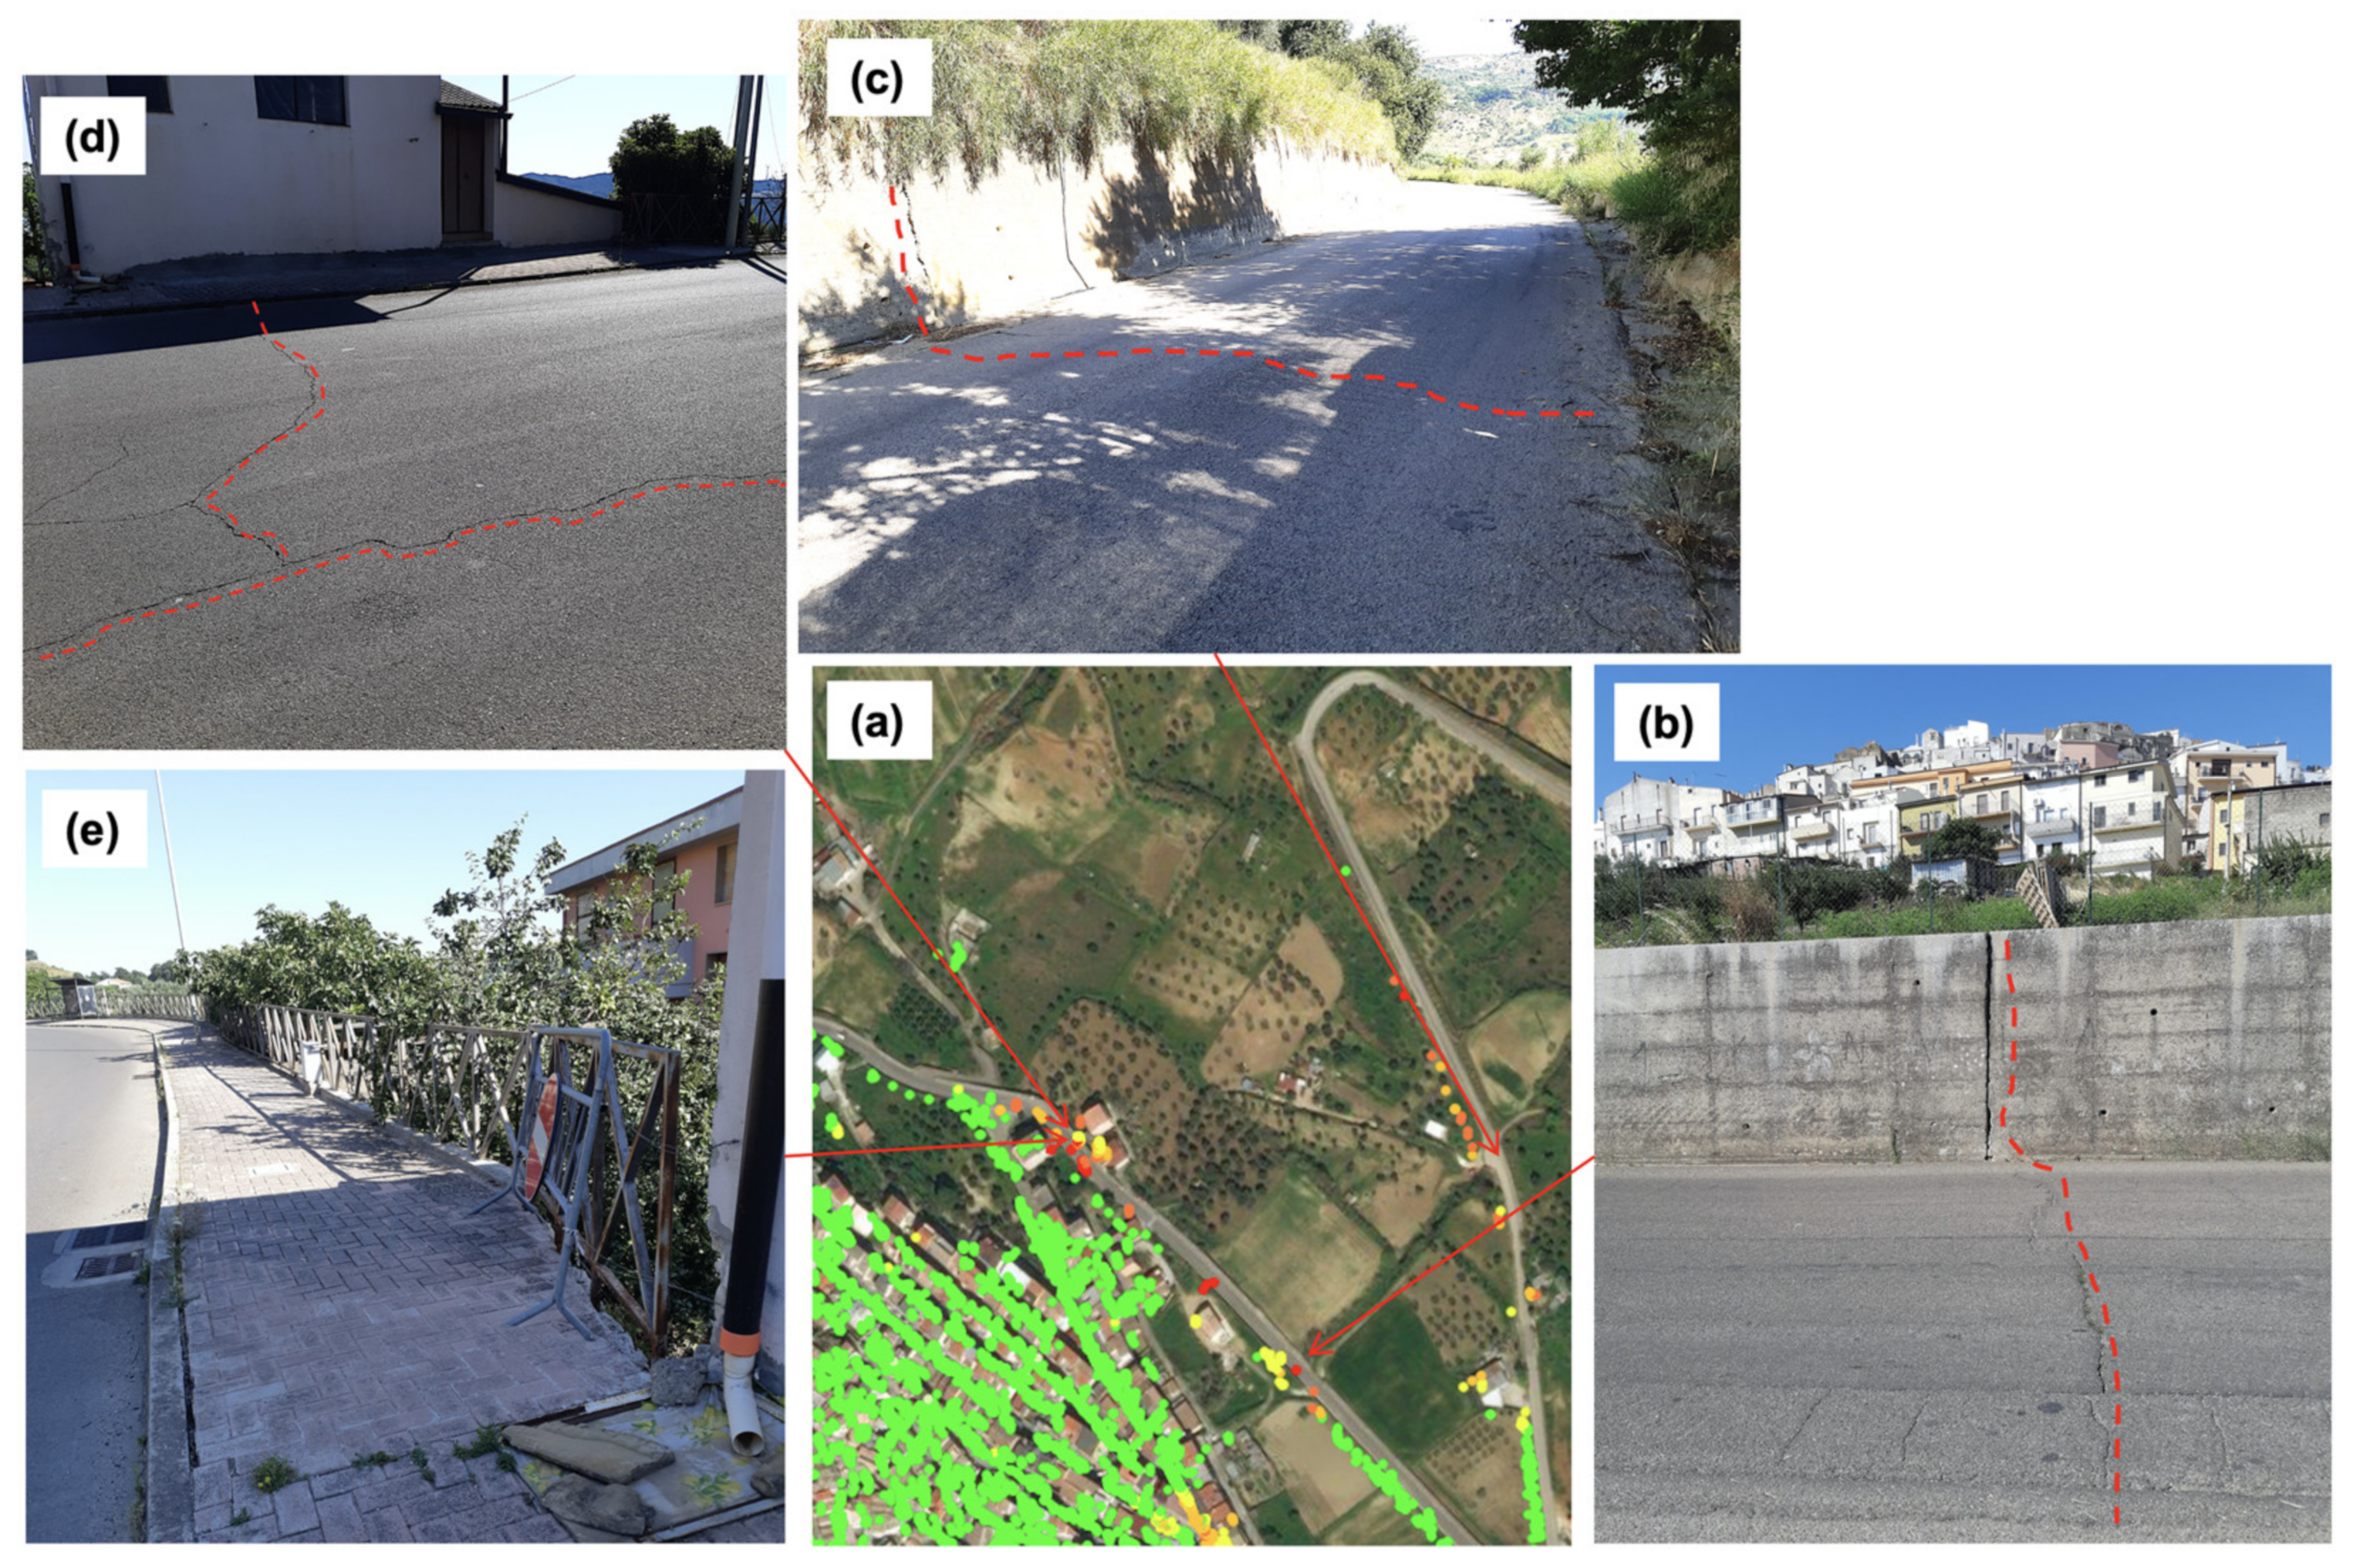
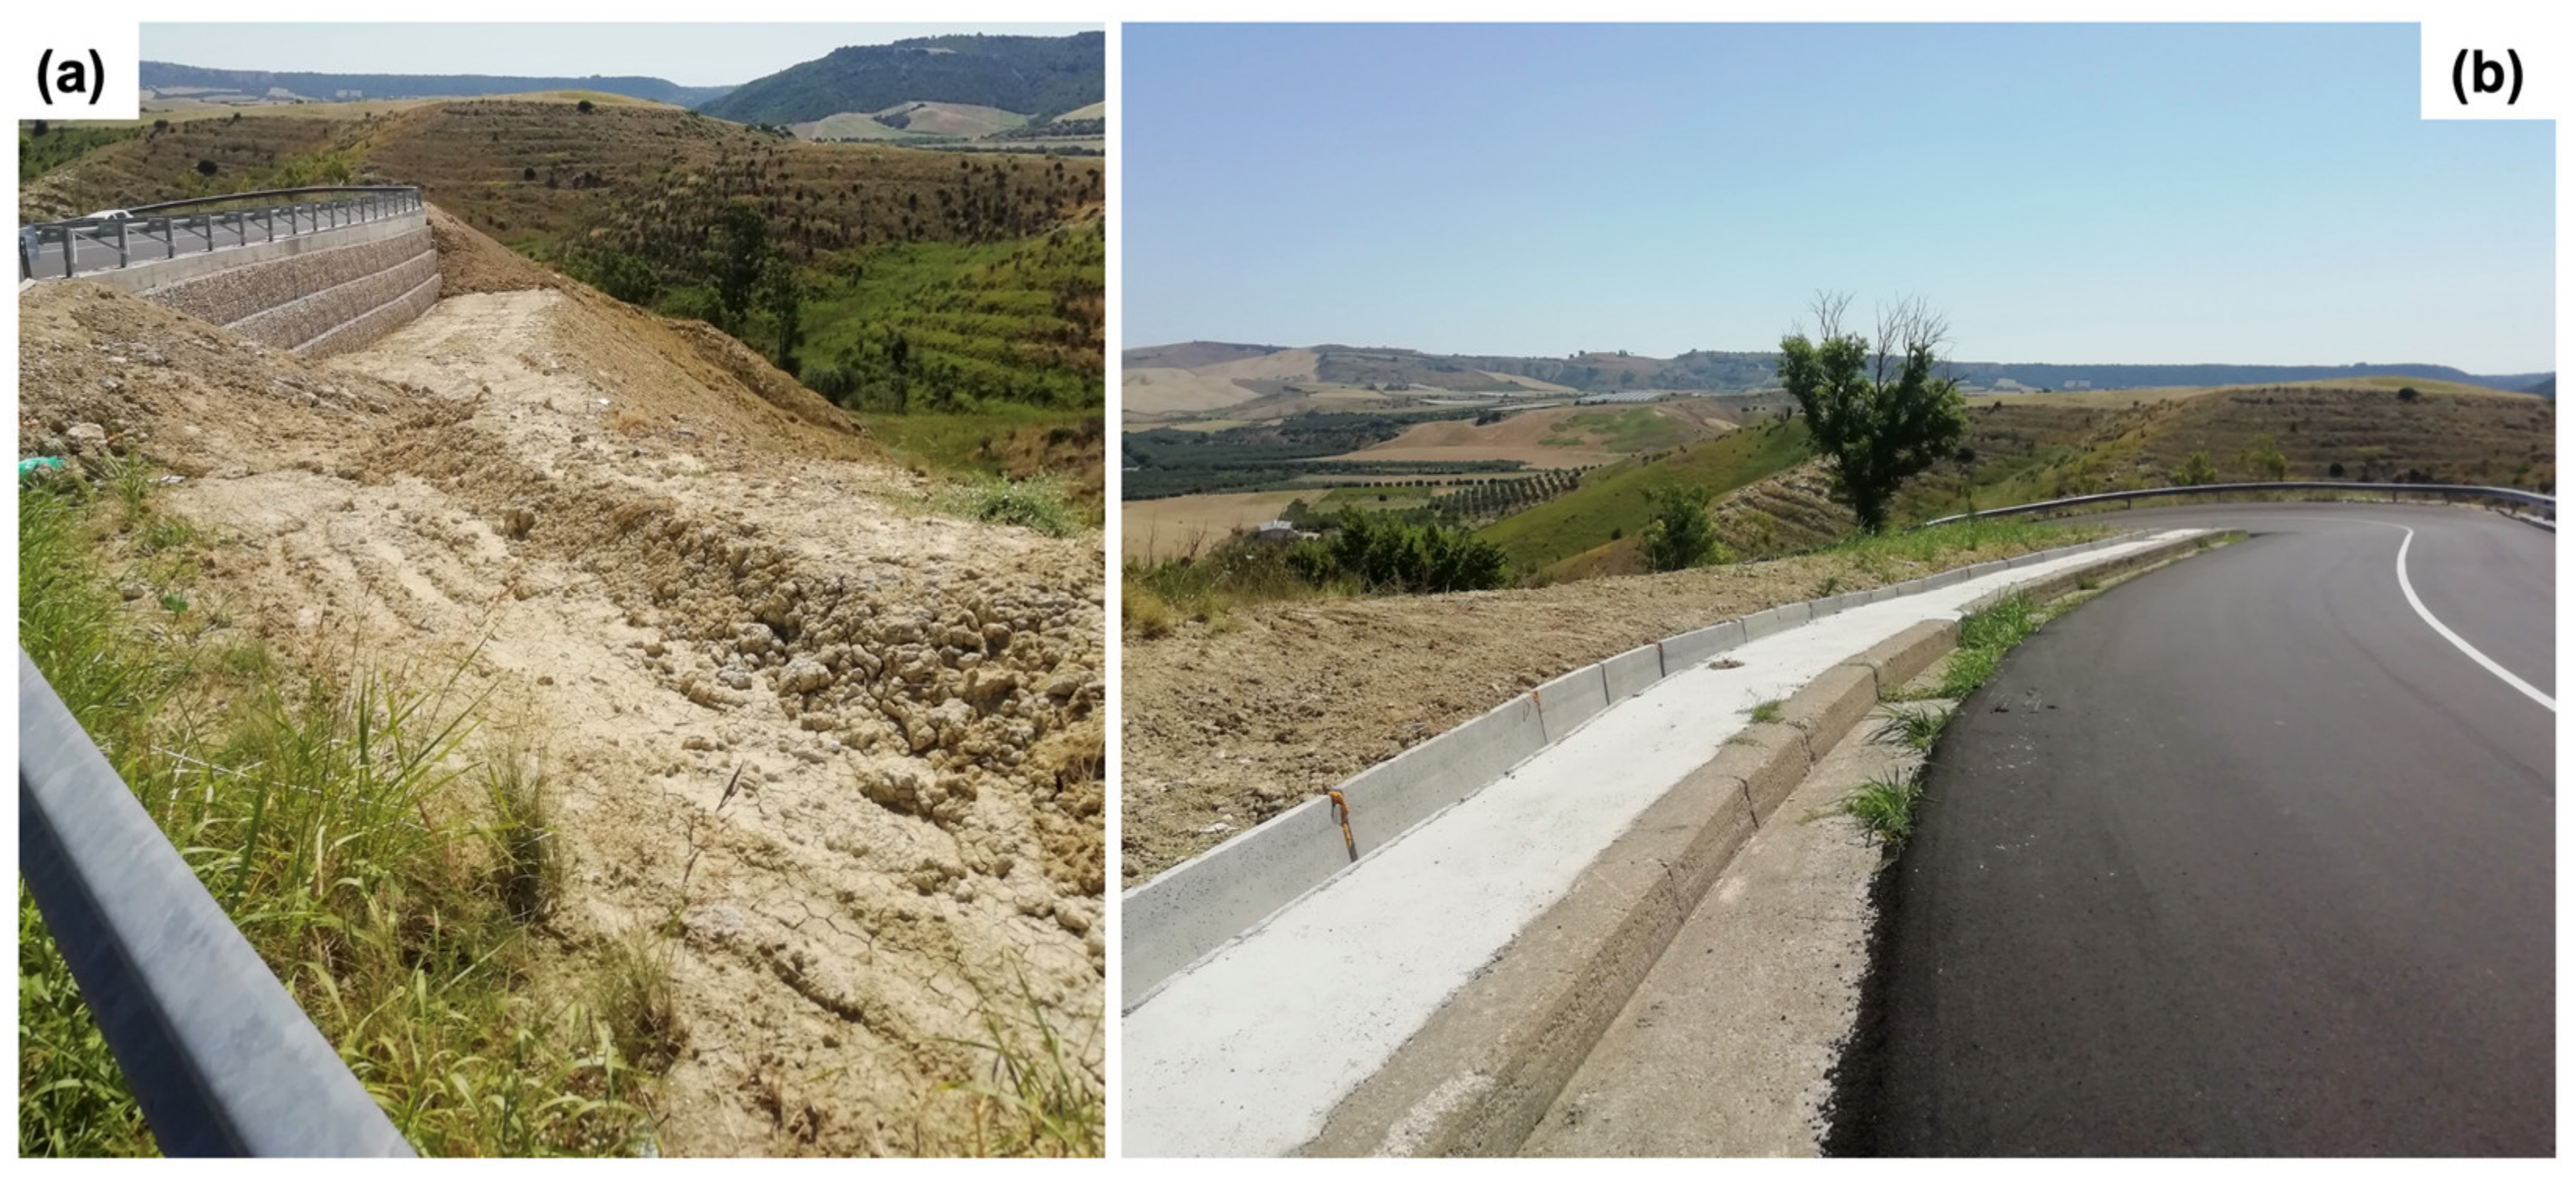
3.1.4. Connecting Road

Figure 6a shows another enlargement of the displacement rate in Figure 2c) over a road section linking the villages of Montescaglioso and Ginosa (the latter located in the Puglia region). The blue targets along the road show displacements with rates ranging between 6 and 10 mm/y, increasing along the LOS direction, which is consistent with a prevailing westward horizontal component of the ground movement. An example of such displacement trends is sketched in Figure 6b, corresponding to the target labeled P1 in Figure 6a. The point exhibits a rather steady upward trend of about 8.5 mm/y.

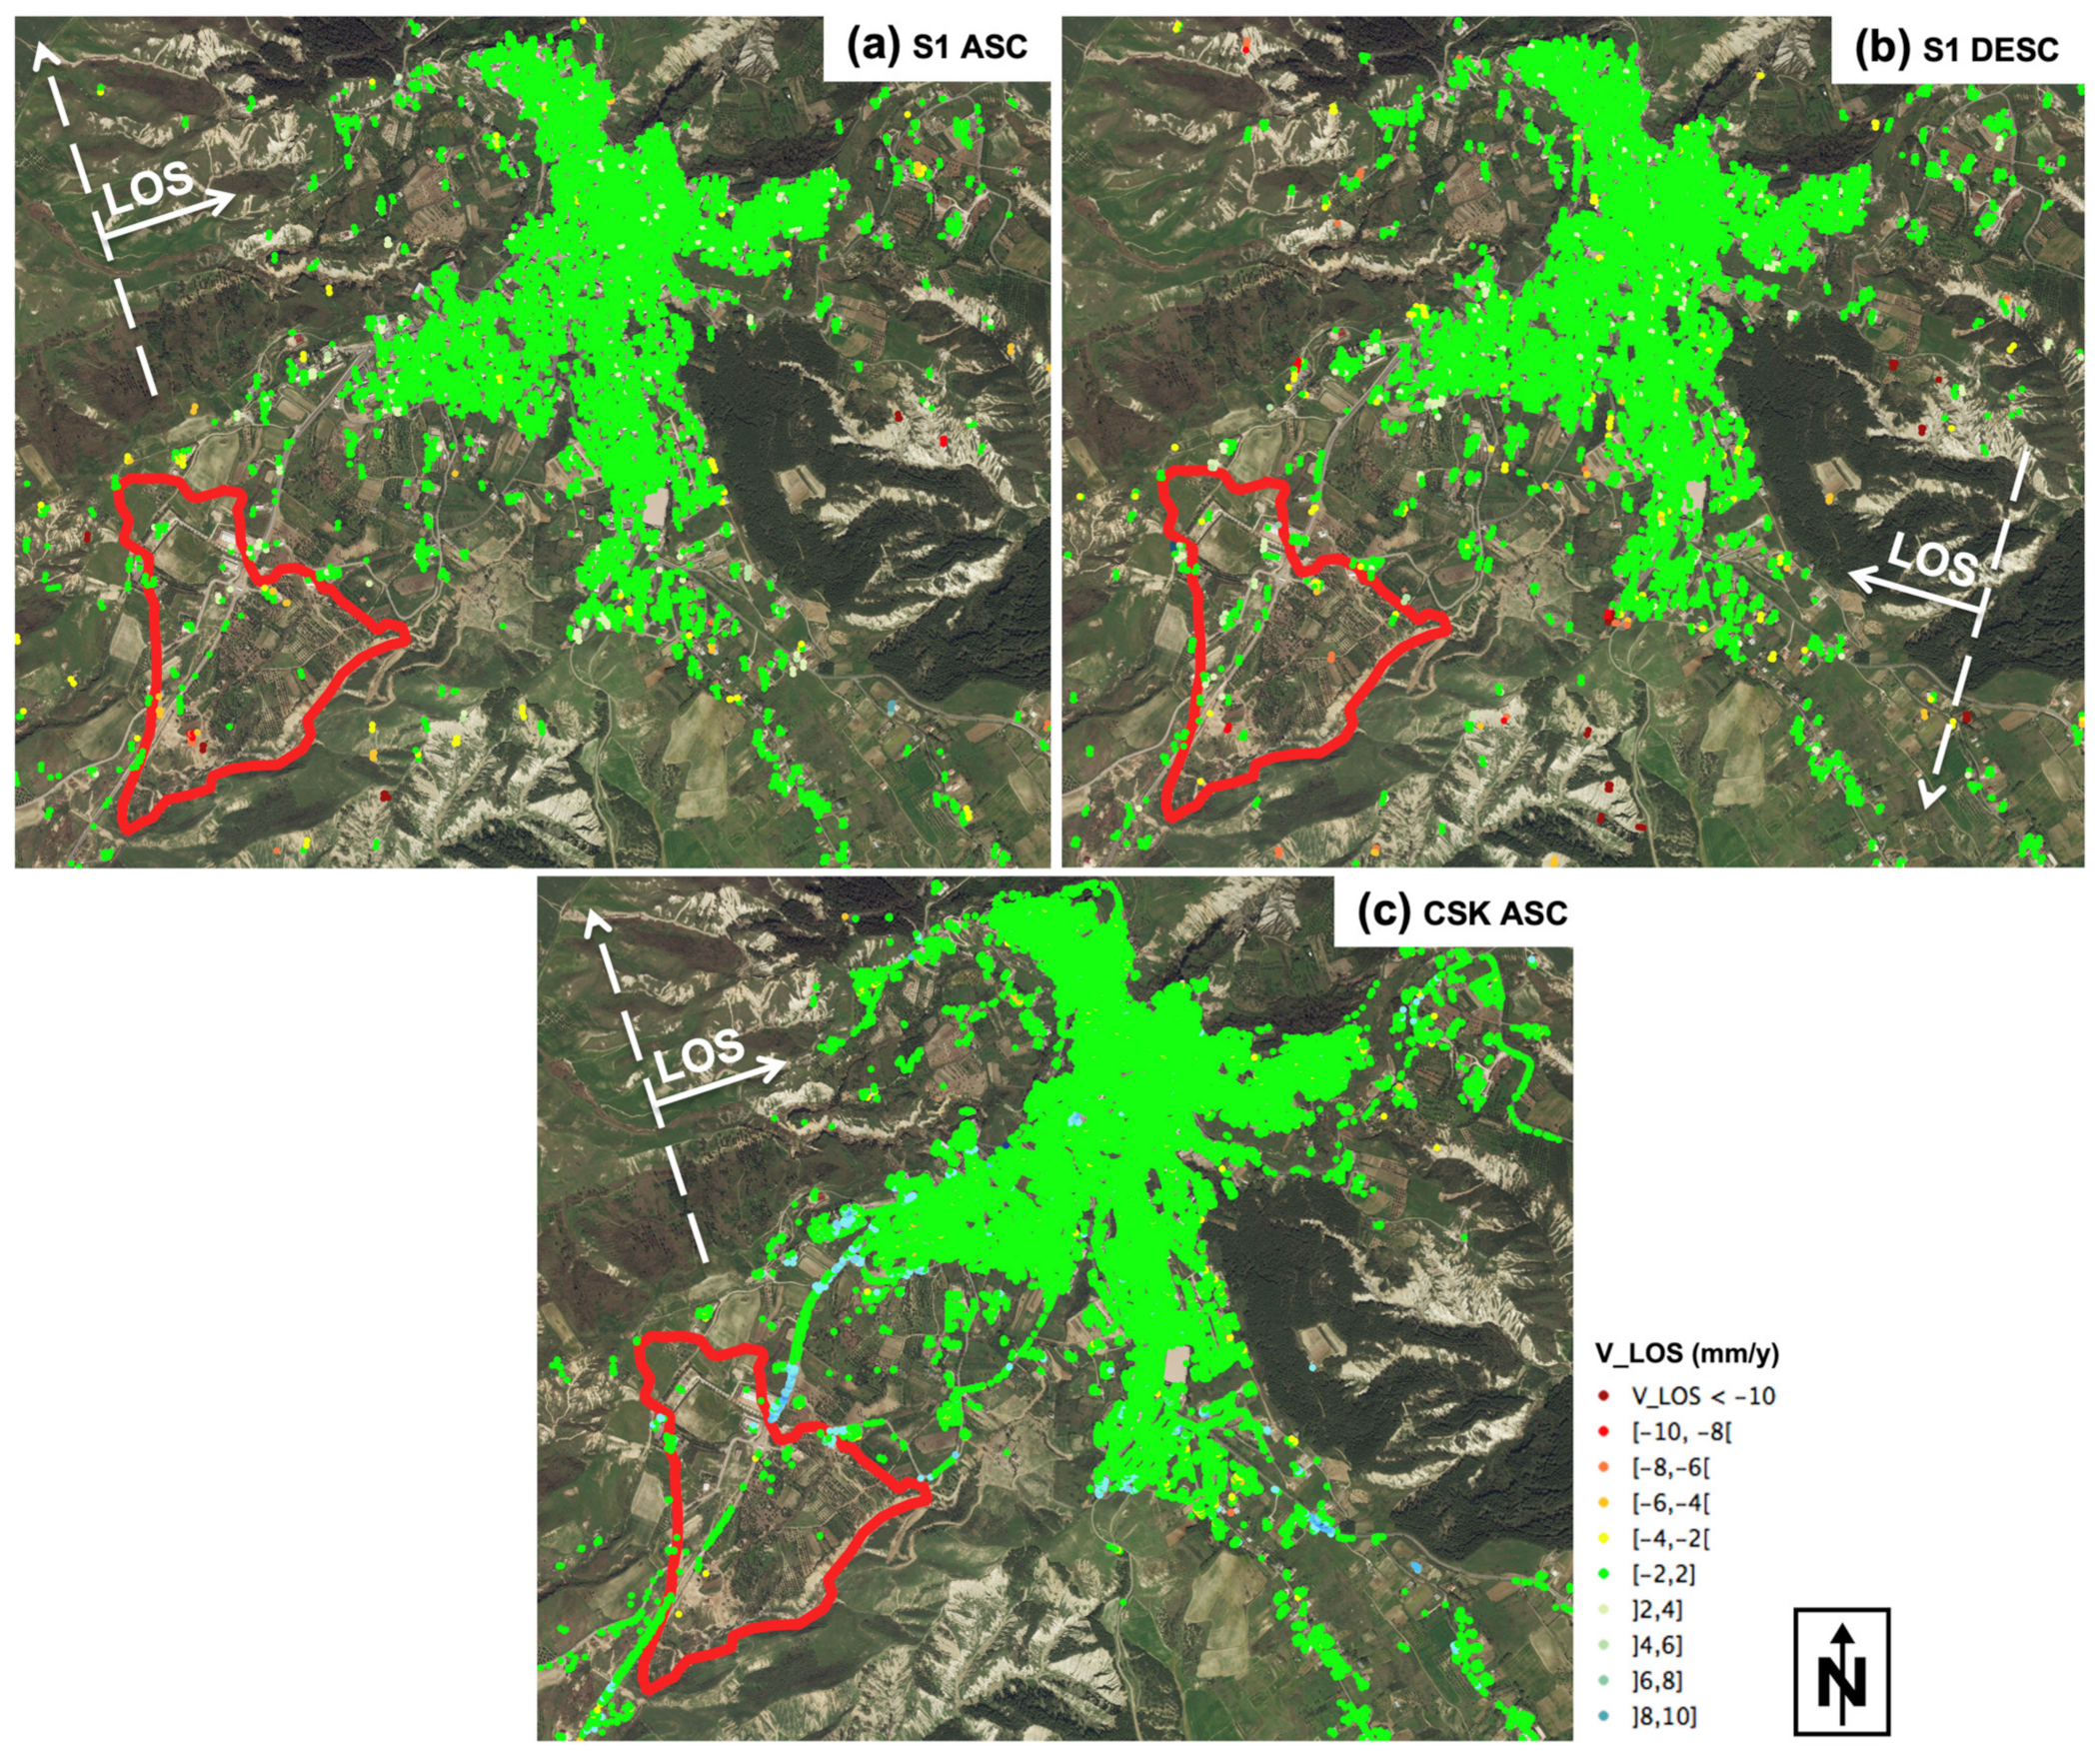
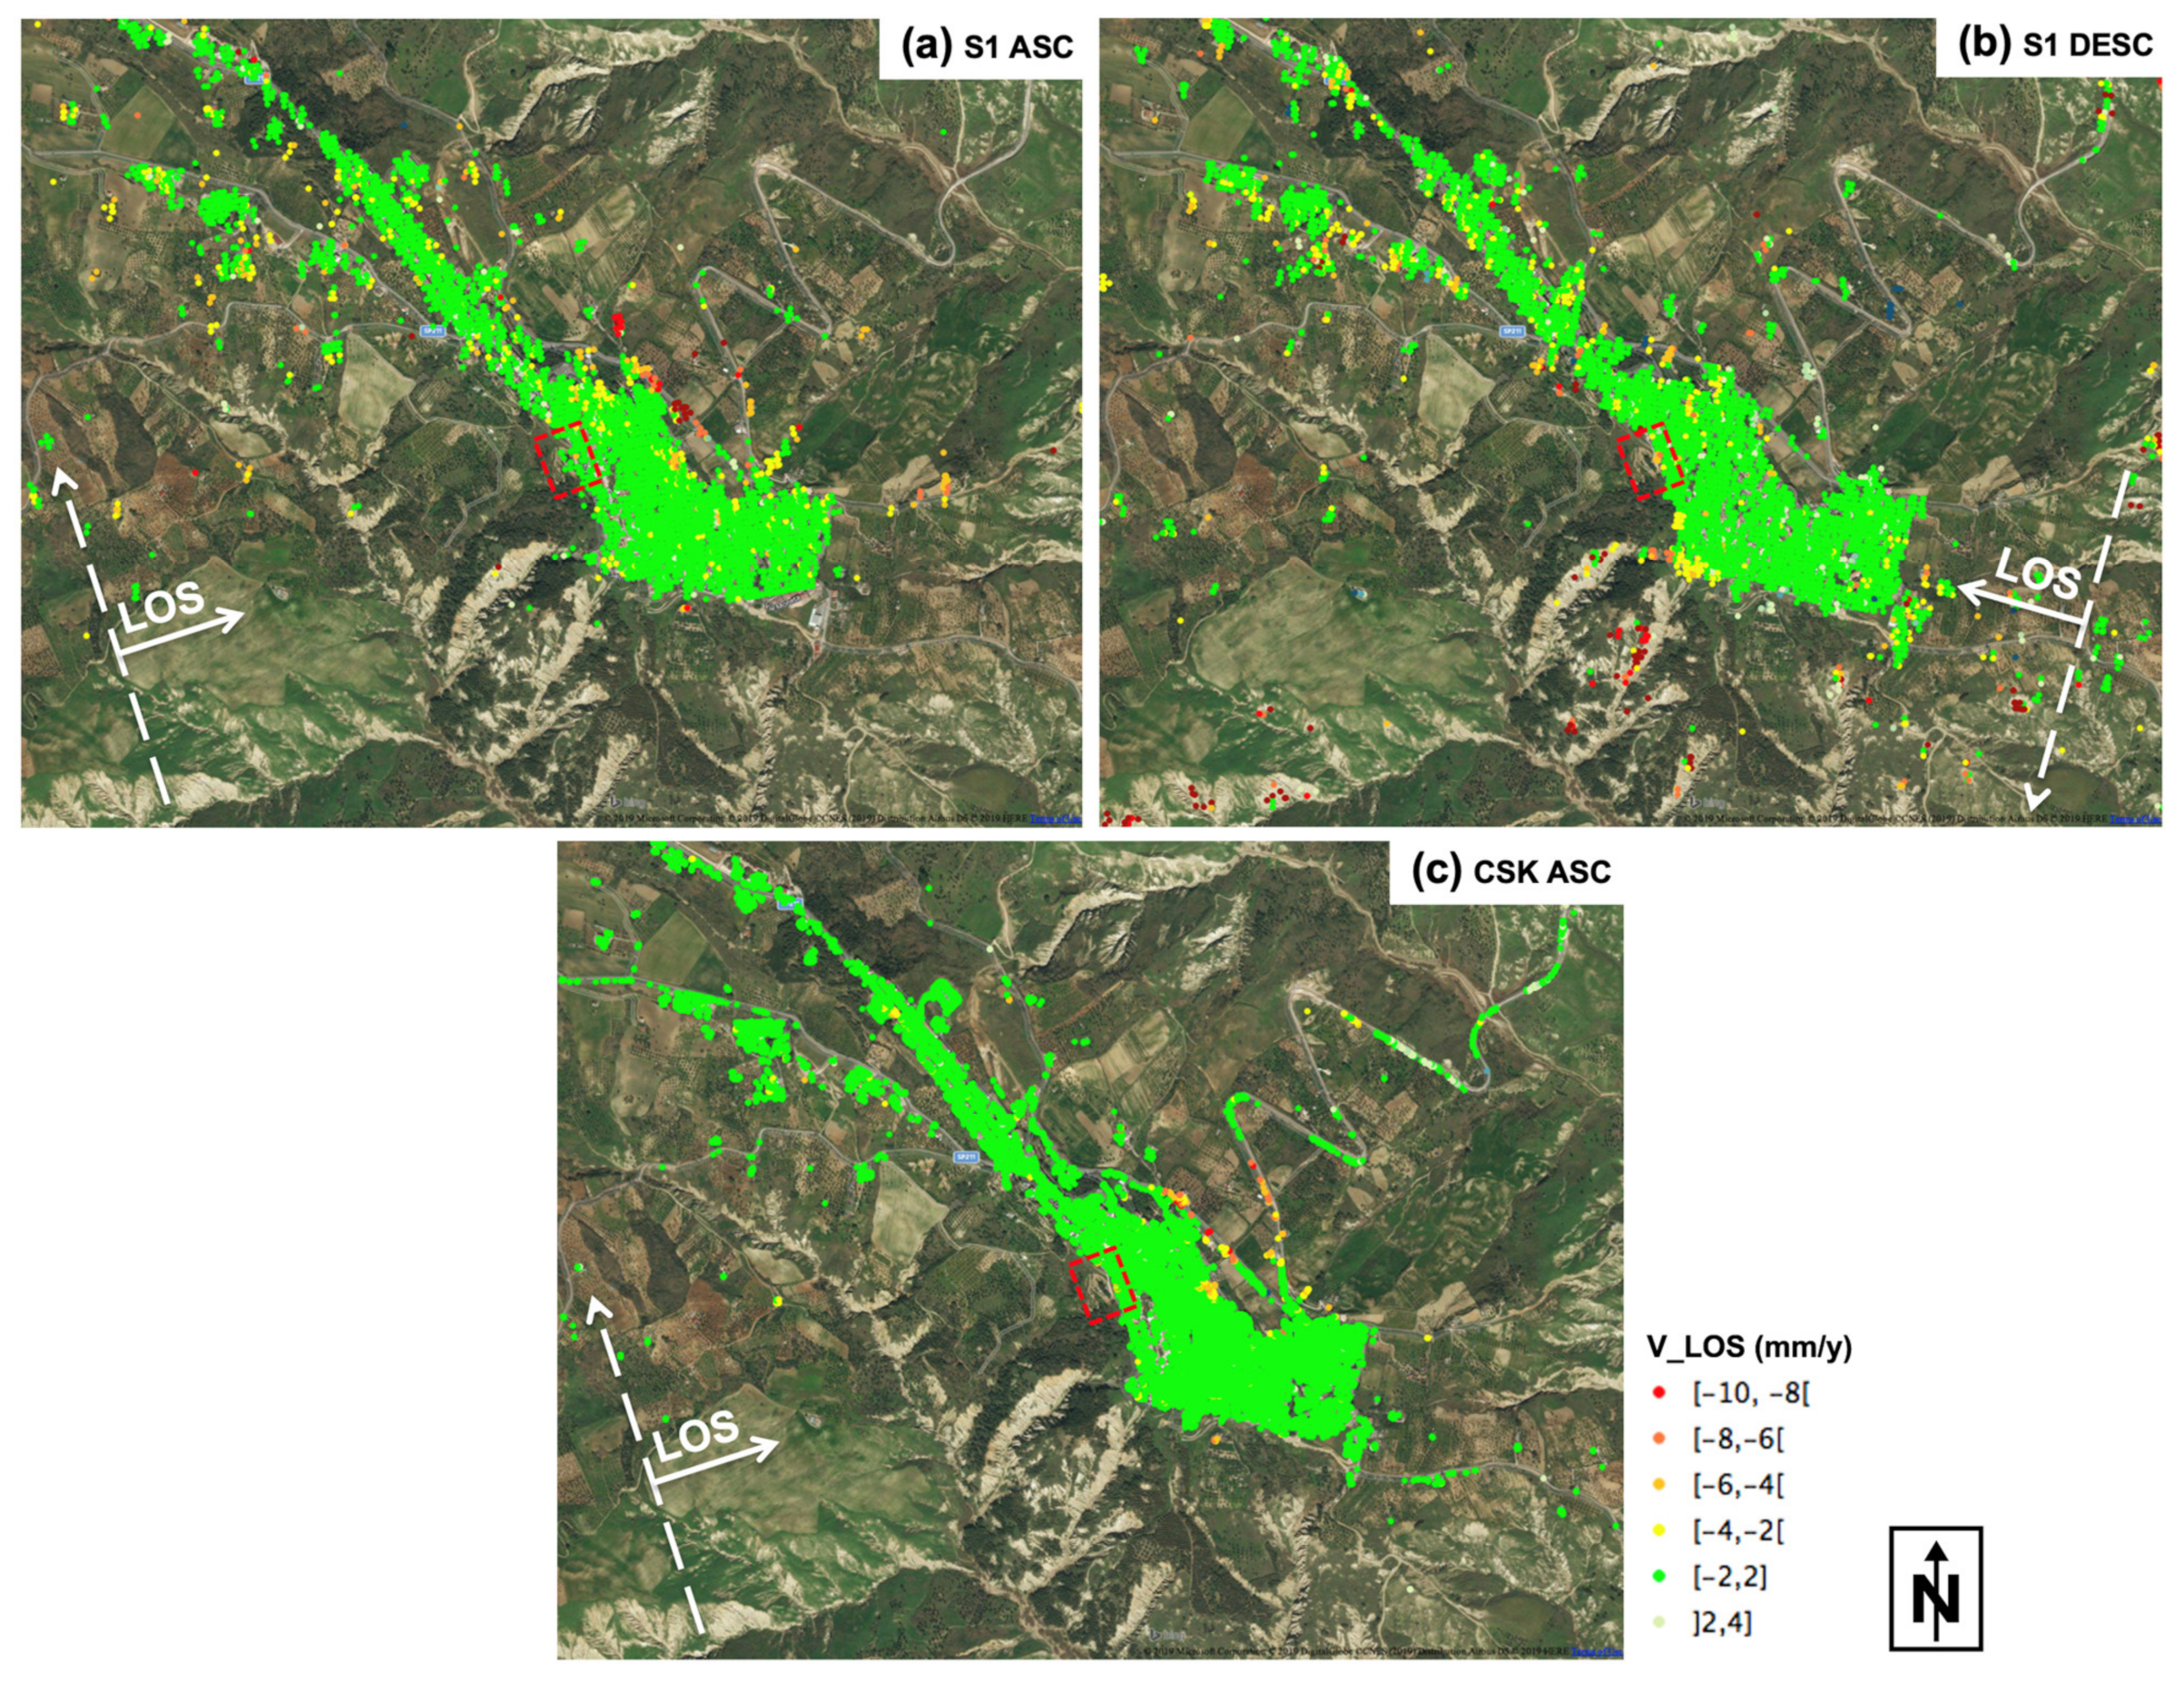
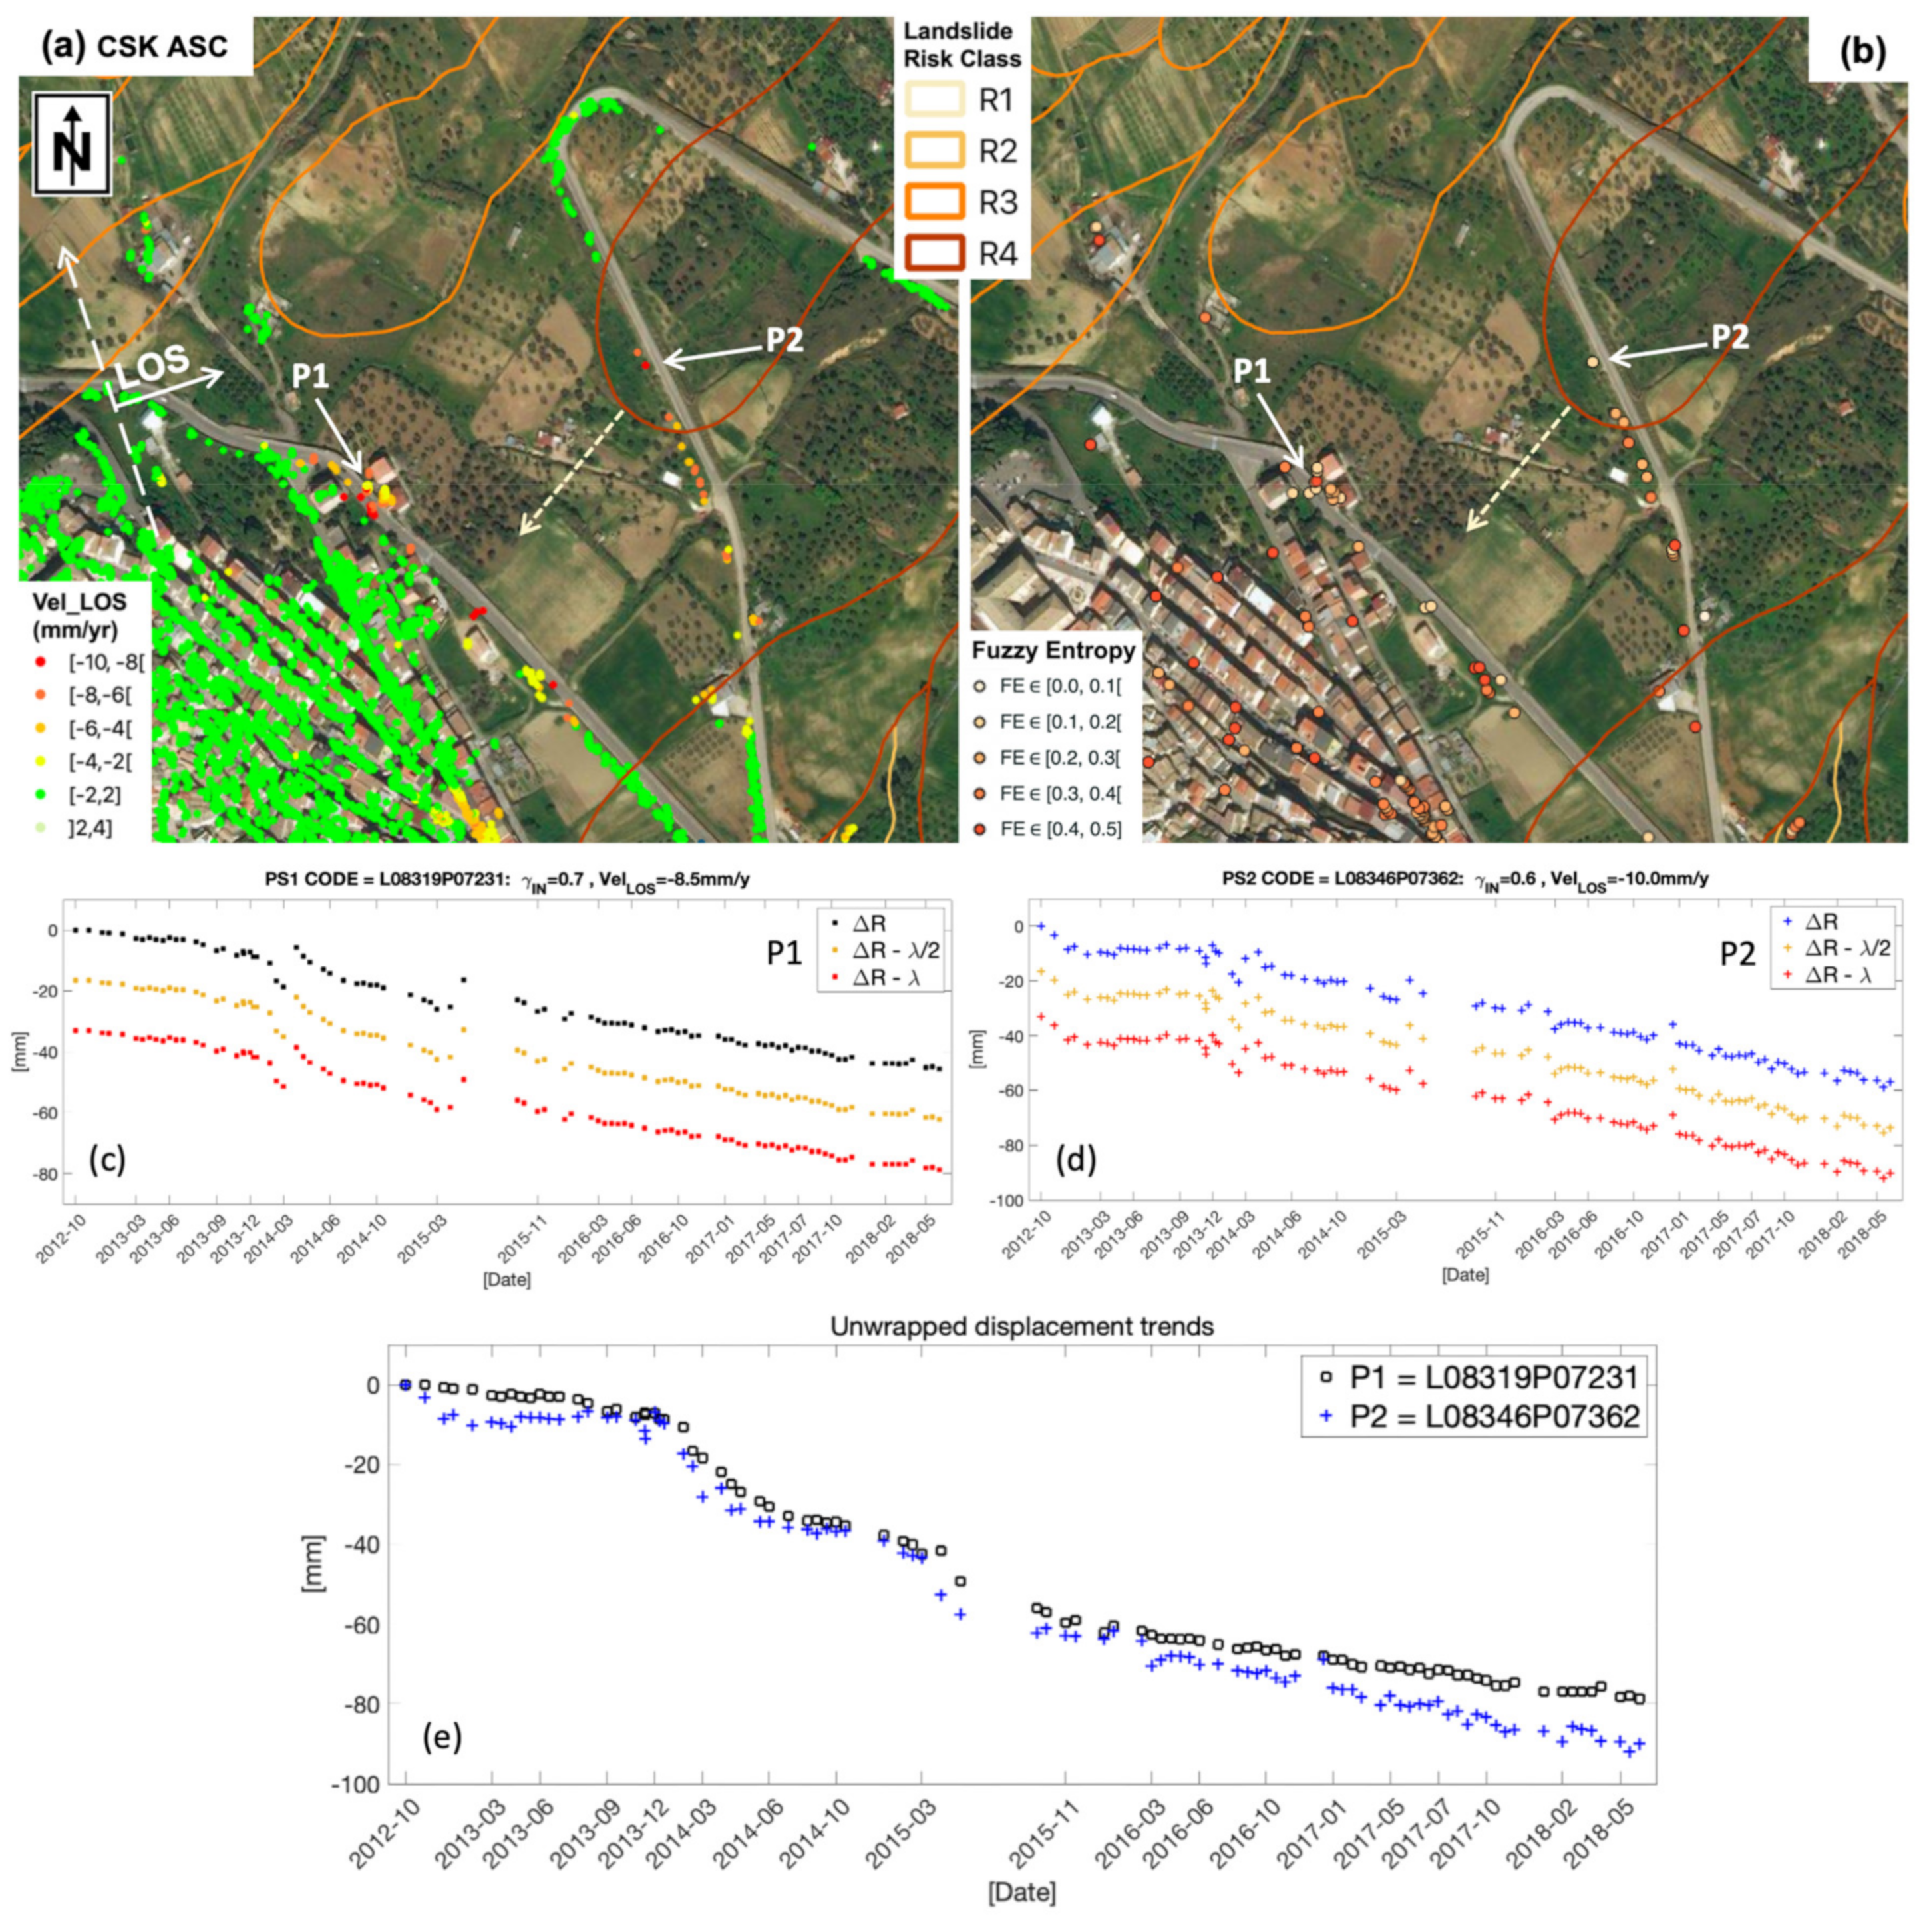
3.2. Pomarico Test Site

Figure 7 shows the displacement maps along the LOS direction derived by MTInSAR processing of S1 ascending (Figure 7a), S1 descending (Figure 7b), and CSK ascending (Figure 7c) datasets over the Pomarico test site. The mean displacement maps are basically in agreement, highlighting a general situation of stable ground conditions with low displacement rates, ranging between −2 and 2 mm/y (green dots), and several local displacements with high rates, reaching in some cases −10 mm/y (yellow to red dots). Both CSK and S1 provide interesting displacement time series with nonlinear trends. However, as in the previous case, CSK appears to detect more stable targets over structures such as buildings and roads with respect to S1. We focused on two different scenarios: (i) pre-event landslide monitoring and (ii) monitoring of an area on the NE side of the village with high local displacements.

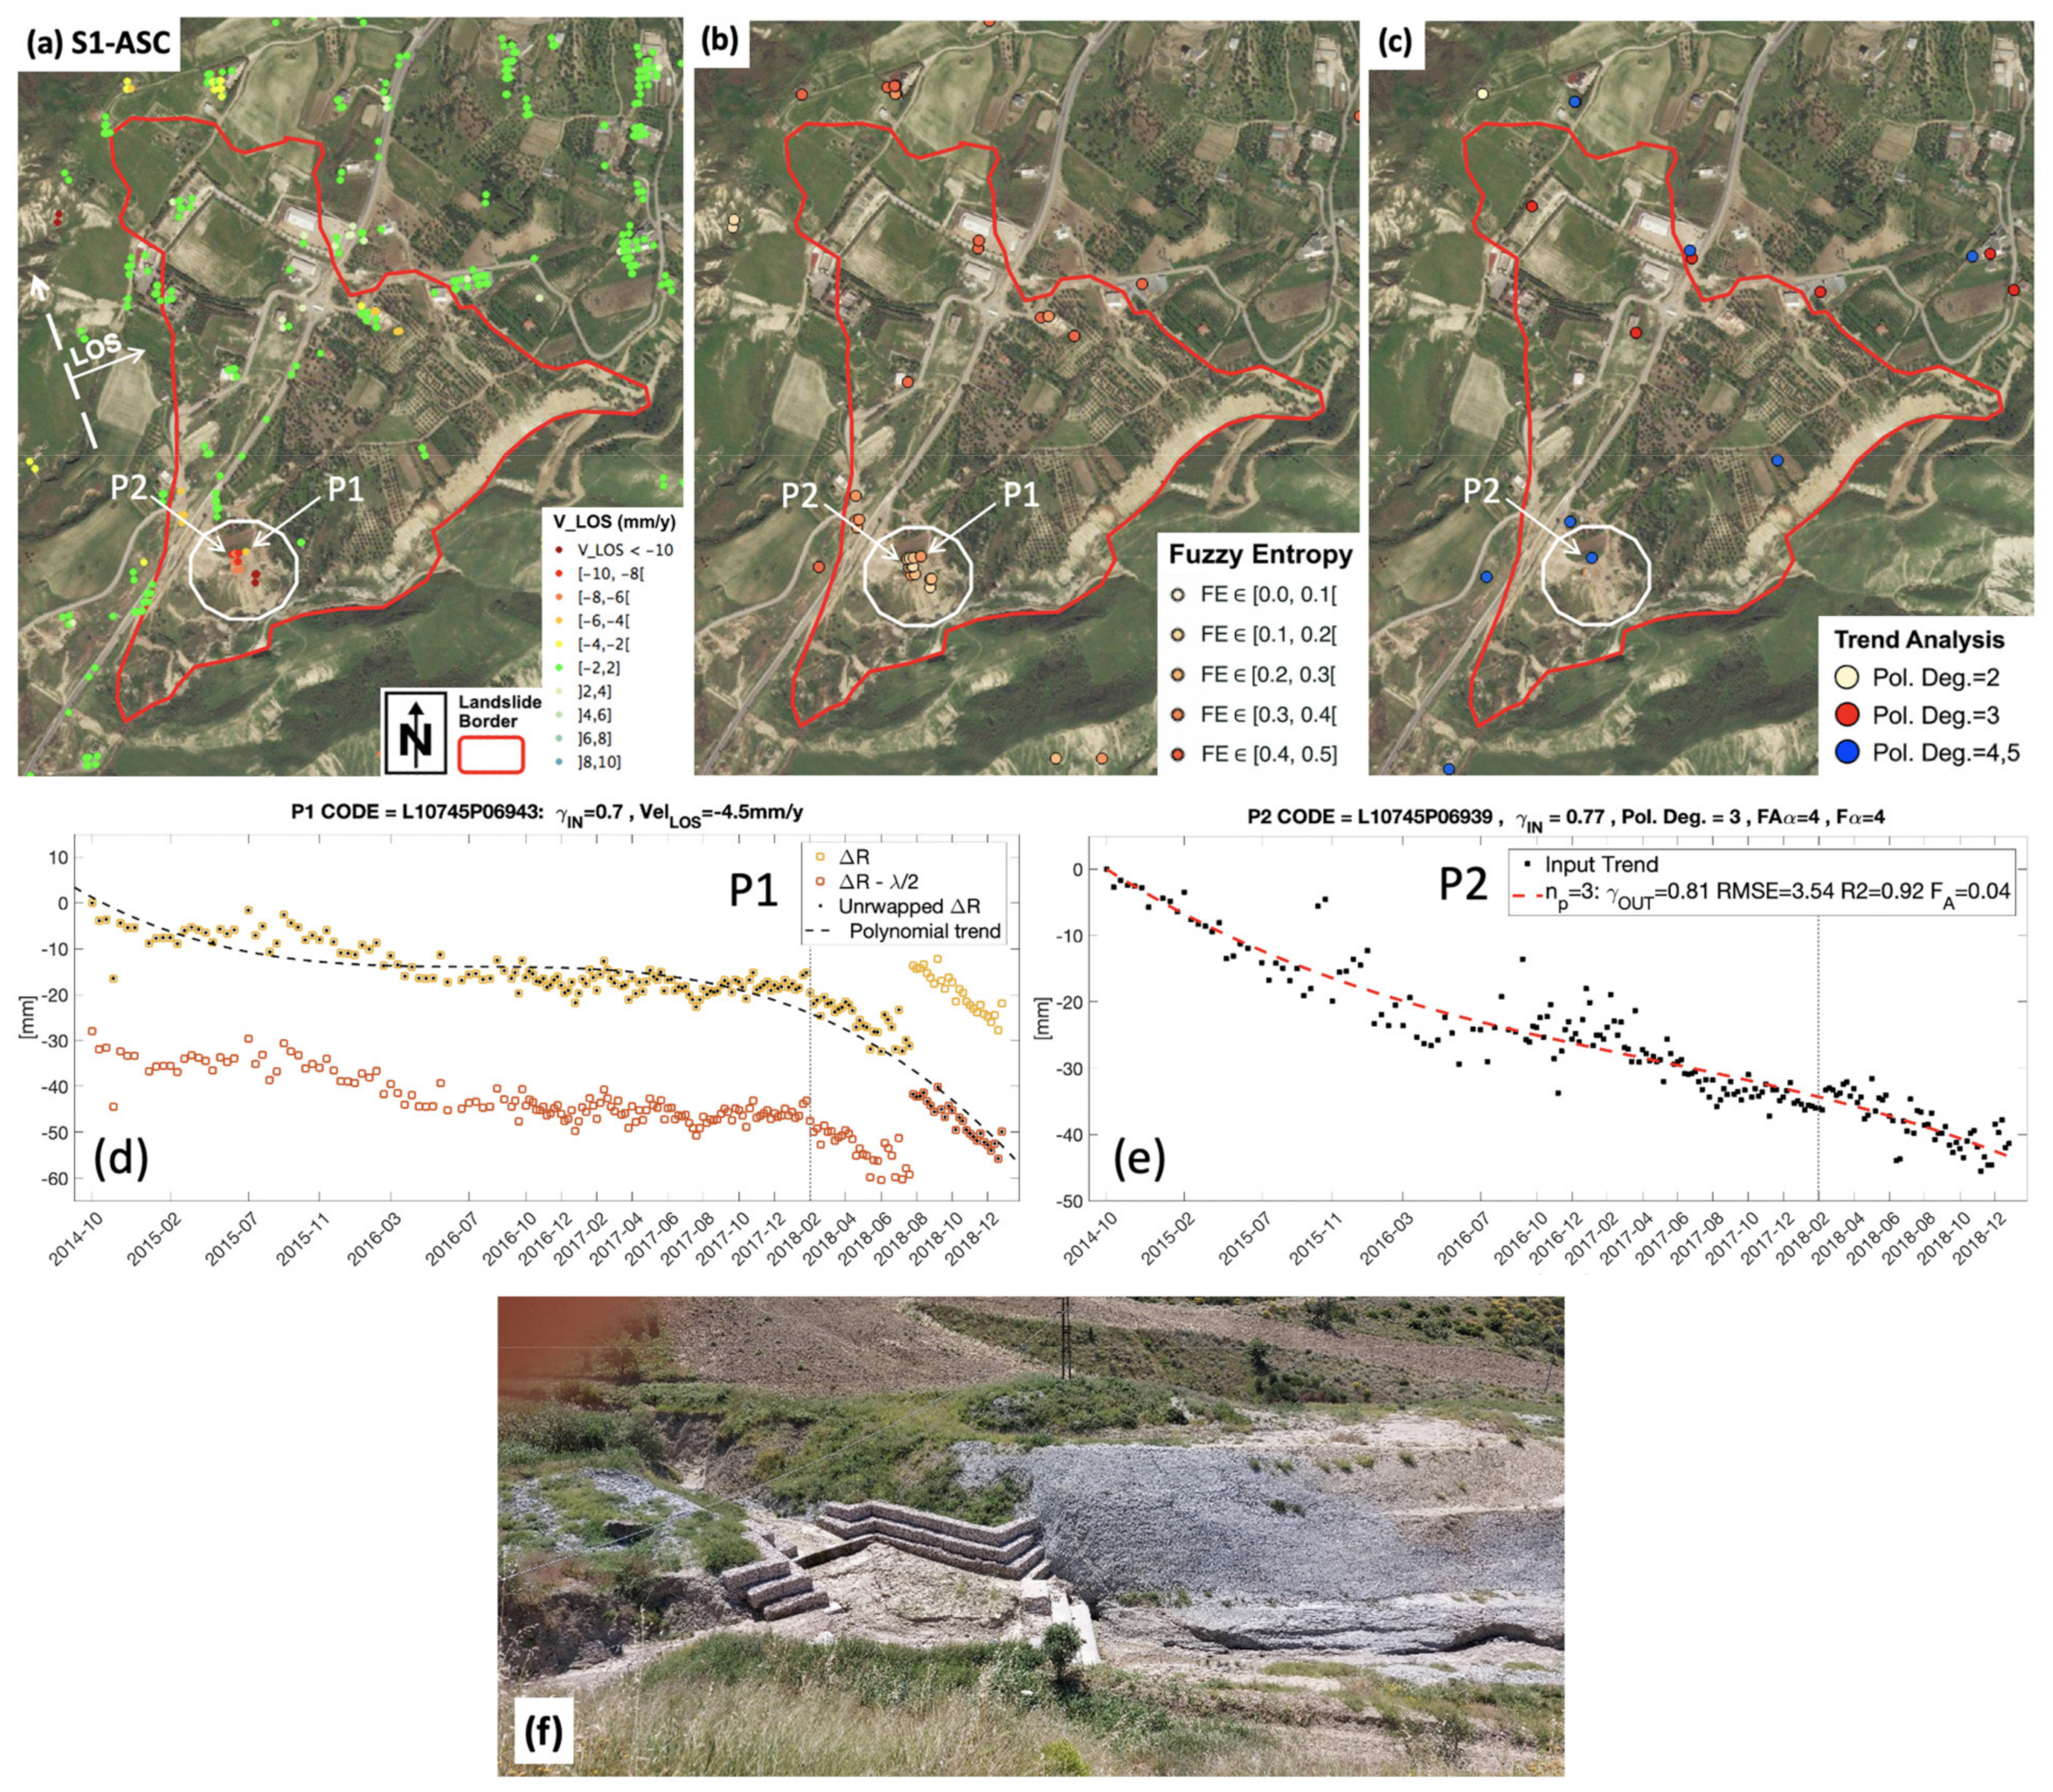
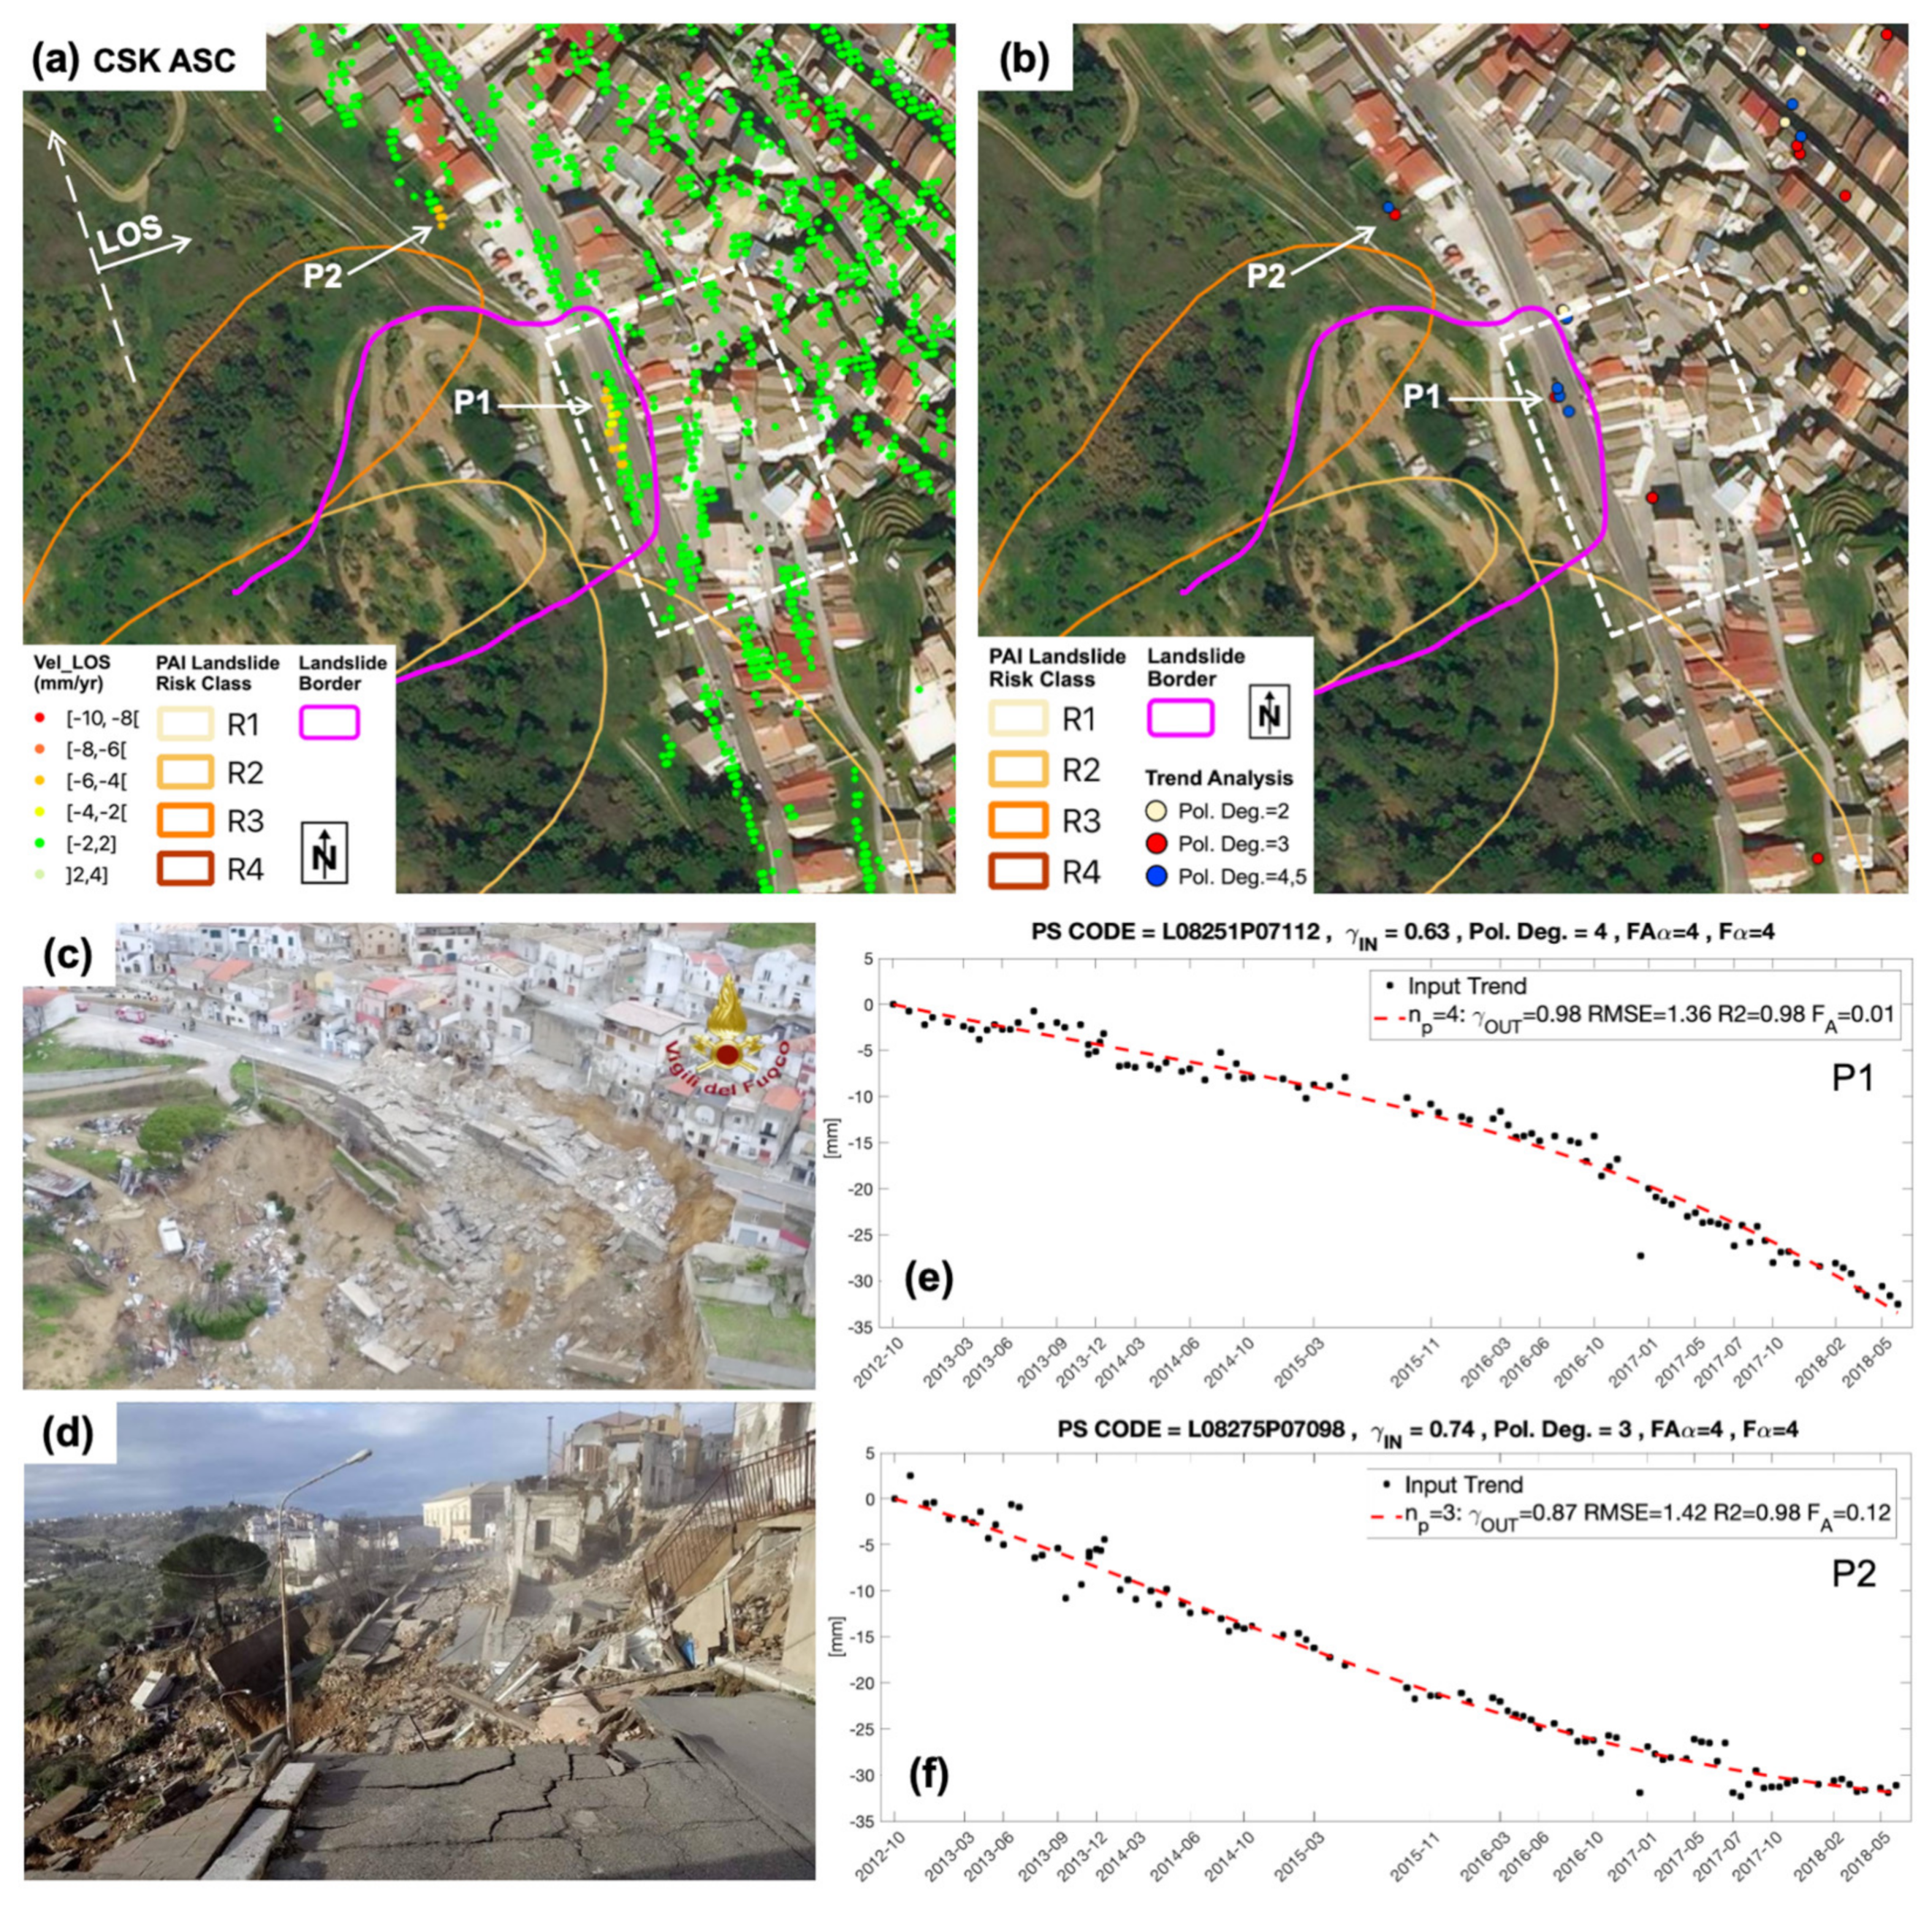
3.2.1. Pre-Event Landslide Monitoring

The Pomarico landslide, delimited by the purple line on the enlarged maps in Figure 8a,b, occurred between 24 and 29 January 2019 after a long rainfall event; it is a retrogressive instability phenomenon that started with the fissures of the cemented cover layer and continued with a destructive evolution [18], which caused the collapse of a portion of the village (Figure 8c,d).
The mean displacement rate map sketched in Figure 8a shows moving targets located close to the landslide area. Figure 8b highlights a few targets selected through the NLTA procedure according to (2) and showing an approximating polynomial degree greater than 1 (nonlinear trend). Two targets labeled as P1 and P2 in the figure are selected as representative of the behavior of the two clusters of targets identified by the NLTA. Their displacement time series are represented by black dots in the plots in Figure 8e,f and Figure 8f, respectively. The dotted red lines in the same panels represent the polynomial curves selected by NLTA for modeling the displacement trends. In both cases, the temporal coherence increases with respect to the initial linear model trend, due to the improved kinematic models.
The selected P1 and P2 targets show displacement time series with opposite behaviors, which are representative of the two clusters of targets located, respectively, inside and outside the landslide: the former shows a linear trend with a rate of about −4.5 mm/y until the end of 2016, then it shows an increased downward linear rate of about −9.6 mm/y; the latter a linear trend with a rate higher than target P1, of about −6.5 mm until the beginning of 2017, then it shows a decrease in the absolute displacement rate, which reaches about −3.1 mm/y.

3.2.2. NE Side Area

Figure 9a shows an enlarged mean LOS displacement map of the CSK ascending dataset over the NE side of the Pomarico village. Targets exhibiting stronger local displacements are aligned on two sections of the road, the former upslope, close to the village, and the latter further downslope. Targets show mean displacement rates ranging between −2 and −10 mm/y (Figure 9a), and the corresponding time series show continuous and linear displacements starting from 2015 (Figure 9c,d).
Figure 9b shows the targets selected through the FE index according to (3). As in the example reported in Section 3.1.1, the FE index allows selecting targets with interesting nonlinear displacement trends, such as those sketched in Figure 9c,d, that refer, respectively, to the targets labeled P1 and P2 in Figure 9b. In both cases, like in the example in Section 3.1.1, the displacement time series are affected by discontinuities due to phase unwrapping errors, which can be corrected by exploring their replicas obtained by subtracting integer multiples of the range of ambiguity ( λ / 2 = 16.5 mm). For example, in Figure 9c, black dots represent the original displacement values of target P1, orange dots represent the displacements obtained by subtracting the range of ambiguity ( λ / 2 ) , which accounts for the first discontinuity occurring around March 2014, and red dots represent the displacements obtained by subtracting twice the range of ambiguity ( λ ), which accounts for the second discontinuity occurring around April 2015. The displacement time series corrected by the phase unwrapping errors are sketched in Figure 9e in black squares for target P1 and blue crosses for target P2. Now the two targets, without discontinuities, show similar nonlinear trends of alternating periods of accelerating and decelerating displacements.

4. Discussion

In this section we discuss the reported examples of: (i) slope pre-failure monitoring on Pomarico landslide: (ii) slope post-failure monitoring on Montescaglioso landslide; and (iii) monitoring of structures (e.g., buildings and roads) affected by instability related to different causes.

4.1. Pre-Failure Monitoring

In the Pomarico village, as mentioned previously, between 25 and 29 January 2019 a complex landslide occurred: the roto-translational movement upslope, attenuated by a pile bulkhead along the roadside, evolved into a downstream earthflow (Figure 8a) [18]. The NLTA used for selecting targets (namely P1 and P2 in Figure 8b) evidenced nonlinear displacement trends related to the landslide event. The time series of the targets falling within the landslide area, in particular target P1 (Figure 8a,e), show continuous displacements. The area was in fact already classified as a medium-risk, R2 area (Figure 8a) in the regional landslide risk map (the regional Hydrogeological Management Plan, or PAI—Piano di Assetto Idrogeologico) by the Basilicata section of the Southern Apennine District Basin Authority [27,28]. Since the end of 2016, there has been an increase in downslope velocity. This may have created a contrast with the high-risk, R3 area (Figure 8a), causing it to decrease in velocity, as demonstrated by the time series of the target P2 (Figure 8f). These temporal trends describe the retrogressive behavior of the landslide, namely the expansion of the instability process beyond the edges of the medium-risk, R2 area (Figure 8a).

4.2. Post-Failure Monitoring

Several independent investigations have been carried out in recent years on the Montescaglioso landslide using different techniques, including LiDAR, SAR Interferometry and Pixel Offset [17,37,38,39,40], which present no major differences from our results. In particular, our analysis confirms the results of [17]: the landslide area shows a situation of substantial ground stability with only local displacements (Figure 3a). In this particular case, the FE index was able to recognize coherent targets affected by phase unwrapping errors. After performing proper corrections, these targets show interesting nonlinear continuous displacement trends that can be further analyzed using the NLTA. These displacements (targets in the area bordered with the white line in Figure 3a) are consistent with a prevailing vertical component, probably due to erosion phenomena of the Capoiazzo stream scarp. This behavior is confirmed by the displacement time series, which show a generally continuous trend. After a local survey, it was possible to identify the most likely cause of the displacement rate change in the first half of the 2018, shown in the displacement time series of P1 and P2 targets (Figure 3d,e): the beginning of major earthmoving works for the reconstruction of the Capoiazzo streambed (Figure 3f).

4.3. Displacement Evolution Monitoring

The cemetery area in the Montescaglioso village is located on the top of a hill, a residual strip of marine terraces, which consist of conglomerates and sands. Downslope of the area, monoliths of inclined cemented conglomerates highlight the recent instability of the terrace edges. Local displacements identified with MTInSAR datasets over this test site concern the NW slope of the hill. The direction of displacements is consistent with a prevailing west horizontal component, which is also confirmed by local surveys (Figure 10b–d).
The cause of these displacements is to be found downslope of the NW slope, where satellite images (Figure 10e) show a continuous erosion of the slope toe. Moreover, Figure 10e is valuable for interpreting the temporal trend of the P1 targets (Figure 4b): (i) at the end of 2013 there was an increase in displacement trends, probably linked to the same heavy rainfall that triggered the Montescaglioso landslide; (ii) towards the end of 2014, a decrease in velocity occurred, attributed to some earthworks shown in Figure 10e (2015); (iii) the erosion subsequently continued, as the trend and Figure 10e (2019) show. These phenomena, which were also confirmed by local surveys, may evolve in the future, causing a landslide.
The NE side of Pomarico village is an area affected by various instability phenomena, mostly retrogressive roto-translational phenomena due to the presence of cemented cover layers [29,41]. The displacements identified by the CSK ascending dataset in this test site (Figure 9a) were also verified by local surveys. Along the road, which runs alongside the village, there are cracks and damaged structures (Figure 11) indicating continuous displacements. Again, in this case the FE index was able to recognize targets affected by phase unwrapping errors, that were corrected in order to derive reliable displacement time series. The analysis of these targets, characterized by a direction with a horizontal and downwards component (Figure 9a) and by similar trends of displacement time series (Figure 9e), suggests a retrogressive behavior of the instability process identified by the very-high-risk, R4 area. This hypothesis is confirmed by the cracks on the retaining walls and on the roads (Figure 11b,c) along the white dotted arrow in Figure 9a, detected during the local survey. This instability process, which is slowly expanding upslope, may cause further damage in the future and eventually evolve into a landslide.

4.4. Structure Instabilities

The analysis of the MTInSAR time series was also carried out on two structures subject to already known instability phenomena, located in the Montescaglioso village.
In the case of the structurally damaged buildings (Figure 5), the cause of the displacements is due to the swelling phenomenon of the sub-Apennine clays [42], which outcrop in this area. The slope of the hill was reshaped and excavated for the building construction. The lightening of the underlying clay, also exposed to rainwater, has caused the swelling phenomenon with structural consequences on the building, such as differential settlements and consequent cracking (Figure 5d). Swelling, which is a very slow phenomenon that completely exhausts over many years, continued to cause small and constant displacements, as shown by the evolution of the crack pattern (Figure 5e) and displacement time series of the target labeled P1 in Figure 5b. Furthermore, the phenomenon affects the whole area around the hill, where the time series show trends consistent with an uplift, as shown by the trend of the target labeled P2 (Figure 5c). This analysis highlights the high sensitivity of the methodology, already observed in other sites subject to the swelling phenomenon, although in profoundly different contexts [43].
In the case of the road section in Figure 6, the analysis of the MTInSAR time series has detected continuous surface displacements, which have caused landslips (Figure 12a). These require continuous maintenance interventions (Figure 12b), as the potential evolution of the instability phenomenon represents both a danger for users and a problem for land management. Certainly, the study of MTInSAR time series is valuable for monitoring the evolution of instability phenomena along the road corridors. Furthermore, the combination of these analyses with vulnerability maps, such as those presented in [44], may provide support to regional planning by identifying the priorities for maintenance interventions. This approach becomes essential in areas characterized by distant urban centers and few connecting roads in a hilly environment, which is common in many regions.

4.5. Final Comments

At present, MTInSAR products may consist of millions of targets covering a large area, each associated with time series covering long time periods (potentially more than 20 years). In order to fully exploit such products, methods are needed for the automatic identification of targets with nonlinear displacement time series that may be relevant for ground phenomena such as reactivation/deactivation phases of known landslides. We adopted two approaches recently introduced in the literature, one based on the fuzzy entropy indicator, the other performing nonlinear trend analysis based on the Fisher statistics. The FE index was able to recognize coherent targets affected by phase unwrapping errors, which should be corrected to provide reliable displacement time series to be further analyzed. The NLTA was used for classifying targets according to the optimal degree of a polynomial function describing the displacement trend. This allowed selecting targets showing nonlinear displacement trends related to the several ground and structure instabilities as pre-failure, post-failure, and evolution signals. Thus, both approaches were very effective in supporting the analysis of ground displacements provided by MTInSAR, since they helped focusing on a smaller set of coherent targets identifying areas or structures on the ground that deserved further detailed geotechnical investigations. Moreover, the joint exploitation of MTInSAR datasets acquired at different wavelengths, resolutions, and revisit times provided valuable insights, with CSK more effective over man-made structures, and S1 over outcrops.
The analysis of pre-failure signals related to the Pomarico landslide showed that CSK has been able to capture better the building deformations preceding the landslide and the collapse. This allowed the understanding of the phenomenon evolution, highlighting a change in velocities that occurred two years before the collapse. This variation probably influenced the dynamics of the landslide leading to the collapse of an area considered to be at a medium-risk level by the regional landslide risk map. MTInSAR datasets also provided valuable results in the monitoring of the displacement evolution. CSK has been able to capture the building and structure deformations both in the Montescaglioso cemetery area and in the NE area of the Pomarico village. Displacement trends of selected targets have been confirmed in both test sites by on-site surveys. The analysis of the signals in the Montescaglioso cemetery area showed the displacement evolution of a site not included in the regional landslide risk map but of interest for local authorities and already affected by restoration works in recent years. The analysis of the NE side of the Pomarico village confirmed the very-high-risk R4 level of the area and showed the retrogressive evolution of the phenomenon, expanding beyond the borders currently established by the regional landslide risk map. These results clearly confirm the valuable use of MTInSAR products as a tool that is additional to the established techniques for studying the dynamics of instability phenomena and their evolution. The analysis of MTInSAR-based displacement time series, possibly performed though ad hoc automated procedures, can provide very useful information for long-term monitoring, management, and risk assessment at the regional level, when combined with planning tools such as the PAI.
The better sensitivity of CSK to capture building and structure deformations was confirmed by the analysis of structures with instability signals, i.e., the building and the road connection in the Montescaglioso village. In the first case, the signal analysis described a very complex phenomenon, due to clay swelling, which led to the evacuation of the building. In the second case, the analysis detected continuous surface displacements that require continuous maintenance interventions. Both cases represent examples of how the analysis of MTInSAR products can support the instability monitoring even at a local level. In particular, the first case concerns the application to slow phenomena extended over time, and shows the potential of the MTInSAR displacement time series analysis for investigating the behavior of structures subjected to yielding (e.g., buildings, bridges, viaducts). It can be a useful tool in planning maintenance activities, for instance, by supporting local authorities in identifying the structures that require timely technical inspections.
The analysis of post-failure signals related to the Montescaglioso landslide showed that S1 provided useful indications within the Montescaglioso landslide body. The selected trends confirmed the stability of the landslide area with some local displacements due to restoration works. In this case, the value of the MTInSAR displacement time series analysis emerged in the assessment phase of post-landslide stability, resulting in a useful support tool in the planning of safety measures in landslide areas.

5. Conclusions

This work was devoted to the exploration of long MTInSAR displacement time series derived from both CSK and S1 for investigating ground instabilities related, in particular, to landslide events. In fact, in order to fully exploit the information content of MTInSAR products covering long time periods, it is crucial to analyze not only the mean rate of displacements, but also their full time series, looking for signals related to the ground phenomena of interest that can be also highly non-linear. Examples are periodic signals related to structural thermal oscillations or seasonal ground subsidence, in addition to high-rate and non-linear trends that characterize the warning signals related to landslides or the pre-failure of artificial infrastructures. However, this detailed analysis is often hindered by the large number of coherent targets (up to millions) required to be inspected by expert users to recognize different signal components and also possible artifacts affecting the MTInSAR products, such as, for instance, those related to phase unwrapping errors.
In the present work the displacement time series analysis was supported by automated procedures recently developed for identifying targets with peculiar, nonlinear signals, one based on fuzzy entropy, and the other performing nonlinear trend analysis based on the Fisher statistics. This allowed the focus on a smaller set of coherent targets showing non-linear displacements and the identification of trends affected by residual unwrapping errors.
We investigated the ground stability of two hilly villages located in the Southern Italian Apennines, namely the towns of Montescaglioso and Pomarico, where landslides occurred in the recent past, causing damage to houses, commercial buildings, and infrastructures. Specifically, we presented an example of slope pre-failure monitoring on the Pomarico landslide, an example of slope post-failure monitoring on the Montescaglioso landslide, and a few examples of buildings and roads affected by instability related to different causes (soil swelling, for example). The analysis of MTInSAR displacement time series showed that the joint exploitation of different MTInSAR datasets provides valuable information about the ground instabilities, with CSK more effective over man-made structures, and S1 over outcrops.
These results once more confirm the potential role of MTInSAR technology in supporting both regional and local civil protection organizations in all phases of risk management: identification, analysis and monitoring, assessment, and mitigation. To achieve this aim, it is very important that MTInSAR datasets are regularly acquired over long time periods with different wavelengths and acquisition modes, and to perform detailed analysis of displacement time series through reliable and automated procedures. Finally, despite the potential of both FE and NLTA in selecting reliable targets and characterizing their temporal behavior, an operational service devoted to slope instability early warning still needs more development. In particular, concerning the time series analysis, the NLTA should be followed by specific processing steps aimed, for instance, at deriving the time corresponding to a breakpoint [33], at forecasting future displacement behavior [45], and at predicting failure time for landslides [46]. The development of these processing steps is also the subject of ongoing research by exploring machine learning techniques.

Author Contributions

Conceptualization, F.B. and I.A.; methodology, F.B., A.R. and G.P.; investigation, I.A. and G.S.; formal analysis, F.B.; resources and software, R.N. and D.O.N.; validation, F.B., I.A. and G.S.; writing—original draft preparation, F.B. and I.A.; writing—review and editing, A.R., R.N., D.O.N. and G.S. All authors have read and agreed to the published version of the manuscript.

Funding

This work was supported by the Italian Ministry of Education, University and Research, D.D. 2261 del 6.9.2018, Programma Operativo Nazionale Ricerca e Innovazione (PON R&I) 2014–2020 under Project OT4CLIMA (ID ARS01_00405).

Acknowledgments

The authors thank GAP srl and Planetek Italia srl for providing MTInSAR time series through the Rheticus® platform. The Sentinel-1 data were provided through the Copernicus Program of the European Union. Project carried out using CSK® Products, © of the Italian Space Agency (ASI), delivered under a license to use by ASI. Finally, the authors thank M. Mottola for her support.

Conflicts of Interest

The authors declare no conflict of interest.

References

  1. Crosetto, M.; Monserrat, O.; Cuevas-González, M.; Devanthéry, N.; Crippa, B. Persistent Scatterer Interferometry: A review. ISPRS J. Photogramm. Remote Sens. 2015, 115, 78–89. [Google Scholar] [CrossRef] [Green Version]
  2. Singh Virk, A.; Singh, A.; Mittal, S.K. Advanced MT-InSAR Landslide Monitoring: Methods and Trends. J. Remote Sens. GIS 2018, 7, 1–6. [Google Scholar] [CrossRef]
  3. Zhao, C.; Lu, Z. Remote Sensing of Landslides—A Review. Remote Sens. 2018, 10, 279. [Google Scholar] [CrossRef] [Green Version]
  4. Wasowski, J.; Bovenga, F. Remote Sensing of Landslide Motion with Emphasis on Satellite Multitemporal Interferometry Applications: An Overview. In Landslide Hazards, Risks, and Disasters; Elsevier Inc.: Amsterdam, The Netherlands, 2015; ISBN 9780123964755. [Google Scholar]
  5. Solari, L.; Del Soldato, M.; Raspini, F.; Barra, A.; Bianchini, S.; Confuorto, P.; Casagli, N.; Crosetto, M. Review of Satellite Interferometry for Landslide Detection in Italy. Remote Sens. 2020, 12, 1351. [Google Scholar] [CrossRef]
  6. Cruden, D.M.; Varnes, D.J. Landslide types and processes. Spec. Rep. Natl. Res. Counc. Transp. Res. Board 1996, 247, 36–75. [Google Scholar]
  7. Wasowski, J.; Bovenga, F. Investigating landslides and unstable slopes with satellite Multi Temporal Interferometry: Current issues and future perspectives. Eng. Geol. 2014, 174, 103–138. [Google Scholar] [CrossRef]
  8. Bovenga, F.; Belmonte, A.; Refice, A.; Pasquariello, G.; Nutricato, R.; Nitti, D.O.; Chiaradia, M.T. Performance analysis of satellite missions for multi-temporal SAR interferometry. Sensors 2018, 18, 1359. [Google Scholar] [CrossRef] [Green Version]
  9. Raucoules, D.; Tomaro, F.; Foumelis, M.; Negulescu, C.; de Michele, M.; Aunay, B. Landslide observation from ALOS-2/PALSAR-2 Data (image correlation techniques and sar interferometry). Application to salazie circle landslides (La Reunion Island). In Proceedings of the IGARSS 2018–2018 IEEE International Geoscience and Remote Sensing Symposium, Valencia, Spain, 22–27 July 2018; IEEE: Piscataway, NJ, USA, 2018; pp. 506–509. [Google Scholar]
  10. Roa, Y.; Rosell, P.; Solarte, A.; Euillades, L.; Carballo, F.; García, S.; Euillades, P. First assessment of the interferometric capabilities of SAOCOM-1A: New results over the Domuyo Volcano, Neuquén Argentina. J. S. Am. Earth Sci. 2021, 106, 102882. [Google Scholar] [CrossRef]
  11. Covello, F.; Battazza, F.; Coletta, A.; Lopinto, E.; Fiorentino, C.; Pietranera, L.; Valentini, G.; Zoffoli, S. COSMO-SkyMed an existing opportunity for observing the Earth. J. Geodyn. 2010, 49, 171–180. [Google Scholar] [CrossRef] [Green Version]
  12. Lorusso, R.; Fasano, L.; Dini, L.; Facchinetti, C.; Varacalli, G.N. “COSMO-SkyMed di Seconda Generazione”—Civilian product specifications. In Proceedings of the Proceedings of the International Astronautical Congress, IAC, Bremen, Germany, 1–5 October 2018; International Astronautical Federation (IAF): Paris, France, 2018. [Google Scholar]
  13. Torres, R.; Snoeij, P.; Geudtner, D.; Bibby, D.; Davidson, M.; Attema, E.; Potin, P.; Rommen, B.; Floury, N.; Brown, M.; et al. GMES Sentinel-1 mission. Remote Sens. Environ. 2012, 120, 9–24. [Google Scholar] [CrossRef]
  14. Carlà, T.; Raspini, F.; Intrieri, E.; Casagli, N. A simple method to help determine landslide susceptibility from spaceborne InSAR data: The Montescaglioso case study. Environ. Earth Sci. 2016, 75, 1492. [Google Scholar] [CrossRef] [Green Version]
  15. Bentivenga, M.; Giano, S.I.; Murgante, B.; Nolè, G.; Palladino, G.; Prosser, G.; Saganeiti, L.; Tucci, B. Application of field surveys and multitemporal in-SAR interferometry analysis in the recognition of deep-seated gravitational slope deformation of an urban area of Southern Italy. Geomat. Nat. Hazards Risk 2019, 10, 1327–1345. [Google Scholar] [CrossRef] [Green Version]
  16. Bentivenga, M.; Bellanova, J.; Calamita, G.; Capece, A.; Cavalcante, F.; Gueguen, E.; Guglielmi, P.; Murgante, B.; Palladino, G.; Perrone, A.; et al. Geomorphological and geophysical surveys with InSAR analysis applied to the Picerno earth flow (southern Apennines, Italy). Landslides 2020, 18, 471–483. [Google Scholar] [CrossRef]
  17. Pellicani, R.; Argentiero, I.; Manzari, P.; Spilotro, G.; Marzo, C.; Ermini, R.; Apollonio, C. UAV and Airborne LiDAR Data for Interpreting Kinematic Evolution of Landslide Movements: The Case Study of the Montescaglioso Landslide (Southern Italy). Geosciences 2019, 9, 248. [Google Scholar] [CrossRef] [Green Version]
  18. Doglioni, A.; Casagli, N.; Nocentini, M.; Sdao, F.; Simeone, V. The landslide of Pomarico, South Italy, occurred on January 29th 2019. Landslides 2020, 17, 2137–2143. [Google Scholar] [CrossRef]
  19. Bovenga, F.; Nutricato, R.; Refice, A.; Guerriero, L.; Chiaradia, M.T. SPINUA: A flexible processing chain for ERS/ENVISAT long term interferometry. In Proceedings of the 2004 Envisat & ERS Symposium, Salzburg, Austria, 6–10 September 2004; ESA Special Publication: Salzburg, Austria, 2005; pp. 473–478. [Google Scholar]
  20. Spilotro, G.; Coviello, L.; Trizzino, R. Post failure behaviour of landslide bodies. In Landslides in Research, Theory and Practice, Proceedings of the 8th International Symposium on Landslides, Cardiff, UK, 26–30 June 2000; Bromhed, E., Dixon, E.N., Ibsen, M.L., Eds.; Thomas Telford: London, UK, 2000; Volume 3, pp. 1379–1386. [Google Scholar]
  21. Caputo, R.; Bianca, M.; D’Onofrio, R. Ionian marine terraces of southern Italy: Insights into the Quaternary tectonic evolution of the area. Tectonics 2010, 29, TC4005. [Google Scholar] [CrossRef]
  22. Cherubini, C.; Cotecchia, V.; Guerricchio, A.; Mastromattei, R. The stability conditions of the town of Aliano (Southern Italy). In Proceedings of the 7th International IAEG Congress, Lisbon, Portugal, 5–9 September 1994; Oliveira, R., Rodrigues, L.F., Coelho, G., Cunha, A.P., Eds.; A.A. Balkema: Rotterdam, The Netherlands, 1994; pp. 2145–2153. [Google Scholar]
  23. Bozzano, F.; Floris, M.; Polemio, M. An Interpretation of Slope Dynamics in Pisticci (Southern Italy). In Landslides in Research, Theory and Practice, Proceedings of the 8th International Symposium on Landslides, Cardiff, UK, 26–30 June 2000; Bromhed, E., Dixon, E.N., Ibsen, M.L., Eds.; Thomas Telford: London, UK, 2000; Volume 1, pp. 171–176. [Google Scholar]
  24. Troncone, A.; Conte, E.; Donato, A. Two and three-dimensional numerical analysis of the progressive failure that occurred in an excavation-induced landslide. Eng. Geol. 2014, 183, 265–275. [Google Scholar] [CrossRef]
  25. Troncone, A.; Conte, E.; Donato, A. Three-dimensional Finite Element Analysis of the Senise Landslide. Procedia Eng. 2016, 158, 212–217. [Google Scholar] [CrossRef] [Green Version]
  26. ISPRA—Istituto Superiore per la Protezione e la Ricerca Ambientale IFFI Project—English. Available online: https://www.isprambiente.gov.it/en/projects/soil-and-territory/iffi-project (accessed on 28 September 2021).
  27. Autorità di Bacino Distrettuale dell’Appennino Meridionale PAI—Piano Stralcio per la Difesa dal Rischio Idrogeologico. Available online: http://rsdi.regione.basilicata.it/viewGis/?project=45774E9D-93DF-6578-E022-46605663079B (accessed on 28 September 2021).
  28. Autorità di Bacino Distrettuale dell’Appennino Meridionale PAI—Aggiornamento 2019. Available online: http://www.adb.basilicata.it/adb/pStralcio/piano2019_adoz.asp (accessed on 28 September 2021).
  29. Floris, M.; Bozzano, F. Evaluation of landslide reactivation: A modified rainfall threshold model based on historical records of rainfall and landslides. Geomorphology 2008, 94, 40–57. [Google Scholar] [CrossRef]
  30. Pellicani, R.; Spilotro, G.; Ermini, R.; Sdao, F. The large montescaglioso landslide of December 2013 after prolonged and severe seasonal climate conditions. In Landslides and Engineered Slopes. Experience, Theory and Practice, Proceedings of the 12th International Symposium on Landslides, Napoli, Italy, 12–19 June 2016; Aversa, S., Cascini, L., Picarelli, L., Scavia, C., Eds.; CRC Press: Croydon, UK, 2016; Volume 3, pp. 1591–1597. [Google Scholar]
  31. Troncone, A. Numerical analysis of a landslide in soils with strain-softening behaviour. Géotechnique 2005, 55, 585–596. [Google Scholar] [CrossRef]
  32. Spilotro, G.; Fidelibus, M.D.; Pellicani, R.; Argentiero, I.; Parisi, A. La stabilità degli abitati su placche rigide su argille plio-pleistoceniche. Esperienze dai centri storici della Basilicata e della Puglia. Geol. Dell’Ambiente 2017, 1, 47–53. [Google Scholar]
  33. Berti, M.; Corsini, A.; Franceschini, S.; Iannacone, J.P. Automated classification of Persistent Scatterers Interferometry time series. Nat. Hazards Earth Syst. Sci. 2013, 13, 1945–1958. [Google Scholar] [CrossRef] [Green Version]
  34. Bovenga, F.; Pasquariello, G.; Refice, A. Statistically-based trend analysis of MTInSAR displacement time series. Remote Sens. 2021, 13, 2302. [Google Scholar] [CrossRef]
  35. Refice, A.; Pasquariello, G.; Bovenga, F. Model-Free Characterization of SAR MTI Time Series. IEEE Geosci. Remote Sens. Lett. 2022, 19, 4004405. [Google Scholar] [CrossRef]
  36. Bozzano, F.; Caporossi, P.; Esposito, C.; Martino, S.; Mazzanti, P.; Moretto, S.; Mugnozza, G.S.; Rizzo, A.M. Mechanism of the Montescaglioso Landslide (Southern Italy) Inferred by Geological Survey and Remote Sensing. In Proceedings of the Advancing Culture of Living with Landslides. WLF 2017; Mikos, M., Tiwari, B., Yin, Y., Sassa, K., Eds.; Springer: Cham, Switzerland, 2017; pp. 97–106. [Google Scholar]
  37. Raspini, F.; Ciampalini, A.; Del Conte, S.; Lombardi, L.; Nocentini, M.; Gigli, G.; Ferretti, A.; Casagli, N. Exploitation of Amplitude and Phase of Satellite SAR Images for Landslide Mapping: The Case of Montescaglioso (South Italy). Remote Sens. 2015, 7, 14576–14596. [Google Scholar] [CrossRef] [Green Version]
  38. Manconi, A.; Casu, F.; Ardizzone, F.; Bonano, M.; Cardinali, M.; De Luca, C.; Gueguen, E.; Marchesini, I.; Parise, M.; Vennari, C.; et al. Brief communication: Rapid mapping of landslide events: The 3 December 2013 Montescaglioso landslide, Italy. Nat. Hazards Earth Syst. Sci. 2014, 14, 1835–1841. [Google Scholar] [CrossRef] [Green Version]
  39. Caporossi, P.; Mazzanti, P.; Bozzano, F. Digital Image Correlation (DIC) analysis of the 3 December 2013 Montescaglioso landslide (Basilicata, Southern Italy): Results from a multi-dataset investigation. ISPRS Int. J. Geo-Inf. 2018, 7, 372. [Google Scholar] [CrossRef] [Green Version]
  40. Elefante, S.; Manconi, A.; Bonano, M.; De Luca, C.; Casu, F. Three-dimensional ground displacements retrieved from SAR data in a landslide emergency scenario. In Proceedings of the 2014 IEEE Geoscience and Remote Sensing Symposium, Quebec City, QC, Canada, 13–18 July 2014; pp. 2400–2403. [Google Scholar] [CrossRef]
  41. Bozzano, F.; Cherubini, C.; Floris, M.; Lupo, M.; Paccapelo, F. Landslide phenomena in the area of Pomarico (Basilicata-Italy): Methods for modelling and monitoring. Phys. Chem. Earth 2002, 27, 1601–1607. [Google Scholar] [CrossRef]
  42. Fidelibus, M.; Argentiero, I.; Canora, F.; Pellicani, R.; Spilotro, G.; Vacca, G. Squeezed Interstitial Water and Soil Properties in Pleistocene Blue Clays under Different Natural Environments. Geosciences 2018, 8, 89. [Google Scholar] [CrossRef] [Green Version]
  43. Refice, A.; Pasquariello, G.; Bovenga, F.; Festa, V.; Acquafredda, P.; Spilotro, G. Investigating uplift in Lesina Marina (Southern Italy) with the aid of persistent scatterer SAR interferometry and in situ measurements. Environ. Earth Sci. 2016, 75, 243. [Google Scholar] [CrossRef] [Green Version]
  44. Pellicani, R.; Argentiero, I.; Spilotro, G. GIS-based predictive models for regional-scale landslide susceptibility assessment and risk mapping along road corridors. Geomat. Nat. Hazards Risk 2017, 8, 1012–1033. [Google Scholar] [CrossRef] [Green Version]
  45. Hill, P.; Biggs, J.; Ponce-López, V.; Bull, D. Time-Series Prediction Approaches to Forecasting Deformation in Sentinel-1 InSAR Data. J. Geophys. Res. Solid Earth 2021, 126, e2020JB020176. [Google Scholar] [CrossRef]
  46. Carlà, T.; Intrieri, E.; Raspini, F.; Bardi, F.; Farina, P.; Ferretti, A.; Colombo, D.; Novali, F.; Casagli, N. Perspectives on the prediction of catastrophic slope failures from satellite InSAR. Sci. Rep. 2019, 9, 14137. [Google Scholar] [CrossRef] [PubMed] [Green Version]
Figure 1. Location of Montescaglioso and Pomarico villages.
Remotesensing 14 01677 g001
Figure 2. Mean LOS displacement rate maps over Montescaglioso village: (a) Sentinel-1 ascending dataset; (b) Sentinel-1 descending dataset; (c) COSMO-SkyMed ascending dataset. Dashed arrows represent orbit directions. The ground projection of the LOS vector is also shown. The red line delimits the known landslide body.
Remotesensing 14 01677 g002
Figure 3. (a) Mean LOS displacement rate map over the Montescaglioso landslide derived by processing the Sentinel-1 ascending dataset; (b,c) targets selected respectively through the FE index according to (3), and through the NLTA procedure according to (2); (d) displacement time series corresponding to the target labeled P1 in panel (b): the yellow and red squares represent, respectively, the original displacement values and those obtained by subtracting the range of ambiguity (λ⁄2 = 28 mm) from the values after the discontinuity; (e) displacement time series corresponding to the target labeled P2 in panel (c): the black dots and the red dotted line represent, respectively, the displacement values and the polynomial curve derived through the NLTA; (f) ground picture of the area delimited by the white polygon in panels (ac).
Remotesensing 14 01677 g003
Figure 4. (a) Mean LOS displacement rate map over the cemetery in Montescaglioso village derived by processing the COSMO-SkyMed ascending dataset; (b) displacement time series corresponding to the target labeled P1 in panel (a).
Remotesensing 14 01677 g004
Figure 5. (a) Mean LOS displacement rate map over an area in Montescaglioso village derived by processing COSMO-SkyMed ascending dataset; (b,c) displacement time series corresponding to targets labeled, respectively, P1 and P2 in panel (a); (d,e) pictures of the building corresponding to target P1 taken in 2013 and 2020.
Remotesensing 14 01677 g005
Figure 6. (a) Mean CSK ascending LOS displacement rate map over a portion of the road connecting the towns of Montescaglioso and Ginosa; (b) displacement time series corresponding to target P1 in panel (a).
Remotesensing 14 01677 g006
Figure 7. Mean LOS displacement rate maps over Pomarico village: (a) Sentinel-1 ascending dataset; (b) Sentinel-1 descending dataset; (c) COSMO-SkyMed ascending dataset.
Remotesensing 14 01677 g007
Figure 8. (a) Enlarged mean LOS displacement rate map over the Pomarico landslide derived by processing the COSMO-SkyMed ascending dataset; (b) map of targets selected though the NLTA according to (2) and showing a polynomial degree greater than 1; (c,d) pictures of the urban area affected by the landslide and bordered by the white rectangle in (a); (e,f) displacement time series corresponding to targets labeled, respectively, P1 and P2 in panel (a,b): black dots and the red dotted lines represent, respectively, the displacement values and the polynomial fit curves derived though the NLTA. The PAI (Piano di Assetto Idrogeologico) landslide risk map by the Basilicata section of the Southern Apennine District Basin Authority [27,28] is plotted with colored lines delimiting the risk classes areas, according to the colormap in the figure.
Remotesensing 14 01677 g008
Figure 9. (a) Enlargement of the mean LOS displacement rate map derived by processing the COSMO-SkyMed ascending dataset over an area NE of the Pomarico village; (b) map of targets selected according to the FE index with a threshold of 0.5; (c) displacement time series (black dots) and its replicas obtained by subtracting λ / 2 (yellow dots) and λ (red dots), corresponding to the target labeled P1 in panel (a); (d) displacement time series (blue crosses) and its replicas obtained by subtracting λ / 2 (yellow crosses) and λ (red crosses), corresponding to the target labeled P2 in panel (a); (e) displacement time series corresponding to target P1 (black squares) and P2 (blue crosses) after correction of phase unwrapping errors. The PAI landslide risk map by the Basilicata section of the Southern Apennine District Basin Authority [27,28] is plotted with colored lines delimiting the risk classes areas according to the colormap in the figure.
Remotesensing 14 01677 g009
Figure 10. (a) Enlargement of the mean LOS CSK PS displacement map over the Montescaglioso cemetery area (same as Figure 4a); (bd) ground pictures of cracks consistent with displacements detected during a local survey, (b) on the NE part of the cemetery area, (c) on the road that runs alongside the cemetery and goes towards the valley, (d) on the wall of a chapel inside the cemetery; (e) satellite images (from Google Earth) showing the evolution from 2010 to 2019 of the N slope.
Remotesensing 14 01677 g010
Figure 11. (a) Enlargement of the mean LOS S1 ascending PS displacement map of the Pomarico NE side area (same area as Figure 9a); (be) ground pictures of (b) cracks on the retaining wall and on the road upstream, (c) cracks on the retaining wall and on the road downstream, (d) cracks on the road, (e) damaged sidewalk.
Remotesensing 14 01677 g011
Figure 12. Pictures of the road section in Montescaglioso village corresponding to the area where target P1 in Figure 6 is located.
Remotesensing 14 01677 g012
Table 1. Dataset characteristics.
Test SiteSensorGeometryN. ImagesTime Interval
PomaricoS1Ascending15815/10/2014–15/05/2018
S1Descending14121/10/2014–21/05/2018
CSKAscending9628/10/2012–23/06/2018
MontescagliosoS1Ascending18215/10/2014–29/12/2018
S1Descending15921/10/2014–29/12/2018
CSKAscending9628/10/2012–23/06/2018
Publisher’s Note: MDPI stays neutral with regard to jurisdictional claims in published maps and institutional affiliations.

