
Monitoring Spatio-Temporal Dynamics in the Eastern Plain Lakes of China Using Long-Term MODIS UNWI Index
by
 , , ,
, , ,
Lifu Zhang
1,2,3 ,
,
Sa Wang
1,2,
Yi Cen
1,
Changping Huang
1,2,*,
Hongming Zhang
1,
Xuejian Sun
1 and
Qingxi Tong
1 1
Aerospace Information Research Institute, Chinese Academy of Sciences, Beijing 100094, China
2
University of Chinese Academy of Sciences, Beijing 100049, China
3
Key Laboratory of Oasis Eco-Agriculture, Xinjiang Production and Construction Corps, Shihezi University, Shihezi 832003, China
*
Author to whom correspondence should be addressed.
Remote Sens. 2022, 14(4), 985; https://doi.org/10.3390/rs14040985
Submission received: 5 January 2022
/
Revised: 29 January 2022
/
Accepted: 12 February 2022
/
Published: 17 February 2022
(This article belongs to the Special Issue Hyperspectral Remote Sensing Technology in Water Quality Evaluation)
Abstract
:Monitoring the spatio-temporal dynamics of the Eastern Plain Lake (EPL) is vital to the local environment and economy. However, due to the limitations and efficiency of traditional image formats in storing and processing large amounts of images and optimal threshold adjustments are often necessary for water/non-water separation based on traditional multi-band/spectral water indexes over large areas and in the long-term, previous studies have either been on a short period or mainly focused on water inundation dynamics of several lakes. To address these issues, a multi-dimensional dataset (MDD) storage format was used to efficiently organize more than ~7000 time series composite MODIS images. Furthermore, a universal normalized water index (UNWI) was developed based on full-spectrum information to simplify optimal threshold adjustments. Consequently, the present study analyzed the patterns of spatio-temporal water dynamic patterns and potential driving factors of inundation changes at large lakes (>5 km2) in the EPL during 2000–2020 through MDD and UNWI. In terms of annual inundation patterns, the numbers of lakes that experienced significant (p < 0.05) decreases (17 lakes) and increases (43 lakes) were highest for Class IV lakes among six geographical classes. Variation in intra-annual inundation in Classes I and II is correlated with consumption of chemical fertilizers (CCF), while precipitation accounted for the most change in lake area in Class III. This spatio-temporal analysis of lakes provides a necessary foundation for the sustainable development and continuous investigations of the EPL.
1. Introduction
As crucial components of the inland water system, lakes hold indispensable ecological value [1,2,3,4]. In addition to providing a majority of the freshwater resources necessary for the survival and development of humankind, lakes also perform a significant role in maintaining the balance of regional ecological environments via the hydrological cycle, flood control, fisheries, and biodiversity conservation [5,6,7,8]. Lakes are a part of the continental surfaces and highly sensitive to climate and human activities [7,9,10,11,12,13,14].
In recent decades, the intensification of both global climate change and human activities have caused many lakes to undergo tremendous changes. Water resources security has become a serious problem, threatening nearly 80% of the world population [14]. Not only the number of lakes, but also the area of lakes have experienced statistically significant declines and this phenomenon has appeared in Oklahoma, USA [15], central Asia [16], Alaska, USA and Siberia, Russia [9], and so on. Moreover, the same phenomenon has occurred in saline lakes around the world [17]. Without exception, lakes in China have also substantially changed [10,18]. For example, glaciers melting caused by accelerated climate warming have led to the expansion of lakes on the Qinghai and Tibetan plateaus [11,19,20,21,22]. Even more drastically, the lakes of the Inner-Mongolian Plateau have decreased by 1223.76 km2, while 333 lakes of eastern China with area ≥ 1.0 km2 have completely disappeared over the past few decades [23]. Therefore, understanding the spatio-spatial dynamics and distribution of lakes in large regions is urgently required to better protect water resource ecosystems and environments [8,24].
Remote sensing methods are unparalleled in their ability to provide large-scale and repeatable Earth observations via real-time images that capture surface information in remote or inaccessible areas, which have become an important method of studying surface water information (size or number) [4,15,24,25,26,27]. The imagery of various satellites, such as Landsat, Moderate Resolution Image Spectroradiometer (MODIS), and Sentinel, has been used to acquire and analyze water surface inundation [3,4,9,23,28,29,30,31,32]. A variety of band combinations indexes, such as the Normalized Difference Water Index (NDWI) [33], Modified Normalized Difference Water Index (mNDWI) [34], Automated Water Extraction Index (AWEI), Automated Water Extraction Index shadow (AWEIsh) and Automated Water Extraction Index no shadow (AWEInsh) [25], Land Surface Water Index (LSWI) and Modified Land Surface Water Index (MLSWI) [35,36], Sentinel Water Mask (SWM) [37,38], and Normalized Difference Vegetation Index (NDVI), etc., have been widely used to acquire water–land interface data. Those indexes were used to find sandbars and lakes or reservoir. For example, SWM water index was the best indicator for sandbars detecting in the Lower Vistula River [39], and the first complete study of lake changes in China between the 1960s and 1980s and 2005–2006 was accomplished using more than 24,000 satellite images [10]. In addition, more than 3831 Landsat satellite images were used to collect data for lakes ≥ 1 km2 in China every five years based on NDWI during 1990–2015 [23]; Tao et al. [11] discussed the changes and their driving forces of lakes in China from the mid-1980s to 2015, while [15] discussed the water body area and number in Oklahoma, USA, using ~16,000 Landsat images based on mNDWI, NDVI, and EVI during 1984–2015. Moreover, [40] analyzed the intra-annual trend in Patagonian with different water index: NDWI1, NDWI2, and mNDWI. The MODIS images of NDVI were also used to acquire the area variation of Urmia Lake, Iran, from 2000 and 2011 [41]. At the same time, [42] used the support vector machine model to identify water and non-water area as well as estimated water volume of Lake Victoria during 2003–2017, with long-term MODIS and GRACE images. In addition, the remote sensing images are also used to acquire global inundation maps. For example, [43] produced global inundation maps at a scale of 15 arc seconds based on the topographic downscaling of the SRTM-derived Hydro SHEDS database and a GLC2000 global land cover map. At the same time, all 3.4 million Landsat 5, 7, and 8 scenes from 1999 to 2018 were recently used to generate global surface water maps [8]. Obviously, the optimal threshold for water/non-water separation based on traditional water indexes is key to accurately extracting water area data [23]. However, determining the optimal thresholds for long-term water/non-water separation over large areas poses a substantial challenge. Traditional water indexes are based on multi-band or multi-spectral information, and a large amount of other spectral information has not been utilized, which may be one reason why threshold adjustment would be necessary. Therefore, in the present study, we introduce a full-band index called the Universal Normalized Water Index (UNWI), which aims to make full use of all spectral information, thereby simplifying or reducing the need for threshold adjustment.
The middle and lower reaches of the Yangtze River and the Huai River, along with their associated outflows and freshwater lakes, constitute the main lakes in the EPL region of China [44,45]. The core EPL primarily covers Zhejiang, Jiangsu, Shandong, Hebei, Anhui, Jiangxi, Hubei, and Hunan provinces as well as Shanghai. With 643 lakes ≥ 1 km2, accounting for 25.9% of the total area of lakes in China [45,46], the EPL is one of the most biologically diverse wetland systems and the largest freshwater group of lakes on the planet, serving as the most important source of freshwater for human and commercial use in eastern China. Characterized by high urbanization and population density [10,45], it is reported that the EPL lakes decreased in area by 7% during the 1960s to 2015 [23]. Due to the influence of human activities and accelerated urbanization [4,10,47,48,49,50], many of the lakes and associated wetlands in this region have undergone dramatic degradation [3,29,51,52], leading to a series of problems such as reduced shortage of drinking water [48,53,54], drought [13,28,50], vegetation losses [47,51,52], etc. The 90 lakes in the downstream Yangtze Basin decreased by 7.4% from 2000 to 2011 [2], and the annual mean lake areas in Poyang also significantly declined from 2000 to 2010 [4]. However, few reports about the EPL as a whole region are available for recent (2000–2020) long-term water dynamics, such as spatial and temporal patterns, seasonal patterns, and inter-annual variability.
The quantification of trends in spatio-temporal water dynamics is critical to water security and will help elucidate and protect water resource-related ecosystem services; however, processing large amounts of long-term data for an adequate number of lakes can prove difficult and the traditional image data storage and processing methods are not ideal for large areas and long-term remote sensing images. The traditional methods are based on traditional image storage format, such as Geographic Tagged Image File Format (Geo-TIFF) [55] and formats for remote sensing business software (e.g., The Environment for Visualizing Images, ENVI). These traditional data storage formats are based on a three-dimensional cube, which stores 1D-spectral dimension and 2D-spatial dimension information, while long-term series remote sensing data contain four-dimensional information: 1D-spectral dimension, 2D-spatial dimensions, and 1D-temporal dimension, also known as temporal-spatial-spectral dimensional data [56]. Traditional data organization formats face several shortcomings in the storage, management, and analysis of long-term remote sensing data. First, in terms of data management, the need for multiple discrete data files to store and organize time series datasets results in a lack of integrity and consistency and a lack of temporal dimension information. Second, in data analysis, many repeated steps are required to process the data, which is cumbersome and makes it difficult to complete the corresponding work through interactive operations. Lastly, it is necessary to read each node one-by-one from multiple files, tree structures, or linked list structures of each file to obtain the data, resulting in low efficiency and inconvenient operations for the extraction of temporal-spectrum information. Therefore, a multi-dimensional dataset (MDD) format framework is urgently needed to store and manage long-term remote sensing images. The design targets of this present study are as follows:
- Build a new framework that can process time-series remote sensing data;
- Develop a universal normalized water index (UNWI) for large areas and long-term lake inundation observations that uses full spectrum information;
- Use the new framework to record patterns of spatio-temporal dynamics of large lakes in the EPL, China, during 2000–2020, and discuss the forces driving the inundation changes at large lakes in the EPL.
2. Study Area and Datasets
2.1. Study Area
The EPL is located in eastern China and contains 18% of the nation’s lakes [10,23]. The region contains about ~600 lakes larger than 1 km2 [23], which are mainly distributed in the Yangtze Plain, Huai River Plain, and the canal from Beijing to Hangzhou (Figure 1) [10,18,57]. These freshwater lakes provide not only freshwater resources for human survival but also serve many ecosystem functions, such as regulating river discharge, irrigation development, water for industry, shipping, etc. [25,29,51,58,59,60]. More importantly, they also play a significant role in mitigating regional climate change, regulating flood and drought, combating soil erosion and water losses, and protecting biodiversity [4,6,14,43,61,62].
In the present study, the 184 lakes that were >5 km2 were selected, and information regarding name, longitude, latitude, and basic region of the lakes was obtained from the China Lake Scientific Database (http://www.lakesci.csdb.cn/, accessed on 14 January 2021) and National Tibetan Plateau Data Center (http://data.tpdc.ac.cn/, accessed on 23 February, 2021). The basic region of each lake was used to extract a subset of MODIS images and was greater in size than the maximum water area [23,63]. In the study of the Yangtze [2,5], the lakes were categorized into three classes based on their discriminant relations with the Yangtze River. Based on the same consideration and strategy, the lakes were categorized into six classes according to the connection between lakes and the Beijing-Hangzhou Grand Reach, Yangtze River, and Huai River in order to better understand the spatial and temporal dynamics of these lakes and their protentional driving forces. Lakes that are freely connected to the Yangtze River are categorized as Class I [2], including Poyang Lake, Dongting Lake, and Shijiu Lake. Lakes that are freely connected to the Huai River were categorized as Class II, while those freely connected to the Beijing-Hangzhou Grand Reach were classified as Class III. The remaining semi-natural lakes (mainly via local flood gates) of the Yangtze River Plain and Huai River Plain were categorized as Class IV and Class V, respectively. The remaining eight lakes were categorized as Class VI).
2.2. Datasets
The MODIS surface reflectance data (h27v05, h27v06, h28v05, and h28v06) from Terra (MOD09) and Acqua (MYD09) during 2000–2020 were obtained from the National Aeronautics and Space Administration Land Processes Distribution Active Archive Center (https://ladsweb.nascom.nasa.gov/, accessed on 3 March 2021) and were used to study changes in the spatial and temporal dynamics of the study lakes. Data on lake dynamics were obtained from the MODIS eight-day surface reflectance data, which avoids large errors and negative reflectance partly by selecting the best possible high observation coverage, low viewing angle, and aerosol loading during an eight-day period [5,57], with spatial resolutions of 250 m (MOD09Q1 and MYD09Q1) and 500 m (MOD09A1 and MYD09A1). Band 1 (red spectra of 620–670 nm) and band 2 (near-infrared spectra of 841–876 nm), which are stored at a spatial resolution of 250 m, and bands 3–7 (i.e., 459–479 nm, 545–565 nm, 1230–1250 nm, 1628–1652 nm and 2105–2155 nm), stored at a spatial resolution of 500 m, were re-sampled to 250 m using the sharpen method [4,5]. In addition, MODIS daily surface reflectance data (MOD09GQ and MYD09GQ with a spatial resolution of 250 m; MOD09GA and MOD09GA with a spatial resolution of 500 m) were also downloaded for further validation by higher-resolution (30 m) Landsat images. With the MODIS QA data, influencing factors such as clouds, cloud shadows, or snow can be detected and then excluded from water extraction as well as spatial and temporal dynamic analysis.
The higher resolution (30 m) Landsat Thematic Mapper (TM), and Landsat 8 Operational Land Imager (OLI) were obtained and downloaded from the United States Geological Survey (USGS, https://earthexplorer.usgs.gov/, accessed on 12 March 2021) to validate the water extent maps acquired by MODIS. All Landsat data downloaded from USGS have been geometrically corrected (Level 1T, L1T). The data collected by the Landsat TM and OLI included the surface reflectance generated by the USGS with the Landsat Ecosystem Disturbance Adaptive Processing System algorithm [64] and the Landsat Surface Reflectance Code algorithm [65], respectively.
Precipitation and temperature data were used to examine the potential natural factors that could influence the long-term spatial and temporal dynamics of lakes in the EPL. Long-term annual precipitation data during 2000–2020 were obtained from the Global Precipitation Measurement Integrated Multi-satellite Retrievals (GPM IMERG) Level-3 “Final” product data, which were downloaded from the NASA Goddard Earth Sciences (GES) Data and Information Services Center (DISC) (https://gpm1.gesdisc.eosdis.nasa.gov/data/GPM_L3/GPM_3IMERGM.06/, accessed on 24 March 2021). These products are produced with the IMERG algorithm, which were combined various satellite data [66,67]. With a spatial resolution of 0.1° × 0.1° (roughly ~10 × 10 km), monthly GPM_3IMERGM data have been shown to perform slightly better than the Tropical Rainfall Measuring Mission data (TRMM 3B43) and are consistent with meteorological field data in terms of long-term trends [68,69,70]. The precipitation conditions of a lake were represented by the total precipitation over each lakes’ water area, which was derived from the GPM_3IMERGM data. Annual temperature and wind data were obtained from the National Meteorological Information Center, China (https://data.cma.cn, accessed on 24 March 2021). Similarly, data collected from the closest meteorological station to a lake were used to represent the temperature conditions of each lake.
Several statistical variables were used to account for the potential human activities that might influence the long-term variability of the annual dynamics of lakes in the EPL. These variables included local population (LPO), gross domestic production (GDP), consumption of chemical fertilizers (CCF), irrigation area of cultivated land (IAC), and gross output value of farming, forestry, animal husbandry, and fishery (GFF) [28,57,71]. In addition, only the human activity factors specific to the city or prefecture in which a particular lake was located were used in the analysis.
3. Methodology
Although extracting water data is easy for a small remote sensing image or for a short time period, e.g., using thresholds for NDVI, NDWI, or MNDWI, the task is quite challenging for 184 different water bodies over 21 years. Through traditional 3D data storage formats, more than 7000 composites images over 21 years would need to be processed and analyzed, requiring enormous computer performance and many repeated steps for processing [72]. Therefore, we performed the necessary long-term time series lake mapping using the MDD structure that stores all band data by time sequence and each spectral cube in the band sequence. First, the long-term time series MODIS images were organized in the MDD structure [56,72]. Second, automated water extraction was conducted, and the final water maps were acquired through visual inspection. Lastly, patterns of the long-term dynamics of the lakes were analyzed. This framework is presented in Figure 2, and the details of each step are described below.
3.1. The Multi-Dimensional Dataset: TSB
As one of the MDD formats, the temporal sequential in band (TSB) data structure (Figure 3) was used to store the long-term MODIS images. A multi-dimensional analysis of remote sensing (MARS) [72] was used to build the TSB. The software can be downloaded from: http://www.geodoi.ac.cn/WebCn/doi.aspx?Id=702 (accessed on 12 June 2021).
As shown in Figure 3, the storage principles of the TSB are that the format stores the first band B1 at time T1 in the order of row-column, the pixel data of each band of T1 are stored sequentially, and all temporal cube data are stored through the above rules. This structure is defined as:
where, represents the cube dataset for each time, which can be expressed as:
Each band is stored in line-by-line order, which can be expressed as:
where, t, s, c, and r represent time, spectral band, column, and row, respectively, and the ranges are [1, T], [1, S], [1, C], and [1, R], respectively. represents the spectral cube of A, the s band, c-th row and the r-line pixel of time t. BTSB represent the data of one band, FTSB represents multiple bands, and PTSB represents a temporal-spatial-spectral dataset.
3.2. Water Extraction Algorithms
Zhang et al. [73,74] proposed a sensor-independent remote sensing decomposition that utilizes a full spectrum information algorithm-universal pattern decomposition method (UPDM). This method is based on the fact that the spectral reflectance of each pixel can be decomposed into the standard spectral linear combination of water, vegetation, soil, and yellow leaves. The UPDM decomposition is:
where , , , and are the decomposition coefficients for water, vegetation, soil, and yellow leaves, respectively; and , , , and are the standard spectral models for sensor band of water, vegetation, soil, and yellow leaves, respectively. Through this projtection, each pixels of the multi-dimensional remote sensing image were converted into four-dimensional UPDM space. That is, four feature vectors (Cw, Cv, Cs and C4) were extracted through this convertion. Zhang et al. [75] optimized the UPDM decomposition calculation using the following formula:
where represents the reflectance value column vector of the pixel, and is the value of bands number for remote sensing sensor. For example, the value of n is 7 for MODIS Acqua/Terra sensor. is the value upon which the normalized values of the continuous spectra of the standard water, vegetation, soil, and yellow leaves are reconstructed into the reflectance values of each band based on the spectral response function of the target sensor. The value of for the MODIS band can be found in Zhang et al. [75]. represents the UPDM dimensional parameters of water, vegetation, soil, and yellow leaves.
The pure pixels of lake, vegetation, dark mountains, and buildings in the EPL were selected, and the UPDM dimensional space distributions in the EPL are shown in Figure 4. In the UPDM dimensional space, the water pixels exhibit several notable characteristics. (1) First, the values of and were higher for water pixels than for other objects (Figure 4a,d), while the value of was significantly greater than 0. (2) In addition, and (p < 0.05), and the values of and were lower. Based on these characteristics of the UPDM dimensional space, the UNWI was defined as Equation (6):
where t represents the time during 2000–2020. Ideally, when the value of or is the largest among , and , the pixels are considered water. Unfortunately, the environment of inland lakes is very complex, and if a lake is shallow or turbid, the influence of sediment or soil will cause the value of to be high. If a lake contains floating algae, the value of could also be high. To reduce the influence of sediment, soil or floating algae and enhance the separability of water and land pixels, the UNWI is considered as expressed in Equation (6) by stabilizing the threshold to distinguish water from non-water pixels. The equation results in large negative values for pixels covered by vegetation, dark mountains, or buildings, which have large values of and (see Figure 5), indicating that 0 could be used as a reasonable threshold to distinguish water from non-water under various environmental conditions. In conclusion, the water pixels were identified as and . Using the UNWI method, automated lake maps were acquired, and visual inspection was used to avoid the effects of complex landcover types, mixed MODIS pixels, and noise in the EPL. The final water maps were obtained using the combination of UNWI and visual examination. Cloud-free Landsat images from the same time were used for verification. The accuracy of this method is discussed below.
3.3. Calculation of Spatial and Temporal Statistics
To reduce the influence of clouds, aerosols, and image noise, the seasonal and annual water bodies were calculated using water body frequencies during the period of 2000–2020, which were calculated using Equation (7). Thresholds of 2/3 and 1/3 were used to identify annual and seasonal water bodies [8,15].
Two methods were used to test whether the changes in lakes area significantly increased or decreased in the long-term: (1) the Mann-Kendall (M-K) trend test [76] was used to determine the pattern distribution of annual lake dynamics in the EPL during 2000–2020; positive and negative z-statistics indicate increasing or decreasing trends, respectively. (2) The second method used linear regression to calculate R2 values. Positive slopes indicate increasing patterns, while negative slopes indicate decreasing trends. Statistical significance of R2 was set at p < 0.05.
where is the frequency of water bodies, is the total number of water bodies, and is the total good number during the observation time.
4. Results
4.1. Performance of Water Extraction Algorithm
Table 1 presents the verification of water extraction maps using the UNWI method for three lakes: Poyang, Chaohu, and Hongze. The true water maps were acquired through visual discrimination. The values of user’s accuracy were all above 90%, with the exception of the image acquired on 5 October 2007. The producer’s accuracy was relatively high (>90%). Based on the UNWI method, the average values of the user’s and producer’s accuracy were 94.52% and 95.65%, respectively. Two pairs of cloud-free Landsat images of Poyang, Chaohu and Hongze were collected and compared to MODIS daily reflectance images on the same days (Figure 6). The boundaries were derived from Landsat and acquired through visual discrimination. For example, for the more complex boundary of the water-land interface (see Figure 6a,b), a visual inspection of Poyang indicated that the Landsat boundaries were more detailed than those acquired by MODIS, due to the higher resolution (30 m) of the former. In particular, Hongze (Figure 6c,d), the area derived from MODIS was slightly larger than the Landsat images. By contrast, for relatively simple water-land interface of Chaohu, the boundaries derived from MODIS and Landsat were very similar (Figure 6e,f). The average differences between MODIS and Landsat of each independent pair were 6.3%, 2.0%, and 3.3% for Poyang, Hongze, and Chaohu, respectively. Overall, the water-land interface distributions strongly overlapped and were very similar, indicating that using a threshold of 0 from the UNWI images to delineate the boundaries of the water-land interface was reasonable and acceptable through visual examination and comparison. The spatial resolution of MODIS has a certain influence on the accuracy of lake area extraction. Different level areas of lakes were selected to detect these impacts (Table 2). The Dongping Lake (C001, ~100 km2), Shaobo Lake (C008, ~50 km2), Douhu Lake (B002, ~5 km2), and Dazonghu Lake (F003, ~5 km2) images were acquired on the same day both on MODIS data and Landsat data. The average differences between MODIS and Landsat for each independent pair were 5.69%, 8.84%, 9.27%, and 8.37%, respectively, indicating that MODIS image data affects area accuracy in some smaller lake extraction, but this effect is acceptable (<10%) in the long-term.
In addition, the lake inundation areas were also compared to the NDWI method. The range of NDWI optimal threshold ranges were −0.06 and 0.15 during 2015–2017 based on visual inspection. A total of 103 and 91 pairs of results acquired from MODIS Terra and Aqua are shown in Figure 7. In general, compared to the UNWI method, the R2 values for Poyang Lake (A002), Taihu Lake (D001), and Chaohu Lake (D143) varied from 0.956 to 0.997 for MODIS Terra/Aqua. In addition, the R2 value for all lake regions (sample sizes of 103 and 91 for MODIS Terra and Aqua, respectively) was 0.998 (Figure 7a,b), indicating that the MODIS water maps acquired using the UNWI method were reasonable and accurate.
4.2. Spatial and Temporal Patterns of lake Inundation during the Long-Term Observations
Seasonal water frequency between 2000 and 2020 in the EPL were calculated using Equation (7), and frequency maps were used to assess the seasonal characteristics of each lake inundation area (Figure 8). These frequencies were classified into six levels: 0–0.1, 0.1–0.3, 0.3–0.5, 0.5–0.65, 0.65–0.84, and 0.84–1. The water area of each lake was summed for each meteorological season (March–May, June–August, September–November, and December–February) of each year and used to analyze patterns during 2000–2020. Significant seasonal variation could be observed in almost all lakes located in the upper reaches of the Huai River and the middle and lower reaches of the Yangtze River. In autumn (Figure 8c), the number of lakes with significantly decreased lake inundation area (p < 0.05) was highest, accounting for 34.24% (63/184) of lakes. By contrast, in summer (Figure 8b), 10.33% (19/184) of lakes experienced a significantly increasing trend (p < 0.05), accounting for the largest proportion. This phenomenon may relate to the climate properties of China, characterized by a monsoon climate, high temperature, and rain in summer, with cold and less rain in winter. In particular, the EPL zone is situated in a subtropical monsoon climate zone [77,78], and more precipitation in summer could result in a significantly increasing trend of lake areas.
The annual water frequency map is shown in Figure 1, and the annual lake inundation area also exhibited significant increases or decreases (p < 0.05). The annual water frequencies were also classified into six levels: 0–0.1, 0.1–0.3, 0.3–0.5, 0.5–0.65, 0.65–0.84, and 0.84–1, accounting for 27.23%, 15.35%, 10.50%, 7.31%, 11.26%, and 28.36%, respectively. The center of each lake exhibited a higher frequency than the edge. In addition, 13.59% (25/184) of the lakes exhibited significantly decreasing trends during the observation period of 21 years, while 25% (46/184) of the lakes experienced a significantly increasing trend. As shown in Table 3 and Table S1, the annual area of A002 (Poyang Lake) showed the largest rate of decrease (−29.09 km2 year−1, r = −0.5, p < 0.05) during 2000–2020, among all 184 study lakes, while the lake D30 (Huangdahu) experienced the largest rate of increase (5.94 km2 year−1, r = 0.49, p < 0.05). Among the lakes located downstream of Poyang Lake, 24.73% (23/93) and 11.83% (11/93) exhibited significant (p < 0.05) increases and decreases, accounting for 50% (23/46) and 44% (11/25) of all lakes with significantly (p < 0.05) increasing and decreasing trends, respectively.
The percentages of lakes of the various classes that exhibited significantly (p < 0.05) decreasing or increasing trends in seasonal inundation area are presented in Table 4. For the different geographical classes, almost all experienced a significantly (p < 0.05) decreasing trend in seasonal inundation area, with the exception of Class I, which showed a decreasing trend in autumn only. The maximum percentages of lakes that exhibited significantly (p < 0.05) decreasing trends in seasonal inundation area for spring, summer, autumn, and winter, were 25% (3/12), 33.33% (4/12), 42.86% (3/7), and 50% (6/12) for lakes in Classes V, V, II, and V, respectively. By contrast, the seasonal patterns for increases in autumn (2.78% of lakes) and winter (10.41%) were similar, and only Class V lakes exhibited significant increases in inundation area. Particularly in summer, the maximum proportion of lakes exhibiting increases occurred in Class VI, accounting for 37.5% (3/8).
However, the inter-annual trends for lake inundation area significantly differed among the different classes (upper left of Figure 1). Class IV exhibited the highest number of lakes with significant changes in inter-annual inundation area, with 17 lakes exhibiting significant decreases (p < 0.05) and 43 lakes exhibiting significant increases (p < 0.05) during 2000–2020. Furthermore, the number of lakes with significantly decreasing or increasing trends was the same for Classes V and VI, accounting for two lakes and one lake in each class, respectively. However, the inundation area of Poyang Lake (Class I, A002) and Douhu Lake (Class II, B002) significantly decreased (p < 0.05), with rates of change of −30.54 km2 year−1 and −0.11 km2 year−1, respectively (Figure 9a). At the same time, the inter-annual inundation of lakes C005 (Class III) and E007 (Class V) also showed a significant decreased while lakes D004 (Class IV) and F003 (Class VI) showed a significantly increased trend (Figure 9c). By contrast, no lakes from Classes I or II exhibited significant increases (p < 0.05) in the inundation area (upper left of Figure 1). More importantly, the maximum percentages of lakes with significantly decreasing or increasing trends occurred in Classes I/VI and IV, accounting for 25% (1/4) and 29.86% (43/144), respectively (Figure 9b).
5. Discussion
5.1. Driving Forces
Changes in climate factors, such as temperature and precipitation, directly affect the lake inundation area [4,57]. Furthermore, human activities can also drastically impact lake ecosystems [29,51]. However, the climate changes and human activities that affected the inundation area in the EPL during 2000–2020 still remain unclear. To determine the potential factors that lead to variability in intra-annual inundation, correlations between annual lake inundation area and corresponding local climate factors (precipitation, maximum temperature, average temperature, minimum temperature, and wind) and human activities (LPO, GDP, CCF, IAC, and GFF) were calculated for each lake.
Precipitation, GDP, and GFF were the main driving factors affecting local lake area (Figure 10). For the 46 EPL lakes that experienced significant increases in annual area, lake area was positively correlated with precipitation, GDP, and GFF. By contrast, for the 25 lakes that exhibited significant decreases in annual area, lake area was negatively correlated with GDP, CCE, IAC, and GFF. Moreover, both positive and negative correlations were found between annual area and GDP and CCF, primarily in the lakes of Class IV. In total, 30.43% (56/184) and 23.37% (43/184) of lakes exhibited positive correlations with precipitation and GDP (p < 0.05), respectively, while 13.04% (24/184) and 21.19% (39/184) of lakes exhibited negative correlations with GDP and CCF (p < 0.05), respectively, suggesting that human activities strongly affected water area in the EPL. In addition, precipitation was an important factor affecting lake inundation area in regions with relatively high rainfall. For example, 59 lakes in the EPL exhibited significant (p < 0.05) correlations with annual precipitation, and 81.35% (48/59) of these were in Class IV. Although both positive and negative correlations were observed between annual inundation area and yearly maximum temperature, average temperature and minimum temperature, the relationship between minimum temperature and area was weakest, suggesting that yearly minimum temperature has little effect on the annual area of lakes.
The most important climate and human factors affecting lake dynamics differed across the geographical classes. For example, CCF was the key driving factor for Classes I and II, for which 75% (3/4) and 42.86% (3/7) of lakes exhibited significant (p < 0.05) correlations between inundation area and CCF, respectively. One noticeable phenomenon was that two lakes in both Classes I and II exhibited significant (p < 0.05) negative correlations with CCF, indicating that human agricultural activities were the main factor causing changes in area for lakes that are freely connected to the Yangtze and Huai Rivers. By contrast, precipitation was the key driving factor affecting changes in area for lakes freely connected to the Beijing-Hangzhou Grand Reach; 33.33% (3/9) of these lakes exhibited significantly (p < 0.05) positive correlations with precipitation in Class III. For Class IV lakes, GDP, precipitation, and CCF were the three most dominant driving factors of changes in lake area, with 38.89% (56/144), 33.33% (48/144), and 32.64% (47/144) of lakes exhibiting significant correlations with GDP, precipitation, and CCF, respectively. In addition, CCF and GDP were the key factors affecting changes in lake area for Classes V and VI, with 41.67% (5/12) and 37.5% (3/8) of lakes, respectively, showing significant correlations with CCF and GDP.
In addition, the construction of the Three Gorges Dam (TGD) may be a primary reason why the area of Poyang Lake (Class I) decreased. The TGD was impounded in 2003, leading to sharply decreased water flow and in turn decreased water area (Figure 9a). Previous studies have demonstrated that the construction of the TGD has led to reductions in the area of Poyang Lake since 2003 [2,3,4].
5.2. Uncertainties
In the present study, MOD09A1/MYD09A1 images were used to obtain water maps of 184 lakes in the EPL. The quality of MODIS surface reflectance products is one reason for the uncertainty of spatio-temporal monitoring of the dynamics of large lakes. On one hand, each pixel of MOD09A1/MYD09A1 surface reflectance data contains the best possible L2G observations during an eight-day period; thus, large errors, stripe noise, clouds, shadows, and negative reflectance can be avoided in part. On the other hand, QA data with these MODIS surface reflectance products were also used to detect good observation pixels and to exclude factors such as clouds, cloud shadows, and snow. At the same time, banding/gap is also an important factor affecting MODIS data, the strip data were not involved in calculation and analysis. Due to the low spatial resolution of MODIS image data, its accuracy is not very high in some small lakes, and the challenge of low spatial resolution of the MODIS sensor, we currently have few better methods to solve it. In the future, if there are long-sequence, high-frequency, high-spatial-resolution image data, higher-precision results will be obtained, and when the sentinel data accumulates a longer time series, the long sequence, high frequency, and high spatial resolution image data will obtain higher precision results.
Despite the fact that TRMM 3B42 data are critical sources of long-term precipitation products for analyzing the relationships among precipitation, water budget, and inundation area [3,4,5,79,80,81], the spatial resolution of TRMM 3B42 is 0.25° × 0.25°, which is not very suitable for inland lakes. Moreover, this system stopped working and receiving data on 16 April 2015. Fortunately, GPM, TRMM’s successor, was launched in February 2014 to provide global-scale precipitation products [69,82,83]. Based on the IMERG algorithm, all microwave satellite sensors and microwave-calibrated infrared (IR) satellites are cross-calibrated, merged and interpolated to generate GPM IMERG products with a spatial resolution of 0.1° × 0.1° [66,68,84]. The GPM IMERG products perform better in southern and eastern China [69,85,86]. The accuracy of GPM IMERG products in the EPL also affects the spatial distribution of lake waters. In the present study, annual precipitation data were acquired from monthly GPM IMERG products and then compared to annual precipitation from field meteorological stations to evaluate the precipitation precision of GPM. The correlation coefficients for stations in Yanzhou, Wuxi, Yueyang, and Poyang were calculated (Figure 11) and were all greater than 0.8, with the exception of Poyang station. The correlations for all data pairs were 0.90, indicating good consistency between annual GPM and meteorological station precipitation. However, a correction algorithm of GPM IMERGE products should be developed in conjunction with meteorological station data in China. At the same time, water level and runoff are other important factors affecting water area, we will analyze the relationship between water level, runoff, and area in a future study.
5.3. Implications
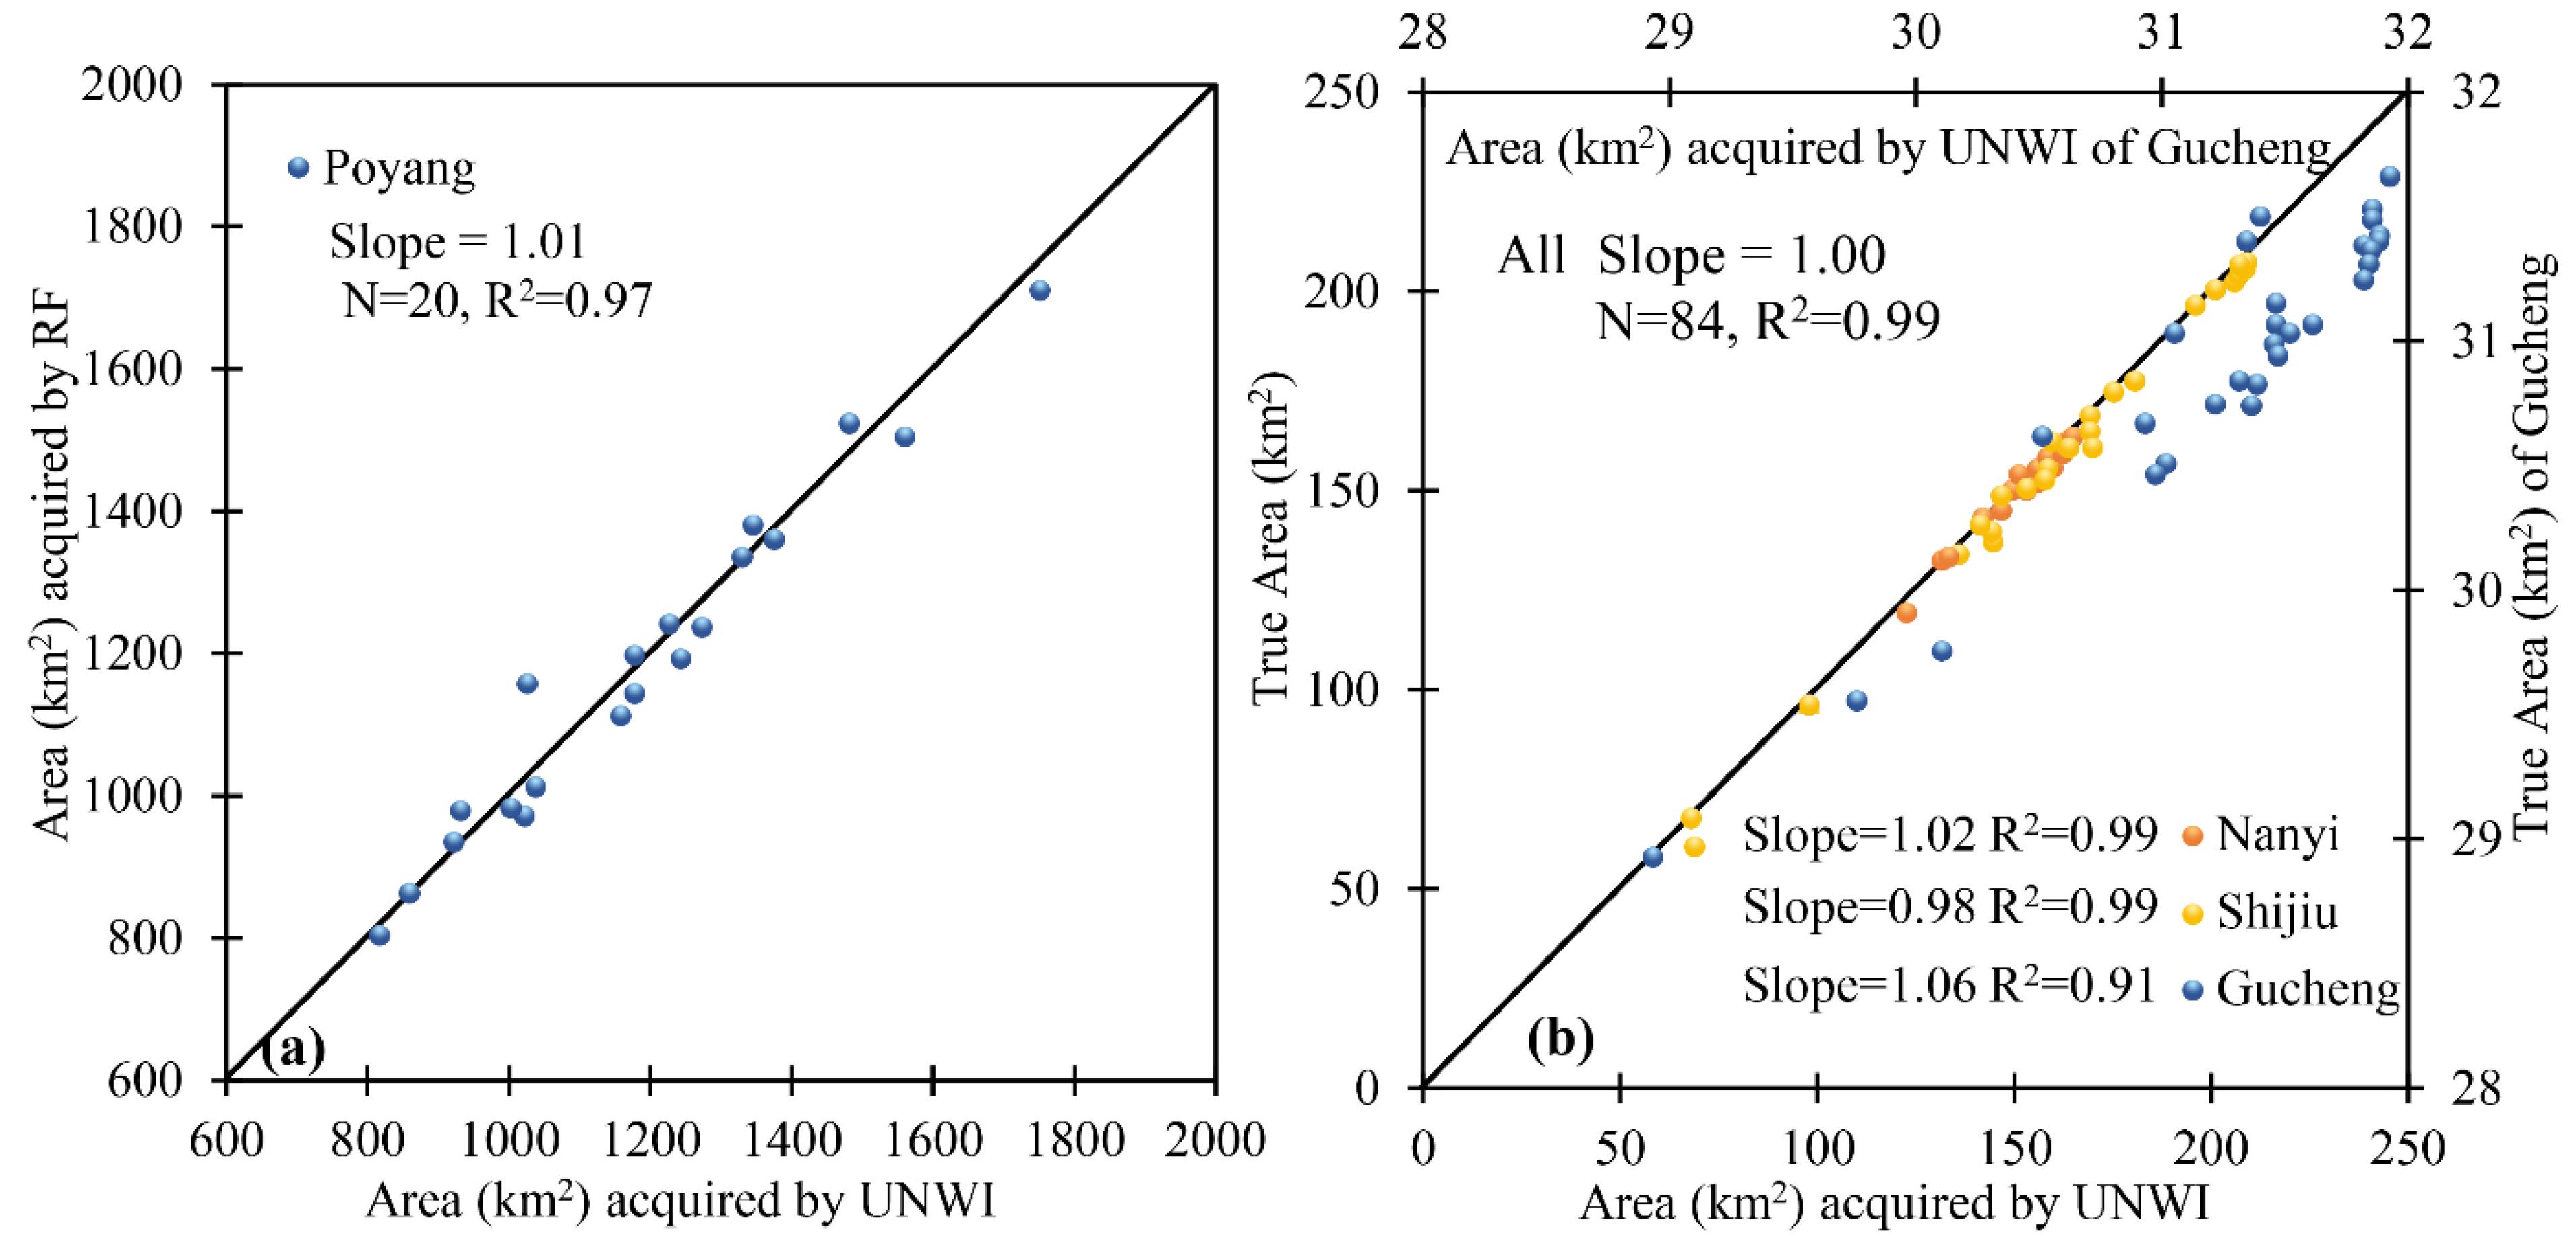
The UNWI method is a robust water extraction index, due to its use of full spectrum information, and it can also be applied to Landsat images (Figure 12). The Landsat OLI images were acquired on 15 April 2020 and 1 October 2014 in Poyang (Figure 12a) and Hongze (Figure 12c), respectively. The red color in the UNWI images produced good fits with water from the Landsat RGB images by visual examination. The water inundation of Poyang Lake during the dry season acquired by Landsat TM and OLI images via the UNWI method were also compared to the results of Wang et al. [29]. As shown in Figure 13a, the inundation area of Poyang Lake (A002) obtained through UNWI agrees well with the results of the RF classification [29]. Specifically, the R2 value for all data combined was 0.97, and the slope was 1.0096. These results indicate that water area data obtained using the UNWI method are consistent with the results of the RF classification method. Indeed, the UNWI method also works well for Sentinel-2 images, as shown in Figure 13b. The R2 values for data obtained using the UNWI method and the true inundation area of Nanyi (D006), Shijiu (A001), and Gucheng (D004) Lakes acquired by visual discrimination were 0.99, 0.99, and 0.91, respectively. The R2 value for all lake regions (84 lakes) was 0.999, and the slope was 1.0033 (Figure 13b), suggesting that the UNWI method can be used successfully for extracting water area based on Landsat and Sentinel-2 images.
The MDD format, developed by [87], is an open dataset, and includes five data storage structures: temporal sequential in band (TSB), temporal sequential in pixel (TSP), temporal interleaved by band (TIB), temporal interleaved by pixel (TIP), and temporal interleaved by spectrum (TIS). The TSB format was applied to the extraction of water area over the 21-year study period and was used to store and calculate ~7000 composite MODIS images in this study. As part of the MDD format, the TSB format can avoid complex problems caused by traditional image storage when dealing with time series images, since this format has the distinct advantage of grouping all bands of the time series data together and integrating the four-dimensional features involved in remote sensing products, such as 1D-spectral dimension, 2D-spatial dimensions, and 1D-temporal dimension, into a 4-D cube. The five data structures of MDD can be converted into one other according to MARS. Due to differences in physical storage, the different structures have different application scenarios. The TSB format is suitable for band operation and spatial filtering, since it stores spectral cube data by time sequence, and each spectral cube is stored in band sequence. The TSP format is appropriate for extracting spectral data of one or more pixels and for spectral derivative and integral operations. The advantages of the TIB, TIP, and TIS formats include extracting time series data from a single band, processing the time-spectrum data of pixels, and extracting time series data of the pixel spectral curve, respectively.
The 21-year inundation frequencies and records of 184 lakes in the EPL are highly valuable for the long-term monitoring and protection of water and wetland ecosystems. Characterized by high levels of urbanization and population density, the EPL region also serves as the most important freshwater source for human and commercial use in eastern China. Therefore, the spatio-temporal monitoring of the dynamics of large lakes in the EPL is crucial to the national economy and peoples’ livelihoods. Time series data for lake inundation from 2000 to 2020 provide not only a dynamic database for lake area but also a foundation for water quality monitoring. Based on our findings, lake reclamation and urbanization in the EPL can be quantified in future studies to achieve a better understanding of human–environment issues.
6. Conclusions
The present study provides a new method for long-term remote sensing monitoring of patterns in spatio-temporal dynamics of water; this method avoids the need for many repeated steps during processing, and it develops a full-band water extraction index, which uses full spectrum information to avoid or reduce optimal threshold adjustments. Compared to Landsat images, the producer’s accuracy range of water extraction based on UNWI algorithms was 90.45–98.87%, and the average R2 value of the lake inundation area obtained using the UNWI versus the NDWI method was 0.97. Based on the MDD framework and UNWI, the inundation conditions of 184 lakes in the EPL during 2000–2020 were accurately mapped through more than 7000 composite eight-day MOD09A1/MYD09A1 images.
Based on our results, significant seasonal variation was observed in almost all lakes located in the upper reaches of the Huai River and the middle and lower reaches of the Yangtze River. The number of lakes exhibiting significant (p < 0.05) decreases or increases was highest in autumn/summer. Meanwhile, during the 21-year observation period, 13.58% (25/184) and 25% (46/184) of lakes significantly decreased and increased in annual inundation area, respectively. Simultaneously, the inter-annual inundation area of 17 Class IV lakes exhibited a significantly decreasing trend (p < 0.05) and 43 Class IV lakes showed a significantly increasing trend (p < 0.05) from 2000–2020, which were the highest percentages for all six geographical classes.
The analysis of climate factors and human activities indicated that precipitation, GDP, and GFF were the main driving factors that led to significant increases in annual area for 46 lakes. CCF was the key driving factor for lakes in Classes I and II. By contrast, precipitation was the key driving factor affecting changes of area in Class III lakes. For Class IV lakes, GDP was the dominant driving factor of changes in lake area, with 38.89% (56/144) exhibiting significant changes. GDP and CCF were also considered key factors affecting changes in area for the lakes of Classes V and VI.
Overall, our findings provide accurate estimates of the spatio-temporal dynamics of large lakes in the EPL, China, between 2000–2020. Seasonal and annual patterns of the lake inundation area were quantified, and potential driving factors of changes in lake area were documented. Our results provide the basis and necessary foundation for the development of water quality monitoring and continuous investigations in the EPL.
Supplementary Materials
The following supporting information can be downloaded at: https://www.mdpi.com/article/10.3390/rs14040985/s1, Table S1: Summary of information (number and location), lake area changes (average area and standard deviation during 2000 ± 2020). Statistically significant correlations and contributions are annotated with * and ** represents p < 0.01 and * represents p < 0.05.
Author Contributions
Conceptualization, L.Z. and S.W.; methodology, L.Z. and S.W.; software, S.W.; validation, S.W. and H.Z.; formal analysis, S.W. and Y.C.; investigation, H.Z.; writing—original draft preparation, S.W., Y.C. and X.S.; writing—review and editing, L.Z., Q.T. and Y.C.; supervision, C.H.; funding acquisition, C.H. and L.Z. All authors have read and agreed to the published version of the manuscript.
Funding
This research was funded by the National Natural Science Foundation of China (No. 41830108), Innovation Team of XPCC’s Key Area (No. 2018CB004), Youth Innovation Promotion Association CAS (No. 2017086), and Major Projects of High Resolution Earth Observation (No. 30-H30C01-9004-19/21).
Institutional Review Board Statement
Not applicable.
Informed Consent Statement
Not applicable.
Data Availability Statement
The MODIS surface reflectance data was obtained from the Na-tional Aeronautics and Space Administration Land Processes Distribution Active Ar-chive Center (https://ladsweb.nascom.nasa.gov/, accessed on 3 March 2021), Landsat data was downloaded from the United States Geological Survey (USGS, https://earthexplorer.usgs.gov/, accessed on 12 March 2021), the annual precipitation data was downloaded from the NASA Goddard Earth Sciences (GES) Data and Information Services Center (DISC) (https://gpm1.gesdisc.eosdis.nasa.gov/data/GPM_L3/GPM_3IMERGM.06/, accessed on 24 March 2021), and the annual temperature and wind data were obtained from the National Meteorological Infor-mation Center, China (https://data.cma.cn, accessed on 24 March 2021).
Acknowledgments
The basic region of each lake data set is provided by National Tibetan Plateau Data Center (http://data.tpdc.ac.cn, accessed on 23 February 2021).
Conflicts of Interest
The authors declare no conflict of interest.
References
- Lehner, B.; Döll, P. Development and validation of a global database of lakes, reservoirs and wetlands. J. Hydrol. 2004, 296, 1–22. [Google Scholar] [CrossRef]
- Wang, J.; Sheng, Y.; Tong, T.S.D. Monitoring decadal lake dynamics across the Yangtze Basin downstream of Three Gorges Dam. Remote Sens. Environ. 2014, 152, 251–269. [Google Scholar] [CrossRef]
- Wang, Y.; Ma, J.; Xiao, X.; Wang, X.; Dai, S.; Zhao, B. Long-Term Dynamic of Poyang Lake Surface Water: A Mapping Work Based on the Google Earth Engine Cloud Platform. Remote Sens. 2019, 11, 313. [Google Scholar] [CrossRef] [Green Version]
- Feng, L.; Hu, C.; Chen, X.; Cai, X.; Tian, L.; Gan, W. Assessment of inundation changes of Poyang Lake using MODIS observations between 2000 and 2010. Remote Sens. Environ. 2012, 121, 80–92. [Google Scholar] [CrossRef]
- Hou, X.; Feng, L.; Duan, H.; Chen, X.; Sun, D.; Shi, K. Fifteen-year monitoring of the turbidity dynamics in large lakes and reservoirs in the middle and lower basin of the Yangtze River, China. Remote Sens. Environ. 2017, 190, 107–121. [Google Scholar] [CrossRef]
- Guan, Q.; Feng, L.; Hou, X.; Schurgers, G.; Zheng, Y.; Tang, J. Eutrophication changes in fifty large lakes on the Yangtze Plain of China derived from MERIS and OLCI observations. Remote Sens. Environ. 2020, 246, 111890. [Google Scholar] [CrossRef]
- Feng, L.; Han, X.; Hu, C.; Chen, X. Four decades of wetland changes of the largest freshwater lake in China: Possible linkage to the Three Gorges Dam? Remote Sens. Environ. 2016, 176, 43–55. [Google Scholar] [CrossRef]
- Pickens, A.H.; Hansen, M.C.; Hancher, M.; Stehman, S.V.; Tyukavina, A.; Potapov, P.; Marroquin, B.; Sherani, Z. Mapping and sampling to characterize global inland water dynamics from 1999 to 2018 with full Landsat time-series. Remote Sens. Environ. 2020, 243, 111792. [Google Scholar] [CrossRef]
- Smith, L.C.; Sheng, Y.; MacDonald, G.M.; Hinzman, L.D. Disappearing Arctic lakes. Science 2005, 308, 1429. [Google Scholar] [CrossRef] [Green Version]
- Ma, R.; Duan, H.; Hu, C.; Feng, X.; Li, A.; Ju, W.; Jiang, J.; Yang, G. A half-century of changes in China’s lakes: Global warming or human influence? Geophys. Res. Lett. 2010, 37, L24106. [Google Scholar] [CrossRef]
- Tao, S.; Fang, J.; Ma, S.; Cai, Q.; Xiong, X.; Tian, D.; Zhao, X.; Fang, L.; Zhang, H.; Zhu, J.; et al. Changes in China’s lakes: Climate and human impacts. Natl. Sci. Rev. 2020, 7, 132–140. [Google Scholar] [CrossRef] [PubMed] [Green Version]
- Zhang, Y.; Jeppesen, E.; Liu, X.; Qin, B.; Shi, K.; Zhou, Y.; Thomaz, S.M.; Deng, J. Global loss of aquatic vegetation in lakes. Earth-Sci. Rev. 2017, 173, 259–265. [Google Scholar] [CrossRef]
- Guo, H.; Hu, Q.; Jiang, T. Annual and seasonal streamflow responses to climate and land-cover changes in the Poyang Lake basin, China. J. Hydrol. 2008, 355, 106–122. [Google Scholar] [CrossRef]
- Vorosmarty, C.J.; McIntyre, P.B.; Gessner, M.O.; Dudgeon, D.; Prusevich, A.; Green, P.; Glidden, S.; Bunn, S.E.; Sullivan, C.A.; Liermann, C.R.; et al. Global threats to human water security and river biodiversity. Nature 2010, 467, 555–561. [Google Scholar] [CrossRef] [PubMed]
- Zou, Z.; Dong, J.; Menarguez, M.A.; Xiao, X.; Qin, Y.; Doughty, R.B.; Hooker, K.V.; David Hambright, K. Continued decrease of open surface water body area in Oklahoma during 1984–2015. Sci. Total Environ. 2017, 595, 451–460. [Google Scholar] [CrossRef] [PubMed]
- Bai, J.; Chen, X.; Li, J.; Yang, L.; Fang, H. Changes in the area of inland lakes in arid regions of central Asia during the past 30 years. Environ. Monit. Assess. 2011, 178, 247–256. [Google Scholar] [CrossRef]
- Wurtsbaugh, W.A.; Miller, C.; Null, S.E.; DeRose, R.J.; Wilcock, P.; Hahnenberger, M.; Howe, F.; Moore, J. Decline of the world’s saline lakes. Nat. Geosci. 2017, 10, 816–821. [Google Scholar] [CrossRef]
- Yang, X.; Lu, X. Drastic change in China’s lakes and reservoirs over the past decades. Sci. Rep. 2014, 4, 6041. [Google Scholar] [CrossRef] [Green Version]
- Bian, D.; Bian, B.; La, B.; Wang, C.; Chen, T. The Response of Water Level of Selin Co to Climate Change during 1975–2008. Acta Geogr. Sin. 2010, 65, 313–319. [Google Scholar]
- Lutz, A.; Immerzeel, W.; Shrestha, A.; Bierkens, M. Consistent increase in High Asia’s runoff due to increasing glacier melt and precipitation. Nat. Clim. Chang. 2014, 4, 587–592. [Google Scholar] [CrossRef] [Green Version]
- Wu, Y.; Zhu, L. The response of lake-glacier variations to climate change in Nam Co Catchment, central Tibetan Plateau, during 1970–2000. J. Geogr. Sci. 2008, 18, 177–189. [Google Scholar] [CrossRef]
- Zhang, J.; Hu, Q.; Li, Y.; Li, H.; Li, J. Area, lake-level and volume variations of typical lakes on the Tibetan Plateau and their response to climate change, 1972–2019. Geo-Spat. Inf. Sci. 2021, 24, 458–473. [Google Scholar] [CrossRef]
- Zhang, G.; Yao, T.; Chen, W.; Zheng, G.; Shum, C.K.; Yang, K.; Piao, S.; Sheng, Y.; Yi, S.; Li, J.; et al. Regional differences of lake evolution across China during 1960s–2015 and its natural and anthropogenic causes. Remote Sens. Environ. 2019, 221, 386–404. [Google Scholar] [CrossRef]
- Mao, D.; Wang, Z.; Du, B.; Li, L.; Tian, Y.; Jia, M.; Zeng, Y.; Song, K.; Jiang, M.; Wang, Y. National wetland mapping in China: A new product resulting from object-based and hierarchical classification of Landsat 8 OLI images. ISPRS J. Photogramm. Remote Sens. 2020, 164, 11–25. [Google Scholar] [CrossRef]
- Feyisa, G.L.; Meilby, H.; Fensholt, R.; Proud, S.R. Automated Water Extraction Index: A new technique for surface water mapping using Landsat imagery. Remote Sens. Environ. 2014, 140, 23–35. [Google Scholar] [CrossRef]
- Wang, Y.; Yésou, H. Remote Sensing of Floodpath Lakes and Wetlands: A Challenging Frontier in the Monitoring of Changing Environments. Remote Sens. 2018, 10, 1955. [Google Scholar] [CrossRef] [Green Version]
- Chen, B.; Chen, L.; Huang, B.; Michishita, R.; Xu, B. Dynamic monitoring of the Poyang Lake wetland by integrating Landsat and MODIS observations. ISPRS J. Photogramm. Remote Sens. 2018, 139, 75–87. [Google Scholar] [CrossRef]
- Zhuang, C.; Ouyang, Z.; Xu, W.; Bai, Y.; Zhou, W.; Zheng, H.; Wang, X. Impacts of human activities on the hydrology of Baiyangdian Lake, China. Environ. Earth Sci. 2010, 62, 1343–1350. [Google Scholar] [CrossRef] [Green Version]
- Wang, S.; Zhang, L.; Zhang, H.; Han, X.; Zhang, L. Spatial–Temporal Wetland Landcover Changes of Poyang Lake Derived from Landsat and HJ-1A/B Data in the Dry Season from 1973–2019. Remote Sens. 2020, 12, 1595. [Google Scholar] [CrossRef]
- Zeng, L.; Schmitt, M.; Li, L.; Zhu, X.X. Analysing changes of the Poyang Lake water area using Sentinel-1 synthetic aperture radar imagery. Int. J. Remote Sens. 2017, 38, 7041–7069. [Google Scholar] [CrossRef] [Green Version]
- Wang, X.; Xiao, X.; Zou, Z.; Chen, B.; Ma, J.; Dong, J.; Doughty, R.B.; Zhong, Q.; Qin, Y.; Dai, S.; et al. Tracking annual changes of coastal tidal flats in China during 1986–2016 through analyses of Landsat images with Google Earth Engine. Remote Sens. Environ. 2020, 238, 110987. [Google Scholar] [CrossRef] [PubMed]
- Wei, K.; Ouyang, C.; Duan, H.; Li, Y.; Chen, M.; Ma, J.; An, H.; Zhou, S. Reflections on the Catastrophic 2020 Yangtze River Basin Flooding in Southern China. Innovation 2020, 1, 100038. [Google Scholar] [CrossRef] [PubMed]
- McFeeters, S.K. The use of the Normalized Difference Water Index (NDWI) in the delineation of open water features. Int. J. Remote Sens. 1996, 17, 1425–1432. [Google Scholar] [CrossRef]
- Xu, H. Modification of normalised difference water index (NDWI) to enhance open water features in remotely sensed imagery. Int. J. Remote Sens. 2007, 27, 3025–3033. [Google Scholar] [CrossRef]
- Kwak, Y.-J. Nationwide Flood Monitoring for Disaster Risk Reduction Using Multiple Satellite Data. ISPRS Int. J. Geo-Inf. 2017, 6, 203. [Google Scholar] [CrossRef]
- Chandrasekar, K.; Sesha Sai, M.V.R.; Roy, P.S.; Dwevedi, R.S. Land Surface Water Index (LSWI) response to rainfall and NDVI using the MODIS Vegetation Index product. Int. J. Remote Sens. 2010, 31, 3987–4005. [Google Scholar] [CrossRef]
- Milczarek, M.; Robak, A.; Gadawska, A. Sentinel Water Mask (SWM)-new index for water detection on Sentinel-2 images. In Proceedings of the 7th Advanced Training Course on Land Remote Sensing, Gödöllő, Hungary, 4–9 September 2017. [Google Scholar]
- Kryniecka, K.; Magnuszewski, A. Application of Satellite Sentinel-2 Images to Study Alternate Sandbars Movement at Lower Vistula River (Poland). Remote Sens. 2021, 13, 1505. [Google Scholar] [CrossRef]
- Kryniecka, K.; Magnuszewski, A. Use of Sentinel-2 Images for the Detection of Sandbars Along the Lower Vistula. Acta Sci. Pol. Form. Circumiectus 2020, 19, 23–33. [Google Scholar] [CrossRef]
- Scordo, F.; Bohn, V.; Piccolo, M.; Perillo, G. Mapping and Monitoring Lakes Intra-Annual Variability in Semi-Arid Regions: A Case of Study in Patagonian Plains (Argentina). Water 2018, 10, 889. [Google Scholar] [CrossRef] [Green Version]
- Sima, S.; Ahmadalipour, A.; Shafiee Jood, M.; Tajrishy, M.; Abrishamchi, A. Monitoring Urmia Lake Area Variations Using MODIS Satellite Data. In Proceedings of the World Environmental and Water Resources Congress 2012, Albuquerque, New Mexico, 20–24 May 2012; pp. 1917–1926. [Google Scholar]
- Lin, Y.; Li, X.; Zhang, T.; Chao, N.; Yu, J.; Cai, J.; Sneeuw, N. Water Volume Variations Estimation and Analysis Using Multisource Satellite Data: A Case Study of Lake Victoria. Remote Sens. 2020, 12, 3052. [Google Scholar] [CrossRef]
- Fluet-Chouinard, E.; Lehner, B.; Rebelo, L.-M.; Papa, F.; Hamilton, S.K. Development of a global inundation map at high spatial resolution from topographic downscaling of coarse-scale remote sensing data. Remote Sens. Environ. 2015, 158, 348–361. [Google Scholar] [CrossRef]
- Jiang, X.; Gao, G.; Zhang, L.; Tang, X.; Shao, K.; Hu, Y. Denitrification and dissimilatory nitrate reduction to ammonium in freshwater lakes of the Eastern Plain, China: Influences of organic carbon and algal bloom. Sci. Total Environ. 2020, 710, 136303. [Google Scholar] [CrossRef]
- Ma, R.; Yang, G.; Duan, H.; Jiang, J.; Wang, S.; Feng, X.; Li, A.; Kong, F.; Xue, B.; Wu, J.; et al. China’s lakes at present: Number, area and spatial distribution. Sci. China Earth Sci. 2011, 54, 283–289. [Google Scholar] [CrossRef]
- Zou, W.; Zhu, G.; Cai, Y.; Vilmi, A.; Xu, H.; Zhu, M.; Gong, Z.; Zhang, Y.; Qin, B. Relationships between nutrient, chlorophyll a and Secchi depth in lakes of the Chinese Eastern Plains ecoregion: Implications for eutrophication management. J. Environ. Manag. 2020, 260, 109923. [Google Scholar] [CrossRef] [PubMed]
- Han, X.; Feng, L.; Hu, C.; Chen, X. Wetland changes of China’s largest freshwater lake and their linkage with the Three Gorges Dam. Remote Sens. Environ. 2018, 204, 799–811. [Google Scholar] [CrossRef]
- Qin, B.; Xu, P.; Wu, Q.; Luo, L.; Zhang, Y. Environmental issues of Lake Taihu, China. Hydrobiologia 2007, 581, 3–14. [Google Scholar] [CrossRef]
- Paerl, H.W.; Xu, H.; McCarthy, M.J.; Zhu, G.; Qin, B.; Li, Y.; Gardner, W.S. Controlling harmful cyanobacterial blooms in a hyper-eutrophic lake (Lake Taihu, China): The need for a dual nutrient (N & P) management strategy. Water Res. 2011, 45, 1973–1983. [Google Scholar]
- Bao, Z.; Zhang, J.; Wang, G.; Fu, G.; He, R.; Yan, X.; Jin, J.; Liu, Y.; Zhang, A. Attribution for decreasing streamflow of the Haihe River basin, northern China: Climate variability or human activities? J. Hydrol. 2012, 460–461, 117–129. [Google Scholar] [CrossRef]
- Han, X.; Chen, X.; Feng, L. Four decades of winter wetland changes in Poyang Lake based on Landsat observations between 1973 and 2013. Remote Sens. Environ. 2015, 156, 426–437. [Google Scholar] [CrossRef]
- Zhu, C.; Zhang, X.; Huang, Q. Four Decades of Estuarine Wetland Changes in the Yellow River Delta Based on Landsat Observations Between 1973 and 2013. Water 2018, 10, 933. [Google Scholar] [CrossRef] [Green Version]
- Qin, B.; Zhu, G.; Gao, G.; Zhang, Y.; Li, W.; Paerl, H.W.; Carmichael, W.W. A drinking water crisis in Lake Taihu, China: Linkage to climatic variability and lake management. Environ. Manag. 2010, 45, 105–112. [Google Scholar] [CrossRef] [PubMed]
- Su, L.; Xue, Y.; Li, L.; Yang, D.; Kolandhasamy, P.; Li, D.; Shi, H. Microplastics in Taihu Lake, China. Environ. Pollut. 2016, 216, 711–719. [Google Scholar] [CrossRef] [PubMed]
- Ben, J.; Zhang, Y.S.; Tong, X.C. Analysis of GeoTIFF and Usage of LibGeoTIFF Library. J. Inf. Eng. Univ. 2005, 6, 94–98. [Google Scholar]
- Zhang, L.; Wang, S.; Liu, H.; Lin, Y.; Zhu, M.; Gao, L.; Tong, Q. From Spectrum to Temporal Spectrum—Research on Change Detection of Remote Sensing Time Serie. Geomat. Inf. Sci. Wuhan Univ. 2021, 46, 451–468. [Google Scholar]
- Wang, S.; Li, J.; Zhang, B.; Lee, Z.; Spyrakos, E.; Feng, L.; Liu, C.; Zhao, H.; Wu, Y.; Zhu, L.; et al. Changes of water clarity in large lakes and reservoirs across China observed from long-term MODIS. Remote Sens. Environ. 2020, 247, 111949. [Google Scholar] [CrossRef]
- Strayer, D.L.; Dudgeon, D. Freshwater biodiversity conservation: Recent progress and future challenges. J. N. Am. Benthol. Soc. 2010, 29, 344–358. [Google Scholar] [CrossRef] [Green Version]
- Ren, S.; Zhang, B.; Wang, W.-J.; Yuan, Y.; Guo, C. Sedimentation and its response to management strategies of the Three Gorges Reservoir, Yangtze River, China. Catena 2021, 199, 105096. [Google Scholar] [CrossRef]
- Duan, H.; Loiselle, S.A.; Zhu, L.; Feng, L.; Zhang, Y.; Ma, R. Distribution and incidence of algal blooms in Lake Taihu. Aquat. Sci. 2014, 77, 9–16. [Google Scholar] [CrossRef]
- Feng, L.; Hou, X.; Zheng, Y. Monitoring and understanding the water transparency changes of fifty large lakes on the Yangtze Plain based on long-term MODIS observations. Remote Sens. Environ. 2019, 221, 675–686. [Google Scholar] [CrossRef]
- Adrian, R.; O’Reilly, C.M.; Zagarese, H.; Baines, S.B.; Hessen, D.O.; Keller, W.; Livingstone, D.M.; Sommaruga, R.; Straile, D.; Van Donk, E.; et al. Lakes as sentinels of climate change. Limnol. Oceanogr. 2009, 54, 2283–2297. [Google Scholar] [CrossRef]
- Zhang, G. China Lake Dataset (1960s–2020); National Tibetan Plateau Data Center: Beijing, China, 2019. [Google Scholar] [CrossRef]
- Masek, J.G.; Huang, C.; Wolfe, R.; Cohen, W.; Hall, F.; Kutler, J.; Nelson, P. North American forest disturbance mapped from a decadal Landsat record. Remote Sens. Environ. 2008, 112, 2914–2926. [Google Scholar] [CrossRef]
- Vermote, E.; Justice, C.; Claverie, M.; Franch, B. Preliminary analysis of the performance of the Landsat 8/OLI land surface reflectance product. Remote Sens. Environ. 2016, 185, 46–56. [Google Scholar] [CrossRef] [PubMed]
- Hou, A.Y.; Kakar, R.K.; Neeck, S.; Azarbarzin, A.A.; Kummerow, C.D.; Kojima, M.; Oki, R.; Nakamura, K.; Iguchi, T. The Global Precipitation Measurement Mission. Bull. Am. Meteorol. Soc. 2014, 95, 701–722. [Google Scholar] [CrossRef]
- Liu, Z. Comparison of Integrated Multisatellite Retrievals for GPM (IMERG) and TRMM Multisatellite Precipitation Analysis (TMPA) Monthly Precipitation Products: Initial Results. J. Hydrometeorol. 2016, 17, 777–790. [Google Scholar] [CrossRef]
- Kim, K.; Park, J.; Baik, J.; Choi, M. Evaluation of topographical and seasonal feature using GPM IMERG and TRMM 3B42 over Far-East Asia. Atmos. Res. 2017, 187, 95–105. [Google Scholar] [CrossRef]
- Fang, J.; Yang, W.; Luan, Y.; Du, J.; Lin, A.; Zhao, L. Evaluation of the TRMM 3B42 and GPM IMERG products for extreme precipitation analysis over China. Atmos. Res. 2019, 223, 24–38. [Google Scholar] [CrossRef]
- Prakash, S.; Mitra, A.K.; AghaKouchak, A.; Liu, Z.; Norouzi, H.; Pai, D.S. A preliminary assessment of GPM-based multi-satellite precipitation estimates over a monsoon dominated region. J. Hydrol. 2018, 556, 865–876. [Google Scholar] [CrossRef] [Green Version]
- Hou, X.; Feng, L.; Tang, J.; Song, X.-P.; Liu, J.; Zhang, Y.; Wang, J.; Xu, Y.; Dai, Y.; Zheng, Y.; et al. Anthropogenic transformation of Yangtze Plain freshwater lakes: Patterns, drivers and impacts. Remote Sens. Environ. 2020, 248, 111998. [Google Scholar] [CrossRef]
- Zhang, L.; Chen, H.; Sun, X.; Fu, D.; Tong, Q. Designing spatial-temporal-spectral integrated storage structure of multi-dimensional remote sensing images. J. Remote Sens. 2017, 21, 62–73. [Google Scholar]
- Zhang, L.; Fujiwara, N.; Furumi, S.; Muramatsu, K.; Daigo, M.; Zhang, L. Assessment of the universal pattern decomposition method using MODIS and ETM+ data. Int. J. Remote Sens. 2010, 28, 125–142. [Google Scholar] [CrossRef]
- Zhang, L.; Furumi, S.; Muramatsu, K.; Fujiwara, N.; Daigo, M.; Zhang, L. Sensor-independent analysis method for hyperspectral data based on the pattern decomposition method. Int. J. Remote Sens. 2007, 27, 4899–4910. [Google Scholar] [CrossRef]
- Zhang, L.; Qiao, N.; Baig, M.H.A.; Huang, C.; Lv, X.; Sun, X.; Zhang, Z. Monitoring vegetation dynamics using the universal normalized vegetation index (UNVI): An optimized vegetation index-VIUPD. Remote Sens. Lett. 2019, 10, 629–638. [Google Scholar] [CrossRef]
- Hamed, K.H. Trend detection in hydrologic data: The Mann–Kendall trend test under the scaling hypothesis. J. Hydrol. 2008, 349, 350–363. [Google Scholar] [CrossRef]
- Shen, M.; Duan, H.; Cao, Z.; Xue, K.; Qi, T.; Ma, J.; Liu, D.; Song, K.; Huang, C.; Song, X. Sentinel-3 OLCI observations of water clarity in large lakes in eastern China: Implications for SDG 6.3.2 evaluation. Remote Sens. Environ. 2020, 247, 111950. [Google Scholar] [CrossRef]
- Shi, P.; Sun, S.; Wang, M.; Li, N.; Wang, J.A.; Jin, Y.; Gu, X.; Yin, W. Climate change regionalization in China (1961–2010). Sci. China Earth Sci. 2014, 57, 2676–2689. [Google Scholar] [CrossRef]
- Li, X.-H.; Zhang, Q.; Xu, C.-Y. Suitability of the TRMM satellite rainfalls in driving a distributed hydrological model for water balance computations in Xinjiang catchment, Poyang lake basin. J. Hydrol. 2012, 426–427, 28–38. [Google Scholar] [CrossRef]
- Zhou, H.; Luo, Z.; Tangdamrongsub, N.; Zhou, Z.; He, L.; Xu, C.; Li, Q.; Wu, Y. Identifying Flood Events over the Poyang Lake Basin Using Multiple Satellite Remote Sensing Observations, Hydrological Models and In Situ Data. Remote Sens. 2018, 10, 713. [Google Scholar] [CrossRef] [Green Version]
- Li, B.; Zhang, J.; Yu, Z.; Liang, Z.; Chen, L.; Acharya, K. Climate change driven water budget dynamics of a Tibetan inland lake. Glob. Planet. Chang. 2017, 150, 70–80. [Google Scholar] [CrossRef]
- Xu, R.; Tian, F.; Yang, L.; Hu, H.; Lu, H.; Hou, A. Ground validation of GPM IMERG and TRMM 3B42V7 rainfall products over southern Tibetan Plateau based on a high-density rain gauge network. J. Geophys. Res. Atmos. 2017, 122, 910–924. [Google Scholar] [CrossRef]
- Sharifi, E.; Steinacker, R.; Saghafian, B. Assessment of GPM-IMERG and Other Precipitation Products against Gauge Data under Different Topographic and Climatic Conditions in Iran: Preliminary Results. Remote Sens. 2016, 8, 135. [Google Scholar] [CrossRef] [Green Version]
- Wang, Z.; Zhong, R.; Lai, C.; Chen, J. Evaluation of the GPM IMERG satellite-based precipitation products and the hydrological utility. Atmos. Res. 2017, 196, 151–163. [Google Scholar] [CrossRef]
- Jiang, S.; Ren, L.; Xu, C.-Y.; Yong, B.; Yuan, F.; Liu, Y.; Yang, X.; Zeng, X. Statistical and hydrological evaluation of the latest Integrated Multi-satellitE Retrievals for GPM (IMERG) over a midlatitude humid basin in South China. Atmos. Res. 2018, 214, 418–429. [Google Scholar] [CrossRef]
- Jiang, L.; Bauer-Gottwein, P. How do GPM IMERG precipitation estimates perform as hydrological model forcing? Evaluation for 300 catchments across Mainland China. J. Hydrol. 2019, 572, 486–500. [Google Scholar] [CrossRef]
- Zhang, L.; Sun, X.; Zhang, X.; Wang, N.; Zhang, M.; Lin, Y.; Huang, H.; Cen, Y.; Huang, C.; Yang, H.; et al. A Multi-Dimensional Data Format (MDD) and Analysis Tool. J. Glob. Chang. Data Discov. 2017, 1, 121–135. [Google Scholar]
Figure 1.
Locations of the 184 study lakes in the EPL region and MODIS-derived annual water frequency, (a) the EPL region and the inset shows the number of lakes with decreasing or increasing trends in annual area for the six classes, (b) the middle of the Yangtze Plain. Lakes for which the annual lake area significantly (p < 0.05) increased or decreased are marked with the symbol “↑” or “↓”, respectively.
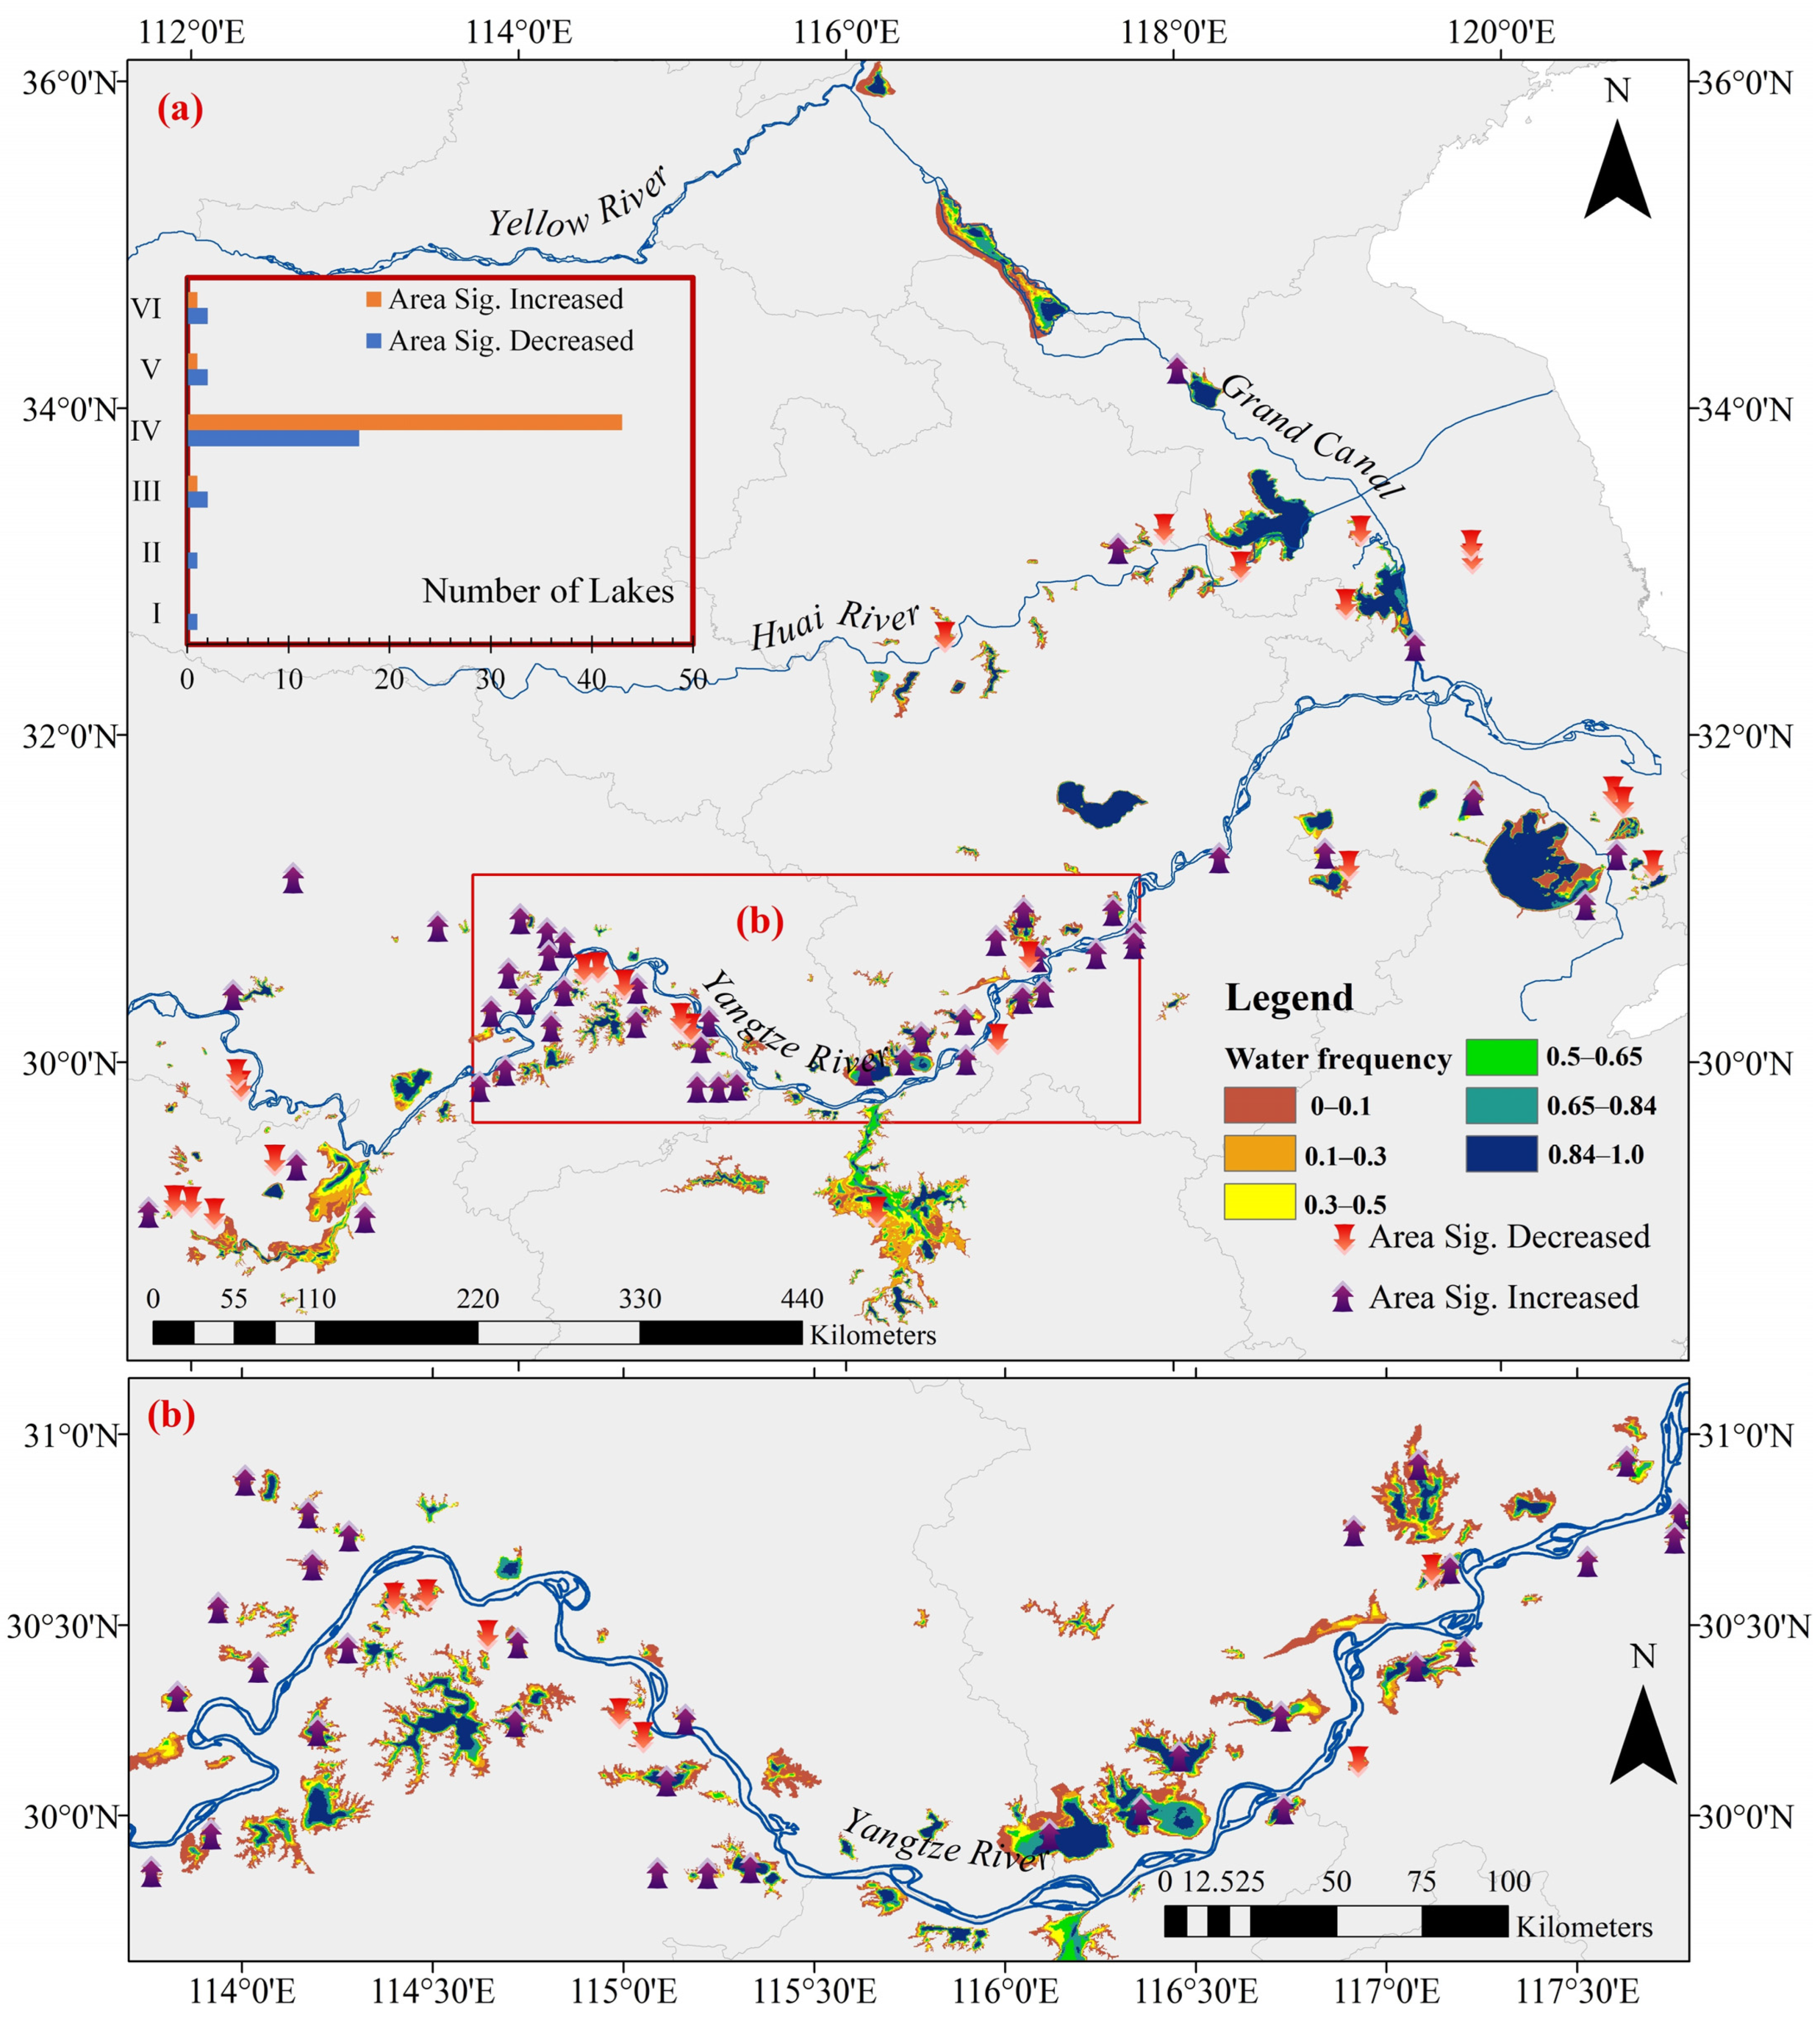
Figure 2.
Work flow of this study (where , , , and are the decomposition coefficients for water, vegetation, soil, and yellow leaves, respectively; see Section 3.2, and 2002185, 2000193…, 2020361 represents for the 185th day of the year 2002, 193th day of the year 2000, …, 361th day of the year 2020, respectively).
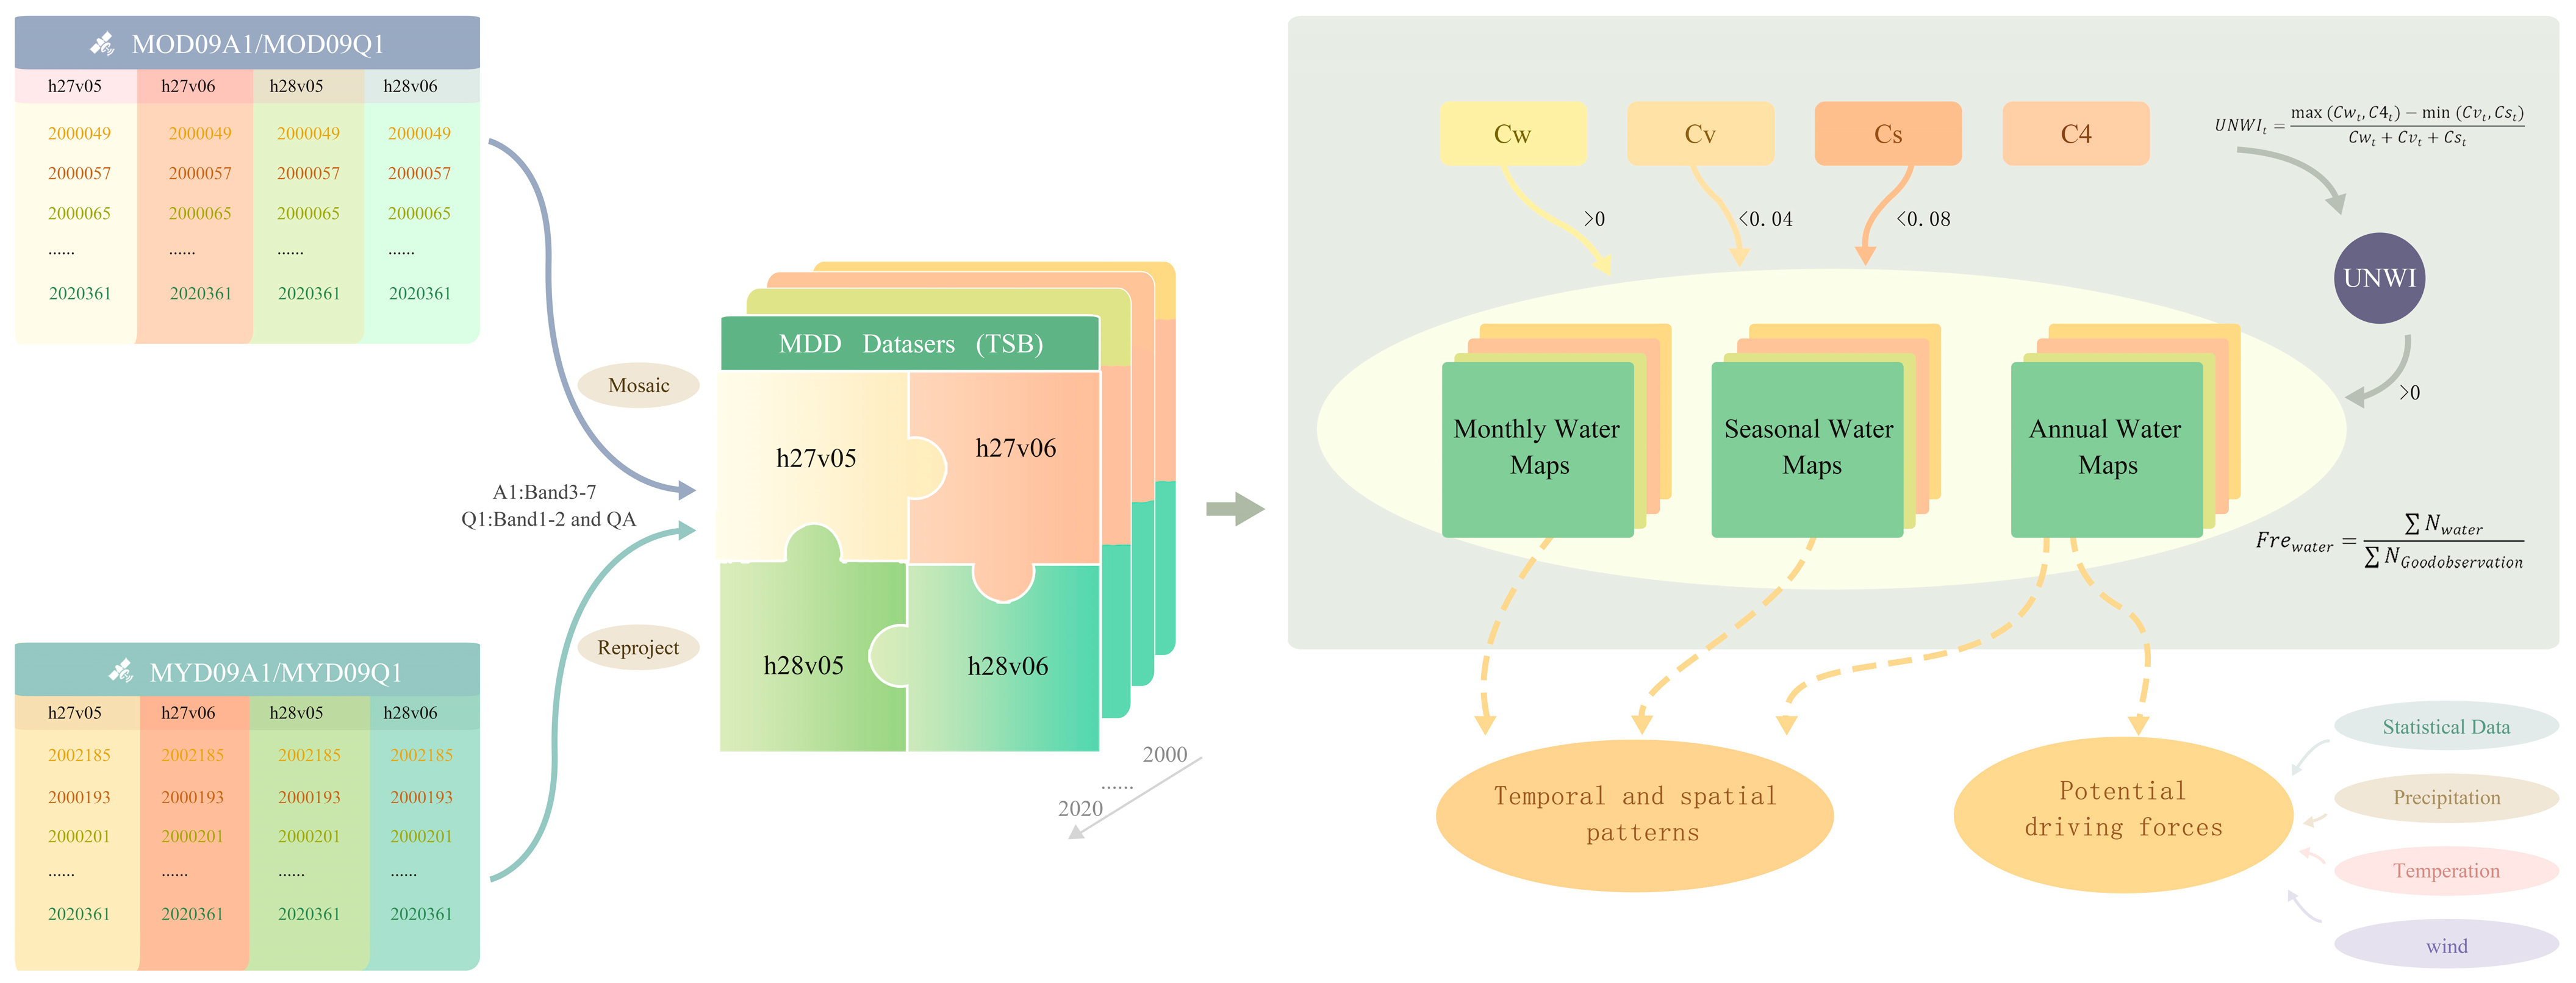
Figure 3.
TSB storage structure (T and B represent time and bands of the images, respectively).
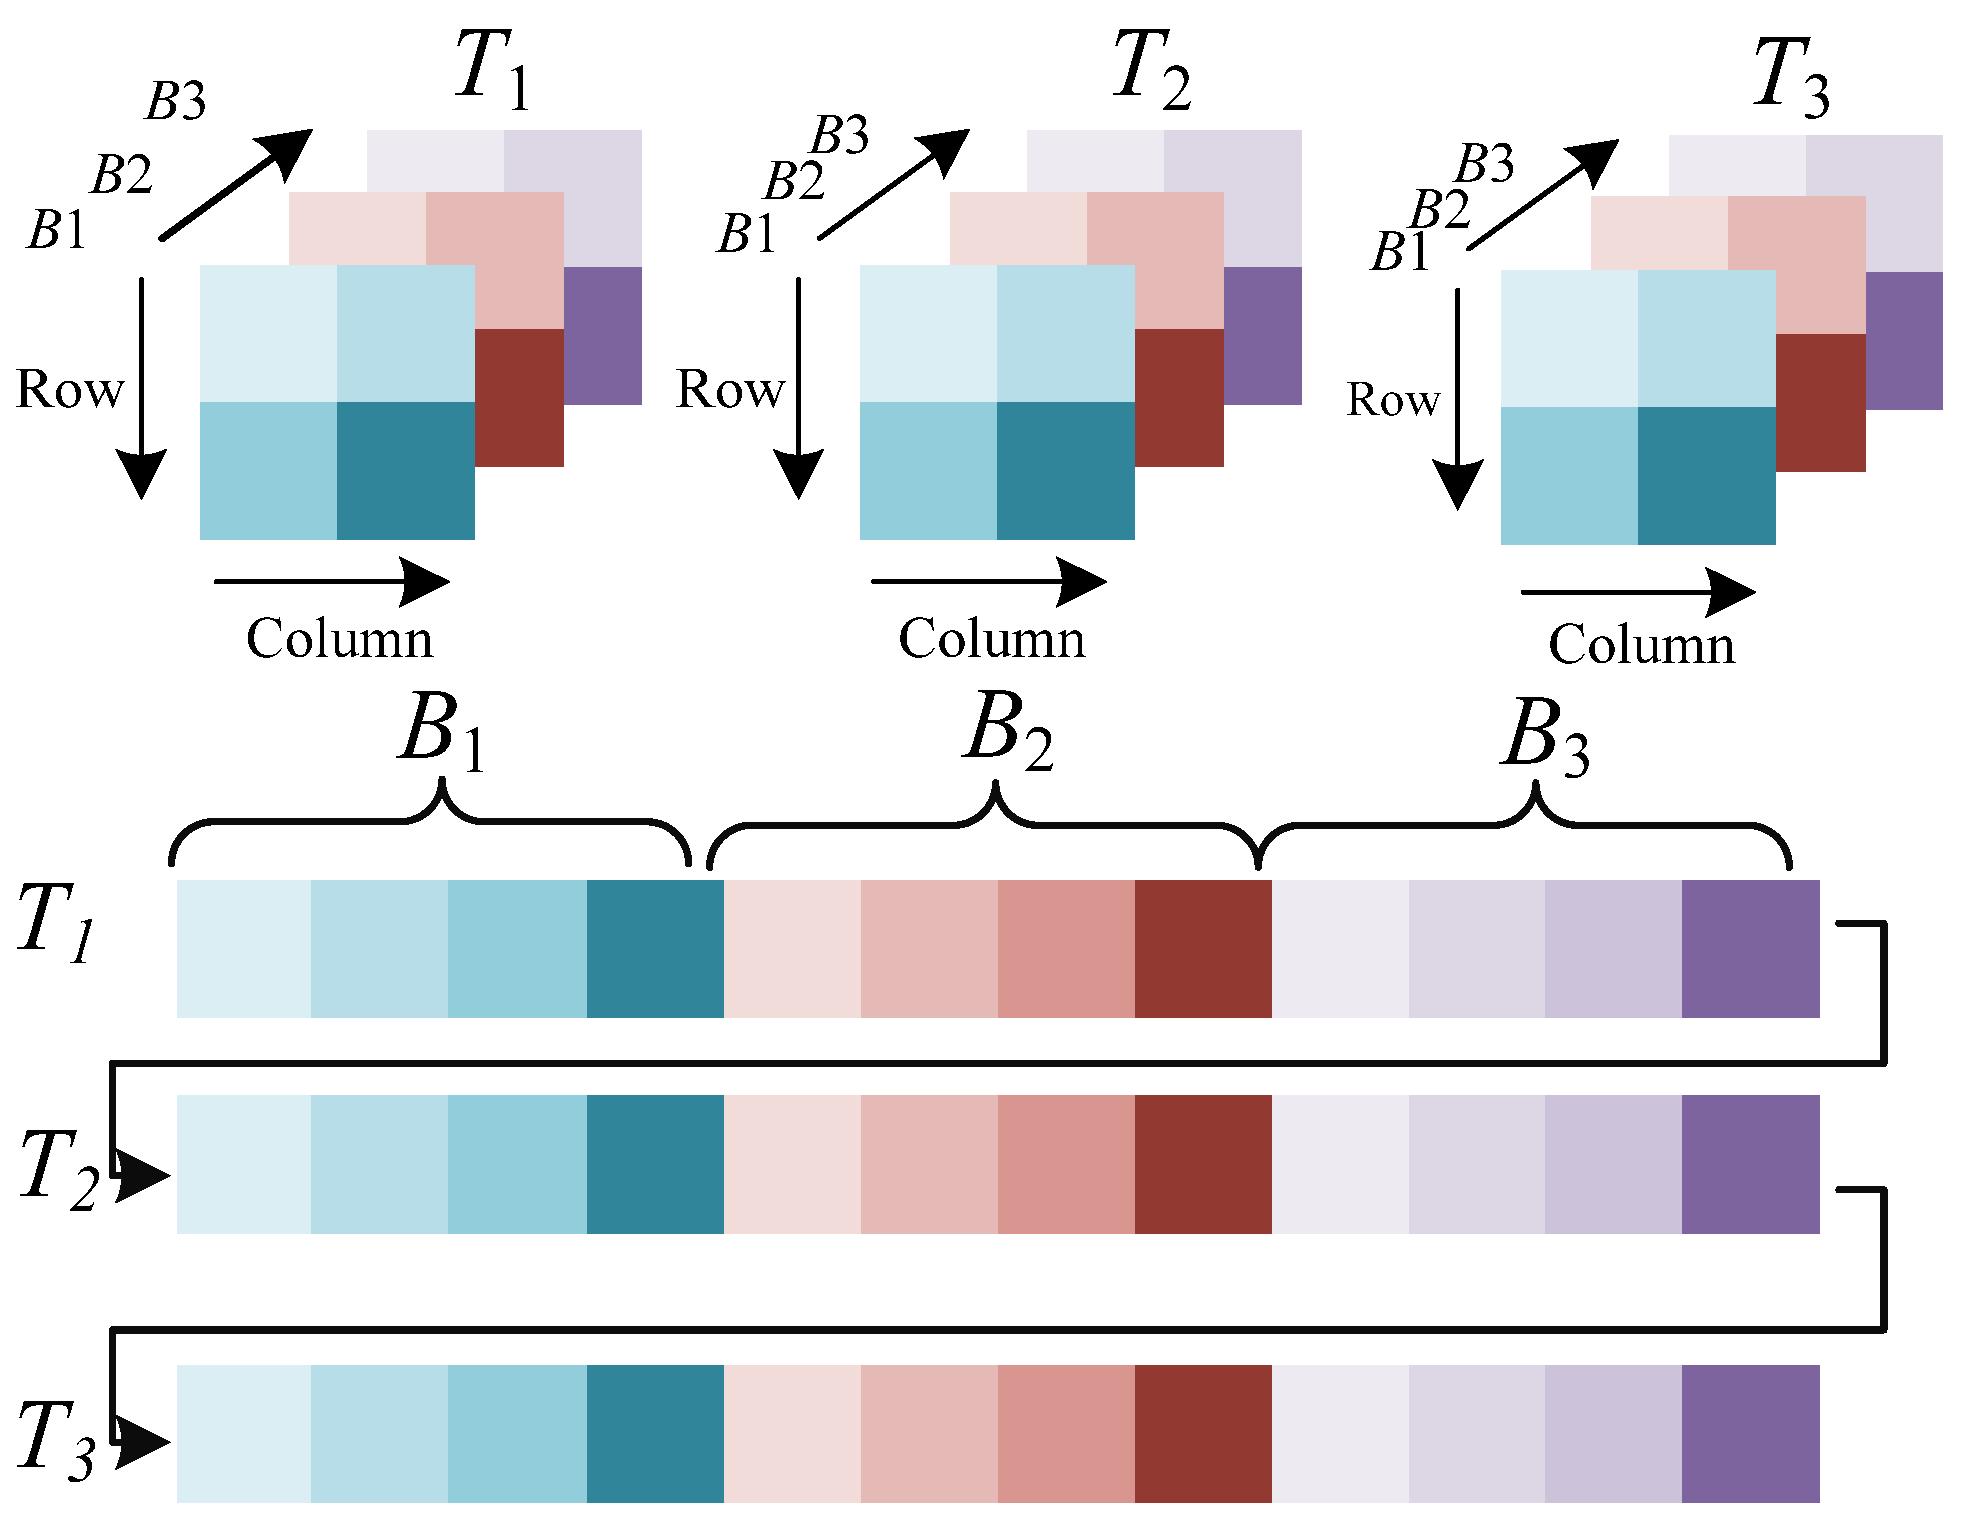
Figure 4.
The UPDM dimensional space distributions of pure pixels of major land cover types based on MODIS images, (a) , (b) , (c) , and (d) . Each box-plot shows the location of the maximum, 75th, 50th, 25th percentiles, and the minimum values using horizontal lines. (note, , , , and are the decomposition coefficients for water, vegetation, soil, and yellow leaves, respectively).
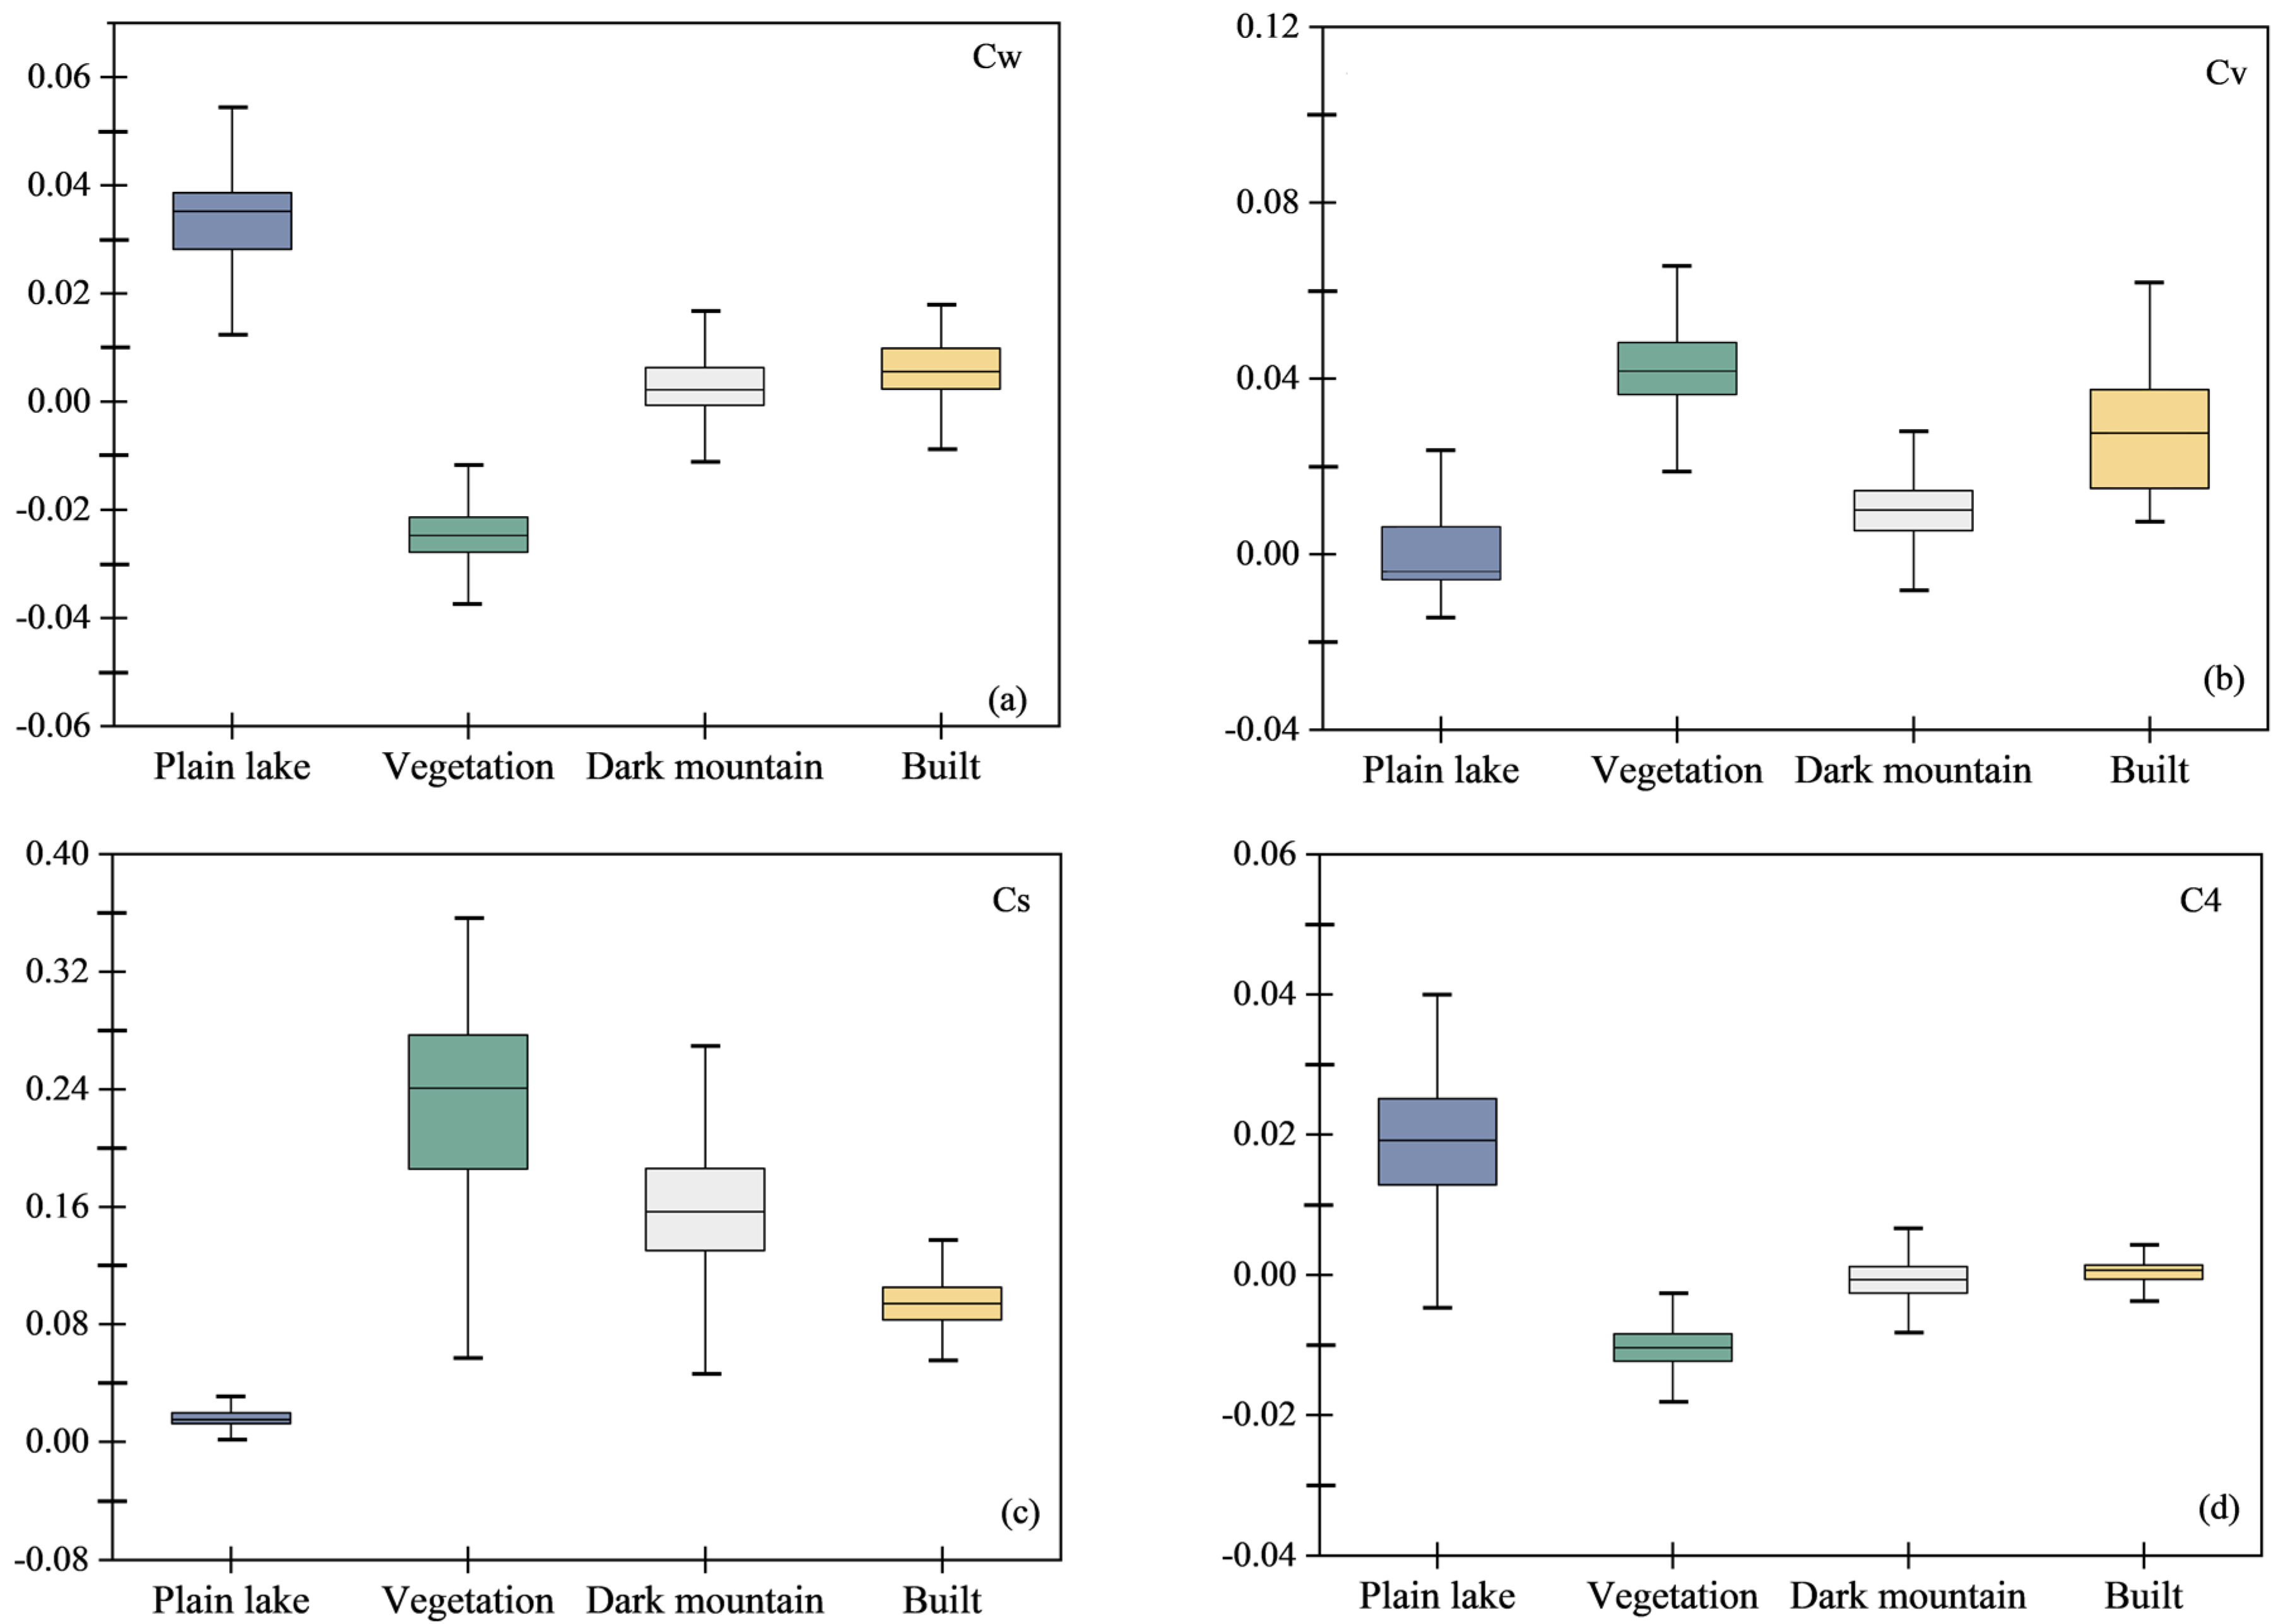
Figure 5.
UNWI distributions of pure pixels of major land cover types.
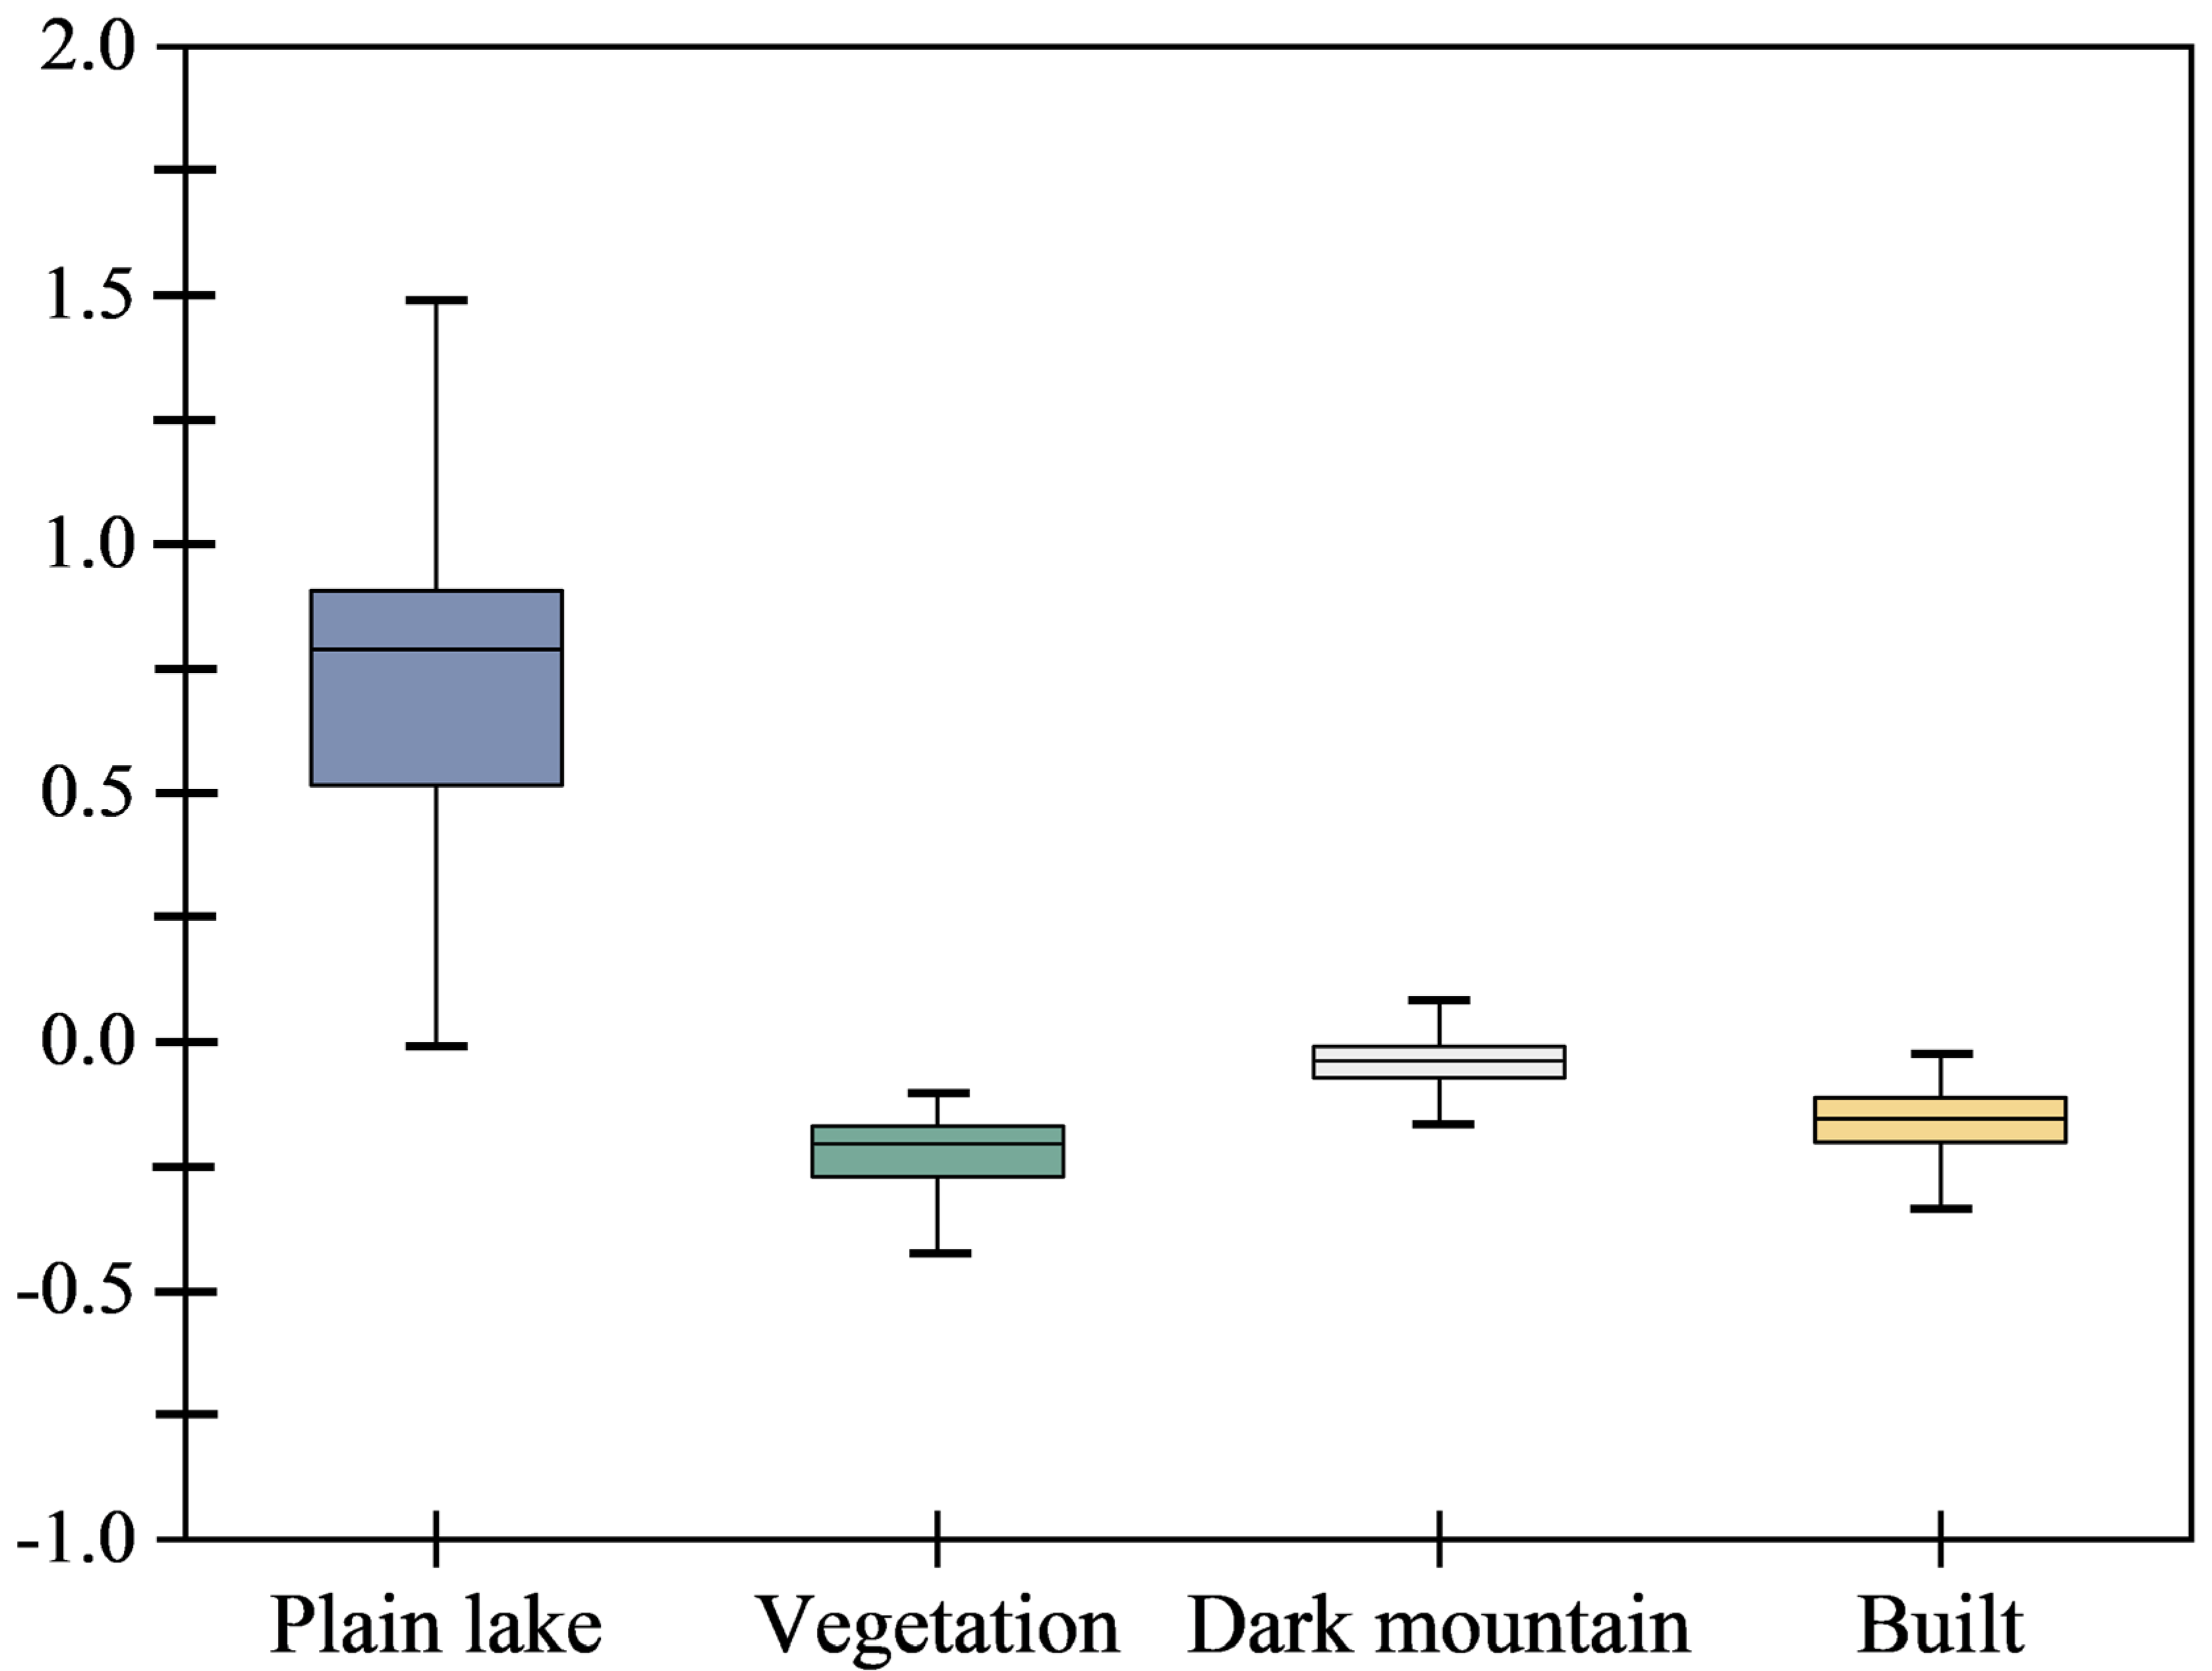
Figure 6.
Comparisons between the water-land boundaries derived from Landsat and MODIS. Poyang: (a,b); Hongze: (c,d); and Chaohu: (e,f). Red and yellow lines represent the boundaries derived from MODIS and Landsat, respectively.
Figure 6.
Comparisons between the water-land boundaries derived from Landsat and MODIS. Poyang: (a,b); Hongze: (c,d); and Chaohu: (e,f). Red and yellow lines represent the boundaries derived from MODIS and Landsat, respectively.
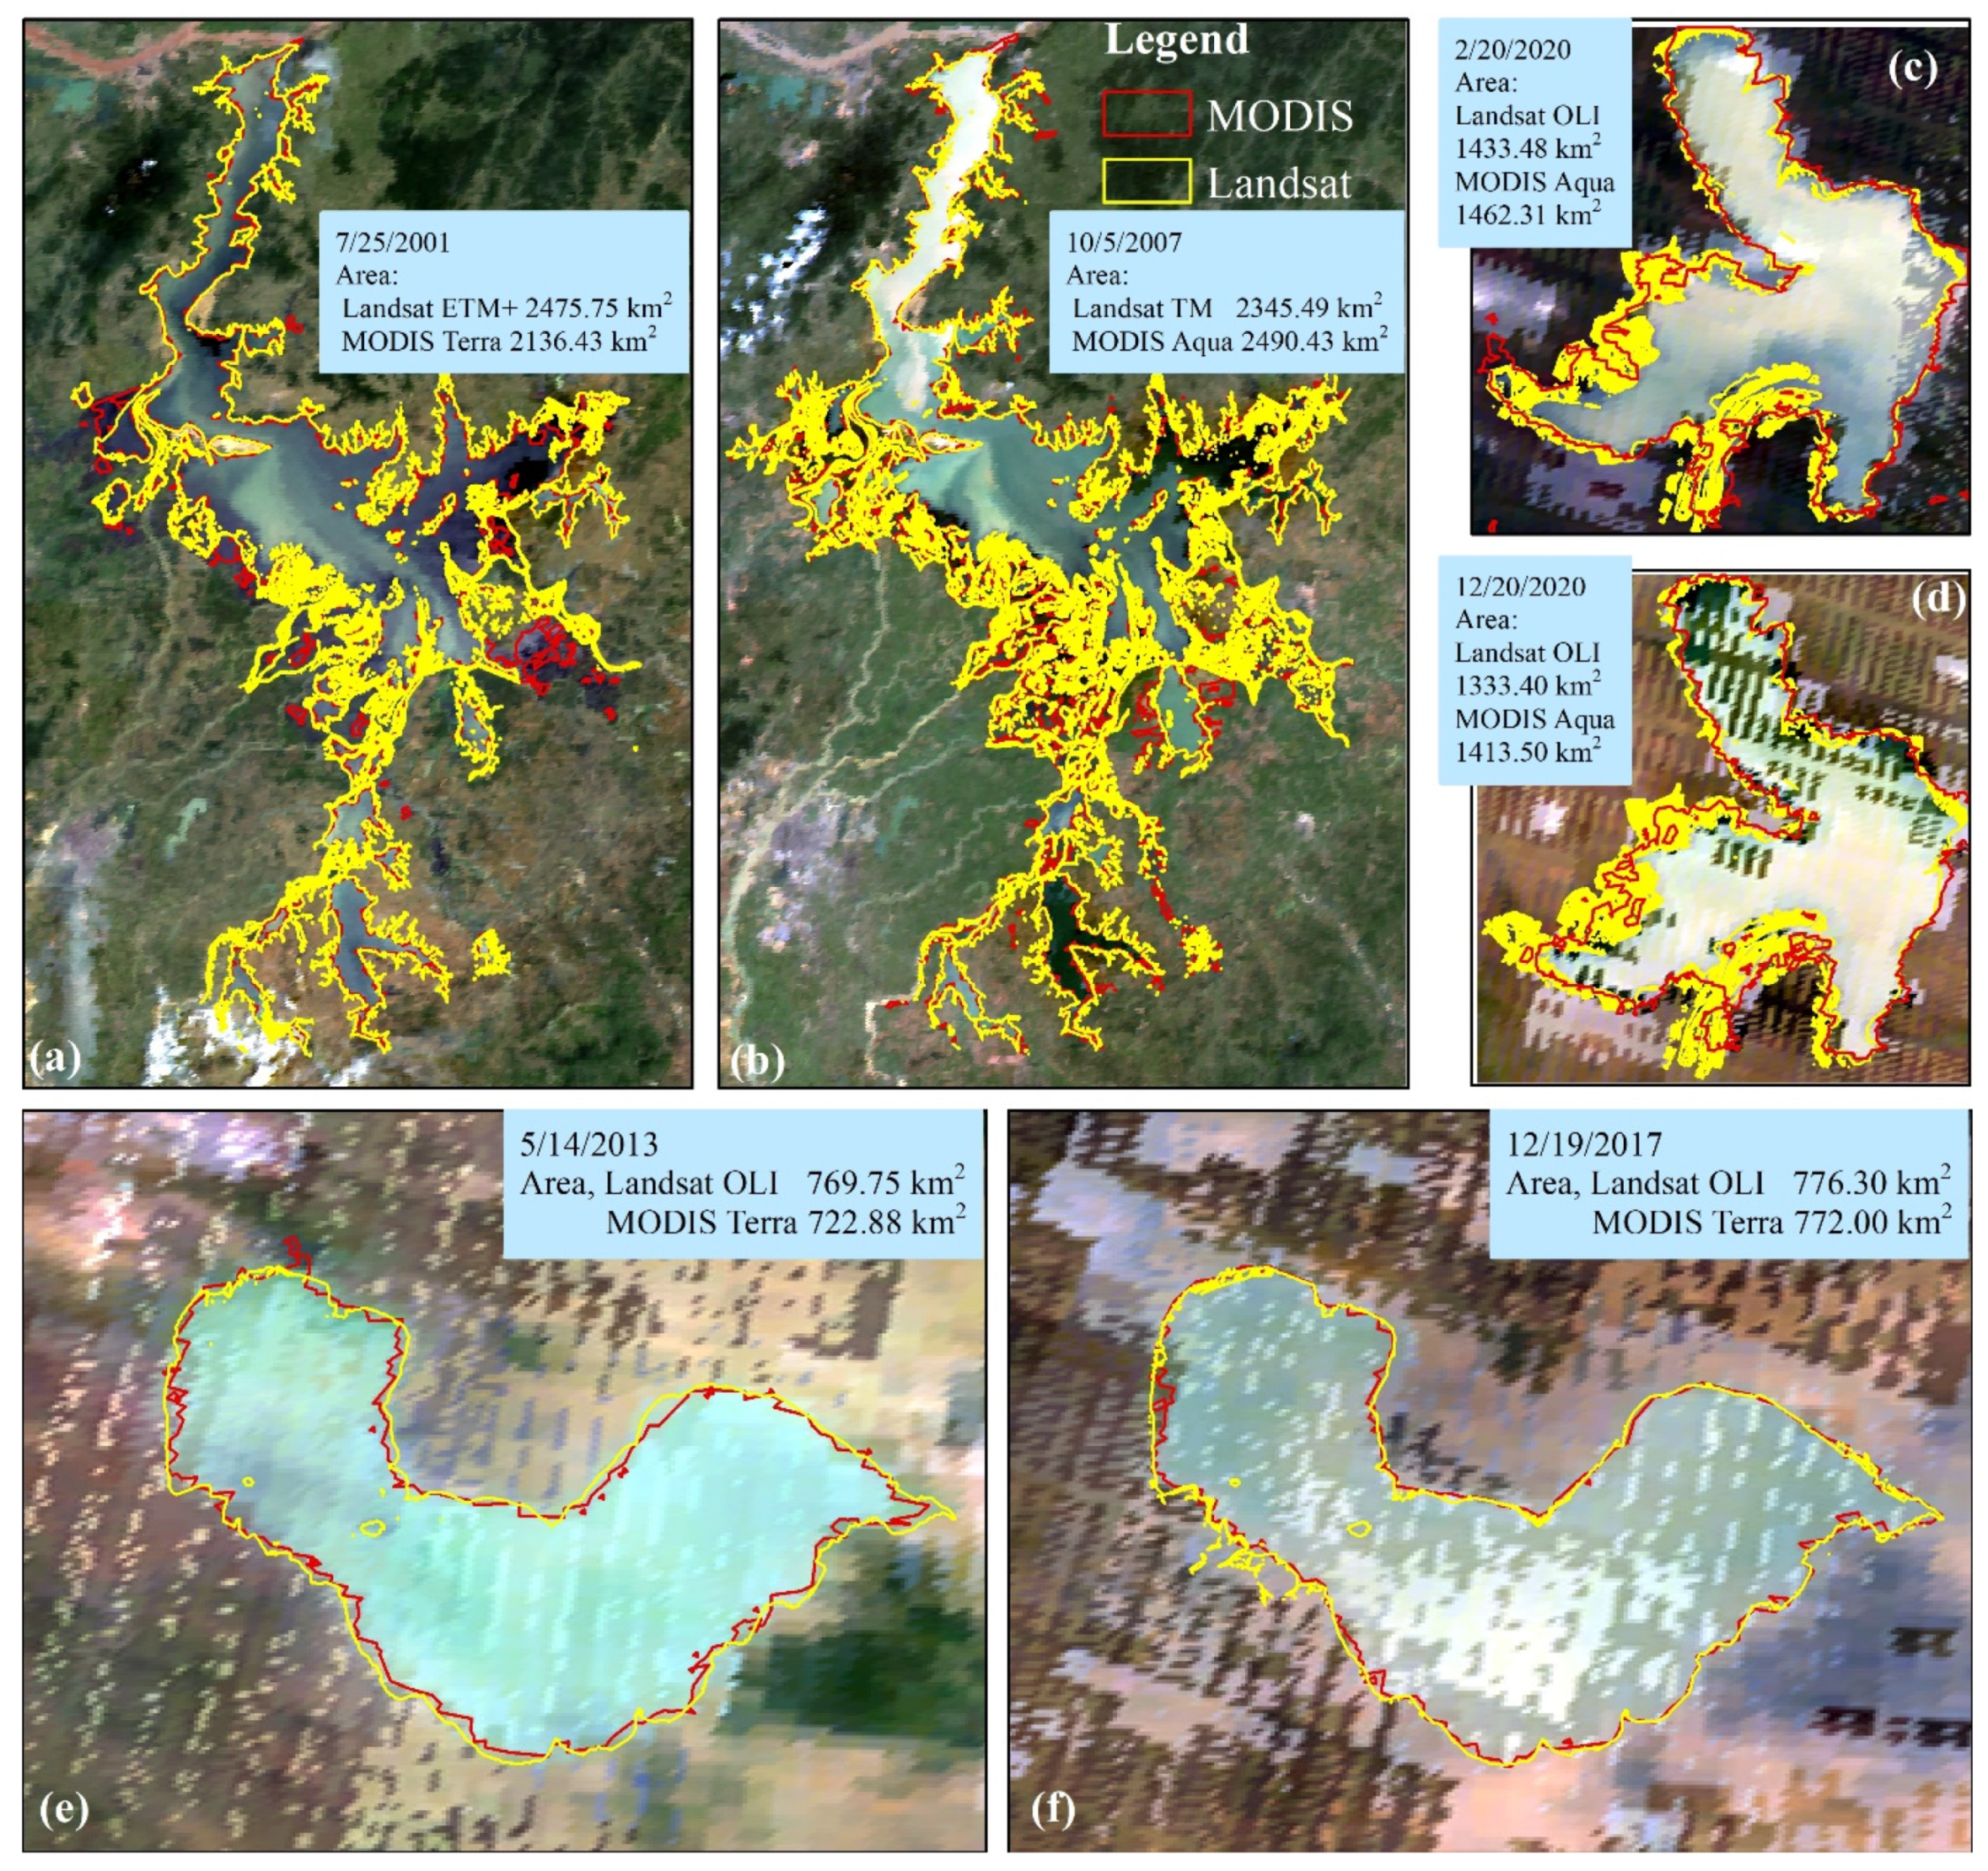
Figure 7.
Comparisons of UNWI and NDWI results from MODIS (a) Terra and (b) Aqua during 2015–2017. The red line represents the 1:1 line.
Figure 7.
Comparisons of UNWI and NDWI results from MODIS (a) Terra and (b) Aqua during 2015–2017. The red line represents the 1:1 line.
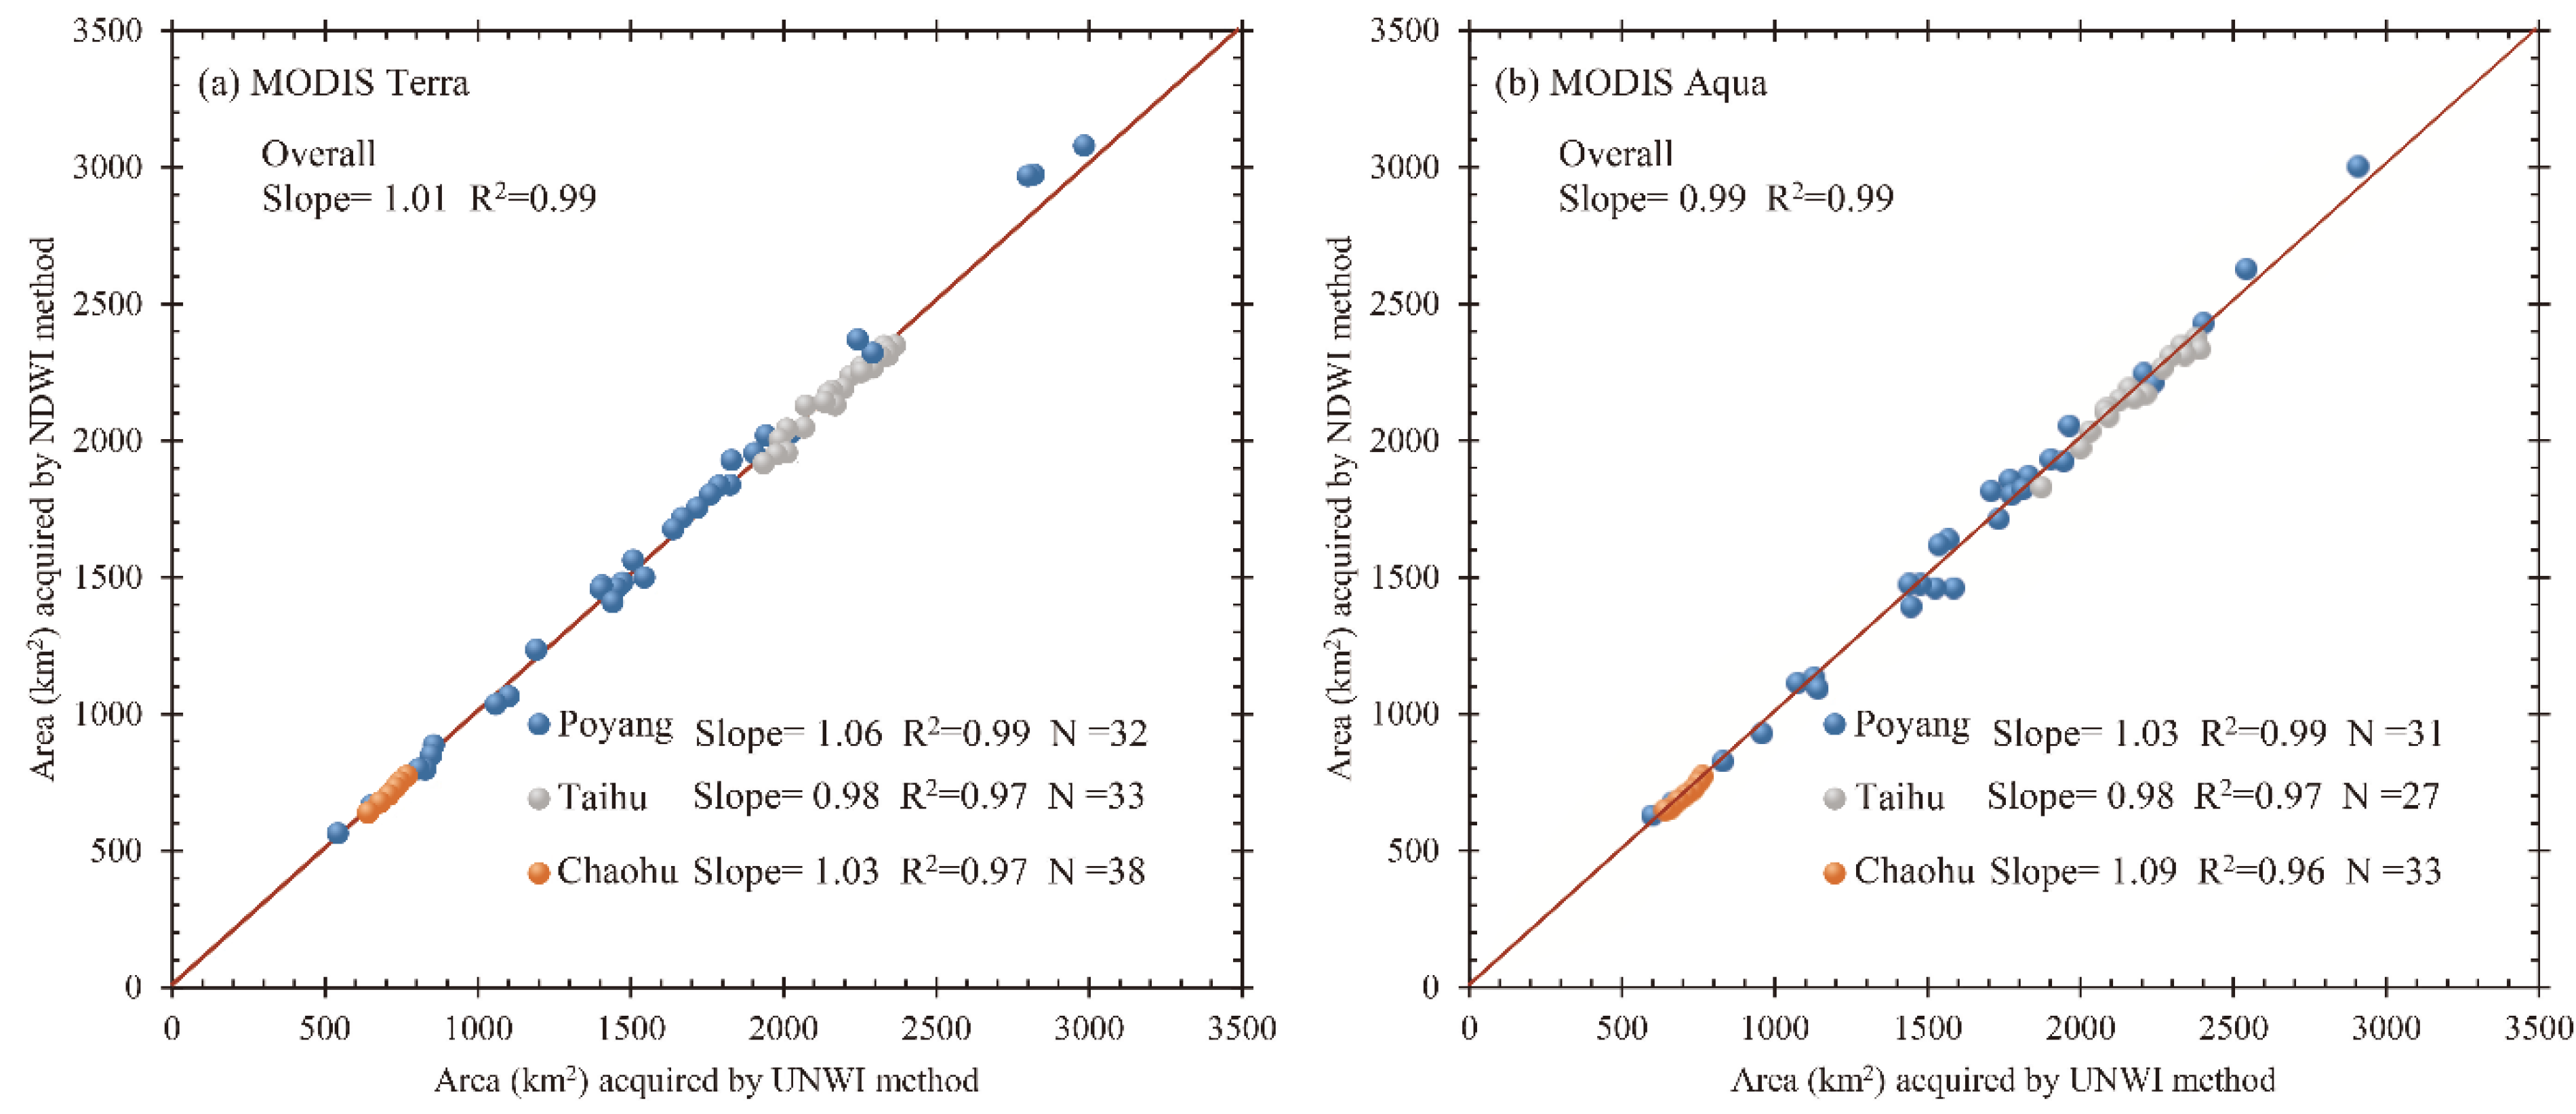
Figure 8.
Seasonal water frequency of the study lakes in the EPL. Seasonal lake area significantly (p < 0.05) increased or decreased, denoted with the symbol “↑” or “↓”, respectively. Water frequencies were calculated for each meteorological season: (a) spring, (b) summer, (c) autumn, and (d) winter.
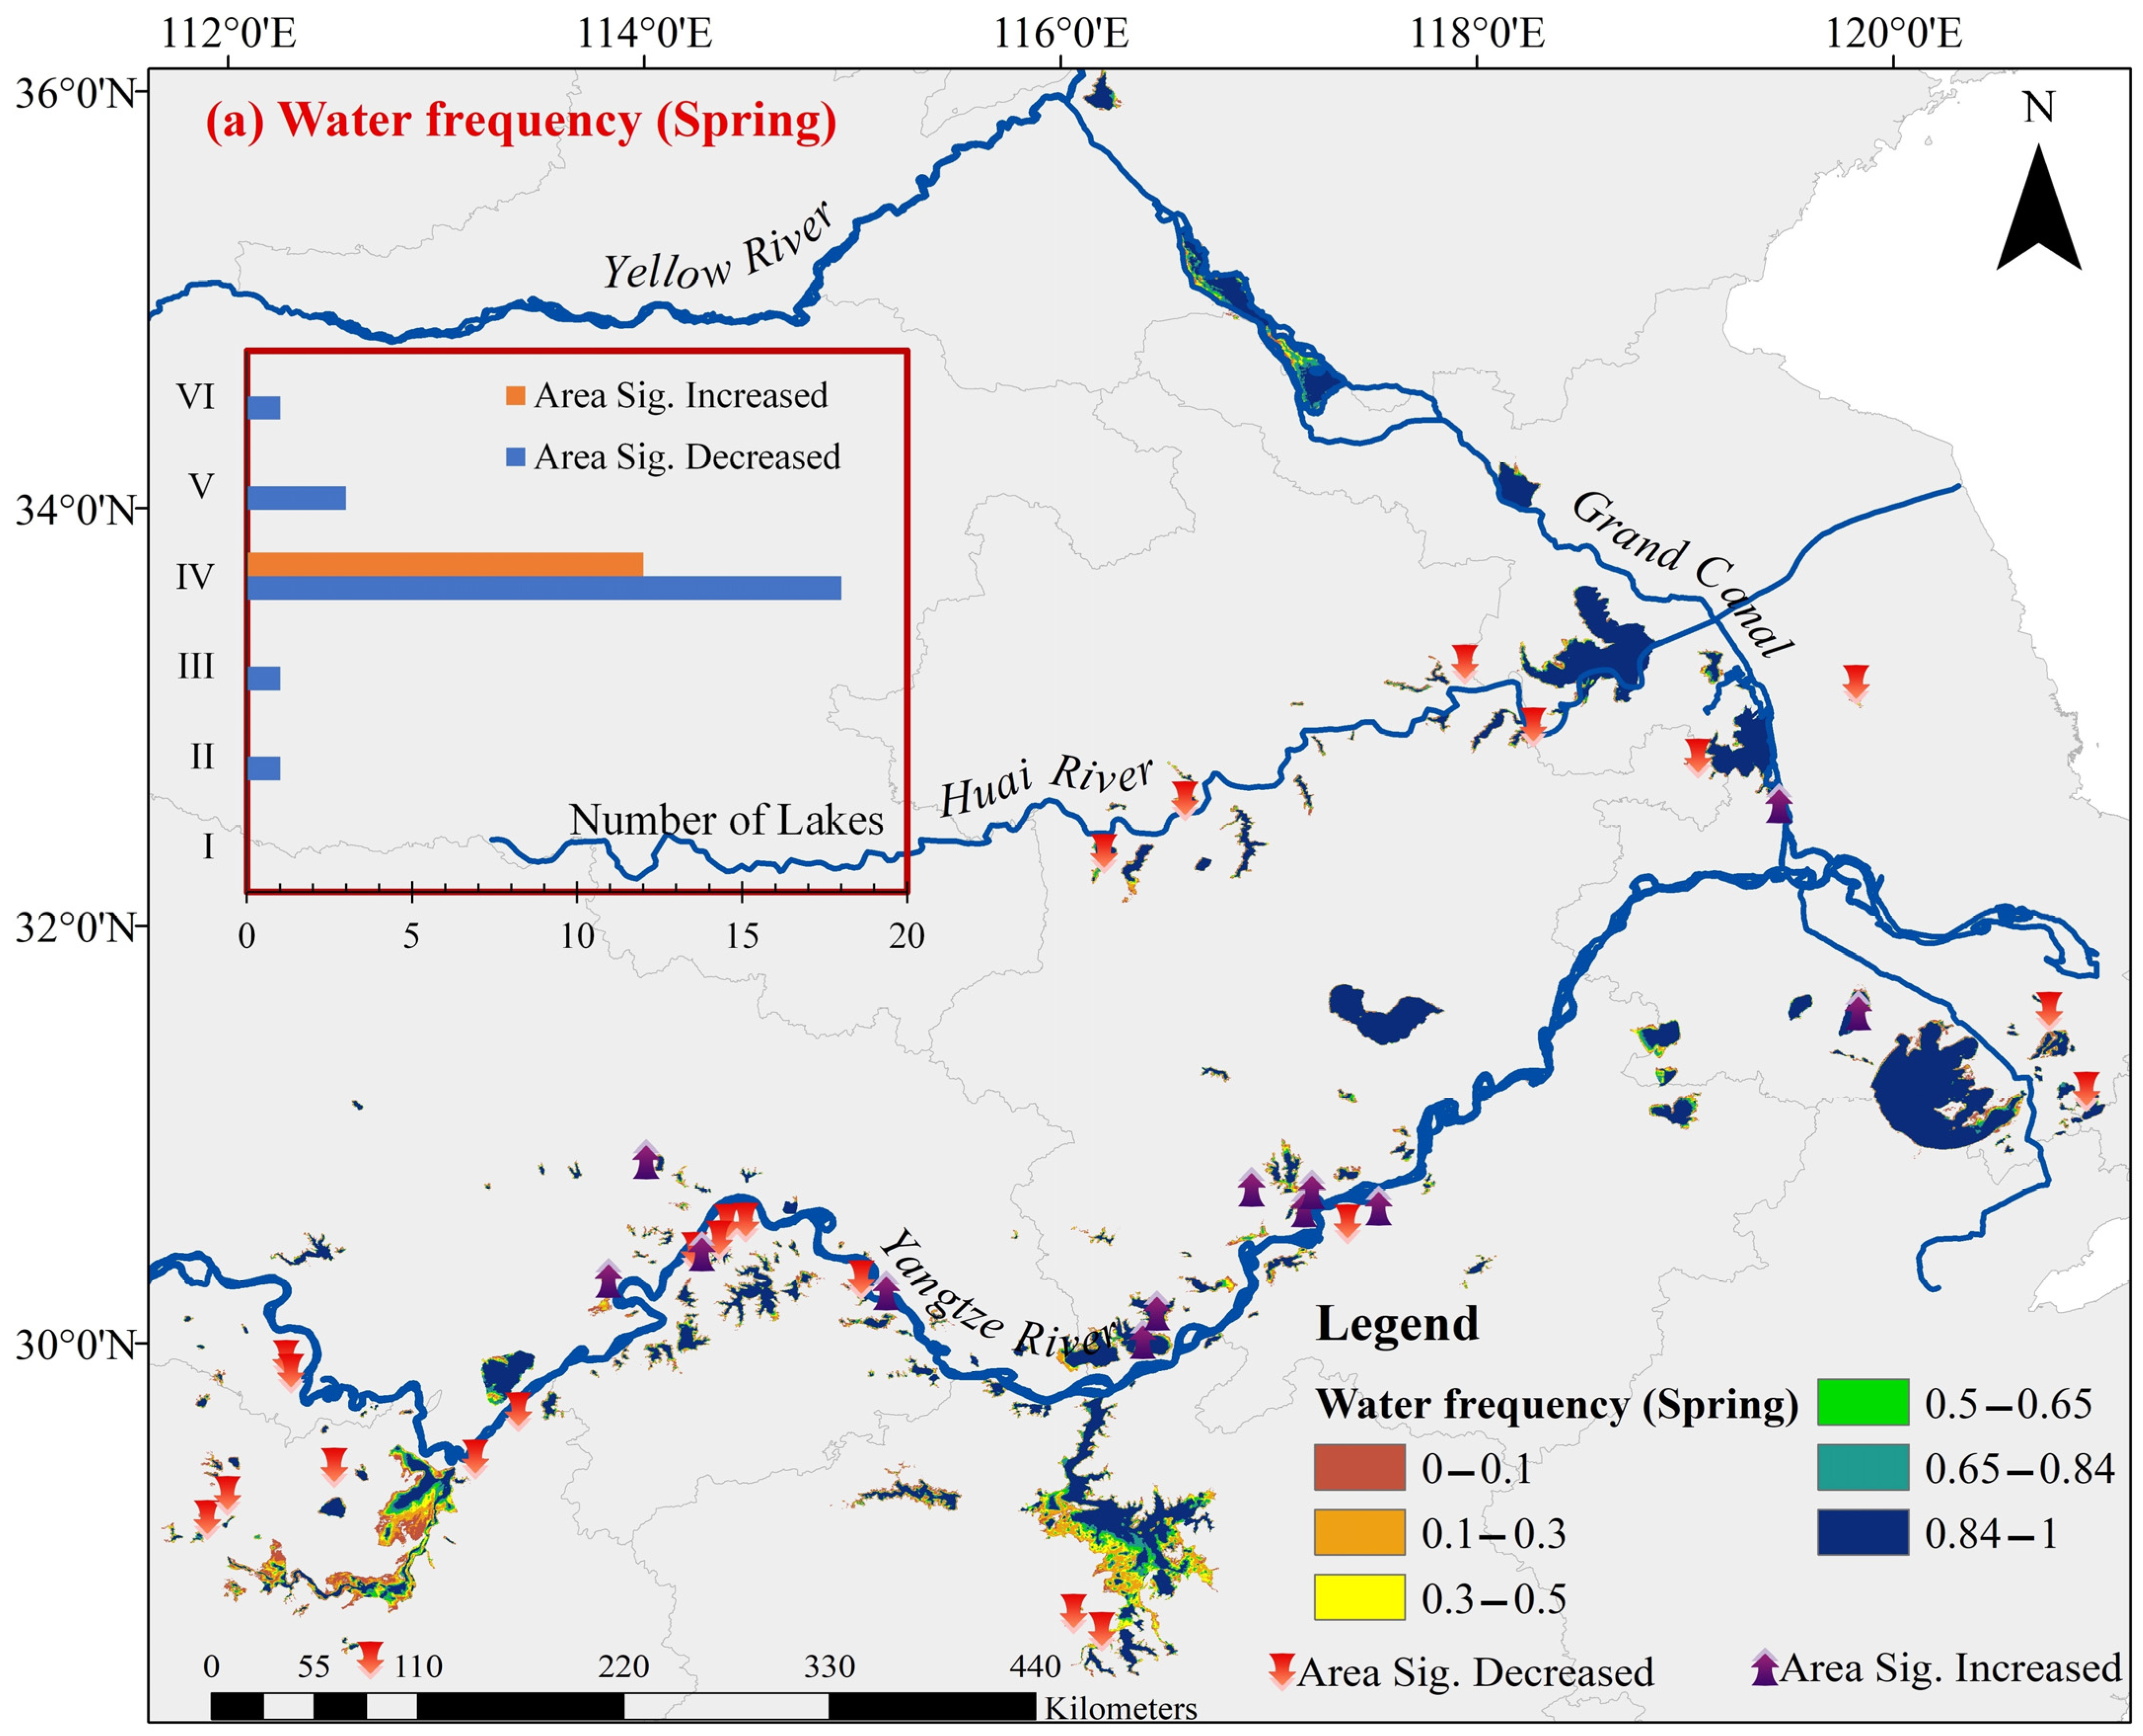
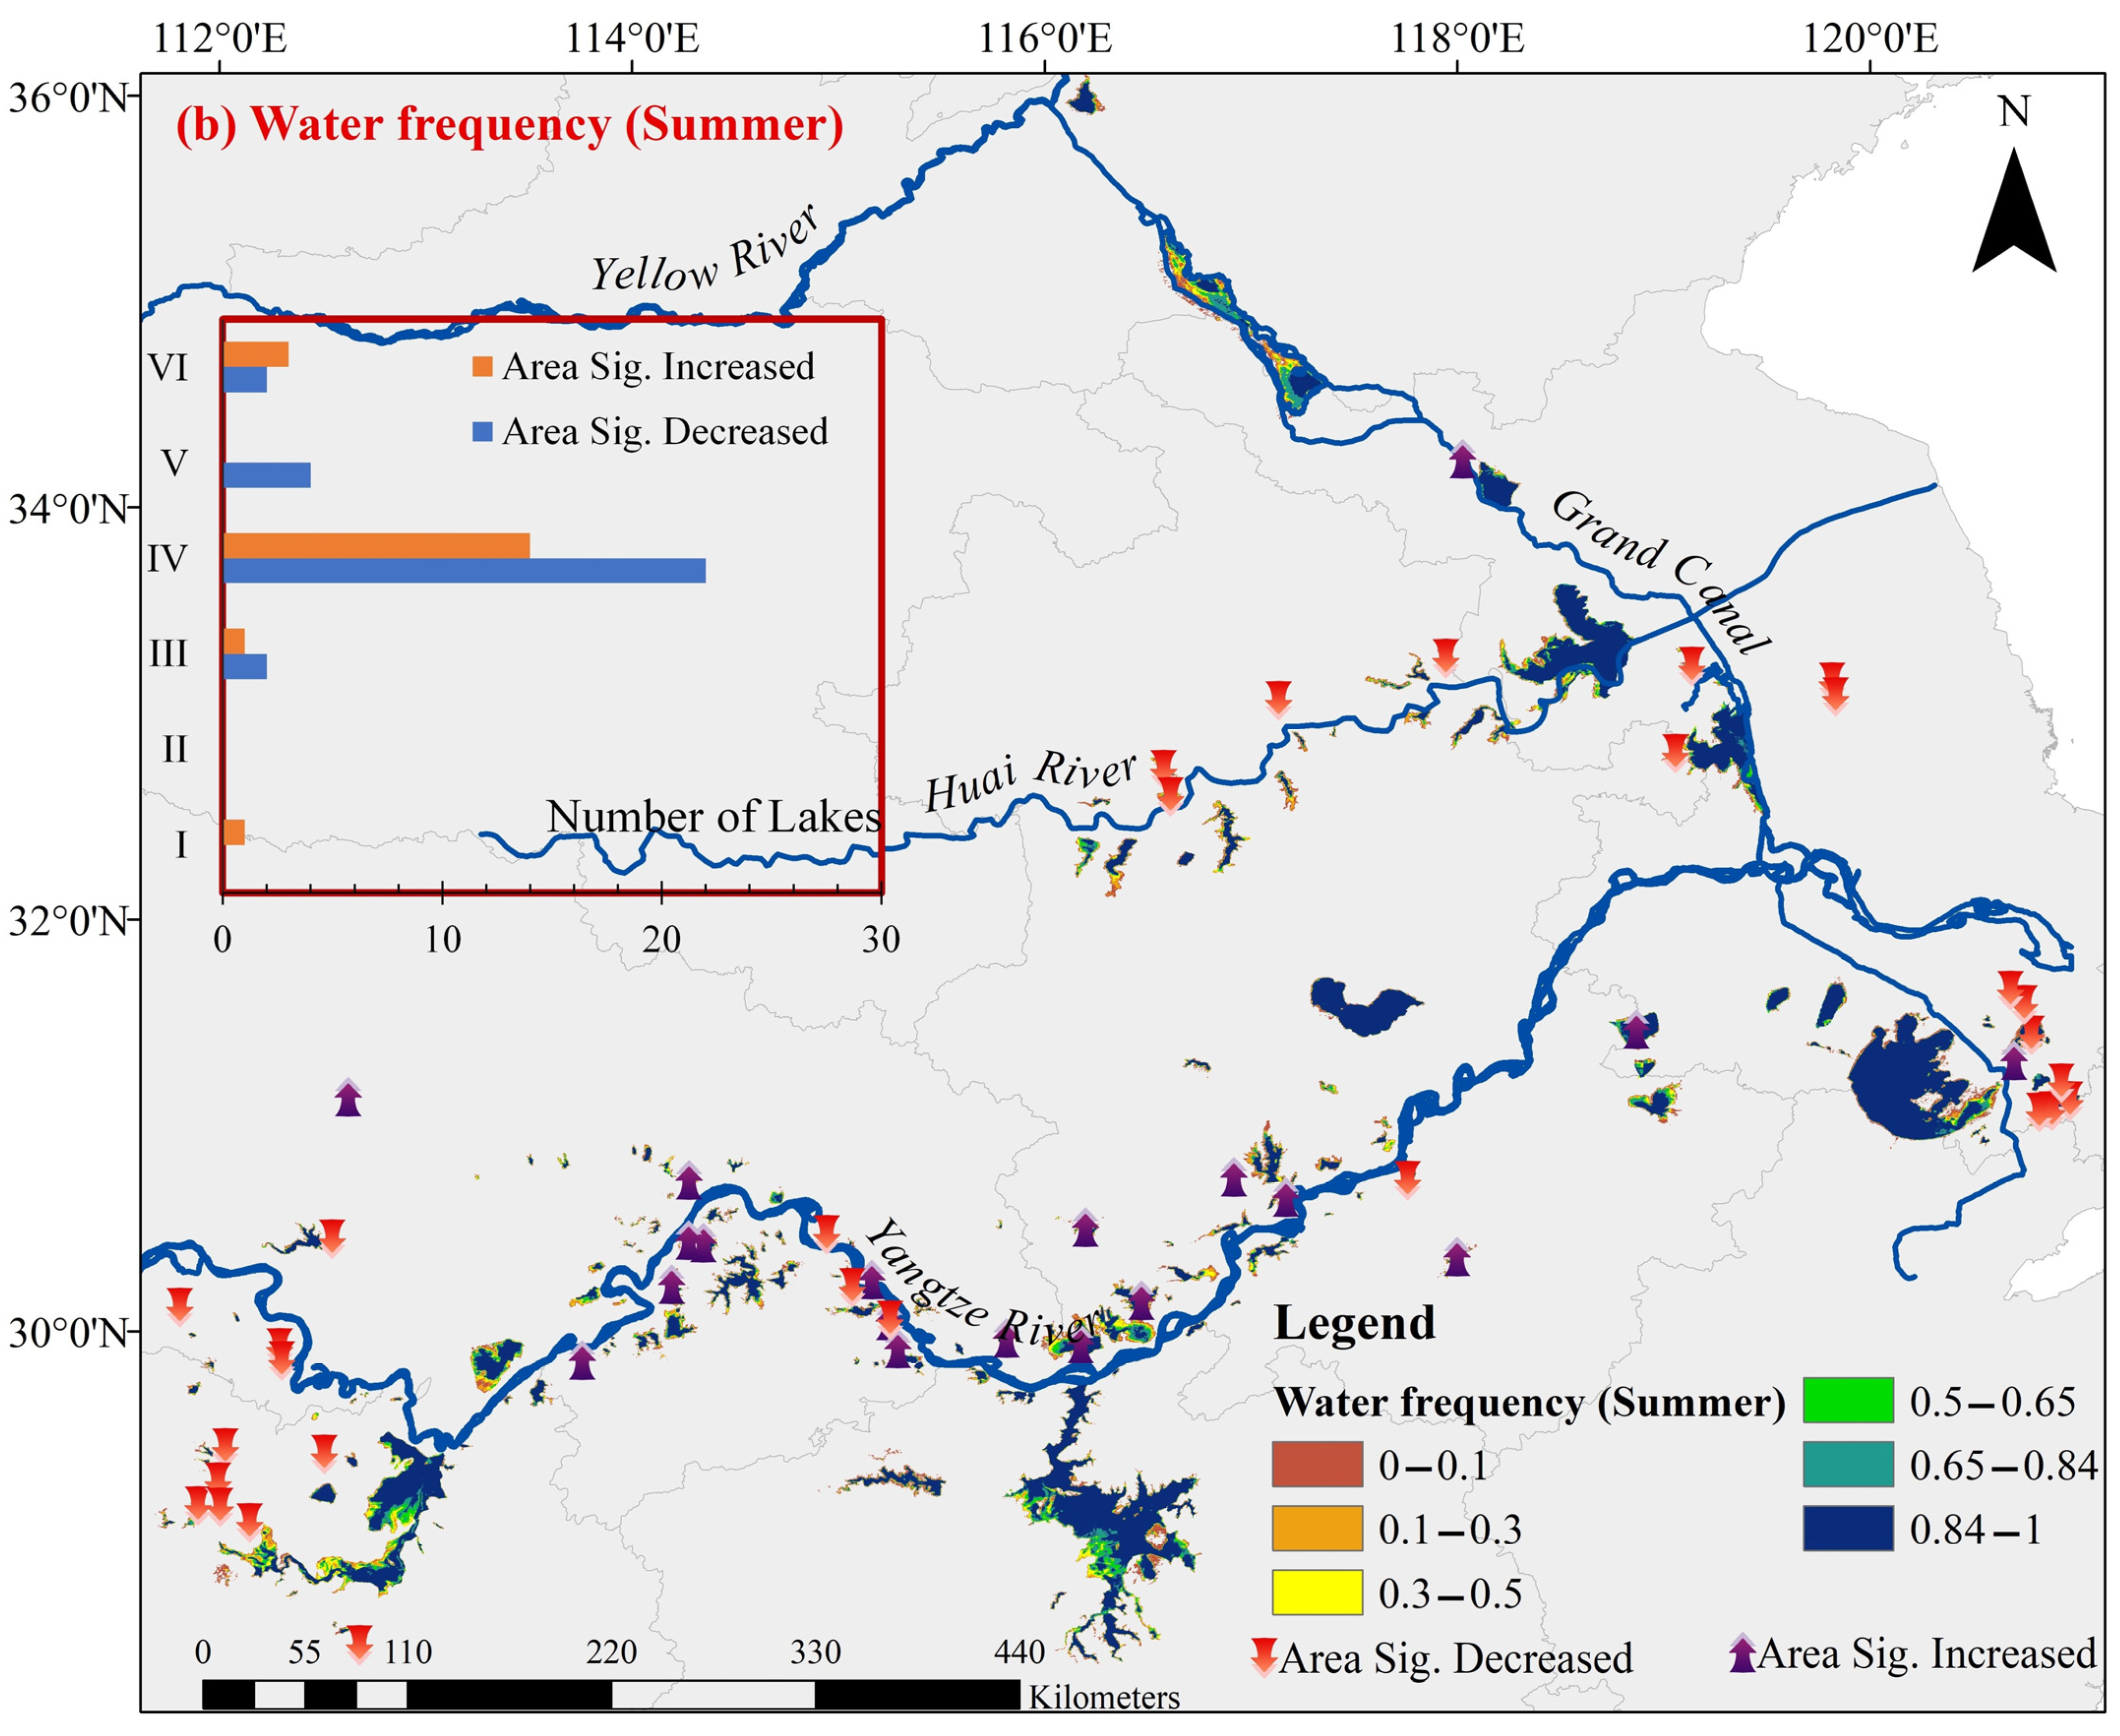
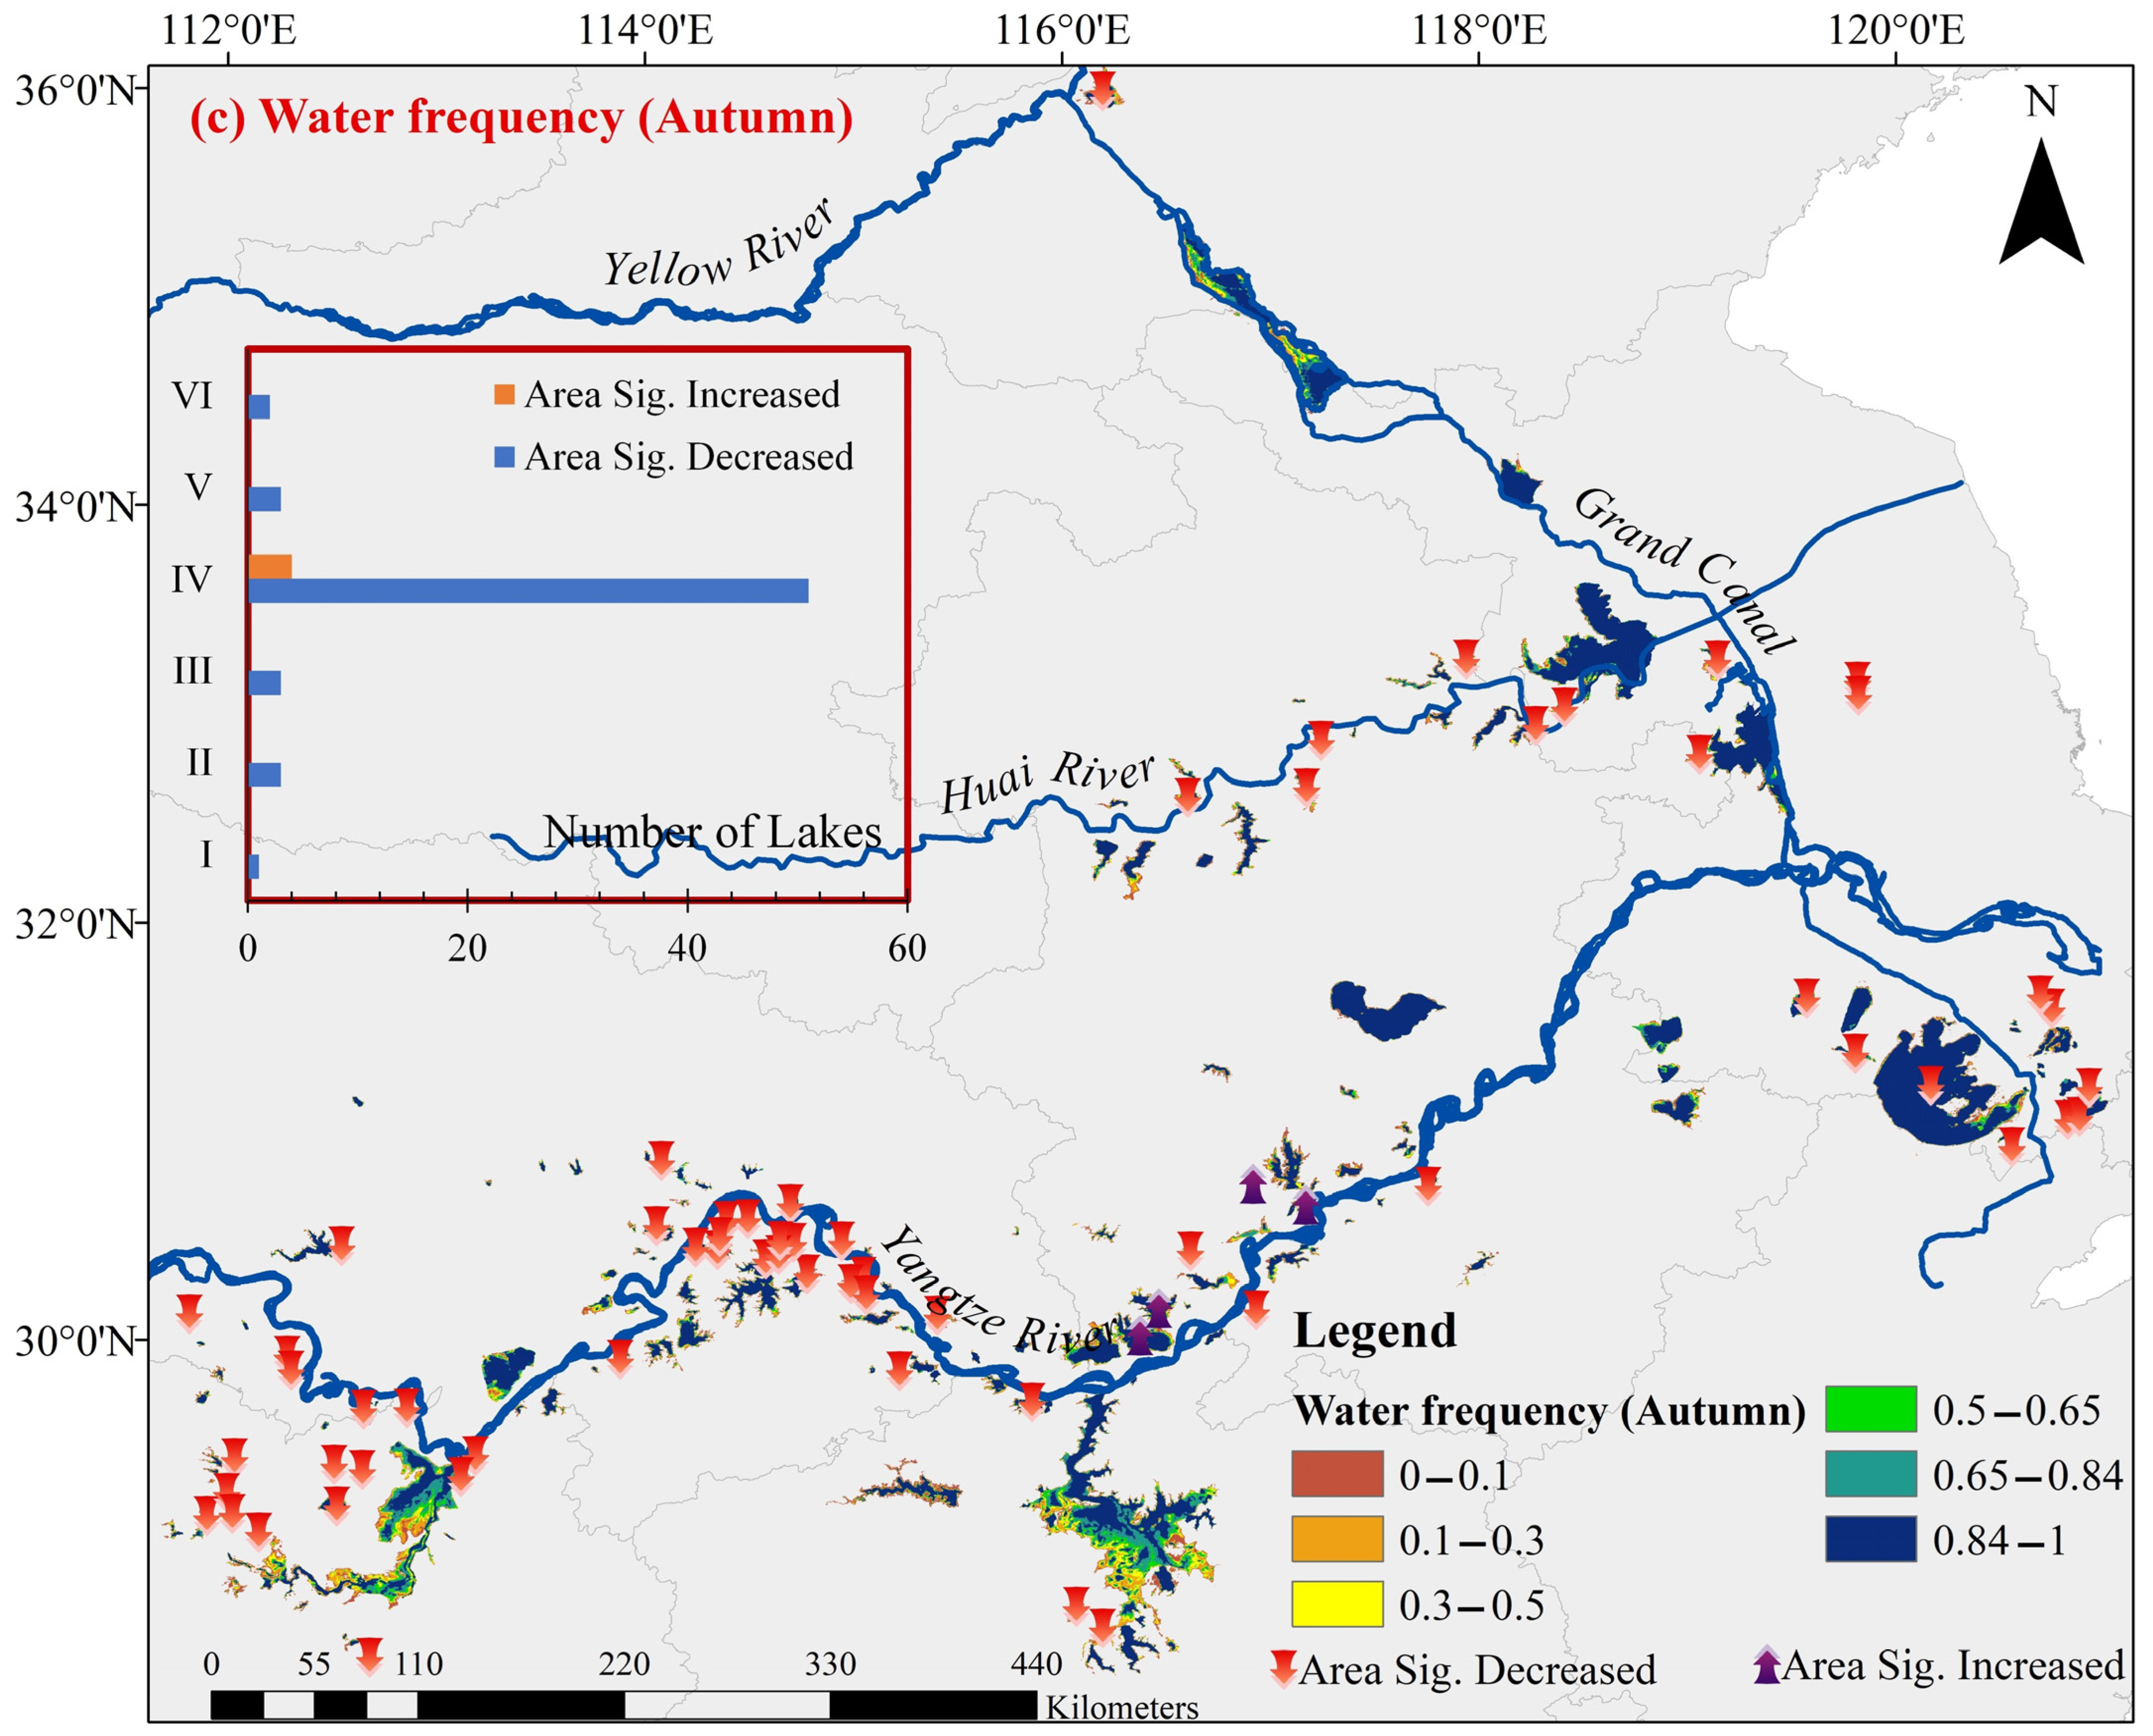
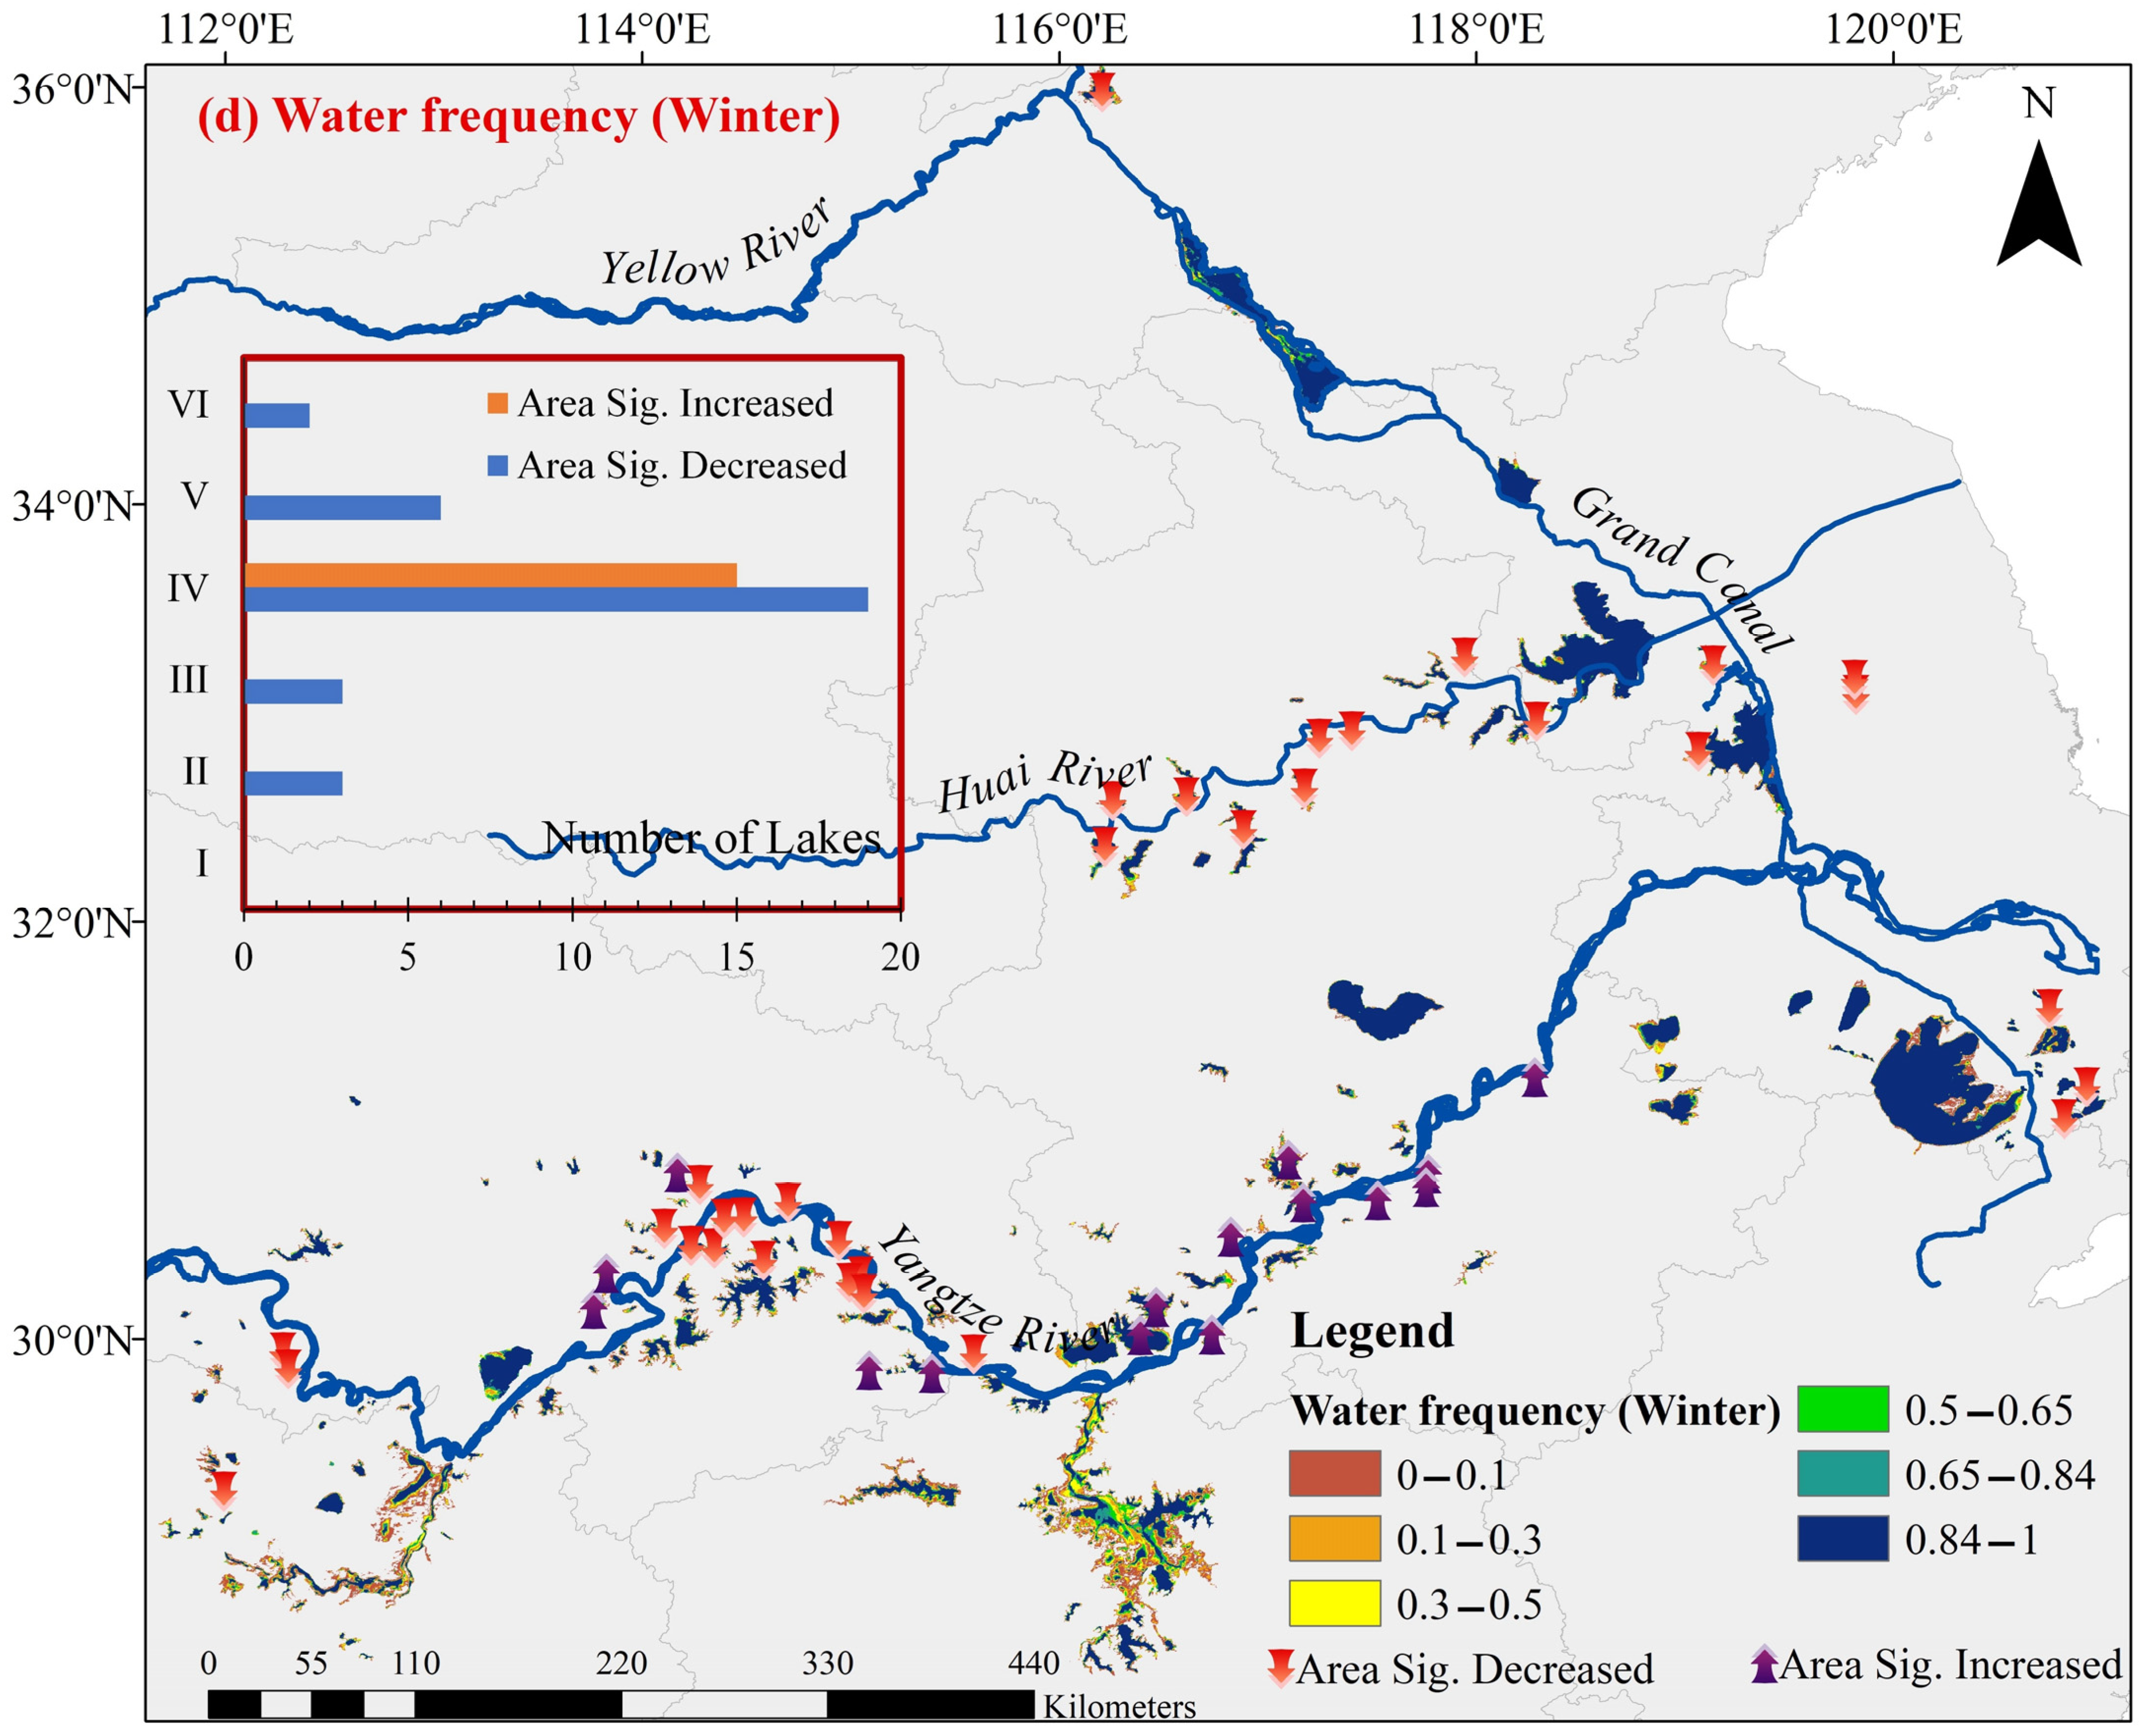
Figure 9.
(a) Inter-annual inundation area of Poyang (A002) and Douhu Lakes (B002), the B002 was on the sub-axis (right-axis); (b) percentages of lakes that exhibited significantly (p < 0.05) decreasing or increasing trends in inter-annual inundation area for the six different geographical classes; (c) inter-annual inundation of lakes in different class: C005, D004, E007, and F003 At the same time, the F003 was on the right-axis. The red dotted line represents the year of 2003 in (a).
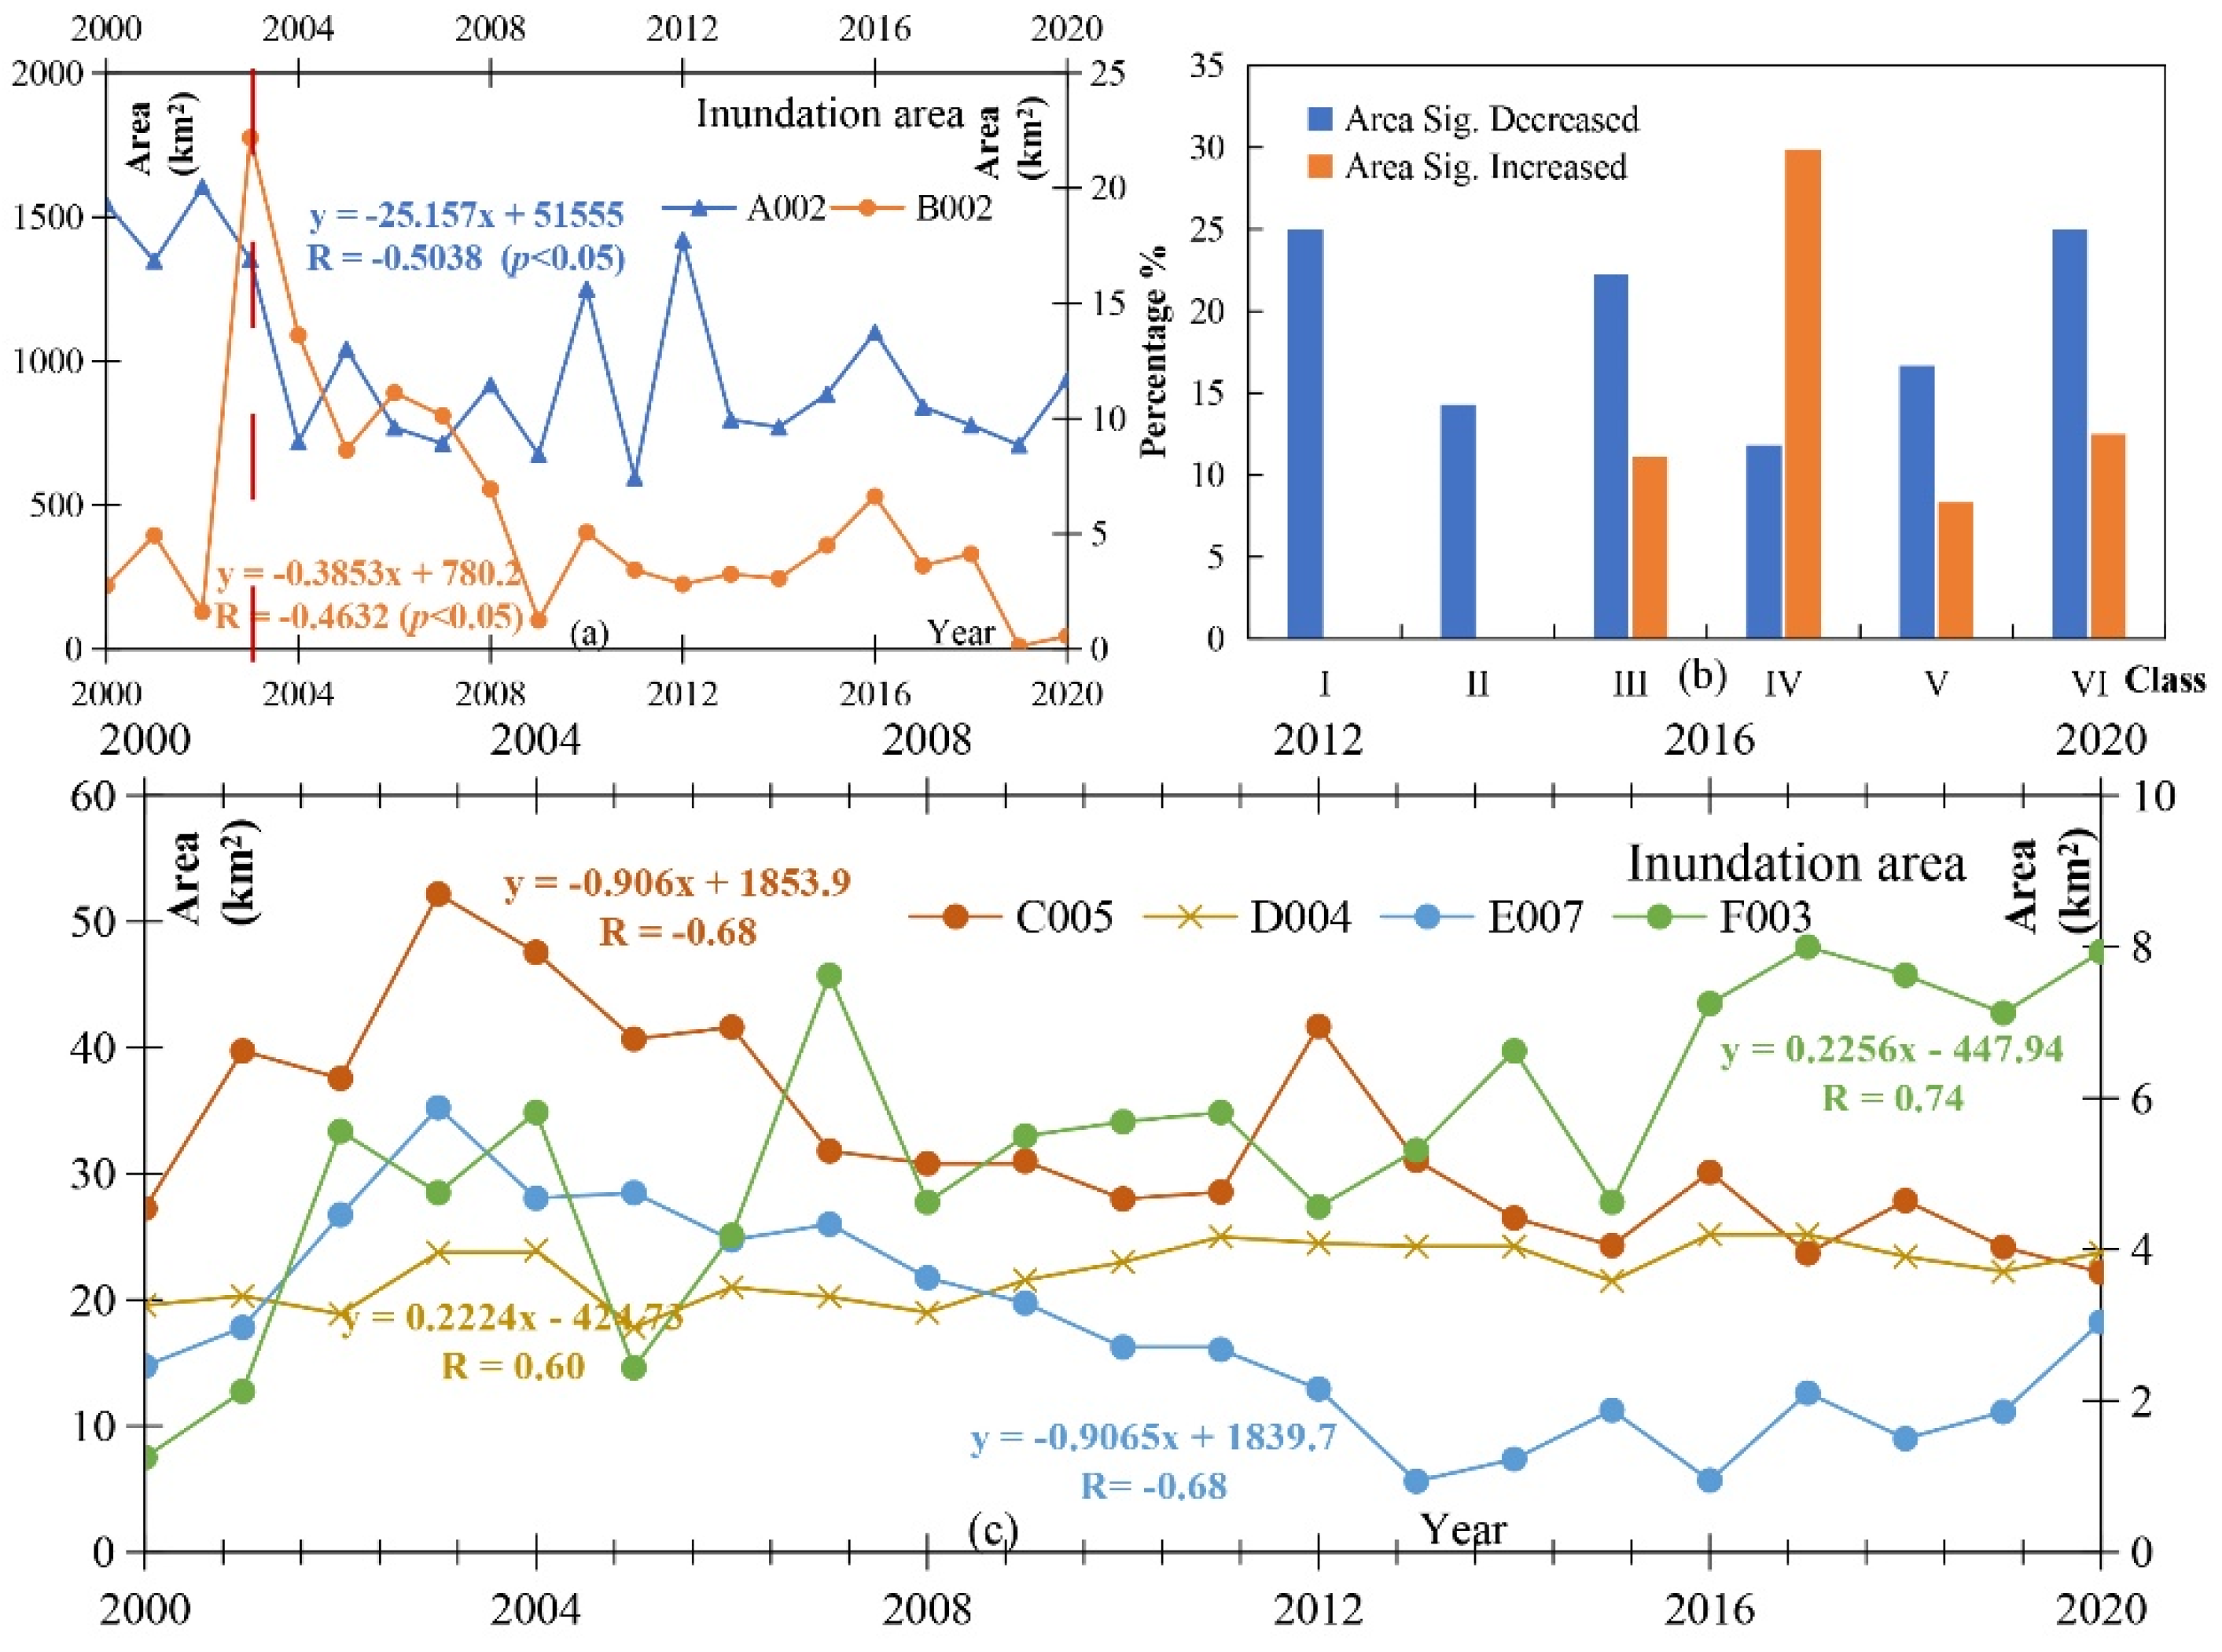
Figure 10.
Correlation coefficients between annual lake area and their potential driving factors, from 2000 to 2020. The factors represented by rows from top to bottom are precipitation, maximum temperature, average temperature, and minimum temperature, wind, LPO, GDP, CCF, IAC, and GFF. (a) Lake A001–D072 and (b) lake D073–F008. Note: when |r| > 0.369, the correlation is marginally significant at p < 0.1; when |r| > 0.433, the correlation is significant at p < 0.05; and when |r| > 0.549, the correlation is significant at p < 0.01. When r > 0, it indicates a positive correlation; and when r < 0, it represents a negative correlation.

Figure 11.
Comparisons of meteorological annual precipitation and GPM IMERG precipitation (note, the gray line represents the 1:1 line).
Figure 11.
Comparisons of meteorological annual precipitation and GPM IMERG precipitation (note, the gray line represents the 1:1 line).
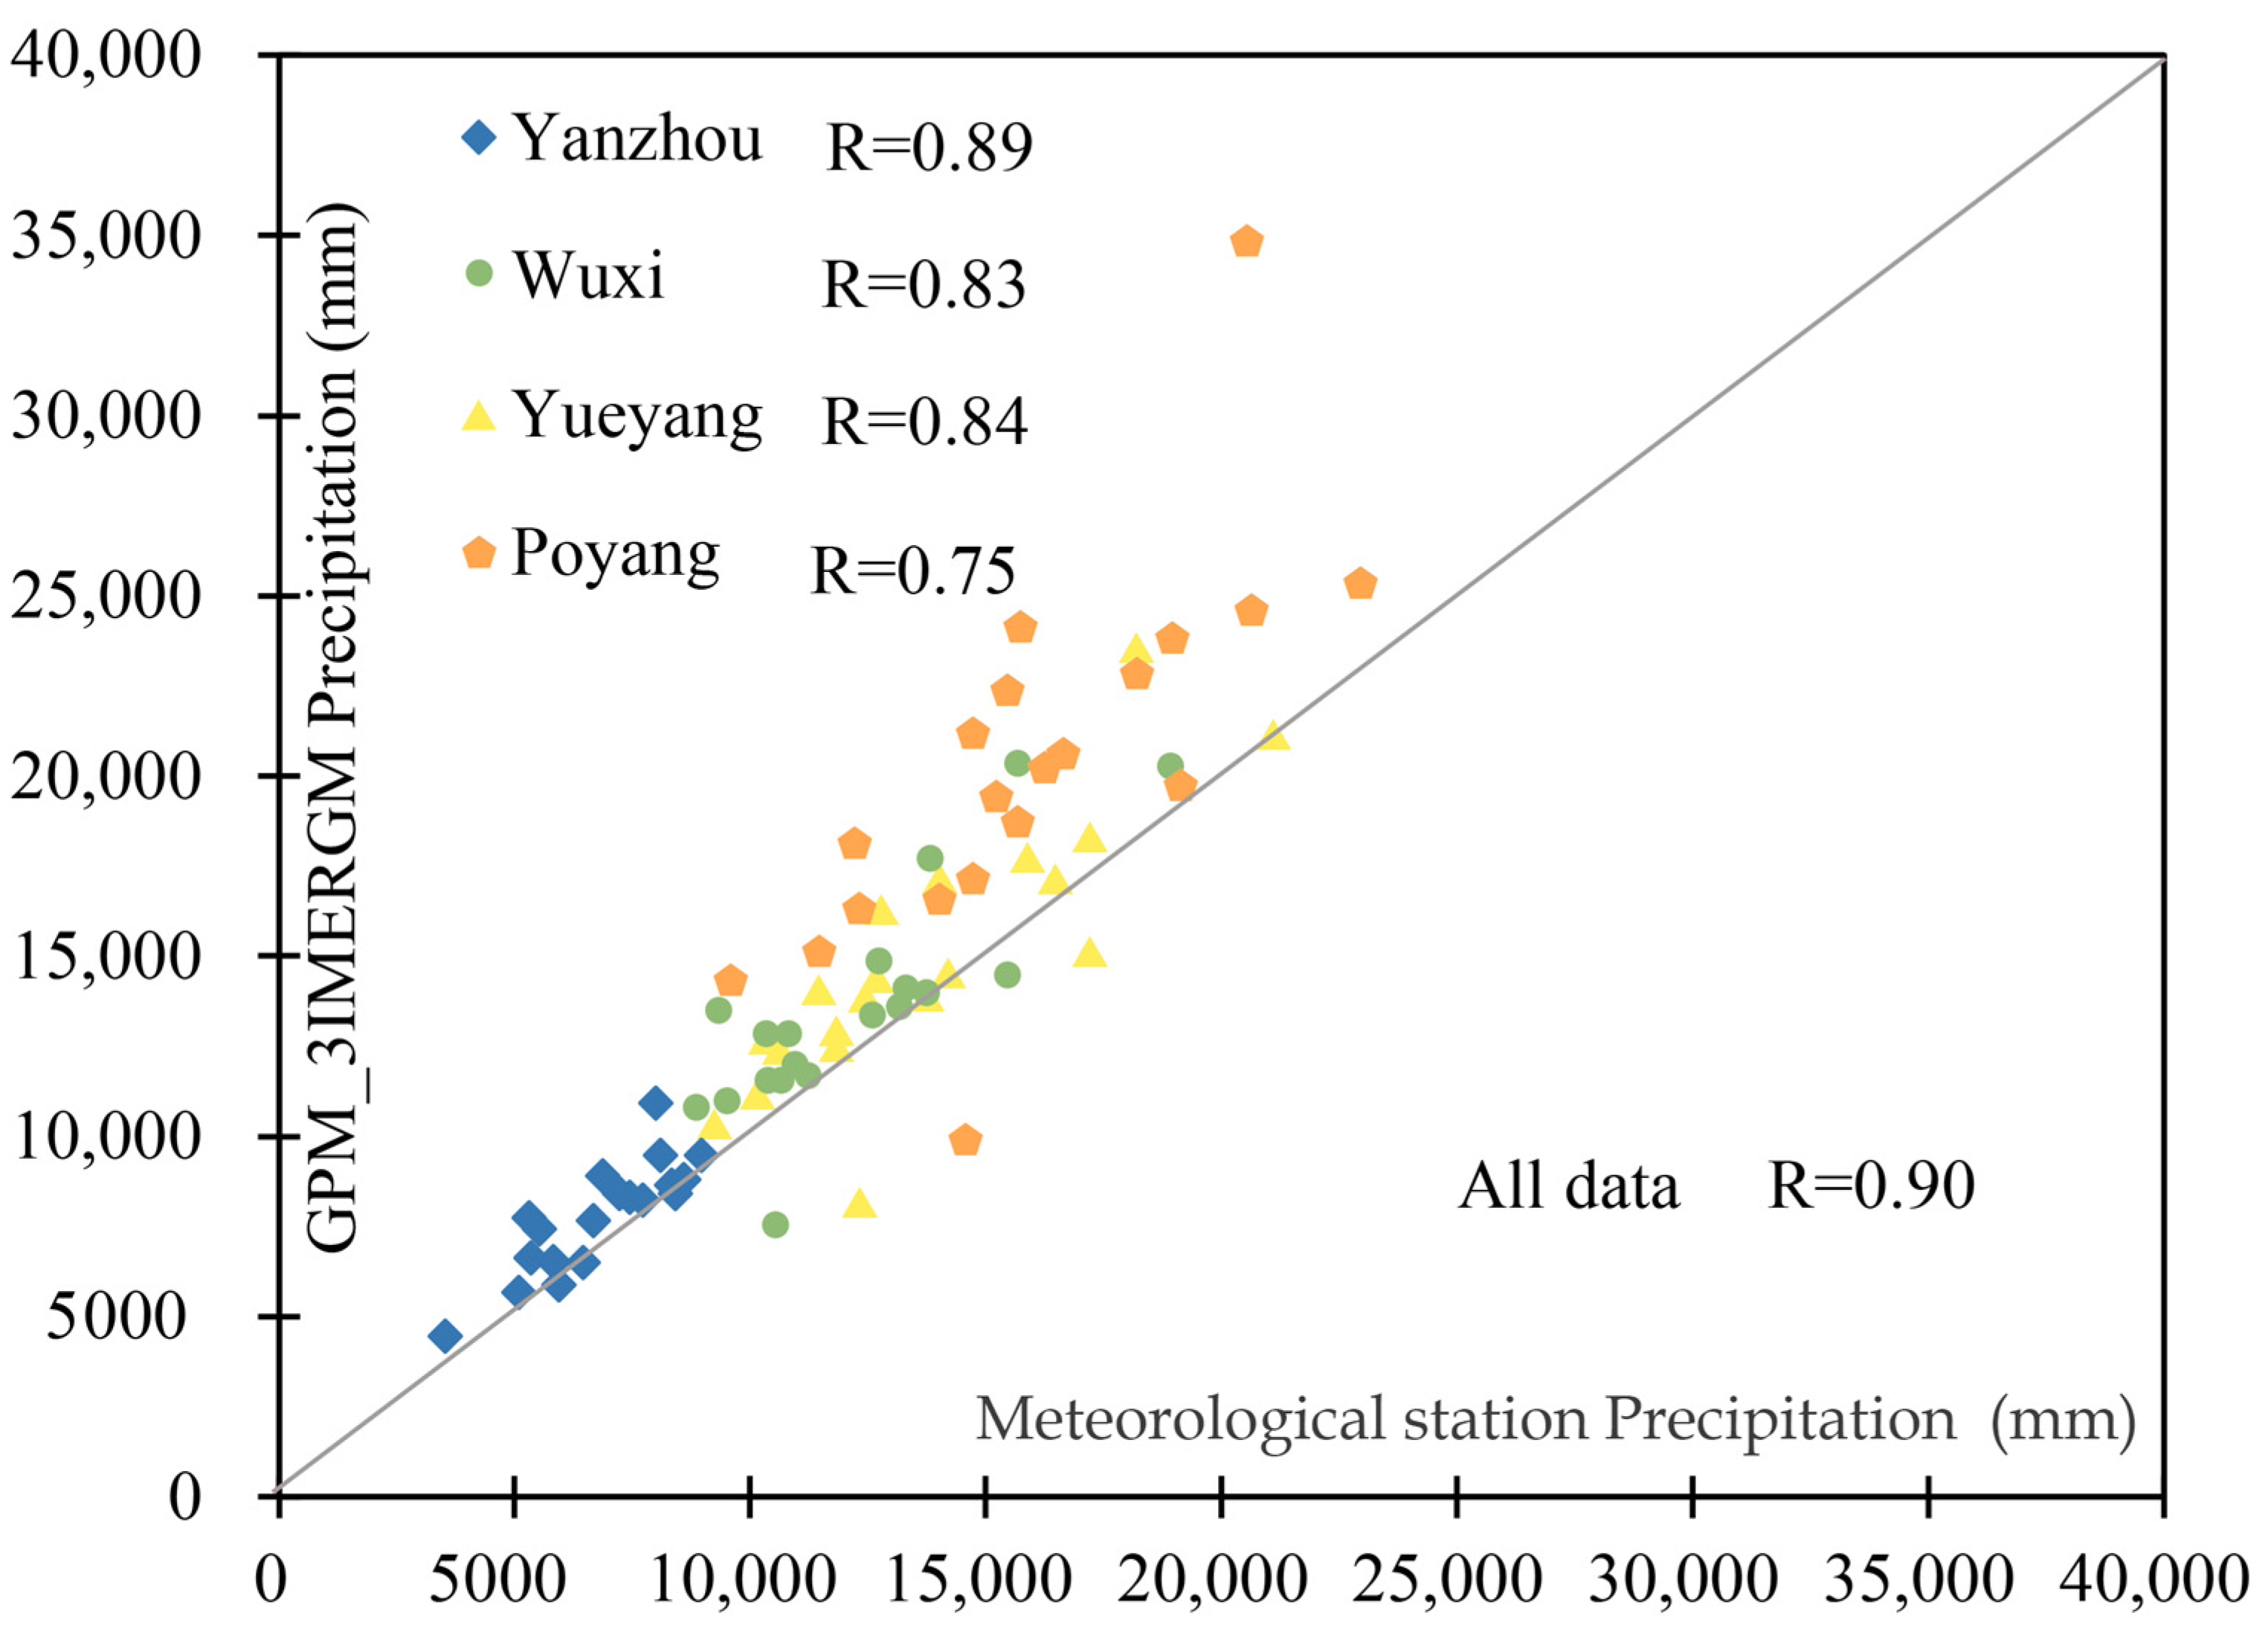
Figure 12.
Landsat OLI RGB (R: 850–880 nm, G: 640–670 nm, B: 530–590 nm) composition image acquired on 15 April 2020 (a) and (b) UNWI image in Poyang Lake; acquired on 1 October 2014 (c) and (d) UNWI image in Hongze.
Figure 12.
Landsat OLI RGB (R: 850–880 nm, G: 640–670 nm, B: 530–590 nm) composition image acquired on 15 April 2020 (a) and (b) UNWI image in Poyang Lake; acquired on 1 October 2014 (c) and (d) UNWI image in Hongze.
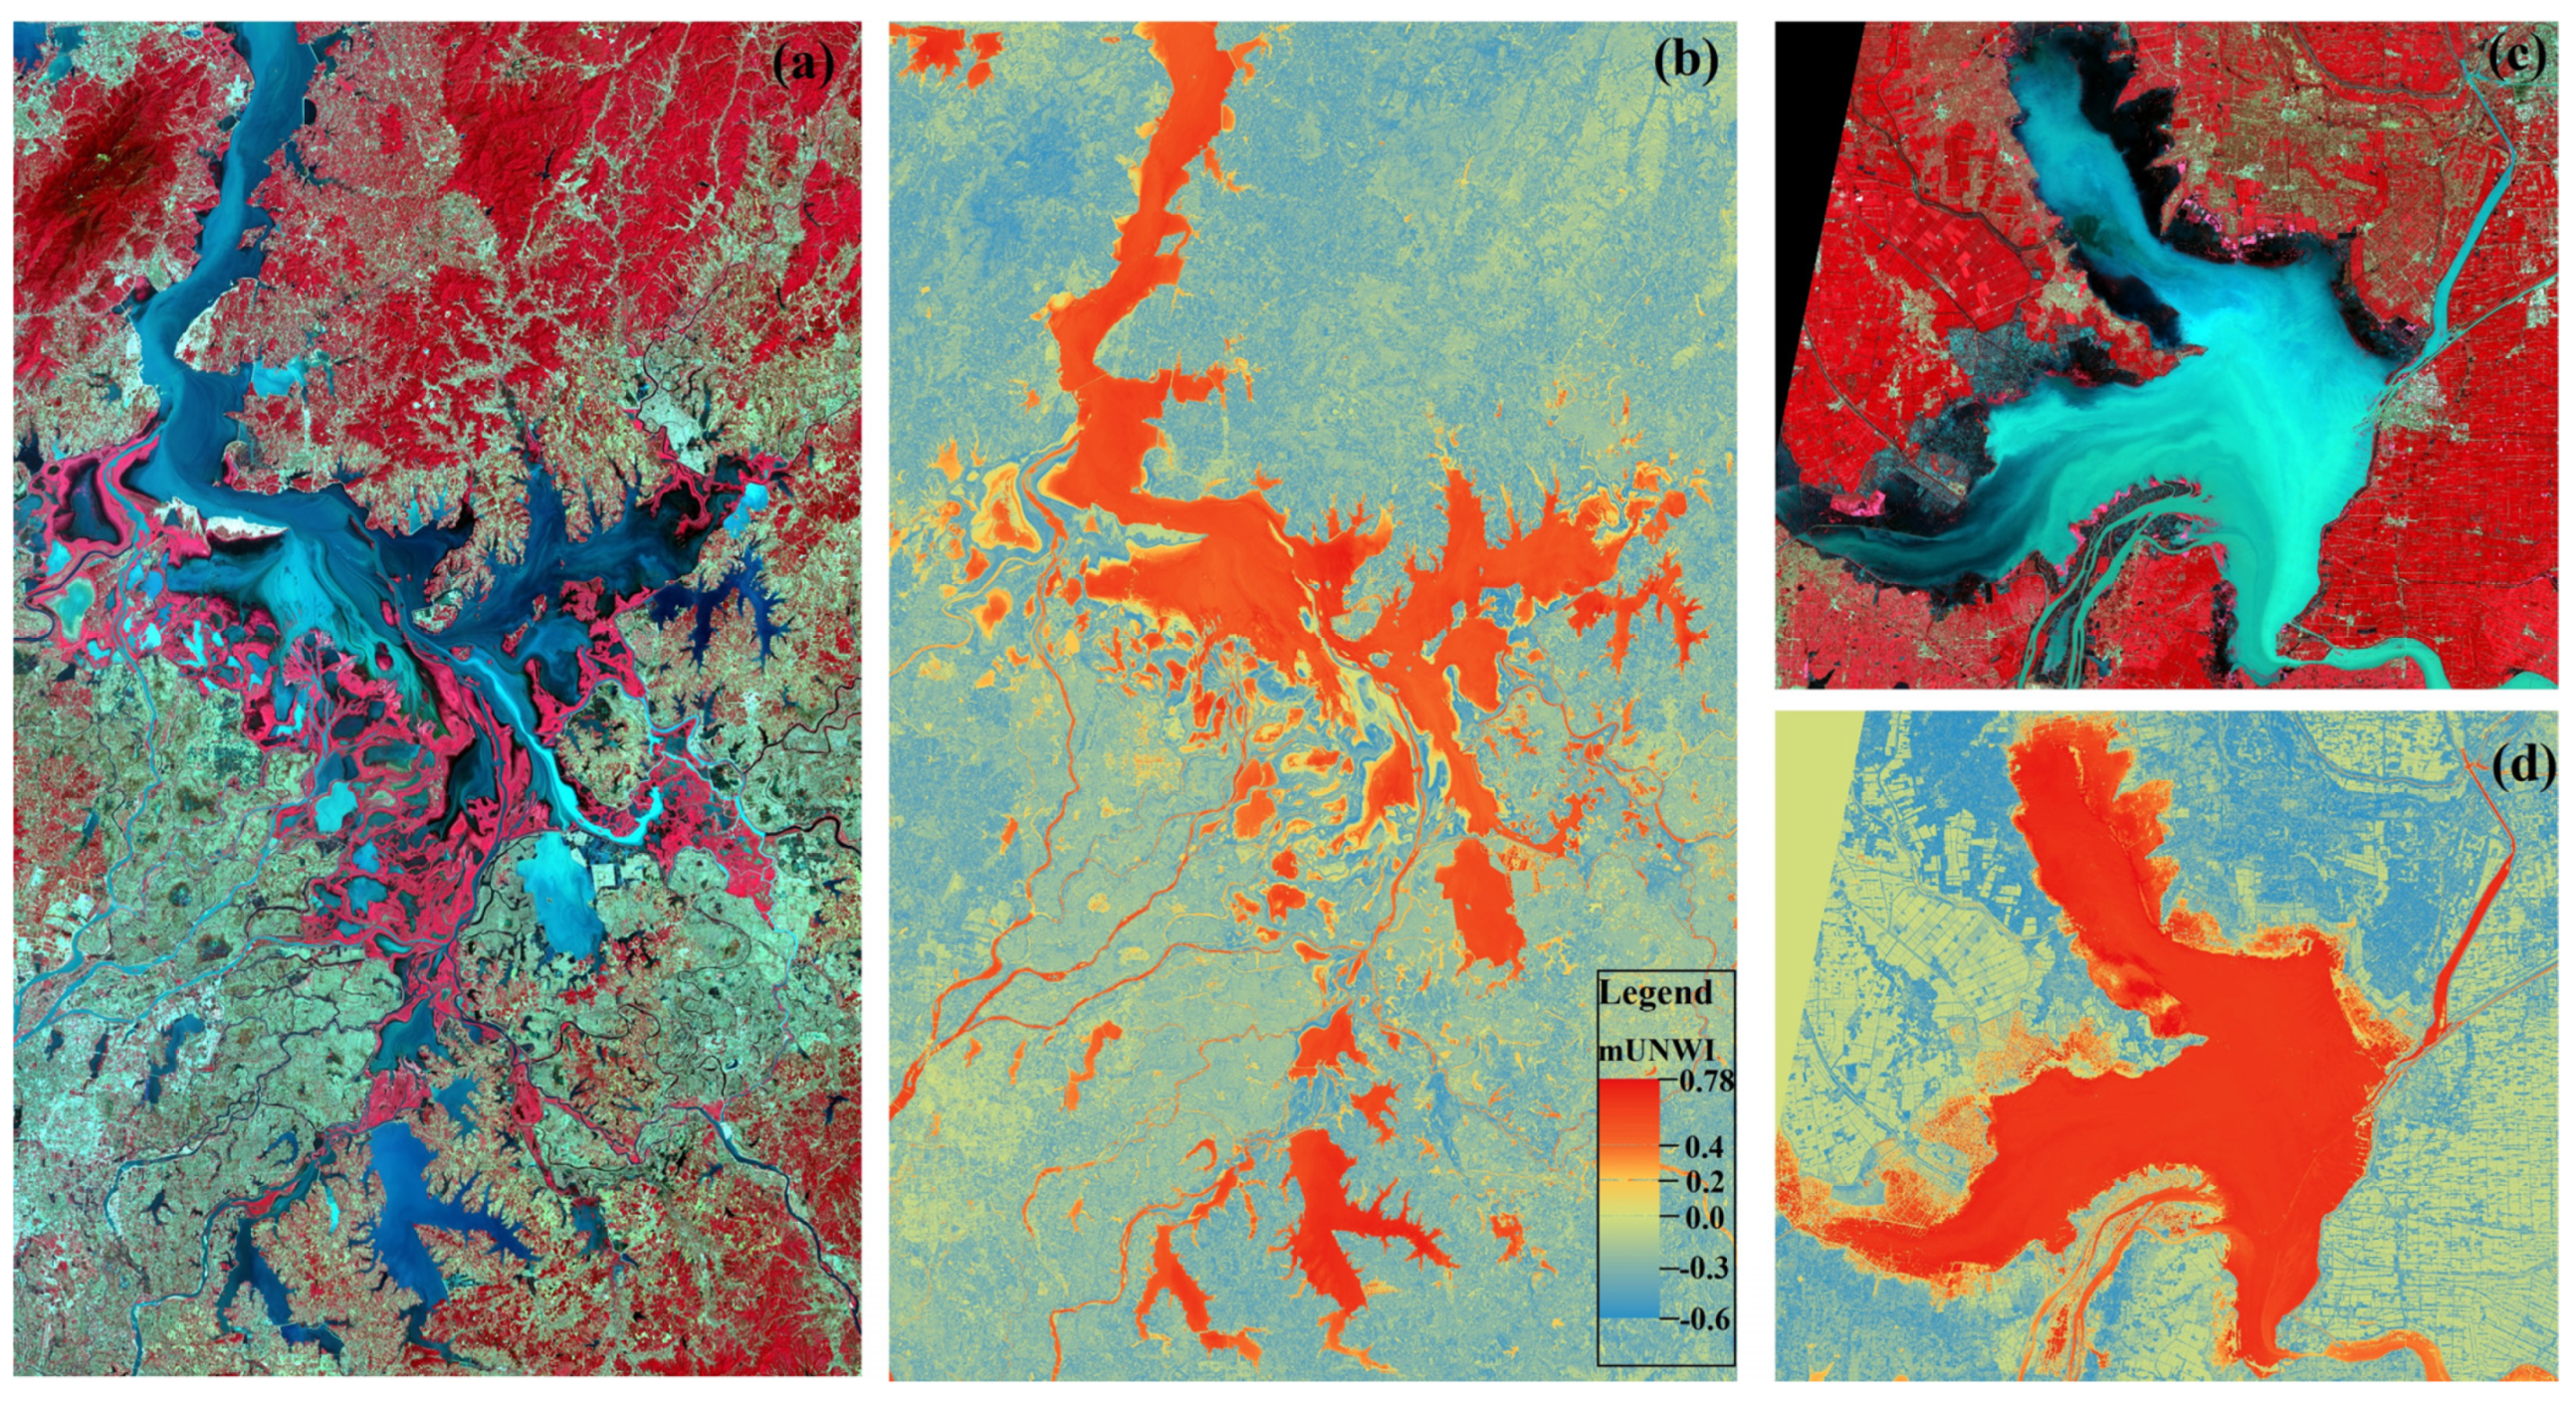
Figure 13.
(a) Comparisons of Landsat water inundation area of Poyang lake through UNWI method and RF classification [29] (b) and results of Sentinel-2 images of Nanyi (29 in number), Shijiu (26 in number), and Gucheng (29 in number) Lakes (note, the black line represents the 1:1 line).
Figure 13.
(a) Comparisons of Landsat water inundation area of Poyang lake through UNWI method and RF classification [29] (b) and results of Sentinel-2 images of Nanyi (29 in number), Shijiu (26 in number), and Gucheng (29 in number) Lakes (note, the black line represents the 1:1 line).

Table 1.
Validation of the MODIS water extraction maps. Visual discrimination was used to obtain the true water maps based on MODIS images R (620–670 nm)-G (545–565 nm)-B (459–479 nm) composition.
Table 1.
Validation of the MODIS water extraction maps. Visual discrimination was used to obtain the true water maps based on MODIS images R (620–670 nm)-G (545–565 nm)-B (459–479 nm) composition.
| Lakes Name | Acquisition Date | Area (km2) | Truth Area (km2) | User’s Accuracy | Producer’s Accuracy |
|---|---|---|---|---|---|
| Poyang | 25 July 2001 | 2136.43 | 2104.31 | 93.59% | 95.02% |
| 5 October 2007 | 2490.43 | 2334.25 | 85.78% | 90.45% | |
| Hongze | 20 February 2020 | 1462.31 | 1541.25 | 98.69% | 93.64% |
| 20 December 2020 | 1413.50 | 1320.38 | 91.10% | 97.52% | |
| Chaohu | 14 May 2013 | 722.88 | 725.63 | 99.34% | 98.87% |
| 19 December 2017 | 772.00 | 781.56 | 99.61% | 98.39% |
Table 2.
Validation of the MODIS water extraction maps based on Landsat images.
| Lakes Name | Acquisition Date | MODIS Area (km2) | Landsat Area (km2) | Lakes Name | Acquisition Date | MODIS Area (km2) | Landsat Area (km2) |
|---|---|---|---|---|---|---|---|
| Dongping (C001) | 3 January 2001 | 136.19 | 143.24 | Douhu (B002) | 26 March 2003 | 27.56 | 28.99 |
| 8 March 2001 | 116.81 | 124.88 | 7 May 2007 | 6.00 | 6.80 | ||
| Shaobo (C008) | 9 March 2009 | 61.50 | 66.77 | Dazonghu (F003) | 19 December 2008 | 19.94 | 22.78 |
| 10 January 2011 | 73.00 | 80.92 | 23 September 2011 | 8.81 | 9.34 |
Table 3.
Summary of information (number and location) and changes in lake annual area (average area and standard deviation during 2000–2020). Statistically significant correlations and contributions are annotated with * p < 0.05 and ** p < 0.01. The full table is shown in Table S1.
Table 3.
Summary of information (number and location) and changes in lake annual area (average area and standard deviation during 2000–2020). Statistically significant correlations and contributions are annotated with * p < 0.05 and ** p < 0.01. The full table is shown in Table S1.
| Num | Lon | Lat | Ave ± Std. (km2) | Rate (km2 Year. −1) | R | M-K Test (Z) | Num | Lon | Lat | Ave ± Std. (km2) | Rate (km2 Year. −1) | R | M-K Test (Z) |
|---|---|---|---|---|---|---|---|---|---|---|---|---|---|
| Class I | D007 | 118.27 | 31.25 | 3.32 ± 0.76 | 0.03 | 0.56 ** | 2.33 ** | ||||||
| A001 | 118.87 | 31.47 | 149.91 ± 22.96 | 0.18 | 0.38 | 1.66 * | D008 | 117.38 | 31.18 | 3.69 ± 3.17 | 0.43 | −0.09 | −0.85 |
| A002 | 116.30 | 29.06 | 988.70 ± 309.81 | −29.09 | −0.50 * | −1.64 * | D009 | 117.64 | 31.02 | 1.93 ± 1.62 | 0.07 | −0.16 | −0.94 |
| A003 | 112.73 | 29.06 | 325.70 ± 71.01 | −2.89 | 0.02 | 0.45 | D010 | 117.63 | 30.93 | 8.57 ± 0.93 | 0.16 | 0.52 * | 2.42 ** |
| A004 | 113.87 | 29.90 | 2.42 ± 0.88 | 0.14 | 0.38 | 1.63 | D011 | 117.67 | 30.90 | 5.34 ± 5.01 | 0.44 | 0.39 | 1.42 |
| Class II | … | … | … | … | … | … | … | ||||||
| B001 | 118.57 | 33.31 | 1271.87 ± 118.40 | −2.99 | −0.12 | −1.60 | D143 | 117.53 | 31.57 | 741.29 ± 5.47 | 0.18 | −0.33 | −1.24 |
| B002 | 118.40 | 33.03 | 5.73 ± 5.16 | −0.10 | −0.46 * | −1.96 * | D144 | 114.18 | 30.66 | 0.14 ± 0.15 | 0.01 | 0.85 ** | 3.96 ** |
| B003 | 118.22 | 32.91 | 19.07 ± 8.22 | 0.50 | −0.30 | −1.15 | Class V | ||||||
| B004 | 118.08 | 32.96 | 63.10 ± 5.50 | 0.11 | −0.26 | −1.00 | E001 | 117.94 | 33.26 | 7.61 ± 2.16 | −0.22 | −0.73 ** | −3.42 ** |
| B005 | 117.82 | 32.98 | 17.95 ± 5.10 | 0.67 | 0.38 | 1.57 | E002 | 117.81 | 33.21 | 15.58 ± 1.67 | 0.17 | 0.02 | −0.12 |
| B006 | 117.40 | 32.91 | 0.65 ± 0.38 | −0.05 | −0.34 | −1.49 | E003 | 117.67 | 33.14 | 6.44 ± 4.04 | 0.07 | 0.49 * | 1.66 * |
| B007 | 117.24 | 32.86 | 2.49 ± 1.19 | −0.02 | 0.16 | 0.88 | E004 | 117.14 | 33.06 | 0.60 ± 0.63 | 0.00 | −0.29 | −0.33 |
| Class III | E005 | 117.18 | 32.63 | 16.47 ± 5.02 | 0.07 | −0.36 | −1.48 | ||||||
| C001 | 116.18 | 35.99 | 97.94 ± 8.20 | 0.32 | −0.02 | −0.12 | E006 | 116.59 | 32.72 | 3.43 ± 1.70 | −0.05 | −0.41 | −2.78 ** |
| C002 | 116.94 | 34.87 | 380.73 ± 164.68 | 5.55 | 0.04 | −1.06 | E007 | 116.60 | 32.60 | 17.60 ± 8.28 | 0.17 | −0.68 ** | −3.23 ** |
| C003 | 118.03 | 34.21 | 3.86 ± 2.55 | 0.29 | 0.51 * | 2.30 * | E008 | 116.88 | 32.41 | 91.80 ± 13.17 | 0.47 | −0.32 | −1.54 |
| C004 | 118.18 | 34.10 | 221.61 ± 13.93 | 1.78 | 0.47 * | 0.91 | E009 | 116.68 | 32.29 | 26.27 ± 3.02 | −0.06 | −0.05 | −0.94 |
| C005 | 119.13 | 33.24 | 32.78 ± 8.31 | −0.24 | −0.68 ** | −3.47 ** | E010 | 116.26 | 32.57 | 4.58 ± 1.19 | 0.04 | −0.16 | −0.45 |
| C006 | 119.29 | 33.13 | 4.20 ± 2.58 | 0.07 | −0.21 | −0.12 | E011 | 116.36 | 32.26 | 79.79 ± 6.70 | 0.34 | −0.11 | −0.15 |
| C007 | 119.28 | 32.85 | 563.67 ± 53.46 | 2.21 | 0.13 | −0.88 | E012 | 116.20 | 32.32 | 47.12 ± 17.57 | −0.68 | −0.40 | −1.78 * |
| C008 | 119.43 | 32.63 | 53.97 ± 14.22 | 1.45 | 0.47 * | 2.02 * | Class VI | ||||||
| C009 | 119.04 | 32.80 | 2.18 ± 2.09 | −0.13 | −0.71 ** | −4.35 ** | F001 | 119.82 | 33.08 | 1.64 ± 2.01 | −0.02 | −0.63 ** | −4.27 ** |
| Class IV | F002 | 119.81 | 33.15 | 11.82 ± 6.11 | −0.51 | −0.77 ** | −3.41 ** | ||||||
| D001 | 120.22 | 31.20 | 2226.50 ± 28.61 | 0.03 | −0.20 | −0.82 | F003 | 112.62 | 31.14 | 5.45 ± 1.90 | 0.32 | 0.74 ** | 3.33 ** |
| D002 | 119.82 | 31.60 | 140.71 ± 9.09 | 1.15 | 0.66 ** | 2.69 ** | F004 | 118.00 | 30.36 | 17.93 ± 2.80 | 0.06 | 0.25 | 1.67 * |
| D003 | 119.55 | 31.62 | 69.91 ± 7.56 | 0.25 | −0.21 | −0.66 | F005 | 116.75 | 31.29 | 12.35 ± 2.02 | 0.15 | 0.37 | 1.42 |
| D004 | 118.91 | 31.28 | 22.30 ± 2.31 | 0.20 | 0.60 ** | 2.54 ** | F006 | 116.18 | 30.51 | 5.39 ± 1.79 | 0.11 | 0.40 | 1.60 |
| D005 | 119.06 | 31.20 | 0.29 ± 0.47 | −0.04 | −0.51 * | −1.88 * | F007 | 115.78 | 30.51 | 0.14 ± 0.15 | 0.00 | 0.14 | 0.44 |
| D006 | 118.97 | 31.11 | 118.40 ± 15.46 | 2.59 | 0.36 | 1.06 | F008 | 115.28 | 29.28 | 97.18 ± 16.91 | −0.27 | 0.20 | 0.75 |
Table 4.
Summary of percentages of lakes that exhibited significantly decreasing or increasing trends in seasonal inundation area in each season for different classes. Boldface denotes the maximum proportion.
Table 4.
Summary of percentages of lakes that exhibited significantly decreasing or increasing trends in seasonal inundation area in each season for different classes. Boldface denotes the maximum proportion.
| Class | Area Sig. Decreased (p < 0.05, %) | Area Sig. Increased (p < 0.05, %) | Total Numbers of Lakes in Each Class | ||||||
|---|---|---|---|---|---|---|---|---|---|
| Spring | Summer | Autumn | Winter | Spring | Summer | Autumn | Winter | ||
| I | 0.00 | 0.00 | 25.00 | 0.00 | 0.00 | 25.00 | 0.00 | 0.00 | 4 |
| II | 14.29 | 0.00 | 42.86 | 42.86 | 0.00 | 0.00 | 0.00 | 0.00 | 7 |
| III | 11.11 | 22.22 | 33.33 | 33.33 | 0.00 | 11.11 | 0.00 | 0.00 | 9 |
| IV | 12.50 | 15.28 | 35.42 | 13.19 | 8.33 | 9.72 | 2.78 | 10.42 | 144 |
| V | 25.00 | 33.33 | 25.00 | 50.00 | 0.00 | 0.00 | 0.00 | 0.00 | 12 |
| VI | 12.50 | 25.00 | 25.00 | 25.00 | 0.00 | 37.50 | 0.00 | 0.00 | 8 |
Publisher’s Note: MDPI stays neutral with regard to jurisdictional claims in published maps and institutional affiliations. |
© 2022 by the authors. Licensee MDPI, Basel, Switzerland. This article is an open access article distributed under the terms and conditions of the Creative Commons Attribution (CC BY) license (https://creativecommons.org/licenses/by/4.0/).
Share and Cite
MDPI and ACS Style
Zhang, L.; Wang, S.; Cen, Y.; Huang, C.; Zhang, H.; Sun, X.; Tong, Q. Monitoring Spatio-Temporal Dynamics in the Eastern Plain Lakes of China Using Long-Term MODIS UNWI Index. Remote Sens. 2022, 14, 985. https://doi.org/10.3390/rs14040985
AMA Style
Zhang L, Wang S, Cen Y, Huang C, Zhang H, Sun X, Tong Q. Monitoring Spatio-Temporal Dynamics in the Eastern Plain Lakes of China Using Long-Term MODIS UNWI Index. Remote Sensing. 2022; 14(4):985. https://doi.org/10.3390/rs14040985
Chicago/Turabian StyleZhang, Lifu, Sa Wang, Yi Cen, Changping Huang, Hongming Zhang, Xuejian Sun, and Qingxi Tong. 2022. "Monitoring Spatio-Temporal Dynamics in the Eastern Plain Lakes of China Using Long-Term MODIS UNWI Index" Remote Sensing 14, no. 4: 985. https://doi.org/10.3390/rs14040985
Note that from the first issue of 2016, this journal uses article numbers instead of page numbers. See further details here.