
Efficient Instance Segmentation Paradigm for Interpreting SAR and Optical Images
by
 , , and
Fan Fan
1,2, 
Xiangfeng Zeng
1,*,
Shunjun Wei
1,
Hao Zhang
1,
Dianhua Tang
2,3,
Jun Shi
1 and
Xiaoling Zhang
1 1
School of Information and Communication Engineering, University of Electronic Science and Technology of China, Chengdu 611731, China
2
Science and Technology on Communication Security Laboratory, Institute of Southwestern Communication, Chengdu 610041, China
3
School of Computer Science and Engineering, University of Electronic Science and Technology of China, Chengdu 611731, China
*
Author to whom correspondence should be addressed.
Remote Sens. 2022, 14(3), 531; https://doi.org/10.3390/rs14030531
Submission received: 17 December 2021
/
Revised: 19 January 2022
/
Accepted: 20 January 2022
/
Published: 23 January 2022
(This article belongs to the Special Issue Machine Vision and Advanced Image Processing in Remote Sensing)
Abstract
:Instance segmentation in remote sensing images is challenging due to the object-level discrimination and pixel-level segmentation for the objects. In remote sensing applications, instance segmentation adopts the instance-aware mask, rather than horizontal bounding box and oriented bounding box in object detection, or category-aware mask in semantic segmentation, to interpret the objects with the boundaries. Despite these distinct advantages, versatile instance segmentation methods are still to be discovered for remote sensing images. In this paper, an efficient instance segmentation paradigm (EISP) for interpreting the synthetic aperture radar (SAR) and optical images is proposed. EISP mainly consists of the Swin Transformer to construct the hierarchical features of SAR and optical images, the context information flow (CIF) for interweaving the semantic features from the bounding box branch to mask branch, and the confluent loss function for refining the predicted masks. Experimental conclusions can be drawn on the PSeg-SSDD (Polygon Segmentation—SAR Ship Detection Dataset) and NWPU VHR-10 instance segmentation dataset (optical dataset): (1) Swin-L, CIF, and confluent loss function in EISP acts on the whole instance segmentation utility; (2) EISP* exceeds vanilla mask R-CNN 4.2% AP value on PSeg-SSDD and 11.2% AP on NWPU VHR-10 instance segmentation dataset; (3) The poorly segmented masks, false alarms, missing segmentations, and aliasing masks can be avoided to a great extent for EISP* in segmenting the SAR and optical images; (4) EISP* achieves the highest instance segmentation AP value compared to the state-of-the-art instance segmentation methods.
1. Introduction
Thanks to the advances brought about by remote sensing (RS) technology, the capacity and quality of synthetic aperture radar (SAR) and optical images have significantly improved, which, to some extent, assists researchers in characterizing the targets in high-resolution Earth observation. Meanwhile, the interpretation of SAR and optical images exerts essential influence on various applications, e.g., urban management, land changes, and environmental monitoring [1,2,3,4]. Correspondingly, with the dramatically increased volume of RS images, efficient and universal methods in interpreting SAR and optical images have raised the attention of the RS field.
In recent years, the deep convolutional neural network (DCNN) has been applied in various fields that have benefited from its advantages such as automatic feature extraction, end-to-end training capability, minimal prior knowledge demand, etc. As for the application in the remote sensing field, DCNN-based methods enable fast and accurate classification, location, and segmentation when interpreting the targets compared to the traditional methods. Generally, according to the practical demand, the DCNN-based methods for SAR and optical images can be roughly categorized into image-level (image classification [3,5,6,7]), object-level (object detection [8,9,10]), and pixel-level (image segmentation [1,11,12]) with increasing challenge. Image-level methods predict the category of each image with simple yet effective networks. Object-level methods adopt horizontal or oriented bounding boxes to interpret the objects with positional coordinates (basic four-points bounding box coordinates or containing additional angle direction). As for pixel-level methods, semantic segmentation-based methods predict the objects in a pixel-by-pixel scheme without categorizing objects within the same category. However, objects in SAR and optical images could be dense but compactly distributed. Therefore, in this paper, we adopt instance segmentation to interpret objects in pixel-wise fashion and distinguish individual objects within the same category.
So far, researchers have achieved continuous breakthroughs in automatically interpreting SAR and optical images. In terms of constructing the prerequisite SAR and optical datasets for developing and testing the DCNN-based methods, quite a few SAR and optical datasets are presented. In the optical remote sensing field, Xia et al. introduced the large-scale dataset for object detection in aerial images (DOTA [13]) with various orientations, scales, and categories. Based on DOTA, Zamir et al. supplemented pixel-level segmentation annotation for each object and constructed the benchmark instance segmentation in aerial images dataset (iSAID [14]). Analogously, Cheng et al. constructed the NWPU VHR-10 dataset [15] with limited data volume but very high-resolution (VHR) optical images; Su et al. extended NWPU VHR-10 dataset with pixel-level segmentation annotation for each object [16]. In the SAR field, Su et al. extended the SAR ship detection dataset (SSDD) with enclosed polygon annotation for pixel-level ship interpretation [17]. By eliminating the defects of low image quality, incorrect annotations, and limited data volume in existing SAR datasets such as SSDD, Wei et al. constructed a high-resolution SAR images dataset (HRSID [18]) which supports ship detection and instance segmentation in qualified SAR data.
Correspondingly, with the increasing volume of SAR and optical datasets, multitude DCNN-based methods are developed, accounting for the increasing demand of SAR and optical image intelligent interpretation. Among them, object detection with horizontal bounding boxes or oriented bounding boxes have drawn much attention. Cheng et al. proposed a rotation-invariant convolutional neural network (RICNN) which imposes a regularization constraint to achieve the rotation invariance in object detection [19]. Similarly, to reduce the background interference of geospatial object detection, An et al. adopted the oriented bounding box to detect ships with arbitrary orientation [20]. As for horizontal-bounding-box-based object detection, Zhang et al. proposed a balanced scene learning mechanism (BSLM) to detect inshore and offshore ships in SAR images [21]; Wei et al. combined the high-resolution and low-resolution convolutions in representation learning when detecting the SAR ships [2]. To transplant the ship detectors into hardware platforms, Zhang et al. adopted fewer convolutional layers and depthwise separable convolution to develop the lightweight, but precise, attribute of the proposed ship detector [9]. Distinguished from object detection, semantic segmentation aims at predicting the pixel-level semantic category for the objects. In terms of promoting the convergence performance of semantic segmentation, Bokhovkin et al. proposed the boundary loss for sufficiently penalizing the misalignment of boundaries in RS imagery [22]. To maintain the feature representation ability of the upsampling process, Wang et al. proposed the Content-Aware ReAssembly of FEatures (CARAFE) to capture the contextual information in dense prediction tasks [23]. As for intraclass variance and small interclass variance in semantic segmentation, Li et al. integrated the lightweight spatial and channel attention modules to remedy them [24]. Zhang et al. [25] proposed the multiscale context aggregation module to improve the localization accuracy and preserve the spatial details of semantic segmentation in RS images.
Compared to object detection and semantic segmentation, instance segmentation in SAR and optical images inherits the characteristic of pixel-level prediction in semantic segmentation and supplements the localization and interclass classification in object detection, which provides comprehensive interpretation to SAR and optical images. However, related works in the RS field are scarce. In terms of the general instance segmentation methods, Su et al. proposed the high-quality instance segmentation network (HQ-ISNet) to interpret RS images under the complex background [17]. As for high-resolution aerial images, consistent proposals of instance segmentation network (CPISNet) integrates the cascaded detection branches and residual convolution networks to precisely segment the aerial instances [26]. Inspired by object detection, Chen et al. designed the instance segmentation network with the bounding box attention module and bounding box filter module [27].
In this paper, to resolve the instance segmentation task under the complex background and the situation of densely distributed small objects in SAR and optical images, we proposed the efficient instance segmentation paradigm (EISP) for interpreting SAR and optical images. EISP inherits the top-down instance segmentation paradigm and introduces three main components for the counterpart characteristics of SAR and optical images. First, the Swin Transformer is adopted for extracting the hierarchical feature maps of SAR and optical images and to model the long-range dependencies of the small objects in SAR and optical images with non-overlapping window based self-attention). Second, the flattened features for object detection are transferred by a context information flow (CIF) module to interact with the features for mask prediction. Third, the proposed confluent loss function can converge the predicted segmentation masks with the combination of distribution, regional, and boundary manner for general segmentation tasks.
The main contributions of this paper are summarized as below:
- EISP is proposed for efficient instance segmentation of remote sensing images.
- Effects of Swin Transformer, CIF, and confluent loss function to the EISP are individually verified, which boost the integral network performance.
- EISP achieves the highest AP value of instance segmentation in remote sensing images compared to the other state-of-the-art methods.
2. Related Work
2.1. Semantic Segmentation
Semantic segmentation is a subtask of image segmentation. It aims at endowing each pixel of the input image a semantic category. Each pixel within a certain semantic category is marked by the same color. By defining and detailing the space of the fully convolutional networks (FCNs), Long et al. first apply it into the dense prediction task of semantic segmentation [28]. In the field of biomedical image segmentation, Ronneberger et al. proposed the medical image segmentation network which consists of a contracting path for capturing context and a symmetric expanding path for precise location, termed U-Net [29]. Inheriting the encoder and decoder architecture, Badrinarayanan et al. mapped the low-resolution feature maps in the encoder to full-input-resolution feature maps in the decoder for pixel-wise classification [30]. In a pyramid scene parsing network (PSPNet), Zhao et al. introduced the which provides global prior representation for pixel-level prediction [31]. By further exploiting Deeplab v3 [32], Chen et al. proposed Deeplab v3+, which refines the segmentation results along the object boundaries [33].
2.2. Instance Segmentation
Distinguished from semantic segmentation, instance segmentation performs pixel-wise prediction in an image and enables the discrimination of objects within the same category. Instance segmentation methods can be divided into three categories, including top-down methods, bottom-up methods, and direct methods. As stated literally, top-down methods follow the formula of detect first, then segment. Based on the object detection architecture of faster R-CNN [34] (with prior bounding box detection), He et al. parallels a mask branch to the object detection branch for mask prediction, termed mask R-CNN [35]. Following the original architecture of mask R-CNN, mask scoring R-CNN calibrates the misalignment between mask quality and mask score [36]. Analogous to the process of mask R-CNN, cascade mask R-CNN [37] parallels a mask branch to the object detection branch in each stage of cascade R-CNN [37] for precise instance segmentation. To bridge the gap of limited performance gain by simply integrating the mask branch in cascade mask R-CNN, hybrid task cascade (HTC) [38] interweaves the mask branches in cascade mask R-CNN for joint multi-stage processing and adopts a fully convolutional branch to provide spatial context. Moreover, SCNet [39] incorporates feature relay and global contextual information to further reinforce the reciprocal relationships of object detection and instance segmentation in cascaded architectures.
The two-stage process in top-down instance segmentation methods slows down the segmentation speed. In contrast, bottom-up instance segmentation methods segment the objects directly and they are superior in segmentation speed. By generating a set of prototype masks, Yolact [40] predicted the mask coefficients of each instance for instance segmentation. BlendMask [41] implemented instance segmentation by combining instance-level information with semantic information with lower-level fine-granularity. Prior to the center classification and distance regression, PolarMask [42] generated the instance mask by predicting the object contour in a polar coordinate. Inspired by mask R-CNN, conditional convolutions, for instance segmentation (CondInst [43]), achieved fast inference speed via dynamically-generated conditional convolutions and FCNs. Segmenting objects by locations (SOLO [44]) viewed instance segmentation as the task of assigning categories to each pixel within an instance according to the instance’s location and size. Despite the fast inference speed, bottom-up instance segmentation methods are inferior in segmentation precision to top-down instance segmentation methods.
3. The Proposed Method
An overview of the proposed EISP is illustrated in Figure 1. It consists of the Shifted Windows (Swin) Transformer [45] to extract the hierarchical features of the input SAR and optical images, the region proposal network (RPN [46,47]) and region of interest (RoI) extractor to generate the region proposals, the context information flow (CIF) to interweave the semantic features from the bounding box branch to mask branch, and the confluent loss function to refine the predicted masks.
3.1. Swin Transformer
Transformers use the attention mechanism to model the long-range dependencies in the data, and they achieve tremendous success in the natural language processing (NLP) domain. Here, we introduce the Swin Transformer to extract the multilevel features of SAR and optical images. The Swin Transformer computes the self-attention within the non-overlapping local windows to reduce the network complexity, and constructs the hierarchical architecture to capture the multilevel feature maps for multiscale segmentation. As the small objects occupy the vast majority of satellite objects, the non-overlapping window-based self-attention in Swin Transformer can effectively capture the long-range dependencies of them, due to the relatively large object-to-background ratio, and eliminate interference from the complex background at the same time. The overall architecture of the Swin Transformer is illustrated in Figure 2. It contains the operations of patch partition, linear embedding, Swin Transformer block, and patch merging. Given the input RS image with the size of , patch partition transforms it into image patches with the size of by the non-overlapping shifting window. Then, the linear embedding layer projects the channel of the image patches into the arbitrary number C. Next, the Swin Transformer block processes the image patches by the shifted window based self-attention in non-overlapped windows. With the consecutive patch merging layer and Swin Transformer block, the hierarchical architecture of the Swin Transformer is constructed. Consequently, the output of to are , , , , respectively.
3.1.1. Swin Transformer Block
In terms of the segmentation tasks, they require per-pixel prediction on the input images. However, the computational complexity of the self-attention module in transformers is quadratic to image size in such application scenes, which is prone to be intractable for the transformer to segment the high-resolution remote sensing images. Therefore, the Swin Transformer block replaces the multihead self-attention (MSA) module in the block of vision transformer (ViT) to window-based multihead self-attention (W-MSA) module and shifted window-based multihead self-attention (SW-MSA) module. Assuming the size of input feature is , the computational complexity of the traditional MSA module is computed via
It is obvious that is quadratic in regards to HW. However, as W-SMA and SW-MSA compute the self-attention of each evenly partitioned window (with the size of ) of the image, the computational complexity of W-SMA and SW-MSA is
which shows a linear relationship to HW. Compared to the computational complexity of MSA, it is scalable for W-SMA and SW-MSA to process the high-resolution remote sensing images. W-MSA evenly splits the image into windows with the size of . In the two consecutive Swin Transformer blocks, as in Figure 3, SW-MSA shifts the partitioned windows in W-MSA by () pixels, which can also be formulated as follows:
where LN denotes the layer normalization operation; MLP is the module in the transformer architectures. and represent the output of (S)W-SMA module and MLP module, respectively. In terms of the Swin Transformer, it adopts the consecutive Swin Transformer block in each stage.
3.1.2. Hyperparameters Setting
As illustrated in Figure 2, the number of successive Swin Transformer blocks in each stage and the number of output channel C in the linear embedding layer formulates the network space (the width and depth) of Swin Transformer. Consequently, the Swin transformer small (Swin-S) is endowed with and the number of successive blocks in to . Analogously, Swin Transformer basic (Swin-B) has and successive blocks of ; Swin Transformer large (Swin-L) has and successive blocks of . In terms of the window size, we maintain the size of pixels for each evenly partitioned image.
3.2. Context Information Flow
Motivated by exploring the implicit mutual information between the sub-tasks of classification, location, and mask prediction, we have designed the context information flow (CIF) to explicitly incorporate the deep representative features in object detection with the mask RoI features to improve the performance of mask prediction. Generally, the bounding box features provide the prior information for mask prediction. However, the predicted masks can in turn supervise the bounding box features via backpropagation. Therefore, we supplemented the CIF to build the shortcut connection among detection branch and mask branch to benefit both tasks. The architecture of CIF is streamlined in Figure 1.
Assuming the pooled bounding box RoI features from FPN are (), we flatten to and apply two fully connected (FC) layers to map the distributed feature to the target feature Q (), which can be presented as follows:
where denotes the FC layer with parameter . To be consistent with the space of samples in the mask branch, Q is sliced to with the size of . Next, a supplemented FC layer is attached to for reassembling the context information from the detection branch. Immediately afterwards, the distributed represented features from FC layer are reconstructed to multidimensional feature M (). The process is formulated as follows:
To match the input size () of the mask branch and enlarge the receptive field when processing the feature M, we upsample M with the content-aware reassembly module (CARM) in two steps: content-aware kernel generation and feature reassemble. The overall process is shown in Figure 4.
- Step 1: Content-aware Kernel Generation
Figure 4a illustrates the intuitive implementation of Step 1, which is responsible for generating the kernel corresponding to each object location. Analogously, it is composed of four sub-tasks: (1) A channel refactor is applied to compress the channel of for reducing the computational cost and model complexity. We choose a convolutional kernel to compress the input channel from C to , making CIF lightweight but efficient. (2) The content encoder which relies on a convolutional kernel excites the feature with output channels. (3) Assuming the encoded feature is , we upsample it with pixel shuffle kernel to generate the reassembly kernel W with the size of . (4) Before being implemented to feature reassemble process, each spatial location of W is transmitted to by a softmax function, which normalizes the sum of channel-wise kernel to 1. The procedure can be formulated as follows:
where represents the convolutional kernel with parameter .
- Step 2: Feature Reassemble
Figure 4b illustrates the intuitive implementation of Step 2, which applies the content-aware kernel to reassemble the input feature in the spatial dimension. Each location in input feature is associated with a -centered square region . Correspondingly, each content-aware kernel in enables pixel-wise summation with which contributes to each pixel of the upsampled synergistically. The reassembly is described via
where · represents the weighted element-wise summation between and . The upsampled feature by CARM contains stronger semantic information than traditional upsample methods, e.g., bilinear interpolation, as it leverages the underlying context information in the original feature map.
Through the context information flow from to , the distribution represented feature for object detection is reconstructed to the size of as that in mask prediction. Finally, we implement element-wise summation for and input mask feature (P) to generate the shortcut connection, which is shown below:
where is the CIF enhanced feature for mask prediction.
3.3. Confluent Loss Function
Similar to object detection, instance segmentation retains the object-level discrimination in the segmentation task. Empirically, researchers extend the Cross Entropy (CE) loss function in object detection to binary cross entropy (BCE) loss function, for instance segmentation. BCE loss function is calculated via:
where is the pixel located at of the ith level of the ground truth feature map and is the pixel of the predicted feature map. However, the characteristic of pixel-level prediction intrinsically requires instance segmentation to consider the regional dependencies and reduce the boundary migration in the counterpart semantic segmentation tasks. As for regional dependencies, assuming there are two numerical sets X and Y, the dice score coefficient (DSC) can be expressed as Equation (15):
Analogously, as for and , operator ∩ equals elementwise dot product, and operator equals numerical square. Therefore, the binary dice (BD) loss function can be formulated as Equation (16):
In the next part, we supplement the boundary information to supervise the predicted mask. Given the distance map of the ground truth mask, the nonsymmetric distance of the predicted boundary () and ground truth boundary () can be calculated via the regional integrals:
where q represents the pixel on the ground truth boundary, is the enclosed area of the predicted contour and ground truth contour. Considering the result of hinges on the ground truth mask, and that it should be a constant, we formulate the boundary distance with . Therefore, the binary boundary (BB) loss for instance segmentation is calculated as follows:
where denotes the distance map of mask; is the inverse of ground truth mask ; is the normalized distance map of . Thus, our confluent loss for mask prediction can be formulated as follows:
where and represent the loss weight for the BD loss () and BB loss (), respectively. Following [26], we set here to maintain the ratio of 3:1 for regional loss function and distributional loss function. Therefore, can be transformed to
Note that the value of will be determined in our subsequent ablation experiments.
4. Experiments
In this section, we introduce the datasets for experiments, evaluation metrics, and implementation details in advance. Then, comprehensive experiments on the SAR Ship Detection Dataset (SSDD) and NWPU VHR-10 Instance Segmentation Dataset are conducted on our proposed EISP to verify its effectiveness.
4.1. Datasets
4.1.1. SAR Ship Detection Dataset
The SAR Ship Detection Dataset (SSDD) is the first dataset for SAR imagery-based intelligent interpretation presented by Li et al. In [48], vanilla SSDD with horizontal bounding box annotation is extended to pixel-level polygon segmentation SSDD (PSeg-SSDD), which supports the instance segmentation of SAR imagery in our work. Consistent with the data volume in SSDD, PSeg-SSDD contains 1160 SAR images in total with various polarizations, resolutions, and scenes. In our experiments, we randomly divided the PSeg-SSDD into the training set and test set with the ratio of 7:3 for training and testing, respectively. The annotations of ships are standardized to COCO format with ground truth mask, area, and related bounding box for instance segmentation.
4.1.2. NWPU VHR-10 Instance Segmentation Dataset
The NWPU VHR-10 Instance Segmentation Dataset is extended by Wei et al. [17] with pixel-level polygon annotation from the vanilla NWPU VHR-10 Dataset, which supports the tasks of object detection, semantic segmentation, and instance segmentation in very high-resolution (VHR) optical remote sensing imagery. The NWPU VHR-10 Instance Segmentation Dataset contains 650 VHR images with annotated targets and 150 VHR images with a pure background. There are 10 classes of targets scattered in the dataset, including bridge (BR), basketball court (BC), storage tank (ST), harbor (HB), tennis court (TC), ship (SH), vehicle (VC), ground track field (GTF), baseball diamond (BD), and airplane (AI). Following the original division ratio of 7:3 in [15] that is used for generating the training set and test set, we obtain the training set and test set for our experiments.
4.2. Evaluation Metrics
Standard Microsoft Common Objects in Context (MS COCO [49]) evaluation metrics are adopted for evaluating the quantitative instance segmentation results generated on the test set. Based on the intersection over union (IoU) of the predicted results and ground truth results, the IoU ratio of each predicted result is defined by
where the predicted mask and ground truth mask are, respectively, represented by and . Setting a prior IoU threshold criterion, the predictions of instance segmentation results can be categorized into true positive (TP), false positive (FP), true negative (TN), and false negative (FN). Then, the corresponding precision value and recall value is calculated via
Constructing the Cartesian coordinate system with recall value as the abscissa and precision value as the ordinate, the average precision (AP) of the prior IoU threshold is calculated by
where is the precision value of the counterpart recall value, and r is the recall value. Considering the MS COCO evaluation metrics in our experiments, the AP value is the average of 10 value from 0.5 to 0.95 with the stride of 0.05, which is calculated as follows:
As for the dataset with N classes, the mean AP (mAP) is average AP value of the classes:
4.3. FLOPs
In computer vision, the number of trainable parameters are calculated via
where and are the number of input and output channels of convolution kernel. If the width and height of the input image are given, the floating-point operations (FLOPs) for computing the model complexity of CNN-based architectures are defined by:
4.4. Implementation Details
In our experiments, all of the methods are modeled by Pytorch framework. The training and test schemes are based on a single Nvidia Quadro RTX 6000 GPU. While training, the Adam is selected as the model optimizer. Each model is trained for 12 epochs with the mini-batch size of two. The initial learning rate is set at 0.0025 and attenuated by the ratio of 0.1 in 8th and 11th epoch. While testing, we select soft non-maximal suppression (Soft NMS) with 0.5 threshold to filter the finest bounding box among the predictions. Note that the images in NWPU VHR-10 instance segmentation dataset and PSeg-SSDD are, respectively, resized to pixels and pixels for training and testing.
4.5. Effects of the EISP
To verify the effects of the Swin Transformer, CIF, and confluent loss function to vanilla mask R-CNN and the overall utility to EISP, we individually measured the AP of each module and the integral AP of EISP. As per the results reported in Table 1, Swin-L, CIF, and confluent loss function, respectively, yield 2.3%, 1.7%, and 1.8% AP value with regard to vanilla mask R-CNN in PSeg-SSDD. In addition, EISP achieves 3.6%, 4.7%, and 4.8% improvement in AP, AP50, and AP75, respectively. In the scale-differentiated AP indicators, EISP even achieves 8.1% APM improvement. Under the counterpart experimental results of NWPU instance segmentation dataset, Swin-L, CIF, and confluent loss function, respectively, yield 5.2%, 1.5%, and 4.9% AP value with regard to vanilla mask R-CNN. In regards to EISP, it respectively achieves 8.2%, 4.8%, and 12.0% AP, AP50, and AP75 improvement. As for the scale-differentiated AP indicators, it even achieves ∼9.0% improvement. In terms of computational complexity, the proposed confluent loss function receives considerable AP value improvement without adding the FLOPs. Relatively, CIF and Swin Transformer require additional FLOPs to drive. The qualitative results of EISP are illustrated in Figure 5, where the contour of the objects fits the counterpart ground truth mask well.
4.6. Ablation Experiments
In this section, we conduct experiments to select the optimal network structure for each module of the proposed EISP.
4.6.1. Experiments on Swin Transformer
Apart from the various architectures of Swin Transformers mentioned in Section 3.1.2, we supplement several mainstream backbone networks, including Res2Net [50], HRNet [51,52], and RegNetx [53], for comprehensive contrast experiments. As shown in Table 2, the mainstream backbone networks for experiments serve as the efficient feature extractors for SAR and optical images. In the experimental results of PSeg-SSDD, HRNetv2-w32 yields 0.4% AP value in relation to ResNet-101; RegNetx and Res2Net achieve ∼0.9% AP improvement than ResNet-101. Overall, the Swin-S, Swin-B, and Swin-L achieve 0.5%, 1.1%, and 2.3% AP improvement in segmenting the SAR images, respectively. In the counterpart experimental results of NWPU VHR-10 instance segmentation dataset, HRNetv2-w32 and RegNetx4.0G yields 2.4% AP value in relation to ResNet-101; Res2Net achieves 3.0% AP improvement over ResNet-101. Overall, the Swin-S, Swin-B, and Swin-L achieve 5.6%, 6.0%, and 6.4% AP improvement in segmenting the optical images, respectively. Experimental results on PSeg-SSDD and NWPU VHR-10 instance segmentation dataset indicate that the Swin Transformer is efficient in segmenting the SAR and optical images.
4.6.2. Experiments on CIF
Considering the efficient context information flow from the bounding box branch to the mask branch, we compress the number of feature channels in the feature reassemble step. Here, we select the channel numbers 32, 64, 128, and 256 for experiments and the results are listed in Table 3. As for the results in PSeg-SSDD, the channel number of 64 achieves salient AP performance (58.4% AP value) compared to the rest of the situations. In the counterpart results of NWPU VHR-10, the channel number of 32 shows competitive performance to the channel number of 64 (59.3% AP value vs. 59.4% AP value). In general, for segmenting the SAR and optical images, we choose the channel number of 64 for our CIF module.
4.6.3. Experiments on Confluent Loss Function
As described in Section 3.3, we conduct ablation experiments on the value of to select the optimal choice for segmenting the SAR and optical images in Table 4. In the results of PSeg-SSDD, and retain competitive performance for SAR images (58.4% AP value vs. 58.5% AP value). With the increase of value, the AP value gradually decreases from 58.5% to 55.6%. In the counterpart results of NWPU VHR-10, the AP value increases at then decreases, and the numerical span is 8.1% (62.8% AP value vs. 54.7% AP value). For comprehensive consideration of the results of PSeg-SSDD and NWPU VHR-10 instance segmentation dataset, should be the optimal selection for instance segmentation of SAR and optical images.
4.7. Ship Segmentation Result of PSeg-SSDD
To verify the general effects of the proposed EISP, we selected seven mainstream instance segmentation methods, including Yolact [40], mask R-CNN, Instaboost [54], masksScoring R-CNN (MS R-CNN), cascade mask R-CNN (CM R-CNN), hybrid task cascade (HTC), and HQ-ISNet for comparison, which contains the categories of top-down, bottom-up, and RS images dedicated instance segmentation methods. The training and test hyperparameters follow the default settings in [55] except for that described in Section 4.3. Note that the top-down and bottom-up instance segmentation methods adopt the ResNet-101 and FPN as the feature extraction structure. The quantitative results are summarized in Table 5. As a bottom-up instance segmentation method, Yolact merely achieves 44.5% AP value in segmenting the SAR images. However, benefiting from the direct segmentation to the SAR ships, Yolact gains 37.2% APL value, which is superior in segmenting the large ships compared to the top-down instance segmentation methods. Instaboost and MS R-CNN optimize mask R-CNN with location probability map guided mask annotations and mask quality to mask score calibration, respectively. Integrating the cascaded architectures, CM R-CNN and HTC further exceed the mask R-CNN by 1.5% and 1.8% AP, respectively. In the remote sensing field, HQ-ISNet achieves state-of-the-art performance in segmenting the RS images. By refactoring the HQ-ISNet and applying our training and test conditions, HQ-ISNet gains 59.4% AP value, pioneering IoU-differentiated (AP50 and AP75) and scale-differentiated (APS, APM, and APL) AP value.
As presented in Table 5, our proposed EISP obtains the highest (60.9%) AP compared to the state-of-the-art methods. It exceeds Yolact, mask R-CNN, and HQ-ISNet by 16.4%, 4.2%, and 1.5% AP in segmenting the SAR ships, respectively. In addition, it achieves the highest (93.3%) AP50 and (73.3%) AP75 value. As for segmenting the medium ships, EISP still yields 4.0% AP increments with regard to HQ-ISNet. Considering the scale variance of RS images, we supplement the multiscale training for further improving the performance of EISP. In the training phase, the images are resized to the size of , , , , , and pixels. In the test phase, the images retain the size of pixels. We name the EISP with multiscale training scheme as EISP*. Without whistles and bells, EISP* achieves 60.9% AP value, which further improves by 0.6% on the AP value of EISP. In addition, it exceeds Yolact, Mask R-CNN, and HQ-ISNet by 17.0%, 4.8%, and 2.1% AP in segmenting the SAR ships, respectively. With the cost of 20.8G FLOPs, EISP and EISP* yields HQ-ISNet 0.9% and 1.5% AP value, respectively. In addition, we provide the precision–recall (PR) curve of AP50 for each state-of-the-art method in Figure 6, where the enclosed area of the x-axis, y-axis, and the curve represent the AP50. As presented in the left part of Figure 6, EISP and EISP* perform better than the state-of-the-art methods with AP50 metric.
Apart from the quantitative results, we visualize the qualitative ship segmentation results in Figure 7. In the inshore scenes, such as the port, the state-of-the-art methods find it hard to distinguish the ships surrounded by the high-reflective artificial facilities. Thus, they are prone to generate false alarms (highlighted by purple rectangle), missing segmentations (highlighted by orange rectangles), aliasing masks (highlighted by red rectangles), and poorly segmented masks (highlighted by blue rectangle). In the offshore scenes, the aliasing masks and missing segmentations selectively appear in the densely distributed ships; however, in the counterpart results of EISP*, such defects are effectively suppressed and the fitness of the segmented masks are comparable to the ground truth, which cross-validates the effectiveness of EISP* in SAR images. Correspondingly, the false alarms appearing in line 9, column 4, and aliasing masks appearing in line 9, column 5 of Figure 7 indicate that EISP* can be further improved to cope with these cases.
4.8. Instance Segmentation Result of NUPU VHR-10
In accordance with the instance segmentation experiments on PSeg-SSDD, the seven state-of-the-art instance segmentation methods are used for comparison with our proposed EISP, where the setting of training and test hyperparameters follows the same criterion. Considering the scale variance of the optical images in NWPU VHR-10 instance segmentation dataset, we define the image size of the multiscale training scheme for EISP* as , , , , and pixels, and the image size of test remains pixels. Distinguished from the counterpart results of PSeg-SSDD, EISP and EISP* bridge the gap in the segmentation precision compared to the state-of-the-art instance segmentation methods. The quantitive results are summarized in Table 6. The size of the input image is scaled to pixels in training the Yolact model. Specifically, Yolact still poorly performs in segmenting the optical RS images; Instaboost, MS R-CNN, CM R-CNN, and HTC have the progressively increased AP value of 58.7%, 59.4%, 60.7%, and 61.9%. In accordance with the results in PSeg-SSDD, HQ-ISNet achieves the highest (62.7%) AP value among the state-of-the-art methods.
As for the proposed EISP and EISP*, they receive the unprecedented 68.1% and 69.1% AP value, respectively. Specifically, EISP exceeds Yolact, mask R-CNN, and HQ-ISNet by 29.5%, 10.2%, and 5.4% AP in segmenting the SAR ships, respectively. As for EISP*, it yields 30.5%, 11.2%, 6.4% AP better values with regard to Yolact, Mask R-CNN, and HQ-ISNet, respectively. Under the scale-differentiated AP indicators, EISP* yields HQ-ISNet 5.1% in AP50 value and 6.4% in AP75 value. As for the scale-differentiated AP indicators, EISP* yields HQ-ISNet 1.0%, 5.8%, and 13.9% in APS, APM, and APL value, respectively. With the cost of 202.8G FLOPs, EISP and EISP* respectively receive a leap of 5.4% and 6.4% AP50 value compared to HQ-ISNet. As presented in the right part of Figure 6, the PR curves of EISP and EISP* are raised more than the remaining methods.
Similar to the procedure in PSeg-SSDD, we visualized the qualitative instance segmentation results in Figure 8. As illustrated in column 1, Figure 8, state-of-the-art methods encounter difficulties, e.g., missing segmentations (highlighted by orange rectangles), aliasing masks (highlighted by red rectangles), and poorly predicted masks (highlighted by blue rectangles), in segmenting the bridges with a large aspect ratio. In terms of the objects, e.g., the tennis court in column 2, the harbor in column 4, and the basketball court in column 5, with dense distribution, state-of-the-art methods tend to produce the aliasing masks among the objects. As for the airplanes with complicated contour, the predicted masks of state-of-the-art methods cannot fit the ground truth masks well. Incidentally, false alarms occasionally appeared in these methods. However, as illustrated in row 9, Figure 8, our proposed EISP* can effectively suppress these defects and generated the fitted masks for the objects regardless of the category, which cross-validates the effectiveness of the proposed method in optical images. Meanwhile, the false alarms in row 9, column 4 indicate that EISP* can be further improved to cope with the densely packed objects.
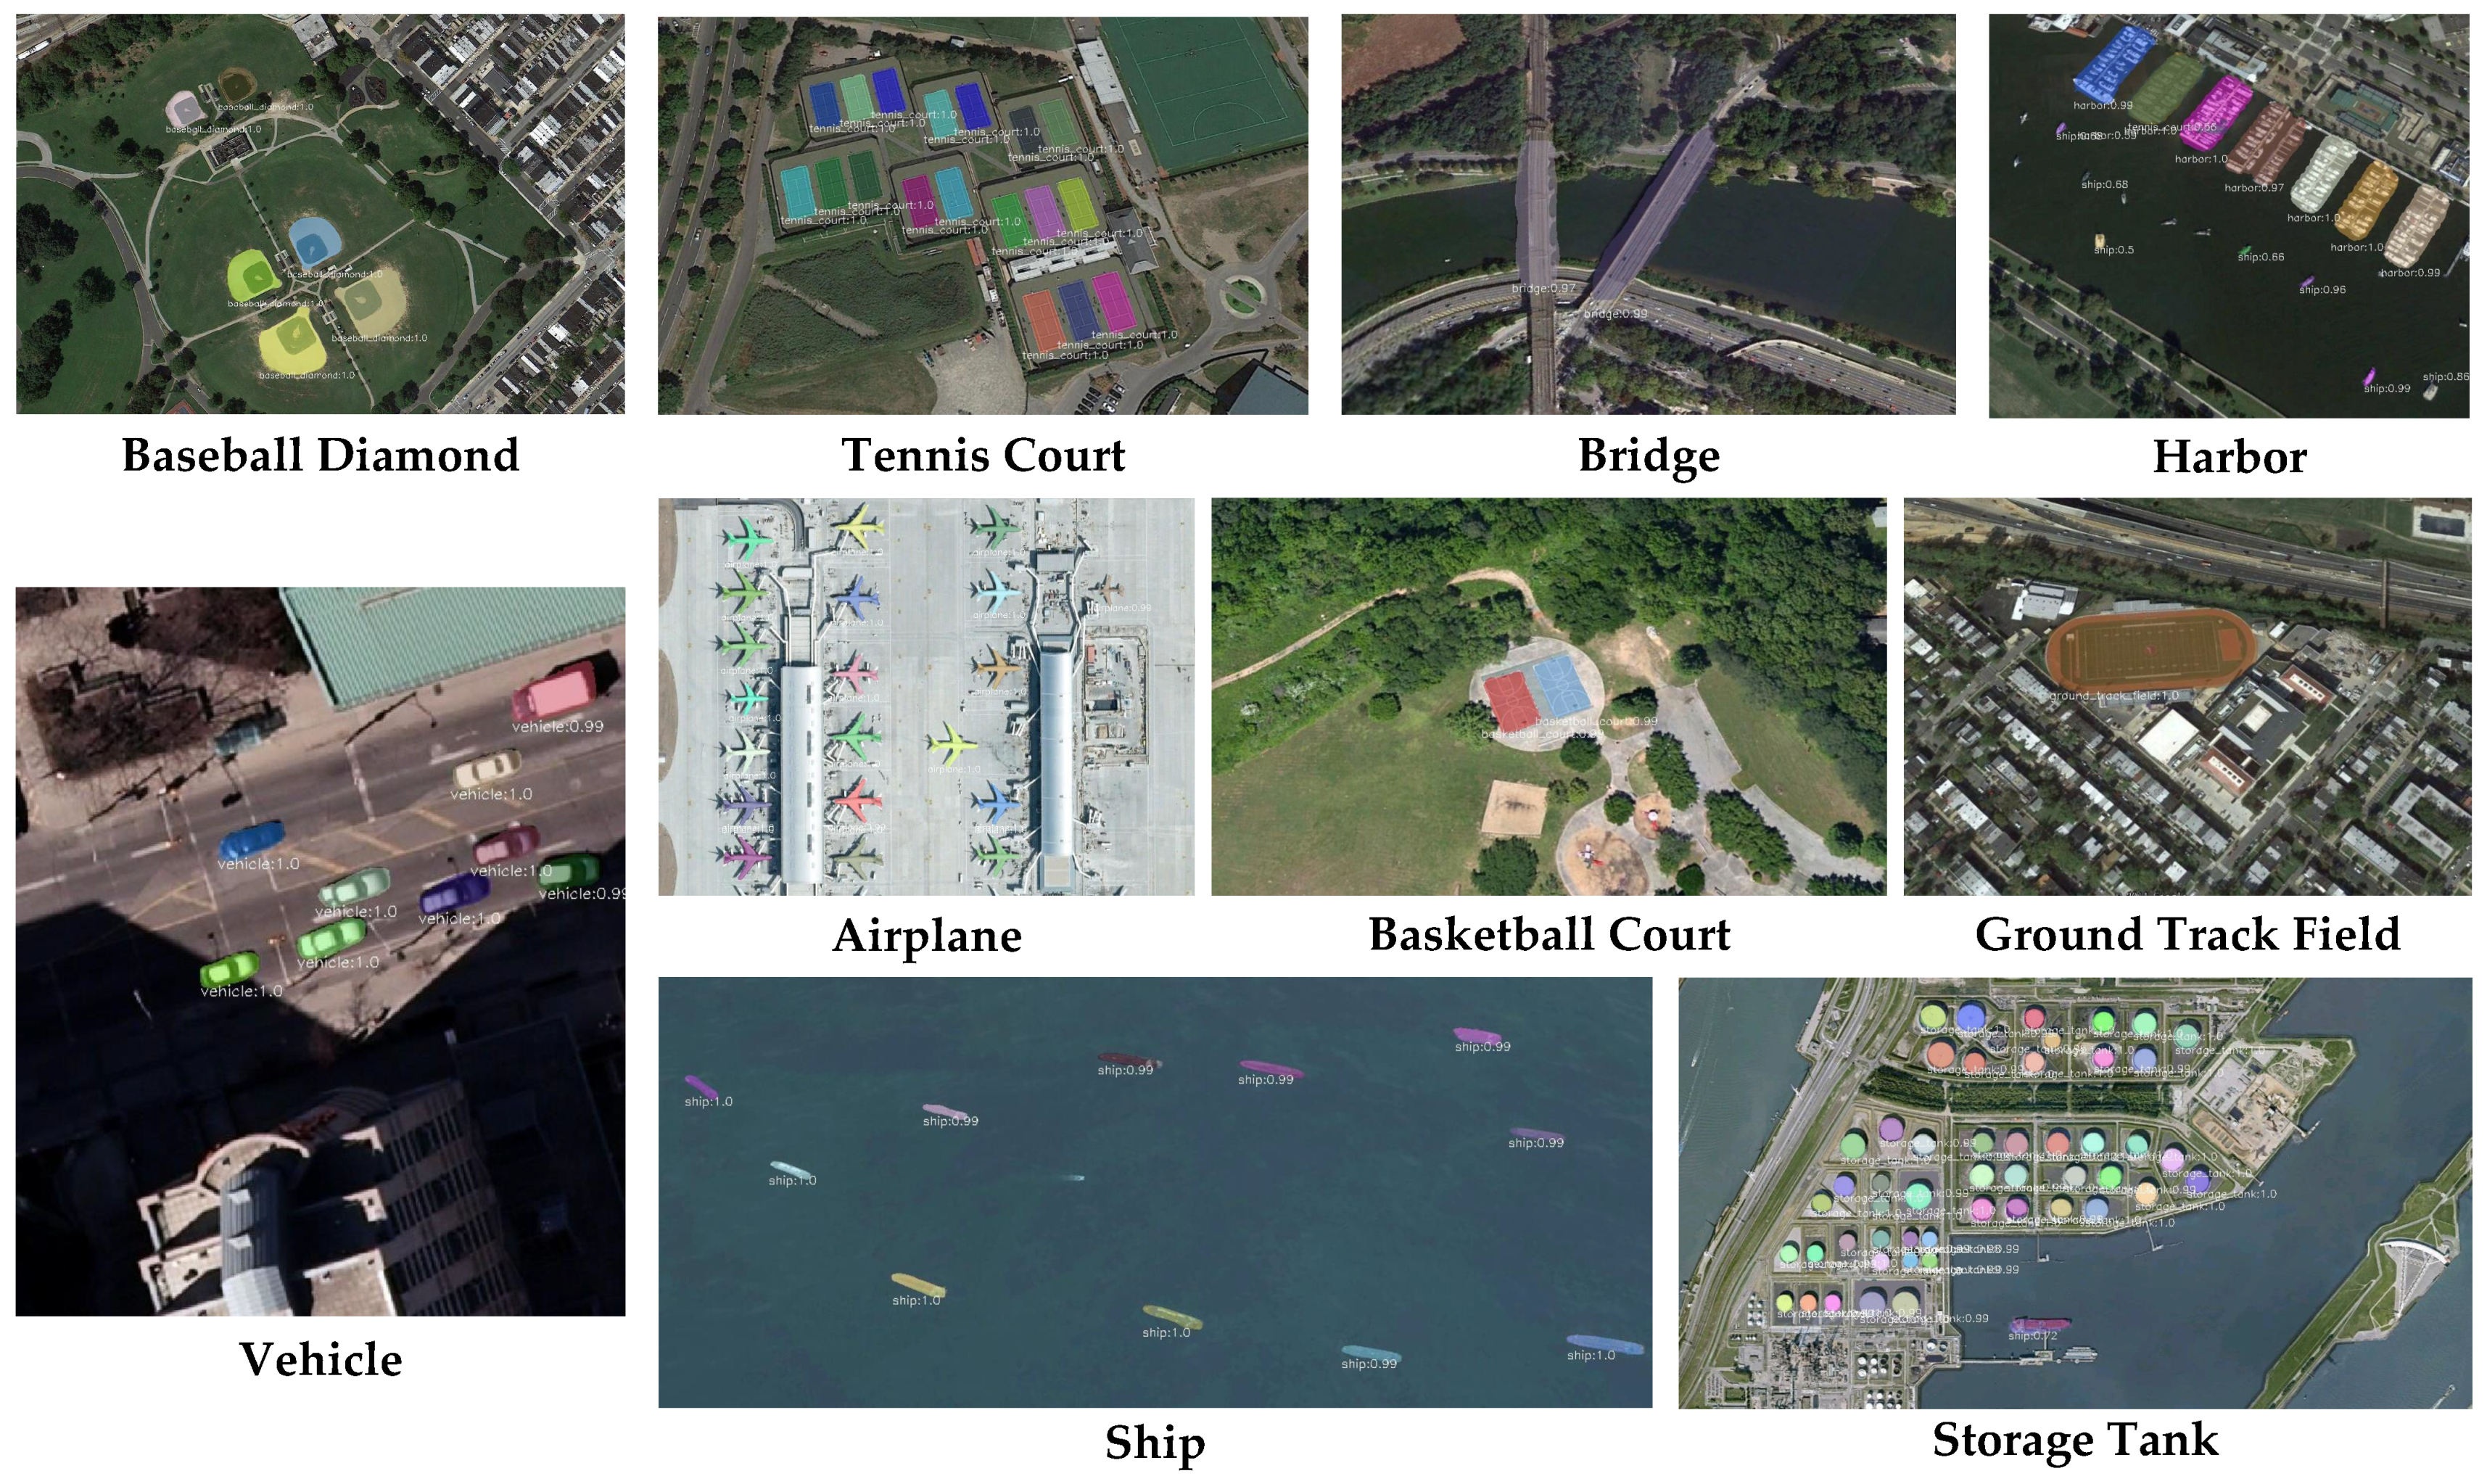
The NWPU VHR-10 instance segmentation dataset contains 10 categories of aerial objects. Therefore, we further measured the class-wise instance segmentation results of each method and we summarize them in Table 7. Among the categories, the ground track field achieves the highest (93.0%) AP value in EISP* and yields a 7.2% AP improvement compared to mask R-CNN; the airplane receives the highest (19.9%) AP improvement (from 27.1% to 47.0%) compared to mask R-CNN, while the AP value of 47.0% still needs to be improved. Similarly, as the top-down instance segmentation methods are inferior in handling the large variance of length and width, the bridge receives the lowest (45.4%) AP value with regard to EISP* due to its large aspect ratio. Relatively, the class-wise instance segmentation results of EISP* are visualized in Figure 9. Identical to the quantitative results, each category in NWPU VHR-10 instance segmentation dataset are segmented with fitted masks by the proposed EISP*.
5. Discussion
Mainstream deep-learning-based methods for interpreting SAR and optical objects adopt horizontal bounding box or oriented bounding box, which contain four coordinates for location and the azimuth coordinate for adjusting the orientation of the predicted results. However, these methods merely interpret the objects with an enclosed rectangular area; the contour and appearance of objects are missed. In this paper, we adopt the efficient instance segmentation paradigm (EISP) to interpret the SAR and optical images in a pixel-wise manner. Intuitively, as illustrated in Figure 5 and Figure 7, Figure 8 and Figure 9, the predicted masks of EISP* are capable of interpreting the SAR and optical objects with the fitted boundary, pixel-level category, and mask-aware location. Despite the effectiveness of EISP and EISP* in segmenting the SAR images and optical images, they still encounter mistakes in precisely predicting the inshore ships in SAR images, e.g., row 9, column 5 of Figure 7, due to the complex inshore background and grayscale features and the densely packed objects in optical images, e.g., the aliasing masks in row 9, column 4 of Figure 8. Future work will focus on reducing the signal noise of SAR images and adapting the characteristics of small SAR ships for segmentation. As for optical images, except for the densely packed objects, we will focus on segmenting the objects with complicated contour, e.g., the airplane, to further improve the segmentation adaptability of the detector.
6. Conclusions
In this paper, we proposed an efficient instance segmentation paradigm (EISP) to interpret the RS images (including SAR image and optical image). Following the top-down instance segmentation formula, EISP adopts the Swin Transformer to construct the hierarchical features of RS images. Then, the region proposal network (RPN) and region of interest (RoI) extractor generate the region proposals for object detection and mask prediction. Next, the context information Flow (CIF) is responsible for interweaving the semantic features from the bounding box branch to the mask branch. Finally, the confluent loss function is proposed for refining the predicted masks. Experimental conclusions can be drawn on the PSeg-SSDD and NWPU VHR-10 instance segmentation datasets: (1) Swin-L, CIF, and confluent loss function in EISP acts on the whole instance segmentation utility; (2) EISP* exceeds vanilla mask R-CNN (by 4.2%) AP value on PSeg-SSDD and (by 11.2%) AP on the NWPU VHR-10 instance segmentation dataset; (3) The poorly segmented masks, false alarms, missing segmentations, and aliasing masks can be avoided to a great extent for EISP* in segmenting the RS images; (4) EISP* achieves the highest instance segmentation AP value compared to the state-of-the-art instance segmentation methods.
Author Contributions
Conceptualization, F.F. and X.Z. (Xiangfeng Zeng); methodology, X.Z. (Xiangfeng Zeng); software, F.F. and D.T.; validation, X.Z. (Xiangfeng Zeng) and H.Z.; formal analysis, F.F. and D.T.; investigation, F.F. and X.Z. (Xiaoling Zhang); resources, S.W., J.S. and X.Z. (Xiaoling Zhang); data curation, H.Z.; writing—original draft preparation, F.F.; writing—review and editing, X.Z. (Xiangfeng Zeng); visualization, F.F. and X.Z. (Xiangfeng Zeng); supervision, S.W., J.S. and X.Z. (Xiaoling Zhang); project administration, S.W. and X.Z. (Xiaoling Zhang); funding acquisition, S.W. All authors have read and agreed to the published version of the manuscript.
Funding
This research was funded by the National Key Research and Development Program of China (2017YFB0502700), the National Natural Science Foundation of China (61501098), and the High-Resolution Earth Observation Youth Foundation (GFZX04061502).
Institutional Review Board Statement
Not applicable.
Informed Consent Statement
Not applicable.
Data Availability Statement
Not applicable.
Acknowledgments
The authors would like to thank the anonymous reviewers and editors for their selfless help to improve our manuscript.
Conflicts of Interest
The authors declare no conflict of interest.
References
- Zeng, X.; Wei, S.; Shi, J.; Zhang, X. A lightweight adaptive roi extraction network for precise aerial image instance segmentation. IEEE Trans. Instrum. Meas. 2021, 70, 5018617. [Google Scholar] [CrossRef]
- Wei, S.; Su, H.; Ming, J.; Wang, C.; Yan, M.; Kumar, D.; Shi, J.; Zhang, X. Precise and robust ship detection for high-resolution sar imagery based on hr-sdnet. Remote Sens. 2020, 12, 167. [Google Scholar] [CrossRef] [Green Version]
- Zhang, T.; Zhang, X. A polarization fusion network with geometric feature embedding for sar ship classification. Pattern Recognit. 2022, 123, 108365. [Google Scholar] [CrossRef]
- Zhang, T.; Zhang, X.; Liu, C.; Shi, J.; Wei, S.; Ahmad, I.; Zhan, X.; Zhou, Y.; Pan, D.; Li, J.; et al. Balance learning for ship detection from synthetic aperture radar remote sensing imagery. ISPRS J. Photogramm. Remote Sens. 2021, 182, 190–207. [Google Scholar] [CrossRef]
- Song, Q.; Xu, F.; Jin, Y.-Q. Sar image representation learning with adversarial autoencoder networks. In Proceedings of the IGARSS 2019—2019 IEEE International Geoscience and Remote Sensing Symposium, Yokohama, Japan, 28 July–2 August 2019; pp. 9498–9501. [Google Scholar]
- Liu, X.; Huang, Y.; Wang, C.; Pei, J.; Huo, W.; Zhang, Y.; Yang, J. Semi-supervised sar atr via conditional generative adversarial network with multi-discriminator. In Proceedings of the 2021 IEEE International Geoscience and Remote Sensing Symposium IGARSS, Brussels, Belgium, 11–16 July 2021; pp. 2361–2364. [Google Scholar]
- Zhang, T.; Zhang, X.; Ke, X.; Liu, C.; Xu, X.; Zhan, X.; Wang, C.; Ahmad, I.; Zhou, Y.; Pan, D.; et al. Hog-shipclsnet: A novel deep learning network with hog feature fusion for sar ship classification. IEEE Trans. Geosci. Remote Sens. 2021, 60, 5210322. [Google Scholar] [CrossRef]
- Zhang, T.; Zhang, X.; Shi, J.; Wei, S. Hyperli-net: A hyper-light deep learning network for high-accurate and high-speed ship detection from synthetic aperture radar imagery. ISPRS J. Photogramm. Remote Sens. 2020, 167, 123–153. [Google Scholar] [CrossRef]
- Zhang, T.; Zhang, X. Shipdenet-20: An only 20 convolution layers and <1-mb lightweight sar ship detector. IEEE Geosci. Remote Sens. Lett. 2020, 18, 1234–1238. [Google Scholar]
- Zhang, T.; Zhang, X.; Ke, X. Quad-fpn: A novel quad feature pyramid network for sar ship detection. Remote Sens. 2021, 13, 2771. [Google Scholar] [CrossRef]
- Hossain, M.D.; Chen, D. Segmentation for object-based image analysis (obia): A review of algorithms and challenges from remote sensing perspective. ISPRS J. Photogramm. Remote Sens. 2019, 150, 115–134. [Google Scholar] [CrossRef]
- Tuia, D.; Muñoz-Marí, J.; Camps-Valls, G. Remote sensing image segmentation by active queries. Pattern Recognit. 2012, 45, 2180–2192. [Google Scholar] [CrossRef]
- Xia, G.S.; Bai, X.; Ding, J.; Zhu, Z.; Belongie, S.; Luo, J.; Datcu, M.; Pelillo, M.; Zhang, L. Dota: A large-scale dataset for object detection in aerial images. In Proceedings of the IEEE Conference on Computer Vision and Pattern Recognition, Salt Lake City, UT, USA, 18–22 June 2018; pp. 3974–3983. [Google Scholar]
- Waqas Zamir, S.; Arora, A.; Gupta, A.; Khan, S.; Sun, G.; Shahbaz Khan, F.; Zhu, F.; Shao, L.; Xia, G.S.; Bai, X. isaid: A large-scale dataset for instance segmentation in aerial images. In Proceedings of the IEEE/CVF Conference on Computer Vision and Pattern Recognition Workshops, Long Beach, CA, USA, 16–17 June 2019; pp. 28–37. [Google Scholar]
- Cheng, G.; Han, J.; Zhou, P.; Guo, L. Multi-class geospatial object detection and geographic image classification based on collection of part detectors. ISPRS J. Photogramm. Remote Sens. 2014, 98, 119–132. [Google Scholar] [CrossRef]
- Su, H.; Wei, S.; Yan, M.; Wang, C.; Shi, J.; Zhang, X. Object detection and instance segmentation in remote sensing imagery based on precise mask r-cnn. In Proceedings of the IGARSS 2019—2019 IEEE International Geoscience and Remote Sensing Symposium, Yokohama, Japan, 28 July–2 August 2019; pp. 1454–1457. [Google Scholar]
- Su, H.; Wei, S.; Liu, S.; Liang, J.; Wang, C.; Shi, J.; Zhang, X. Hq-isnet: High-quality instance segmentation for remote sensing imagery. Remote Sens. 2020, 12, 989. [Google Scholar] [CrossRef] [Green Version]
- Wei, S.; Zeng, X.; Qu, Q.; Wang, M.; Su, H.; Shi, J. Hrsid: A high-resolution sar images dataset for ship detection and instance segmentation. IEEE Access 2020, 8, 120234–120254. [Google Scholar] [CrossRef]
- Cheng, G.; Zhou, P.; Han, J. Learning rotation-invariant convolutional neural networks for object detection in vhr optical remote sensing images. IEEE Trans. Geosci. Remote Sens. 2016, 54, 7405–7415. [Google Scholar] [CrossRef]
- An, Q.; Pan, Z.; Liu, L.; You, H. Drbox-v2: An improved detector with rotatable boxes for target detection in sar images. IEEE Trans. Geosci. Remote Sens. 2019, 57, 8333–8349. [Google Scholar] [CrossRef]
- Zhang, T.; Zhang, X.; Shi, J.; Wei, S.; Wang, J.; Li, J.; Su, H.; Zhou, Y. Balance scene learning mechanism for offshore and inshore ship detection in sar images. IEEE Geosci. Remote Sens. Lett. 2020, 19, 4004905. [Google Scholar] [CrossRef]
- Bokhovkin, A.; Burnaev, E. Boundary loss for remote sensing imagery semantic segmentation. In International Symposium on Neural Networks; Springer: Cham, Switzerland, 2019; pp. 388–401. [Google Scholar]
- Wang, J.; Chen, K.; Xu, R.; Liu, Z.; Loy, C.C.; Lin, D. Carafe: Content-aware reassembly of features. In Proceedings of the IEEE/CVF International Conference on Computer Vision, Seoul, Korea, 27 October–2 November 2019; pp. 3007–3016. [Google Scholar]
- Li, H.; Qiu, K.; Chen, L.; Mei, X.; Hong, L.; Tao, C. Scattnet: Semantic segmentation network with spatial and channel attention mechanism for high-resolution remote sensing images. IEEE Geosci. Remote Sens. Lett. 2020, 18, 905–909. [Google Scholar] [CrossRef]
- Zhang, J.; Lin, S.; Ding, L.; Bruzzone, L. Multi-scale context aggregation for semantic segmentation of remote sensing images. Remote Sens. 2020, 12, 701. [Google Scholar] [CrossRef] [Green Version]
- Zeng, X.; Wei, S.; Wei, J.; Zhou, Z.; Shi, J.; Zhang, X.; Fan, F. Cpisnet: Delving into consistent proposals of instance segmentation network for high-resolution aerial images. Remote Sens. 2021, 13, 2788. [Google Scholar] [CrossRef]
- Chen, L.; Fu, Y.; You, S.; Liu, H. Efficient hybrid supervision for instance segmentation in aerial images. Remote Sens. 2021, 13, 252. [Google Scholar] [CrossRef]
- Long, J.; Shelhamer, E.; Darrell, T. Fully convolutional networks for semantic segmentation. In Proceedings of the IEEE Conference on Computer Vision and Pattern Recognition, Boston, MA, USA, 7–12 June 2015; pp. 3431–3440. [Google Scholar]
- Ronneberger, O.; Fischer, P.; Brox, T. U-net: Convolutional networks for biomedical image segmentation. In International Conference on Medical Image Computing and Computer-Assisted Intervention; Springer: Cham, Switzerland, 2015; pp. 234–241. [Google Scholar]
- Badrinarayanan, V.; Kendall, A.; Cipolla, R. Segnet: A deep convolutional encoder-decoder architecture for image segmentation. IEEE Trans. Pattern Anal. Mach. Intell. 2017, 39, 2481–2495. [Google Scholar] [CrossRef] [PubMed]
- Zhao, H.; Shi, J.; Qi, X.; Wang, X.; Jia, J. Pyramid scene parsing network. In Proceedings of the IEEE Conference on Computer Vision and Pattern Recognition, Honolulu, HI, USA, 21–26 July 2017; pp. 2881–2890. [Google Scholar]
- Chen, L.-C.; Papandreou, G.; Schroff, F.; Adam, H. Rethinking atrous convolution for semantic image segmentation. arXiv 2017, arXiv:1706.05587. [Google Scholar]
- Chen, L.-C.; Zhu, Y.; Papandreou, G.; Schroff, F.; Adam, H. Encoder-decoder with atrous separable convolution for semantic image segmentation. In Proceedings of the European Conference on Computer Vision (ECCV), Munich, Germany, 8–14 September 2018; pp. 801–818. [Google Scholar]
- Ren, S.; He, K.; Girshick, R.; Sun, J. Faster r-cnn: Towards real-time object detection with region proposal networks. IEEE Trans. Pattern Anal. Mach. Intell. 2016, 39, 1137–1149. [Google Scholar] [CrossRef] [PubMed] [Green Version]
- He, K.; Gkioxari, G.; Dollár, P.; Girshick, R. Mask r-cnn. In Proceedings of the IEEE International Conference on Computer Vision, Venice, Italy, 22–29 October 2017; pp. 2961–2969. [Google Scholar]
- Huang, Z.; Huang, L.; Gong, Y.; Huang, C.; Wang, X. Mask scoring r-cnn. In Proceedings of the IEEE/CVF Conference on Computer Vision and Pattern Recognition, Long Beach, CA, USA, 15–20 June 2019; pp. 6409–6418. [Google Scholar]
- Cai, Z.; Vasconcelos, N. Cascade r-cnn: High quality object detection and instance segmentation. IEEE Trans. Pattern Anal. Mach. Intell. 2019, 43, 1483–1498. [Google Scholar] [CrossRef] [PubMed] [Green Version]
- Chen, K.; Pang, J.; Wang, J.; Xiong, Y.; Li, X.; Sun, S.; Feng, W.; Liu, Z.; Shi, J.; Ouyang, W.; et al. Hybrid task cascade for instance segmentation. In Proceedings of the IEEE/CVF Conference on Computer Vision and Pattern Recognition, Long Beach, CA, USA, 15–20 June 2019; pp. 4974–4983. [Google Scholar]
- Vu, T.; Kang, H.; Yoo, C.D. Scnet: Training inference sample consistency for instance segmentation. In Proceedings of the AAAI Conference on Artificial Intelligence, Virtually, 2–9 February 2021; Volume 35, pp. 2701–2709. [Google Scholar]
- Bolya, D.; Zhou, C.; Xiao, F.; Lee, Y.J. Yolact: Real-time instance segmentation. In Proceedings of the IEEE/CVF International Conference on Computer Vision, Seoul, Korea, 27 October–2 November 2019; pp. 9157–9166. [Google Scholar]
- Chen, H.; Sun, K.; Tian, Z.; Shen, C.; Huang, Y.; Yan, Y. Blendmask: Top-down meets bottom-up for instance segmentation. In Proceedings of the IEEE/CVF Conference on Computer Vision and Pattern Recognition, Seattle, WA, USA, 13–19 June 2020; pp. 8573–8581. [Google Scholar]
- Xie, E.; Sun, P.; Song, X.; Wang, W.; Liu, X.; Liang, D.; Shen, C.; Luo, P. Polarmask: Single shot instance segmentation with polar representation. In Proceedings of the IEEE/CVF Conference on Computer Vision and Pattern Recognition, Seattle, WA, USA, 13–19 June 2020; pp. 12193–12202. [Google Scholar]
- Tian, Z.; Shen, C.; Chen, H. Conditional convolutions for instance segmentation. In Computer Vision—ECCV 2020: 16th European Conference, Glasgow, UK, 23–28 August 2020, Proceedings, Part I 16; Springer: Berlin/Heidelberg, Germany, 2020; pp. 282–298. [Google Scholar]
- Wang, X.; Kong, T.; Shen, C.; Jiang, Y.; Li, L. Solo: Segmenting objects by locations. In European Conference on Computer Vision; Springer: Cham, Switzerland, 2020; pp. 649–665. [Google Scholar]
- Liu, Z.; Lin, Y.; Cao, Y.; Hu, H.; Wei, Y.; Zhang, Z.; Lin, S.; Guo, B. Swin transformer: Hierarchical vision transformer using shifted windows. arXiv 2021, arXiv:2103.14030. [Google Scholar]
- Girshick, R.; Donahue, J.; Darrell, T.; Malik, J. Rich feature hierarchies for accurate object detection and semantic segmentation. In Proceedings of the IEEE Conference on Computer Vision and Pattern Recognition, Columbus, OH, USA, 23–28 June 2014; pp. 580–587. [Google Scholar]
- Lin, T.-Y.; Dollár, P.; Girshick, R.; He, K.; Hariharan, B.; Belongie, S. Feature pyramid networks for object detection. In Proceedings of the IEEE Conference on Computer Vision and Pattern Recognition, Honolulu, HI, USA, 21–26 July 2017; pp. 2117–2125. [Google Scholar]
- Zhang, T.; Zhang, X.; Li, J.; Xu, X.; Wang, B.; Zhan, X.; Xu, Y.; Ke, X.; Zeng, T.; Su, H.; et al. Sar ship detection dataset (ssdd): Official release and comprehensive data analysis. Remote Sens. 2021, 13, 3690. [Google Scholar] [CrossRef]
- Lin, T.Y.; Maire, M.; Belongie, S.; Hays, J.; Perona, P.; Ramanan, D.; Dollár, P.; Zitnick, C.L. Microsoft coco: Common objects in context. In European Conference on Computer Vision; Springer: Cham, Switzerland, 2014; pp. 740–755. [Google Scholar]
- Gao, S.; Cheng, M.M.; Zhao, K.; Zhang, X.Y.; Yang, M.H.; Torr, P.H. Res2net: A new multi-scale backbone architecture. IEEE Trans. Pattern Anal. Mach. Intell. 2019, 43, 652–662. [Google Scholar] [CrossRef] [Green Version]
- Sun, K.; Xiao, B.; Liu, D.; Wang, J. Deep high-resolution representation learning for human pose estimation. In Proceedings of the IEEE/CVF Conference on Computer Vision and Pattern Recognition, Long Beach, CA, USA, 15–20 June 2019; pp. 5693–5703. [Google Scholar]
- Sun, K.; Zhao, Y.; Jiang, B.; Cheng, T.; Xiao, B.; Liu, D.; Mu, Y.; Wang, X.; Liu, W.; Wang, J. High-resolution representations for labeling pixels and regions. arXiv 2019, arXiv:1904.04514. [Google Scholar]
- Radosavovic, I.; Kosaraju, R.P.; Girshick, R.; He, K.; Dollár, P. Designing network design spaces. In Proceedings of the IEEE/CVF Conference on Computer Vision and Pattern Recognition, Seattle, WA, USA, 13–19 June 2020; pp. 10428–10436. [Google Scholar]
- Fang, H.-S.; Sun, J.; Wang, R.; Gou, M.; Li, Y.-L.; Lu, C. Instaboost: Boosting instance segmentation via probability map guided copy-pasting. In Proceedings of the IEEE/CVF International Conference on Computer Vision, Seoul, Korea, 27 October–2 November 2019; pp. 682–691. [Google Scholar]
- Chen, K.; Wang, J.; Pang, J.; Cao, Y.; Xiong, Y.; Li, X.; Sun, S.; Feng, W.; Liu, Z.; Xu, J.; et al. Mmdetection: Open mmlab detection toolbox and benchmark. arXiv 2019, arXiv:1906.07155. [Google Scholar]
Figure 1.
The network architecture of EISP.
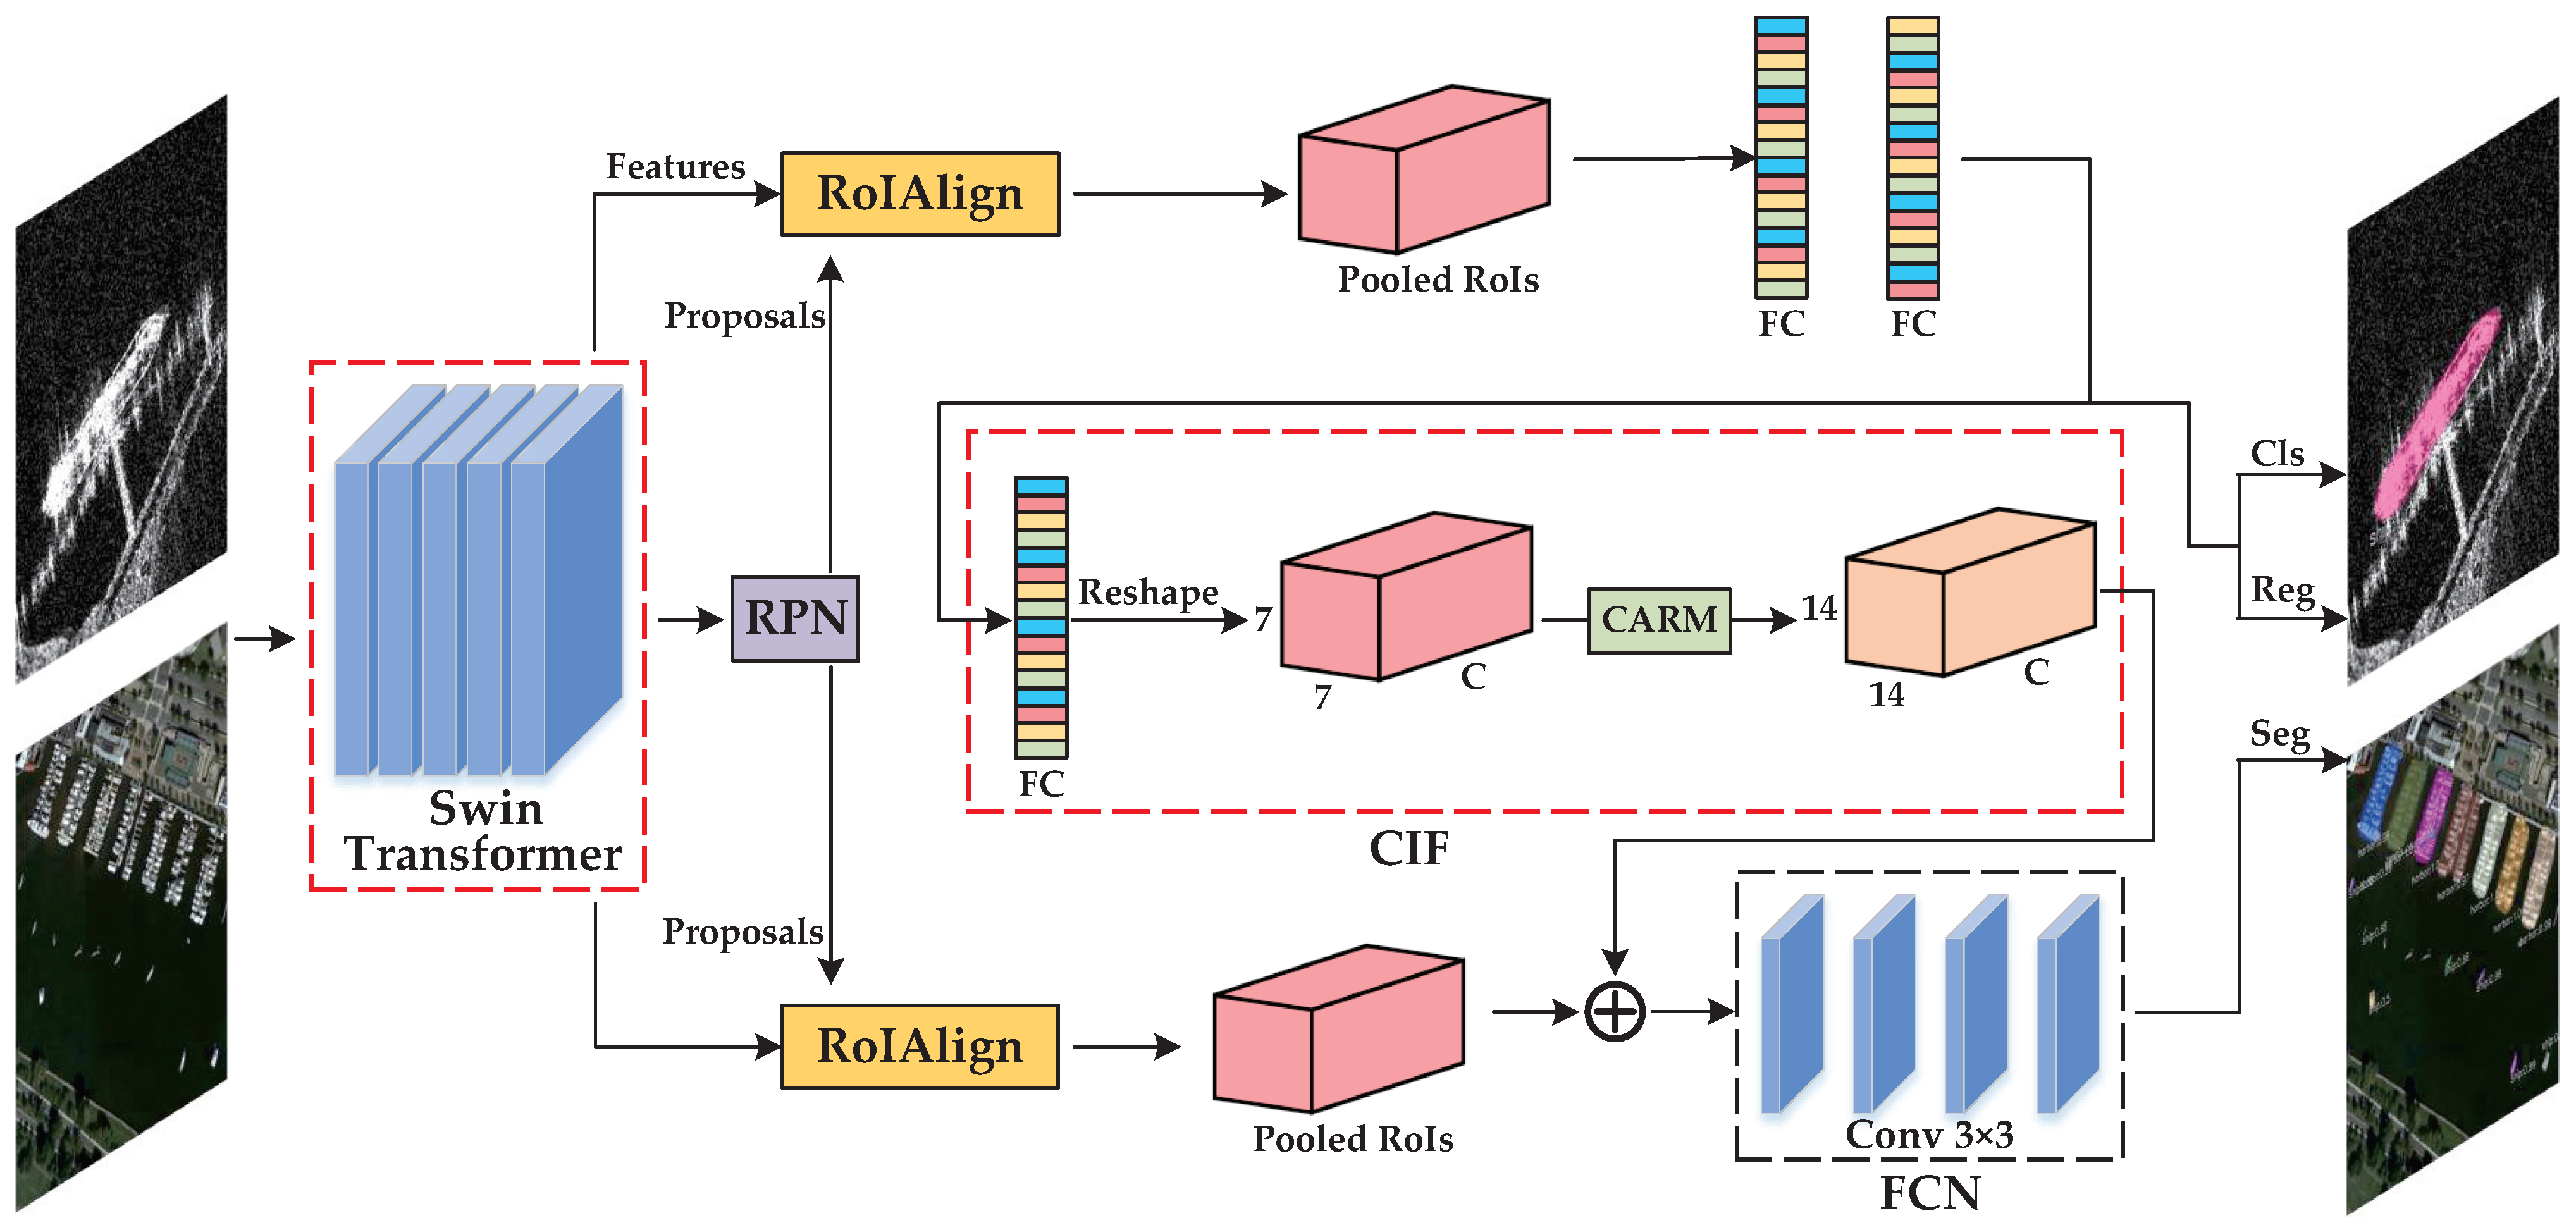
Figure 2.
The network architecture of the Swin Transformer.
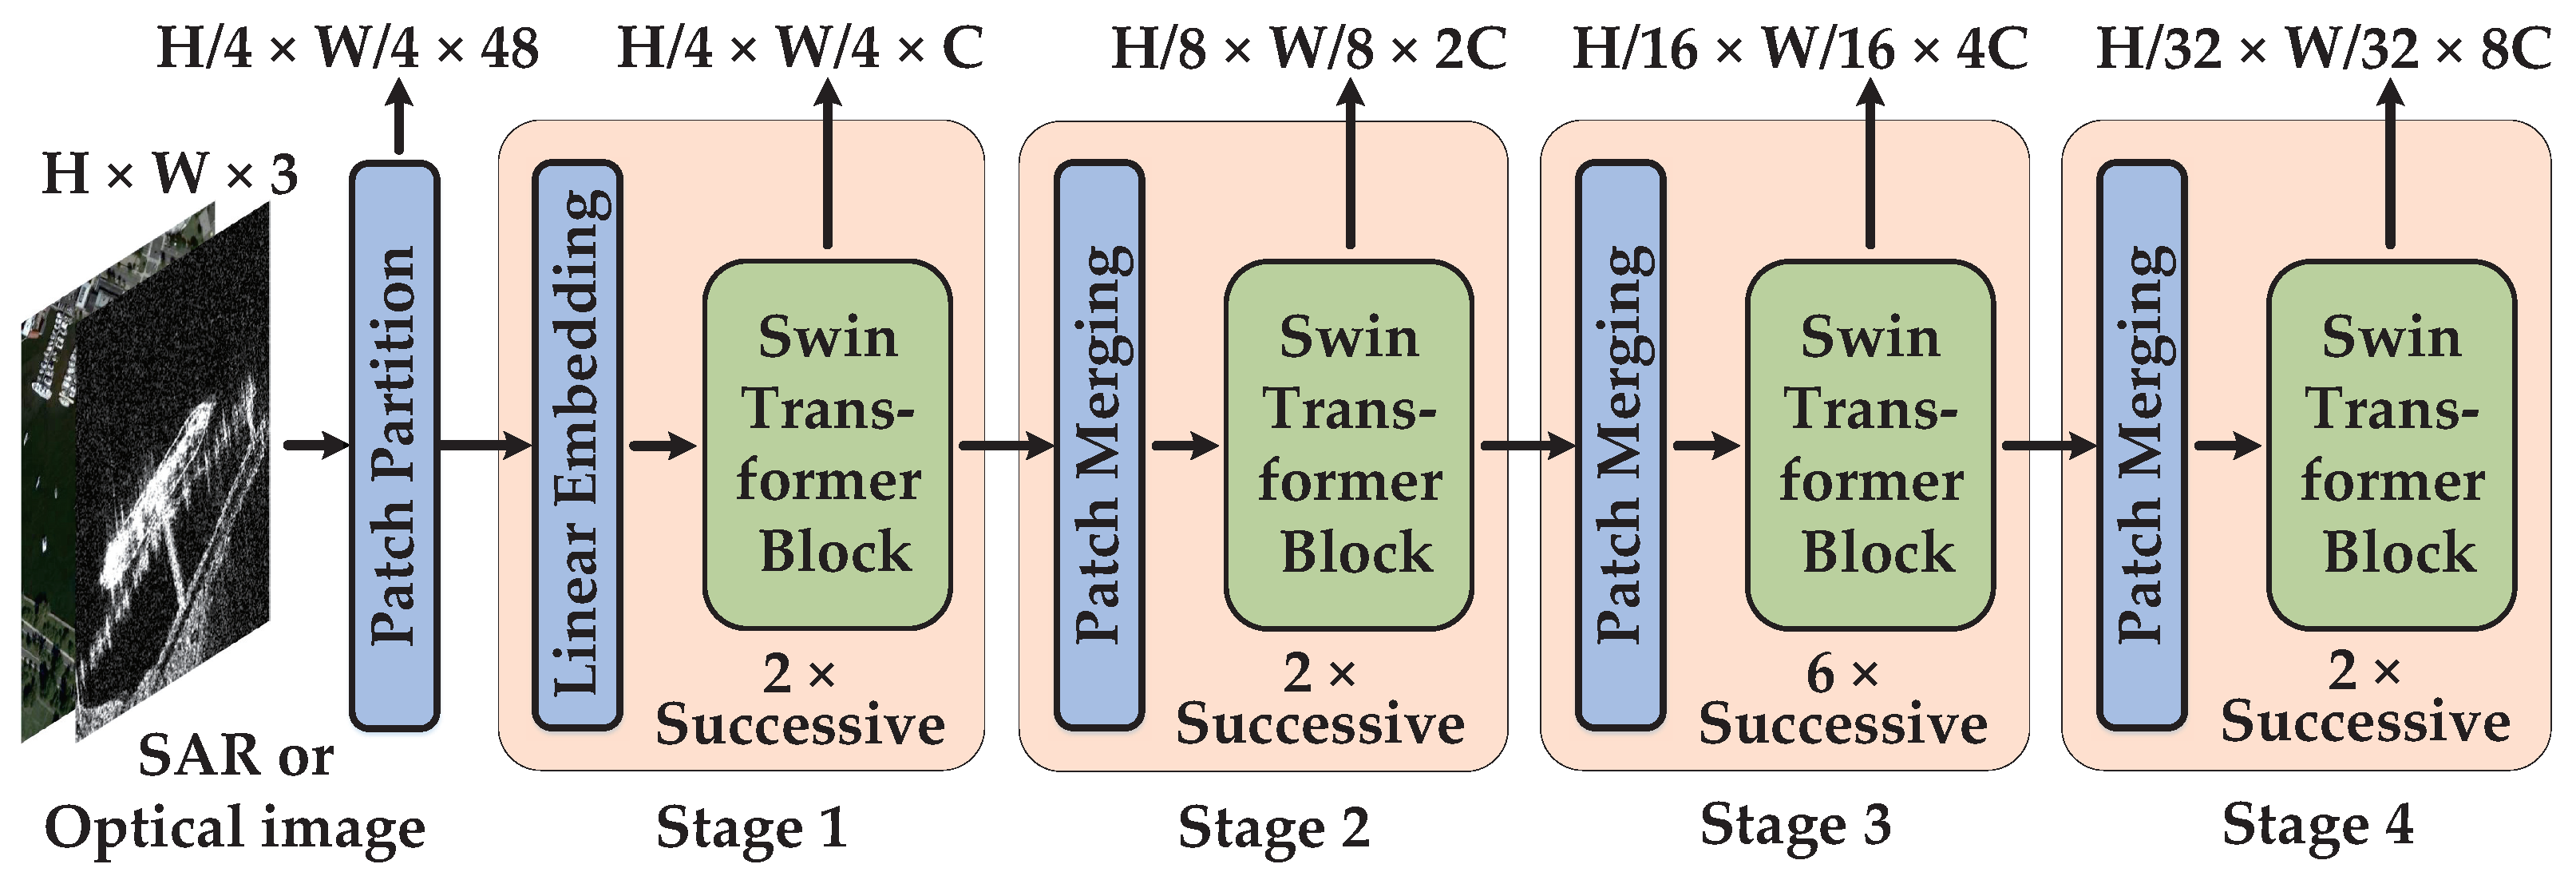
Figure 3.
Illustration of two consecutive Swin Transformer blocks.
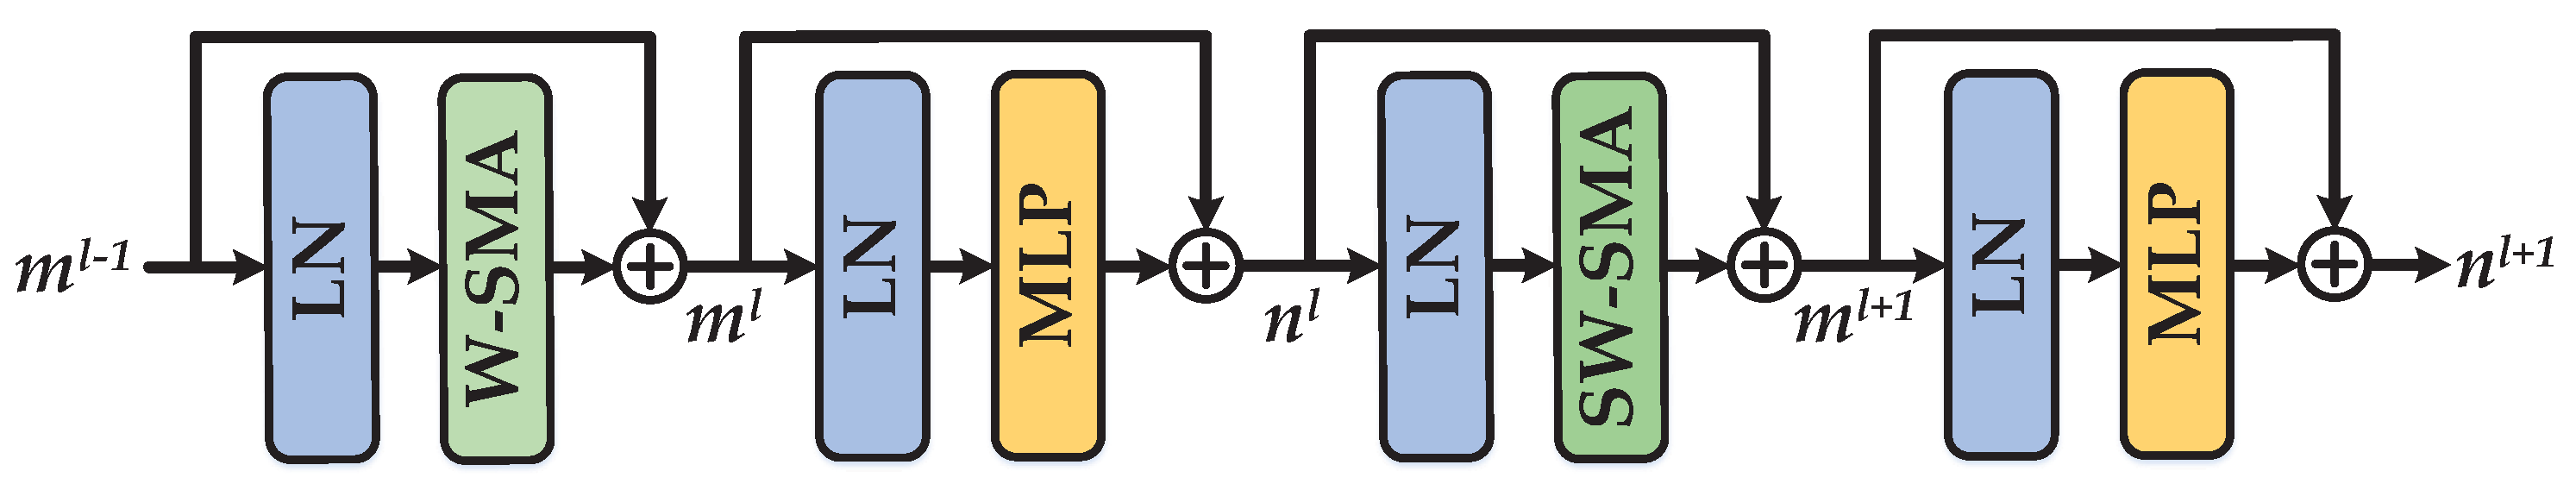
Figure 4.
Detailed network architecture of the content-aware reassembly module (CARM). Detailed network architecture of the content-aware reassembly module (CARM), where sub-figure (a) represents the content-aware kernel generation step and sub-figure (b) represents the feature reassemble step.
Figure 4.
Detailed network architecture of the content-aware reassembly module (CARM). Detailed network architecture of the content-aware reassembly module (CARM), where sub-figure (a) represents the content-aware kernel generation step and sub-figure (b) represents the feature reassemble step.
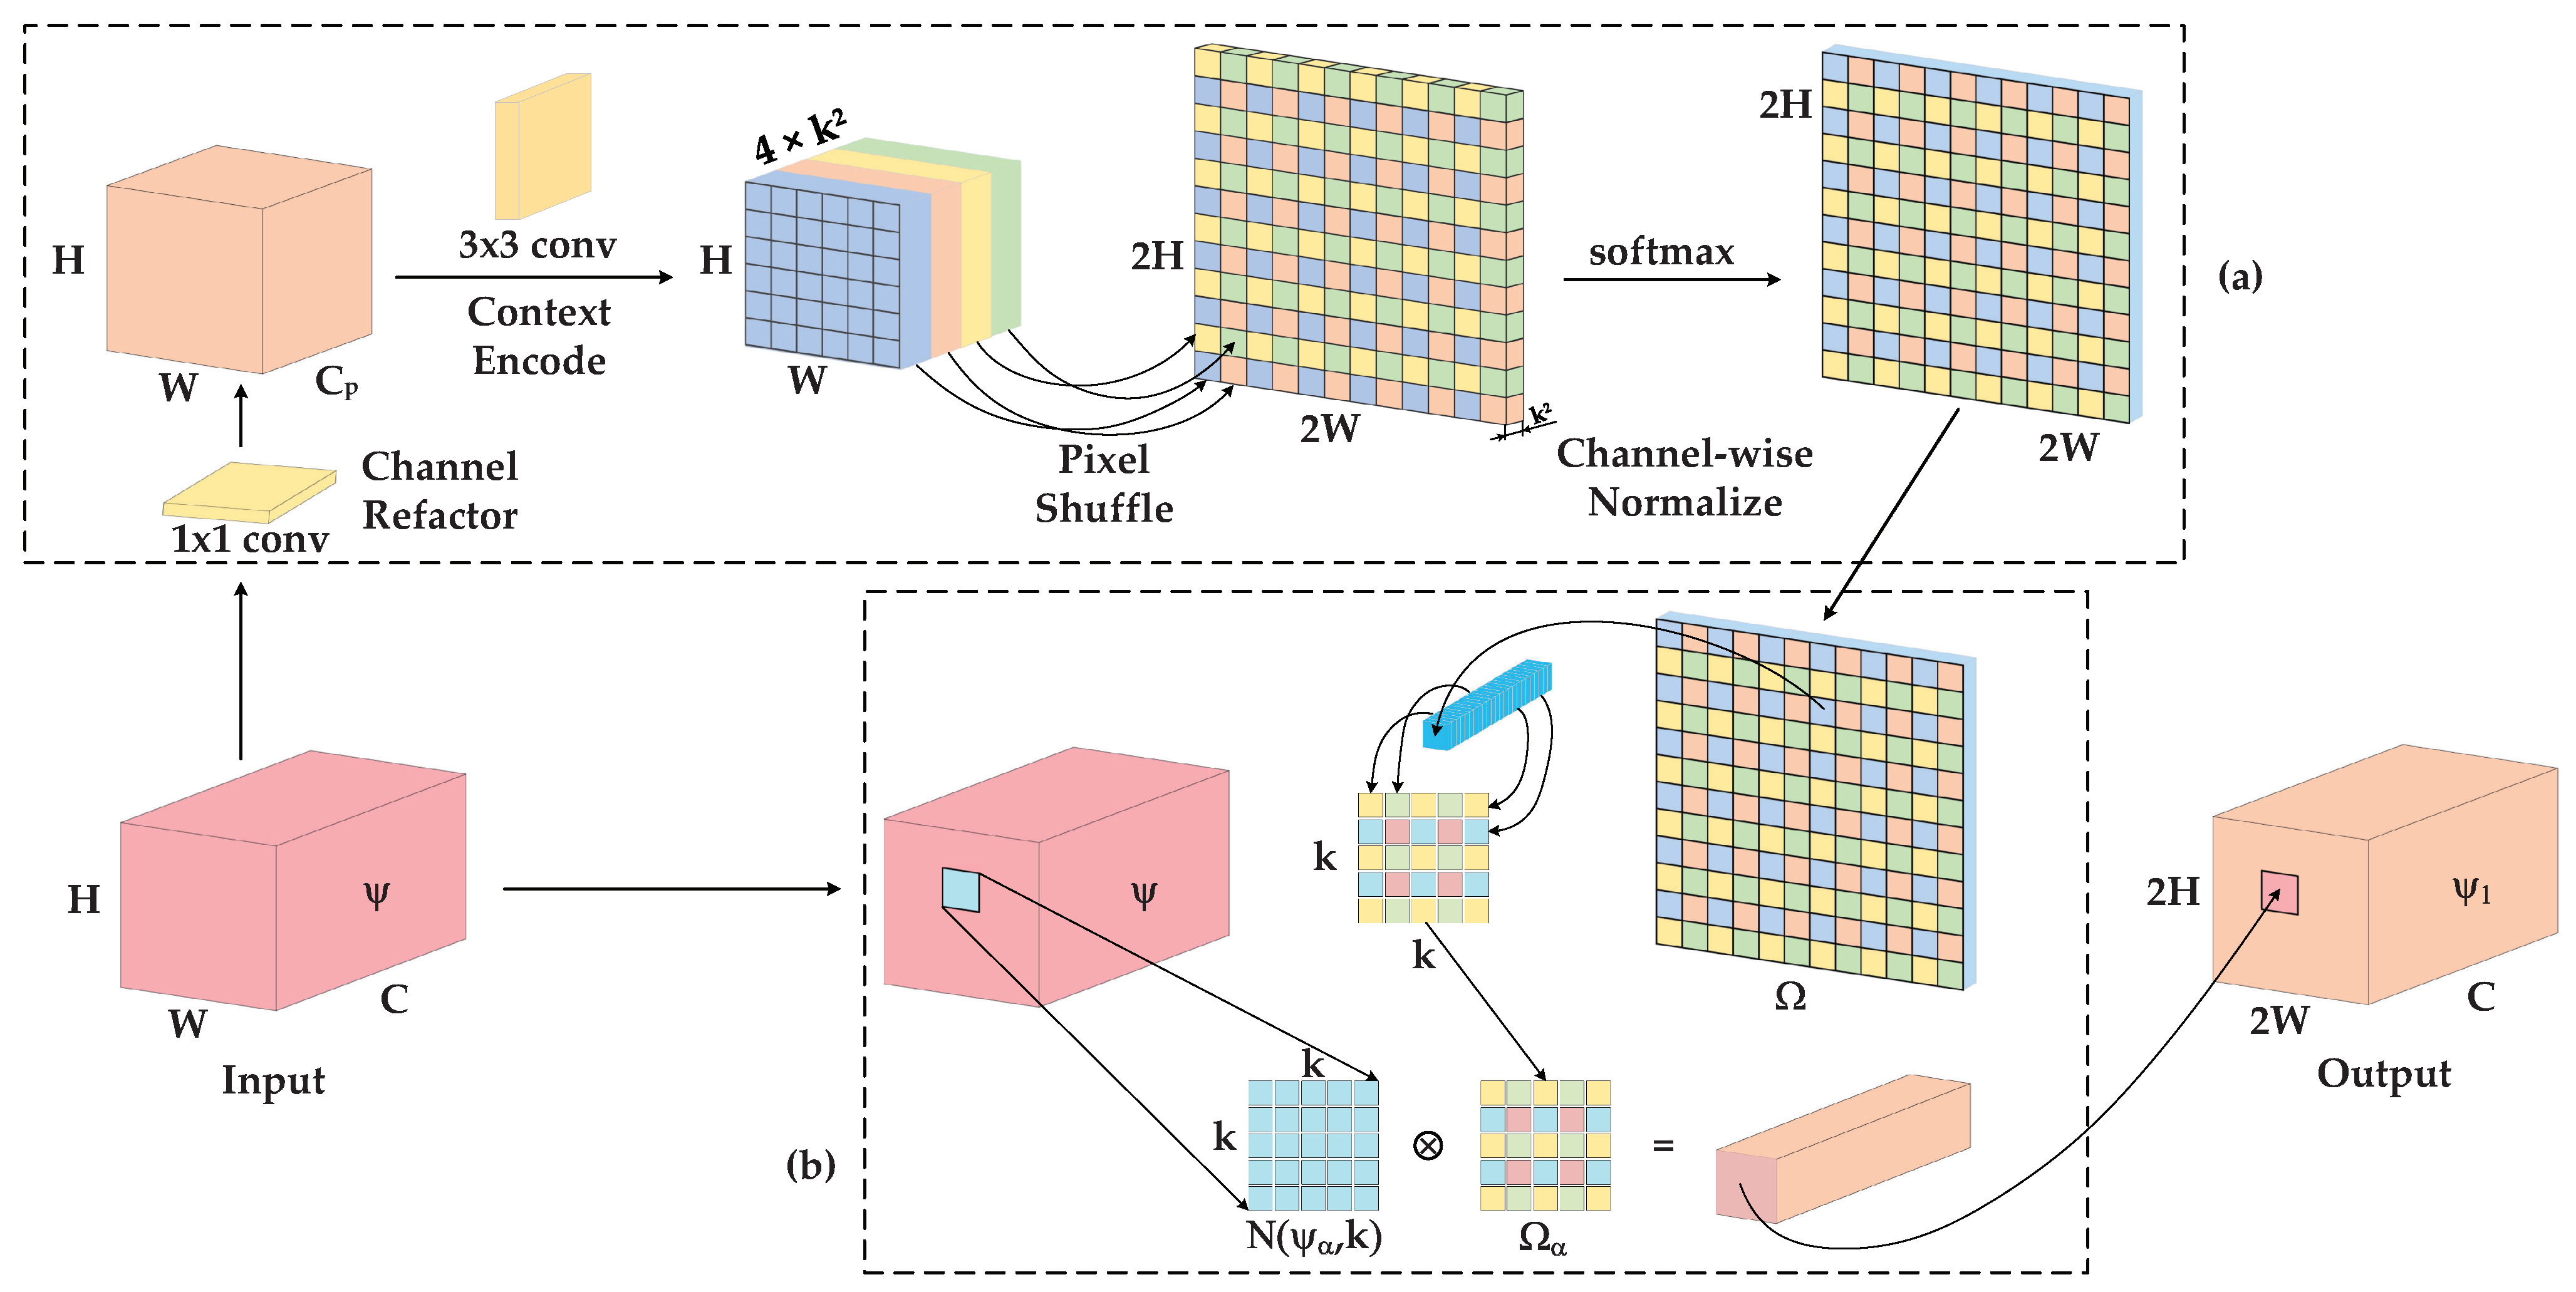
Figure 5.
Effects of EISP with multiscale training. Note that row 1 is the ground truth and row 2 denotes the predicted results.
Figure 5.
Effects of EISP with multiscale training. Note that row 1 is the ground truth and row 2 denotes the predicted results.
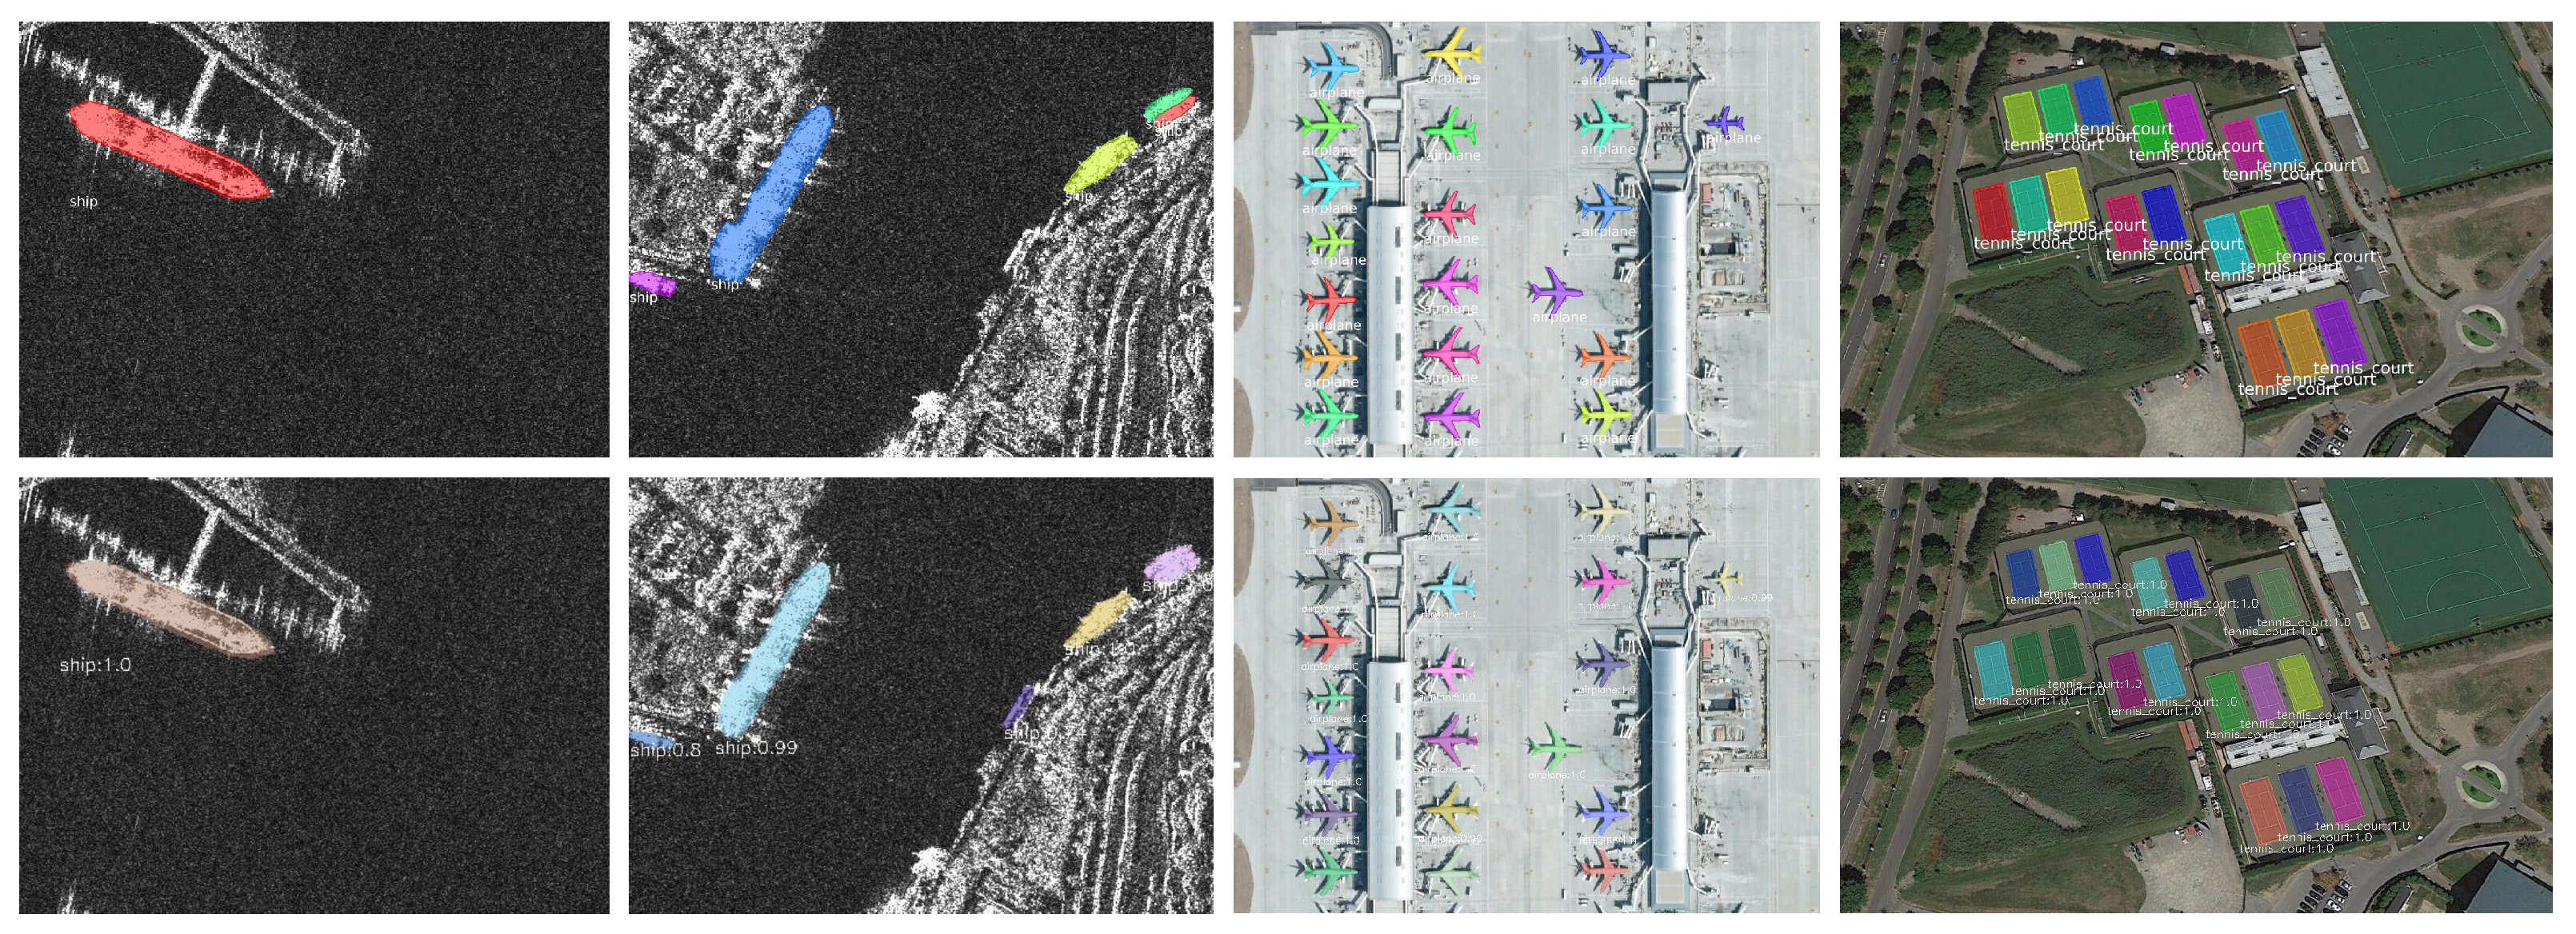
Figure 6.
The precision–recall (PR) curve of the state-of-the-art methods and EISP on PSeg-SSDD test set (left) and NWPU VHR-10 test set (right).
Figure 6.
The precision–recall (PR) curve of the state-of-the-art methods and EISP on PSeg-SSDD test set (left) and NWPU VHR-10 test set (right).
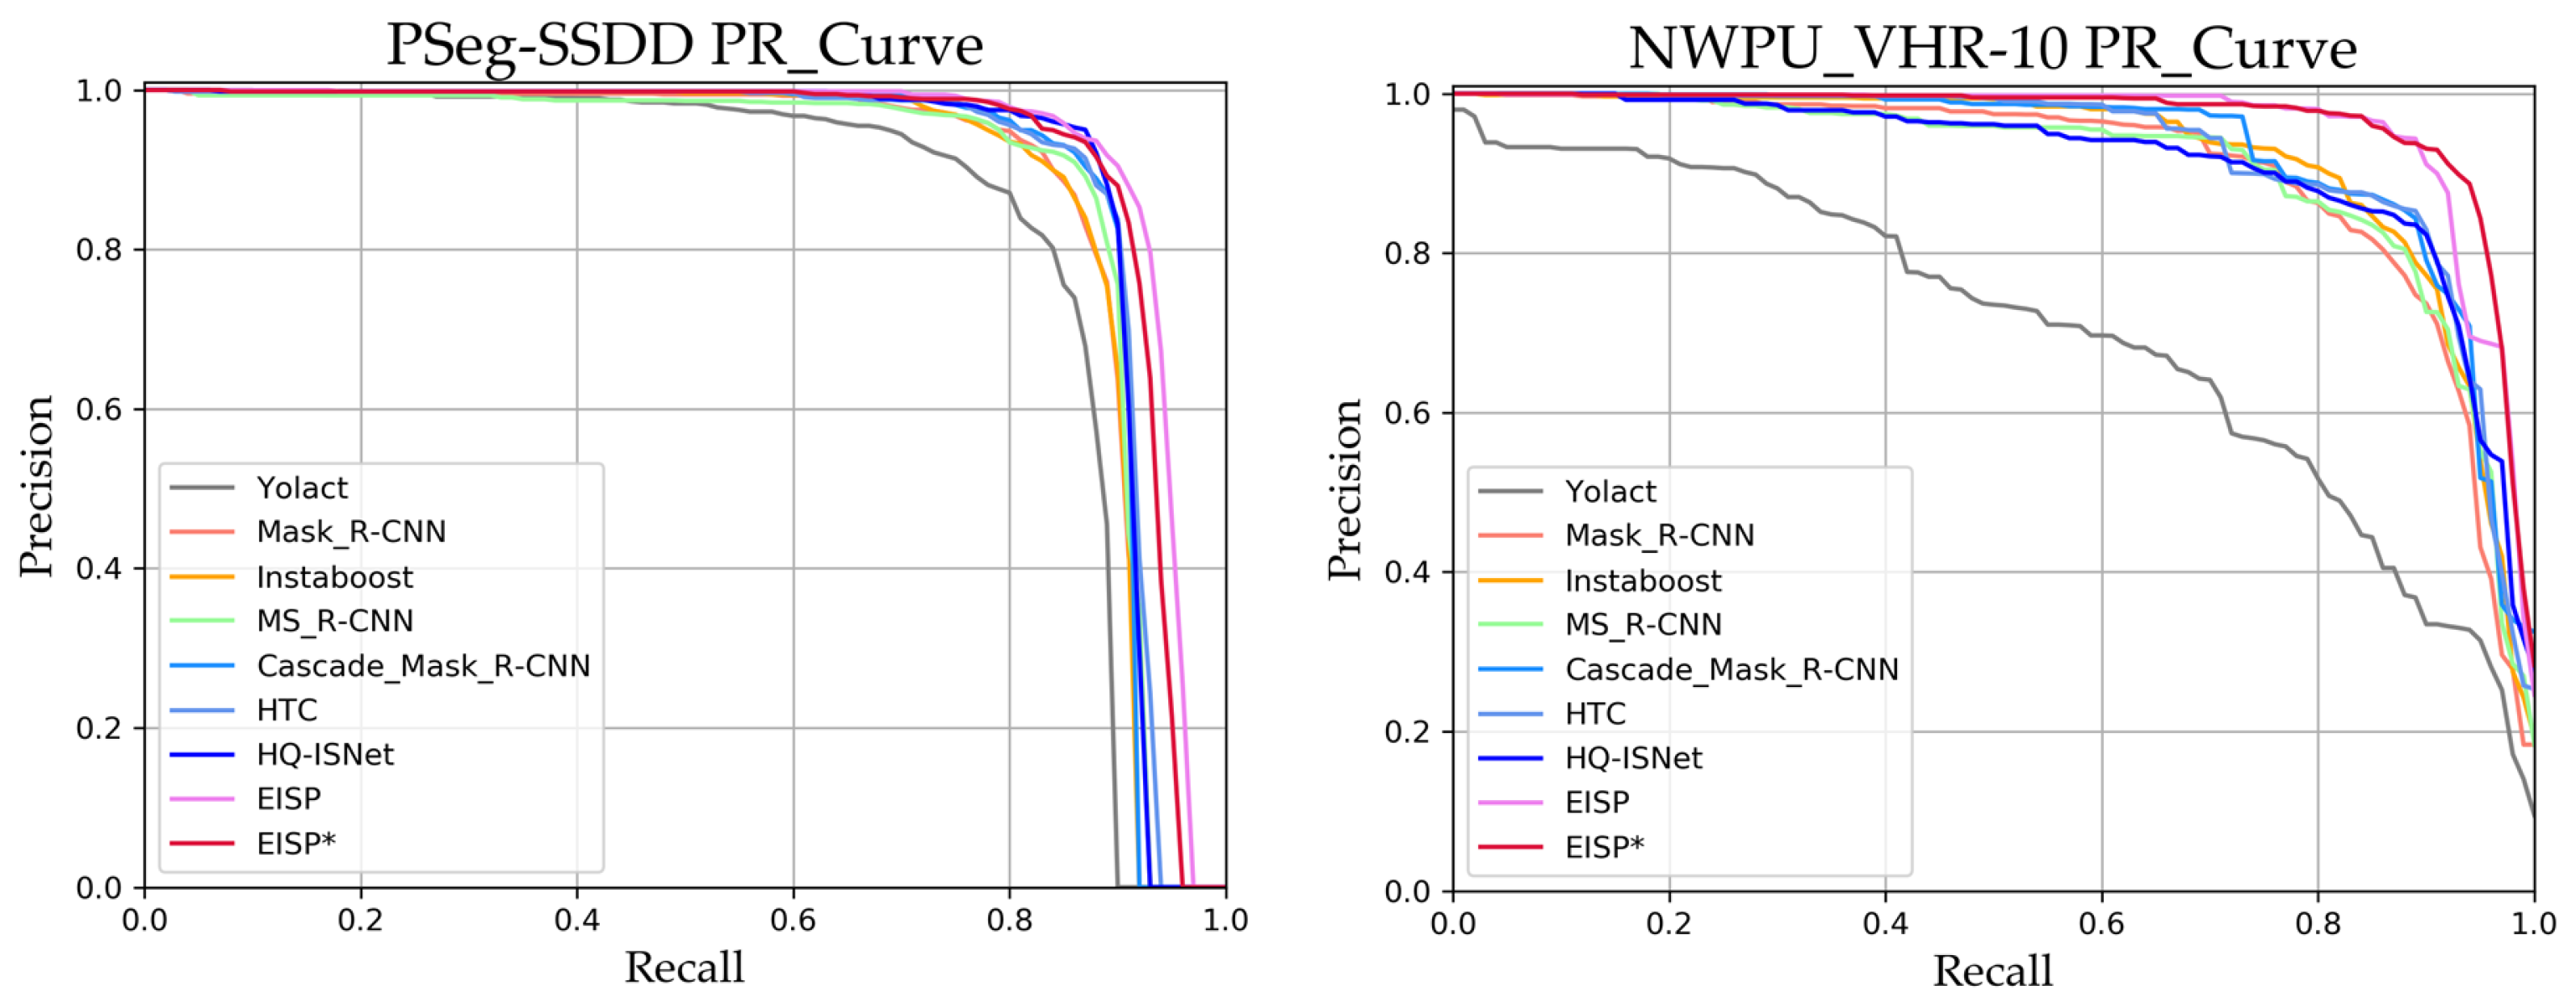
Figure 7.
Qualitative instance segmentation results of the state-of-the-art methods and the proposed EISP* on PSeg-SSDD. Row 1 represents the ground truth annotations of the objects. Note that the red rectangle, blue rectangle, orange rectangle, and purple rectangle denote the aliasing masks of dense objects, poorly segmented mask, missing segmentations, and false alarms, respectively.
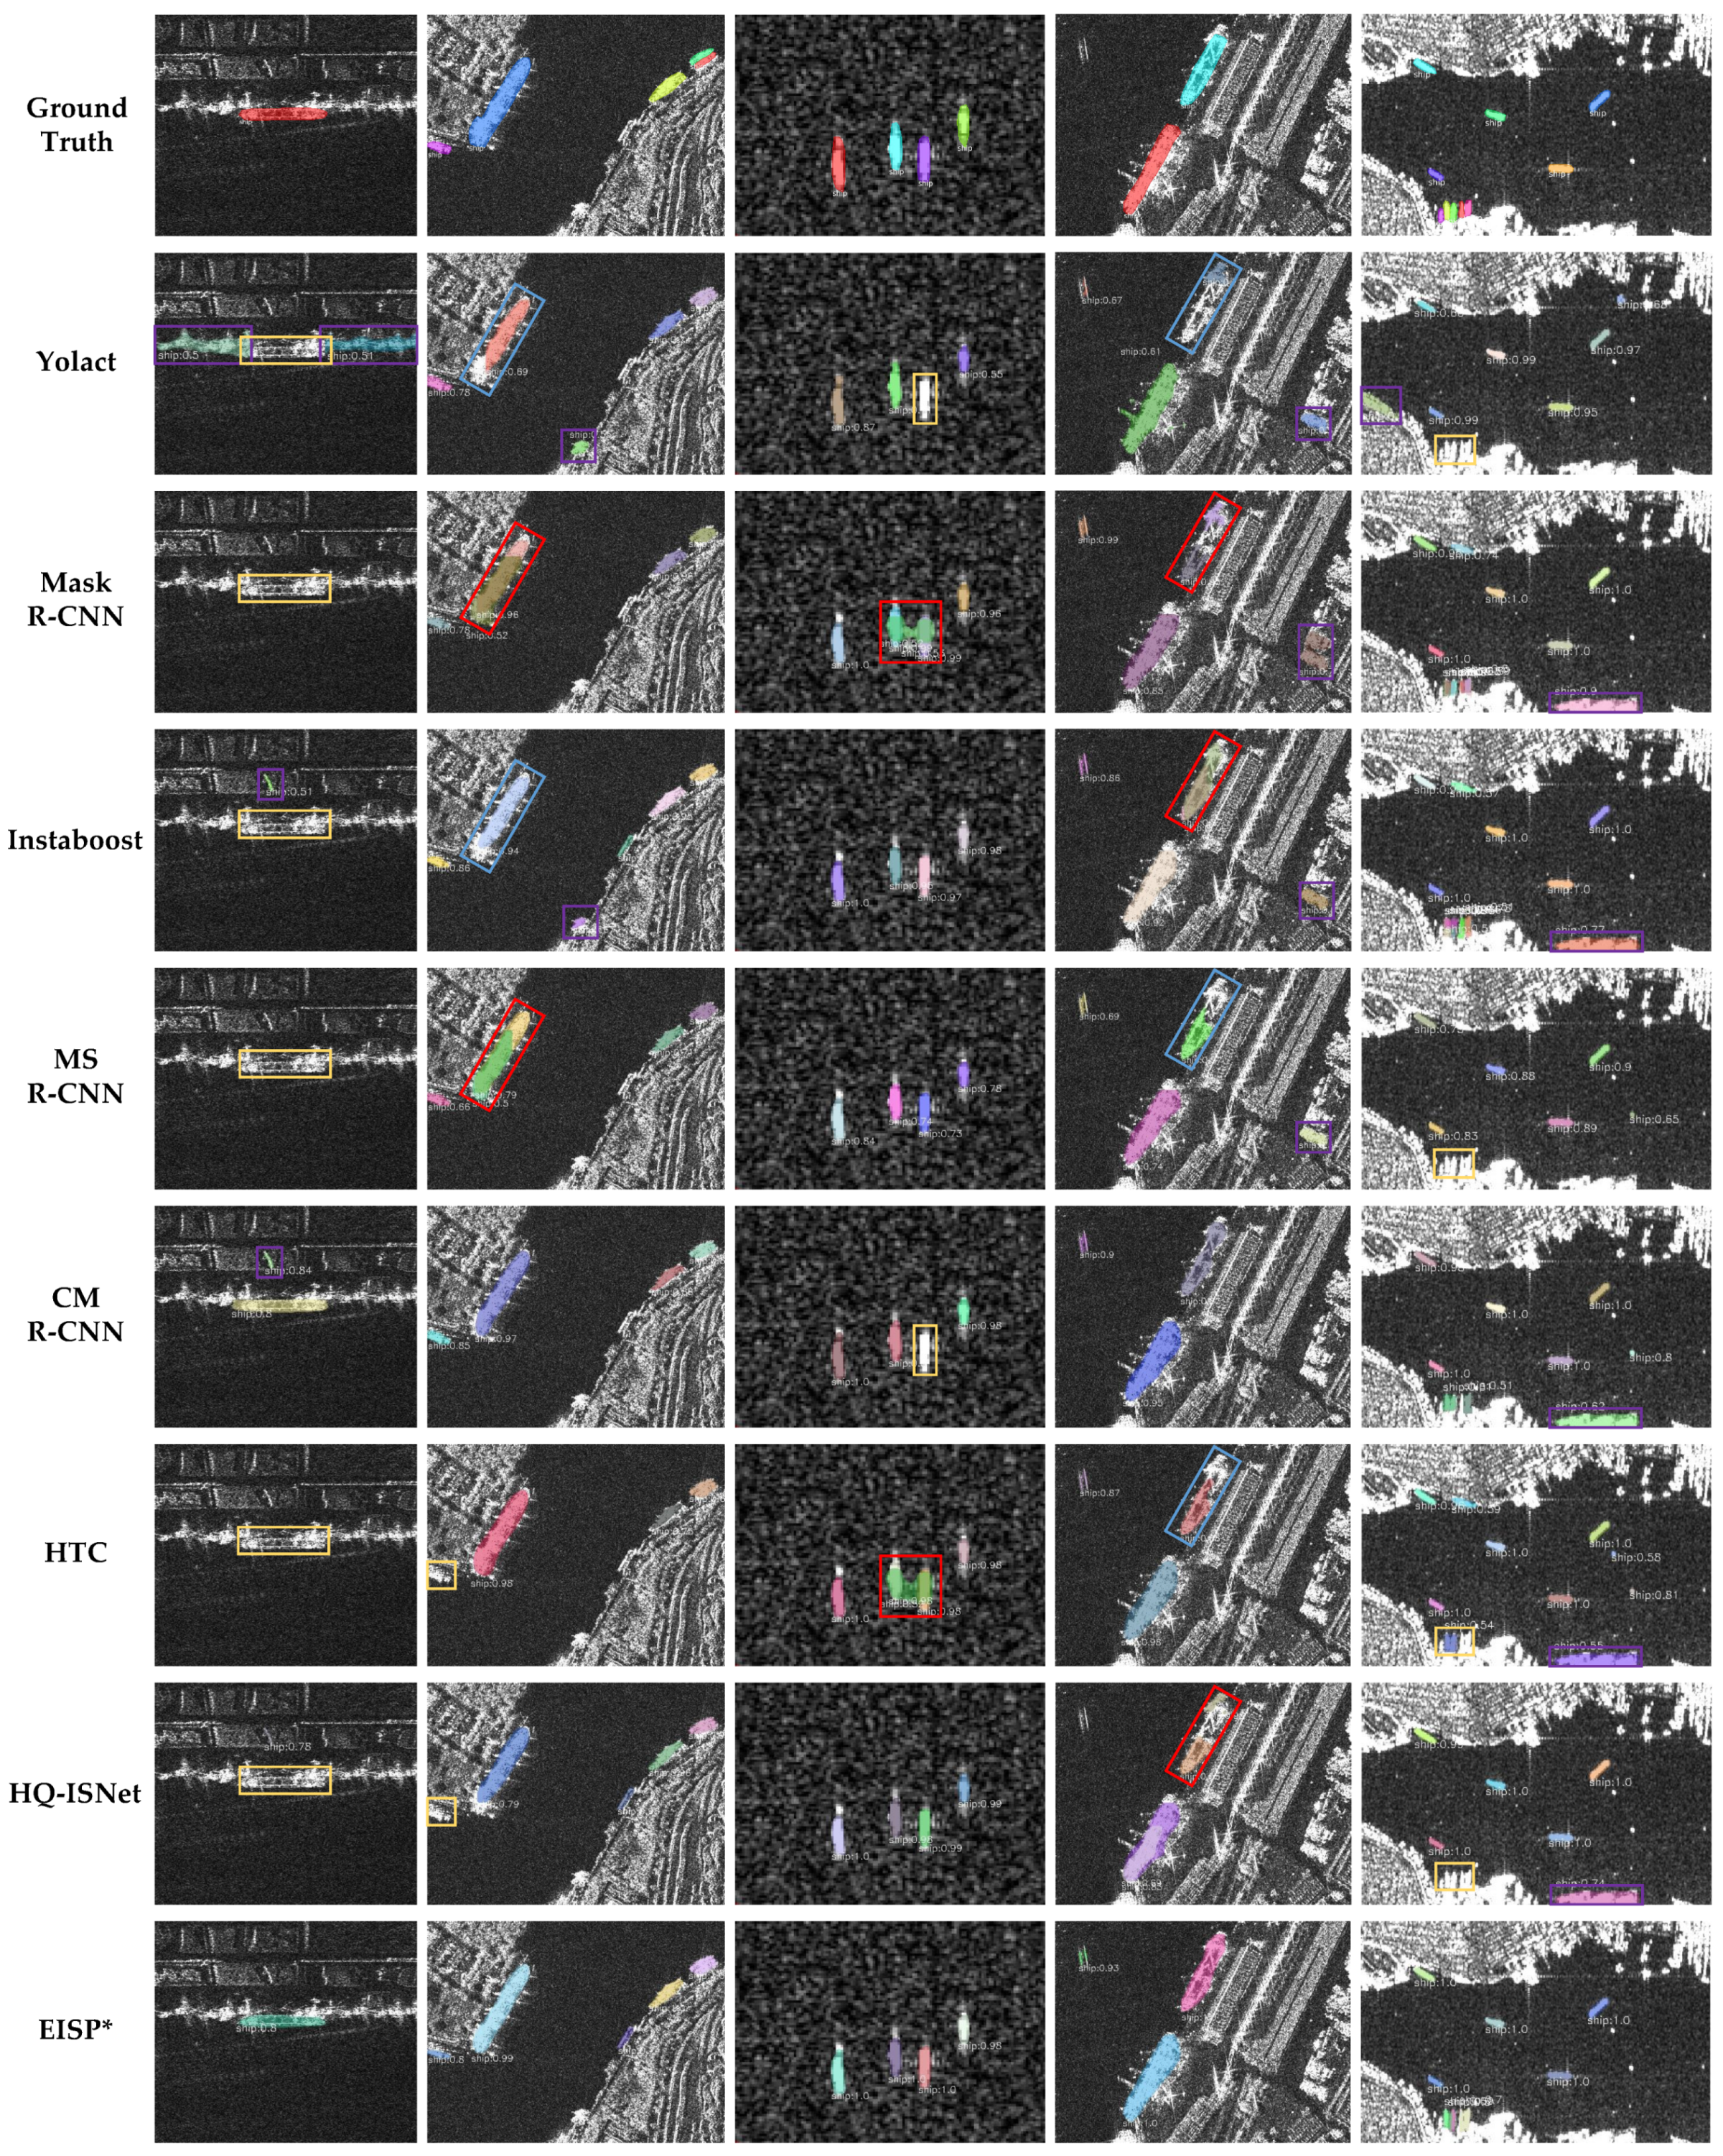
Figure 8.
Qualitative instance segmentation results of the state-of-the-art methods and the proposed EISP* on NWPU VHR-10 instance segmentation dataset. Row 1 represents the ground truth annotations of the objects; row 2 to row 7 represent the results of state-of-the-art methods; row 8 shows the results of the proposed EISP*. Note that the red rectangle, blue rectangle, orange rectangle, and purple rectangle denote the aliasing masks of dense objects, poorly segmented mask, missing segmentations, and false alarms, respectively.
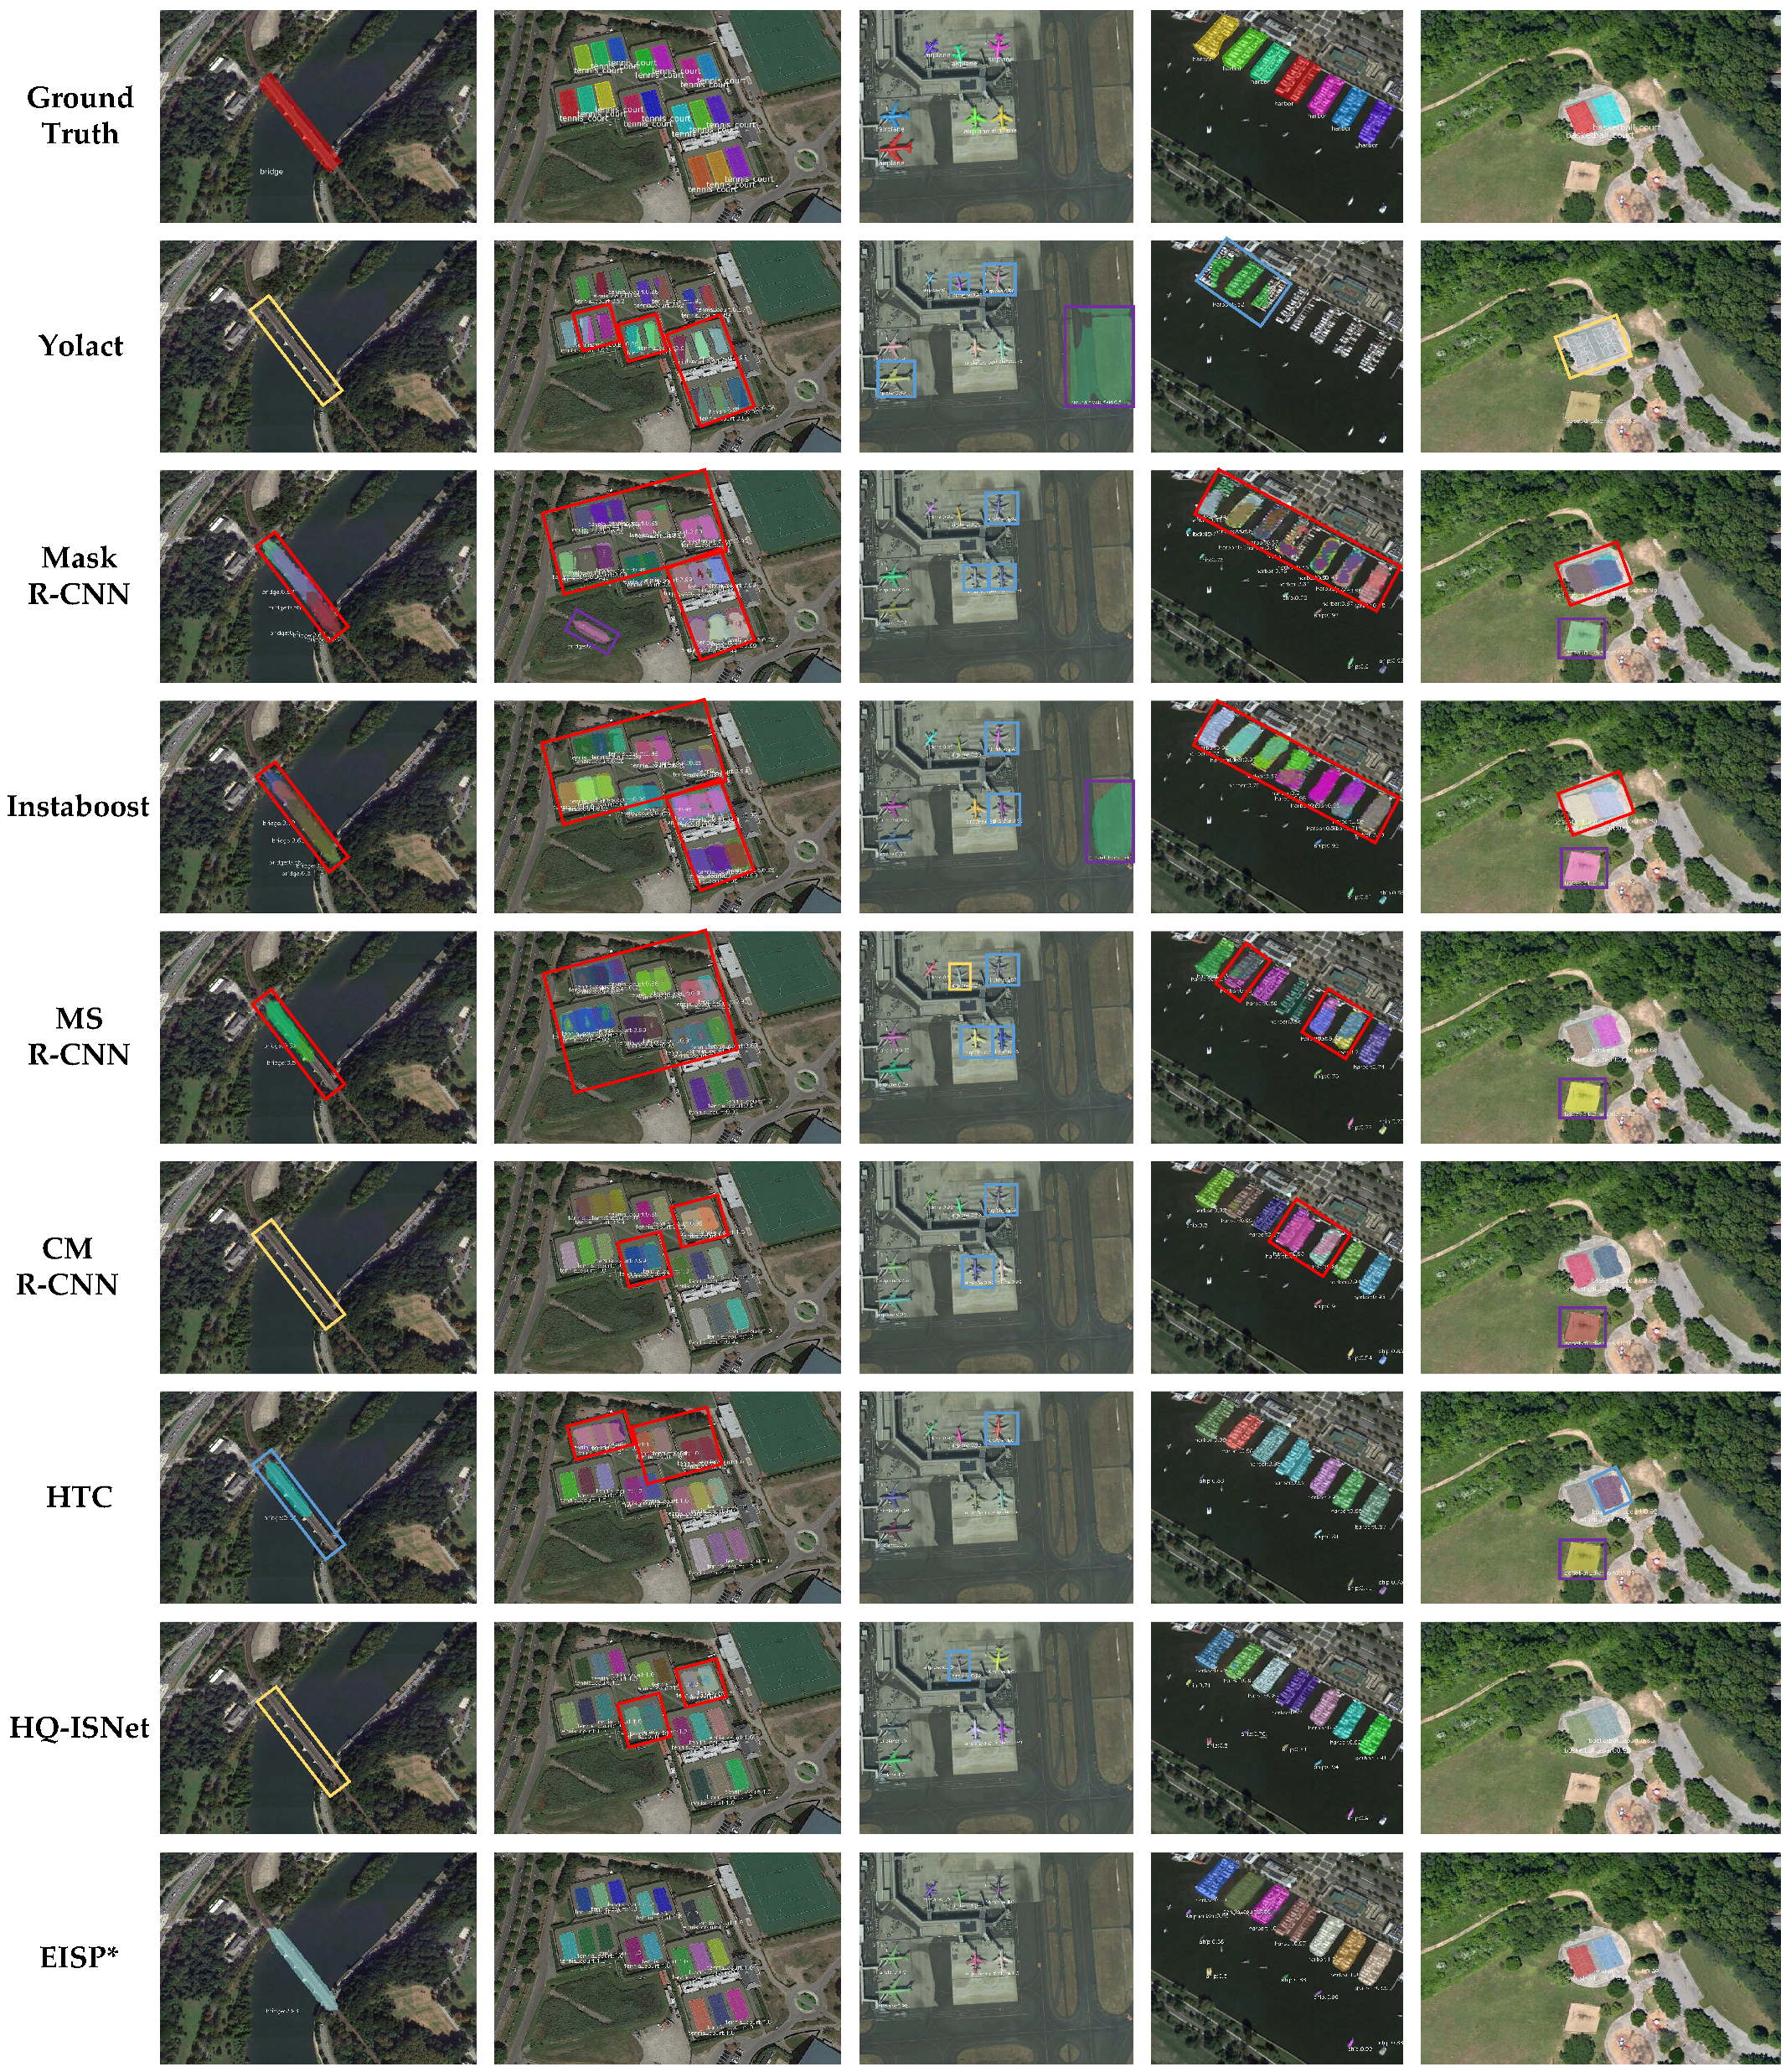
Figure 9.
Class-wise instance segmentation results of EISP* on the NWPU VHR-10 instance segmentation dataset.
Figure 9.
Class-wise instance segmentation results of EISP* on the NWPU VHR-10 instance segmentation dataset.

Table 1.
Effects of EISP. Note that all results are evaluated on the test set.
| Dataset | Model | Swin-L | CIF | Conf Loss | AP | AP50 | AP75 | APS | APM | APL | FLOPs |
|---|---|---|---|---|---|---|---|---|---|---|---|
| PSeg-SSDD | Mask R-CNN | 56.7 | 88.6 | 70.8 | 56.8 | 57.8 | 27.6 | 134.2G | |||
| Modules | 🗸 | 59.0 | 91.3 | 72.8 | 58.5 | 61.7 | 40.0 | 283.9G | |||
| 🗸 | 58.4 | 89.8 | 73.0 | 58.2 | 60.0 | 17.9 | 150.7G | ||||
| 🗸 | 58.5 | 89.8 | 72.5 | 58.0 | 61.4 | 15.6 | 134.2G | ||||
| EISP | 🗸 | 🗸 | 🗸 | 60.3 | 93.3 | 73.3 | 58.9 | 65.9 | 35.6 | 293.9G | |
| NWPU VHR-10 | Mask R-CNN | 57.9 | 90.2 | 61.0 | 41.5 | 58.6 | 53.1 | 229.1G | |||
| Modules | 🗸 | 63.1 | 94.2 | 68.9 | 47.5 | 63.0 | 72.4 | 577.8G | |||
| 🗸 | 59.4 | 92.1 | 64.1 | 42.9 | 60.3 | 62.0 | 245.5G | ||||
| 🗸 | 62.8 | 91.5 | 69.2 | 46.3 | 63.8 | 70.2 | 229.1G | ||||
| EISP | 🗸 | 🗸 | 🗸 | 68.1 | 95.8 | 74.5 | 52.7 | 68.4 | 76.9 | 594.2G |
Table 2.
Effects of the Swin Transformer.
| Dataset | Backbone | AP | AP50 | AP75 | APS | APM | APL |
|---|---|---|---|---|---|---|---|
| PSeg-SSDD | ResNet-101 | 56.7 | 88.6 | 70.8 | 56.8 | 57.8 | 27.6 |
| HRNetv2-w32 | 57.1 | 87.8 | 72.2 | 56.8 | 59.7 | 18.2 | |
| RegNetx-3.2G | 57.5 | 89.1 | 70.3 | 57.2 | 60.7 | 12.9 | |
| RegNetx-4.0G | 57.7 | 89.7 | 71.4 | 57.5 | 60.4 | 14.2 | |
| Res2Net-101 | 57.6 | 89.4 | 71.9 | 57.2 | 60.7 | 24.2 | |
| Swin-S | 57.2 | 89.7 | 68.8 | 56.4 | 60.1 | 30.2 | |
| Swin-B | 57.8 | 90.5 | 71.1 | 57.2 | 60.6 | 26.7 | |
| Swin-L | 59.0 | 91.3 | 72.8 | 58.5 | 61.7 | 40.0 | |
| NWPU VHR-10 | ResNet-101 | 57.9 | 90.2 | 61.0 | 41.5 | 58.6 | 53.1 |
| HRNetv2-w32 | 60.3 | 90.7 | 66.3 | 45.9 | 61.1 | 65.6 | |
| RegNetx-3.2G | 59.1 | 91.2 | 62.0 | 44.6 | 60.1 | 63.2 | |
| RegNetx-4.0G | 60.3 | 91.8 | 67.4 | 45.8 | 60.9 | 65.4 | |
| Res2Net-101 | 60.9 | 93.3 | 68.1 | 44.6 | 61.9 | 65.9 | |
| Swin-S | 62.3 | 92.9 | 69.3 | 46.7 | 62.3 | 71.9 | |
| Swin-B | 62.7 | 92.6 | 69.6 | 47.5 | 63.2 | 63.9 | |
| Swin-L | 63.1 | 94.2 | 68.9 | 47.5 | 63.0 | 72.4 |
Table 3.
Effects of the channel number.
| Dataset | No. of Channels | AP | AP50 | AP75 | APS | APM | APL |
|---|---|---|---|---|---|---|---|
| PSeg-SSDD | 32 | 57.5 | 89.4 | 71.8 | 57.1 | 60.1 | 18.0 |
| 64 | 58.4 | 89.8 | 73.0 | 58.2 | 60.0 | 17.9 | |
| 128 | 57.9 | 89.8 | 70.9 | 57.4 | 60.8 | 16.6 | |
| 256 | 57.7 | 90.4 | 70.6 | 57.6 | 60.2 | 12.4 | |
| NWPU VHR-10 | 32 | 59.3 | 92.4 | 66.3 | 42.3 | 60.0 | 66.1 |
| 64 | 59.4 | 92.1 | 64.1 | 42.9 | 60.3 | 62.0 | |
| 128 | 59.0 | 91.6 | 64.5 | 41.5 | 59.5 | 66.7 | |
| 256 | 58.5 | 91.4 | 64.1 | 42.3 | 59.3 | 59.7 |
Table 4.
Selection of the value.
| Dataset | AP | AP50 | AP75 | APS | APM | APL | |
|---|---|---|---|---|---|---|---|
| PSeg-SSDD | 0 | 58.4 | 90.0 | 72.3 | 58.0 | 61.4 | 13.5 |
| 0.3 | 58.5 | 89.8 | 72.5 | 58.0 | 61.4 | 15.6 | |
| 0.9 | 57.4 | 89.4 | 72.0 | 57.0 | 60.3 | 14.8 | |
| 1.5 | 57.1 | 89.2 | 71.2 | 56.8 | 59.5 | 7.6 | |
| 2.1 | 56.2 | 87.6 | 71.1 | 55.7 | 59.2 | 8.5 | |
| 2.7 | 55.6 | 88.0 | 69.3 | 55.5 | 58.0 | 7.2 | |
| NWPU VHR-10 | 0 | 61.9 | 91.3 | 68.1 | 47.1 | 62.8 | 68.6 |
| 0.3 | 62.8 | 91.5 | 69.2 | 46.3 | 63.8 | 70.2 | |
| 0.9 | 60.9 | 90.8 | 67.9 | 45.8 | 62.2 | 68.1 | |
| 1.5 | 59.3 | 88.1 | 66.3 | 44.8 | 59.8 | 71.7 | |
| 2.1 | 58.4 | 87.9 | 64.2 | 42.1 | 59.2 | 65.7 | |
| 2.7 | 54.7 | 82.4 | 62.0 | 41.6 | 55.5 | 62.2 |
Table 5.
Ship segmentation results on PSeg-SSDD.
| Dataset | Model | AP | AP50 | AP75 | APS | APM | APL | FLOPs |
|---|---|---|---|---|---|---|---|---|
| PSeg-SSDD | Yolact [40] | 44.5 | 84.7 | 40.4 | 43.2 | 51.6 | 37.2 | 67.14G |
| Mask R-CNN [35] | 56.7 | 88.6 | 70.8 | 56.8 | 57.8 | 27.6 | 134.2G | |
| Instaboost [54] | 57.7 | 88.4 | 71.6 | 57.6 | 59.4 | 19.9 | 134.2G | |
| MS R-CNN [36] | 57.9 | 88.7 | 73.1 | 57.6 | 59.6 | 16.4 | 134.2G | |
| CM R-CNN [37] | 58.2 | 89.5 | 71.8 | 57.6 | 61.0 | 21.9 | 265.0G | |
| HTC [38] | 58.5 | 90.1 | 72.9 | 58.0 | 60.6 | 33.1 | 279.0G | |
| HQ-ISNet [17] | 59.4 | 90.0 | 73.3 | 58.7 | 61.9 | 36.2 | 279.6G | |
| EISP | 60.3 | 93.3 | 73.3 | 58.9 | 65.9 | 35.6 | 300.4G | |
| EISP* | 60.9 | 92.0 | 75.1 | 60.2 | 63.9 | 47.3 | 300.4G |
Table 6.
Instance segmentation results on NWPU VHR-10 test set.
| Dataset | Model | AP | AP50 | AP75 | APS | APM | APL | FLOPs |
|---|---|---|---|---|---|---|---|---|
| NWPU VHR-10 | Yolact [40] | 38.6 | 70.4 | 38.5 | 24.3 | 39.9 | 46.2 | 164.8G |
| Mask R-CNN [35] | 57.9 | 90.2 | 61.0 | 41.5 | 58.6 | 53.1 | 229.1G | |
| Instaboost [54] | 58.7 | 91.9 | 65.9 | 42.8 | 59.1 | 65.6 | 229.1G | |
| MS R-CNN [36] | 59.4 | 90.4 | 66.4 | 40.2 | 59.9 | 63.9 | 229.1G | |
| CM R-CNN [37] | 60.7 | 92.8 | 66.6 | 47.9 | 61.4 | 62.1 | 360.2G | |
| HTC [38] | 61.9 | 92.4 | 67.7 | 49.0 | 62.1 | 64.1 | 390.0G | |
| HQ-ISNet [17] | 62.7 | 91.2 | 69.7 | 54.6 | 63.5 | 64.3 | 391.4G | |
| EISP | 68.1 | 95.8 | 74.5 | 52.7 | 68.4 | 76.9 | 594.2G | |
| EISP* | 69.1 | 96.3 | 76.1 | 55.6 | 69.3 | 78.2 | 594.2G |
Table 7.
Class-wise instance segmentation results on the NWPU VHR-10 test set.
| Model | AI | BD | GTF | VC | SH | TC | HB | ST | BC | BR |
|---|---|---|---|---|---|---|---|---|---|---|
| Yolact | 5.1 | 77.0 | 67.6 | 33.0 | 47.5 | 24.9 | 31.6 | 55.5 | 36.7 | 6.9 |
| Mask R-CNN | 27.1 | 81.1 | 85.8 | 51.8 | 53.3 | 58.6 | 55.2 | 71.5 | 67.1 | 27.3 |
| Instaboost | 26.5 | 81.6 | 83.8 | 52.4 | 55.9 | 61.0 | 60.0 | 71.7 | 65.2 | 28.8 |
| MS R-CNN | 27.0 | 79.7 | 87.5 | 52.0 | 51.6 | 60.9 | 60.2 | 70.0 | 74.3 | 30.6 |
| CM R-CNN | 28.0 | 83.5 | 87.6 | 53.6 | 56.9 | 65.3 | 59.6 | 71.5 | 74.2 | 26.6 |
| HTC | 28.1 | 83.6 | 88.8 | 54.8 | 55.0 | 67.1 | 61.6 | 73.5 | 77.3 | 28.8 |
| HQ-ISNet | 38.7 | 85.8 | 87.9 | 57.8 | 59.2 | 72.2 | 60.2 | 75.1 | 69.2 | 20.9 |
| EISP | 46.6 | 86.5 | 92.0 | 59.3 | 58.6 | 73.0 | 65.3 | 76.3 | 80.3 | 42.9 |
| EISP* | 47.0 | 86.6 | 93.0 | 62.9 | 60.1 | 73.4 | 66.4 | 75.4 | 80.4 | 45.4 |
Publisher’s Note: MDPI stays neutral with regard to jurisdictional claims in published maps and institutional affiliations. |
© 2022 by the authors. Licensee MDPI, Basel, Switzerland. This article is an open access article distributed under the terms and conditions of the Creative Commons Attribution (CC BY) license (https://creativecommons.org/licenses/by/4.0/).
Share and Cite
MDPI and ACS Style
Fan, F.; Zeng, X.; Wei, S.; Zhang, H.; Tang, D.; Shi, J.; Zhang, X. Efficient Instance Segmentation Paradigm for Interpreting SAR and Optical Images. Remote Sens. 2022, 14, 531. https://doi.org/10.3390/rs14030531
AMA Style
Fan F, Zeng X, Wei S, Zhang H, Tang D, Shi J, Zhang X. Efficient Instance Segmentation Paradigm for Interpreting SAR and Optical Images. Remote Sensing. 2022; 14(3):531. https://doi.org/10.3390/rs14030531
Chicago/Turabian StyleFan, Fan, Xiangfeng Zeng, Shunjun Wei, Hao Zhang, Dianhua Tang, Jun Shi, and Xiaoling Zhang. 2022. "Efficient Instance Segmentation Paradigm for Interpreting SAR and Optical Images" Remote Sensing 14, no. 3: 531. https://doi.org/10.3390/rs14030531
Note that from the first issue of 2016, this journal uses article numbers instead of page numbers. See further details here.