
A Remote Sensing-Based Inventory of West Africa Tropical Forest Patches: A Basis for Enhancing Their Conservation and Sustainable Use

Abstract
:
1. Introduction
2. Methodology
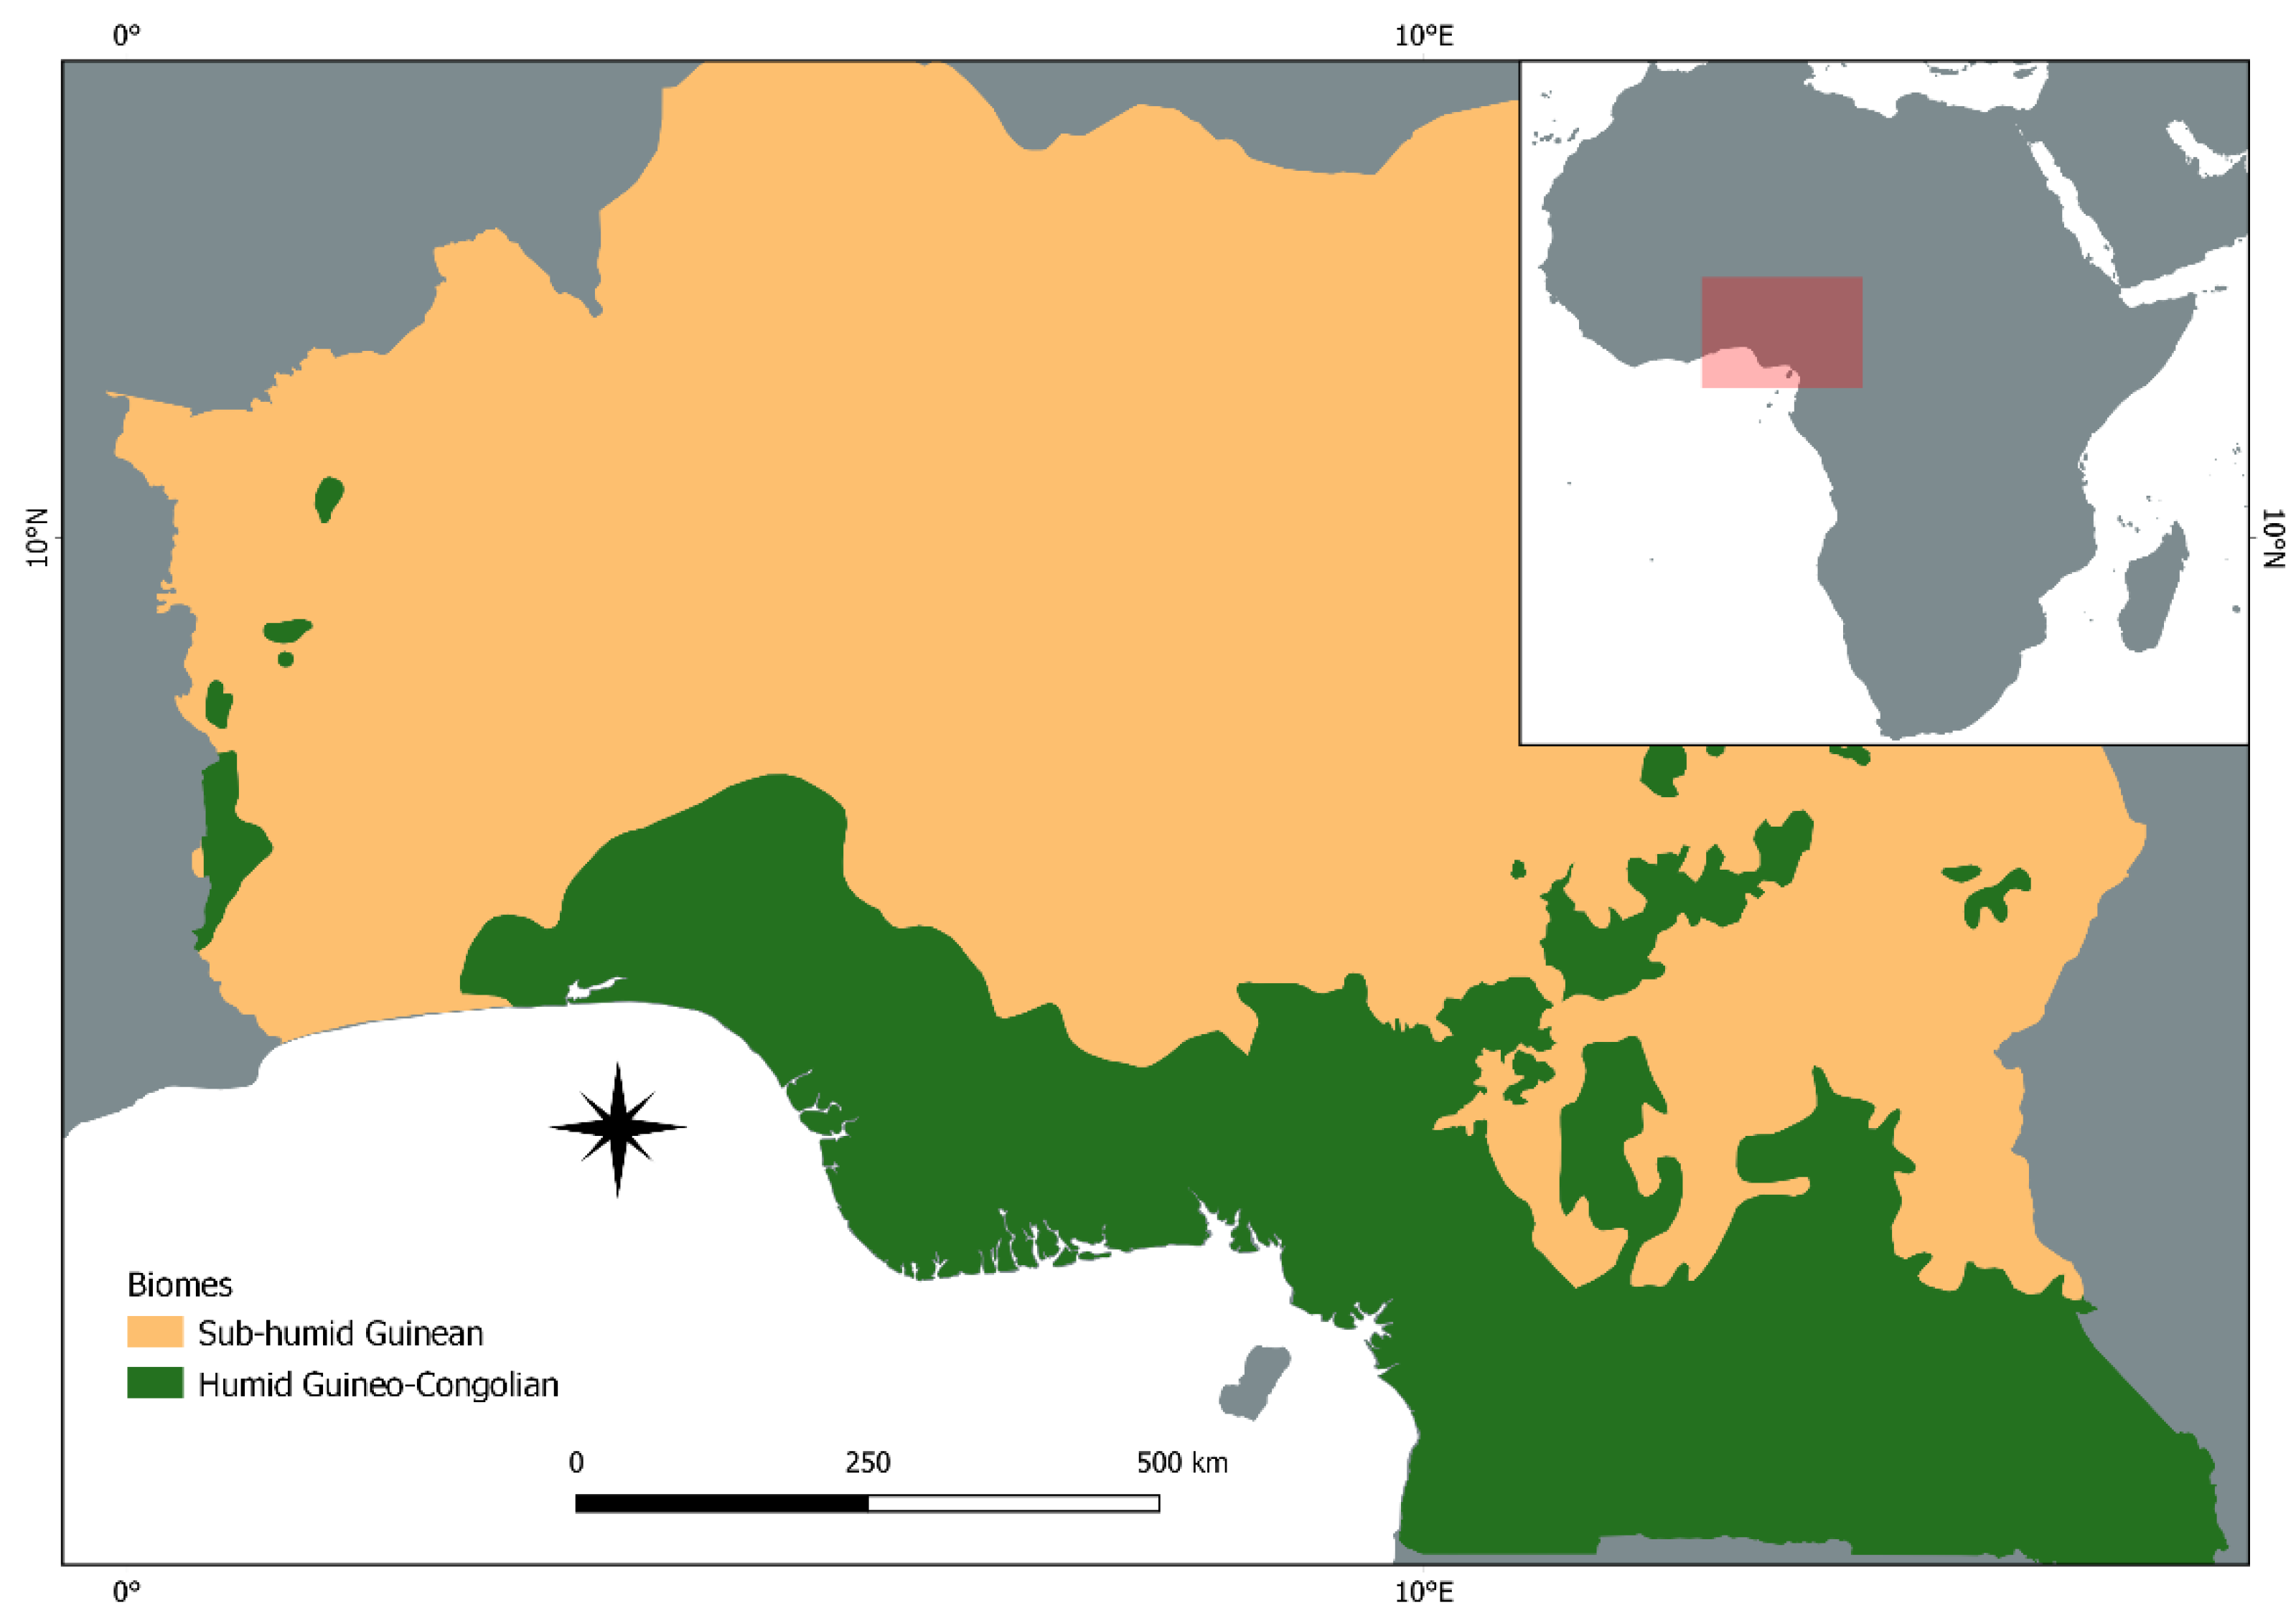
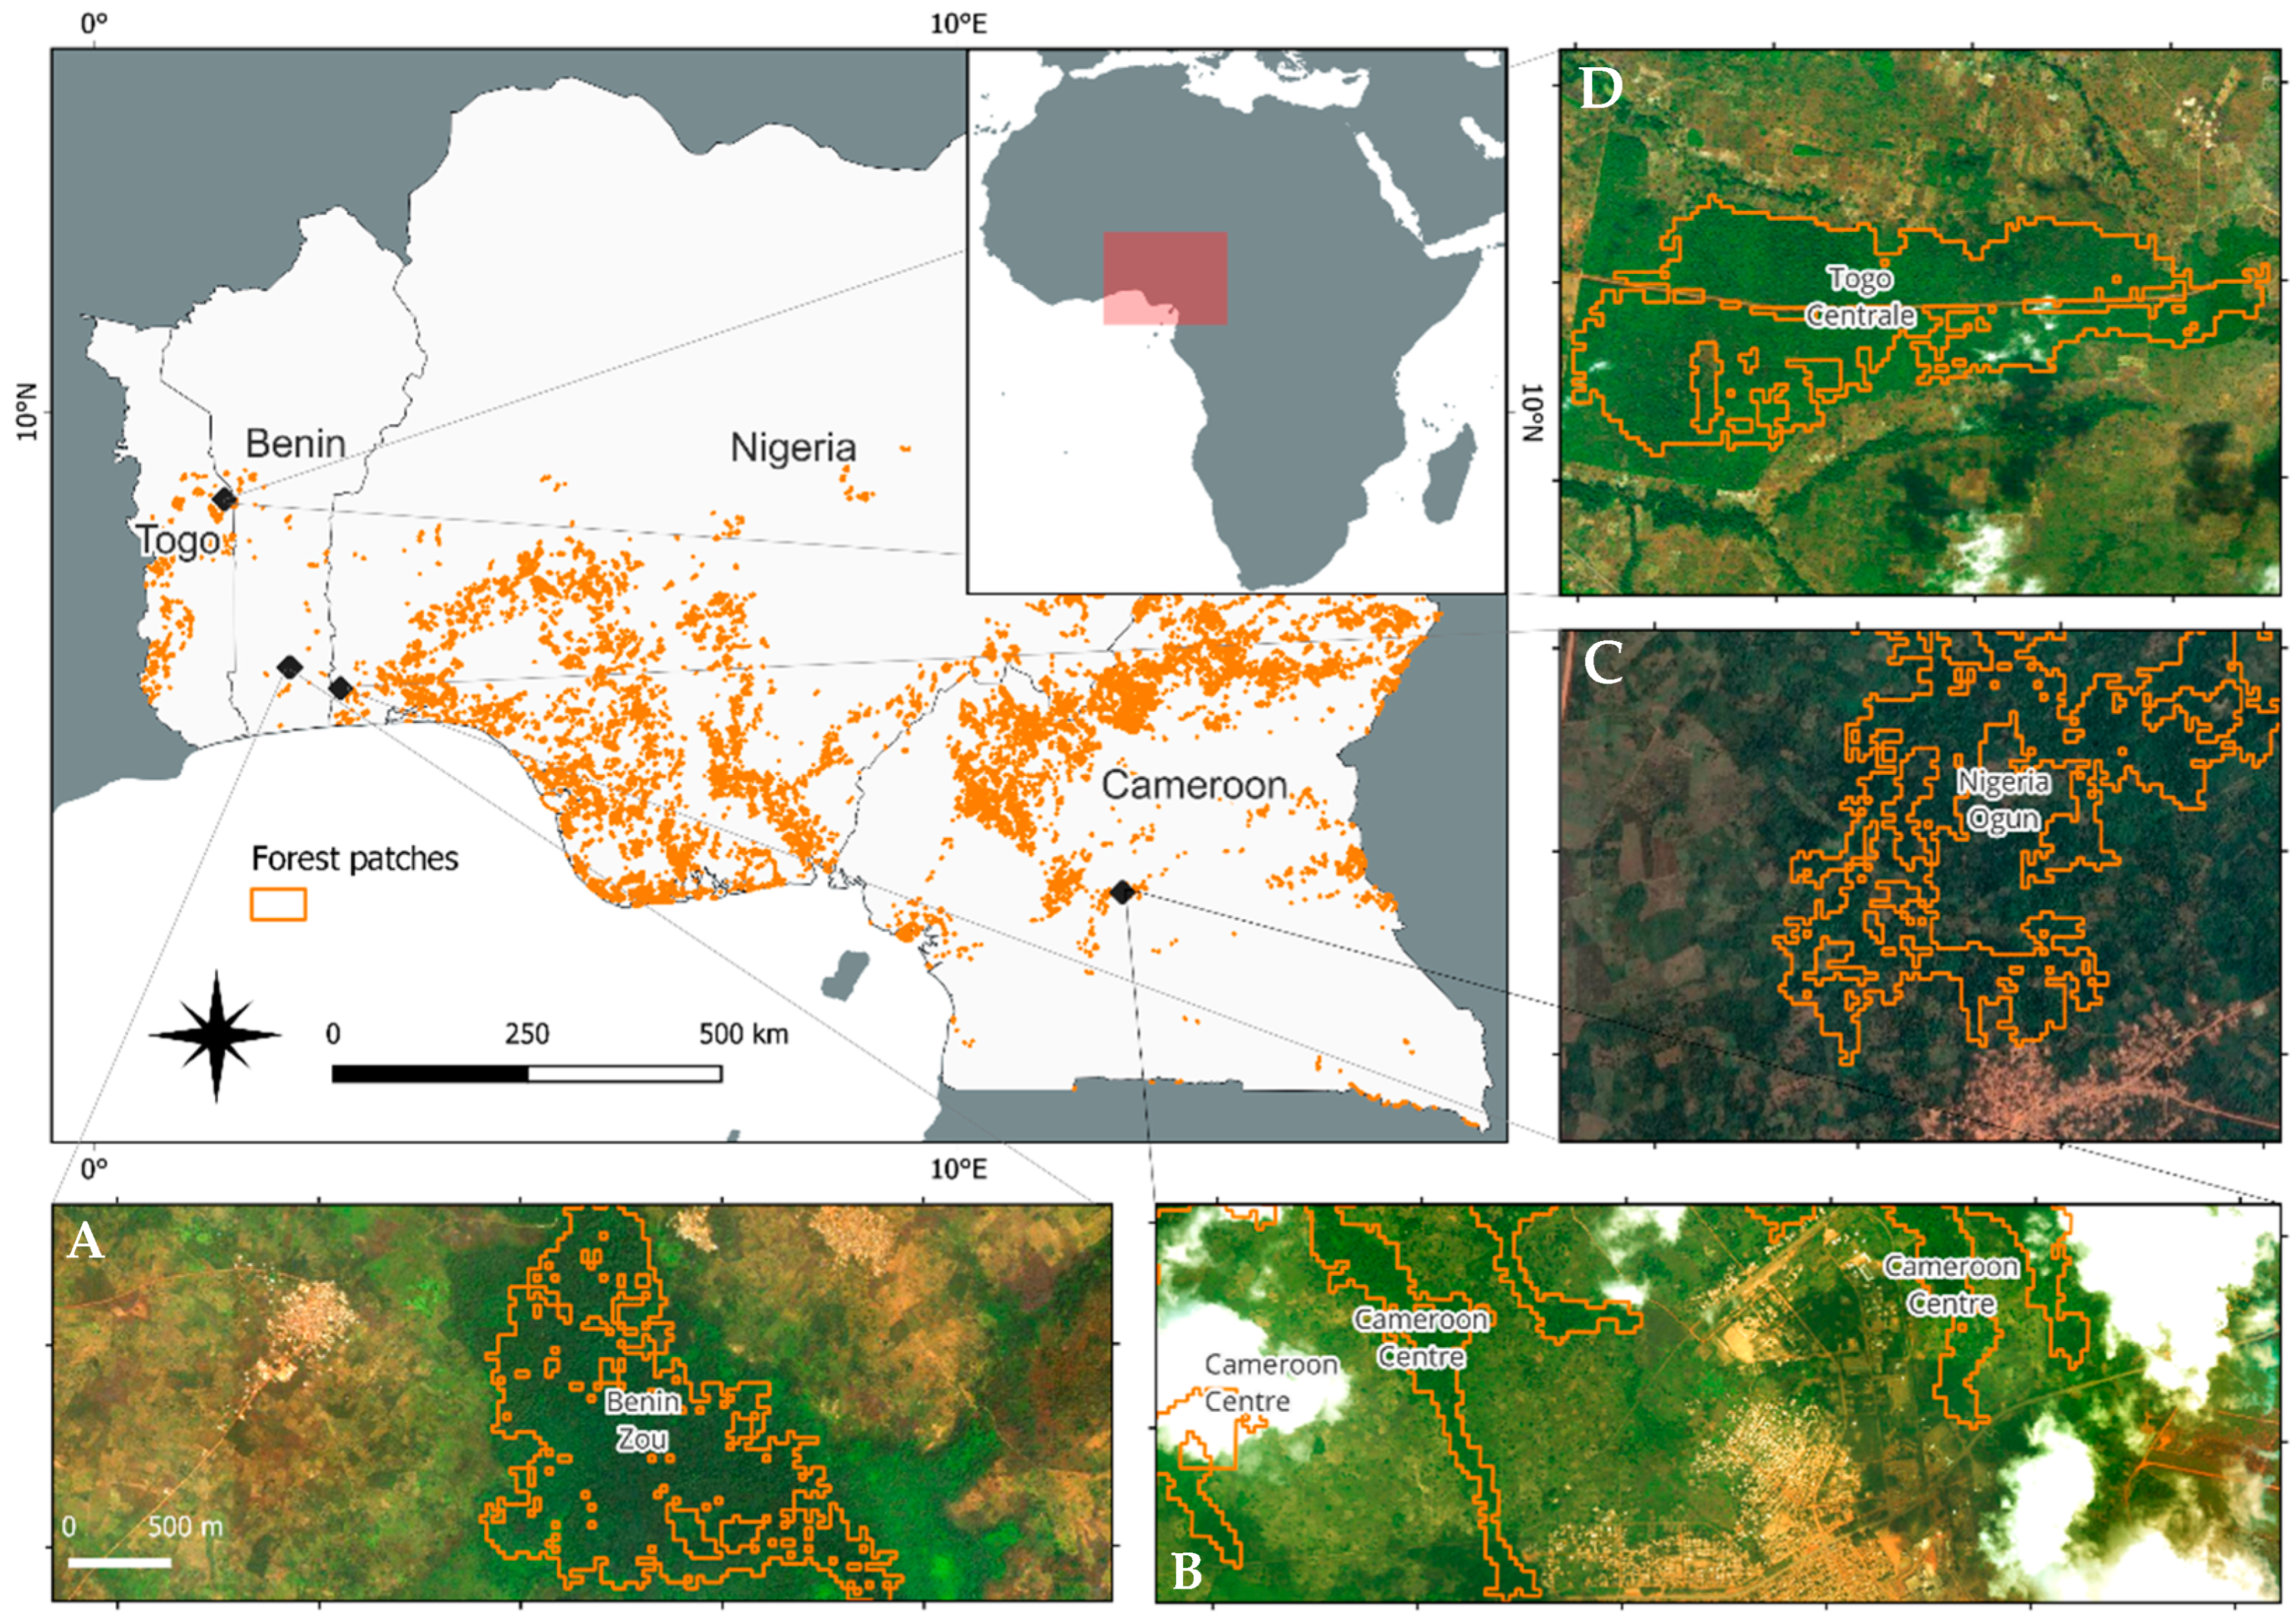
2.1. Study Area
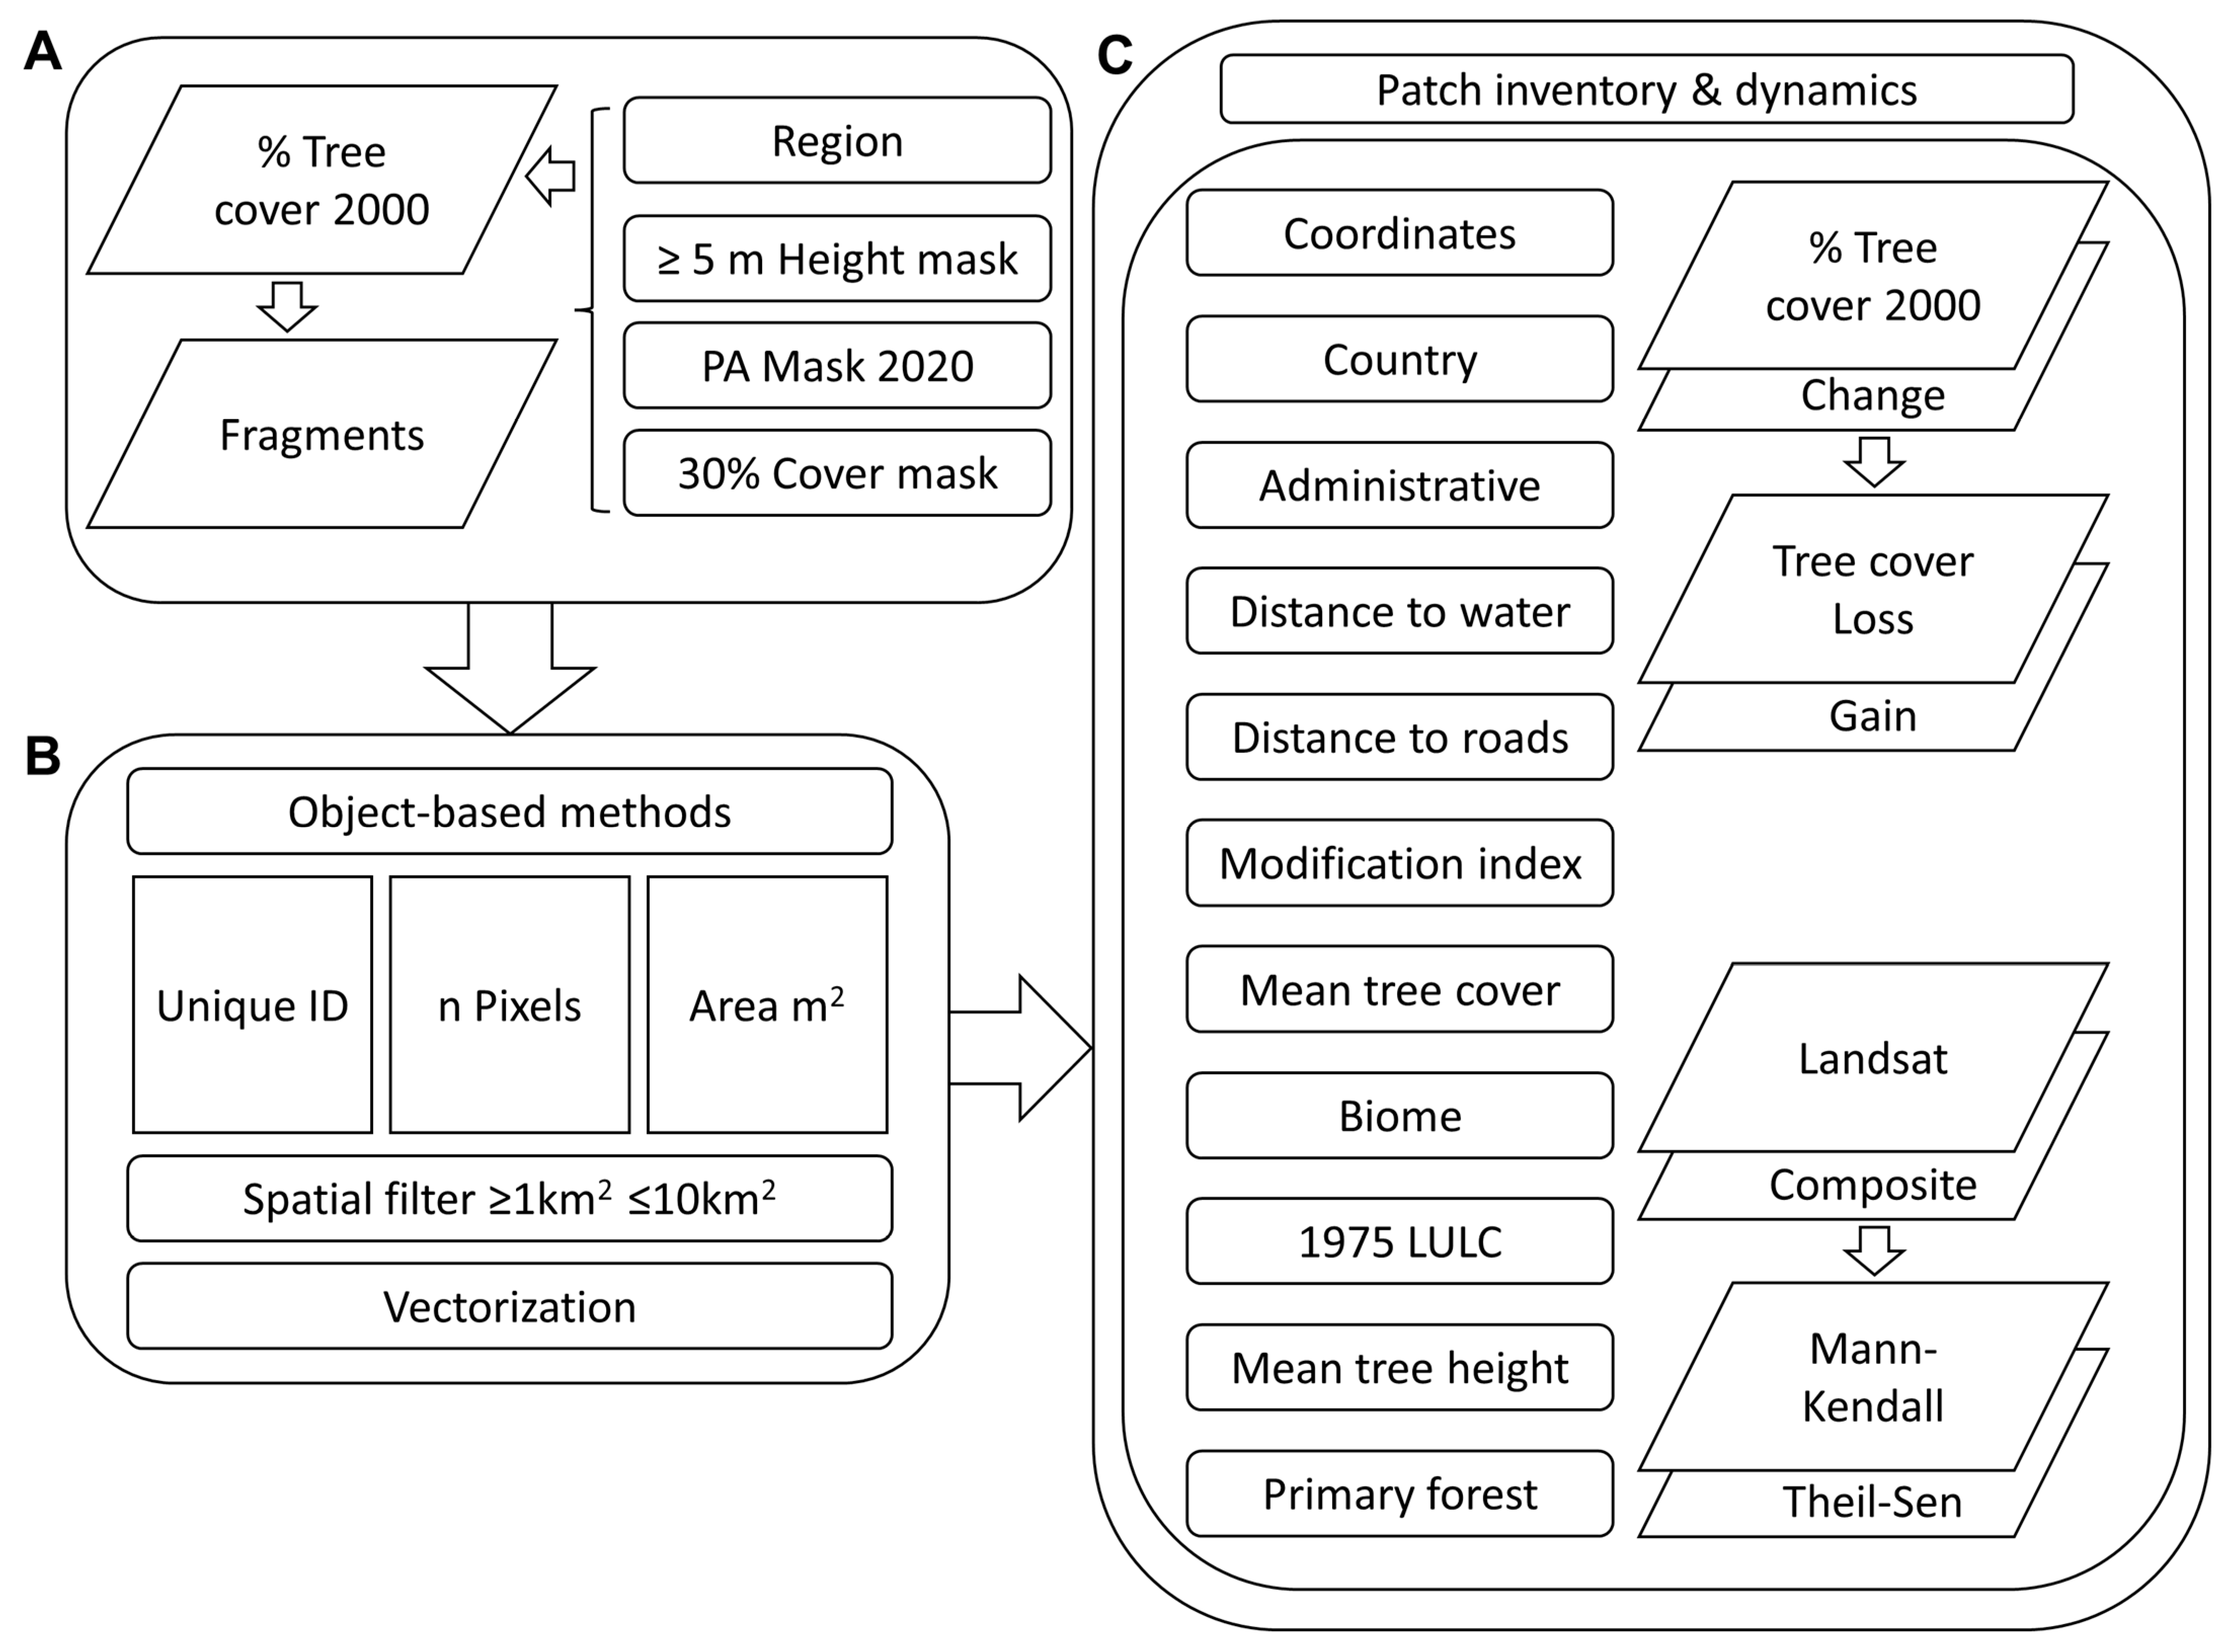
2.2. Forest Patch Detection
2.3. Inventory Attributes
2.4. Analyses
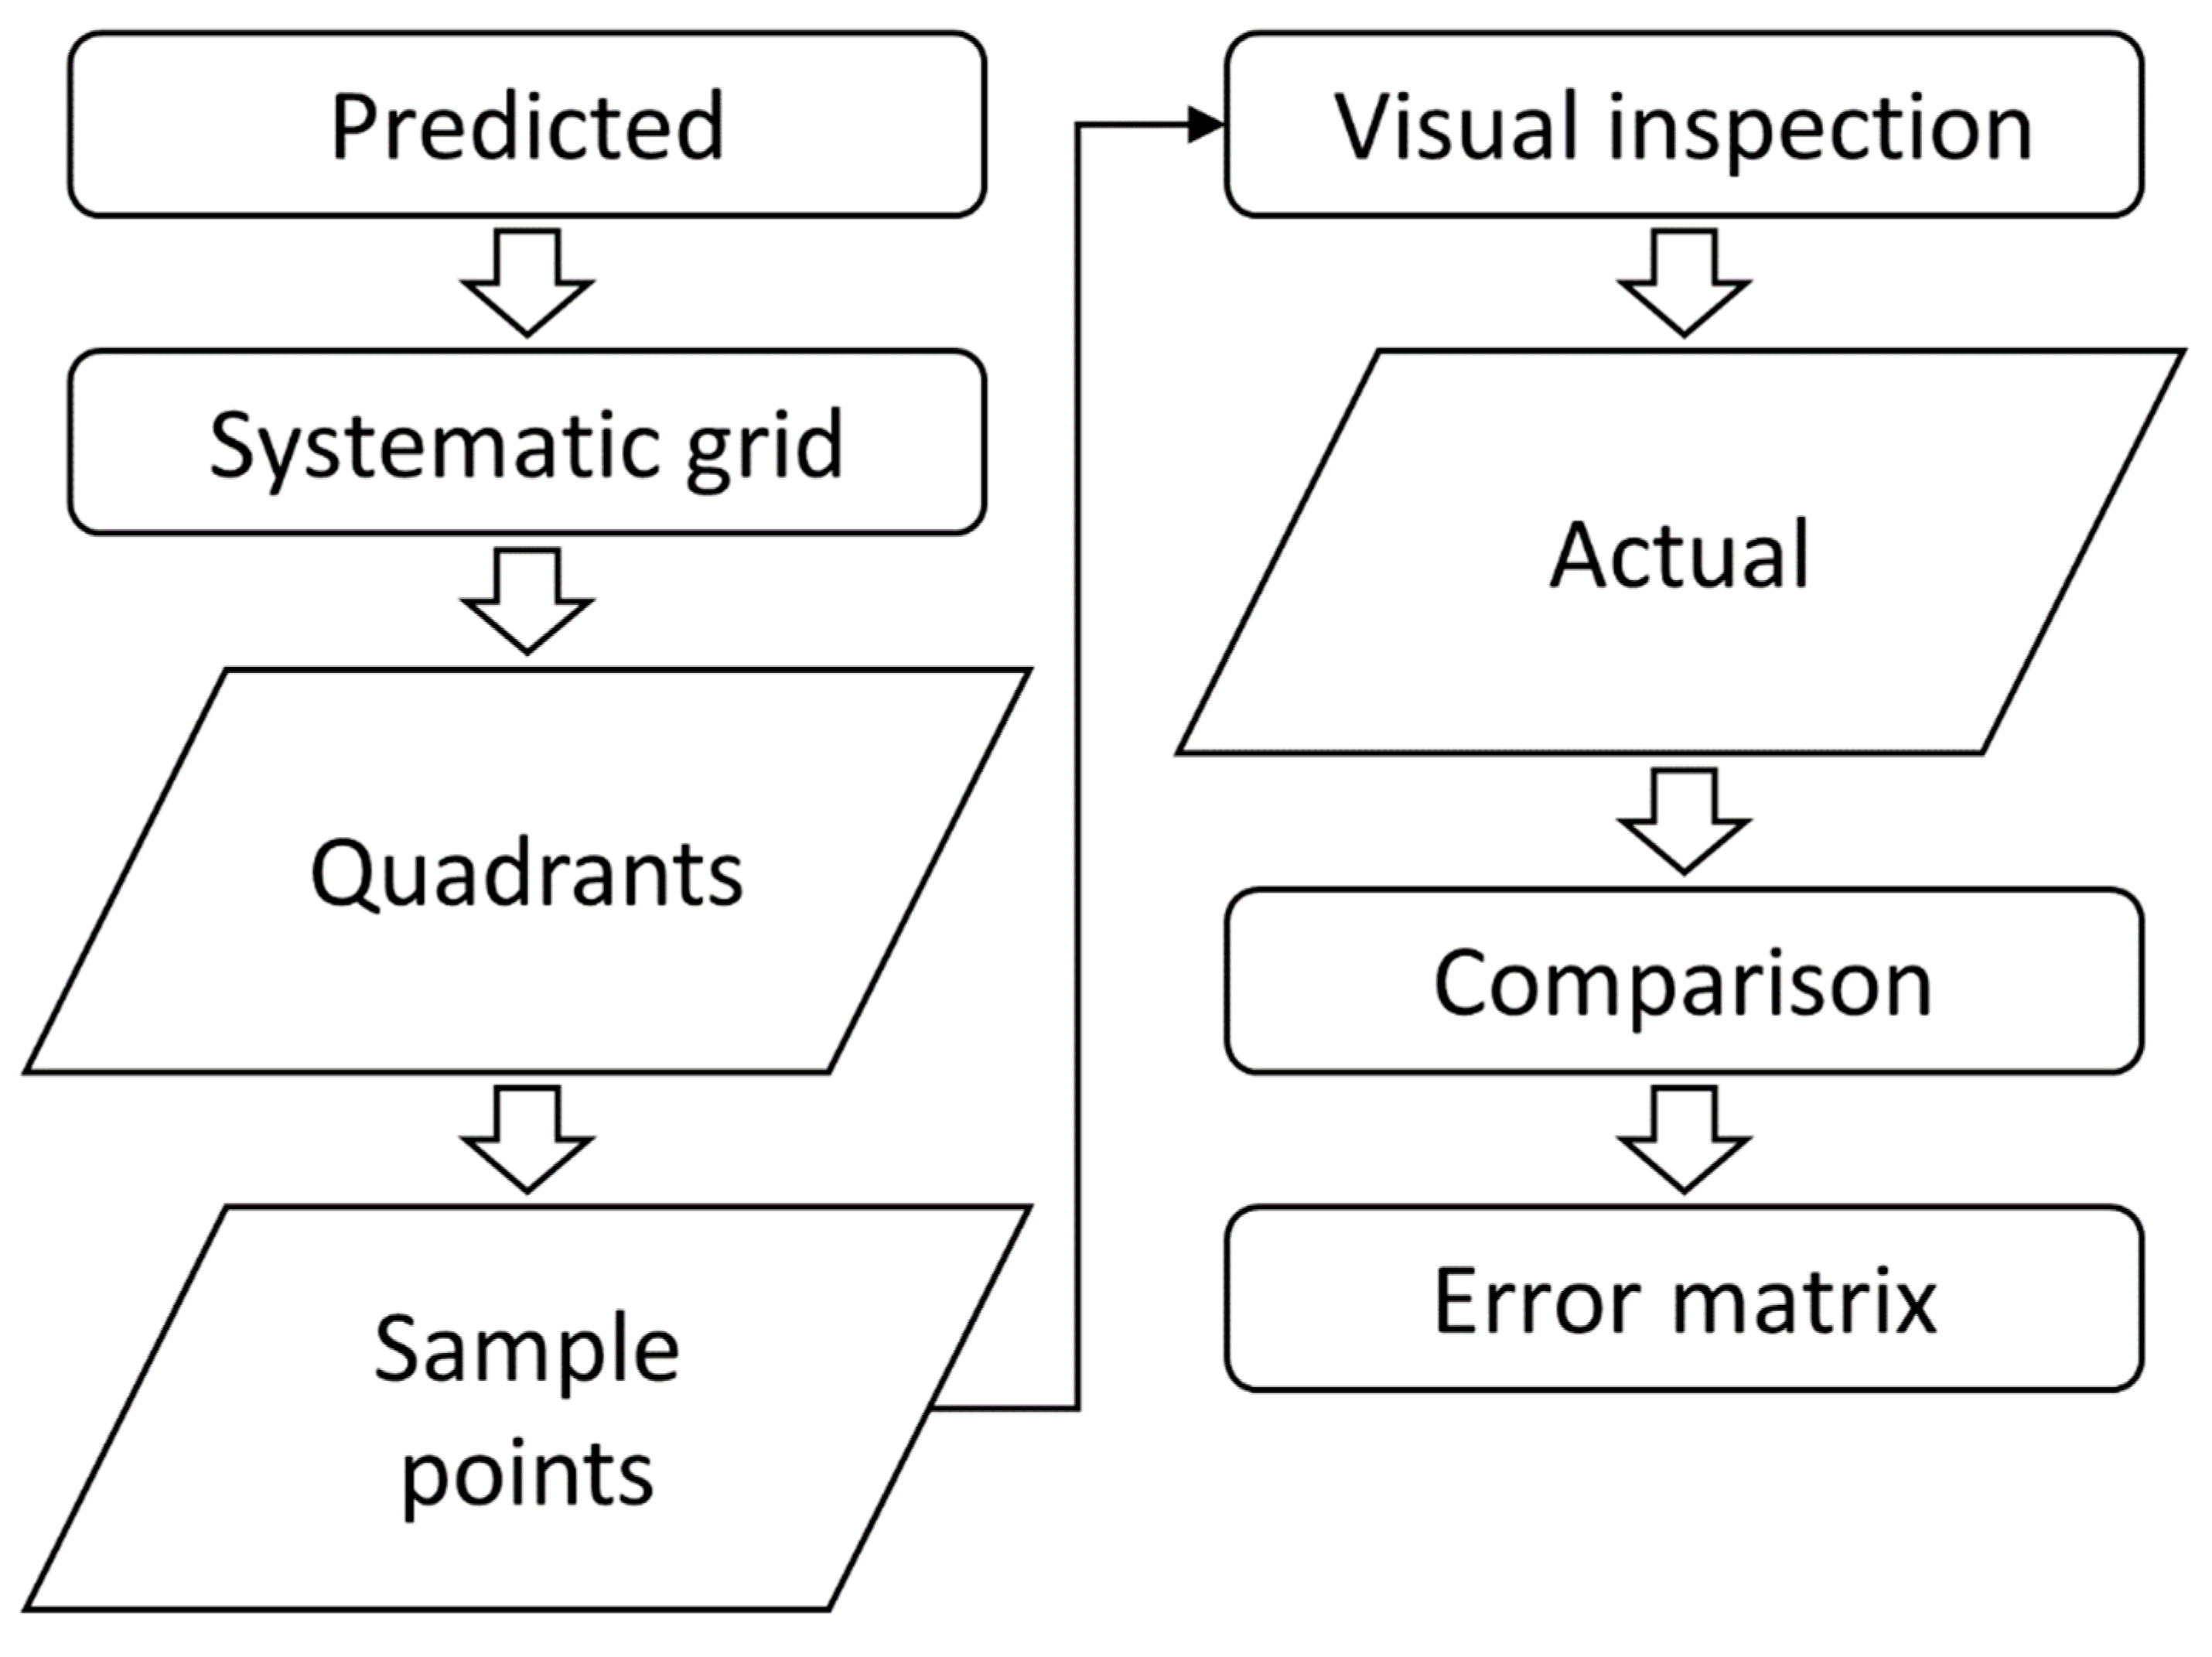
2.5. Validation
3. Results and Discussion
3.1. Change Statistics
Land-Use/Land Cover 1975
3.2. Regression Analyses
3.2.1. Forest Loss and Gain
3.2.2. Trends
3.2.3. Forest Change in Relation to Drivers
3.2.4. Tree Cover and Height
4. Conclusions
Author Contributions
Funding
Data Availability Statement
Acknowledgments
Conflicts of Interest
References
- Barlow, J.; Gardner, T.A.; Araujo, I.S.; Ávila-Pires, T.C.; Bonaldo, A.B.; Costa, J.E.; Esposito, M.C.; Ferreira, L.V.; Hawes, J.; Hernandez, M.I.M.; et al. Quantifying the Biodiversity Value of Tropical Primary, Secondary, and Plantation Forests. Proc. Natl. Acad. Sci. USA 2007, 104, 18555–18560. [Google Scholar] [CrossRef] [PubMed] [Green Version]
- Gibson, L.; Lee, T.M.; Koh, L.P.; Brook, B.; Gardner, T.A.; Barlow, J.; Peres, C.; Bradshaw, C.; Laurance, W.F.; Lovejoy, T.E.; et al. Primary forests are irreplaceable for sustaining tropical biodiversity. Nature 2011, 478, 378–381. [Google Scholar] [CrossRef] [PubMed]
- Achard, F.; Beuchle, R.; Mayaux, P.; Stibig, H.; Bodart, C.; Brink, A.; Carboni, S.; Desclée, B.; Donnay, F.; Eva, H.D.; et al. Determination of Tropical Deforestation Rates and Related Carbon Losses from 1990 to 2010. Glob. Chang. Biol. 2014, 20, 2540–2554. [Google Scholar] [CrossRef] [PubMed]
- Mitchard, E.T. The tropical forest carbon cycle and climate change. Nature 2018, 559, 527–534. [Google Scholar] [CrossRef] [Green Version]
- Haddad, N.M.; Brudvig, L.A.; Clobert, J.; Davies, K.F.; Gonzalez, A.; Holt, R.D.; Lovejoy, T.E.; Sexton, J.O.; Austin, M.P.; Collins, C.D.; et al. Habitat Fragmentation and Its Lasting Impact on Earth’s Ecosystems. Sci. Adv. 2015, 1, e1500052. [Google Scholar] [CrossRef] [PubMed] [Green Version]
- Brinck, K.; Fischer, R.; Groeneveld, J.; Lehmann, S.; De Paula, M.D.; Pütz, S.; Sexton, J.O.; Song, D.; Huth, A. High resolution analysis of tropical forest fragmentation and its impact on the global carbon cycle. Nat. Commun. 2017, 8, 14855. [Google Scholar] [CrossRef] [PubMed] [Green Version]
- Chaplin-Kramer, R.; Ramler, I.; Sharp, R.R.; Haddad, N.M.; Gerber, J.; West, P.C.; Mandle, L.; Engstrom, P.; Baccini, A.; Sim, S.; et al. Degradation in carbon stocks near tropical forest edges. Nat. Commun. 2015, 6, 10158. [Google Scholar] [CrossRef] [PubMed] [Green Version]
- Laurance, W.F.; Camargo, J.L.; Luizão, R.C.; Laurance, S.G.; Pimm, S.L.; Bruna, E.M.; Stouffer, P.C.; Williamson, G.B.; Benítez-Malvido, J.; Vasconcelos, H.L.; et al. The fate of Amazonian forest fragments: A 32-year investigation. Biol. Conserv. 2011, 144, 56–67. [Google Scholar] [CrossRef]
- Pütz, S.; Groeneveld, J.; Henle, K.; Knogge, C.; Martensen, A.C.; Metz, M.; Metzger, J.P.; Ribeiro, M.C.; de Paula, M.D.; Huth, A. Long-term carbon loss in fragmented Neotropical forests. Nat. Commun. 2014, 5, 5037. [Google Scholar] [CrossRef] [Green Version]
- Qie, L.; Lewis, S.L.; Sullivan, M.J.P.; Lopez-Gonzalez, G.; Pickavance, G.C.; Sunderland, T.; Ashton, P.; Hubau, W.; Abu Salim, K.; Aiba, S.-I.; et al. Long-term carbon sink in Borneo’s forests halted by drought and vulnerable to edge effects. Nat. Commun. 2017, 8, 1966. [Google Scholar] [CrossRef]
- Seymour, F.; Harris, N.L. Reducing tropical deforestation. Science 2019, 365, 756–757. [Google Scholar] [CrossRef] [PubMed] [Green Version]
- Curtis, P.G.; Slay, C.M.; Harris, N.L.; Tyukavina, A.; Hansen, M.C. Classifying drivers of global forest loss. Science 2018, 361, 1108–1111. [Google Scholar] [CrossRef] [PubMed]
- Akinyemi, F.O.; Speranza, C.I. Agricultural Landscape Change Impact on the Quality of Land: An African Continent-Wide Assessment in Gained and Displaced Agricultural Lands. Int. J. Appl. Earth Obs. Geoinf. 2022, 106, 102644. [Google Scholar] [CrossRef]
- Groeneveld, J.; Alves, L.; Bernacci, L.; Catharino, E.; Knogge, C.; Metzger, J.; Pütz, S.; Huth, A. The impact of fragmentation and density regulation on forest succession in the Atlantic rain forest. Ecol. Model. 2009, 220, 2450–2459. [Google Scholar] [CrossRef]
- Ordway, E.M.; Asner, G.P. Carbon declines along tropical forest edges correspond to heterogeneous effects on canopy structure and function. Proc. Natl. Acad. Sci. USA 2020, 117, 7863–7870. [Google Scholar] [CrossRef]
- Broadbent, E.N.; Asner, G.P.; Keller, M.; Knapp, D.E.; Oliveira, P.J.; Silva, J.N. Forest fragmentation and edge effects from deforestation and selective logging in the Brazilian Amazon. Biol. Conserv. 2008, 141, 1745–1757. [Google Scholar] [CrossRef]
- Gascon, C.; Williamson, G.B.; da Fonseca, G.A.B. Receding Forest Edges and Vanishing Reserves. Science 2000, 288, 1356–1358. [Google Scholar] [CrossRef] [PubMed]
- Fischer, R.; Taubert, F.; Müller, M.S.; Groeneveld, J.; Lehmann, S.; Wiegand, T.; Huth, A. Accelerated forest fragmentation leads to critical increase in tropical forest edge area. Sci. Adv. 2021, 7, eabg7012. [Google Scholar] [CrossRef]
- Hansen, M.C.; Potapov, P.V.; Moore, R.; Hancher, M.; Turubanova, S.A.; Tyukavina, A.; Thau, D.; Stehman, S.V.; Goetz, S.J.; Loveland, T.R.; et al. High-resolution global maps of 21st-century forest cover change. Science 2013, 342, 850–853. [Google Scholar] [CrossRef] [Green Version]
- Hansen, M.C.; Wang, L.; Song, X.-P.; Tyukavina, A.; Turubanova, S.; Potapov, P.V.; Stehman, S.V. The fate of tropical forest fragments. Sci. Adv. 2020, 6, eaax8574. [Google Scholar] [CrossRef]
- Hecht, S.B.; Saatchi, S.S. Globalization and Forest Resurgence: Changes in Forest Cover in El Salvador. BioScience 2007, 57, 663–672. [Google Scholar] [CrossRef] [Green Version]
- Fairhead, J.; Leach, M. Misreading the African Landscape: Society and Ecology in a Forest-Savanna Mosaic; Cambridge University Press: Cambridge, UK, 1996; ISBN 0-521-56499-9. [Google Scholar]
- Lewis, S.L.; Lopez-Gonzalez, G.; Sonké, B.; Affum-Baffoe, K.; Baker, T.R.; Ojo, L.O.; Phillips, O.L.; Reitsma, J.M.; White, L.; Comiskey, J.A.; et al. Increasing Carbon Storage in Intact African Tropical Forests. Nature 2009, 457, 1003–1006. [Google Scholar] [CrossRef] [PubMed]
- Parnell, S.; Walawege, R. Sub-Saharan African urbanisation and global environmental change. Glob. Environ. Chang. 2011, 21, S12–S20. [Google Scholar] [CrossRef]
- Malhi, Y.; Hamilton, S.E.; Hill, S.L.L.; Arnell, A.; Maney, C.; Butchart, S.H.M.; Hilton-Taylor, C.; Ciciarelli, C.; Davis, C.; Dinerstein, E.; et al. Measuring Forest Biodiversity Status and Changes Globally. Front. For. Glob. Chang. 2019, 1, 70. [Google Scholar] [CrossRef]
- German, L.; Schoneveld, G.; Mwangi, E. Contemporary Processes of Large-Scale Land Acquisition in Sub-Saharan Africa: Legal Deficiency or Elite Capture of the Rule of Law? World Dev. 2013, 48, 1–18. [Google Scholar] [CrossRef]
- Allen, T.; Heinrig, P.; Heo, I. Agriculture, Food and Jobs in West Africa. West African Papers, 5 April 2018. [Google Scholar]
- Cotillon, S.E.; Tappan, G.G. Landscapes of West Africa: A Window on a Changing World; United States Geological Survey: Garretson, SD, USA, 2016. [Google Scholar]
- Nicholson, S.E. The West African Sahel: A Review of Recent Studies on the Rainfall Regime and Its Interannual Variability. Int. Sch. Res. Not. 2013, 2013, 453521. [Google Scholar] [CrossRef]
- Keay, R. Derived Savanna: Derived from What. Bull. l’Ifan 1959, 21, 427–438. [Google Scholar]
- Valentin, C. Rapport Sur La Résidence Du Kissi; National Archives: Dakar, Senegal, 1893. [Google Scholar]
- Adam, J. Les Reliques Boisées et Les Essences Des Savanes Dans La Zone Préforestière En Guinée Française. Bull. Soc. Bot. Fr. 1948, 95, 22–26. [Google Scholar] [CrossRef]
- Gouvernement de Guinee, C. Politique Forestiere et Plan d’action, Plan d’Action Forestier Tropical, 1988; Food and Agriculture Organization of the United Nations: Rome, Italy, 1988. [Google Scholar]
- Aubréville, A. Climats, Forêts et Désertification de l’Afrique Tropicale. 1949. Available online: https://agris.fao.org/agris-search/search.do?recordID=US201300651842 (accessed on 27 September 2022).
- Keay, R.W.J. Vegetation Map of Africa South of the Tropic of Cancer. Explanatory Notes; Oxford University Press: Oxford, UK, 1959. [Google Scholar]
- Gayibor, N.L. Écologie et Histoire: Les Origines de La Savane Du Bénin (Ecology and History: The Origins of the Benin Savanna). Cah. D’etudes Afr. 1986, 26, 13–41. [Google Scholar]
- Backéus, I. Distribution and vegetation dynamics of humid savannas in Africa and Asia. J. Veg. Sci. 1992, 3, 345–356. [Google Scholar] [CrossRef]
- Sinsin, B.; Kampmann, D.; Thiombiano, A.; Konaté, S. Atlas de La Biodiversité de l’Afrique de l’Ouest, Tome III: Côte d’Ivoire. Abidjan & Frankfurt/Main. 2010. Available online: http://www.goethe-university-frankfurt.de/50800968/CI_01_Cover_Preface_Introduction.pdf (accessed on 27 September 2022).
- Gorelick, N.; Hancher, M.; Dixon, M.; Ilyushchenko, S.; Thau, D.; Moore, R. Google Earth Engine: Planetary-scale geospatial analysis for everyone. Remote Sens. Environ. 2017, 202, 18–27. [Google Scholar] [CrossRef]
- Keenan, R.J.; Reams, G.A.; Achard, F.; de Freitas, J.V.; Grainger, A.; Lindquist, E. Dynamics of Global Forest Area: Results from the FAO Global Forest Resources Assessment 2015. For. Ecol. Manag. 2015, 352, 9–20. [Google Scholar] [CrossRef]
- Potapov, P.; Li, X.; Hernandez-Serna, A.; Tyukavina, A.; Hansen, M.C.; Kommareddy, A.; Pickens, A.; Turubanova, S.; Tang, H.; Silva, C.E.; et al. Mapping global forest canopy height through integration of GEDI and Landsat data. Remote Sens. Environ. 2021, 253, 112165. [Google Scholar] [CrossRef]
- UNEP-WCMC; IUCN. NGS (2018) Protected Planet Report 2018; UNEP-WCMC: Cambridge, UK; IUCN: Gland, Switzerland; NGS: Washington, DC, USA, 2020. [Google Scholar]
- Maxwell, S.L.; Evans, T.; Watson, J.E.M.; Morel, A.; Grantham, H.; Duncan, A.; Harris, N.; Potapov, P.; Runting, R.K.; Venter, O.; et al. Degradation and forgone removals increase the carbon impact of intact forest loss by 626%. Sci. Adv. 2019, 5, eaax2546. [Google Scholar] [CrossRef] [PubMed] [Green Version]
- Turubanova, S.; Potapov, P.V.; Tyukavina, A.; Hansen, M.C. Ongoing Primary Forest Loss in Brazil, Democratic Republic of the Congo, and Indonesia. Environ. Res. Lett. 2018, 13, 074028. [Google Scholar] [CrossRef] [Green Version]
- Dinerstein, E.; Olson, D.; Joshi, A.; Vynne, C.; Burgess, N.D.; Wikramanayake, E.; Hahn, N.; Palminteri, S.; Hedao, P.; Noss, R.; et al. An Ecoregion-Based Approach to Protecting Half the Terrestrial Realm. Bioscience 2017, 67, 534–545. [Google Scholar] [CrossRef]
- Food and Agriculture Organization of the United Nations. The Global Administrative Unit Layers (GAUL): Technical Aspects; Food and Agriculture Organization of the United Nations: Rome, Italy, 2008. [Google Scholar]
- Solórzano, J.V.; Gallardo-Cruz, J.A.; Peralta-Carreta, C.; Martínez-Camilo, R.; de Oca, A.F.-M. Plant community composition patterns in relation to microtopography and distance to water bodies in a tropical forested wetland. Aquat. Bot. 2020, 167, 103295. [Google Scholar] [CrossRef]
- Pekel, J.-F.; Cottam, A.; Gorelick, N.; Belward, A.S. High-resolution mapping of global surface water and its long-term changes. Nature 2016, 540, 418–422. [Google Scholar] [CrossRef]
- Center for International Earth Science Information Network-CIESIN-Columbia University and Information Technology Outreach Services-ITOS-University of Georgia. Global Roads Open Access Data Set, Version 1 (GROADSv1); NASA Socioeconomic Data and Applications Center (SEDAC): Palisades, NY, USA, 2013. [Google Scholar] [CrossRef]
- Kennedy, C.M.; Oakleaf, J.R.; Theobald, D.M.; Baruch-Mordo, S.; Kiesecker, J. Managing the middle: A shift in conservation priorities based on the global human modification gradient. Glob. Chang. Biol. 2019, 25, 811–826. [Google Scholar] [CrossRef]
- Kennedy, C.; Oakleaf, J.R.; Theobald, D.M.; Baruch-Mordo, S.; Kiesecker, J. Documentation for the Global Human Modification of Terrestrial Systems; NASA Socioeconomic Data and Applications Center (SEDAC): Palisades, NY, USA, 2020. [Google Scholar]
- Myers-Smith, I.H.; Kerby, J.T.; Phoenix, G.K.; Bjerke, J.W.; Epstein, H.E.; Assmann, J.J.; John, C.; Andreu-Hayles, L.; Angers-Blondin, S.; Beck, P.S.A.; et al. Complexity revealed in the greening of the Arctic. Nat. Clim. Chang. 2020, 10, 106–117. [Google Scholar] [CrossRef] [Green Version]
- Forkel, M.; Carvalhais, N.; Verbesselt, J.; Mahecha, M.D.; Neigh, C.S.R.; Reichstein, M. Trend Change Detection in NDVI Time Series: Effects of Inter-Annual Variability and Methodology. Remote Sens. 2013, 5, 2113–2144. [Google Scholar] [CrossRef]
- Verbesselt, J.; Hyndman, R.; Newnham, G.; Culvenor, D. Detecting trend and seasonal changes in satellite image time series. Remote Sens. Environ. 2010, 114, 106–115. [Google Scholar] [CrossRef]
- Pohlert, T. Non-Parametric Trend Tests and Change-Point Detection. 2016. Available online: https://cran.microsoft.com/snapshot/2017-11-08/web/packages/trend/vignettes/trend.pdf (accessed on 1 March 2021).
- Theil, H. A Rank-Invariant Method of Linear and Polynomial Regression Analysis. Indag. Math. 1950, 12, 173. [Google Scholar]
- Morell, O.; Fried, R. On Nonparametric Tests for Trend Detection in Seasonal Time Series. In Statistical Inference, Econometric Analysis and Matrix Algebra; Springer: Berlin/Heidelberg, Germany, 2009; pp. 19–39. [Google Scholar]
- Congalton, R.G.; Green, K. Assessing the Accuracy of Remotely Sensed Data: Principles and Practices; CRC Press: Boca Raton, FL, USA, 2019; ISBN 0-429-62935-4. [Google Scholar]
- Planet Team. Planet Application Program Interface: In Space for Life on Earth; Planet Team: San Francisco, CA, USA, 2017; Volume 2017, p. 40. [Google Scholar]
- Potapov, P.; Hansen, M.C.; Laestadius, L.; Turubanova, S.; Yaroshenko, A.; Thies, C.; Smith, W.; Zhuravleva, I.; Komarova, A.; Minnemeyer, S. The Last Frontiers of Wilderness: Tracking Loss of Intact Forest Landscapes from 2000 to 2013. Sci. Adv. 2017, 3, e1600821. [Google Scholar] [CrossRef] [Green Version]
- Bryan-Brown, D.N.; Connolly, R.M.; Richards, D.R.; Adame, F.; Friess, D.A.; Brown, C.J. Global trends in mangrove forest fragmentation. Sci. Rep. 2020, 10, 7177. [Google Scholar] [CrossRef] [PubMed]
- Poorter, L.; Craven, D.; Jakovac, C.C.; van der Sande, M.T.; Amissah, L.; Bongers, F.; Chazdon, R.L.; Farrior, C.E.; Kambach, S.; Meave, J.A.; et al. Multidimensional tropical forest recovery. Science 2021, 374, 1370–1376. [Google Scholar] [CrossRef] [PubMed]
- Neuenschwander, P.; Bown, D.; Hèdégbètan, G.C.; Adomou, A. Long-Term Conservation and Rehabilitation of Threatened Rain Forest Patches under Different Human Population Pressures in West Africa. Nat. Conserv. 2015, 13, 21–46. [Google Scholar] [CrossRef] [Green Version]
- Mitchard, E.T.A.; Saatchi, S.S.; Lewis, S.L.; Feldpausch, T.R.; Woodhouse, I.H.; Sonké, B.; Rowland, C.; Meir, P. Measuring biomass changes due to woody encroachment and deforestation/degradation in a forest–savanna boundary region of central Africa using multi-temporal L-band radar backscatter. Remote Sens. Environ. 2011, 115, 2861–2873. [Google Scholar] [CrossRef] [Green Version]
- Wingate, V.R.; Phinn, S.R.; Kuhn, N.; Scarth, P. Estimating aboveground woody biomass change in Kalahari woodland: Combining field, radar, and optical data sets. Int. J. Remote Sens. 2018, 39, 577–606. [Google Scholar] [CrossRef] [Green Version]
- Venter, Z.; Cramer, M.D.; Hawkins, H.-J. Drivers of woody plant encroachment over Africa. Nat. Commun. 2018, 9, 2272. [Google Scholar] [CrossRef] [Green Version]
- Olsson, L.; Eklundh, L.; Ardö, J. A recent greening of the Sahel—Trends, patterns and potential causes. J. Arid. Environ. 2005, 63, 556–566. [Google Scholar] [CrossRef]
- de Jong, R.; Verbesselt, J.; Zeileis, A.; Schaepman, M.E. Shifts in Global Vegetation Activity Trends. Remote Sens. 2013, 5, 1117–1133. [Google Scholar] [CrossRef]


| Variable Code | Description | Date | Units | |
|---|---|---|---|---|
| 1 | Labels | ID | - | - |
| 2 | Biome | Biome | - | - |
| 3 | Country | Country | - | - |
| 4 | Admin | Sub-national administrative region | - | - |
| 5 | Region | West Africa | - | - |
| 6 | D_water | Euclidian distance to water | 1984–2020 | Meters |
| 7 | D_roads | Euclidian distance to roads | 1980–2010 | Meters |
| 8 | Lat_DD | Latitude | - | Decimal degrees |
| 9 | Long_DD | Longitude | - | Decimal degrees |
| 10 | Area_m | Area of forest patch | 2020 | m2 |
| 11 | gHM | Global Human Modification dataset | 2016 | 0–1 |
| 12 | treeheight | Mean tree height | 2019 | Meters |
| 13 | treecover | Mean percentage tree-cover | 2000 | % |
| 14 | mask | Tree-cover binary mask | 2000 | Binary |
| 15 | Primary | Primary/non-primary | 2001–2002 | Binary |
| 16 | Gain_area | Tree cover gain area (m2) | 2000–2012 | m2 |
| 17 | Loss_area | Tree cover loss area (m2) | 2000–2020 | m2 |
| 18 | MannKendal | Mann–Kendall trend test | 2000–2020 | −1/+1 |
| 19 | TheilSen | Theil-Sen slope | 2000–2020 | 0–1 |
| Predicted | Actual | ||||
|---|---|---|---|---|---|
| Forest Patch | Other | ∑ User | Users’ Accuracy (%) | ||
| Forest Patch | 377 | 25 | 402 | 93.8 | |
| Other | 25 | 377 | 402 | 93.8 | |
| ∑ Producer | 402 | 402 | 804 | ||
| Producers’ accuracy (%) | 93.8 | 93.8 | |||
| Overall accuracy (%) | 93.8% | ||||
Publisher’s Note: MDPI stays neutral with regard to jurisdictional claims in published maps and institutional affiliations. |
© 2022 by the authors. Licensee MDPI, Basel, Switzerland. This article is an open access article distributed under the terms and conditions of the Creative Commons Attribution (CC BY) license (https://creativecommons.org/licenses/by/4.0/).
Share and Cite
Wingate, V.R.; Akinyemi, F.O.; Iheaturu, C.J.; Ifejika Speranza, C. A Remote Sensing-Based Inventory of West Africa Tropical Forest Patches: A Basis for Enhancing Their Conservation and Sustainable Use. Remote Sens. 2022, 14, 6251. https://doi.org/10.3390/rs14246251
Wingate VR, Akinyemi FO, Iheaturu CJ, Ifejika Speranza C. A Remote Sensing-Based Inventory of West Africa Tropical Forest Patches: A Basis for Enhancing Their Conservation and Sustainable Use. Remote Sensing. 2022; 14(24):6251. https://doi.org/10.3390/rs14246251
Chicago/Turabian StyleWingate, Vladimir R., Felicia O. Akinyemi, Chima J. Iheaturu, and Chinwe Ifejika Speranza. 2022. "A Remote Sensing-Based Inventory of West Africa Tropical Forest Patches: A Basis for Enhancing Their Conservation and Sustainable Use" Remote Sensing 14, no. 24: 6251. https://doi.org/10.3390/rs14246251