Article

Identification of Potential Natural Aquifer Recharge Sites in Islamabad, Pakistan, by Integrating GIS and RS Techniques

1
School of Civil and Environmental Engineering (SCEE), National University of Sciences and Technology (NUST), Islamabad 44000, Pakistan
2
Elementary & Secondary Education Department Government of Khyber Pakhtunkhwa, Chitral 17200, Pakistan
3
Department of Geography, Islamia College University, Peshawar 25120, Pakistan
4
Department of Electronic Engineering, Chung Yuan Christian University, No. 200, Zhongbei Rd., Jhongli District, Taoyuan City 320314, Taiwan
5
Center for Space and Remote Sensing Research, National Central University, No. 300, Jhongda Rd., Jhongli District, Taoyuan City 320317, Taiwan
6
Institute of Geography, Vietnam Academy of Science and Technology, 18 Hoang Quoc Viet Rd., Cau Giay, Hanoi 100000, Vietnam
*
Author to whom correspondence should be addressed.
Remote Sens. 2022, 14(23), 6051; https://doi.org/10.3390/rs14236051
Submission received: 22 August 2022 / Revised: 6 November 2022 / Accepted: 23 November 2022 / Published: 29 November 2022
(This article belongs to the Special Issue Remote Sensing in Environmental Modelling)

Abstract

:
Islamabad is essentially the only well-planned city in Pakistan, but groundwater depletion has become a serious issue there because of the rapid increase in population, poor water management, and deforestation. The current water demand of the city is about 220 million gallons per day, with the Capital Development Authority (CDA) providing up to 70 million gallons per day. The need for water is mostly fulfilled through groundwater sources, such as water bores and commercial tube wells. Hence, identifying recharge sites for natural aquifers is a significant component of groundwater required to overcome the water crisis. Therefore, this study aims to identify potential sites for natural aquifer recharge by using analytical hierarchy process (AHP), weighted linear combination (WLC), and fuzzy logic methods. To achieve the stated objective, seven local influencing factors including soil, slope, water table, population density, land use land cover (LULC), drainage density, and elevation have been utilized in this study. AHP was utilized for the evaluation of the relative importance of the above-mentioned factors, while fuzzy logic was applied for the standardization of these factors. Finally, the AHP-WLC and fuzzy logic approaches were used to merge factor maps in order to identify suitable sites for natural aquifer recharge in Islamabad City. Two different suitability maps were constructed from both techniques, and on each of the resulting maps, the subregions were categorized into five classes: not suitable, less suitable, moderate, suitable, and most suitable. Based on the AHP-WLC results, 5% of the whole study area is deemed most suitable for natural aquifer recharge (NAR), whereas from the fuzzy logic results, 10% of the study area is marked as most suitable. In contrast, 37% and 32% of the whole study area were identified as suitable by the AHP-WLC and fuzzy logic methods, respectively. While both techniques can obtain satisfactory outcomes, the suitability map from fuzzy logic has produced more precise results. Hence, we propose to CDA-Islamabad here different sites for recharge wells based on the results of fuzzy logic. As recommended by this study, to date CDA has constructed twelve recharge wells.

Graphical Abstract

1. Introduction

Pakistan is the 4th biggest groundwater puller in the world [1]. Its annual groundwater withdrawal is assessed at 65 BCM (Billion Cubic Meter), and its yearly sustainable groundwater assets are assessed at 55 BCM [1]. While focusing on the capital region of Islamabad, the scenario is not much different because of the increase in population, recorded as 805,235 in the 1998 census and 994,365 in the 2017 census [2]. However, the groundwater sources are essentially the same as they were in the 1990s. This rapid increase in population has resulted in overexploitation of groundwater resources. City groundwater is depleting at an alarming rate of 1.7 m per year as a result of excessive withdrawal [3].
Natural aquifer recharge (NAR) site selection is an integral part of water resources management. Therefore, delineation of NAR is one of the most crucial steps in water resource management. Furthermore, timely and reliable NAR site information with respect to its natural and spatial distribution is fundamental for best utilization of the above-mentioned reasons. Scientists are encouraged to use Multi-Criteria Decision Making (MCDM) techniques with integration of GIS for identification and selection of potential NAR [4]. Different spatio-statistical techniques are used for water resource management [5]. Sarhadi et al. [6] developed an improved regression-based model in order to address the biases in raw GCMs and to capture the non-linearity between hydroclimate predictions and atmospheric projection. However, more flexible and powerful approaches are needed to address the NAR potential zonation.
Groundwater is the most basic source of fresh water in the world and it plays an important part in the hydrological cycle, as well as in preserving the aquatic ecosystem and human well-being. Groundwater recharge occurs when water travels beneath the ground and infiltrates the saturated zones. Its availability mainly depends on precipitation and recharge systems [7].
Factors such as rapid population growth, climate change, deforestation, urbanization, and poor groundwater management policies have contributed to the depletion of groundwater [8]. Multiple studies have been performed for groundwater recharge by utilizing GIS techniques, especially Multi Criteria Decision Making (MCD), which includes an analytical hierarchy process (AHP) and fuzzy logic [9]. The MCDM techniques assist decision makers in solving complex problems where multiple conflict criteria are involved and must be evaluated. They are robust, cost effective, responsive, and powerful tools that can be used in many circumstances, such as certainty or uncertainty evaluations to analyze a problem in a scientific manner [10]. Although there are several methods to explore groundwater resources—such as drilling, or hydrological and geological methods—all of them require considerable time, money, expertise, and resources. However, the use of remote sensing (RS) and Geographic information system (GIS) techniques has proved to be less expensive, more responsive, and more convenient for suitable site selection for groundwater recharge [11]. Based on RS and GIS, methods like AHP, multi-criteria decision-making (MCDM), and fuzzy logic are developed, and such methods have been relatively efficient for appropriate groundwater recharge site zones [11]. However, the identification of natural aquifer recharge (NAR) sites via AHP, MCDM, and fuzzy logic approaches is relatively challenging as it involves several factors, such as soil types, land use land cover (LULC), drainage density, slope, water table, lithology, and geological structure [4,8,12,13,14]. To tackle the challenges of natural aquifer recharge, many researchers have worked on further developing approaches based on GIS, RS, and AHP in order to achieve a novel strategy for natural aquifer recharge potential sites. In their research, they incorporate factors such as source water quality, distance to canal, aquifer thickness, groundwater quality, distance to sensitive areas, and soil quality [14].
Shao et al. [13] also utilized AHP, which is an application of the MCDM method for locating acceptable recharging sites by incorporating national datasets of slopes, lithology, land use, drainage density, and soil drainage. Zghibi et al. [15] carried out research on the Korba aquifer in northeastern Tunisia in order to mitigate groundwater decline by incorporating AHP with multiple influencing factors—such as slope, lithology, land use land cover, geomorphology, lineament density, rainfall, soil types, and drainage density—to map groundwater recharge zones in Tunisia. Al-Shammari et al. [16] integrated GIS and RS techniques by adopting MCDM to identify aquifer recharge sites and cost-effective structures for groundwater recharge. They incorporated factors such as drainage, runoff, groundwater depth, slope, land use land cover, soil texture, and geology for their research. Khan et al. [3] delineated locations that have the potential to be used for artificial groundwater recharge in the Yamuna River basin (India) by incorporating the AHP model in the GIS environment to determine potential sites for recharge. They utilized different data sources and Landsat-8 images for different parameters as per their roles in groundwater recharge. In addition, Xu et al. [4] constructed a technique based on GIS and MCDM to identify potential sites for artificial recharge in China. Moreover, they incorporated factors such as source water quality, distance to canal, drainage density, aquifer hydraulic conductivity, groundwater depth, distance to sensitive areas, and soil quality in their analysis. Alikhanov et al. [17] performed a study for assessment of influencing factors on groundwater potential in zones of Uzbekistan by combining GIS and remote sensing technologies. Kumar et al. [18] incorporated RS and GIS techniques by using fuzzy logic and analytical hierarchical process to delineate groundwater recharge sites and concluded that geographic information systems in combination with remote sensing constitutes the best approach for results that are cost effective, less time consuming, and more responsive. Arshad et al. [8] carried out a study in Punjab (Pakistan) for potential recharge zones based on AHP and the probability frequency ratio technique. They assigned weights to different thematic layers—such as geomorphology, rainfall, depth to water, aquifer media, topography, soil media, land use land cover, and hydraulic conductivity—based on the literature and overlaid the maps.
Based on the review of these previous extensive studies, it has been pointed out that there is still a reasonable, but not followed, approach for the identification of natural aquifer recharge (NAR) suitable sites, which is to integrate GIS, RS, and MCDA altogether [19]. For Islamabad to overcome the groundwater crisis in upcoming years, emphasis should be given to effective management strategies based on real-life scenarios, keeping in view the field reality and water demand for the city. Hence, focused on this critical scenario in Islamabad, this study has aimed to provide an effective and reality-based spatial insight for efficient potential sites for natural aquifer recharge in order to overcome the water crisis and to enhance the prospective water table. In order to identify potential sites for natural aquifer recharge, we have combined and utilized AHP, weighted linear combination (WLC), and fuzzy logic methods. This study compared several GIS-based integrated methodologies, including AHP, fuzzy logic, and WLC methods, using a multi-criteria decision-making methodology to remove the inherent disadvantages associated with each of the above methods. The proposed technique is novel because the biasedness stemming from expert judgment will be removed by the AHP method, while fuzzy set theory will be used to remove the uncertainty and inconsistency associated with the data and factors.

2. Material and Methods

2.1. Study Area

Islamabad, the Federal Capital of Pakistan, is in the center of the Margalla Hills and Rawalpindi, with a total area of 906 km2. It is geographically located in the northwest of the country on the Potohar Plateau between 33°28′01″N and 33°48′36″N and 72°48′36″E–73°24′00″E [20], as shown in Figure 1. Islamabad City is partitioned into five major zones, which are in turn further divided into sectors. Zone Four is the largest residential zone in the area, whereas Zone I is the most developed. Each residential sector is designated by an alphabet letter and a number, and it spans an area of nearly 2 km × 2 km. The urban area of Islamabad is of 220.15 km2, the rural area 466.20 km2, and the parking area is 220.15 km2 [21]. From a hydro-geological standpoint, Islamabad sits in the Soan River basin. Two major rivers (Kurang and Soan), four perennial streams (Gumrah Kas, Bedarwali Kas, Tanawala Kas, and Lei Nala), and three reservoirs (Khanpur Dams, Simili, and Rawal) all flow through this area. The residents of Islamabad depend mainly on groundwater, and on surface water as well. The major surface water source is Simply Dam, while the rest of the water demand is fulfilled via public tube wells installed at various locations on the premises of Islamabad.
Driven by changes in the climate over the last couple of years, the inflow of water to Simply Dam has decreased because of over-extraction of water from the ground through tube wells, which has in turn resulted in a decrease in the groundwater table [21]. Islamabad lies at an altitude ranging from 360 to 1538 m from mean sea level. There are four kinds of main sources of water supply to Islamabad: streams, springs, reservoirs, and groundwater. The Capital Development Authority (CDA) has installed approximately 200 tube wells, which are used to supply water to Islamabad.

2.2. Data Sources

The selection of suitable sites for natural aquifer recharge (NAR) is the main factor in the evaluation of hydro resources. Other local influencing factors concern various different perspectives, such as topographic, environmental, technical, and economic [7,12]. The selection of factors is an important stage for recharge site identification [22,23]. A Digital Elevation Model (DEM) with a 12.5-m resolution was downloaded from the Alaska Satellite Facility (ASF) website https://asf.alaska.edu/ on 23 March 2021, and was further utilized to generate thematic maps, such as for slope, drainage density, streams, and lineament density. Furthermore, Sentinal-2B featuring a spatial resolution of 10 m was utilized and processed in a GIS environment for land use on the land cover map. Additionally, a field survey was performed to obtain groundwater table data for which the CDA tube wells data were also collected. The data of soil types were collected by assembling an ensemble of soil samples from the field, and sieve analysis along with hydrometer analysis were performed to extract soil types in Geotech Lab NICE. The rest of the soil data were collected from the CDA soil laboratory. Islamabad population data [2] were obtained from the Pakistan Bureau of Statistics. Table 1 shows the list of factors for this study area, along with the sources.
In the consideration of the abovementioned factors, special focus has been given to their effectiveness for the research region [5]. The factors were considered based on the level of significance to the recharge and extensive literature review. The following seven factors were selected for this research: land use land cover (LULC), drainage density (DD), slope, population density (PD), water table (WT), soil types, and elevation (Table 1).
The above-selected factors have already been widely considered for groundwater recharge potential sites in various studies [13,24,25,26,27,28,29], and they were chosen due to their local influence and the nature of the study area, as Islamabad has a complex natural terrain.

2.3. Preparation of Thematic Maps

Thematic maps for drainage density, slope, water table, soil, population density, land use land cover, and elevation were constructed from satellite and conventional data (Table 1) by using ArcMap 10.5. For the preparation of slope maps, the Alaska satellite facility (ASF) DEM with a 12.5-m resolution was processed in ArcMap 10.5. By using the same DEM, first streams and drainage lines were obtained, and subsequently drainage density was computed in a GIS environment.
To develop the soil map for the study area, 400 soil samples were processed first in the soil laboratory to find out the soil types in sieves, followed by hydrometer analyses of the soil samples. The data were then further processed in ArcMap to generate a thematic map of the soil. The map of population density for the study area was utilized to generate a thematic map for the study area. The thematic map of the water table for natural aquifer recharge sites was constructed using the observations from 170 CDA tube wells. Tube wells data were converted into a spatial map through the kriging method in ArcMap 10.5. A land useland cover map was produced by utilizing Sentinel-2B based on supervised classification. Seven influencing factors were selected for this study area and their thematic map was prepared in ArcMap 10.5. Furthermore, they were reclassified, ranked, and assigned with weights (based on the AHP).

2.3.1. Land Use and Land Cover

Natural aquifer recharge is controlled to a large extent by and use land cover (LULC). In particular, Watershed is significantly influenced by land use land cover for groundwater potential zones [23]. Land use land cover map was prepared by utilizing Sentinel 2B image in ArcMap through supervised classification. Vegetation and agricultural lands allow more infiltration because of pore spaces that can catch and hold water and facilitate water percolation. Therefore, areas covered with vegetation and agricultural area were assigned higher weights for recharge. In contrast, barren land and built-up areas are deemed unsuitable for recharge due to high runoff potentials; hence, they were given lower weights and ranks [15]. The sites on the land use land cover map were classified into six groups (Figure 2a), namely agricultural land, waterbody, built-up area, barren land, vegetation, and parks. Each class was assigned weights and ranked according to its expected performance for recharge sites.

2.3.2. Soil Types

Soil types also have an important impact on natural aquifer recharge. The better the soil quality, the better the result for recharge will be [4]. A soil map was constructed based on analysis of 400 soil sample from various locations in the study area in order to achieve better interpolation results. Soil types play a key role in percolation and infiltration [15]. The soil map for the study area is divided into five classes based on their permeability ratio: gravely clay, sandy clay, silty clay, low plasticity clay, and lean clay (Figure 2b). The gravely and sandy types of clay have high degrees of infiltration and, therefore, were given more weight, whereas low plasticity and lean clay bear low infiltration and, consequently, were given the lowest weighting for recharge.

2.3.3. Water Table

Water table (W) depth is the altitude of the top of the water in the aquifer [30]. Many researchers have adopted water table depth as an indicator for the evaluation of groundwater storage capacity [4]. The study area groundwater depth varied from 15 m to 132 m. Sites on the water table map were reclassified into five groups: (1) <30 m, (2) 31–50 m, (3) 51–75 m, (4) 76–100 m, and (5) 101–132 m (Figure 2c). The higher the depth of the water table renders, the higher the chance of storage capacity or percolation of water through soil pore spaces into the aquifer. In contrast, in areas with less water table depth, soil pore spaces are essentially fully saturated, thus there is very little chance for water to percolate into the aquifer.

2.3.4. Elevation

Elevation is yet another main factor that plays a critical role in locating potential natural aquifer recharge sites. The relation of elevation with groundwater recharge is always inverse proportional. The higher the elevation is, the lower the chances of recharge are, because water flows naturally towards lower elevation areas. Conversely, the lower the elevation is, the higher the chances of infiltration for recharge are [31]. The elevation map was prepared by utilizing 12.5-m resolution DEM.
The range of elevation has been divided into five classes based on the extent of elevation and the corresponding degree in infiltration: (1) 360–494 m, (2) 496–590 m, (3) 697–707 m, (4) 768–908 m, and (5) 999–1538 m (Figure 2d). In this study area, places having high elevations are assigned less weighting and lower ranks because of their lower significance for recharge, whereas areas with low elevations are given more weighting due to their stronger potential for recharge.

2.3.5. Drainage Density

Many researchers have incorporated drainage density into their toolboxes for the determination of potential recharge sites [4,30,32]. Low drainage density areas are covered mostly with high vegetation, which is considered very good for permeability and porosity and bears high infiltration capacity. In contrast, areas with high drainage density generally have less recharge rate [4]. Higher drainage density results in higher runoff, whereas lower drainage density results in lower runoff and likely more chances of recharge [31]. Drainage density is yet another key component that controls the passage of water and the recharge rate. The drainage density is the amount of a watershed that is drained by a stream-channel, and it Drainage density is influenced by several factors, such as the infiltration capacity, vegetation, type of upper surface over the land, and climate conditions [15]. The sites on the drainage density map have been categorized into five classes: (1) 0–0.81 km2, (2) 0.82–1.12 km2, (3) 1.13–1.25 km2, (4) 1.26–1.56 km2, and (5) 1.57–2.37 km2. Higher priority and ranks were assigned to areas with lower drainage density (Figure 2e).

2.3.6. Slope

Slopes directly influence the runoff and infiltration process [4]. A slope map was prepared by utilizing DEM having a 12.5-m resolution for the study area in ArcMap 10.5. Slopes always imply the capability for groundwater recharge because where the land has a gentle slope, it will exhibit stronger effects for recharge and high infiltration for groundwater recharge as a result of low runoff. In contrast, areas with steep slopes bear low permeability and, thus, a lesser extent of recharge [33]. A steep slope area is normally associated with hilly and mountainous geography. Based on weights and ranks, sites on the slope map were divided into five classes: (1) 0°–2° (2) 2°–10° (3) 10°–15° (4) 15°–30°, and (5) >30° (Figure 2f).

2.3.7. Population Density

In general, the larger the population is, the more interferences and overexploitation of groundwater resources there are [34]. Population density is not just a significant factor, but it also plays an important role in the decrease of groundwater resources because population growth will limit the amount of available water per person. Population density has an inversely proportional relationship with groundwater recharge [35]. The findings have also shown that population density is related to the accessibility of groundwater watersheds [22]. The population density map has been incorporated into this study as a new dimension as compared to existing methodologies for natural aquifer recharge potential sites. Population densities were calculated by dividing the total number of people living in the aquifer area. The map was prepared by incorporating the census data of Islamabad from 2017 (Figure 3), which led to dividing the sites into five classes: (1) 0–500 person per km2, (2) 5001–1000 person per km2, (3) 1001–2000 person per km2, (4) 2001–3000 person per km2, and (5) 3001–40,062 person per km2.

2.4. Methodological Overview

Figure 4 describes the methodology adopted in this study for the identification of natural aquifer recharge sites based on multi-criteria decision-making techniques such as AHP, fuzzy logic, and WLC. Figure 4 consists of four stages, as described below.
In the first stage, seven influencing factors for recharge zones were selected.
The second stage consists of data preprocessing and the generation of thematic maps in the ArcGIS environment.
The third stage is where the AHP tool was utilized for weight assignment and the normalization of weights. Selected thematic maps were reclassified into five classes (based on their suitability for aquifer recharge) and each class was assigned weights based on its significance and the corresponding consequences for recharge sites. After the determination of the significance of the local factors, fuzzy logic technique was utilized to standardize the factor maps. All layers were combined using AHP-WLC and fuzzy overlay, and the comparison between them was performed by using suitability index maps for natural aquifer recharge sites.
The fourth stage consists of result validation and execution of the results.

3. Results

3.1. Analytical Hierarchy Process (AHP)

The analytical hierarchy process emerged as one of the most significant approaches in decision making in various parameters, such as site selection, land use allocation, and solid waste management [36]. AHP is a widely proven technique for decision making that is used for pair-wise comparisons of factors to assess and rank their importance level [32]. In this study, the AHP procedure suggested by Saaty (1980) [37] has been used to determine the weights of the selected factors for the identification of recharge sites. To represent the evaluation of relative importance from pairwise factor comparisons in the first step (a), we constructed a square matrix in which each factor is represented by a specified number, and then, by comparing the relative significance between two factors, weights were assigned according to the factor-importance based on the AHP scale (Table 2).
Land use land cover (LULC) plays an important role in the identification of recharge sites, and therefore was placed in the first-row and, correspondingly, the first column of the matrix. The soil was placed in the second position in the pairwise comparison matrix due to the significant influence of its infiltration and permeability volume on natural aquifer recharge. The water table was assigned to the third position as it is the main factor on which the whole study was performed to delineate suitable sites. Elevation was placed in the fourth position as it plays an important role in controlling runoff speed and infiltration. The fifth position was allocated to the drainage density as it can reflect various other influencing factors, such as the streams order and lineament density. The slope was placed at the sixth position as it controlled the density of the water that reaches the Earth’s surface and finally percolates into the ground. The population density was assigned the seventh, i.e., the least important, place as it has less direct impact on groundwater recharge compared with other factors that are utilized in the investigation for suitable sites (Table 3).
In this study, relative priority is evaluated in a scale from 1 to 5 (equal importance to strong importance) to reflect relative importance and to rank the influence of each factor. The reason for using a scale up to 5 is mainly its similarity with the scale from 1 to 5 adopted for the weighted overlay tool during analysis in ArcMap [13]. Another reason to maintain the current priority values (1–5) is that the ambiguity and imprecision of the existing data and predetermined verbal judgments of people make it rather difficult to further refine numerical values for the assessment of the factors.
(b) In the second step of AHP, relative weight for each factor has been calculated by computing an eigenvector. In this case, the eigenvector has been calculated by dividing the individual column values by the column sum of the normalized pairwise comparisons matrix (Table 4) then averaging the row value.
(c) The calculation of the consistency ratio was performed through the principal eigenvalue. The principal eigenvalue is defined as the sum of the eigenvalues. The consistency of the comparison matrix is dependent on the value of the principal eigenvalue as it should be equal to or greater than several selected factors (Table 5).
(d) Finalizing the overall weight of each factor was based on their influence on recharge sites, as shown in table in Section 3.2. A flow chart diagram is shown in (Figure 5) that describes the entire procedure, adopting the criterion that the weight and consistency ratio test should return a value equal to or less than 0.1.
An Excel spreadsheet was used to evaluate the consistency index as defined in Equation (1) and the consistency ratio as in Equation (2), and the results are shown in table in Section 3.2.
CI = ( λ m a x n ) ( n 1 )
where CI is the consistency index; n is the number of factors selected for the research, which was seven in our case; and λmax is the value of principal eigenvalue, which is obtained by taking the average across, as shown in (Table 5). The λ value should be greater than or equal to several factors incorporated in the study.
CR = ( C I ) ( R I )
where CR is a consistency ratio and RI is a random number pre-defined by Professor Saaty in 1980 against each matrix size. If CR is greater than 0.10, its mean weights assigned will be inconsistent, and hence it will need to be revised. A CR value less than 0.10 represents good consistency, and hence weights assigned are deemed acceptable for further analysis. In this study, the resulting CR value that was acquired by assigning the weights is 0.087, which is acceptable, and, in addition, the results are also agreeable. CI is the consistency index, whereas RI is a random index whose value depends on several factors incorporated in research, as shown in the random index table. Finally, all factors were reclassified (standardized) into five classes. Ranks were assigned to sites on reclassified maps from 1 to 5 classes: (1) not suitable, (2) less suitable, (3) moderate, (4) suitable, (5) most suitable, as shown in (Table 6).
The result from a comparison matrix shows that the maximum lambda (λmax) was found to be 7.69, which is greater than the selected number of factors and thus demonstrates a reasonable range. The values of the consistency index and of the random index were observed at 0.12 and 1.32, respectively. In addition, the value of the consistency ratio was 0.087, which is fewer than 0.1. Hence, according to our statistical hypothesis, it validates the consistency of calculated weights (Table 7). Furthermore, the weights for the factors in the comparison matrix reveal that the influence values for the LULC (28%) is the highest among all selected factors. Furthermore, the priority values for soil (21%), water table (21%), elevation (10%), drainage density (9%), slope (7%), and population density (4%) were found and put in order.

3.2. Fuzzy Logic

Fuzzy logic is a useful method that has been utilized in artificial recharge information [38]. In fuzzy logic, the individual class of each factor on the map is defined in a distinct way from those mentioned before and demonstrates a continuous degree of membership. Members of a fuzzy set are normally described by a number between the absolute true (1) and the absolute false (0), which can be viewed as neither true nor false, but varying in a continuous scale from 0 (non-membership) to 1(full-membership). Compared with Boolean logic, usually there is no clean-cut certainty occurring in fuzzy logic [39]. Each class of an individual factor map is defined as per its degree of membership in a range of 0 to 1. Several different operations may be utilized to combine the membership values of each factor map, such as fuzzy OR, fuzzy algebra, fuzzy gamma, fuzzy AND, and fuzzy algebra sum [38].
Fuzzy logic normally works on the basis of two basic principles: in the first step maps are classified by comparing them with each other based on their importance, and in the second step classes are assigned weights between 0 to 1. As there are not any practical constraints for the choice of the membership value of fuzzy logic, there are a variety of operations that can be employed to assign membership value to the classes, such as fuzzy AND, fuzzy OR, fuzzy algorithm, fuzzy gamma, and fuzzy algebra. In this research, the fuzzification algorithm is used because of its high sensitivity in appointing natural recharge areas [38].
Fuzzy logic structure mainly contains in several steps. First, fuzzification of crisp values is performed in the domain of fuzzy logic and rules are defined. In the next step, the fuzzy inference engine implements fuzzified inputs as per pre-defined rules, and in the last step, defuzzification is performed for the fuzzy output values by conversion into crisp values [40]. There are multiple types of fuzzy membership functions, but we utilized the s-shaped, j-shaped, linear, and user-defined membership function for our research, as shown in Figure 6. These membership functions depend on control points like C1 and C2. Water table C1 equal to zero means unsuitable, while C2 equal to 1 means most suitable for recharge.
We interpolate values between any two control points in a user-defined function. In this study, the value of the user-defined function is established using expert judgement, factor influences on recharge, and a thorough literature analysis. The primary characteristic of fuzzy algorithms is sigmoidal, with big or small, monotonically increasing, or decreasing functions that are used to represent values in fuzzy set theories. The example of the above-mentioned s—shaped decreasing algorithm is shown in Equation (3). The fuzzy membership algorithm for increasing is defined in Equation (4).
μ = 1 1 + [ x f 2 ] f 1
In the above-mentioned equations μ = fuzzy membership function; x = feature; and f1 = spread of the transition from a membership value of 1 to 0 and f2 = midpoint, where the membership value is 0.5.
In a fuzzy logic system, fuzzification is performed by converting crisp values into a degree of membership function by using commonly adopted fuzzy membership functions, such as s-shaped, j-shaped, and linear with control points to assign values of suitability. In the case of linear membership type, control point (a) is used to denote the situations less suitable for recharge, while control point (b) is used to denote the situations considered highly suitable. In this study, higher values were assigned to the layers that correspond to high recharge and lower values in-between 0 to 1 (Table 8) were assigned to sites that were less suitable for recharge. Moreover, in the present study, fuzzy logic was applied to construct standardized factors maps (Figure 7).

3.3. Weighted Linear Combination Method

WLC is also known as the conventional overlay technique, which is utilized in most of the previous studies to locate potential sites for groundwater recharge [19]. In weighted linear combination, the relative relevance of the factors is used to determine appropriateness in the spatial multi-criteria evaluation. Consequently, once we have completed the job of assigning weights and the reclassification of the sites on the thematic maps, based on the methods of the AHP, the WLC method can be used to incorporate all the layers [31]. Each standardized component in this study was multiplied by its corresponding weight from AHP. WLC is applied on aggregate suitability maps prepared by each factor after the standardization and assigning of weights to each factor. A weighted linear combination is a spatial multi-criteria technique in which suitability depends on the importance criterion [20] as defined in (Equation (5)).
S I = W i S i
where SI stands for the suitability index, Wi is used to represent the weight of the factors, and Si indicates the standard suitability score for the factors [20]. In this study, AHP has been used to assign weights, and WLC was used to combine all layers to identify a suitable site by overlaying the factor maps.

3.4. Final Suitability Maps

In this study, two suitability index maps have been generated using two different methods. Figure 8a shows the suitability index map from AHP-WLC integration, and Figure 8b represents the suitability index map of the fuzzy overlay. There are five classes—not suitable, less suitable, moderate, suitable, and most suitable—in both suitability index maps, and the area belonging to each class was calculated with the results shown in (Table 9). The comparison of the results from the two approaches is shown in (Figure 9). The area of the ‘not suitable’ class is found to be (144 km2) in the fuzzy suitability index map, whereas in the case of AHP-WLC it is (176 km2). The ‘less suitable’ area was estimated as (110 km2), and the AHP technique gave an area of (94 km2) for the same class.
Furthermore, through fuzzy overlay, the (272 km2) area was found to belong in the ‘moderate class’, and the AHP area in that class was found to be (248 km2). Similarly, an area of (291 km2) was obtained from our computation for the ‘suitable classes’ in the fuzzy overlay, and an area of (339 km2) was obtained by using AHP, which occupies the most area among all classes. The area for the ‘most suitable’ class was estimated as 89 km2 through fuzzy overlay, and an area of 49 km2 falls under the ‘suitable classes’ in the AHP analysis, which holds the least area among all classes.
The sites on the suitability index map constructed from fuzzy overlay were reclassified through equal interval classification methods, and, consequently, reclassification achieved more smooth and refined results than those of the AHP method. This may be associated with the better segregation options of the fuzzy overlay approach as compared with the AHP-WLC.

3.5. Result Validation

To confirm the accuracy of the selected suitable sites for natural aquifer recharge and to correlate the locations on both suitability maps, a field validation procedure has also been carried out. For ground validation, various sites were visited in the study area and compared with both suitability maps. Furthermore, it was also observed during the field validation process that the result of fuzzy overlay was more accurate than that of AHP-WLC and the same when we share with CDA for recharge well construction. Additionally, the accuracy assessment was also carried out on the final fuzzy logic suitability map by selecting 101 random points of each suitability class for ground truthing. Then we verified those random points of each class through reliable data sources, such as Google Earth, along with field visits. The Accuracy assessment map along with the accuracy assessment calculation table are shown in Figure 10 and Table 10, along with Kappa values in Table 11.
Overall Accuracy = Total number of correctly classified pixels/Total number of referenced pixels × 100 = 83/101 × 100
Overall Accuracy = 82.2%
Kappa Coefficient (T)= (TS × TCS) − ∑(Column Total × Row Total)/TS2 − ∑ (Column Total − Row Total) × 100
Kappa Coefficient (T) = 66%
Our results indicate a moderate level of agreement with the actual field locations, demonstrating that the results are reliable enough to be shared for further research work or to be used for the construction of recharge wells on the ground to overcome groundwater crises in Islamabad City.

4. Discussion

Each suitability index map was divided into five equal classes. These classes provide enough options to the water resource engineers and the managers in planning and managing groundwater demand. The suitability maps were developed to divide the area into qualitatively different regions based on their potential and requirements (most depleted, highly populated, and less developed), and on the priorities of the individual factors. The result of both suitability maps shows numerous suitable sites that were validated late through ground visits. During ground validation, it was found that results from fuzzy overlay were more accurate, precise, and refined, compared with those of the AHP-WLC. Several locations of ‘suitable sites’ lie in Islamabad parks. This fact may be associated with the incorporation of data from 400 parks in our study, and it was natural for our procedure to assign a high rank to parks as they have open space and smooth slopes. Similarly, a location classified ‘not suitable’ was also confirmed as one of those located on used land and paved areas.
Both suitability index maps have identified “suitable” areas outside the urban areas. Similarly, both suitability maps mark “not suitable” areas in red spots in urban areas. Hence, both maps consistently show a very small suitability index in the north over Margalla Hills and its surrounding areas. This fact may be explained by the steep slope and high altitude in the northern part of Islamabad. Similarly, both the suitability index maps exhibit a high suitability index in the east and west parts of Islamabad because of the smooth slope along with low elevations and gravelly soil types. The suitability index maps also indicate “not suitable” areas in the southern part of Islamabad, which reflects the land use, the filling of built-up area, and the highly populated (dense) areas where less weights were assigned as these areas have less capacity for infiltration. Both maps have displayed, overall, well-spread, Moderate classes areas, which dominate all the other classes.
Based on both suitability maps, it is also predicted that the most suitable class will count for less area than the suitable and moderate classes (Figure 9) because most of the study area consists of mountainous rocks and silty clay, which are less suitable for groundwater recharge. In this study, it has also been observed that fuzzy overlay provides more refined, smooth, and robust results than those from the AHP-WLC, which, in the belief of the authors, is because the AHP is unable to capture the subjectivity of expert judgments as this verbal judgment that has been subsequently converted into crisp values.

Construction of Recharge Wells at Suitable Sites

According to the analysis of this study, suitable sites were recommended and forwarded for suggestion to Capital Development Authority (CDA) Islamabad for the construction of recharge wells. Based on the fuzzy overlay finding and suggestion of this study, the recharge well has been constructed by the CDA, Islamabad. In addition, eight recharge wells were constructed out of 80 in the first phase, while the rest are currently under construction. The technical design, coral design, and constructed recharge wells are shown in Figure 11. At a suitable location for natural aquifer recharge, where the surface runoff is more along the catchment area, small ponds have also been constructed with recharge wells to fully utilized the rainwater, as small ponds are economical as compared to recharge wells. It is anticipated that the groundwater level of the study area will not only be stabilized, but will also increase over time.

5. Conclusions

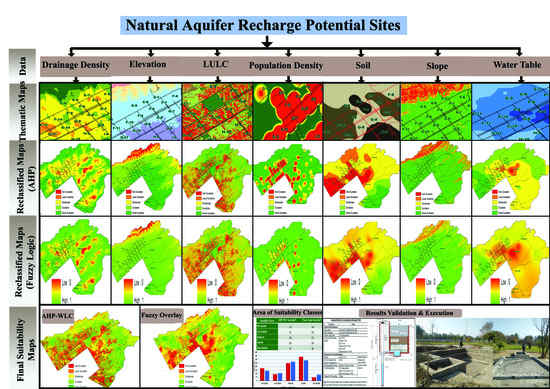
One of the most important steps of water resource management is the selection of optimal sites for natural aquifer recharge. As the water table of Islamabad is depleting at a very fast rate, the present study therefore focuses on the identification of potential sites for natural aquifer recharge by using RS and GIS techniques. To achieve the objective mentioned above, in the current approach we have incorporated seven local influencing factors, including land use land cover (LULC), drainage density, slope, population density, water table, elevation, and soil types. These factors have been evaluated based on their significance and potential contribution using the analytical hierarchy process (AHP). Furthermore, these factors have been combined by using two different techniques (AHP-WLC, fuzzy overlay) to obtain the suitability map. Finally, we have combined both the suitability index maps (generated from AHP and fuzzy overlay) through the intersection method to get suitable sites for natural aquifer recharge. From these observations, it is then concluded that RS, GIS, and MCDM techniques are powerful tools for the identification of suitable sites for natural aquifer recharge. It is also clear that the utilization of AHP and fuzzy logic along with the weighted linear combination method is more responsive, cost-effective, less time-consuming, and resource-friendly. Based on the findings of this study, it is suggested that special focus should be imposed on sectorial areas where water resources are at high risk and the demand for water has been exceeded. Prospectively, private tube wells along with hand pump data may be incorporated for more accurate predictions of water table depth at various locations of the area. It is also recommended that high-resolution imagery along with machine learning should be adopted to further enhance the accuracy of the outcomes. Prospectively, the present study will prove insightful for policymakers for a better management of the groundwater resources in perspective of distribution, exploration, and recharge aquifers based on the suitable sites. Additionally, the proposed approach may be applicable to the identification of suitable sites for natural aquifer recharge sites in developing as well as developed countries.

Author Contributions

Writing original draft and preparation, formal analysis, methodology, F.A.; writing original draft and preparation, methodology, investigation, supervision, M.A.; writing-review and editing, resources, R.Z. and S.A.; review the manuscript and English correction, A.R. and K.-A.N.; original draft extensive editing and finalizing, H.-W.V.Y.; funding, original draft extensive editing and finalizing, Y.-A.L. All authors have read and agreed to the published version of the manuscript.

Funding

This work was supported by the Ministry of Science and Technology, Taiwan, under Grants MOST 10-2111-M-008-008 and 110-2634-F-008-008.

Acknowledgments

This research was collectively assisted by (SCEE), NUST Islamabad Pakistan, and Center for Space and Remote Sensing Research, National Central University, Taiwan.

Conflicts of Interest

The authors declare no conflict of interest.

References

  1. Qureshi, A.S. Groundwater Governance in Pakistan: From Colossal Development to Neglected Management. Water 2020, 12, 3017. [Google Scholar] [CrossRef]
  2. Available online: https://www.pbs.gov.pk/sites/default/files/population/2017/tables/islamabad/Table01d.pdf/Table03d.pdf. (accessed on 10 April 2022).
  3. Khan, S.; Guan, Y.; Khan, F.; Khan, Z. A Comprehensive Index for Measuring water Security in an Urbanizing World: The Case of Pakistan’s Capital. Water 2020, 12, 166. [Google Scholar] [CrossRef] [Green Version]
  4. Xu, G.; Su, X.; Zhang, Y.; You, B. Identifying Potential Sites for Artificial Recharge in the Plain Area of the Daqing River Catchment Using GIS-Based Multi-Criteria Analysis. Sustainability 2021, 13, 3978. [Google Scholar] [CrossRef]
  5. Aslan, V.; Çelik, R. Integrated Gis-Based Multi-Criteria Analysis for Groundwater Potential Mapping in the Euphrates’s Sub-Basin, Harran Basin, Turkey. Sustainability 2021, 13, 7375. [Google Scholar] [CrossRef]
  6. Sarhadi, A.; Burn, D.H.; Johnson, F.; Mehrotra, R.; Sharma, A. Water resources climate change projections using supervised nonlinear and multivariate soft computing techniques. J. Hydrol. 2016, 536, 119–132. [Google Scholar] [CrossRef] [Green Version]
  7. Sadaf, R.; Mahar, G.A.; Younes, I. Appraisal of Groundwater Potential through Remote Sensing in River Basin, Pakistan. Int. J. Econ. Environ. Geol. 2018, 9, 25–32. [Google Scholar]
  8. Arshad, A.; Zhang, Z.; Zhang, W.; Dilawar, A. Mapping Favorable Groundwater Potential Recharge Zones Using a GIS-Based Analytical Hierarchical Process and Probability Frequency Ratio Model: A Case Study from an Agro-Urban Region of Pakistan. Geosci. Front. 2020, 11, 1805–1819. [Google Scholar] [CrossRef]
  9. Arefin, R. Groundwater potential zone identification using an analytic hierarchy process in Dhaka City, Bangladesh. Environ. Earth Sci. 2020, 79, 268. [Google Scholar] [CrossRef]
  10. Sitorus, F.; Cilliers, J.J.; Brito-Parada, P.R. Multi-criteria decision making for the choice problem in mining and mineral processing: Applications and trends. Expert Syst. Appl. 2019, 121, 393–417. [Google Scholar] [CrossRef]
  11. Pathmanandakumar, V.; Thasarathan, N.; Ranagalage, M. An Approach to Delineate Potential Groundwater Zones in Kilinochchi District, Sri Lanka, Using GIS Techniques. ISPRS Int. J. Geo-Inf. 2021, 10, 730. [Google Scholar] [CrossRef]
  12. Khudhair, M.A.; Sayl, K.N.; Darama, Y. Locating Site Selection for Rainwater Harvesting Structure Using Remote Sensing and GIS. IOP Conf. Ser. Mater. Sci. Eng. 2020, 881, 012170. [Google Scholar] [CrossRef]
  13. Shao, Z.; Jahangir, Z.; Yasir, Q.M.; Atta-Ur-rahman; Mahmood, S. Identification of Potential Sites for a Multi-Purpose Dam Using a Dam Suitability Stream Model. Water 2020, 12, 3249. [Google Scholar] [CrossRef]
  14. Singh, S.K.; Zeddies, M.; Shankar, U.; Griffiths, G.A. Potential Groundwater Recharge Zones within New Zealand. Geosci. Front. 2019, 10, 1065–1072. [Google Scholar] [CrossRef]
  15. Zghibi, A.; Mirchi, A.; Msaddek, M.H.; Merzougui, A.; Zouhri, L.; Taupin, J.D.; Chekirbane, A.; Chenini, I.; Tarhouni, J. Using Analytical Hierarchy Process and Multi-Influencing Factors to Map Groundwater Recharge Zones in a Semi-Arid Mediterranean Coastal Aquifer. Water 2020, 12, 2525. [Google Scholar] [CrossRef]
  16. AL-Shammari, M.M.A.; L-Shamma’a, A.M.A.; al Maliki, A.; Hussain, H.M.; Yaseen, Z.M.; Armanuos, A.M. Integrated Water Harvesting and Aquifer Recharge Evaluation Methodology Based on Remote Sensing and Geographical Information System: Case Study in Iraq. Nat. Resour. Res. 2021, 30, 2119–2143. [Google Scholar] [CrossRef]
  17. Alikhanov, B.; Juliev, M.; Alikhanova, S.; Mondal, I. Assessment of Influencing Factor Method for Delineation of Groundwater Potential Zones with Geospatial Techniques. Case Study of Bostanlik District, Uzbekistan. Groundw. Sustain. Dev. 2021, 12, 100548. [Google Scholar] [CrossRef]
  18. Kumar, M.; Singh, P.; Singh, P. Fuzzy AHP Based GIS and Remote Sensing Techniques for the Groundwater Potential Zonation for Bundelkhand Craton Region, India. Geocarto Int. 2021, 37, 6671–6694. [Google Scholar] [CrossRef]
  19. Azizur, R.M.; Rusteberg, B.; Gogu, R.C.; Ferreira, J.P.L.; Sauter, M. A New Spatial Multi-Criteria Decision Support Tool for Site Selection for Implementation of Managed Aquifer Recharge. J. Environ. Manag. 2012, 99, 61–75. [Google Scholar] [CrossRef]
  20. Zarin, R.; Azmat, M.; Naqvi, S.R.; Saddique, Q.; Ullah, S. Landfill Site Selection by Integrating Fuzzy Logic, AHP, and WLC Method Based on Multi-Criteria Decision Analysis. Environ. Sci. Pollut. Res. 2021, 28, 19726–19741. [Google Scholar] [CrossRef]
  21. Sohail, M.T.; Mahfooz, Y.; Azam, K.; Yen, Y.; Genfu, L.; Fahad, S. Impacts of Urbanization and Land Cover Dynamics on Undergroundwater in Islamabad, Pakistan. Desalination Water Treat. 2019, 159, 402–411. [Google Scholar] [CrossRef]
  22. Ahmed, R.; Sajjad, H. Analyzing Factors of Groundwater Potential and Its Relation with Population in the Lower Barpani Watershed, Assam, India. Nat. Resour. Res. 2018, 27, 503–515. [Google Scholar] [CrossRef]
  23. Ahmed, A.A.; Shabana, A.R. Integrating of Remote Sensing, GIS and Geophysical Data for Recharge Potentiality Evaluation in Wadi El Tarfa, Eastern Desert, Egypt. J. Afr. Earth Sci. 2020, 172, 103957. [Google Scholar] [CrossRef]
  24. Achu, A.L.; Thomas, J.; Reghunath, R. Multi-Criteria Decision Analysis for Delineation of Groundwater Potential Zones in a Tropical River Basin Using Remote Sensing, GIS and Analytical Hierarchy Process (AHP). Groundw. Sustain. Dev. 2020, 10, 100365. [Google Scholar] [CrossRef]
  25. Chaudhary, P.; Chhetri, S.K.; Joshi, K.M.; Shrestha, B.M.; Kayastha, P. Application of an Analytic Hierarchy Process (AHP) in the GIS Interface for Suitable Fire Site Selection: A Case Study from Kathmandu Metropolitan City, Nepal. Socio-Econ. Plan. Sci. 2016, 53, 60–71. [Google Scholar] [CrossRef]
  26. Jasrotia, A.S.; Majhi, A.; Singh, S. Water Balance Approach for Rainwater Harvesting Using Remote Sensing and GIS Techniques, Jammu Himalaya, India. Water Resour. Manag. 2009, 23, 3035–3055. [Google Scholar] [CrossRef]
  27. Kardan Moghaddam, H.; Dehghani, M.; Kivi, Z.R.; Moghaddam, H.K.; Hashemi, S.R. Efficiency Assessment of AHP and Fuzzy Logic Methods in Suitability Mapping for Artificial Recharging (Case Study: Sarbisheh Basin, Southern Khorasan, Iran). Water Harvest. Res. 2017, 2017, 57–67. [Google Scholar] [CrossRef]
  28. Pedrero, F.; Albuquerque, A.; Monte, H.M.D.; Cavaleiro, V.; Alarcón, J.J. Application of GIS-Based Multi-Criteria Analysis for Site Selection of Aquifer Recharge with Reclaimed Water. Resour. Conserv. Recycl. 2011, 56, 105–116. [Google Scholar] [CrossRef]
  29. Singh, B. Analytical Hierarchical Process (AHP) and Fuzzy Ahp Applications—A Review Paper. Int. J. Pharm. Technol. 2016, 8, 4925–4946. [Google Scholar]
  30. Behroozmand, A.A.; Auken, E.; Knight, R.; Behroozmand, A.A.; Knight, R. Assessment of Managed Aquifer Recharge Sites Using a New Geophysical Imaging Method; Assessment of Managed Aquifer Recharge Sites Using a New Geophysical Imaging Method. Vadose Zone J. Adv. Crit. Zone Sci. 2019, 18, 1–13. [Google Scholar] [CrossRef] [Green Version]
  31. Salar, S.G.; Othman, A.A.; Hasan, S.E. Identification of Suitable Sites for Groundwater Recharge in Awaspi Watershed Using GIS and Remote Sensing Techniques. Environ. Earth Sci. 2018, 77, 701. [Google Scholar] [CrossRef]
  32. Mahmoudi, M.; Aydi, A.; Ibrahim, H. Site Selection for Artificial Recharge with Treated Wastewater with the Integration of Multi-Criteria Evaluation and ELECTRE III. Environ. Sci. Pollut. Res. 2021, 28, 46748–46763. [Google Scholar] [CrossRef] [PubMed]
  33. Aluko, O.E.; Igwe, O. An Integrated Geomatics Approach to Groundwater Potential Delineation in the Akoko-Edo Area, Nigeria. Environ. Earth Sci. 2017, 76, 240. [Google Scholar] [CrossRef]
  34. Parizi, E.; Hosseini, S.M.; Ataie-Ashtiani, B.; Simmons, C.T. Normalized Difference Vegetation Index as the Dominant Predicting Factor of Groundwater Recharge in Phreatic Aquifers: Case Studies across Iran. Sci. Rep. 2020, 10, 17473. [Google Scholar] [CrossRef] [PubMed]
  35. Döll, P. Vulnerability to the Impact of Climate Change on Renewable Groundwater Resources: A Global-Scale Assessment. Environ. Res. Lett. 2009, 4, 035006. [Google Scholar] [CrossRef]
  36. Lentswe, G.B.; Molwalefhe, L. Delineation of Potential Groundwater Recharge Zones Using Analytic Hierarchy Process-Guided GIS in the Semi-Arid Motloutse Watershed, Eastern Botswana. J. Hydrol. Reg. Stud. 2020, 28, 100674. [Google Scholar] [CrossRef]
  37. Saaty, T. The Analytic Hierarchy Process (AHP) for Decision Making; McGraw-Hill: Kobe, Japan, 1980. [Google Scholar]
  38. Mahdavi, A.; Tabatabaei, S.H.; Mahdavi, R.; Emamzadei, M.R.N. Application of Digital Techniques to Identify Aquifer Artificial Recharge Sites in GIS Environment. Int. J. Digit. Earth 2013, 6, 589–609. [Google Scholar] [CrossRef] [Green Version]
  39. Ghayoumian, J.; Saravi, M.M.; Feiznia, S.; Nouri, B.; Malekian, A. Application of GIS Techniques to Determine Areas Most Suitable for Artificial Groundwater Recharge in a Coastal Aquifer in Southern Iran. J. Asian Earth Sci. 2007, 30, 364–374. [Google Scholar] [CrossRef]
  40. Ghazavi, R.; Babaei, S.; Erfanian, M. Recharge wells site selection for artificial groundwater recharge in an urban area using fuzzy logic technique. Water Resour. Manag. 2018, 32, 3821–3834. [Google Scholar] [CrossRef]
Figure 1. Location of the study area (Islamabad).
Remotesensing 14 06051 g001
Figure 2. Criteria/factors maps (a) LULC, (b) soil (c) water table, (d) elevation, (e) drainage density, and (f) slope.
Remotesensing 14 06051 g002
Figure 3. Population Density.
Remotesensing 14 06051 g003
Figure 4. Methodology flow chart for natural aquifer recharge sites.
Remotesensing 14 06051 g004
Figure 5. AHP flow chart for the consistency ratio test.
Remotesensing 14 06051 g005
Figure 6. Fuzzy membership functions for factor standardization.
Remotesensing 14 06051 g006
Figure 7. Factor map for fuzzy logic (right) and AHP (left) including (a) LULC (b) soil types (c) water table (d) elevation (e) drainage density (f) slope (g) population density.
Remotesensing 14 06051 g007aRemotesensing 14 06051 g007bRemotesensing 14 06051 g007c
Figure 8. Suitability map obtained from AHP-WLC (a) and fuzzy logic (b).
Remotesensing 14 06051 g008
Figure 9. Area of AHP-WLC vs. Fuzzy logic method.
Remotesensing 14 06051 g009
Figure 10. Accuracy assessment Map.
Remotesensing 14 06051 g010
Figure 11. Technical design, coral design, and constructed recharge well on suitable sites.
Remotesensing 14 06051 g011
Table 1. List of factors used and their data sources.
FactorsSources
LULCSentinal-2B
Population DensityPakistan Bureau of Statistics
Water TableCDA, Field Survey
Drainage DensityDEM (ASF)
SlopeDEM (ASF)
Soil TypesLab NICE, CDA
ElevationDEM (ASF)
Table 2. Thomas Saaty 1–9 Scale for AHP Pairwise Comparison.
ScaleInverse Value Decimal ValueDescription of Preferences
11/11.000Equal Importance
21/20.500Equally to Moderate
31/30.333Moderate Importance
41/40.250Moderately to Strong
51/50.200Strong Importance
61/60.167Strongly to Very Strong
71/70.143Very Strong Importance
81/80.125Very Strongly to Extreme
91/90.111Extreme Importance
Table 3. Pair-wise comparison matrix.
FactorsSoilWTLULCDDSlopeElevationPD
Soil111/53535
WT1112335
LULC5112335
DD1/31/21/2121/32
Slope1/51/31/31/2113
Elevation1/31/31/33113
PD1/51/51/51/21/31/31
Table 4. Normalized pairwise comparison matrix.
FactorsSoilWTLULCDDSlopeElevationPDEigen VectorFactor Influence %
Soil0.120.230.060.250.330.260.210.2120.7%
WT0.120.230.280.170.200.260.210.2120.9%
LULC0.620.230.280.170.200.260.210.2828.0%
DD0.040.110.140.080.130.030.080.098.9%
Slope0.020.080.090.040.070.090.130.077.3%
Elevation0.040.080.090.250.070.090.130.1110.5%
PD0.020.020.020.060.040.040.040.043.7%
Total Effect1.001.001.001.001.001.001.001.00100
Table 5. Consistency Ratio Matrix.
FactorsSoilWTLULCDDSlopeElevationPDWeighted Sumλmax
Soil0.210.210.060.270.370.320.191.617.75
WT0.210.210.280.180.220.320.191.597.64
LULC1.040.210.280.180.220.320.192.428.67
DD0.070.100.140.090.150.040.070.667.41
Slope0.040.070.090.040.070.110.110.547.36
Elevation0.070.070.090.270.070.110.110.797.49
PD0.040.040.060.040.020.040.040.287.53
Table 6. Suitability ranks for Sub-criteria of selected maps.
LayersCategorySuitability ValuesSuitability Ranking
LULCAgriculture landModerate3
WaterNot Suitable1
Bulit Up areaNot Suitable1
Barren LandModerate4
Low VegetationSuitable4
High vegetationMost Suitable5
ParksMost Suitable5
SoilGravelly ClayMost Suitable5
Sandy ClaySuitable4
Silty ClayModerate3
Low Plasticity ClayLess Suitable2
Lean ClayNot Suitable1
Water TableUp to 30Not Suitable1
30–50Less Suitable2
50–75Moderate3
75–100Suitable4
Above 100Most Suitable5
Drainage Density (Per Km2)
00–0.8Most Suitable5
0.8–1.12Suitable4
1.12–1.25Moderate3
1.25–1.56Less Suitable2
Above 1.56Not Suitable1
Slope (Degree)0°–2°Suitable4
2°–10°Most Suitable5
10°–15°Moderate3
15°–30°Less Suitable2
Above 30°Not Suitable1
Population Density (Per Km2)Below 500Most Suitable5
501–1000Suitable4
1001–2000Moderate3
2001–3000Less Suitable2
Elevation (m)Above 3000Not Suitable1
360–494Most Suitable5
495–596Suitable4
597–767Moderate3
768–998Less Suitable2
999–1538Not Suitable1
Table 7. Final weights and consistency measurement of factors using AHP.
S/NFactorWeightsRankLambdaConsistency Index & RIConsistency Ratio
1LULC28%17.690.12, 1.320.087 < 0.1 acceptable
2Soil21%2
3Water Table21%3
4Elevation10%4
5Drainage Density9%5
6Slope7%6
7Population Density4%7
Table 8. Fuzzy set memberships function with controls points used for natural aquifer recharge.
LayersSubcategoryControl Points (a)Control Points (b)Fuzzy Membership Value/Type
LULCAgriculture Land 0.5
WaterUser Define0
Built Up Area 0
Barren Land 0.6
Low Vegetation/Parks 0.6
High Vegetation 0.8
Parks 0.88
SoilGravelly ClayUser Define0.92
Sandy Clay 0.8
Silty Clay 0.6
Low Plasticity Clay 0.3
Lean Clay 0
Water Table15 m150 mLinear (S-Shaped Increasing)
Drainage Density25Small
Slope2 deg90 degLinear (S-Shaped Decreasing)
Population Density40,000500Linear (S-Shaped Decreasing)
Elevation360 m1550 mLinear (J-Shaped Increasing)
Table 9. Area of suitability classes from both the methods.
Suitability ClassesAHP Area (km2)Fuzzy Logic Area (km2)
Not Suitable176144
Less Suitable94110
Moderate248272
Suitable339291
Most Suitable4989
Table 10. Accuracy Assessment Calculation.
Suitability ClassesNot SuitableLess SuitableModerateSuitableMost SuitableTotal (User)
Not Suitable19033025
Less Suitable090009
Moderate10186025
Suitable12121025
Most Suitable00011617
Total (Producer)2111193116101
Table 11. Accuracy Assessment Calculation.
Kappa Value Level of Agreement% of Data That Are Reliable
0–0.20None0–4%
0.21–0.39Minimal4–15%
0.40–0.59Weak15–35%
0.60–0.79Moderate35–63%
0.80–0.90Strong64–81%
Above 0.90Almost Perfect82–100%
Publisher’s Note: MDPI stays neutral with regard to jurisdictional claims in published maps and institutional affiliations.

