
Mapping of Forest Biomass in Shangri-La City Based on LiDAR Technology and Other Remote Sensing Data
by
 ,
,
Yuncheng Deng
1,2,3,
Jiya Pan
1,2,3,
Jinliang Wang
1,2,3,*,
Qianwei Liu
1,2,3 and
Jianpeng Zhang
1,2,3 1
Faculty of Geography, Yunnan Normal University, Kunming 650500, China
2
Key Laboratory of Resources and Environmental Remote Sensing for Universities in Yunnan Kunming, Kunming 650500, China
3
Center for Geospatial Information Engineering and Technology of Yunnan Province, Kunming 650500, China
*
Author to whom correspondence should be addressed.
Remote Sens. 2022, 14(22), 5816; https://doi.org/10.3390/rs14225816
Submission received: 28 September 2022
/
Revised: 9 November 2022
/
Accepted: 13 November 2022
/
Published: 17 November 2022
(This article belongs to the Special Issue Lidar for Environmental Remote Sensing: Theory and Application)
Abstract
:Forest ecosystems can be regarded as huge carbon sinks. In order to effectively assess carbon balance in such ecosystems, rapid and accurate estimation of the aboveground biomass of a forest is critically needed. However, the current methods for biomass estimation and mapping are of limited spatial resolution and mostly depend on large numbers of measurements. In order to obtain better biomass estimation outcomes with higher spatial resolution, a rapid method is introduced for region-scale biomass estimation in alpine and canyon areas using space-borne light detection and ranging (LiDAR) data and optical remote-sensing images. Specifically, we explored alpine and canyon areas in Shangri-La City in China using space-borne LiDAR data from ICESAT-2 and optical remote-sensing images from Landsat8 OLI, Sentinel-2, and Microwave remote sensing Sentinel-1. An extrapolation model of the forest canopy heights in these areas was constructed with a 30-m resolution of continuous canopy height outputs. For continuously estimating the diameter at breast height (DBH) in Shangri-La City, a tree height-DBH growth model was constructed based on the LiDAR and remote-sensing measurements. Finally, based on the average DBH of the explored forests, a model was constructed for estimating and mapping the aboveground biomass and carbon storage in Shangri-La with a spatial resolution of 30 m. The results show that the forest canopy height in Shangri-La City is mainly in the range of 2.82–30.96 m, and that the estimation accuracy is verified by the LiDAR-based canopy height model (CHM) with a coefficient of determination of R2 = 0.7143. The inversion results were still largely affected by geospatial location factors (longitude, latitude), terrain factors (slope, elevation), and vegetation indices (NBR, NDGI, NDVI). Based on the relationship between the tree height and the DBH, the DBH of trees in Shangri-La City was estimated to be mainly in the range of 20 cm to 30 cm, and this estimate was verified by actual measurements with R2 greater than 0.7 all. Finally, the established model estimated the aboveground forest biomass and carbon storage of the study area of Shangri-La City in 2020 to be 1.28 × 10⁸ t and 6.41 × 10⁷ t, respectively. These estimates correspond to total accuracies of 92.28%, respectively.
1. Introduction
Forests are terrestrial natural ecosystems with highly complex structures and functions. Forests represent important strategic resources for world countries, and forests play an important role in water and soil conservation, carbon balance, oxygen release, climate regulation, environmental purification, and biodiversity protection [1]. Numerous factors have been considered in the evaluation of conditions of forest ecosystems. In particular, forest biomass is a key factor for evaluating carbon sequestration potential and investigating global climate changes [2,3]. In fact, the effectiveness of sustainable ecosystem development and regional carbon cycle management significantly depends on the accurate and convenient estimation of the forest biomass and carbon storage, as well as the identification of the influence of these two factors on ecological environmental changes.
The biomass of a single tree can be accurately evaluated through a direct manual measurement approach. However, this approach requires considerable manpower and material resources, and may even lead to ecosystem damage [4,5]. These drawbacks can be avoided through several remote-sensing approaches (such as those based on optical or microwave technologies), which save time and effort and enable large-scale estimation of the forest biomass and carbon storage [6,7,8]. Nevertheless, remote sensing technologies have different limitations. For example, the quality of the data collected through optical remote sensing can be greatly degraded by cloudy and rainy weather conditions, and the poor penetration of light rays in forests. So, this type of data cannot typically reveal the structural details of a forest canopy and lower layers. Also, although microwave remote sensing can overcome the influence of weather conditions, and the microwave backscattering coefficient is significantly correlated with the trunk biomass, the microwave remote sensing data is still prone to signal saturation [9,10,11].
Earlier studies demonstrated a strong correlation between the forest biomass and the canopy height, and Wang et al. [12] particularly established a biomass estimation model based on the canopy height. The canopy height and other parameters of the forest vertical structures can be remarkably obtained through the highly-penetrative light detection and ranging (LiDAR) technology. In particular, small-spot LiDAR data can be highly accurate, but are of limited coverage and excessively large amounts. Moreover, although space-borne large-spot LiDAR can be used to obtain forest canopy information in a large area, this technology exhibits low spatial resolution, discontinuous sampling, and limited applicability at regional scales [5]. In order to alleviate the sampling discontinuity problem, space-borne LiDAR data was commonly combined with optical remote-sensing images to obtain continuous canopy height information [13]. Wang et al. [14] used waveform data correction based on the GeoScience Laser Altimeter System (GLAS) waveform data correction and the Moderate Resolution Imaging Spectroradiometer (MODIS) data in order to estimate the average vegetation height in Northeast China. Lefsky et al. [15] used the GLAS waveform range and the topographic data of the Shuttle Radar Topography Mission (SRTM) in order to construct a multiple regression model for canopy height estimation in forests. The obtained height data was used to estimate the aboveground biomass. Naesset and Gobakken [16] estimated the biomass of forest plots in Northern Norway using the centile height variable and the canopy density variable of LiDAR echo data. A regression model was constructed by taking these two variables as independent variables, the statistical characteristics and the age of each plot as virtual variables, and the tree species as continuous variables. Huang et al. [17] used airborne LiDAR and stepwise regression modeling to estimate the biomass of a GLAS spot, establish a regression relationship with a GLAS3 waveform index, and thus map the aboveground biomass (AGB) in the whole study area.
Nevertheless, there are still several gaps that need to be filled in the current methodology. First of all, the current methods for biomass distribution mapping are of low spatial resolution, typically within 500–1000 m, and obviously high-resolution biomass distribution mapping is still needed. Secondly, few studies are available on canopy height inversion models for the alpine and canyon areas. Thirdly, most remote-sensing-based biomass estimation methods require the collection of large numbers of field measurements.
The aforementioned gaps can be filled in through the combination of LiDAR data and optical remote-sensing images. We use such a combination for large-scale high-resolution estimation of the canopy height and the forest biomass. In this work, the LiDAR data is ATL08 spot data obtained from the ICESAT-2 satellite for Shangri-La City (Northwestern Yunnan Province, China). Remote-sensing images were obtained from optical remote sensing data like Landsat 8 OLI, Sentinel-2, and microwave remote sensing data like Sentinel-1. These two types of data were used along with other auxiliary data in order to construct a canopy height extrapolation model and thus achieve high-resolution canopy height inversion for the alpine and canyon areas of Shangri-La City. The relationship between the tree height and the DBH was established based on measurements of these two quantities, and thus high-resolution mapping of the average DBH in Shangri-La City was completed. Finally, using the biomass scale equation, the aboveground biomass and carbon storage were estimated for the forests in Shangri-La City.
2. Materials and Methods
2.1. Study Area
The study area in our work was selected to be Shangri-La, Diqing Tibetan Autonomous Prefecture, Yunnan Province, China. Shangri-La is a typical alpine and canyon area with high mountains and steep valleys. This area is located in the eastern part of the Longitudinal Valley area of the Three Parallel Rivers in the Hengduan Mountains on the southeastern edge of the Qinghai-Tibet Plateau. In fact, Shangri-La is a part of the parallel-flow area of the three rivers of the Salween (Nujiang), the Mekong (Lancangjiang), and the River of Golden Sand (Jinshajiang). The geographical coordinates of this study area are 99°22′–100°19′E, 26°52′–28°52′N (See Figure 1). The altitude within the area varies widely from low to high values, with significantly different weather conditions. The area has essentially a montane cold temperate monsoon climate, with distinct dry and wet seasons, where the wet rainfall season is mainly from June to October. Moreover, the geomorphic structures in the study area are mainly mountains, basins, plateaus, and river valleys. As well, the terrain is low in the southeast and high in the northwest, with a maximum elevation difference of 4042 m and an average altitude of 3459 m [18]. Furthermore, the forest coverage rate is about 74.99%, and the forest ecosystem is rich and well-preserved. The main tree species are Picea asperata Mast., Abies fabri (Mast.) Craib, Pinus densata Mast., Pinus Yunnanensis, and Quercus Sichuanensis Aquifolioides Rehd. Et Wils.
Due to the special topographic and geomorphic conditions of the study area, the quality of the data obtained by the satellite remote-sensing sensors in this area is relatively poor. Actually, because of the special topographic and climatic conditions and the excessive human activities, Shangri-La City suffers from severe soil erosion, and poor ecological security. This situation makes Shangri-La City one of the most fragile ecological environment areas in China [19,20,21]. In recent years, with the implementation of relevant policies, regulations, and governance measures, both the ecological environment quality and the ecological security in this city have been improved.
2.2. Data Description and Processing
2.2.1. ICESat-2/ATL08
The ICESat-2 satellite (Ice, Cloud, and land Elevation Satellite-2) is equipped with the Advanced Topographic Laser Altimeter System (ATLAS), and is a sequel to the ICESat satellite launched in 2003. The Geoscience Laser Altimeter System (GLAS) carried by ICESat has a sensitive single-photon detector. The higher pulse repetition rate can lead to the acquisition of photon point clouds with smaller light spots and higher densities. Then, fine three-dimensional surface measurements can be collected and used to estimate the vegetation height and biomass in a large area. In fact, ICESat-2 was launched in 2018 to monitor changes in ice sheets, glacier elevation, sea ice freeboard, and forest heights. The ICESat-2/ATLAS architecture provides 21 standard data types, with four levels each. Among these types, the level-3 ATL08 data represents data of the terrestrial vegetation, including the canopy height, the canopy cover, the surface slope, roughness, and, if available, the apparent reflectance [22].
The ICESAT-2 orbit has an altitude of about 500 km, an inclination angle (i.e., satellite’s orbit tilt around the Earth) of 92°, and an observation coverage of 88°S to 88°N. This satellite has a repetition period of 91 days, with 1387 orbits per cycle. The ATLAS system is equipped with two laser systems, where usually only one of which is in operation. Each laser system can emit a single pulse (532 nm) at a 10-kHZ repetition rate with a pulse width of 1.5 ns, and can thus scan spots with 17 m in diameter and 0.7 m of inter-spot separation.
For our study, we collected all ATL08 data captured by ICESat-2 for Shangri-La City from January to December 2020. The collected data samples include those of the left and right orbits for 6 laser beams (GT1L, GT1R, GT2L, GT2R, GT3L, GT3R) and 115 spectral bands. The original data was stored in the H5 format. In order to better ensure the accuracy of forest height inversion results, ATL08 data were screened: (1) According to the signal-to-noise ratio label of ICESat-2 satellite product, thresholds were set for low signal-to-noise ratio (<3) was deleted; (2) To reduce the influence of cloud, remove the cloud affected spots (cloud_flag_atm < 2), and screen ICESat-2 data with the distance between ground elevation and reference ground elevation less than 50 m; (3) Remove data with greater uncertainty of forest height (h_canopy_uncertainty = 3.4028235 × 1038) [23]. Based on this, the 95th percentile parameter of canopy height (canopy_h_metrics (95)) was extracted for forest height inversion. The experimental Data used in this paper are ATL08 products of the ICESat-2 satellite [24,25], which was publicly released in NSIDC (National Snow & Ice Data Center (Boulder, CO, USA)). The free download site is https://nsidc.org/data/icesat-2/data sets (accessed on 6 June 2022).
2.2.2. Optical Remote Sensing and Microwave Remote Sensing Data
The optical remote-sensing data used in this study was collected from three satellites, namely, Landsat 8 OLI, Sentinel-2, and microwave data Sentinel-1. The obtained image data samples were first processed using the Google Earth Engine (GEE), which is a remote-sensing cloud-computing platform. Any image with a cloud cover of less than 5% within the time period from January 2020 to December 2020 was selected (following the same procedure for the space-borne LiDAR data). Further data processing steps were carried out: radiometric calibration, atmospheric correction, image mosaicking, geometric correction, and image cropping. Most of the images processed within the GEE can be retrieved by clipping according to the vector range of the research area.
2.2.3. SRTM DEM
The digital elevation model (DEM) data used in this study is the SRTM 1 data released by the National Aeronautics and Space Administration (NASA) of the United States. The SRTM 1 data has a spatial resolution of 30 m, and it was again processed within the GEE to extract topographic features such as tree elevation, slope, aspect, and shadow.
2.2.4. Field, Airborne LiDAR Data Measurements and Forest Survey Data
The forest resources were surveyed in the study area in September 2020 and August 2021. Measurements were performed for several single-tree parameters such as the tree position, the canopy height, the diameter at the breast height, and the crown width. Airborne LiDAR data samples were collected for more than 40 plots using the Rigel-VUX-1 UAV LIDAR system. Single-tree measurements were collected in the east, south, west, north, and middle of Shangri-La City for 1193 trees, including the typical tree species in the area: Pinus densata Mast. (279 trees), Pinus yunnanensis (535 trees), Picea asperata Mast. (130 trees), Abies fabri (Mast.) (111 trees) Craib, and Quercus (138 trees). The collected LIDAR data was preprocessed to generate canopy height model (CHM) data with the same resolution as the Landsat 8 OLI images, in order to verify the accuracy of the high-resolution canopy height estimation. The location and orthophoto of the plot investigated by UAV are shown in Figure 2.
The forest resources survey data used in this study were the fourth round of forest resources planning and design survey data of Shangri-La in 2016, which recorded the dominant tree species, stock volume, age group, average DBH, average tree height, tree number, and other information of each tree forest in Shangri-La.
2.2.5. GlobeLand 30
The GlobeLand 30 dataset is an important outcome of the global land-cover remote-sensing mapping and key technologies research project of China’s National High-Technology Development Program (863 Program). The spatial resolution of this dataset is 30 m, and it mainly contains ten major land-cover types (namely, arable land, forest, grassland, shrub land, wetland, water body, tundra, artificial surface, bare land, glacier, and permanent snow). The labelled images in the dataset are mainly 30-m multispectral images, including TM5, TM+, and OLI multispectral images captured by the US LandSat satellite and China’s Environmental Disaster Reduction Satellite (HJ-1). The most recently available 2020 version of the data has also GF-1 multispectral images of 16-m resolution. For the 2020 data, the best-reported classification accuracy was 85.72%, while the Kappa coefficient was 0.82 [26]. In our work, high-resolution canopy height mapping was obtained by stacking the high-resolution height data with the forest ground class of the GlobeLand30 data and then trimming. Table 1 shows the specific parameters of each of the data collections used in our work.
2.3. Methods
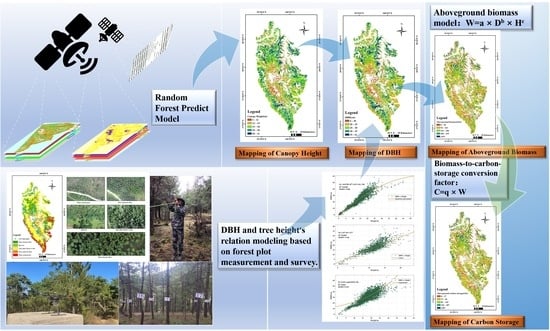
The ICESat2 ATL08 data and optical remote-sensing data were jointly used to estimate the forest canopy height in Shangri-La City. Then, measurement samples were used to establish a data model for the tree diameter at the breast height (DBH). Based on that model, DBH calculations were completed and used for forest biomass estimation in Shangri-La City. In addition, the forest biomass was used along with the carbon factor in order to estimate the forest carbon storage. Thus, the mapping of the forest biomass and the carbon storage in Shangri-La City was completed. A flow chart of the overall proposed methodology is shown in Figure 3.
2.3.1. High-Resolution Canopy Height Estimation
The ATL08 data type within the ICESAT-2 data represents vegetation height data that can be used solely for canopy height estimation. However, the number of light spots is quite limited and discrete, so it is necessary to augment this estimation process with rich high-resolution spectral information of optical remote-sensing images. Spectral band calculations were carried out by combining Sentinel-1, Sentinel-2, and Landsat8 OLI images. The indices extracted from these images are the normalized difference vegetation index (NDVI), the difference vegetation index (DVI), the ratio vegetation index (RVI), the normalized difference built-up index (NDBI), the normalized difference water index (NDWI), the enhanced vegetation index (EVI), the normalized burn ratio (NBR), and the normalized difference green index (NDGI). Topographic factors of slope and elevation were obtained by processing the DEM data. We thus computed three types of features (i.e., the vegetation indices, the terrain factors, and location information), found the importance of each feature, and established a random-forest model for high-resolution canopy height estimation from the corresponding spot locations (Figure 4) [13]. The candidate feature factors are shown in Table 2. Finally, the woodland part in the land-use data was clipped for high-resolution canopy height mapping in the study area.
2.3.2. High-Resolution DBH Estimation
The tree diameter at the breast height (DBH) is directly related to the growth status of a tree. Generally speaking, according to the scale rule of vegetation growth, the larger the DBH in a stand is, the higher the trees will be, that is, there is a positive correlation between the DBH and the tree height [4]. In this study, single-tree height and DBH field measurements were used for data cleaning and outlier removal. A regression model could thus be established with the tree height as the independent variable and the DBH as the dependent variable. Different types of such a model are shown in Table 3. Through model evaluation, the best model fitting the data can be selected and used to predict DBH values from given canopy heights. Therefore, by feeding high-resolution estimates of the forest canopy height into the Height-DBH regression model, corresponding high-resolution DBH estimates can be obtained.
2.3.3. Estimation of the Forest Biomass and Carbon Storage
Common standing biomass models mainly include unary, binary, and multivariate biomass models. Unary biomass models mostly choose tree DBH as independent variables, while binary biomass models mostly choose DBH and tree height [27,28,29,30]. Through the comparison of previous studies, it is found that the accuracy of the bivariate biomass model is higher than that of the monadic biomass model. Through searching data and referring to the study of Wang [12] et al., the standing biomass model of the main dominant tree species in Shangri-La was selected, as shown in Table 3. The biomass of individual trees can be calculated by using the biomass estimation model of each tree species in Table 4, and the above-ground biomass of the plot can be obtained by multiplying the tree plant density of the plot.
In Table 4, where W denotes the forest biomass (kg/tree), D denotes the tree DBH (cm), H denotes the tree height (m).
After estimating the forest biomass, the biomass-to-carbon-storage conversion factor is used to convert the forest biomass into the corresponding forest carbon storage as follows:
where C denotes the forest carbon storage, W denotes the forest biomass, and q denotes the conversion factor. Some studies have shown that this conversion factor varies by the tree species, but the variation is small and basically stable within a certain range (0.47–0.55) [31]. Therefore, the median conversion factor (0.50) was used in our work to partially offset the positive and negative errors in the estimation of carbon storage.
C = W × q
3. Experimental Results
3.1. High-Resolution Canopy Height Mapping
By combining optical remote sensing and microwave remote sensing images (collected from LandSat8 OLI, Sentinel-2, Sentinel-1) and ICESAT-2/ATL08 data, we extracted vegetation indices, terrain factors, the geospatial location, and other vegetation characteristics, and thus established a random-forest regression model between these factors and the canopy height [13]. Then, random-forest importance ranking was conducted on the feature factors, and the factors with the greatest influence were selected. Model training was carried out again, and high-resolution canopy height estimation was finally completed. The forest canopy height map for Shangri-La City was obtained by dividing the woodland distribution range into 30-m land-use data of GlobeLand 30. The features were ranked by a random-forest algorithm, and the features with the greatest influence on canopy height estimation were found to be the longitude, latitude, slope, elevation, NBR (Normalized Burn Ratio), NDGI (Normalized Difference Greenness Index), NDVI (Normalized Difference Vegetation Index), VV (Vertically-polarized band in Sentinel-1), VH (Horizontally-polarized band in Sentinel-1), B4_1 (Red band in Landsat8 OIL), B5_1 (Red-edge band in Landsat8 OIL), B6_1 (First shortwave-infrared band in Landsat8 OIL) and B7_1 (Second shortwave-infrared band Landsat8 OIL). The feature ranking results are shown in Figure 5. For comparison with the inversion result, a canopy height model (CHM) with the same resolution as the inversion result was generated by processing the UAV airborne LiDAR data obtained from field measurements. The model has a coefficient of variation of R2 = 0.7143, and this shows that the inversion result is somewhat correlated with the measurements and is thus relatively reliable (Figure 6). The high-resolution canopy height estimation result is shown in Figure 7. Obviously, the forest canopy height map estimated by the random-forest model is basically in line with the actual situation in Shangri-La City. Indeed, Shangri-La City is rich in forest resources, where the forest canopy height ranges between 2.28 m and 30.96 m. This height distribution is different from that of the single-tree height measurements in the field. This is because we used Landsat8 remote-sensing images for canopy height estimation, and the resolution of the obtained result was 30 m. Each pixel represents the average tree height within 900 m2 of the surrounding area. In terms of spatial distribution, the forest canopy height in the east side of Shangri-La City is higher than that in the west side. This is mainly because pine trees (such as the Pinus yunnanensis and the Pinus densata Mast.) are more distributed in the west side of Shangri-La, and these trees are higher than Picea asperata Mast., Abies fabri (Mast.) Craib and other Chinese fir trees.
3.2. High-Resolution DBH Mapping
The statistical model of forest tree height and DBH in Shangri-La was established by using the measured data and the data of the forest resources survey in 2016. Five candidate models, including unary linear, exponential function, power function, quadratic polynomial, and cubic polynomial were established according to different tree species. In this study, a total of 32,492 sample plots of five typical tree species were selected from the forest resources survey data. 75% of the sample plots were used as the training data set, and 25% were used as the test data set for cross-validation. R2 and RMSE were selected as the evaluation indexes to calculate the correlation between the predicted values and the estimated values. According to the evaluation of the established relationship models, among the relationship models of different tree species, the predicted DBH of the cubic polynomial model is the closest to the real value, and this relationship model can best reflect the relationship of tree height DBH of typical forest trees in Shangri–La City (Figure 8).
Based on the cubic-polynomial model, the high-resolution canopy height map estimated from space-borne LiDAR data (Figure 7) was used to obtain the corresponding high-resolution DBH map (Figure 9) in Shangri-La City by raster computations. The maximum and minimum DBH values were found to be 64.11 cm and 4.42 cm, respectively. Also, most of the DBH values were concentrated between 20 cm and 35 cm. These results are consistent with the actual field measurements.
3.3. Mapping of the Forest Biomass and Carbon Storage
In our study, the biomass estimation equation in Table 3. was used (along with the tree height and DBH results) to estimate the forest biomass in Shangri-La City. The biomass estimation results are shown in Figure 10. The biomass-to-carbon-storage conversion factor (Equation (1)) was then used to estimate the carbon storage in Shangri-La City (See Figure 11). The results show that the total biomass and carbon storage in Shangri-La City are 1.28 × 10⁸ t and 6.41 × 10⁷ t, respectively. Indeed, Shangri-La City has jurisdiction over 11 townships, among which the spatial distributions of the forest aboveground biomass and the carbon storage are uneven. The Gezan Township has the largest proportion of forest biomass and carbon storage (with an overall percentage of 30.22%), where the aboveground biomass and carbon storage are 3.88 × 10⁷ t and 1.94 × 10⁷ t, respectively. Secondly, the Dongwang Township accounts for 10.90% of the total, with 1.40 × 10⁷ t of aboveground biomass and 6.99 × 10⁶ t of carbon storage. The Shangjiang Township has the least aboveground biomass of only 3.98 × 10⁶ t and carbon storage of 1.99 × 10⁶ t, accounting for only 3.10% of the total in the study region. Shangri-La City has a large altitude span, with an elevation gradient between 1400 m and 5000 m, and distinct vertical forest features. Our results show that the forest biomass and carbon storage in Shangri-La City are mainly distributed between 2400 m and 4000 m, accounting for 86.31% of the total. The forest biomass and carbon storage below the 2400-m altitude were the least, with 6.90 × 10⁶ t and 3.45 × 10⁶ t, respectively (accounting for only 5.38% of the total). In general, the elevation range of the forest biomass and the carbon storage in Shangri-La City is 3200–4000 m, accounting for 60.30% of the total.
According to the slope analysis method for forest resource surveying, the slope from 0° to 90° can be divided into six categories: a flat slope (0°–5°), a gentle slope (6°–15°), a normal slope (16°–25°), a steep slope (26°–35°), a sharp slope (36°–45°), and a dangerous slope (≥45°) [32]. As demonstrated in Figure 12, spatial slope analysis shows that the aboveground biomass and the carbon storage in Shangri-La City are mostly distributed with a slope of 6°–45°. The steep-slope area (with a slope of 26°–35°) has the highest biomass and carbon storage of 3.83 × 10⁷ t and 1.92 × 10⁷ t, respectively (accounting for 29.88% of the total). In the flat-slope area (0°–5°), the aboveground biomass was 4.87 × 10⁶ t, and the carbon storage was 2.43 × 10⁶ t (accounting for only 3.79% of the total).
According to the slope aspect classification method in forest resource surveying, the slope aspect can be divided into a shady slope (north), a semi-shady slope (northeast, northwest, east), a semi-sunny slope (west, southeast, southwest), a sunny slope (south) and finally a no-slope aspect [32]. Spatial analysis of the slope aspect shows that the distribution of the aboveground biomass and the carbon storage in Shangri-La City was relatively uniform in each slope upward (See Figure 12). The no-slope area had the least distribution with a biomass of 2.42 × 10⁶ t and a carbon storage of 1.21 × 10⁶ t (accounting for 1.88% of the total). The areas with the largest shares were the southwest orientation of the semi-sunny slope. In particular, the forest biomass of the southwest orientation of the semi-sunny slope area was 1.83 × 10⁷ t, and the corresponding carbon storage was 9.14 × 10⁶ t (accounting for 14.25% of the total). In general, the aboveground biomass and the carbon storage in the shady-slope and sunny-slope areas accounted for 50.60% and 47.52% of the total, respectively. Obviously, the difference between the two areas in terms of these quantities was not large, and the overall distribution was uniform along the various slope directions without obvious regularity.
4. Discussion
4.1. Importance of Model Variables in Canopy Height Estimation
There is a strong correlation between the canopy height and biomass in forests [4]. In our work, ICESAT-2/ATL08 data, optical remote-sensing images, and topographic data were used for high-resolution estimation of the forest canopy height and the aboveground biomass in Shangri-La City. The ICESat-2/ATL08 data contain canopy height data but are of limited spatial resolution. Therefore, one of the key issues in estimating the forest aboveground biomass distribution is how to extrapolate from the discrete light spots to highly-continuous height data. At present, the main solution to this key problem is to establish a model that captures the relationship between spot data and spectral indices using optical remote-sensing images [33]. This model is used to extrapolate the whole study area. Following Zhu et al. [13], we established the relationship between ICESat-2/ATL08 canopy height data and vegetation indices, topographic factors, and the geospatial location using a random-forest regression model. This model can effectively capture complex relations among predictor variables. A total of 32 features were selected for model training, and an importance ranking of these features was established. The results show that the geographical location factors (i.e., the longitude and the latitude) had the greatest influence on the canopy height prediction results. Indeed, these geospatial location factors directly affect the temperature gradient and thus the forest canopy height. In addition, the topographic factors (i.e., slope and elevation) also have a great influence on the forest canopy height, mainly because of the high correlation of these factors with the average temperature. This has a strong correlation with the special geographical environment of Shangri-La City, which is a typical area of mountains and valleys with high and low latitudes, and the climate there changes significantly with the increase in altitude. These research results are consistent with those expressed by Matasci et al. [34].
4.2. Carbon Factor Selection
In our work, the forest carbon factor was used to convert the forest aboveground biomass into forest carbon storage. However, because the biomass and carbon storage were not directly measured, the carbon factor could not be estimated in practice. For typical tree species in Shangri-La City, measurements of the average carbon content have been reported: Pinus yunnanensis stands (51.48%), Pinus densata Mast. (51.31%), Abies fabri (Mast.) Craib (50.79%), and Quercus aquifolioides Rehd. Et Wils. (48.71%) [31]. These carbon content levels are clearly different among the four tree species. However, the carbon content levels are essentially the same for parts of the same tree species. The carbon content variations among different tree species (for the same tree part) or among trees of different ages (from the same tree species) are small, with the maximum coefficient of variation not exceeding 6%, and the carbon content rate essentially within 47–55% [31]. Therefore, the median carbon content rate (50% or 0.5) was selected to convert the biomass into carbon storage in order to partially offset the positive and negative errors in the estimation of the carbon storage.
4.3. Estimation Results for the Forest Aboveground Biomass and Carbon Storage
According to the forest resources monitoring results of Shangri-La in 2020, the total woodland area of Shangri-La in 2020 will be 961,500 hectares, the forest area will be 897,500 hectares, and the living wood stock will be 139 million cubic meters. According to experience, the ratio of live biomass to the stock of stand is about 1 [35]. In this study, it is estimated that the forest biomass of Shangri-La in 2020 will be 128,267,202.1 t and the carbon storage will be 64,133,601.05 t. The estimated results in this paper are compared with the existing studies in Shangri-La, and the comparison results are shown in Table 5. By comparing the results, it is found that the difference between our estimation results and the existing ones is not much, with the maximum difference being 5.91 × 10⁷ t with Guo’s and the minimum difference being 2.63 × 10⁶ t with Cheng’s. Although the estimated year is different, the forest ecosystem is a stable one. The change in forest biomass is not significant, and the estimated results of this study are in high consistency with those of other scholars. The forest live wood stock in the forest survey results published in 2020 is converted to live wood biomass of about 1.39 × 10⁸ t, and the estimation accuracy is 92.28%. Therefore, the estimation results in this paper have a certain reliability.
Although the estimated results of the present study are in good agreement with the existing published results, the method adopted in this paper still has some limitations. The spatial resolution of the estimation results in this study is 30 m, so the overall result is higher than that estimated with measured data. The established tree height-DBH model is based on the average tree height and DBH in the survey data. Although this paper has established a tree height DBH relationship model for each specific tree species, it is only a relatively simple linear model. Exploring more complex and complete models of tree height DBH relationship will help to further improve the results of regional forest biomass estimation.
5. Conclusions
The estimation of the forest biomass and carbon storage is of great significance for forest ecosystem protection, global warming mitigation, carbon emission reduction, carbon capturing and sequestration, as well as other ecological and environmental issues. Remote-sensing technologies have been recently employed in order to effectively and rapidly estimate the forest biomass and carbon storage at different regional scales. In our work, we focused on a study area within Shangri-La City in China which is rich in forest resources. Therefore, quantitative estimation and analysis of the forest biomass and carbon storage in this city is helpful to comprehensively evaluate the carbon absorption capacity as well as other ecological and environmental effects. Combining active and passive remote-sensing techniques, we obtained high-resolution canopy height mapping using a random-forest machine-learning model for the alpine and canyon areas of Shangri-La City. As well, high-resolution DBH values were estimated by constructing a regression model between the tree height and the DBH. Finally, the aboveground biomass in Shangri-La City was estimated by a DBH-biomass equation, and the carbon storage was subsequently obtained by multiplying the biomass by a known carbon content coefficient. The results showed that the forest aboveground biomass and the carbon storage in Shangri-La City were 1.28 × 10⁸ t and 6.41 × 10⁷ t, respectively. Compared with actual measurements from forest survey data, these numbers are indeed reliable with estimation accuracies of 92.28%, respectively. In terms of spatial distribution, the aboveground biomass and the carbon storage are mostly abundant in the Gezan Township of Shangri-La, with 30.22% of the total for this city. The two quantities also have obvious distribution patterns by altitude and slope.
Even though we have achieved some results, there is still the possibility of progress. This study relies on the accuracy of tree height DBH modeling and the accuracy of tree species classification, although we have classified tree species based on forest resource survey data and modeled the relationship between mean DBH and mean tree height for each species. However, since the classification of tree s Even though we have achieved some results, there is still the possibility of progress. This study relies on the accuracy of tree height DBH modeling and the accuracy of tree species classification, although we have classified tree species based on forest resource survey data and modeled the relationship between mean DBH and mean tree height for each species. However, since the classification of tree species is not in the same period, and the relationship between tree height and DBH is only a simple linear model, it cannot be fully adapted to other research areas, or we believe that the estimation accuracy of this method is still possible to be improved. In the following work, we will focus on the classification of regional high-precision tree species and establish a more complex and universal tree height DBH model, so as to improve the accuracy of regional biomass estimation.
Species is not in the same period, and the relationship between tree height and DBH is only a simple linear model, it cannot be fully adapted to other research areas, or we believe that the estimation accuracy of this method is still possible to be improved. In the following work, we will focus on the classification of regional high-precision tree species and establish a more complex and universal tree height DBH model, so as to improve the accuracy of regional biomass estimation.
Author Contributions
Conceptualization, Y.D. and J.P.; methodology, Y.D., J.P. and J.W.; validation, Y.D., J.W. and Q.L.; software, Y.D. and Q.L.; writing-original draft preparation, Y.D., J.P. and J.Z.; writing-review and editing, Y.D. and J.W. All authors have read and agreed to the published version of the manuscript.
Funding
This research has received funding from the National Natural Science Foundation of China (41961060) and the Scientific Research Found Project of the Education Department of Yunnan Province (2021J0438).
Data Availability Statement
ICESat-2/ATLAS Lidar data used in this study are openly available at https://nsidc.org/data/icesat-2/data-sets (accessed on 6 June 2022); Landsat 8 OLI data used in this study are openly available at http://earthexplorer.usgs.gov (accessed on 6 June 2022); Sentinel-2 data used in this study are openly available at http://earthexplorer.usgs.gov (accessed on 6 June 2022); Sentinel-1 data used in this study are openly available at http://earthexplorer.usgs.gov (accessed on 6 June 2022); SRTM 1 data used in this study are openly available at http://earthexplorer.usgs.gov (accessed on 6 June 2022); Globeland 30 data used in this study are openly available at www.globallandcover.com (accessed on 6 June 2022).
Conflicts of Interest
The authors declare no conflict of interest.
References
- Xu, X.; Cao, M.; Li, K. Temporal-Spatial Dynamics of Carbon Storage of Forest Vegetation in China. Prog. Geogr. 2007, 26, 1–10. [Google Scholar]
- Pan, Y.; Birdsey, R.A.; Fang, J.; Houghton, R.; Kauppi, P.E.; Kurz, W.A.; Phillips, O.L.; Shvidenko, A.; Lewis, S.L.; Canadell, J.G.; et al. A large and Persostent Carbon Sink in the World’s Forests. Science 2011, 333, 988–993. [Google Scholar] [CrossRef] [PubMed] [Green Version]
- Wu, S.; Yan, X.; Zhang, L. The relationship between forest ecosystem emergy and forest ecosystem service value in China. Acta Geogr. Sin. 2014, 3, 334–342. [Google Scholar] [CrossRef]
- Meng, X. Tree Surveying, 2nd ed.; China Forestry Publishing House: Beijing, China, 2006; p. 295. [Google Scholar]
- Wang, Y.; Zhao, S. Biomass and net productivity of Picea schrenkiana var tianshanica forest. Chin. J. Appl. Ecol. 1999, 10, 389–391. [Google Scholar]
- Wang, J.; Cheng, P.; Xu, S.; Wang, X.; Cheng, F. Forest biomass estimation in Shangri-La based on the remote sensing. J. Zhejiang A F Univ. 2013, 30, 325–329. [Google Scholar] [CrossRef]
- Li, R.; Liu, J. An Estimation of Wetland Vegetation Biomass in the Poyang Lake Using Landsat ETM Data. Acta Geogr. Sin. 2001, 56, 532–540. [Google Scholar]
- Huang, J.; Ju, W.; Zheng, G.; Kang, T. Estimation of forest aboveground biomass using high spatial resolution remote sensing imagery. Acta Ecol. Sin. 2013, 33, 6497–6508. [Google Scholar] [CrossRef]
- Liu, Q.; Yang, L.; Liu, Q.; Li, J. Review of forest above ground biomass inversion methods based on remote sensing technology. J. Remote Sens. 2015, 19, 62–74. [Google Scholar] [CrossRef]
- Treuhaft, R.N.; Siqueira, P.R. The calculated performance of forest structure and biomass estimate from interferometric Radar. Waves Random Media 2004, 14, 345–358. [Google Scholar] [CrossRef]
- Moghaddam, M.; Dungan, J.L.; Acker, S. Forest variable estimation from fusion of SAR and multispectral optical data. IEEE Trans. Geosci. Remote Sens. 2002, 40, 2176–2178. [Google Scholar] [CrossRef]
- Wang, J.; Tang, W. Estimation and analysis of aboveground biomass and carbon storage of arbor forest based on forest resource planning and design survey data: A case study of Shangri-La City. J. Green Sci. Technol. 2021, 23, 14–16. [Google Scholar]
- Zhu, X.; Wang, C.; Nie, S.; Pan, F.; Xi, X.; Hu, Z. Mapping forest height using photon-counting LiDAR data and Landsat 8 OLI data: A case study in Virginia and North Carolina, USA. Ecol. Indic. 2020, 114, 106287. [Google Scholar] [CrossRef]
- Wang, C.; Xi, X.; Luo, S.; Li, G. Spaceborne Ranging LiDAR Data Processing and Application, 1st ed.; Science Press: Beijing, China, 2015. [Google Scholar]
- Lefsky, M.A.; Harding, D.J.; Keller, M.; Cohen, W.B.; Camargo, P.B. Correction to “Estimates of forest canopy height and aboveground biomass using ICESat”. Geophys. Res. Lett. 2006, 33, L05501. [Google Scholar] [CrossRef] [Green Version]
- Naesset, E.; Gobakken, T. Estimation of above-and below-ground biomass across regions of the boreal forest zone using airborne laser. Remote Sens. Environ. 2008, 112, 3079–3090. [Google Scholar] [CrossRef]
- Huang, K.; Pang, Y.; Shu, Q.; Fu, T. Aboveground forest biomass estimation using ICESat GLAS in Yunnan, China. J. Remote Sens. 2013, 17, 165–179. [Google Scholar]
- Han, W.; Wang, J.; Ke, H.; Fu, L. Research on acquiring information of LU/LC by remote sense image based on GIS-A case study of Shangri-La county, the Northwestern Yunnan. Yunnan Geogr. Environ. Res. 2007, 19, 98–102. [Google Scholar]
- Pan, J.; Wang, J.; Gao, F. Research of land use change and ecological security of typical area of alpine canyon in Northwest Yunnan. Ecol. Sci. 2022, 41, 29–40. [Google Scholar] [CrossRef]
- Yang, C.; Wang, J. Dynamic Remote Sensing Monitoring of Soil Erosion in Shangri-La, Northwest Yunnan. J. Kunming Univ. Sci. Technol. (Nat. Sci. Ed.) 2015, 40, 32–39. [Google Scholar] [CrossRef]
- Sun, X.; Yu, Y.; Wang, J.; Liu, W. Analysis of the Spatiotemporal Variation in Habitat Quality Based on the InVEST Model-A Case Study of Shangri-La City, Northwest Yunnan, China. J. Phys. Conf. Ser. 2021, 1961, 012016. [Google Scholar] [CrossRef]
- Wang, C.; Xi, X.; Yang, X.; Nie, S. Introduction to LiDAR Remote Sensing, 1st ed.; Higher Education Press: Beijing, China, 2022; pp. 69–71. [Google Scholar]
- Zhu, X. Forest Height Retrieval of China with a Resolution of 30 m Using ICESat-2 and GEDI Data; University of Chinese Academy of Sciences: Beijing, China, 2021. [Google Scholar]
- Neuenschwander, A.; Pitts, K.; Jelley, B.; Robbins, J.; Klotz, B.; Popescu, S.; Nelson, R.; Harding, D.; Pederson, D.; Sheridan, R. Ice, Cloud, and Land Elevation Satellite 2 (ICESat-2) Algorithm Theoretical Basis Document (ATBD) for Land—Vegetation along-Track Products (ATL08). Available online: https://nsidc.org/sites/nsidc.org/files/technical-references/ICESat2_ATL08_ATBD_r003.pdf (accessed on 6 June 2022).
- Neuenschwander, A.; Pitts, K. The ATL08 land and vegetation product for the ICESat-2 Mission. Remote Sens. Environ. 2019, 221, 247–259. [Google Scholar] [CrossRef]
- Liao, A.; Peng, S.; Wu, H.; Chen, L.; Zhang, W. The Production System of 30 m Global Land Cover Mapping and Its Application. Bull. Surv. Mapp. 2015, 10, 4–8. [Google Scholar] [CrossRef]
- West, G.B.; Brown, J.H.; Enquist, B.J. A general model for the structure and allometry of plant vascular systems. Nature 1999, 400, 664–667. [Google Scholar] [CrossRef]
- Kaitaniemi, P. Testing allometric scaling laws. J. Theor. Biol. 2004, 228, 149–153. [Google Scholar] [CrossRef] [PubMed]
- Ketterings, Q.M.; Coe, R.; Van, N.M.; Ambagau, Y.; Palm, C.A. Reducing uncertainty in the use of allometric biomass equations for predicting above-ground tree biomass in mixed secondary forests. For. Ecol. Manag. 2001, 146, 199–209. [Google Scholar] [CrossRef]
- Ou, G.; Xu, H. A Review on Forest Biomass Models. J. Southwest For. Univ. 2020, 40, 1–10. [Google Scholar] [CrossRef]
- Wang, J.; Wang, X.; Yue, C.; Cheng, F.; Xu, T.; Cheng, P.; Wang, X.; Gao, Y. Carbon content rate in dominant species of four forest types in Shangri-la, northwest Yunnan province. Ecol. Environ. Sci. 2012, 1, 613–619. [Google Scholar] [CrossRef]
- Su, Y.; Guo, Q.; Xue, B.; Hu, T.; Alvarez, O.; Tao, S.; Fang, J. Spatial distribution of forest aboveground biomass in China: Estimation through combination of spaceborne LiDAR, optical imagery, and forest inventory data. Remote Sens. Environ. 2016, 173, 187–199. [Google Scholar] [CrossRef] [Green Version]
- Xu, Z.; Xu, X.; Jia, Y.; Wang, D.; Li, Y. Experimental Practice Guidance of Forest Ecology, 1st ed.; China Forestry Publishing House: Beijing, China, 2021; pp. 12–17. [Google Scholar]
- Matasci, G.; Hermosilla, T.; Wulder, M.; White, J.; Coops, N.; Hobart, G.; Zald, H. Large-area mapping of Canadian boreal forest cover, height, biomass and other structural attributes using Landsat composites and LiDAR plots. Remote Sens. Environ. 2018, 209, 90–106. [Google Scholar] [CrossRef]
- Fang, J.; Liu, G.; Xu, S. Carbon Pools of Terrestrial Ecosystems in China, 1st ed.; China Environmental Science Press: Beijing, China, 1996; pp. 109–128. [Google Scholar]
- Yue, C. Forest Biomass Estimation in Shangri-La County Based on Remote Sensing; Beijing Forestry University: Beijing, China, 2011. [Google Scholar]
- Cheng, F. Forest Biomass Estimation of Yunnan Province Using Multi-Source Remote Sensing Data; Yunnan Normal University: Kunming, China, 2011. [Google Scholar]
Figure 1.
Location of the Shangri-La study area in China.

Figure 2.
The location of UAV survey plots and the orthophoto of four tree species.

Figure 3.
Flow chart of the proposed methodology for canopy height estimation and forest biomass mapping.
Figure 3.
Flow chart of the proposed methodology for canopy height estimation and forest biomass mapping.

Figure 4.
The random-forest canopy height estimation model, green circle means target feature, white circle means other feature.
Figure 4.
The random-forest canopy height estimation model, green circle means target feature, white circle means other feature.

Figure 5.
Feature importance ranking.

Figure 6.
Canopy height prediction compare with UAV Lidar data.

Figure 7.
Forest canopy height mapping in Shangri-La City.

Figure 8.
Regression models for tree DBH prediction from the tree Height including: linear model, quadratic-polynomial model, cubic-polynomial model, exponential model and power-function model. (a–e): Pinus densata Mast.; (f–j): Abies fabri (Mast.) Craib; (k–o): Quercus; (p–t): Pinus yunnanensis; (u–y): Picea asperata Mast.


Figure 9.
Forest DBH mapping in Shangri-La City.

Figure 10.
Aboveground biomass in Shangri-La City.

Figure 11.
Aboveground carbon storage in Shangri-La City.

Figure 12.
Spatial distribution of the aboveground biomass and carbon storage in Shangri-La City: (a) Distribution in different townships; (b) Distribution at different elevations; (c) Distribution at different slopes; (d) Distribution in different slope directions.
Figure 12.
Spatial distribution of the aboveground biomass and carbon storage in Shangri-La City: (a) Distribution in different townships; (b) Distribution at different elevations; (c) Distribution at different slopes; (d) Distribution in different slope directions.


Table 1.
A summary of the data collections used in our work.
| Type | Name | Spatial Resolution | Data Source |
|---|---|---|---|
| LiDAR data | ICESat-2/ATLAS | 100 m | NSIDC (https://nsidc.org/data/icesat-2/data-sets (accessed on 6 June 2022)) |
| ULS | - | Rigel-VUX-1 | |
| Optical remote sensing data | Landsat 8 OLI | 30 m | USGS (http://earthexplorer.usgs.gov (accessed on 6 June 2022)) |
| Sentinel-2 | 10 m | USGS (http://earthexplorer.usgs.gov (accessed on 6 June 2022)) | |
| Microwave remote sensing data | Sentinel-1 | 20 m | USGS (http://earthexplorer.usgs.gov (accessed on 6 June 2022)) |
| DEM | SRTM 1 | 30 m | USGS (http://earthexplorer.usgs.gov (accessed on 6 June 2022)) |
| Thematic Data | Globeland 30 | 30 m | www.globallandcover.com (accessed on 6 June 2022) |
| 2016 Forest survey data | Forest government |
Table 2.
Candidate feature factors.
| Type | Factors |
|---|---|
| Location | Latitude, Longitude |
| Terrain | Slope, Elevation, |
| Vegetion Index | the normalized difference green index (NDGI), the ratio vegetation index (RVI), the normalized burn ratio (NBR),the enhanced vegetation index (EVI), the difference vegetation index (DVI), the normalized difference vegetation index (NDVI), the normalized difference built-up index (NDBI),the terrestrial chlorophyll index (MTCI),the inverted red-edge chlorophyll index (IRECI), the normalized difference water index (NDWI), modified NDWI (MNDWI), the Pigment-Specific-Simple Ratio (PSSRa) |
| Sentinel-1 | Vertically-polarized (VV), Horizontally-polarized (VH) |
| Landsat8 OLI | The red band(B4_1), the near-infrared band (B5_1), the first short wave infrared band (B6_1), the second short wave infrared band (B7_1) |
| Sentinel-2 | The blue band (B2), the red band (B4), the visible and near-infrared band (B5), the visible and near-infrared band (B6), the visible and near-infrared band (B7), the visible and near-infrared band (B8), the visible and near-infrared band (B8A), the short wave infrared band (B11), the short wave infrared band (B12) |
Table 3.
Candidate regression models for the relation between the canopy height and the DBH. In the table, D represents the tree DBH (cm), H represents the tree height (m), and a, b, c, and d are constants or parameters.
Table 3.
Candidate regression models for the relation between the canopy height and the DBH. In the table, D represents the tree DBH (cm), H represents the tree height (m), and a, b, c, and d are constants or parameters.
| ID | Model | Express | Parameters |
|---|---|---|---|
| 1 | Linear | D = a + b × H | a, b |
| 2 | Exponential | D = a × ebH | a, b |
| 3 | Power | D = a × Hb | a, b |
| 4 | Quadratic polynomial | D = a + b × H + c × H2 | a, b, c |
| 5 | Cubic polynomial | D = a + b × H + c × H2 + d × H3 | a, b, c, d |
Table 4.
Above ground biomass model of main tree species in Shangri-La City.
| Spieces of Trees | Above Ground Biomass Model |
|---|---|
| Abies fabri (Mast.) Craib | W = 0.06127D2.05753H0.50839 |
| Quercus | W = 0.07806D2.06321H0.57393 |
| Pinus densata Mast. | W = 0.0730D2.3560H0.1090 |
| Picea asperata Mast. | W = 0.09152D2.2106H0.25663 |
| Pinus yunnanensis | W = 0.070231D2.10392H0.41120 |
Publisher’s Note: MDPI stays neutral with regard to jurisdictional claims in published maps and institutional affiliations. |
© 2022 by the authors. Licensee MDPI, Basel, Switzerland. This article is an open access article distributed under the terms and conditions of the Creative Commons Attribution (CC BY) license (https://creativecommons.org/licenses/by/4.0/).
Share and Cite
MDPI and ACS Style
Deng, Y.; Pan, J.; Wang, J.; Liu, Q.; Zhang, J. Mapping of Forest Biomass in Shangri-La City Based on LiDAR Technology and Other Remote Sensing Data. Remote Sens. 2022, 14, 5816. https://doi.org/10.3390/rs14225816
AMA Style
Deng Y, Pan J, Wang J, Liu Q, Zhang J. Mapping of Forest Biomass in Shangri-La City Based on LiDAR Technology and Other Remote Sensing Data. Remote Sensing. 2022; 14(22):5816. https://doi.org/10.3390/rs14225816
Chicago/Turabian StyleDeng, Yuncheng, Jiya Pan, Jinliang Wang, Qianwei Liu, and Jianpeng Zhang. 2022. "Mapping of Forest Biomass in Shangri-La City Based on LiDAR Technology and Other Remote Sensing Data" Remote Sensing 14, no. 22: 5816. https://doi.org/10.3390/rs14225816
Note that from the first issue of 2016, this journal uses article numbers instead of page numbers. See further details here.