
FY-4A/AGRI Aerosol Optical Depth Retrieval Capability Test and Validation Based on NNAeroG

 , , ,
, , ,
Abstract
:
1. Introduction
2. Materials
2.1. FY-4A/AGRI Data
2.2. Ground-Based Data
2.2.1. AERONET Data
2.2.2. SONET Data
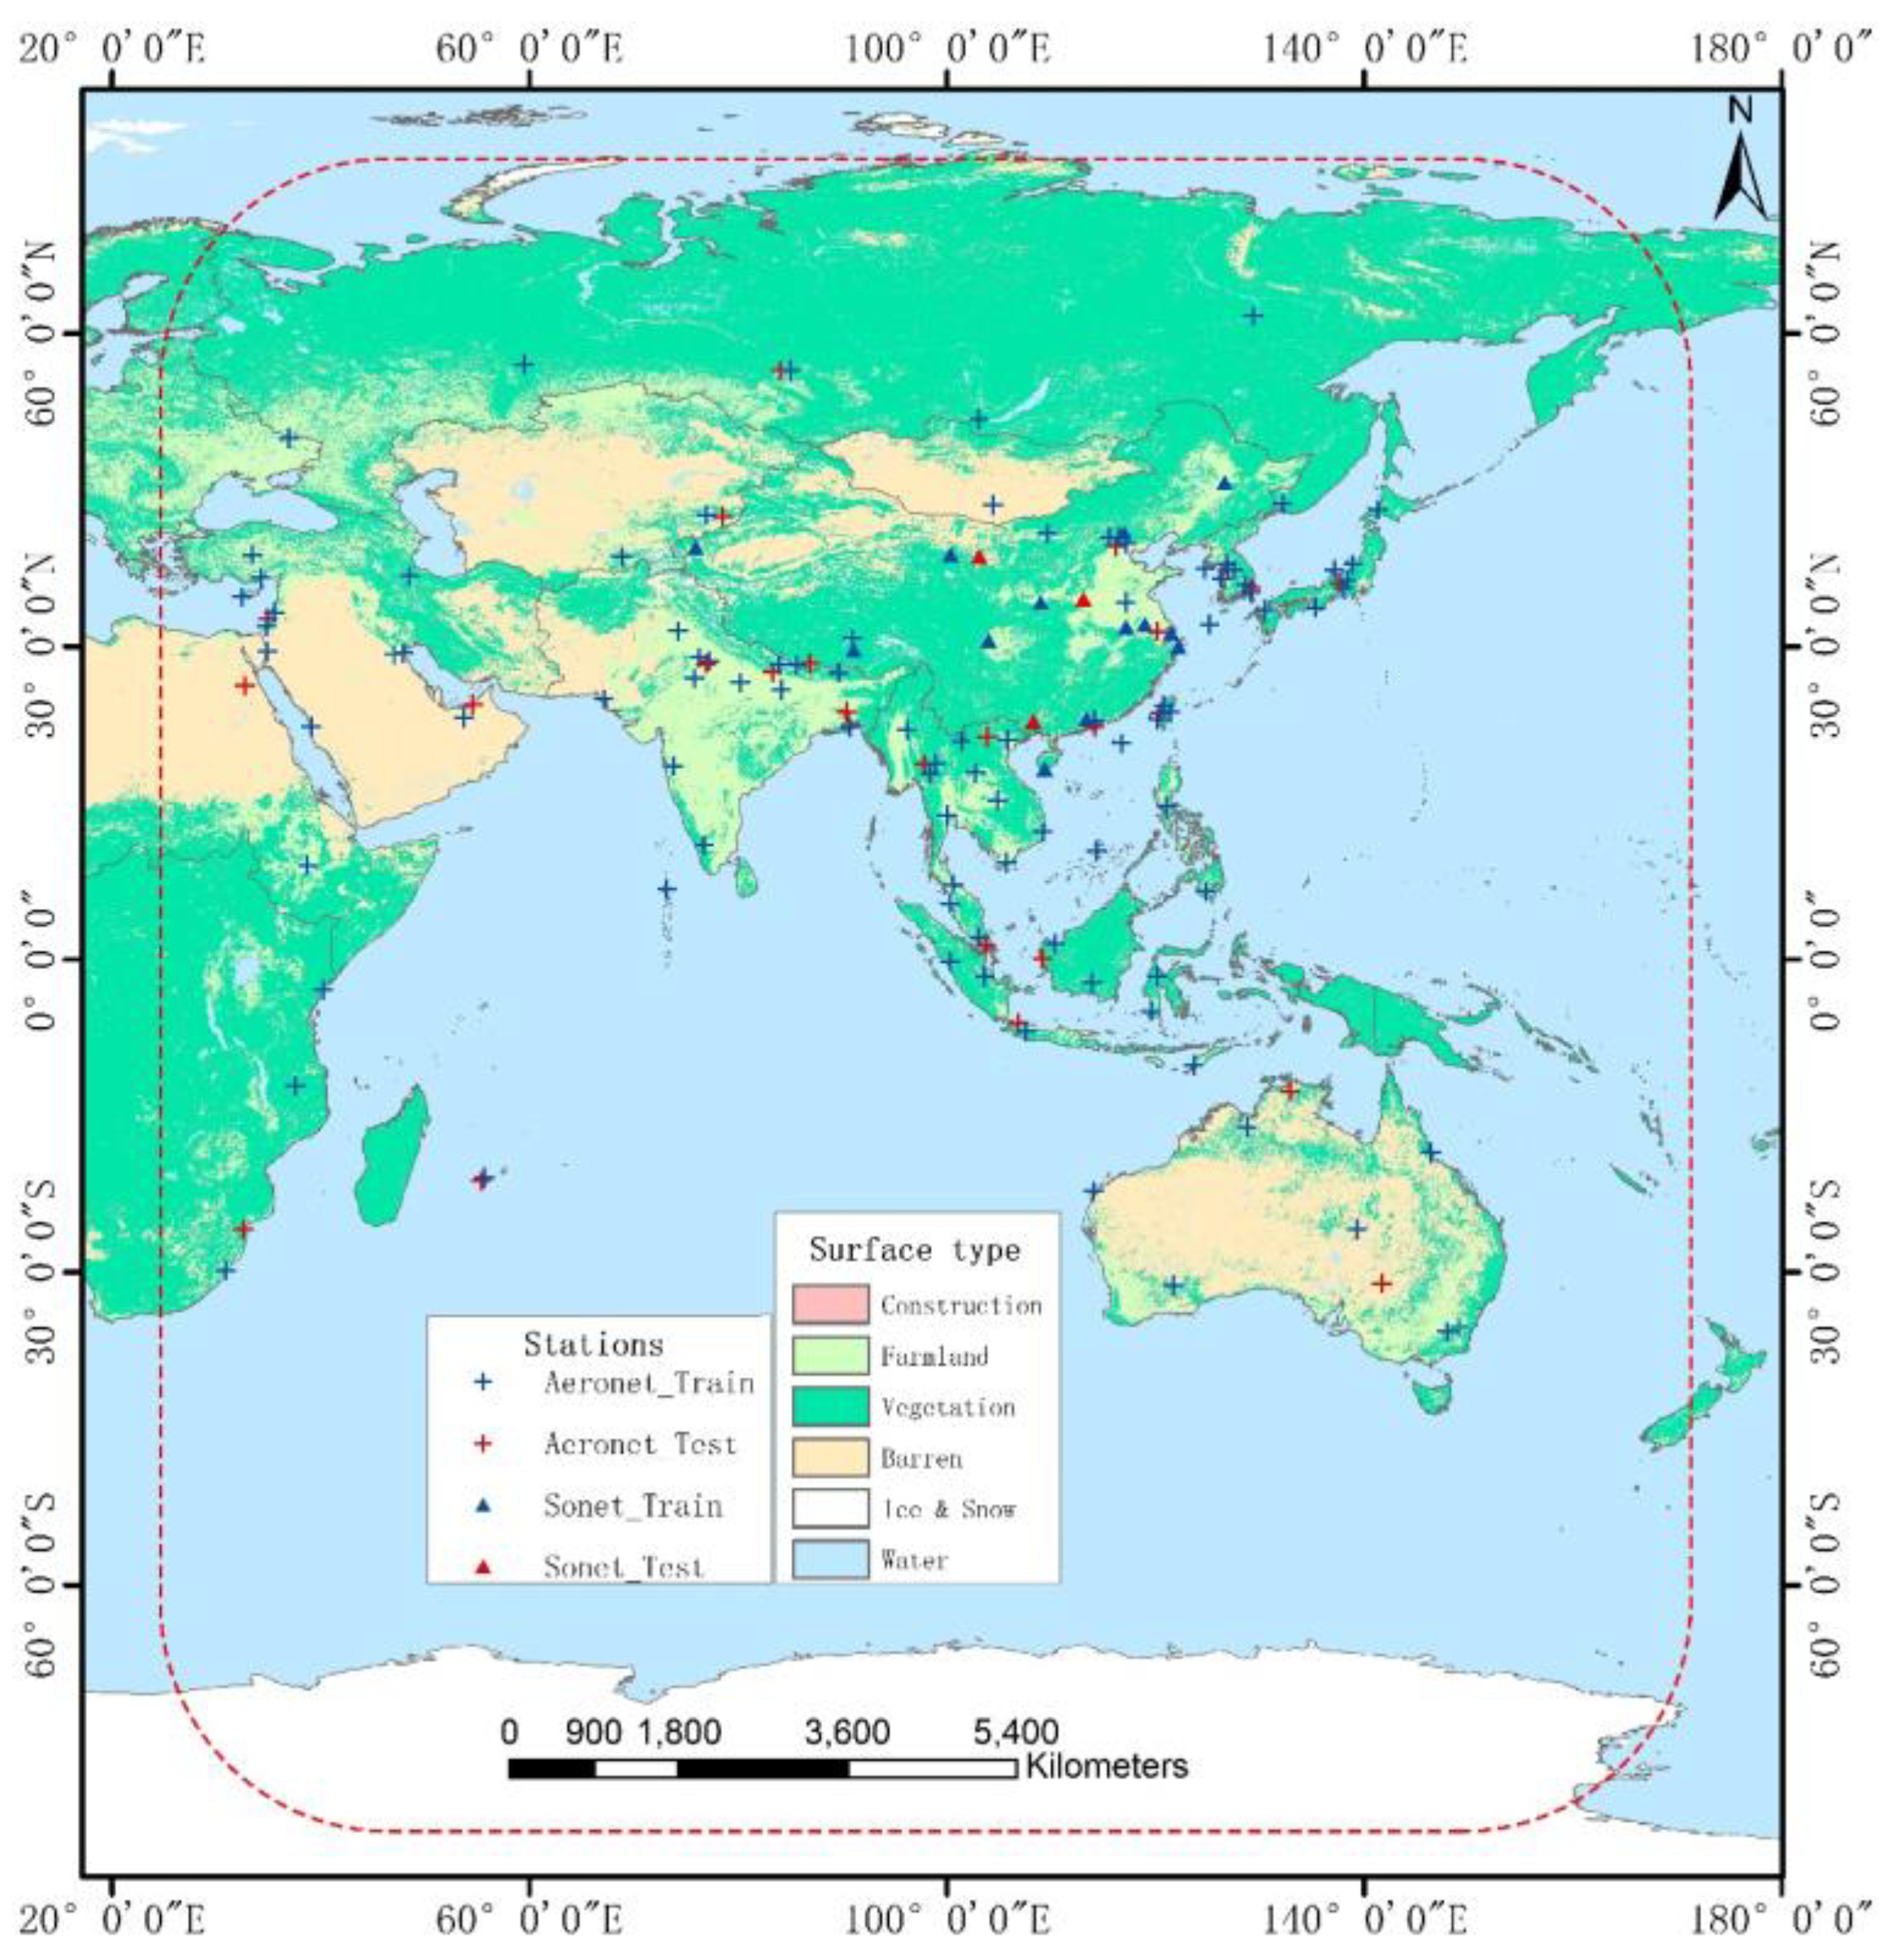
2.3. Study Area
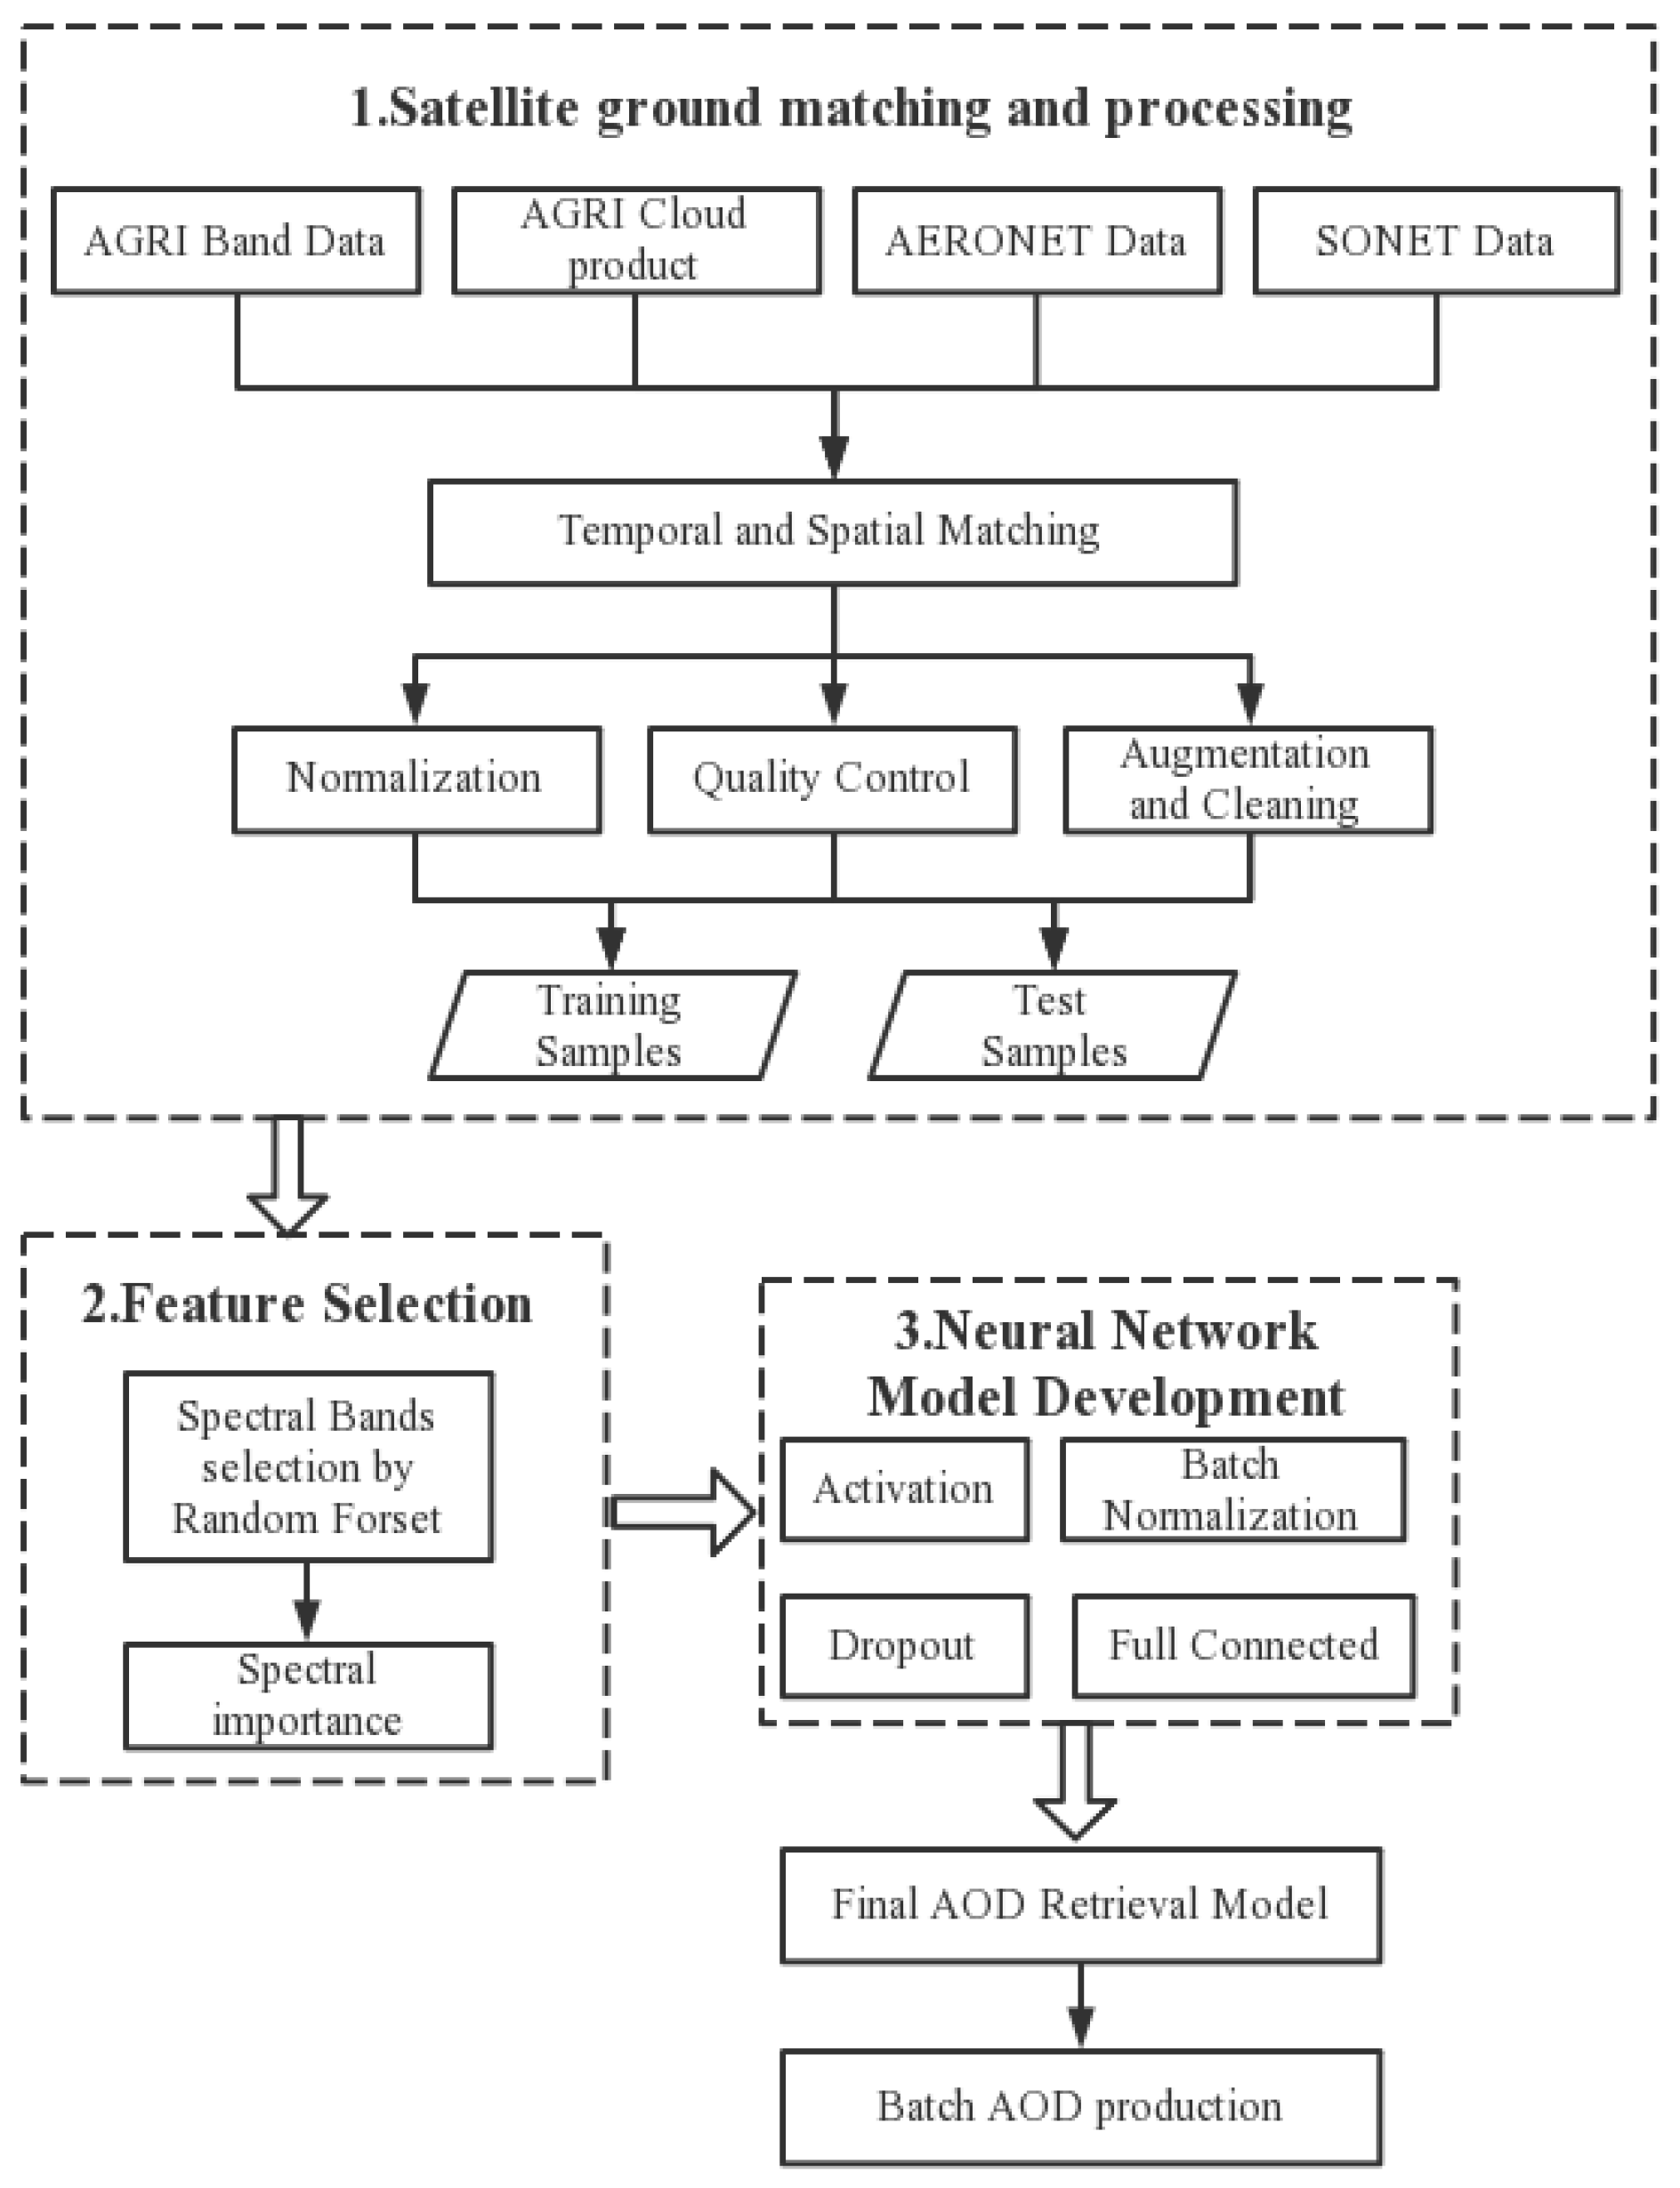
3. Method
3.1. Strategy and Data Set Preprocessing
3.2. Fully Connected Neural Network (FCNN)
3.3. Training Configurations and Model Validation
4. Results
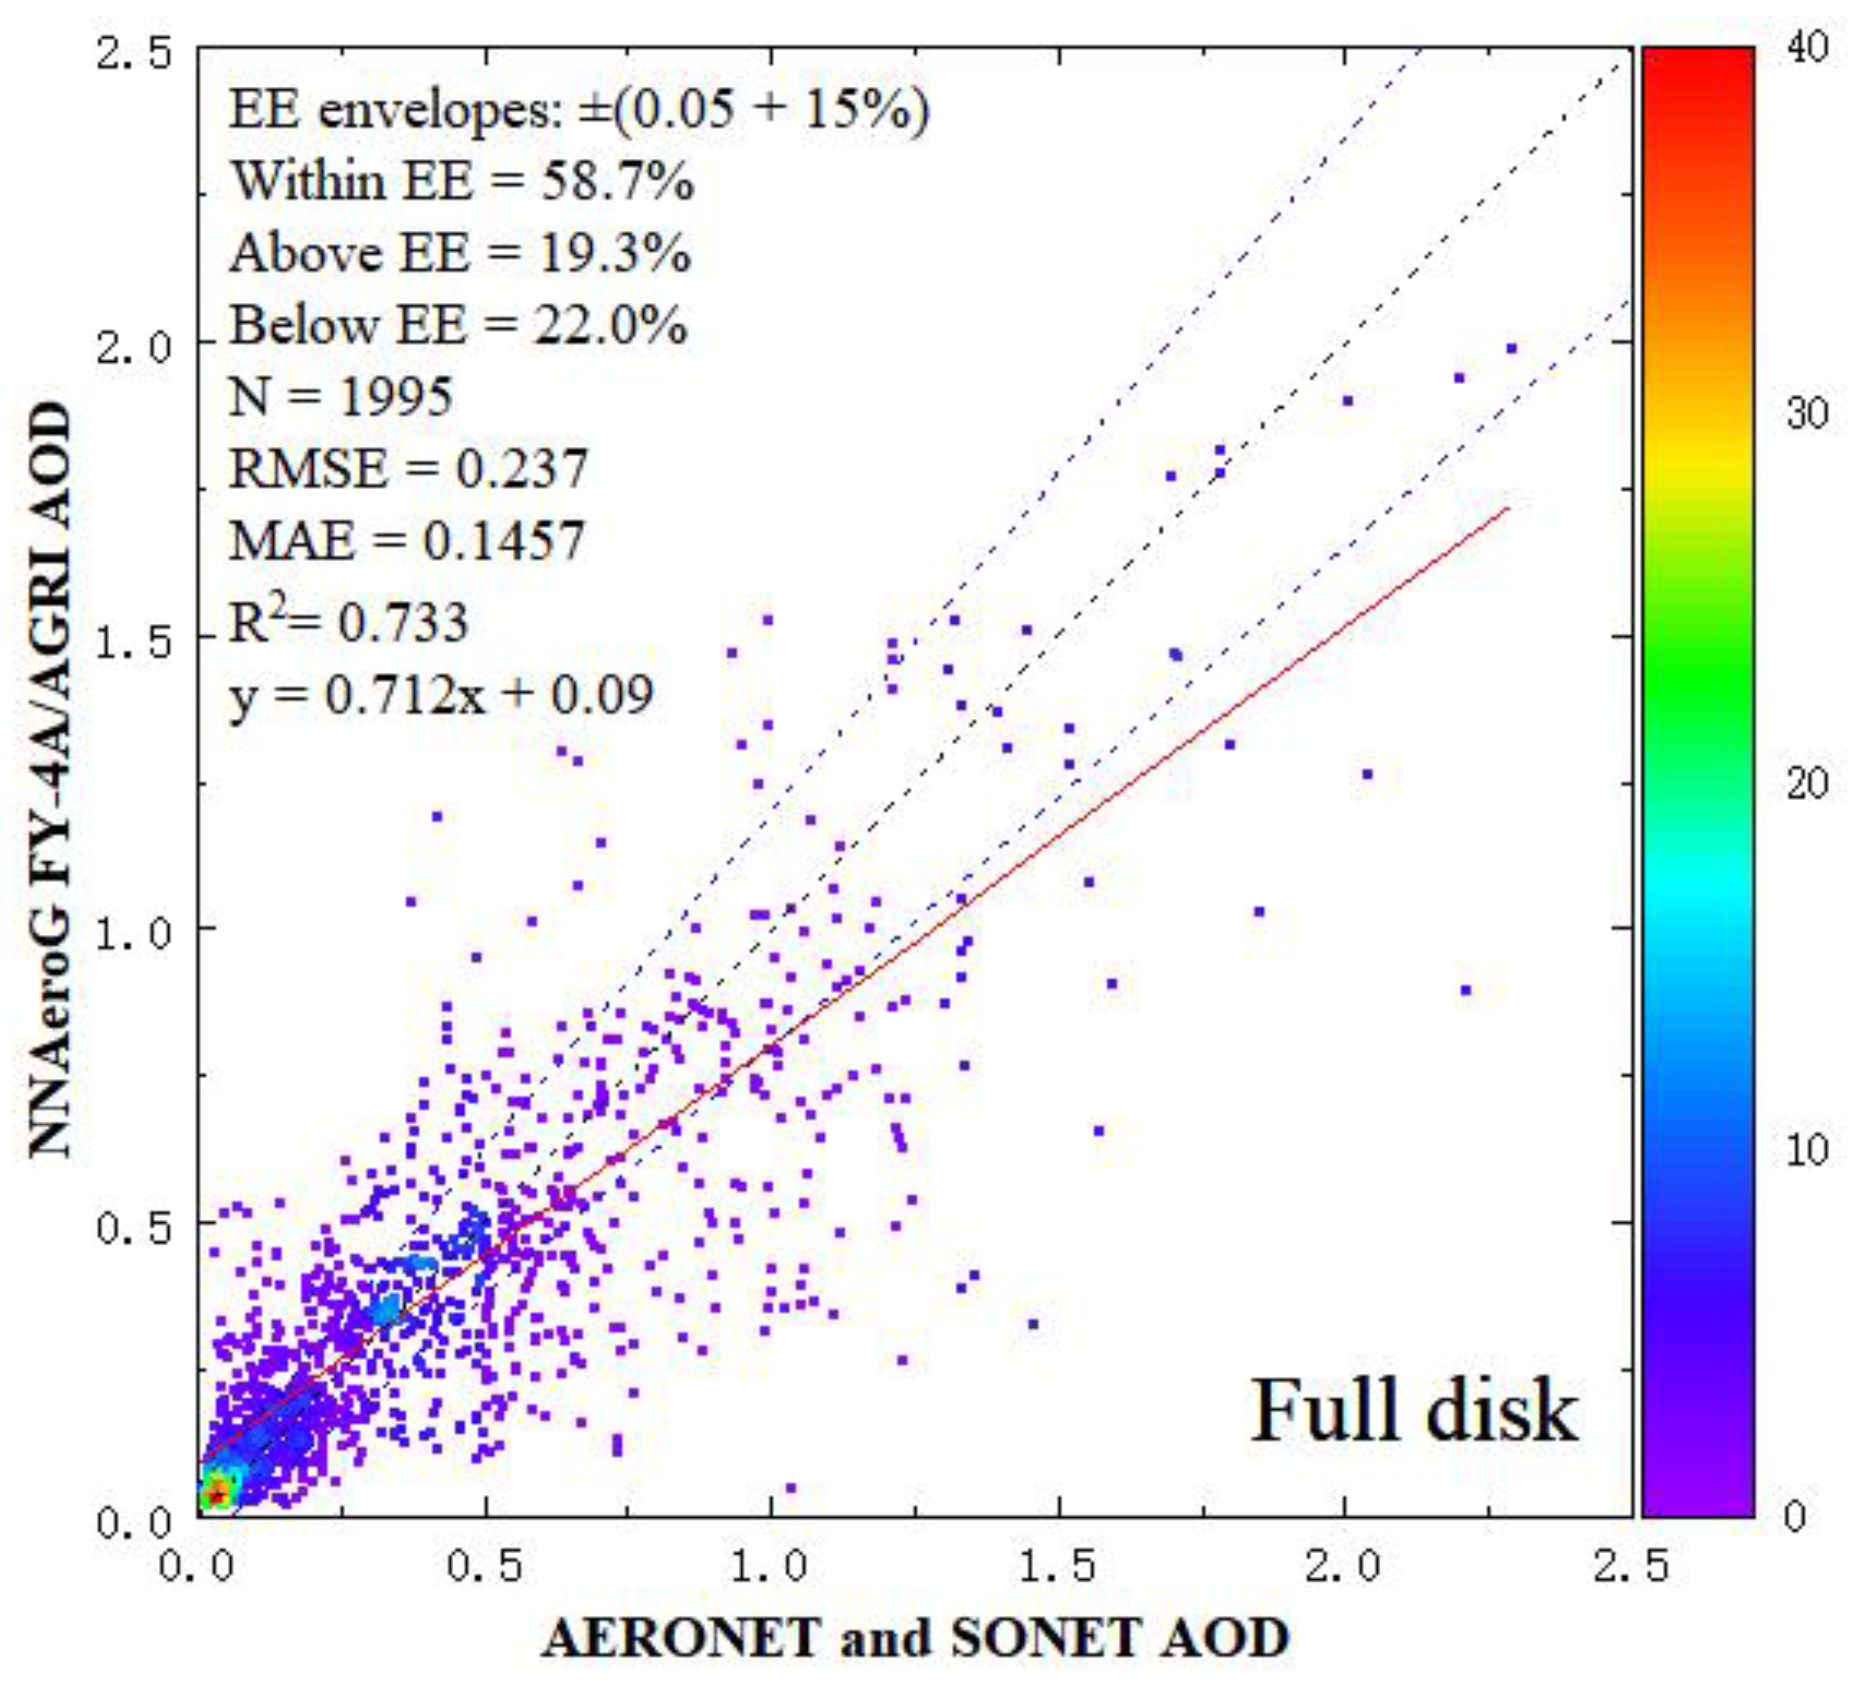
4.1. General Validation
4.2. AOD Results of Different Surface Types
4.2.1. Vegetated Areas
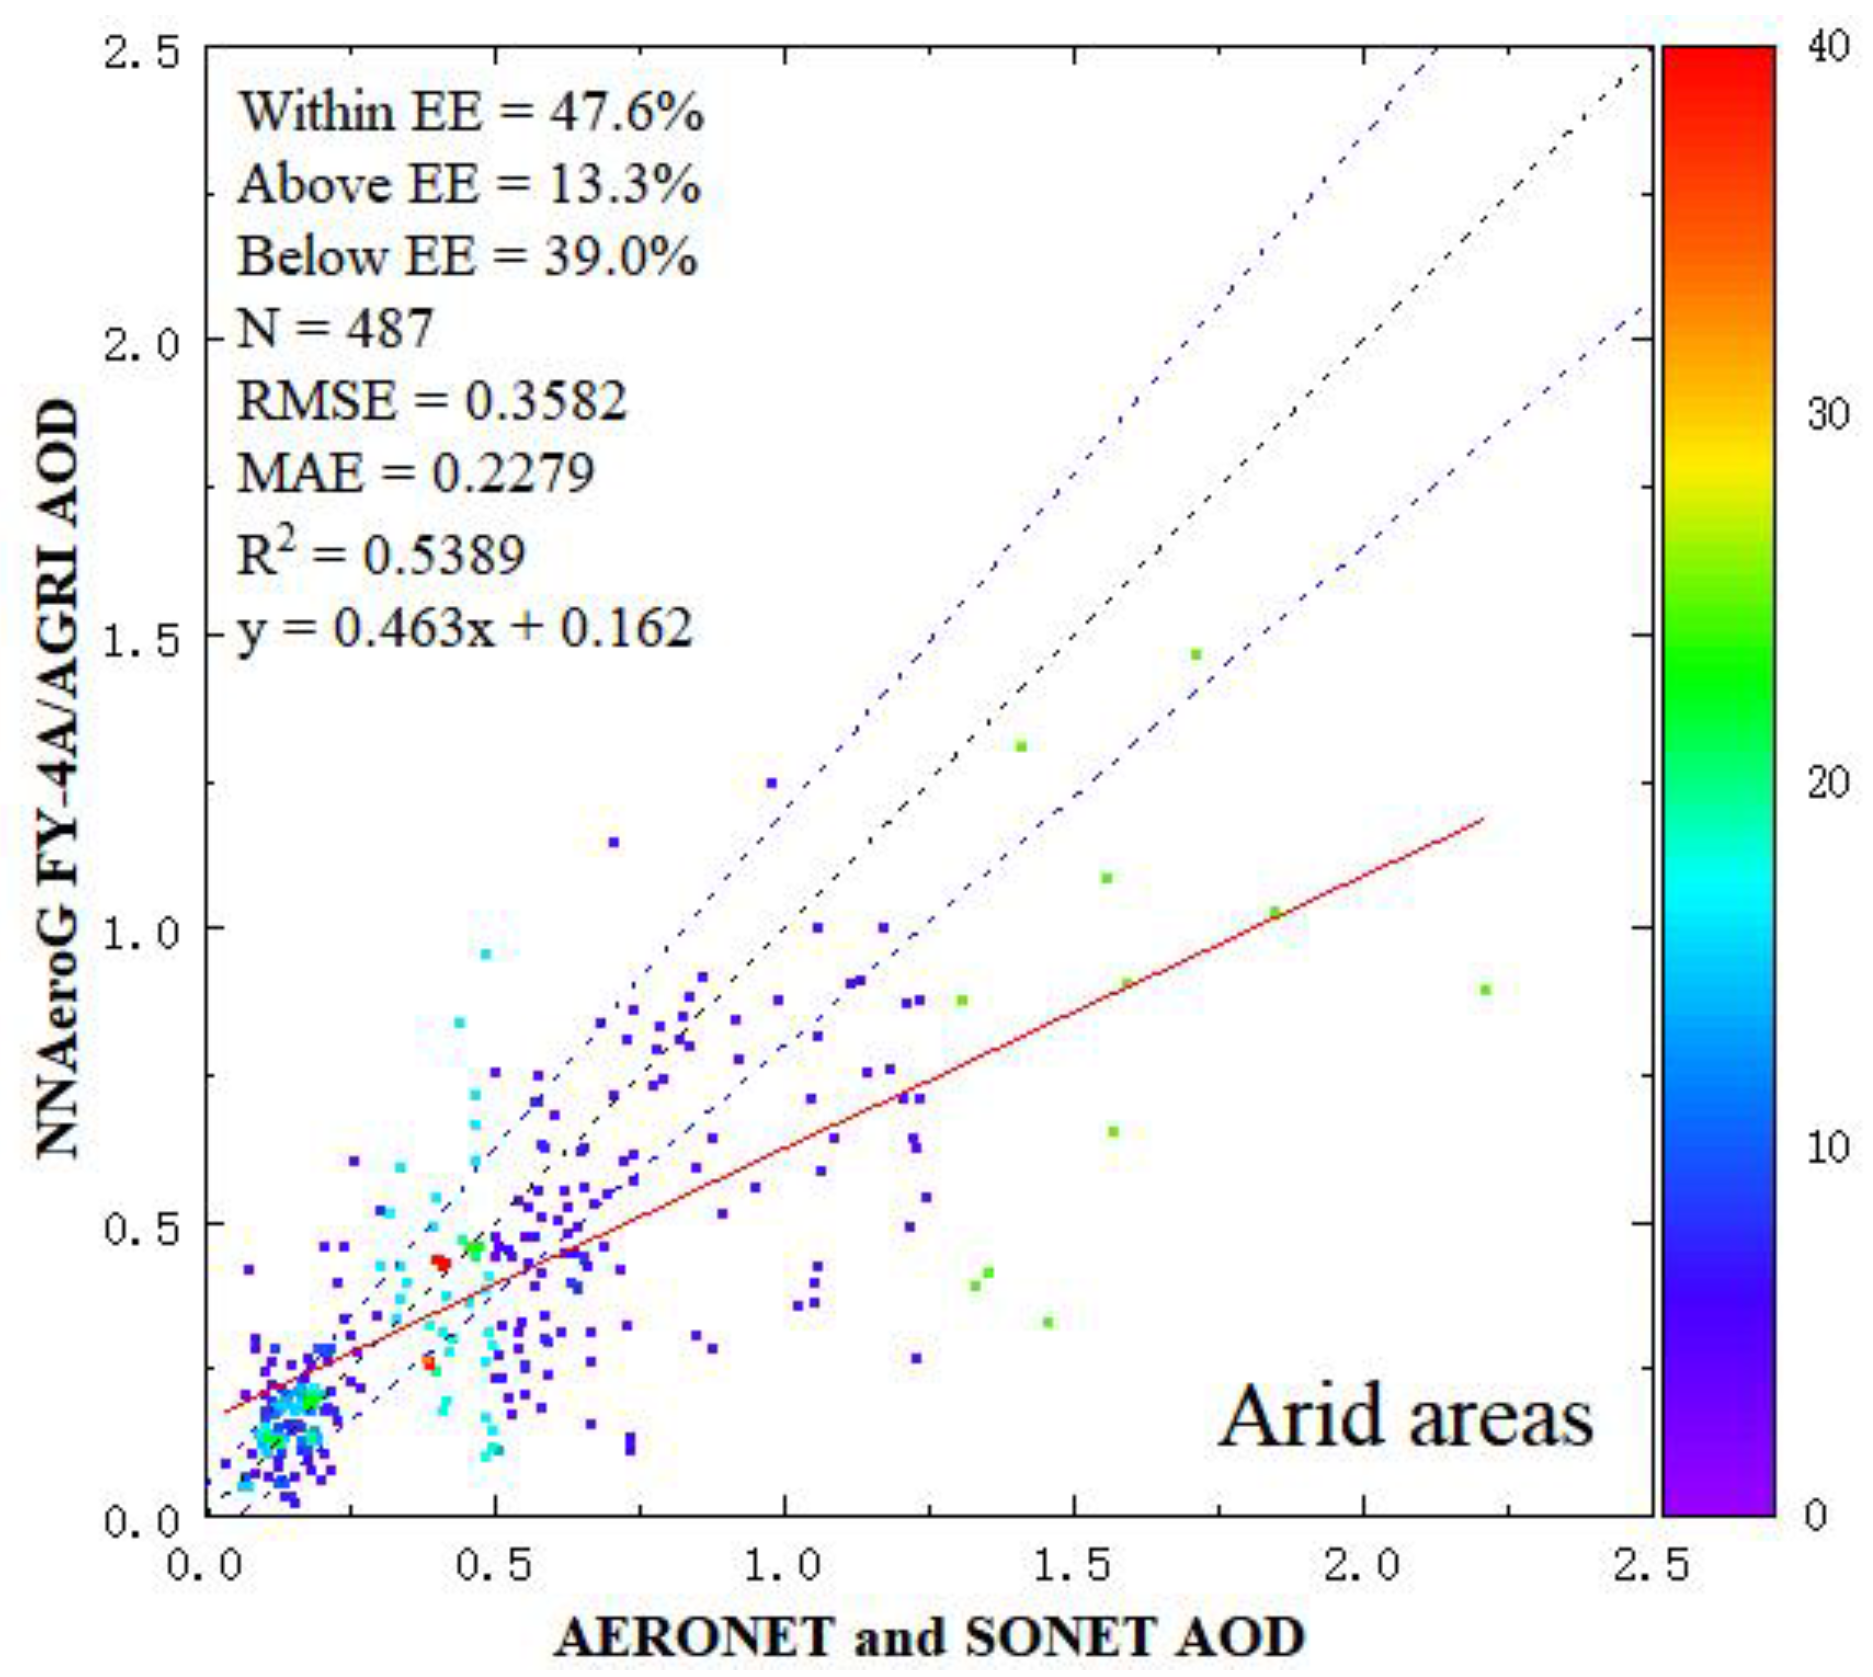
4.2.2. Arid Areas
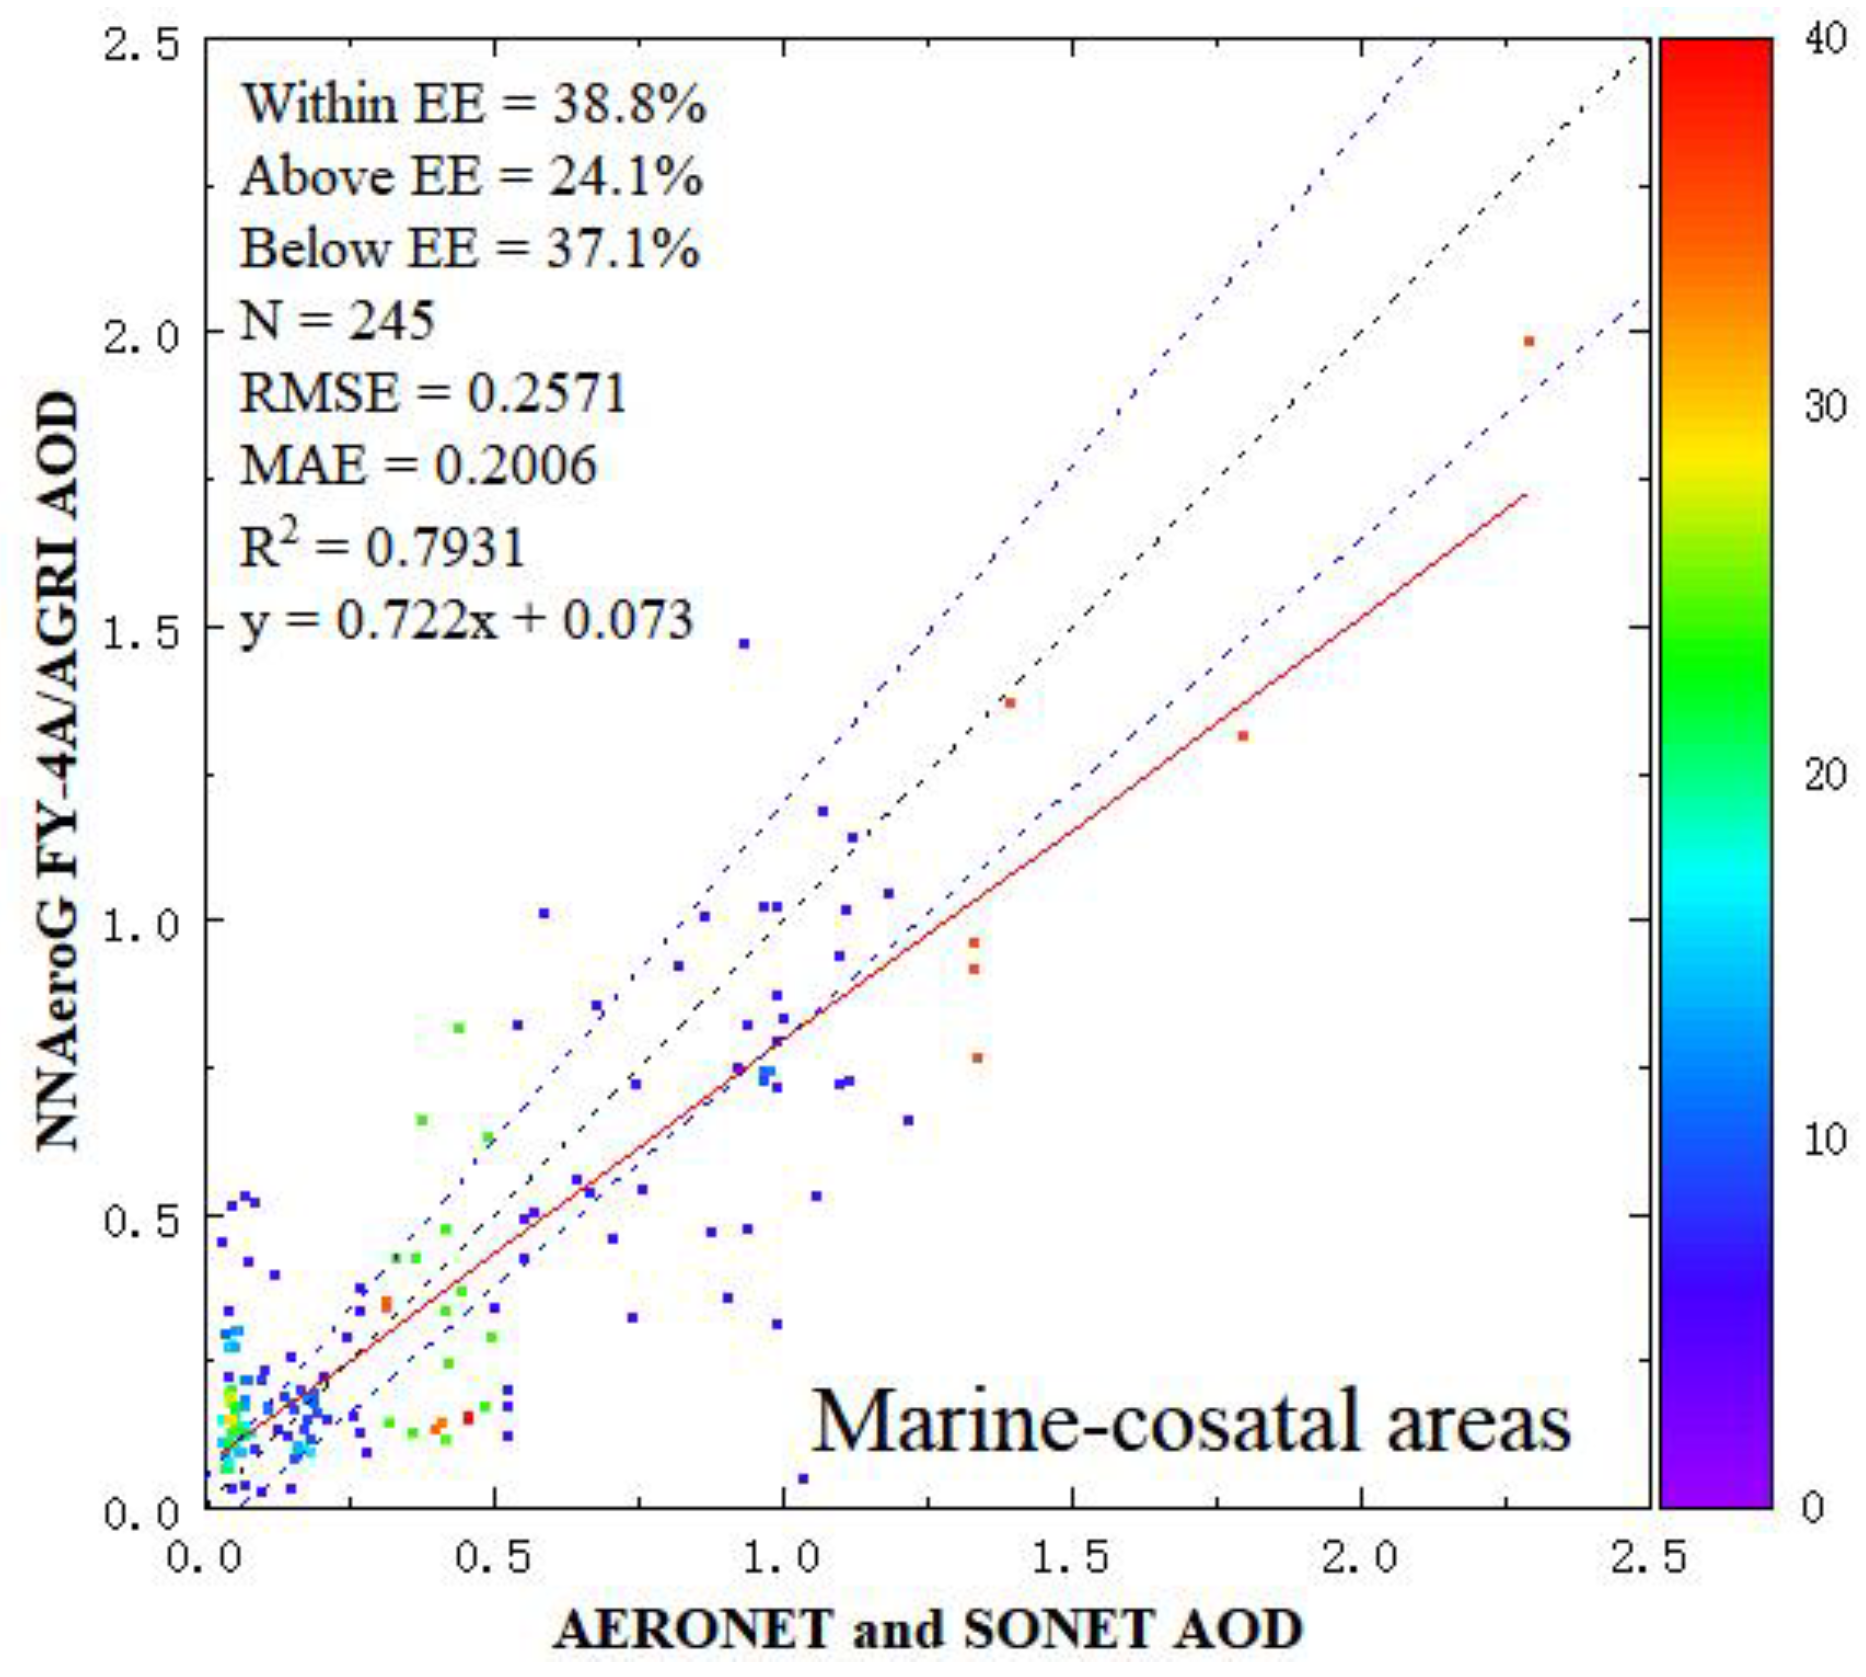
4.2.3. Marine and Coastal Areas
4.3. Fine and Coarse Mode AOD
5. Discussion
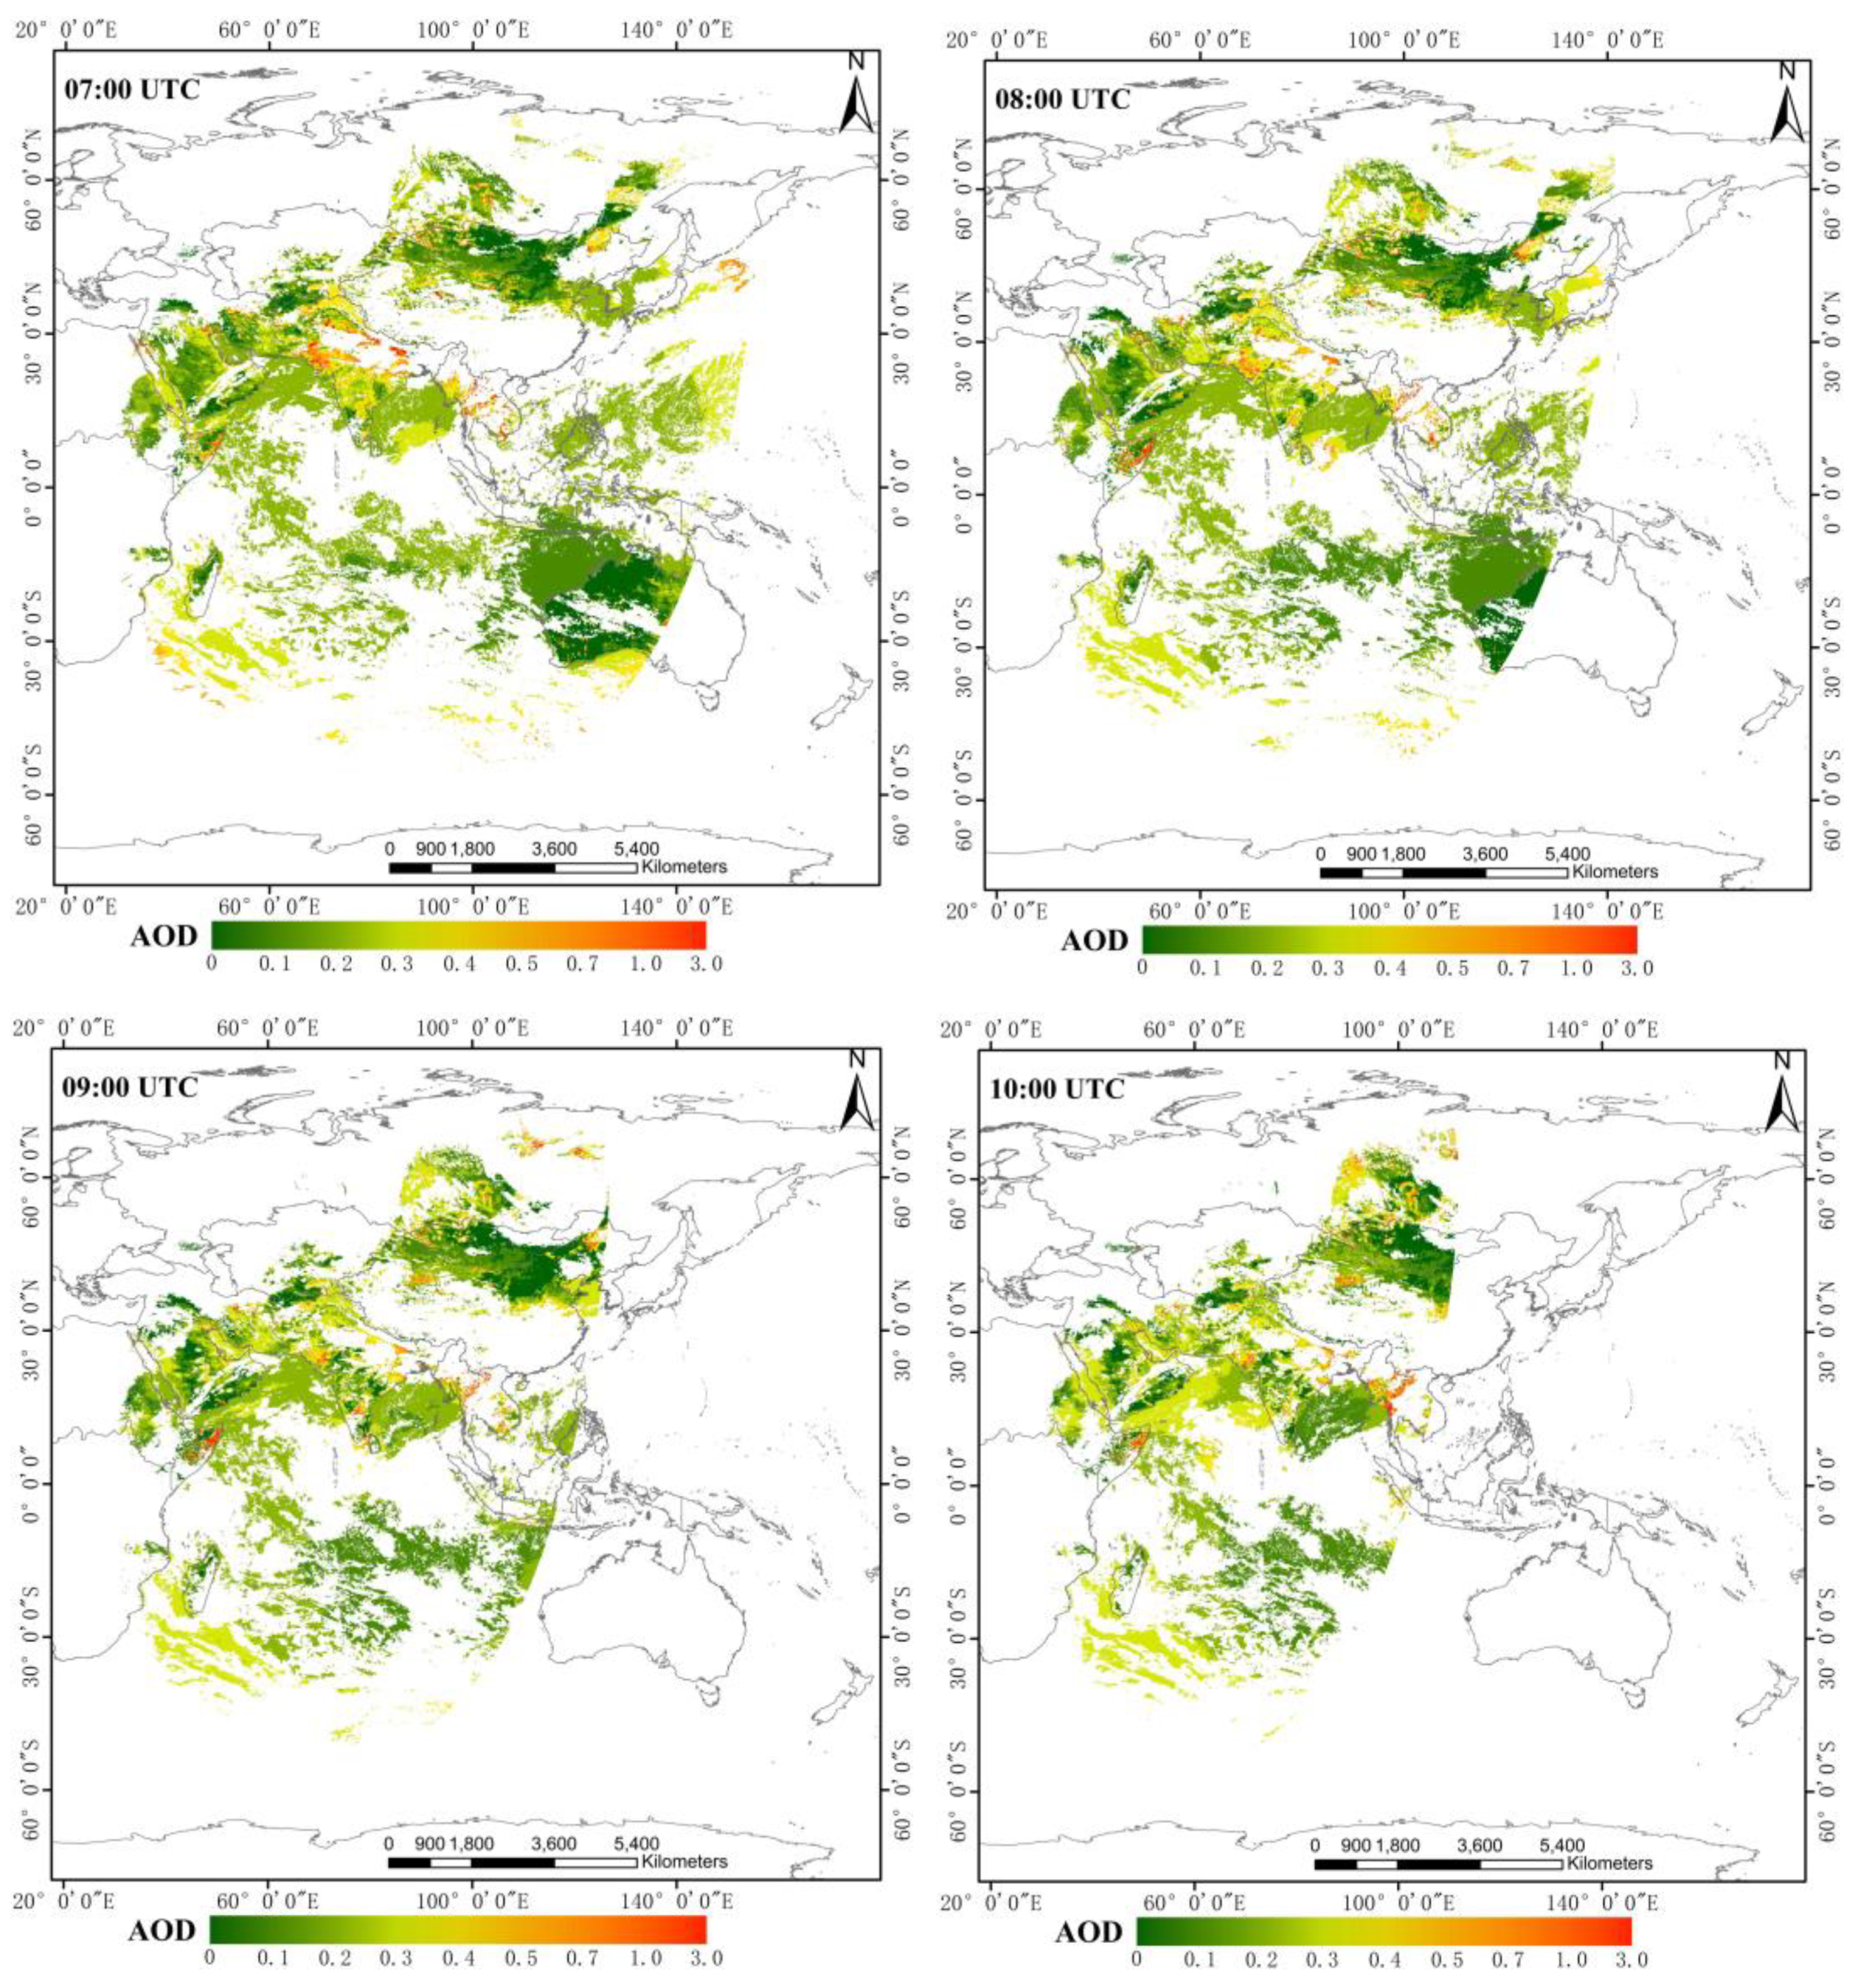
5.1. High Temporal Resolution Products
5.2. Comparison with Himawari-8 AOD
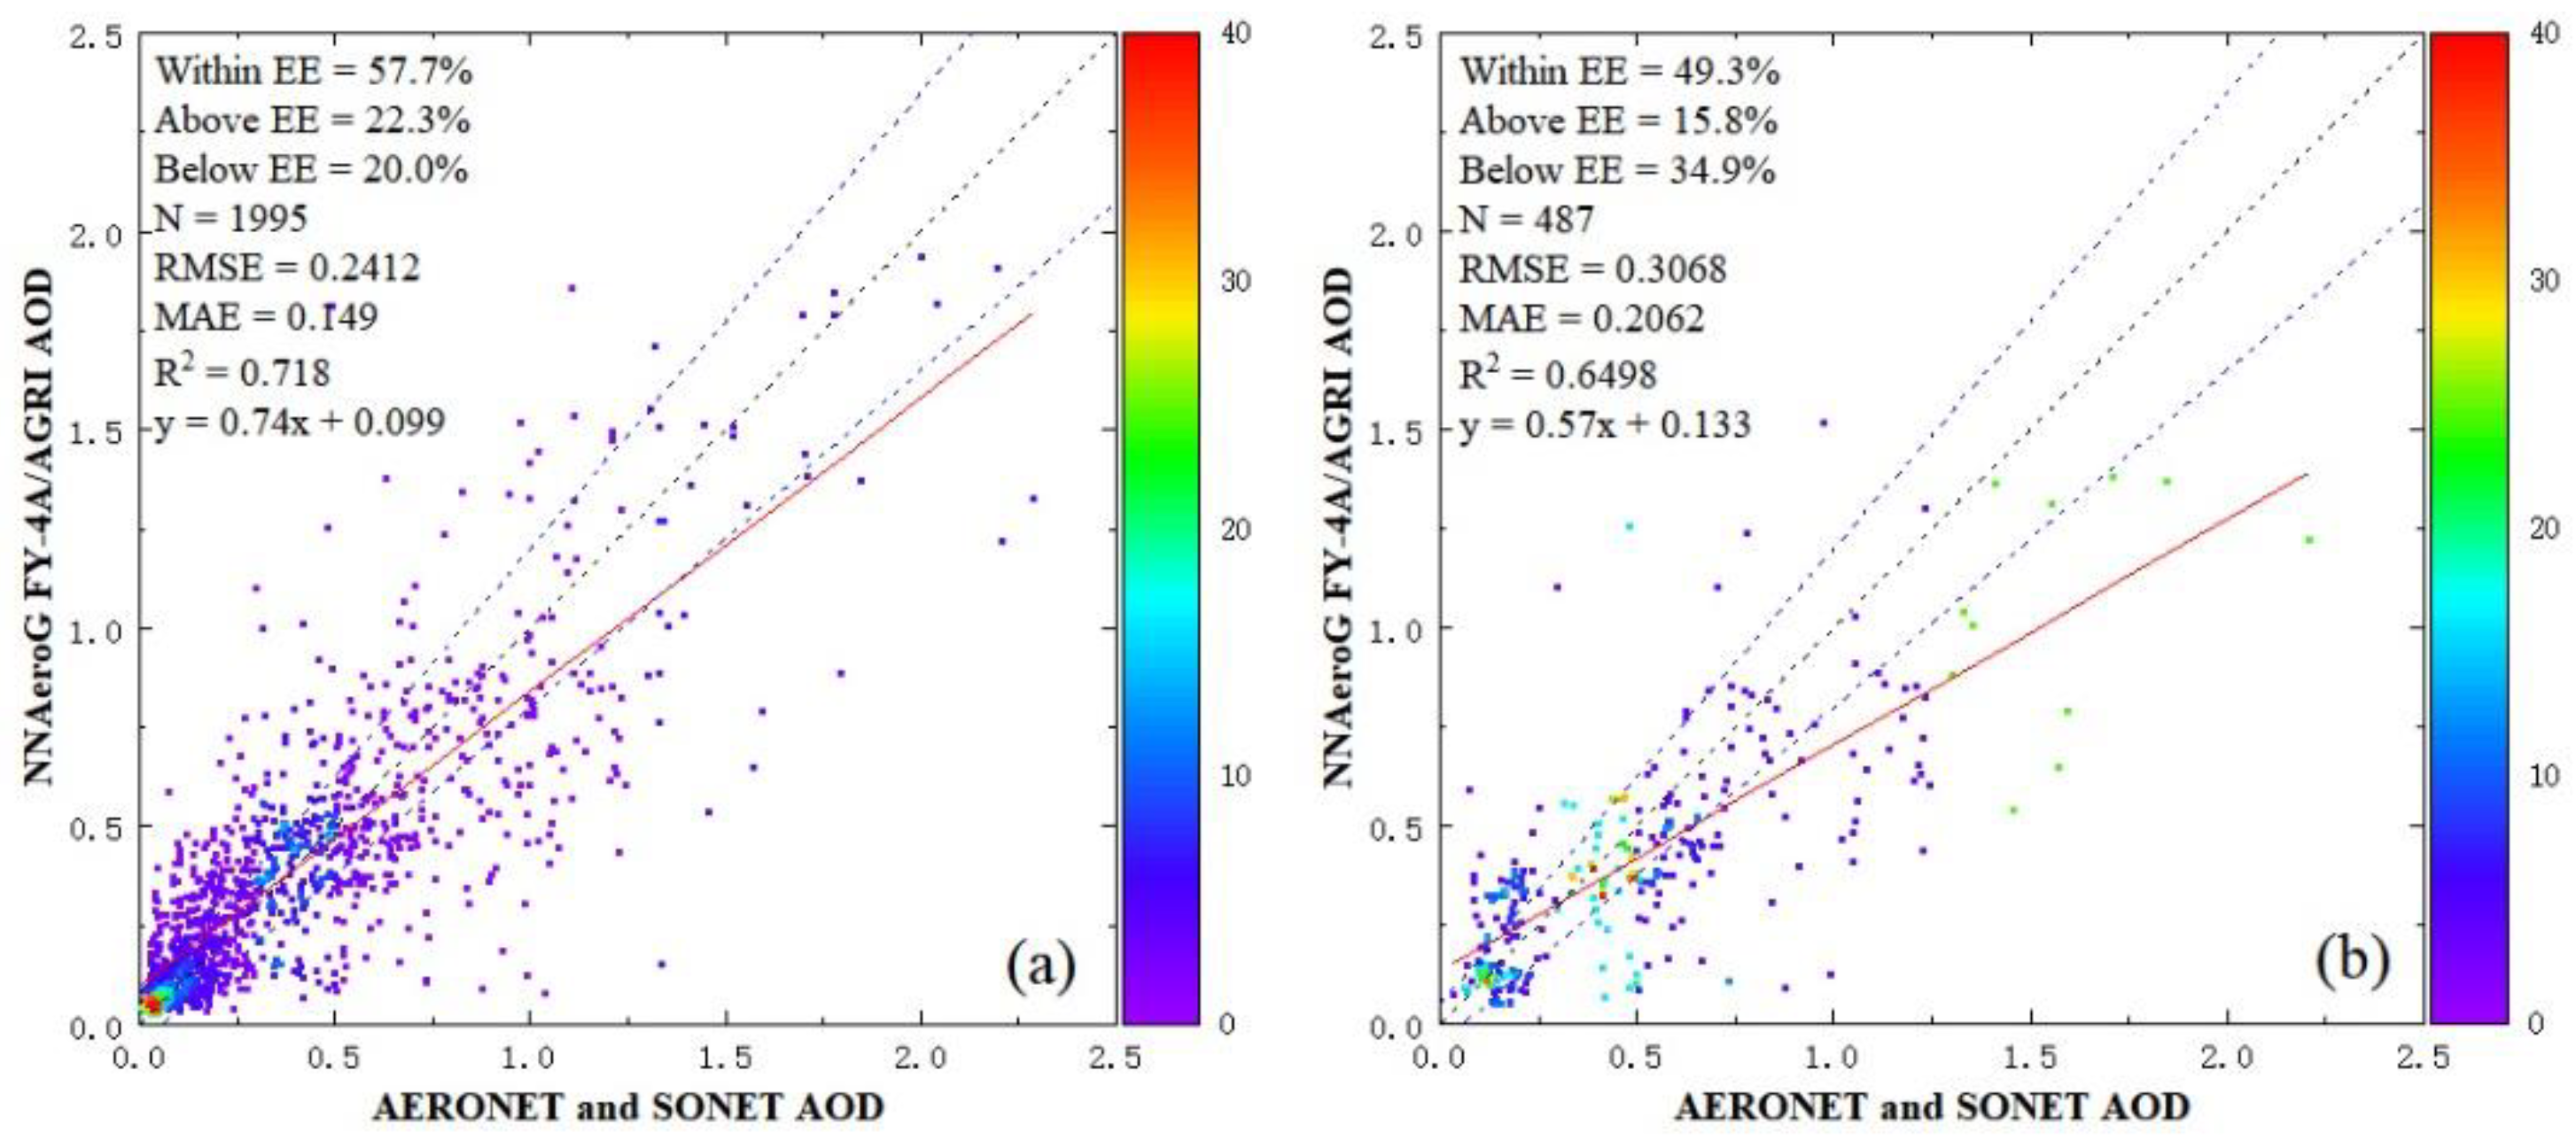
5.3. Improvement Test over Arid Area
6. Conclusions
Author Contributions
Funding
Data Availability Statement
Acknowledgments
Conflicts of Interest
References
- Kaufman, Y.J.; Tanré, D.; Gordon, H.R.; Nakajima, T.; Lenoble, J.; Frouin, R.; Grassl, H.; Herman, B.M.; King, M.D.; Teillet, P.M. Passive remote sensing of tropospheric aerosol and atmospheric correction for the aerosol effect. J. Geophys. Res. Atmos. 1997, 102, 16815–16830. [Google Scholar] [CrossRef] [Green Version]
- Yu, L.; Zhang, M.; Wang, L.; Lu, Y.; Li, J. Effects of aerosols and water vapour on spatial-temporal variations of the clear-sky surface solar radiation in China. Atmos. Res. 2021, 248, 16. [Google Scholar] [CrossRef]
- Qin, K.; Wang, L.; Wu, L.; Xu, J.; Rao, L.; Letu, H.; Shi, T.; Wang, R. A campaign for investigating aerosol optical properties during winter hazes over Shijiazhuang, China. Atmos. Res. 2017, 198, 113–122. [Google Scholar] [CrossRef]
- Holben, B.N.; Eck, T.F.; Slutsker, I.; Tanre, D.; Buis, J.P.; Setzer, A.; Vermote, E.; Reagan, J.A.; Kaufman, Y.J.; Nakajima, T.; et al. AERONET—A federated instrument network and data archive for aerosol characterization. Remote Sens. Environ. 1998, 66, 1–16. [Google Scholar] [CrossRef]
- Li, Z.; Gu, X.; Wang, L.; Li, D.; Xie, Y.; Li, K.; Dubovik, O.; Schuster, G.; Goloub, P.; Zhang, Y.; et al. Aerosol physical and chemical properties retrieved from ground-based remote sensing measurements during heavy haze days in Beijing winter. Atmos. Chem. Phys. 2013, 13, 10171–10183. [Google Scholar] [CrossRef] [Green Version]
- Ningombam, S.S.; Larson, E.J.L.; Dumka, U.C.; Estellés, V.; Campanelli, M.; Steve, C. Long-term (1995–2018) aerosol optical depth derived using ground based AERONET and SKYNET measurements from aerosol aged-background sites. Atmos. Pollut. Res. 2019, 10, 608–620. [Google Scholar] [CrossRef]
- Che, H.; Xia, X.; Zhao, H.; Dubovik, O.; Holben, B.N.; Goloub, P.; Cuevas-Agulló, E.; Estelles, V.; Wang, Y.; Zhu, J.; et al. Spatial distribution of aerosol microphysical and optical properties and direct radiative effect from the China Aerosol Remote Sensing Network. Atmos. Chem. Phys. 2019, 19, 11843–11864. [Google Scholar] [CrossRef] [Green Version]
- Hair, J.W.; Hostetler, C.A.; Cook, A.L.; Harper, D.B.; Ferrare, R.A.; Mack, T.L.; Welch, W.; Isquierdo, L.R.; Hovis, F.E. Airborne high spectral resolution lidar for profiling aerosol optical properties. Appl. Opt. 2008, 47, 6734–6752. [Google Scholar] [CrossRef] [Green Version]
- Burton, S.P.; Ferrare, R.A.; Hostetler, C.A.; Hair, J.W.; Rogers, R.R.; Obland, M.D.; Butler, C.F.; Cook, A.L.; Harper, D.B.; Froyd, K.D. Aerosol classification using airborne high spectral resolution LiDAR measurements–methodology and examples. Atmos. Meas. Tech. 2012, 5, 73–98. [Google Scholar] [CrossRef] [Green Version]
- Levy, R.C.; Mattoo, S.; Munchak, L.A.; Remer, L.A.; Sayer, A.M.; Patadia, F.; Hsu, N.C. The collection 6 MODIS aerosol products over land and ocean. Atmos. Meas. Tech. 2013, 6, 2989–3034. [Google Scholar] [CrossRef]
- Kolmonen, P.; Sogacheva, L.; Virtanen, T.H.; de Leeuw, G.; Kulmala, M. The ADV/ASV AATSR aerosol retrieval algorithm: Current status and presentation of a full-mission AOD datase. Int. J. Digit. Earth 2016, 9, 545–561. [Google Scholar] [CrossRef]
- Che, H.; Gui, K.; Xia, X.; Wang, Y.; Holben, B.N.; Goloub, P.; Cuevas-Agulló, E.; Wang, H.; Zheng, Y.; Zhao, H.; et al. Large contribution of meteorological factors to inter-decadal changes in regional aerosol optical depth. Atmos. Chem. Phys. 2019, 19, 10497–10523. [Google Scholar] [CrossRef] [Green Version]
- She, L.; Xue, Y.; Yang, X.; Leys, J.; Guang, J.; Che, Y.; Fan, C.; Xie, Y.; Li, Y. Joint retrieval of aerosol optical depth and surface reflectance over land using geostationary satellite data. IEEE Trans. Geosci. Remote Sens. 2019, 57, 1489–1501. [Google Scholar] [CrossRef]
- Yang, F.; Wang, Y.; Tao, J.; Wang, Z.; Fan, M.; de Leeuw, G.; Chen, L. Preliminary investigation of a new AHI aerosol optical depth (AOD) retrieval algorithm and evaluation with multiple source AOD measurements in China. Remote Sens. 2018, 10, 748. [Google Scholar] [CrossRef] [Green Version]
- Li, L.; Dubovik, O.; Derimian, Y.; Schuster, G.L.; Lapyonok, T.; Litvinov, P.; Ducos, F.; Fuertes, D.; Chen, C.; Li, Z.; et al. Retrieval of aerosol components directly from satellite and ground-based measurements. Atmos. Chem. Phys. 2019, 19, 13409–13443. [Google Scholar] [CrossRef] [Green Version]
- Li, L.; Che, H.; Zhang, X.; Chen, C.; Chen, X.; Gui, K.; Liang, Y.; Wang, F.; Derimian, Y.; Fuertes, D.; et al. A satellite-measured view of aerosol component content and optical property in a haze-polluted case over North China Plain. Atmos. Res. 2022, 266, 105958. [Google Scholar] [CrossRef]
- Li, L.; Derimian, Y.; Chen, C.; Zhang, X.; Che, H.; Schuster, G.L.; Fuertes, D.; Litvinov, P.; Lapyonok, T.; Lopatin, A.; et al. Climatology of aerosol component concentrations derived from multi-angular polarimetric POLDER-3 observations using GRASP algorithm. Earth Syst. Sci. Data 2022, 14, 3439–3469. [Google Scholar] [CrossRef]
- de Leeuw, G.; Holzer-Popp, T.; Bevan, S.; Davies, W.H.; Descloitres, J.; Grainger, R.G.; Griesfeller, J.; Heckel, A.; Kinne, S.; Klüser, L.; et al. Evaluation of seven European aerosol optical depth retrieval algorithms for climate analysis. Remote Sens. Environ. 2015, 162, 295–315. [Google Scholar] [CrossRef] [Green Version]
- Yoshida, M.; Kikuchi, M.; Nagao, T.M.; Murakami, H.; Nomaki, T.; Higurashi, A. Common retrieval of aerosol properties for imaging satellite sensors. J. Meteorol. Soc. Jpn. Ser. II 2018, 96B, 193–209. [Google Scholar] [CrossRef] [Green Version]
- Ge, B.; Li, Z.; Liu, L.; Yang, L.; Chen, X.; Hou, W.; Zhang, Y.; Li, D.; Li, L.; Qie, L. A Dark Target Method for Himawari-8/AHI Aerosol Retrieval: Application and Validation. IEEE Trans. Geosci. Remote Sens. 2019, 57, 381–393. [Google Scholar] [CrossRef]
- Li, D.; Qin, K.; Wu, L.; Mei, L.; de Leeuw, G.; Xue, Y.; Shi, Y.; Li, Y. Himawari-8-Derived Aerosol Optical Depth Using an Improved Time Series Algorithm Over Eastern China. Remote Sens. 2020, 12, 978. [Google Scholar] [CrossRef]
- Wang, L.; Yu, C.; Cai, K.; Zheng, F.; Li, S. Retrieval of Aerosol Optical Depth from the Himawari-8 Advanced Himawari Imager data: Application over Beijing in the summer of 2016. Atmos. Environ. 2020, 241, 117788. [Google Scholar] [CrossRef]
- She, L.; Zhang, H.K.; Li, Z.; de Leeuw, G.; Huang, B. Himawari-8 Aerosol Optical Depth (AOD) Retrieval Using a Deep Neural Network Trained Using AERONET Observations. Remote Sens. 2020, 12, 4125. [Google Scholar] [CrossRef]
- Chen, X.; Zhao, L.; Zheng, F.; Li, J.; Li, L.; Ding, H.; Zhang, K.; Liu, S.; Li, D.; de Leeuw, G. Neural Network AEROsol Retrieval for Geostationary Satellite (NNAeroG) Based on Temporal, Spatial and Spectral Measurements. Remote Sens. 2022, 14, 980. [Google Scholar] [CrossRef]
- Jiang, X.; Xue, Y.; Jin, C.; Bai, R.; Li, N.; Sun, Y. Retrieval of Aerosol Optical Depth Over Land Using Fy-4Aagri Geostationary Satellite Data. In Proceedings of the 2021 IEEE International Geoscience and Remote Sensing Symposium (IGARSS), Brussels, Belgium, 11–16 July 2021; pp. 1931–1934. [Google Scholar]
- Xie, Y.; Li, Z.; Guang, J.; Hou, W.; Salam, A.; Ali, Z.; Fang, L. Aerosol Optical Depth Retrieval Over South Asia Using FY-4A/AGRI Data. IEEE Trans. Geosci. Remote Sens. 2022, 60, 4104814. [Google Scholar] [CrossRef]
- Chen, X.; de Leeuw, G.; Arola, A.; Liu, S.; Liu, Y.; Li, Z.; Zhang, K. Joint retrieval of the aerosol fine mode fraction and optical depth using MODIS spectral reflectance over northern and eastern China: Artificial neural network method. Remote Sens. Environ. 2020, 249, 112006. [Google Scholar] [CrossRef]
- Holben, B.N.; Tanré, D.; Smirnov, A.; Eck, T.F.; Slutsker, I.; Abuhassan, N.; Newcomb, W.W.; Schafer, J.S.; Chatenet, B.; Lavenu, F.; et al. An emerging ground-based aerosol climatology: Aerosol optical depth from AERONET. J. Geophys. Res. Atmos. 2001, 106, 12067–12097. [Google Scholar] [CrossRef]
- Li, Z.Q.; Xu, H.; Li, K.T.; Li, D.H.; Xie, Y.S.; Li, L.; Zhang, Y.; Gu, X.F.; Zhao, W.; Tian, Q.J.; et al. Comprehensive study of optical, physical, chemical, and radiative properties of total columnar atmospheric aerosols over China: An overview of sun–sky radiometer observation network (SONET) measurements. Bull. Am. Meteorol. Soc. 2018, 99, 739–755. [Google Scholar] [CrossRef]
- Yang, J.; Zhang, Z.; Wei, C.; Lu, F.; Guo, Q. Introducing the new generation of Chinese geostationary weather satellites, Fengyun-4. Bull. Am. Meteorol. Soc. 2017, 98, 1637–1658. [Google Scholar] [CrossRef]
- Wang, G.; Jiang, L.; Liu, X.; Cui, H.; Yang, J.; Wang, J. Estimation of Fractional Snow Cover From Fy-4a/Agri. In Proceedings of the 2019 IEEE International Geoscience and Remote Sensing Symposium (IGARSS), Yokohama, Japan, 28 July–2 August 2019; pp. 4064–4067. [Google Scholar]
- Qiao, H.; Zhang, P.; Li, Z.; Liu, C. A New Geostationary Satellite-Based Snow Cover Recognition Method for FY-4A AGRI. IEEE Trans. Geosci. Remote Sens. 2021, 14, 11372–11385. [Google Scholar] [CrossRef]
- Tan, Z.; Ma, S.; Zhao, X.; Yan, W.; Lu, W. Evaluation of Cloud Top Height Retrievals from China’s Next-Generation Geostationary Meteorological Satellite FY-4A. J. Meteorol. Res. 2019, 33, 553–562. [Google Scholar] [CrossRef]
- Lu, F.; Zhang, X.; Chen, B.; Liu, H.; Wu, R.; Han, Q.; Feng, X.; Li, Y.; Zhang, Z. FY-4 geostationary meteorological satellite imaging characteristics and its application prospects. J. Mar. Meteorol. 2017, 37, 1–12. [Google Scholar]
- Eck, T.F.; Holben, B.N.; Reid, J.S.; Dubovik, O.; Smirnov, A.; O’Neill, N.T.; Slutsker, I.; Kinne, S. Wavelength dependence of the optical depth of biomass burning, urban, and desert dust aerosols. J. Geophys. Res. 1999, 104, 31333–31349. [Google Scholar] [CrossRef]
- Giles, D.M.; Sinyuk, A.; Sorokin, M.G.; Schafer, J.S.; Smirnov, A.; Slutsker, I.; Eck, T.F.; Holben, B.N.; Lewis, J.R.; Campbell, J.R.; et al. Advancements in the aerosol robotic network (AERONET) version 3 database–automated near-real-time quality control algorithm with improved cloud screening for sun photometer aerosol optical depth (AOD) measurements. Atmos. Meas. Tech. 2019, 12, 169–209. [Google Scholar] [CrossRef] [Green Version]
- Li, Z.; Li, D.; Li, K.; Xu, H.; Chen, X.; Chen, C.; Xie, Y.; Li, L.; Li, L.; Li, W.; et al. Sun-sky radiometer observation network with the extension of multi-wavelength polarization measurements. J. Remote Sens. 2015, 19, 495–519. [Google Scholar]
- Xie, Y.; Li, Z.; Li, D.; Xu, H.; Li, K. Aerosol Optical and Microphysical Properties of Four Typical Sites of SONET in China Based on Remote Sensing Measurements. Remote Sens. 2015, 7, 9928–9953. [Google Scholar] [CrossRef] [Green Version]
- Yan, X.; Liang, C.; Jiang, Y.; Luo, N.; Zang, Z.; Li, Z. A deep learning approach to improve the retrieval of temperature and humidity profiles from a ground-based microwave radiometer. IEEE Trans. Geosci. Remote Sens. 2020, 58, 842–8437. [Google Scholar] [CrossRef]
- Glorot, X.; Bordes, A.; Bengio, Y. Deep sparse rectifier neural networks. In Proceedings of the Fourteenth International Conference on Artificial Intelligence and Statistics, Fort Lauderdale, FL, USA, 11–13 April 2011; pp. 315–323. [Google Scholar]
- Levy, R.C.; Remer, L.A.; Kleidman, R.G.; Mattoo, S.; Ichoku, C.; Kahn, R.; Eck, T.F. Global evaluation of the Collection 5 MODIS dark-target aerosol products over land. Atmos. Chem. Phys. 2010, 10, 10399–10420. [Google Scholar] [CrossRef] [Green Version]
- Xiao, Q.; Zhang, H.; Choi, M.; Li, S.; Kondragunta, S.; Kim, J.; Holben, B.; Levy, R.C.; Liu, Y. Evaluation of VIIRS, GOCI, and MODIS Collection 6 AOD retrievals against ground sunphotometer observations over East Asia. Atmos. Chem. Phys. 2016, 16, 1255–1269. [Google Scholar] [CrossRef] [Green Version]
- Wang, X.; Min, M.; Wang, F.; Guo, J.; Li, B.; Tang, S. Intercomparisons of Cloud Mask Products Among Fengyun-4A, Himawari-8, and MODIS. IEEE Trans. Geosci. Remote Sens. 2019, 57, 8827–8839. [Google Scholar] [CrossRef]
- Zhang, P.; Zhu, L.; Tang, S.; Gao, L.; Chen, L.; Zheng, W.; Han, X.; Chen, J.; Shao, J. General Comparison of FY-4A/AGRI With Other GEO/LEO Instruments and Its Potential and Challenges in Non-meteorological Applications. Front. Earth Sci. 2019, 6, 224. [Google Scholar] [CrossRef] [Green Version]
- Tian, X.; Sun, L. Retrieval of Aerosol Optical Depth over Arid Areas from MODIS Data. Atmosphere 2016, 7, 134. [Google Scholar] [CrossRef]
- Wang, Y.; Wang, J.; Levy, R.C.; Xu, X.; Reid, J.S. MODIS Retrieval of Aerosol Optical Depth over Turbid Coastal Water. Remote Sens. 2017, 9, 595. [Google Scholar] [CrossRef] [PubMed] [Green Version]
- Wang, Y.; Wang, J.; Levy, R.C.; Shi, Y.R.; Mattoo, S.; Reid, J.S. First retrieval of AOD at fine resolution over shallow and turbid coastal waters from MODIS. Geophys. Res. Lett. 2021, 48, e2021GL094344. [Google Scholar] [CrossRef]
- Lin, M.; Begho, T. Crop residue burning in South Asia: A review of the scale, effect, and solutions with a focus on reducing reactive nitrogen losses. J. Environ. Manag. 2022, 314, 115104. [Google Scholar] [CrossRef]


| Band Notation | Band | Central Wavelength (nm) | Spatial Resolution (km) |
|---|---|---|---|
| VIS | 1 | 0.45~0.49 | 1 |
| 2 | 0.55~0.75 | 0.5~1 | |
| NIR | 3 | 0.75~0.90 | 1 |
| Cirrus | 4 | 1.36~1.39 | 2 |
| SWIR | 5 | 1.58~1.64 | 2 |
| 6 | 2.1~2.35 | 2~4 | |
| 7 | 3.5~4.0 | 2 | |
| 8 | 3.5~4.0 | 4 | |
| Water | 9 | 5.8~6.7 | 4 |
| Vapor | 10 | 6.9~7.3 | 4 |
| TIR | 11 | 8.0~9.0 | 4 |
| 12 | 10.3~11.3 | 4 | |
| 13 | 11.5~12.5 | 4 | |
| 14 | 13.2~13.8 | 4 |
| Site Name | Position | Purpose | Characteristics |
|---|---|---|---|
| UEM_Maputo | 25.950°S, 32.599°E | Validation | marine and coastal |
| Qena_SVU | 26.2°N, 32.747°E | Validation | arid |
| Tel-Aviv_University | 32.113°N, 34.806°E | Validation | marine and coastal |
| Maido_OPAR | 21.08°S, 55.383°E | Validation | marine and coastal |
| Tomsk_22 | 56.417°N, 84.074°E | Validation | vegetated |
| Masdar_Institute_2 | 24.442°N, 54.617°E | Validation | marine and coastal |
| IAOCA-KRSU | 42.464°N, 78.529°E | Validation | arid |
| Lumbini | 27.49°N, 83.28°E | Validation | arid |
| Doi_Inthanon | 18.59°N, 98.486°E | Validation | vegetated |
| Pioneer_JC | 1.384°N, 103.755°E | Validation | marine and coastal |
| BMKG_Jakarta | 6.155°S, 106.841°E | Validation | marine and coastal |
| Fowlers_Gap | 31.086°S, 141.701°E | Validation | arid |
| Jabiru | 12.661°S, 132.893°E | Validation | marine and coastal |
| Pontianak | 0.075°N, 109.191°E | Validation | marine and coastal |
| DRAGON_Minowa | 35.915°N, 137.981°E | Validation | vegetated |
| KORUS_UNIST_Ulsan | 35.582°N, 129.19°E | Validation | vegetated |
| Seoul_SNU | 37.458°N, 126.951°E | Validation | vegetated |
| Chiayi | 23.496°N, 120.496°E | Validation | marine and coastal |
| QOMS_CAS | 28.365°N, 86.948°E | Validation | arid |
| Beijing-CAMS | 39.933°N, 116.317°E | Validation | vegetated |
| Hong_Kong_PolyU | 22.303°N, 114.18°E | Validation | marine and coastal |
| Taihu | 31.421°N, 120.215°E | Validation | marine and coastal |
| Son_La | 21.332°N, 103.905°E | Validation | vegetated |
| Amity_Univ_Gurgaon | 28.317°N, 76.916°E | Validation | vegetated |
| Dhaka_University | 23.728°N, 90.398°E | Validation | marine and coastal |
| Site Name | Position | Purpose | Characteristics |
|---|---|---|---|
| Sanya | 18.29°N, 109.379°E | Training | marine and coastal |
| Guangzhou | 23.069°N, 113.381°E | Training | marine and coastal |
| Yanqihu | 40.408°N, 116.674°E | Training | marine and coastal |
| Shanghai | 31.284°N, 121.481°E | Training | marine and coastal |
| Zhoushan | 29.994°N, 122.19°E | Training | marine and coastal |
| Harbin | 45.705°N, 126.614°E | Training | vegetation |
| Chengdu | 30.584°N, 104.989°E | Training | vegetation |
| Xian | 34.223°N, 109.001°E | Training | arid |
| Nanjing | 32.115°N, 118.957°E | Training | vegetation |
| Hefei | 31.905°N, 117.162°E | Training | vegetation |
| Zhangye | 38.854°N, 100.364°E | Training | arid |
| Kashi | 39.504°N, 75.93°E | Training | arid |
| Lhasa | 29.648°N, 91.088°E | Training | arid |
| Minqin | 38.633°N, 103.089°E | Validation | arid |
| Songshan | 34.535°N, 113.096°E | Validation | vegetation |
| Nanning | 22.839°N, 108.285°E | Validation | vegetation |
| Method | Literature | Sensor | RMSE | MAE | R2 | % In EE | Study Area |
|---|---|---|---|---|---|---|---|
| DNN | She et al. [23] | AHI | 0.172 | — | 0.730 | — | Full disk |
| JAXA | She et al. [23] | AHI | 0.378 | — | 0.333 | — | Full disk |
| NNAeroG | Chen et al. [24] | AHI | 0.124 | 0.092 | 0.859 | 58.7% | China |
| NNAeroG | This paper | AGRI | 0.237 | 0.145 | 0.733 | 63.7% | Full disk |
Publisher’s Note: MDPI stays neutral with regard to jurisdictional claims in published maps and institutional affiliations. |
© 2022 by the authors. Licensee MDPI, Basel, Switzerland. This article is an open access article distributed under the terms and conditions of the Creative Commons Attribution (CC BY) license (https://creativecommons.org/licenses/by/4.0/).
Share and Cite
Ding, H.; Zhao, L.; Liu, S.; Chen, X.; de Leeuw, G.; Wang, F.; Zheng, F.; Zhang, Y.; Liu, J.; Li, J.; et al. FY-4A/AGRI Aerosol Optical Depth Retrieval Capability Test and Validation Based on NNAeroG. Remote Sens. 2022, 14, 5591. https://doi.org/10.3390/rs14215591
Ding H, Zhao L, Liu S, Chen X, de Leeuw G, Wang F, Zheng F, Zhang Y, Liu J, Li J, et al. FY-4A/AGRI Aerosol Optical Depth Retrieval Capability Test and Validation Based on NNAeroG. Remote Sensing. 2022; 14(21):5591. https://doi.org/10.3390/rs14215591
Chicago/Turabian StyleDing, Haonan, Limin Zhao, Shanwei Liu, Xingfeng Chen, Gerrit de Leeuw, Fu Wang, Fengjie Zheng, Yuhuan Zhang, Jun Liu, Jiaguo Li, and et al. 2022. "FY-4A/AGRI Aerosol Optical Depth Retrieval Capability Test and Validation Based on NNAeroG" Remote Sensing 14, no. 21: 5591. https://doi.org/10.3390/rs14215591