
An Operational Atmospheric Correction Framework for Multi-Source Medium-High-Resolution Remote Sensing Data of China


Abstract
:1. Introduction
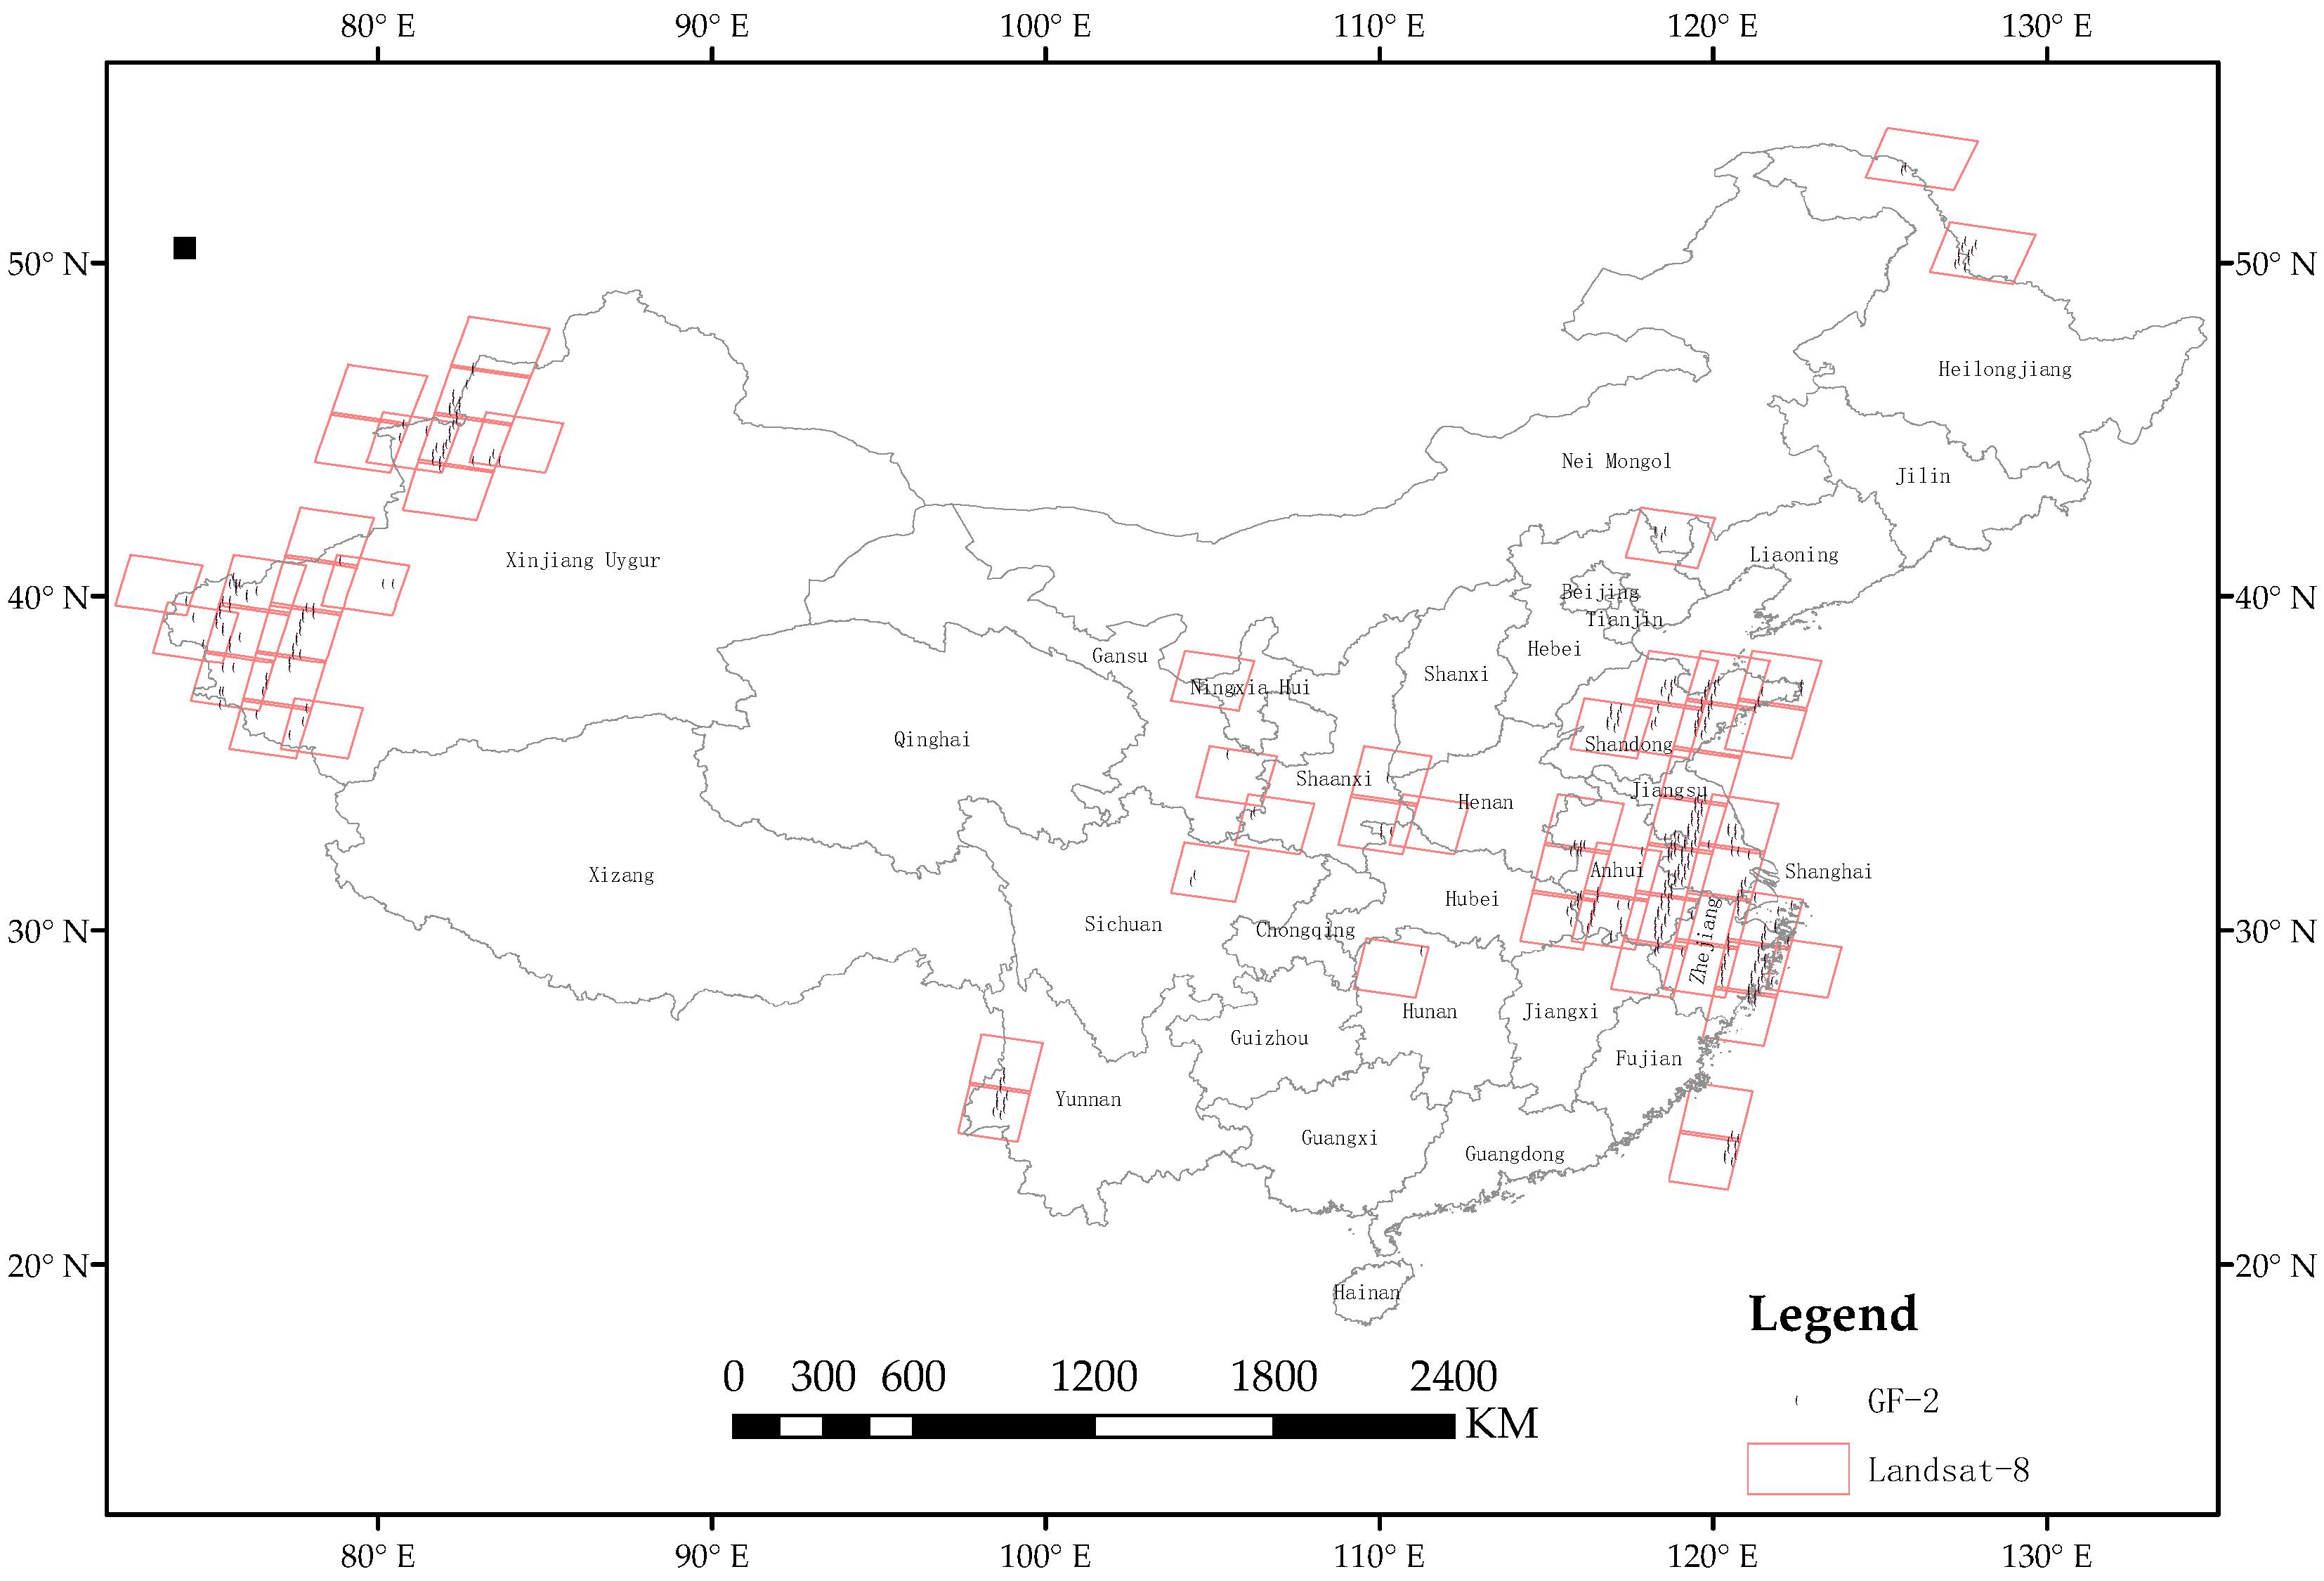
2. Datasets
3. Algorithm Strategy
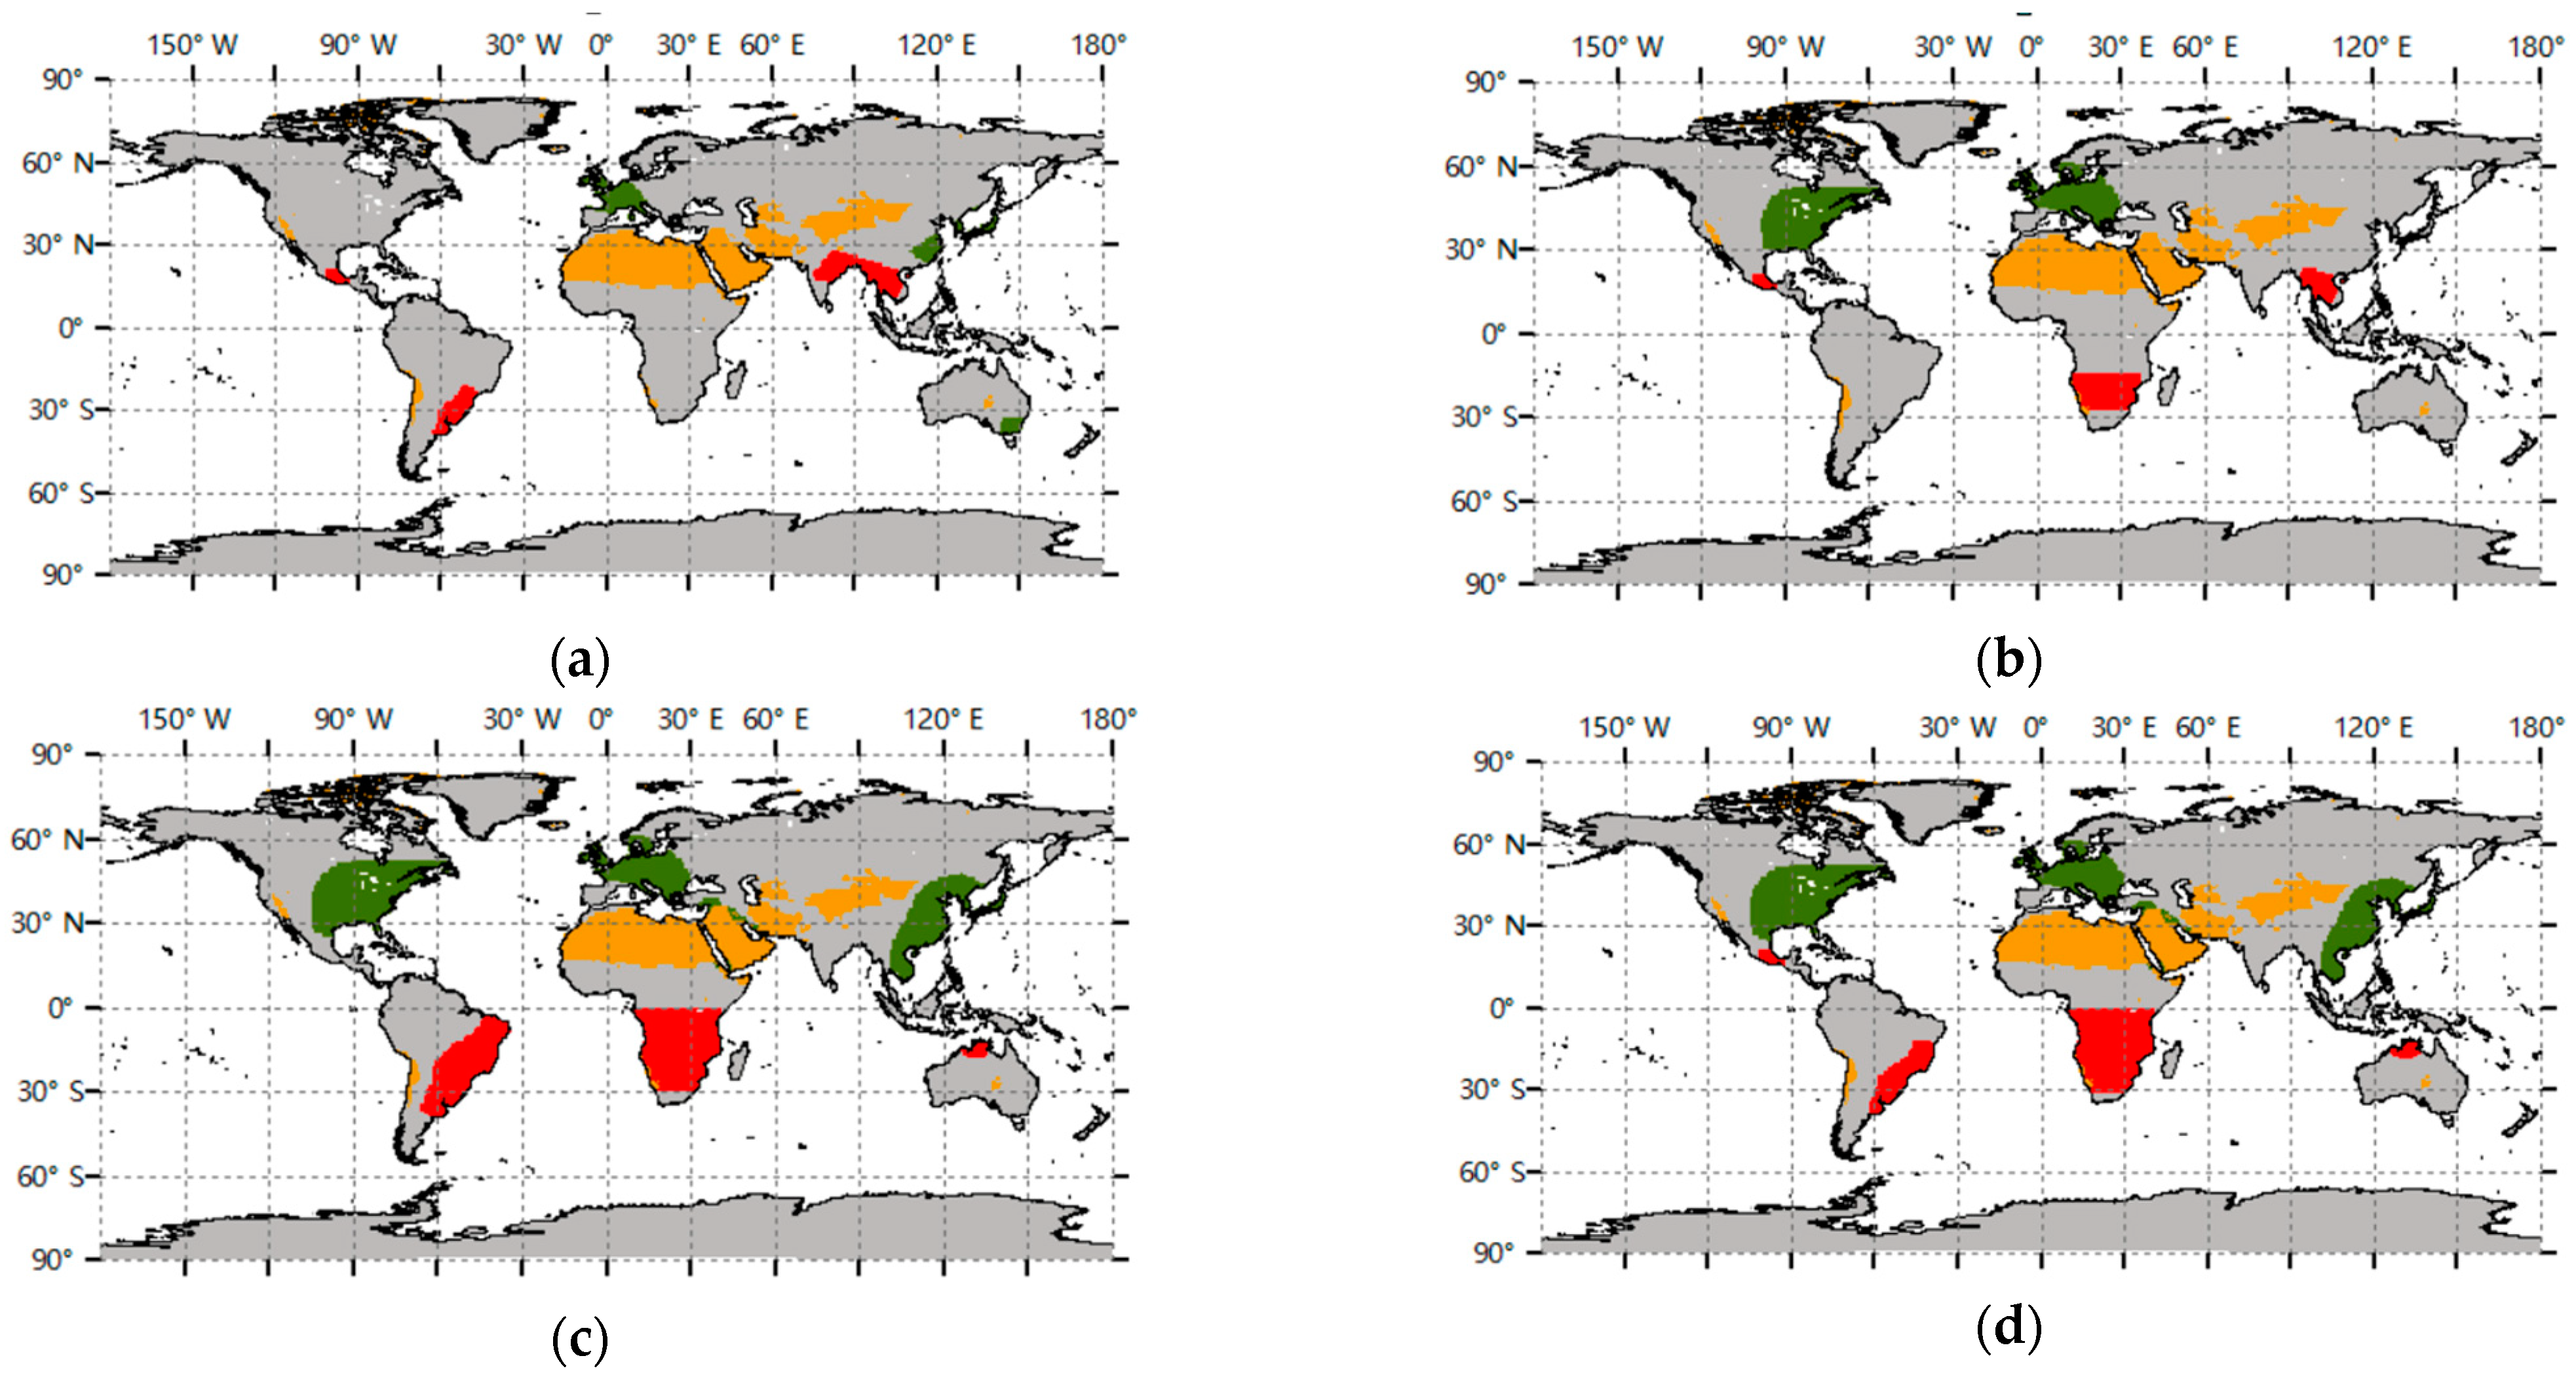
3.1. Aerosol Type Selection
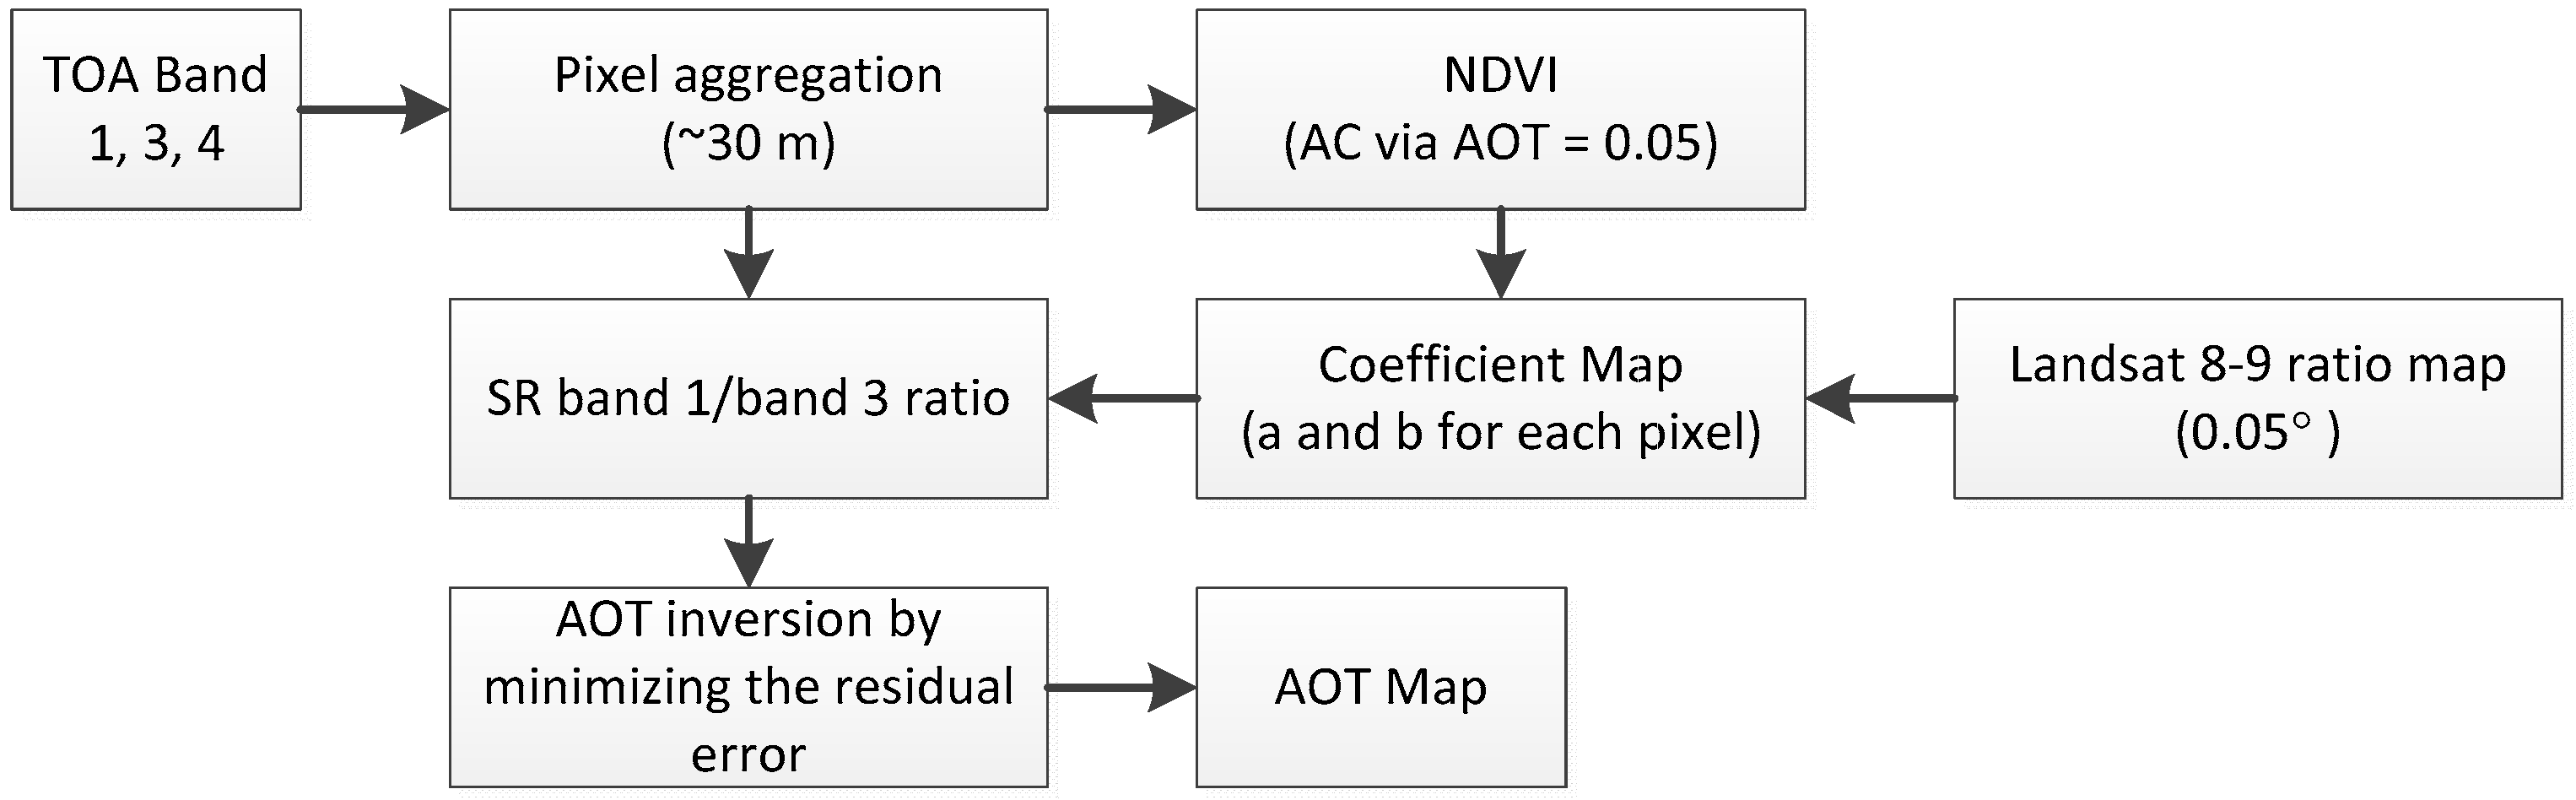
3.2. AOT Retrieval
3.3. Atmospheric Correction
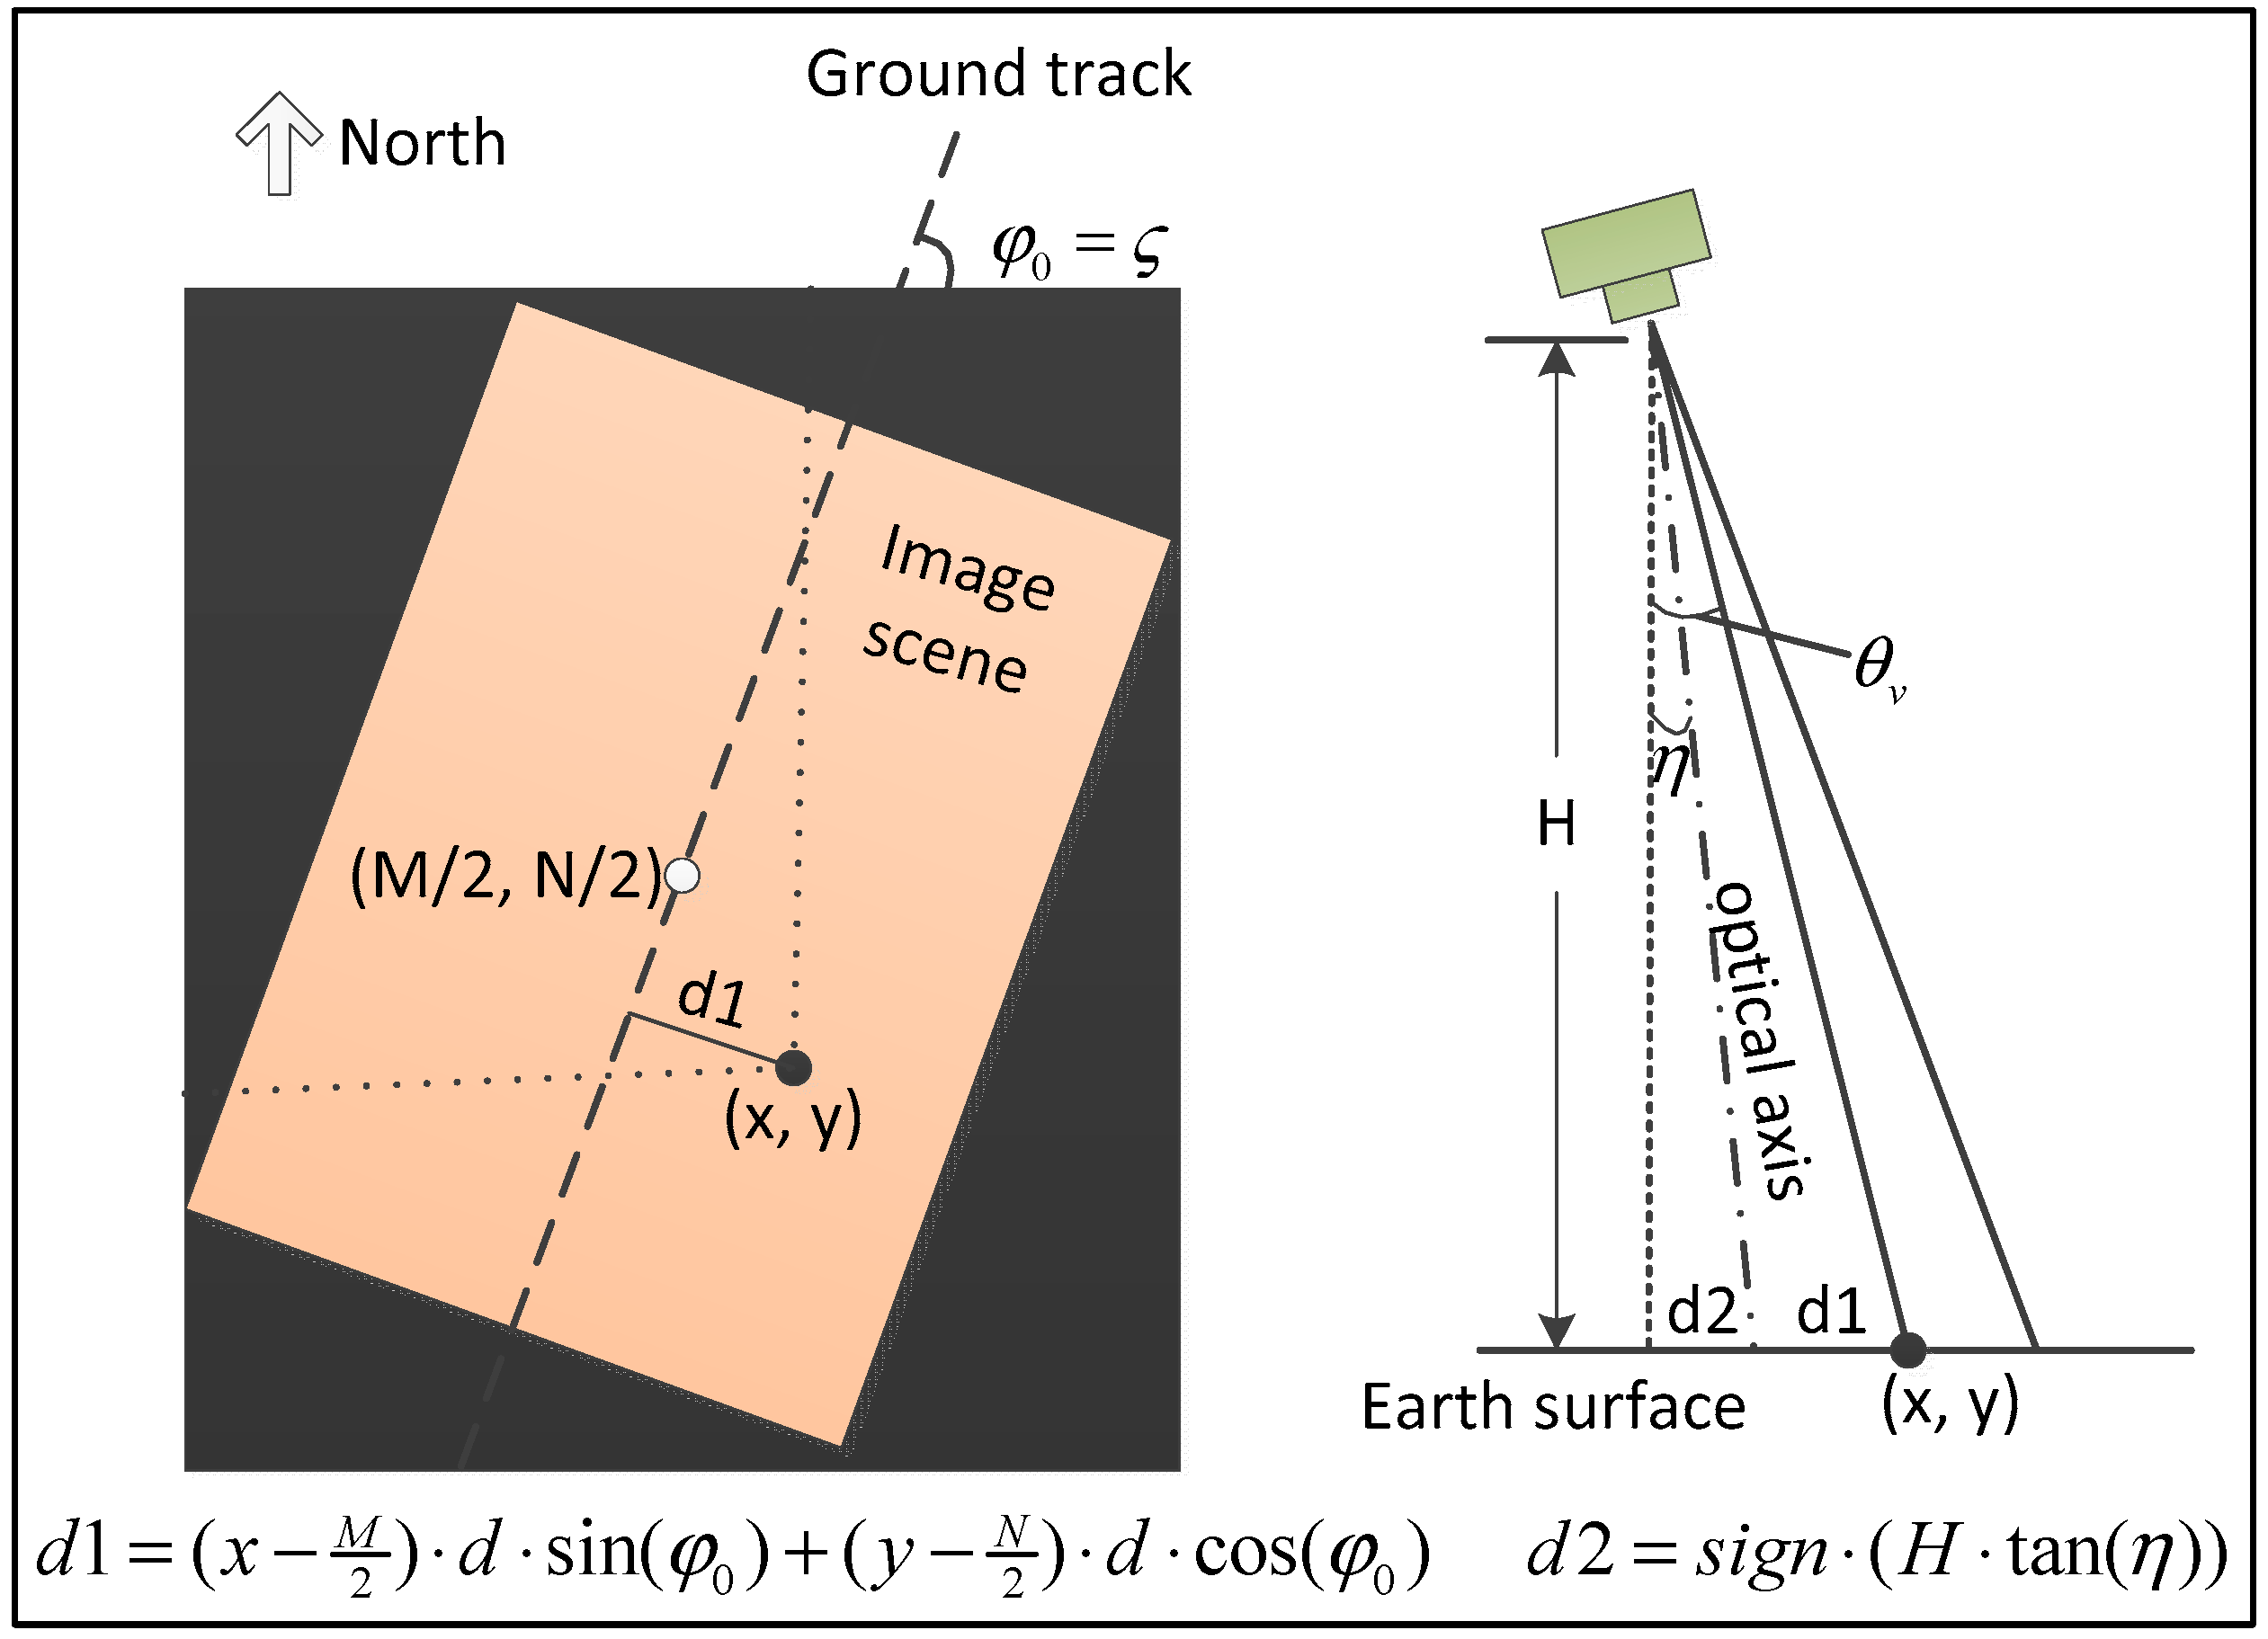
3.3.1. Imaging Geometry and Apparent Reflectance Computation
3.3.2. Gaseous Transmission Correction
3.3.3. Land Surface Reflectance (LSR) Inversion
- (1)
- : The Rayleigh optical thickness at standard pressure.
- (2)
- : The intrinsic reflectance at standard pressure.
- (3)
- : The atmospheric transmission at standard pressure.
- (4)
- : The atmospheric spherical albedo at standard pressure.
4. LUT Design
5. System Design and Implementation
5.1. Cloud- and Water-Related Masking
- Step 1. Background masking
- Step 2. Water-related masking
- Step 3. Cloud-related masking
5.2. LSR Product Format
6. Preliminary Results
6.1. Product Accuracy
- (1)
- GF-2 3.2 m LSR spatial aggregation to 30 m resolution.
- (2)
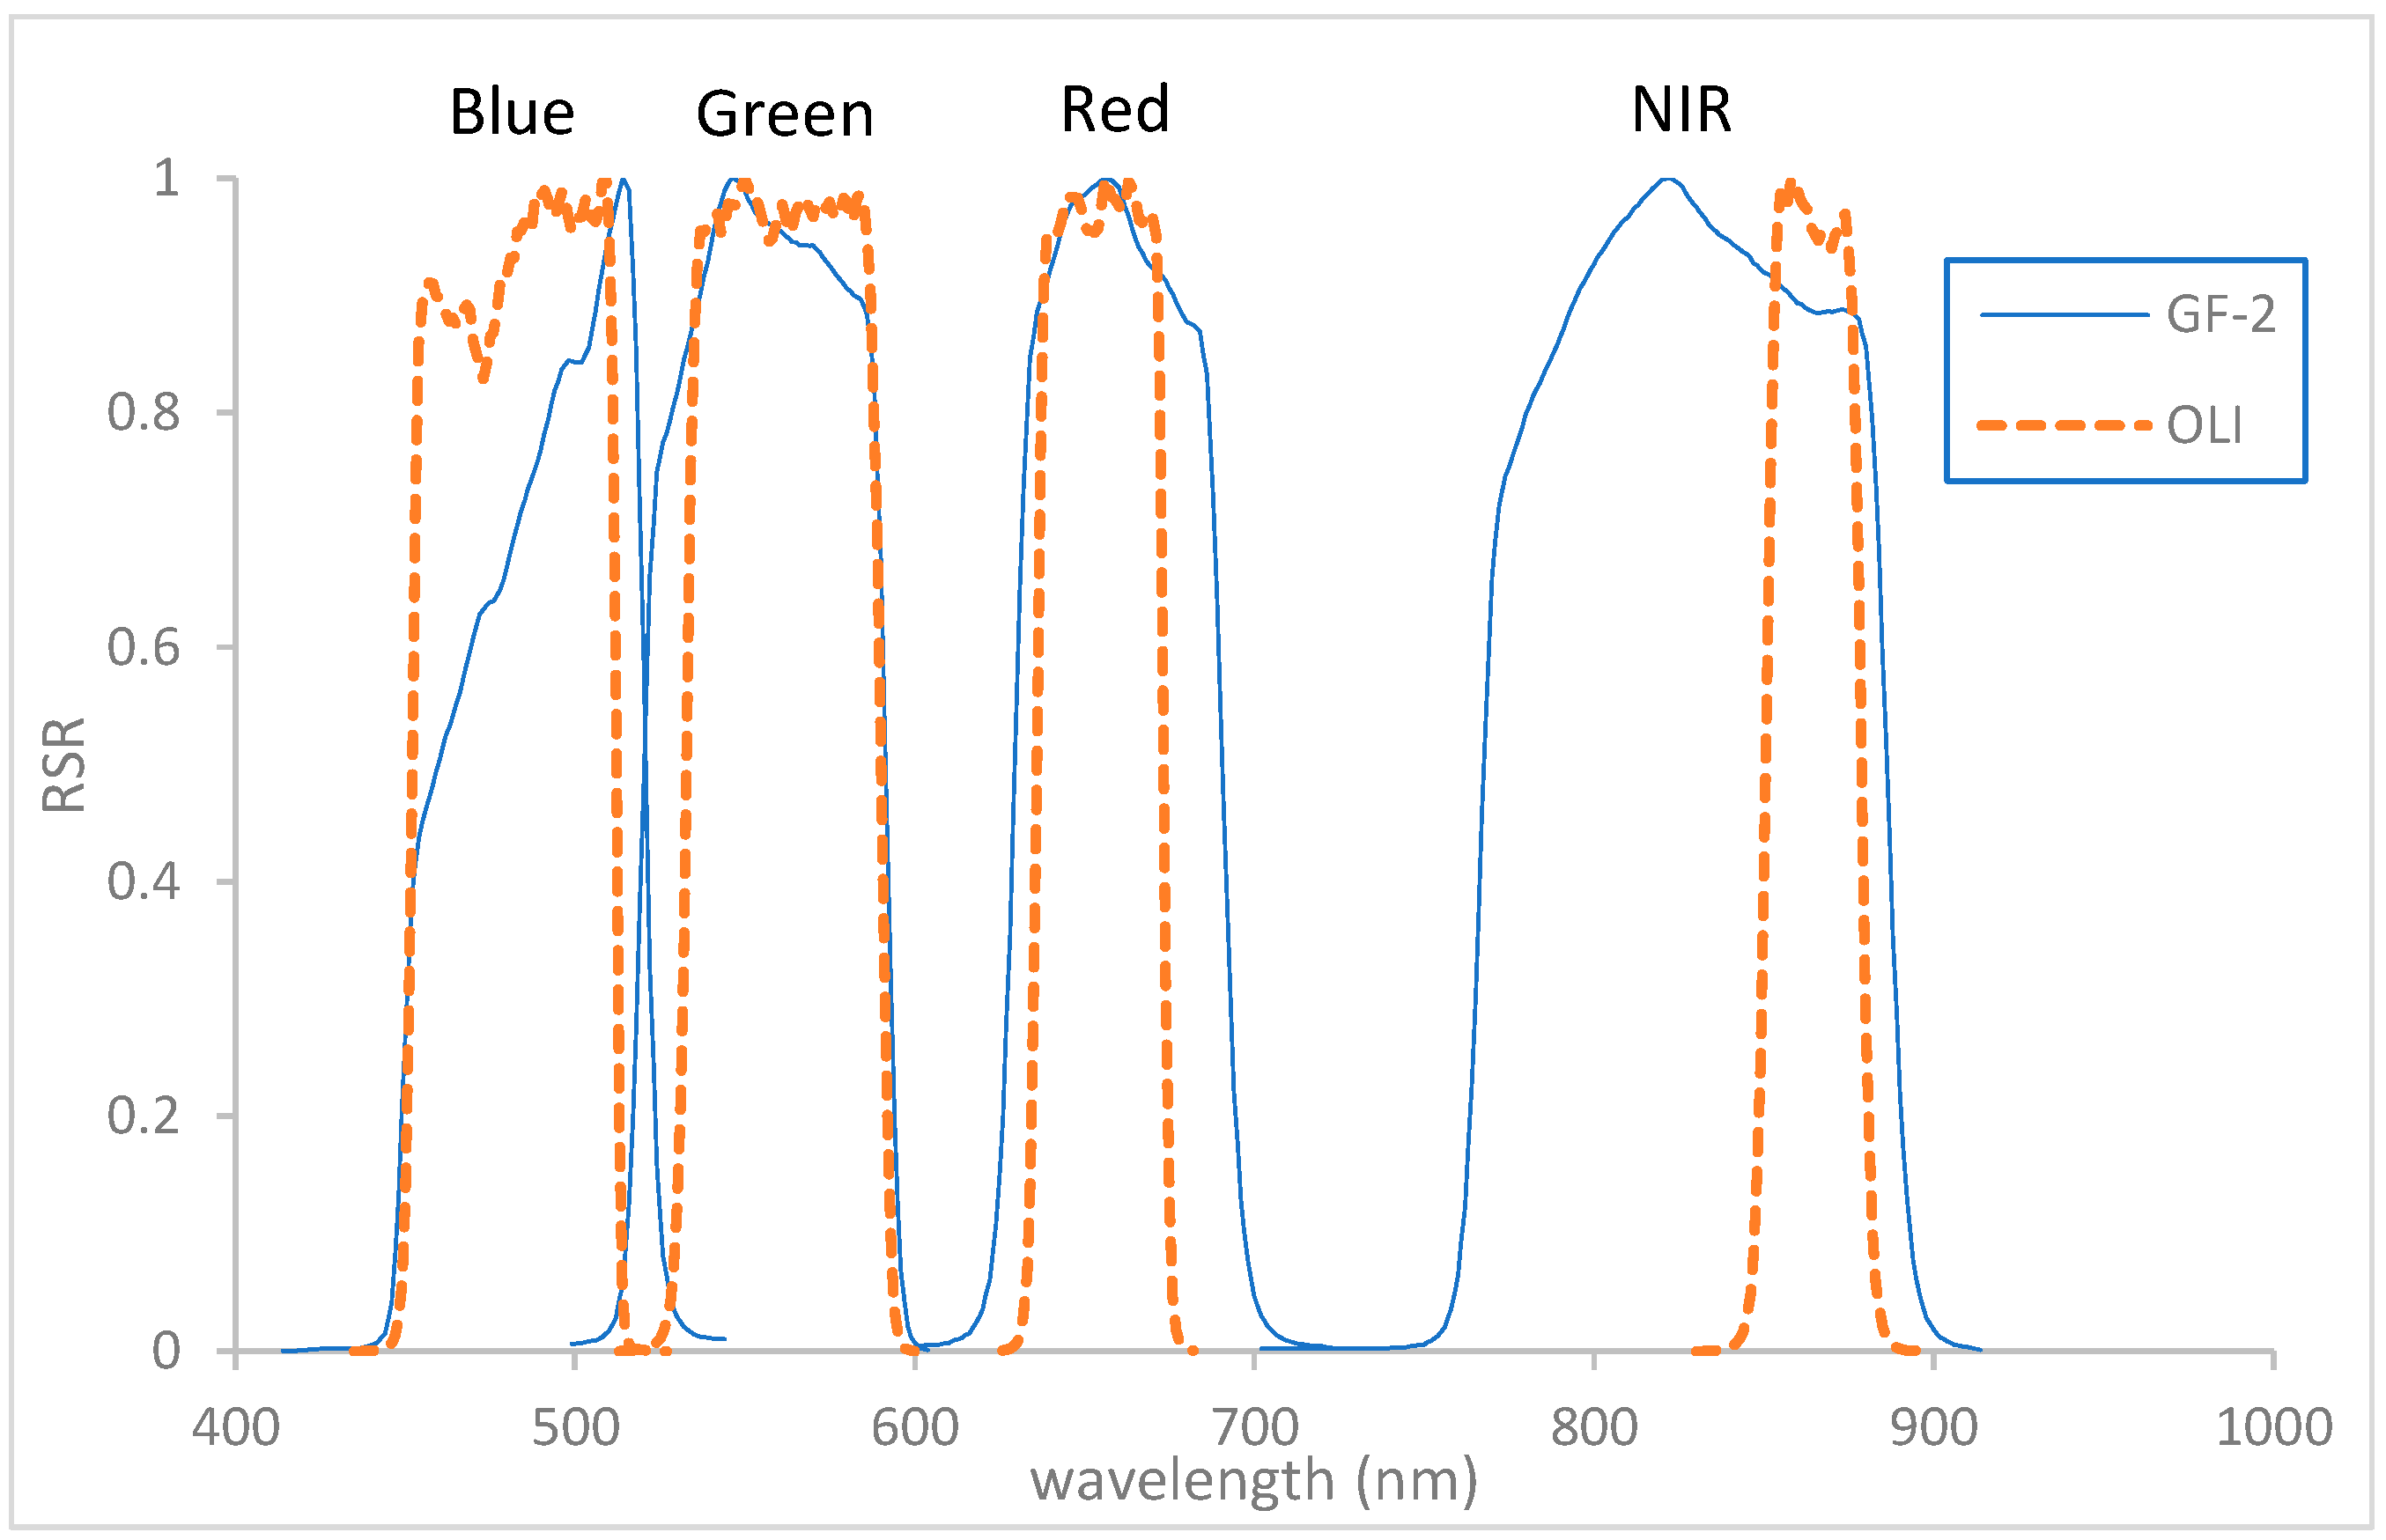
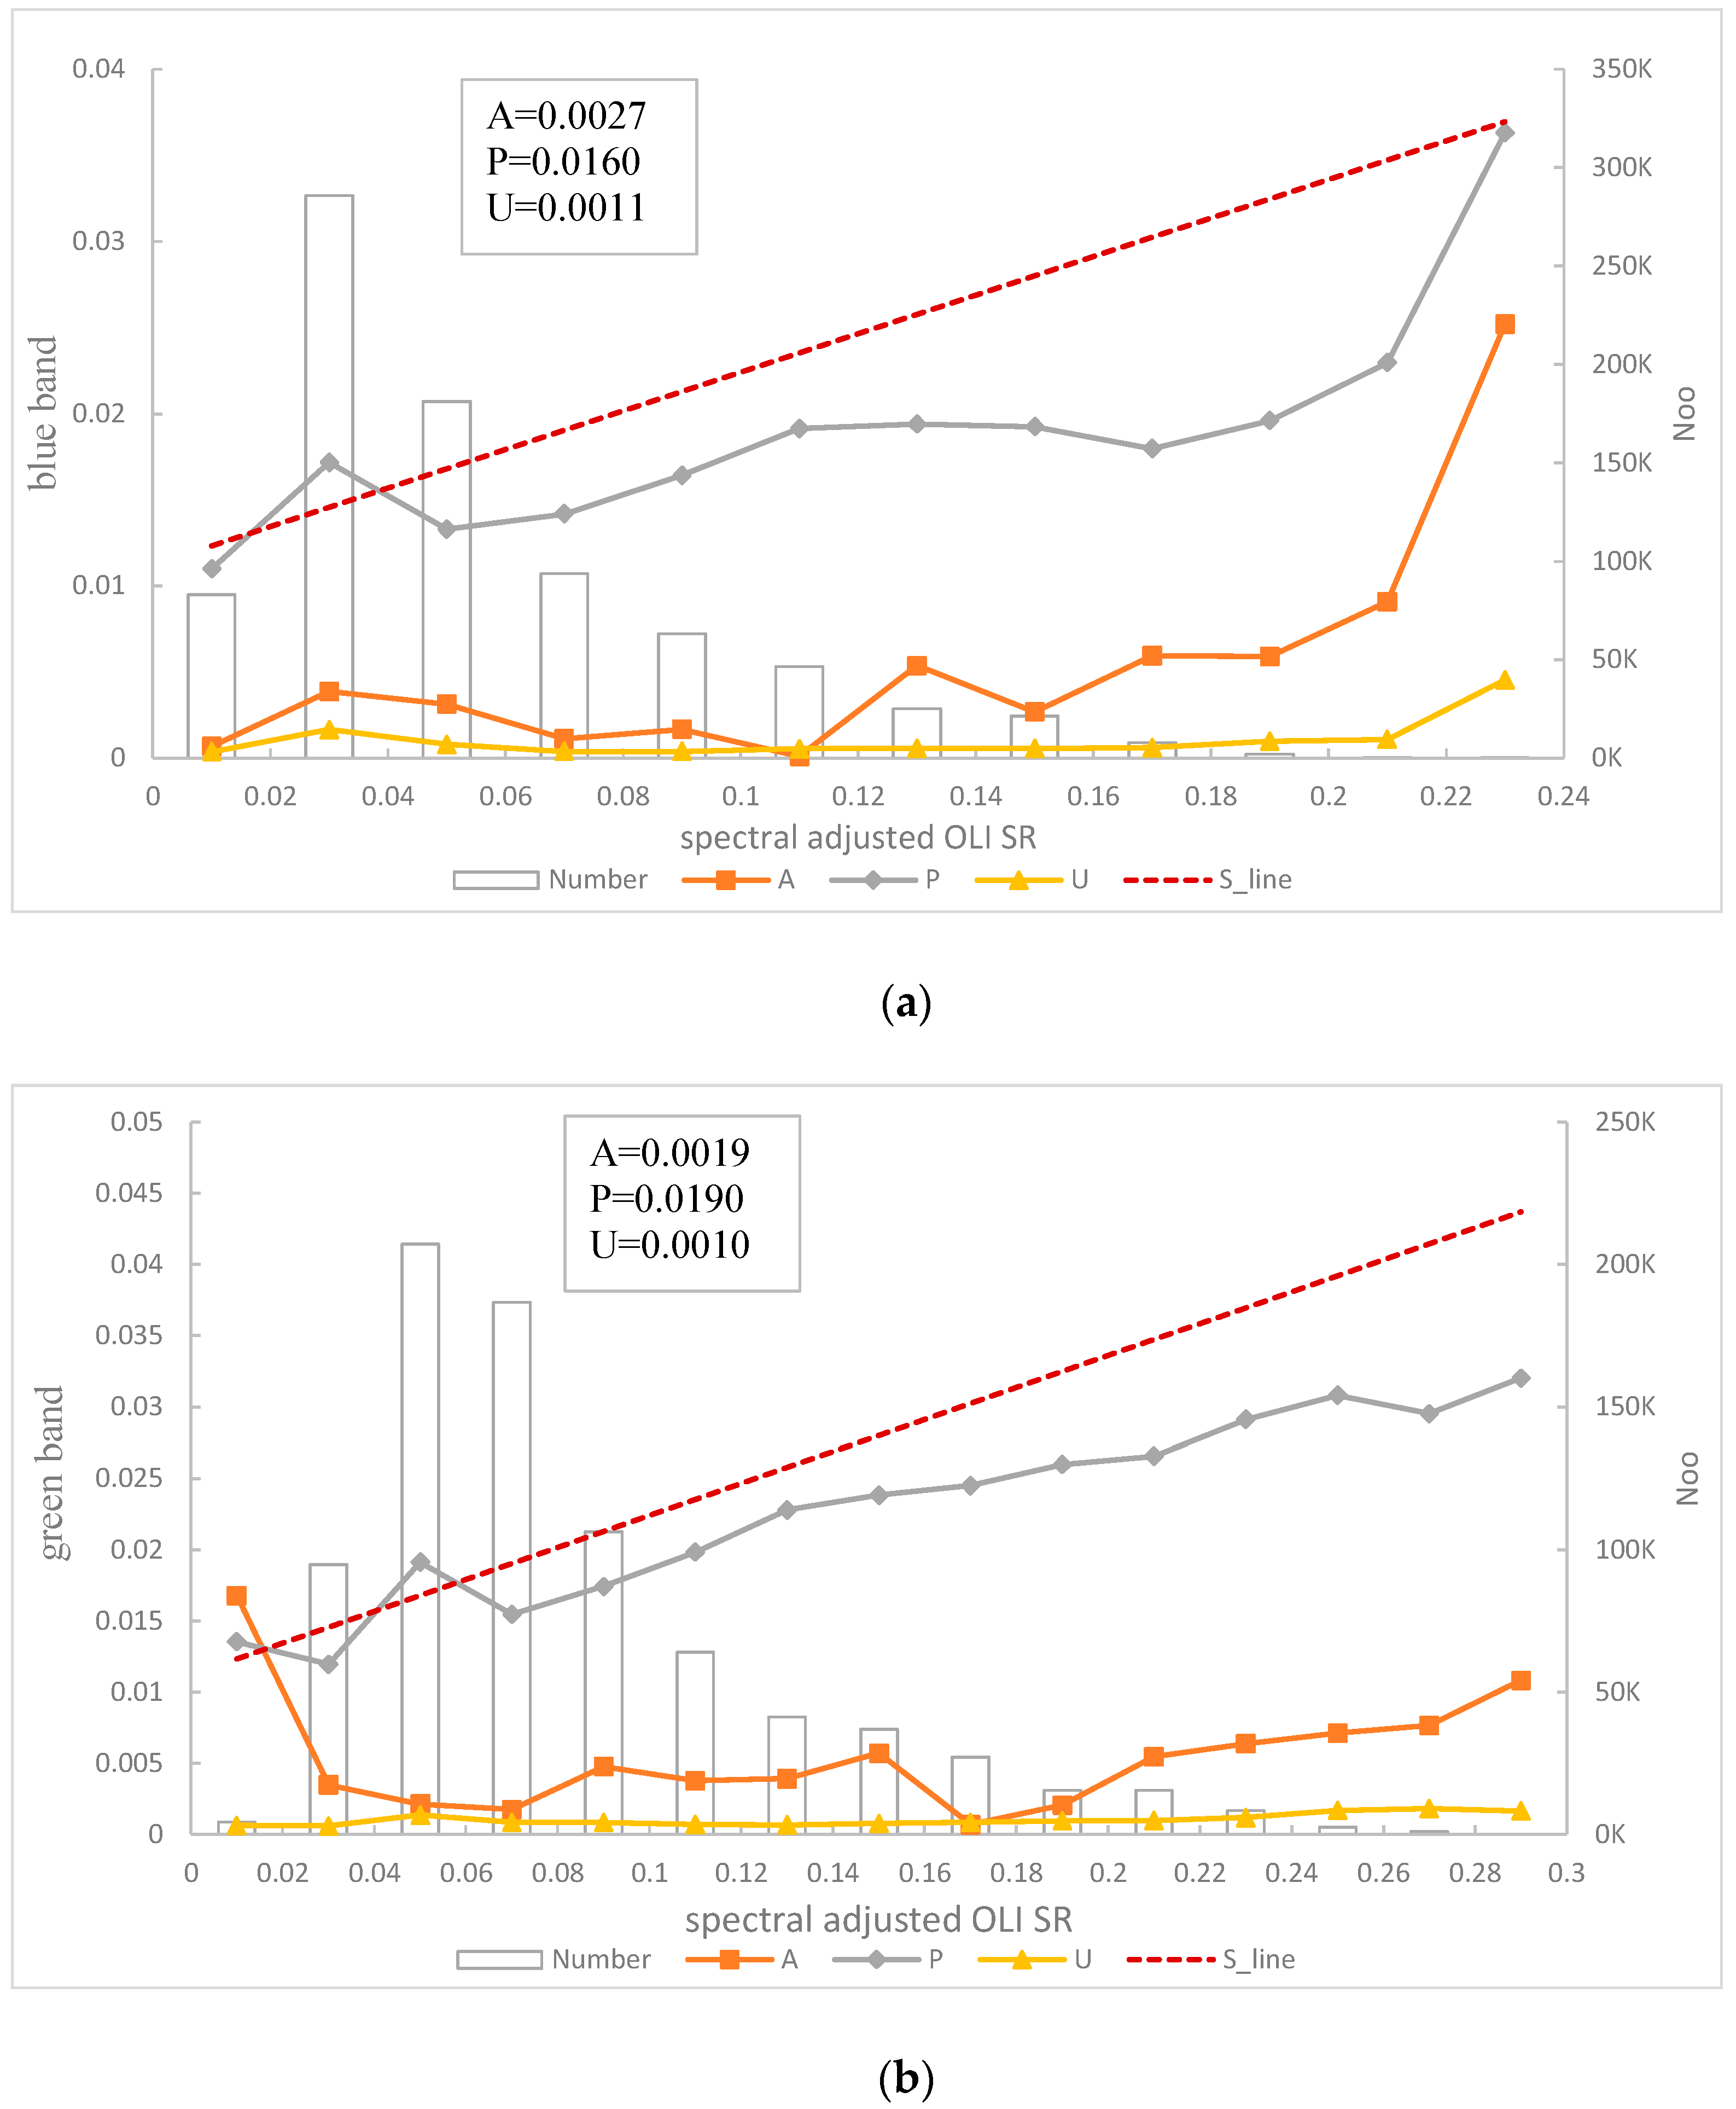
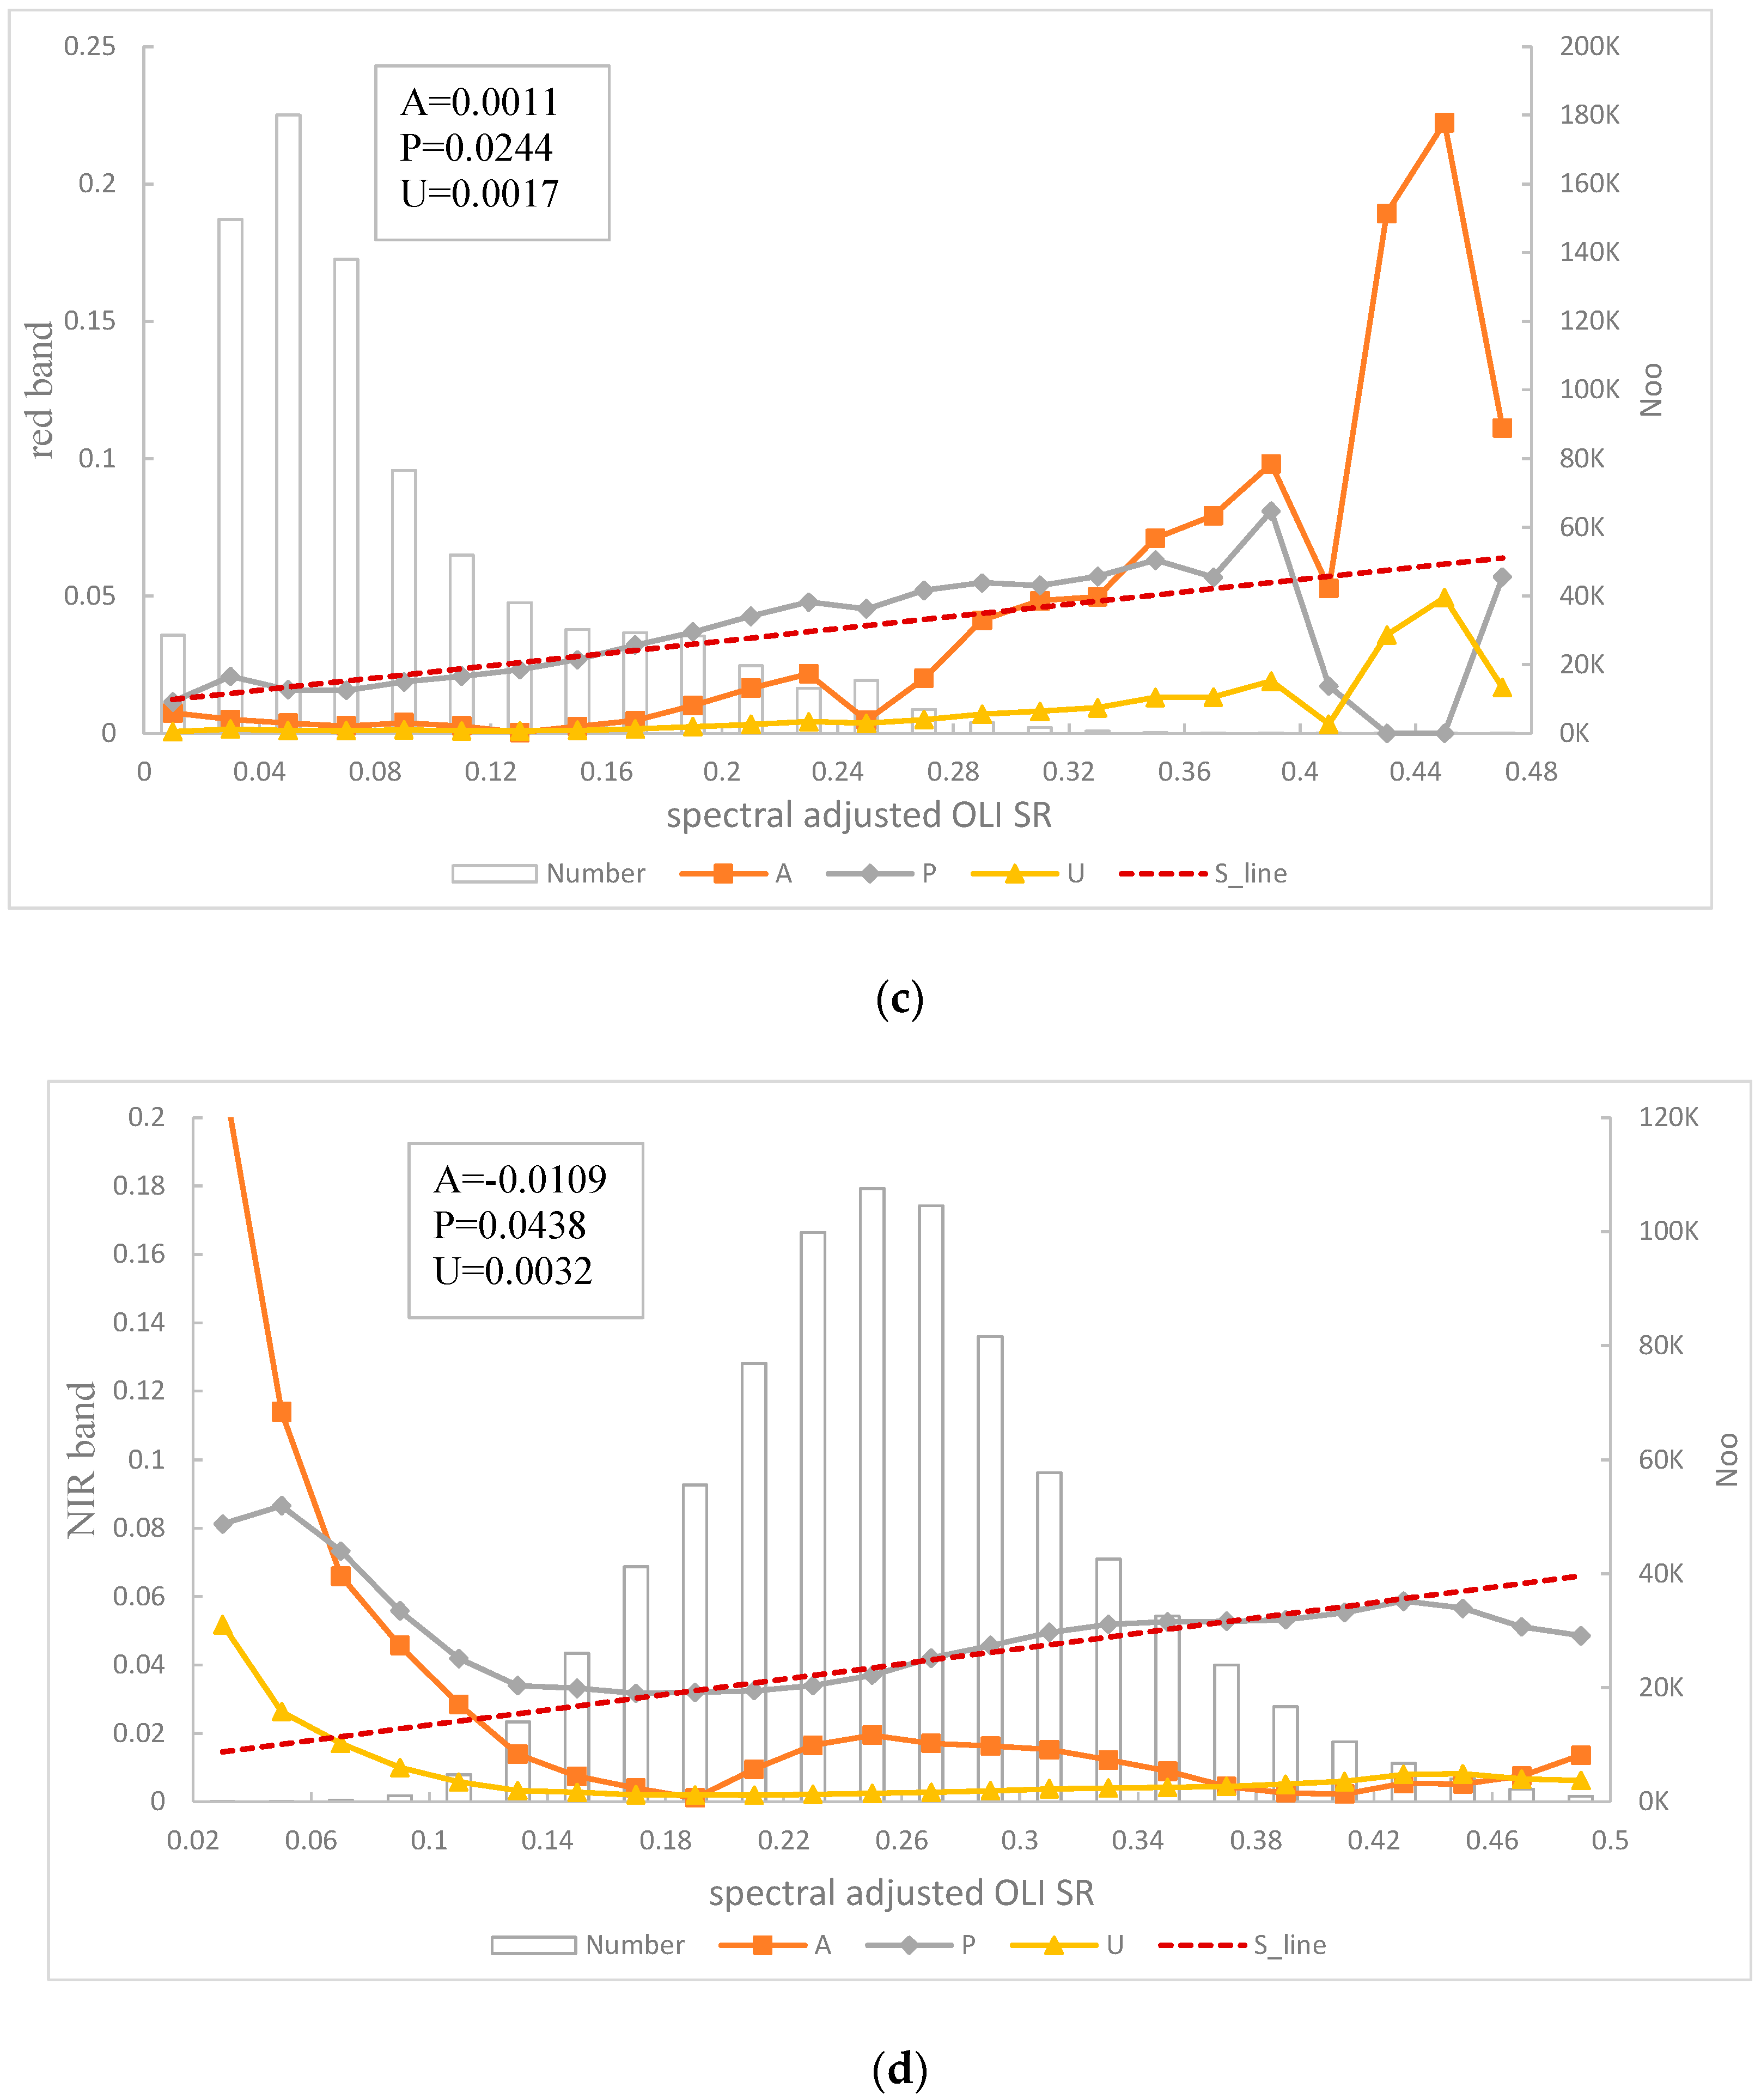
- Landsat-8 OLI LSR spectral adjustment.
- The smoothing Hyperion surface reflectance image was obtained by applying the FLAASH polishing algorithm [67].
- A PCA was performed on the smoothing surface reflectance data in the spectral subset of less-atmospheric-affecting regions. A 99% of the variance was considered for the PCA transformation.
- An unsupervised ISODATA classifier was performed on each PCA-transformed scene and the centroid spectra of each class were extracted.
6.2. Processing Efficiency
7. Discussion
7.1. LUT Accuarcy
- (1)
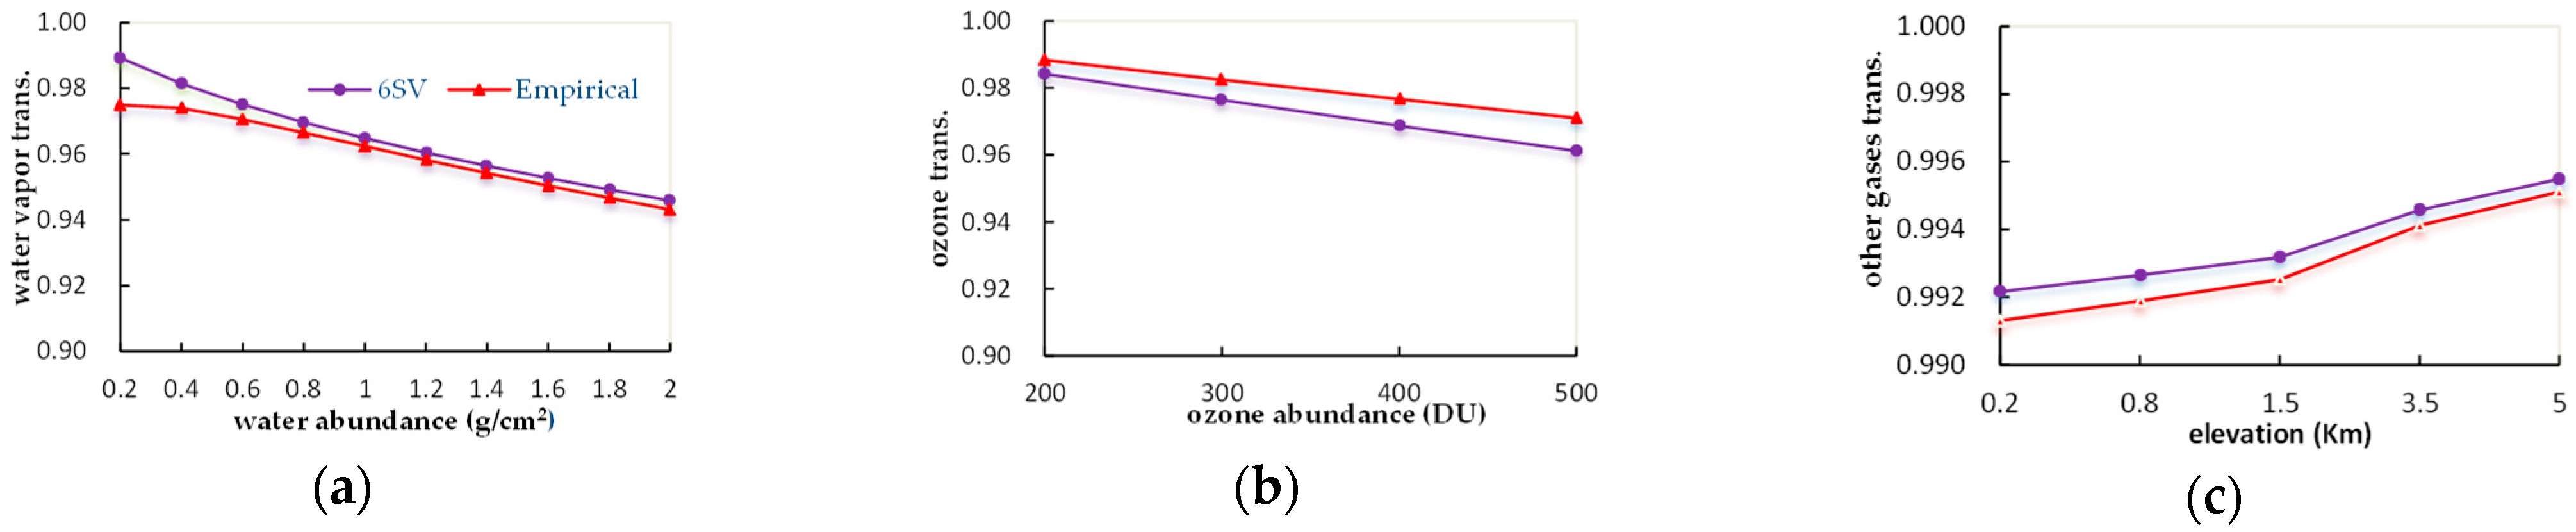
- The empirical formulas had relatively high accuracy, being eligible for gaseous transmission calculation. A relative maximum error of ~1.5% was obtained for the case of water vapor transmission in the NIR band because of its spectral range covering the water absorption wavelengths. The relative maximum errors for ozone and other gases (except for ozone and water vapor) were 0.1% and 0.09%, respectively. Figure 9 compares the gaseous transmissions calculated using the empirical formulas and by 6SV for the band having the largest difference.
- (2)
- The LSRs based on the LUTs had a high accuracy compared to those based on the direct inputting of the same atmospheric parameter to 6SV. As a case study, the LSRs computed based on the LUTs had absolute errors from 0.8% for the blue band to 0.5% for the NIR band when applied to GF-2 data. The LSRs based on the LUTs also exhibited superior accuracy compared to those retrieved using FLAASH (Table 8).
7.2. Choice of Aerosol Model
7.3. AC Algorithm
7.4. Data Processing Chain
8. Conclusions
Author Contributions
Funding
Institutional Review Board Statement
Data Availability Statement
Acknowledgments
Conflicts of Interest
References
- U.S. Geological Survey. Landsat—Earth Observation Satellites (ver. 1.1, August 2016): U.S. Geological Survey Fact Sheet 2015–3081; U.S. Geological Survey: Reston, VA, USA, 2016; 4p. [CrossRef] [Green Version]
- Landsat 9. Available online: https://landsat.gsfc.nasa.gov/landsat-9/ (accessed on 5 July 2022).
- Li, J.; Roy, D. A Global Analysis of Sentinel-2A, Sentinel-2B and Landsat-8 Data Revisit Intervals and Implications for Terrestrial Monitoring. Remote Sens. 2017, 9, 902. [Google Scholar] [CrossRef] [Green Version]
- Liao, A.; Chen, L.; Chen, J.; He, C.; Cao, X.; Chen, J.; Peng, S.; Sun, F.; Gong, P. High-resolution remote sensing mapping of global land water. Sci. China Earth Sci. 2014, 57, 2305–2316. [Google Scholar] [CrossRef]
- McCarthy, M.J.; Radabaugh, K.R.; Moyer, R.P.; Muller-Karger, F.E. Enabling efficient, large-scale high-spatial resolution wetland mapping using satellites. Remote Sens. Environ. 2018, 208, 189–201. [Google Scholar] [CrossRef]
- Chen, D.; Shi, Y.; Huang, W.; Zhang, J.; Wu, K. Mapping wheat rust based on high spatial resolution satellite imagery. Comput. Electron. Agric. 2018, 152, 109–116. [Google Scholar] [CrossRef]
- Zhou, Q.-B.; Yu, Q.-Y.; Liu, J.; Wu, W.-B.; Tang, H.-J. Perspective of Chinese GF-1 high-resolution satellite data in agricultural remote sensing monitoring. J. Integr. Agric. 2017, 16, 242–251. [Google Scholar] [CrossRef]
- Wagner, F.H.; Ferreira, M.P.; Sanchez, A.; Hirye, M.C.M.; Zortea, M.; Gloor, E.; Phillips, O.L.; de Souza Filho, C.R.; Shimabukuro, Y.E.; Aragão, L.E.O.C. Individual tree crown delineation in a highly diverse tropical forest using very high resolution satellite images. ISPRS J. Photogramm. Remote Sens. 2018, 145, 362–377. [Google Scholar] [CrossRef]
- Pacifici, F.; Longbotham, N.; Emery, W.J. The Importance of Physical Quantities for the Analysis of Multitemporal and Multiangular Optical Very High Spatial Resolution Images. IEEE Trans. Geosci. Remote Sens. 2014, 52, 6241–6256. [Google Scholar] [CrossRef]
- Buckley, M. Airbus Approach to Constellations: The Arrow Product. Available online: https://space.biz.pl/wp-content/uploads/2018/06/Mike-Buckly-Airbus.pdf (accessed on 4 November 2022).
- Longanbach, M.; McGill, L. Scaling Fleet Operations: The Growth and Results of SkySat Mission Operations. In Proceedings of the SpaceOps Conferences, Marseille, France, 28 May–1 June 2018. [Google Scholar]
- Planet. Planet Imagery Product Specifications. Available online: https://vekom.com/wp-content/uploads/2020/03/Planet-Imagery-Product-Specifications-Combined-April-2019.pdf (accessed on 4 November 2022).
- Xu, W.; Jin, G.; Wang, J.Q. Optical imaging technology of JL-1 lightweight high resolution multispectral remote sensing satellite. Opt. Precis. Eng. 2017, 25, 1969–1978. [Google Scholar] [CrossRef]
- Franklin, S.E.; Wulder, M.A. Remote sensing methods in medium spatial resolution satellite data land cover classification of large areas. Prog. Phys. Geogr. Earth Environ. 2002, 26, 173–205. [Google Scholar] [CrossRef]
- Hansen, M.C.; Loveland, T.R. A review of large area monitoring of land cover change using Landsat data. Remote Sens. Environ. 2012, 122, 66–74. [Google Scholar] [CrossRef]
- Zhu, Z. Change detection using landsat time series: A review of frequencies, preprocessing, algorithms, and applications. ISPRS J. Photogramm. Remote Sens. 2017, 130, 370–384. [Google Scholar] [CrossRef]
- Torbick, N.; Huang, X.; Ziniti, B.; Johnson, D.; Masek, J.; Reba, M. Fusion of Moderate Resolution Earth Observations for Operational Crop Type Mapping. Remote Sens. 2018, 10, 1058. [Google Scholar] [CrossRef] [Green Version]
- Drusch, M.; Del Bello, U.; Carlier, S.; Colin, O.; Fernandez, V.; Gascon, F.; Hoersch, B.; Isola, C.; Laberinti, P.; Martimort, P.; et al. Sentinel-2: ESA’s Optical High-Resolution Mission for GMES Operational Services. Remote Sens. Environ. 2012, 120, 25–36. [Google Scholar] [CrossRef]
- Roy, D.P.; Wulder, M.A.; Loveland, T.R.; Woodcock, C.E.; Allen, R.G.; Anderson, M.C.; Helder, D.; Irons, J.R.; Johnson, D.M.; Kennedy, R.; et al. Landsat-8: Science and product vision for terrestrial global change research. Remote Sens. Environ. 2014, 145, 154–172. [Google Scholar] [CrossRef] [Green Version]
- Lesiv, M.; See, L.; Laso Bayas, J.; Sturn, T.; Schepaschenko, D.; Karner, M.; Moorthy, I.; McCallum, I.; Fritz, S. Characterizing the Spatial and Temporal Availability of Very High Resolution Satellite Imagery in Google Earth and Microsoft Bing Maps as a Source of Reference Data. Land 2018, 7, 118. [Google Scholar] [CrossRef] [Green Version]
- Kaufman, Y.J.; Tanré, D.; Remer, L.A.; Vermote, E.F.; Chu, A.; Holben, B.N. Operational remote sensing of tropospheric aerosol over land from EOS moderate resolution imaging spectroradiometer. J. Geophys. Res 1997, 102, 17051–17067. [Google Scholar] [CrossRef]
- Vermote, E.F.; Kotchenova, S. Atmospheric correction for the monitoring of land surfaces. J. Geophys. Res. Atmos. 2008, 113, D23S90. [Google Scholar] [CrossRef]
- Mei, L.; Rozanov, V.; Vountas, M.; Burrows, J.P.; Levy, R.C.; Lotz, W. Retrieval of aerosol optical properties using MERIS observations: Algorithm and some first results. Remote Sens. Environ. 2017, 197, 125–140. [Google Scholar] [CrossRef]
- Hsu, N.C.; Tsay, S.C.; King, M.D.; Herman, J.R. Deep Blue Retrievals of Asian Aerosol Properties During ACE-Asia. IEEE Trans. Geosci. Remote Sens. 2006, 44, 3180–3195. [Google Scholar] [CrossRef]
- Hsu, N.C.; Jeong, M.J.; Bettenhausen, C.; Sayer, A.M.; Hansell, R.; Seftor, C.S.; Huang, J.; Tsay, S.C. Enhanced Deep Blue aerosol retrieval algorithm: The second generation. J. Geophys. Res. Atmos. 2013, 118, 9296–9315. [Google Scholar] [CrossRef]
- Lyapustin, A.; Wang, Y.; Laszlo, I.; Kahn, R.; Korkin, S.; Remer, L.; Levy, R.; Reid, J.S. Multiangle implementation of atmospheric correction (MAIAC): 2. Aerosol algorithm. J. Geophys. Res. Atmos. 2011, 116, D03211. [Google Scholar] [CrossRef]
- Hagolle, O.; Dedieu, G.; Mougenot, B.; Debaecker, V.; Duchemin, B.; Meygret, A. Correction of aerosol effects on multi-temporal images acquired with constant viewing angles: Application to Formosat-2 images. Remote Sens. Environ. 2008, 112, 1689–1701. [Google Scholar] [CrossRef] [Green Version]
- Richter, R. Correction of atmospheric and topographic effects for high spatial resolution satellite imagery. Int. J. Remote Sens. 1997, 18, 1099–1111. [Google Scholar] [CrossRef]
- Richter, R.; Schläpfer, D. ATCOR-2/3 User Guide; ReSe Applications Schläpfer: Wil, Switzerland, 2012; p. 203. [Google Scholar]
- Miller, C.J. Performance Assessment of ACORN Atmospheric Correction Algorithm; SPIE: Philadelphia, PA, USA, 2002; Volume 4725. [Google Scholar]
- Matthew, M.W.; Adler-Golden, S.M.; Berk, A.; Richtsmeier, S.C.; Levine, R.Y.; Bernstein, L.S.; Acharya, P.K.; Anderson, G.P.; Felde, G.W.; Hoke, M.L.; et al. Status of Atmospheric Correction Using a MODTRAN4-Based Algorithm; SPIE: Philadelphia, PA, USA, 2000; Volume 4049. [Google Scholar]
- Anderson, G.P.; Pukall, B.; Allred, C.L.; Jeong, L.S.; Hoke, M.; Chetwynd, J.H.; Adler-Golden, S.M.; Berk, A.; Bernstein, L.S.; Richtsmeier, S.C.; et al. FLAASH and MODTRAN4: State-of-the-art atmospheric correction for hyperspectral data. In Proceedings of the 1999 IEEE Aerospace Conference. Proceedings (Cat. No.99TH8403), Snowmass, CO, USA, 7 March 1999; Volume 174, pp. 177–181. [Google Scholar]
- Adler-Golden, S.M.; Matthew, M.W.; Bernstein, L.S.; Levine, R.Y.; Berk, A.; Richtsmeier, S.C.; Acharya, P.K.; Anderson, G.P.; Felde, J.W.; Gardner, J.A.; et al. Atmospheric Correction for Shortwave Spectral Imagery Based on MODTRAN4; SPIE: Philadelphia, PA, USA, 1999; Volume 3753. [Google Scholar]
- Zheng, Q.; Kindel, B.C.; Goetz, A.F.H. The High Accuracy Atmospheric Correction for Hyperspectral Data (HATCH) model. IEEE Trans. Geosci. Remote Sens. 2003, 41, 1223–1231. [Google Scholar] [CrossRef]
- Vermote, E.F.; Saleous, N. Operational Atmospheric Correction of MODIS Visible to Middle Infrared Land Surface Data in the Case of an Infinite Lambertian Target. In Earth Science Satellite Remote Sensing: Vol. 1: Science and Instruments; Qu, J.J., Gao, W., Kafatos, M., Murphy, R.E., Salomonson, V.V., Eds.; Springer: Berlin/Heidelberg, Germany, 2006; pp. 123–153. [Google Scholar] [CrossRef]
- MERIS Surface Reflectance Time Series. Available online: http://maps.elie.ucl.ac.be/CCI/viewer/index.php (accessed on 4 November 2022).
- Defourny, P.; Kirches, G.; Krueger, O.; Boettcher, M.; Bontemps, S.; Lamarche, C.; Verheggen, A.; Lembrée, C.; Radoux, J. Land Cover CCI Algorithm Theoretical Basis Document Version 2; ESA: Leuven, Belgium, 2013. [Google Scholar]
- Wolters, E.; Swinnen, E.; Toté, C.; Sterckx, S. SPOT-VGT Collection 3 Products User Mannual V1.2. Available online: https://www.spot-vegetation.com/pages/SPOT_VGT_PUM_v1.2.pdf (accessed on 4 November 2022).
- Fallah-Adl, H.; Jájá, J.; Liang, S. Fast algorithms for estimating aerosol optical depth and correcting Thematic Mapper imagery. J. Supercomput. 1997, 10, 315–329. [Google Scholar] [CrossRef] [Green Version]
- Fraser, R.S.; Ferrare, R.A.; Kaufman, Y.J.; Markham, B.L.; Mattoo, S. Algorithm for atmospheric corrections of aircraft and satellite imagery. Int. J. Remote Sens. 1992, 13, 541–557. [Google Scholar] [CrossRef] [Green Version]
- Liang, S.; Fallah-Adl, H.; Kalluri, S.; Jájá, J.; Kaufman, Y.J.; Townshend, J.R.G. An operational atmospheric correction algorithm for Landsat Thematic Mapper imagery over the land. J. Geophys. Res. Atmos. 1997, 102, 17173–17186. [Google Scholar] [CrossRef]
- Liang, S.; Fang, H.; Chen, M. Atmospheric correction of Landsat ETM+ land surface imagery—Part I: Methods. IEEE Trans. Geosci. Remote Sens. 2001, 39, 2490–2498. [Google Scholar] [CrossRef]
- Frantz, D.; Röder, A.; Stellmes, M.; Hill, J. An Operational Radiometric Landsat Preprocessing Framework for Large-Area Time Series Applications. IEEE Trans. Geosci. Remote Sens. 2016, 54, 3928–3943. [Google Scholar] [CrossRef]
- Flood, N.; Danaher, T.; Gill, T.; Gillingham, S. An Operational Scheme for Deriving Standardised Surface Reflectance from Landsat TM/ETM+ and SPOT HRG Imagery for Eastern Australia. Remote Sens. 2013, 5, 83–109. [Google Scholar] [CrossRef] [Green Version]
- Masek, J.G.; Vermote, E.F.; Saleous, N.E.; Wolfe, R.; Hall, F.G.; Huemmrich, K.F.; Feng, G.; Kutler, J.; Teng-Kui, L. A Landsat surface reflectance dataset for North America, 1990-2000. IEEE Geosci. Remote Sens. Lett. 2006, 3, 68–72. [Google Scholar] [CrossRef]
- Vermote, E.; Justice, C.; Claverie, M.; Franch, B. Preliminary analysis of the performance of the Landsat 8/OLI land surface reflectance product. Remote Sens. Environ. 2016, 185, 46–56. [Google Scholar] [CrossRef] [PubMed]
- Ju, J.; Roy, D.P.; Vermote, E.; Masek, J.; Kovalskyy, V. Continental-scale validation of MODIS-based and LEDAPS Landsat ETM+ atmospheric correction methods. Remote Sens. Environ. 2012, 122, 175–184. [Google Scholar] [CrossRef] [Green Version]
- Global Web-Enabled Landsat Data. Available online: https://landsat.gsfc.nasa.gov/article/web-enabled-landsat-data-going-global/ (accessed on 4 November 2022).
- Planet. Planet Surface Reflectance Product. Available online: https://assets.planet.com/marketing/PDF/Planet_Surface_Reflectance_Technical_White_Paper.pdf (accessed on 4 November 2022).
- Rouquie, B.; Hagolle, O.; Breon, F.M.; Boucher, O.; Desjardins, C.; Remy, S. Using Copernicus Atmosphere Monitoring Service Products to Constrain the Aerosol Type in the Atmospheric Correction Processor MAJA. Remote Sens. 2017, 9, 1230. [Google Scholar] [CrossRef] [Green Version]
- Doxani, G.; Vermote, E.; Roger, J.-C.; Gascon, F.; Adriaensen, S.; Frantz, D.; Hagolle, O.; Hollstein, A.; Kirches, G.; Li, F.; et al. Atmospheric Correction Inter-Comparison Exercise. Remote Sens. 2018, 10, 352. [Google Scholar] [CrossRef] [Green Version]
- Gao, B.-C.; Montes, M.J.; Davis, C.O.; Goetz, A.F.H. Atmospheric correction algorithms for hyperspectral remote sensing data of land and ocean. Remote Sens. Environ. 2009, 113, S17–S24. [Google Scholar] [CrossRef]
- Bruegge, C.J.; Conel, J.E.; Green, R.O.; Margolis, J.S.; Holm, R.G.; Toon, G. Water vapor column abundance retrievals during FIFE. J. Geophys. Res. Atmos. 1992, 97, 18759–18768. [Google Scholar] [CrossRef]
- Kaufman, Y.J.; Gao, B. Remote sensing of water vapor in the near IR from EOS/MODIS. IEEE Trans. Geosci. Remote Sens. 1992, 30, 871–884. [Google Scholar] [CrossRef]
- Gao, B.; Kaufman, Y.J. The MODIS Near-IR Water Vapor Algorithm. Available online: https://modis.gsfc.nasa.gov/data/atbd/atbd_mod03.pdf (accessed on 4 November 2022).
- Schläpfer, D.; Borel, C.C.; Keller, J.; Itten, K.I. Atmospheric Precorrected Differential Absorption Technique to Retrieve Columnar Water Vapor. Remote Sens. Environ. 1998, 65, 353–366. [Google Scholar] [CrossRef]
- Zhang, H.; Chen, Z.; Zhang, B.; Peng, D. Comparison of two water vapor retrieval algorithms for HJ1A hyperspectral imagery. In Proceedings of the 2011 IEEE International Geoscience and Remote Sensing Symposium, Vancouver, BC, Canada, 24–29 July 2011; pp. 1732–1735. [Google Scholar]
- Levy, R.C.; Remer, L.A.; Dubovik, O. Global aerosol optical properties and application to Moderate Resolution Imaging Spectroradiometer aerosol retrieval over land. J. Geophys. Res. Atmos. 2007, 112, D13210. [Google Scholar] [CrossRef] [Green Version]
- Reda, I.; Andreas, A. Solar Position Algorithm for Solar Radiation Applications. Sol. Energy 2004, 76, 577–589. [Google Scholar] [CrossRef]
- Bodhaine, B.A.; Wood, N.B.; Dutton, E.G.; Slusser, J.R. On Rayleigh Optical Depth Calculations. J. Atmos. Ocean. Technol. 1999, 16, 1854–1861. [Google Scholar] [CrossRef]
- Kotchenova, S.Y.; Vermote, E.F.; Matarrese, R.; Klemm, J.F.J. Validation of a vector version of the 6S radiative transfer code for atmospheric correction of satellite data. Part I: Path radiance. Appl. Opt. 2006, 45, 6762–6774. [Google Scholar] [CrossRef] [PubMed] [Green Version]
- Gao, B.C.; Montes, M.J.; Davis, C.O. Atmospheric correction algorithm for hyperspectral remote sensing of ocean color from space. Appl. Opt. 2000, 39, 887–896. [Google Scholar] [CrossRef] [PubMed] [Green Version]
- GDAL—Geospatial Data Abstraction Library. Available online: https://gdal.org/ (accessed on 4 November 2022).
- Zhai, H.; Zhang, H.; Zhang, L.; Li, P. Cloud/shadow detection based on spectral indices for multi/hyperspectral optical remote sensing imagery. ISPRS J. Photogramm. Remote Sens. 2018, 144, 235–253. [Google Scholar] [CrossRef]
- Claverie, M.; Ju, J.; Masek, J.G.; Dungan, J.L.; Vermote, E.F.; Roger, J.; Skakun, S.V.; Justice, C. The Harmonized Landsat and Sentinel-2 Surface Reflectance Data Set. Remote Sens. Environ. 2018, 219, 145–161. [Google Scholar] [CrossRef]
- Vermote, E.; Tanré, D.; Deuzé, J.L.; Herman, M.; Morcrette, J.J.; Kotchenova, S.Y. Second Simulation of a Satellite Signal in the Solar Spectrum-Vector (6SV). In 6S User Guide; University of Maryland: College Park, MD, USA, 2006; pp. 1–55. [Google Scholar]
- FLAASH Module, Atmospheric Correction Module: QUAC and FLAASH User’s Guide, Version 4.7; ITT Visual Information Solutions: Boulder, CO, USA, 2009; p. 44.
- Shu, M.; Wen, D.; Zhang, H.; Chen, Z. Design and Implementation of Operational Atmospheric Correction Look-up Tables for GF-2 Image. J. Beijing Univ. Technol. 2017, 43, 683–689. [Google Scholar]
- Kaufman, Y.J.; Tanre, D.; Gordon, H.R.; Nakajima, T.; Lenoble, J.; Frouin, R.; Grassl, H.; Herman, B.M.; King, M.D.; Teillet, P.M. Passive remote sensing of tropospheric aerosol and atmospheric correction for the aerosol effect. J. Geophys. Res 1997, 102, 16815–16830. [Google Scholar] [CrossRef] [Green Version]
- Levy, R.C.; Remer, L.A.; Mattoo, S.; Vermote, E.F.; Kaufman, Y.J. Second-generation operational algorithm: Retrieval of aerosol properties over land from inversion of Moderate Resolution Imaging Spectroradiometer spectral reflectance. J. Geophys. Res. Atmos. 2007, 112, D13211. [Google Scholar] [CrossRef]
- Chen, Z.; Xu, J.; Zhang, H. Evaluation of HJ-1A/B CCD Surface Reflectance Products Using the VNIR and MODIS-Based Atmospheric Correction Approaches. IEEE J. Sel. Top. Appl. Earth Obs. Remote Sens. 2019, 12, 437–449. [Google Scholar] [CrossRef]
- Hsu, N.C.; Si-Chee, T.; King, M.D.; Herman, J.R. Aerosol properties over bright-reflecting source regions. IEEE Trans. Geosci. Remote Sens. 2004, 42, 557–569. [Google Scholar] [CrossRef]
- Levy, R.C.; Mattoo, S.; Munchak, L.A.; Remer, L.A.; Sayer, A.M.; Patadia, F.; Hsu, N.C. The Collection 6 MODIS aerosol products over land and ocean. Atmos. Meas. Tech. 2013, 6, 2989–3034. [Google Scholar] [CrossRef] [Green Version]
- Sun, L.; Wei, J.; Bilal, M.; Tian, X.; Jia, C.; Guo, Y.; Mi, X. Aerosol Optical Depth Retrieval over Bright Areas Using Landsat 8 OLI Images. Remote Sens. 2016, 8, 23. [Google Scholar] [CrossRef] [Green Version]
- Wang, Z.; Li, Q.; Wang, Q.; Li, S.; Chen, L.; Zhou, C.; Zhang, L.; Xu, Y. HJ-1 terrestrial aerosol data retrieval using deep blue algorithm. J. Remote Sens. 2012, 16, 596–610. [Google Scholar]
- Richter, R. Correction of satellite imagery over mountainous terrain. Appl. Opt. 1998, 37, 4004–4015. [Google Scholar] [CrossRef] [PubMed]
- Richter, R.; Kellenberger, T.; Kaufmann, H. Comparison of Topographic Correction Methods. Remote Sens. 2009, 1, 184. [Google Scholar] [CrossRef] [Green Version]
- Teillet, P.M.; Guindon, B.; Goodenough, D.G. On the Slope-Aspect Correction of Multispectral Scanner Data. Can. J. Remote Sens. 1982, 8, 84–106. [Google Scholar] [CrossRef] [Green Version]
- Hantson, S.; Chuvieco, E. Evaluation of different topographic correction methods for Landsat imagery. Int. J. Appl. Earth Obs. Geoinf. 2011, 13, 691–700. [Google Scholar] [CrossRef]
- Schläpfer, D.; Richter, R.; Feingersh, T. Operational BRDF Effects Correction for Wide-Field-of-View Optical Scanners (BREFCOR). IEEE Trans. Geosci. Remote Sens. 2015, 53, 1855–1864. [Google Scholar] [CrossRef]


| Satellite | Spatial Res. (m) | Spectral Bands (μm) | |||
|---|---|---|---|---|---|
| Blue | Green | Red | NIR | ||
| THEOS | 15 | 0.45–0.53 | 0.53–0.60 | 0.62–0.69 | 0.77–0.69 |
| SPOT6 | 6.0 | 0.455–0.525 | 0.53–0.59 | 0.625–0.695 | 0.76–0.89 |
| GeoEye-1 | 1.64 | 0.45–0.51 | 0.51–0.58 | 0.655–0.690 | 0.78–0.92 |
| Advanced Land Observing Satellite (ALOS) | 10 | 0.42–0.50 | 0.52–0.60 | 0.61–0.69 | 0.76–0.89 |
| HJ-1 (A & B) | 30 | 0.43–0.52 | 0.52–0.60 | 0.63–0.69 | 0.76–0.90 |
| CBERS-01/02 | 19.5 | 0.45–0.52 | 0.52–0.59 | 0.63–0.69 | 0.77–0.89 |
| CBERS-02B | 20 | 0.45–0.52 | 0.52–0.59 | 0.63–0.69 | 0.77–0.89 |
| CBERS-04 1 | 10/20 | 0.45–0.52 | 0.52–0.59 | 0.63–0.69 | 0.77–0.89 |
| GF-1 2 | 8/16 | 0.45–0.52 | 0.52–0.59 | 0.63–0.69 | 0.77–0.89 |
| GF-2 | 4 | 0.45–0.52 | 0.52–0.59 | 0.63–0.69 | 0.77–0.89 |
| ZY-3 | 6 | 0.45–0.52 | 0.52–0.59 | 0.63–0.69 | 0.77–0.89 |
| ZY-3-02 | 5.8 | 0.45–0.52 | 0.52–0.59 | 0.63–0.69 | 0.77–0.89 |
| Factors | Node | Counts |
|---|---|---|
| Bands | Number of bands for special sensor | x1 |
| Aerosol type | Weakly, moderately, and strongly absorbing; dust | 4 |
| SZ angle (°) | 1.5, 12, 24, 36, 48, 54, 60, 66, 72 | 9 |
| AZ angle (°) | 0, 30, 60, 90, 120, 150, 180 | 7 |
| VZ angle (°) | Maximum nodes of 0, 12, 24, 36, 48, 54, 60, 66, 72 | y1 |
| AOT @ 550 nm | 0.01, 0.05, 0.10, 0.15, 0.20, 0.30, 0.40, 0.60, 0.80, 1.00, 1.20, 1.40, 1.60, 1.80, 2.0 | 15 |
| Satellite | Sensor | Unique Name | Spatial Resolution (m) |
|---|---|---|---|
| THEOS | Multi-spectral (MS) | THEOS | 15 |
| SPOT6 | New AstroSat Optical Modular Instrument (NAOMI) | SPOT6 | 6.0 |
| GeoEye-1 | MS | GeoEye1 | 1.64 |
| ALOS | Advanced Visible and Near-infrared Radiometer Type 2 (AVNIR-2) | ALOS | 10 |
| HJ-1A | CCD1 | HJ-1ACCD1 | 30 |
| HJ-1A | CCD2 | HJ-1ACCD2 | 30 |
| HJ-1B | CCD1 | HJ-1BCCD1 | 30 |
| HJ-1B | CCD2 | HJ-1BCCD2 | 30 |
| CBERS-01/02 | CCD | CBERS | 19.5 |
| CBERS-02B | CCD | CBERS02B | 20 |
| CBERS-04 | Panchromatic and Multi-spectral (PMS) | CBERS04-PMS | 10 |
| CBERS-04 | Multispectral Camera (MUXCAM) | CBERS04-MUX | 20 |
| GF-1 | PMS | GF1-PMS | 8 |
| GF-1 | MUX | GF1-PMS | 16 |
| GF-2 | MUX | GF2-MUX | 4 |
| ZY-1-02C | PMS | ZY102C-PMS | 10 |
| ZY-3 | MUX | ZY3-MUX | 6 |
| ZY-3-02 | MUX | ZY3-02-MUX | 5.8 |
| File Name | Specification |
|---|---|
| GF1-PMS_8_2014174032104_602090_atc.hdf | Contains attribution information and the data layers |
| GF1-PMS_8_2014174032104_602090_toa.tif | TOA reflectance |
| GF1-PMS_8_2014174032104_602090_lsr.tif | Land surface reflectance |
| GF1-PMS_8_2014174032104_602090_aot.tif | Retrieved AOT at 550 nm |
| GF1-PMS_8_2014174032104_602090_cld.tif | Cloud mask |
| GF1-PMS_8_2014174032104_602090_wat.tif | Water mask |
| Attribute | Specification | ||
|---|---|---|---|
| Spatial Resolution | Spatial Resolution | ||
| RawDataNames | Name list of all data files as inputs for target product retrieval | ||
| AcquisitionTime | Acquisition time in UTC for scene, expressed in “YYYYDDDHHMMSS“ format | ||
| OrbitNum | Path and row numbers for scene, i.e., “PPPRRR” | ||
| StdProductName | Entire product name, consistent with file name | ||
| NumBand | Total number of bands in product | ||
| SpatialReference | Spatial reference represented by WKT string | ||
| DataGroupNum | Total number of data groups | ||
| Size | Spatial dimensions of sample and row, e.g., “15,412, 13,835” | ||
| ACAlgorithm | 4-band internal algorithm | ||
| Data group name | Data layer name | Data layer attribute | Specification |
| AngleData | ViewZenithAngle ViewAzimuthAngle SolarZenithAngle SolarAzimuthAngle | Scalefactor | Values derived by original value multiplying scale factor |
| IsImage | 0 or 1 indicating false or true | ||
| FillValue | Filled values for invalid pixels, e.g., “−32,768” | ||
| LandSurfaceReflectance | DataSet_1 DataSet_2 DataSet_3 … DataSet_x | BandID | Indicating band ID in original scene |
| SpectralRange | Spectral wavelength range in units of micrometer, e.g., “0.43, 0.52” | ||
| Scalefactor | Values derived by original value multiplying scale factor | ||
| FillValue | |||
| TOAReflectance | DataSet_1 DataSet_2 DataSet_3 … DataSet_x | BandID | Indicating band ID in original scene |
| SpectralRange | Spectral wavelength range in units of micrometers, e.g., “0.43, 0.52” | ||
| Scalefactor | Values derived by original value multiplying scale factor | ||
| FillValue | |||
| LayerMask | DataSet_CloudMask DataSet_ShadowMask DataSet_SnowMask DataSet_WaterMask DataSet_AOT | Scalefactor | Values derived by original value multiplying scale factor |
| FillValue | |||
| Band Name | Slope | Offset | R2 | Residual |
|---|---|---|---|---|
| Blue | 0.99513 | −0.00326 | 0.99995 | 0.00120 |
| Green | 0.99922 | 0.00133 | 0.99998 | 0.00087 |
| Red | 1.00032 | −0.00171 | 0.99994 | 0.00139 |
| NIR | 1.01916 | 0.00657 | 0.99777 | 0.00752 |
| Data Source | Regions | Processing Time Cost (h) |
|---|---|---|
| GF-2 PMS, 784 scenes from 2016 | Henan province | ~84 (by ACFrC) |
| GF-1 PMS, 138 scenes from 2013, 2014, and 2017; GF-2 PMS, 316 scenes in 2017; and ZY-3 MUX, 139 scenes in 2013, 2014, and 2017 | Beijing, Tianjin, and Hebei province | ~60 (by ACFrC) |
| GF-2 PMS, 592 scenes from 2017 to 2021 | Hainan province | ~60 (by ACFrC) |
| Landsat-8 OLI, 10 scenes in 2021 | Beijing, Nei Mongol | ~10.33 (by FLAASH) |
| Sentinel-2B, 10 scenes in 2021 | Beijing, Shandong province | ~11.15 (by Sen2Cor) |
| Band | FLAASH | LUTs |
|---|---|---|
| Blue | 2.6 ± 0.5% | 0.8 ± 0.010% |
| Green | 1.8 ± 0.4% | 0.6 ± 0.006% |
| Red | 1.7 ± 0.2% | 0.5 ± 0.003% |
| NIR | 1.9 ± 0.1% | 0.5 ± 0.002% |
Publisher’s Note: MDPI stays neutral with regard to jurisdictional claims in published maps and institutional affiliations. |
© 2022 by the authors. Licensee MDPI, Basel, Switzerland. This article is an open access article distributed under the terms and conditions of the Creative Commons Attribution (CC BY) license (https://creativecommons.org/licenses/by/4.0/).
Share and Cite
Zhang, H.; Yan, D.; Zhang, B.; Fu, Z.; Li, B.; Zhang, S. An Operational Atmospheric Correction Framework for Multi-Source Medium-High-Resolution Remote Sensing Data of China. Remote Sens. 2022, 14, 5590. https://doi.org/10.3390/rs14215590
Zhang H, Yan D, Zhang B, Fu Z, Li B, Zhang S. An Operational Atmospheric Correction Framework for Multi-Source Medium-High-Resolution Remote Sensing Data of China. Remote Sensing. 2022; 14(21):5590. https://doi.org/10.3390/rs14215590
Chicago/Turabian StyleZhang, Hao, Dongchuan Yan, Bing Zhang, Zhengwen Fu, Baipeng Li, and Shuning Zhang. 2022. "An Operational Atmospheric Correction Framework for Multi-Source Medium-High-Resolution Remote Sensing Data of China" Remote Sensing 14, no. 21: 5590. https://doi.org/10.3390/rs14215590