Article

Novel Neuron-like Procedure of Weak Signal Detection against the Non-Stationary Noise Background with Application to Underwater Sound

by
Alexander Gennadievich Khobotov
,
Vera Igorevna Kalinina
*,
Alexander Ivanovich Khil’ko
and
Alexander Igorevich Malekhanov
Institute of Applied Physics, Russian Academy of Sciences, 46 Uljanova St., Nizhny Novgorod 603950, Russia
*
Author to whom correspondence should be addressed.
Remote Sens. 2022, 14(19), 4860; https://doi.org/10.3390/rs14194860
Submission received: 1 August 2022 / Revised: 19 September 2022 / Accepted: 23 September 2022 / Published: 29 September 2022
(This article belongs to the Section Ocean Remote Sensing)

Abstract

:
The well-known method of detecting a useful signal in the presence of noise during underwater remote sensing, based on the matched filtering of the received signal with the test signal, provides the maximum signal-to-noise ratio (SNR) at the receiver output. To do this, a correlation-type criterion function (CF) is constructed for the received and test signals. In the case of large volumes of processed data, this method requires the use of large computing resources. The search for a data processing method with lower computational costs, as well as the effective application of artificial neural networks to array signal processing, motivates the authors to propose an alternative approach to the CF construction based on the McCulloch–Pitts neuron model. Such a neuron-like CF is based on a specific nonlinear transformation of the input and test signals and uses only logical operations, which require much less computational resources. The ratio of the output signal amplitude to the input noise level is indeed the maximum with matched filtering. Studies have shown that it is not this parameter that should be considered, but statistical characteristics, on the basis of which the thresholds for detecting a signal in the presence of noise are determined. Such characteristics include the probability density distributions of correlation and neuron-like CFs in the presence and absence of noise. In this case, the signal detection thresholds will be lower for the neuron-like CF than for the conventional correlation CF. The aim of this research is to increase the accuracy of the selection of a useful signal against the intense noise background when using a processor based on the neuron-like CF and to determine the conditions when the input SNR, at which signal detection is possible, is lower compared to the correlation CF. The comparative results of stochastic modeling show the effectiveness of using a new neuron-like approach to reduce the detection threshold when a chirp signal is received against a background of unsteady Gaussian noise. The advantages of the neuron-like method become significant when the statistical distribution of the additive noise does not change, but its variance increases or decreases. In order to confirm the presence of non-stationarity in real noises, experimental data obtained from the remote sounding of bottom sediments in the Black Sea are presented. The results obtained are considered to be applicable in a wide range of practical situations related to remote sensing in non-stationary environments, long-range sonar and sea bottom exploration.

1. Introduction

The remote sensing of objects located in the water column, as well as the structure and composition of bottom layers in various water areas, is a complex and multiparametric task. One of the important aspects is the identification of weak signals against a background of large noise, as well as the determination of their parameters by comparison with model signals. Currently, complex algorithms are employed to process hydroacoustic signals received during remote sensing of underwater objects. In most of the algorithms, the CF used is analyzed (a function of several variables that compares the received and model signals in one way or another), which ensures the determination of the model parameters closest to those that determine the characteristics of the observed acoustic signals.
In general, such a stochastic problem is complex and multiparametric and often has a large degree of uncertainty due to inaccuracy of models or a high level of additive and multiplicative interference. This significantly complicates the solution methods and requires a detailed analysis of all the features of a specific task. Statistical analysis of individual noise sources, as well as studies aimed at obtaining information in the presence of noise that distorts the useful signal, have already found application in many works (see, e.g., [1,2,3,4,5,6]).
There are no universal solutions to the problems of underwater remote sensing of the bottom and objects located in the water column, and numerous methods and algorithms that have been proposed are based on various features of a specific task (see, e.g., [7,8,9,10]). In this regard, the issue of finding and improving methods for comparing model location signals with signals obtained experimentally against the background of various noises remains relevant.
One of the well-known and generally accepted methods for solving such problems is the matched filtering of the received signal with the test one, built on the basis of correlation convolution. It is known that a matched filter is optimal in the case of a deterministic signal and white Gaussian noise, and such processing ensures the maximum SNR at the output (see, e.g., [11,12]). That is why the correlation CF was taken as a basis for comparison with the new proposed method of detecting a signal against the background of additive white Gaussian noise. At the same time, the new method was not compared with others in terms of maximizing the output SNR, since the correlation method in this case is known to work better than other existing methods. The main task was to obtain a method that has the best performance for the Neumann–Pearson criterion, i.e., to construct such a processing criterion for detecting a signal against a background of noise so that with a specified probability of a false alarm, it provides a minimum probability of missing the target.
It is usually difficult to construct an optimal CF from general considerations when solving the inverse problem. This can be conducted based on a detailed analysis of all the features of a specific task. In [13,14,15,16,17], the authors solved the problem of a layer-by-layer reconstruction of the geoacoustic parameters of the bottom layers using coherent sonar complex modulated signals during remote sensing of the sea bottom. For this purpose, some residual functions have been proposed, namely, criterion functions for comparing experimental and theoretical signals. The operability of the functions was examined, and a comparative analysis and a study of the stability of searching and decision-making algorithms to interference were carried out. The stability of the obtained estimates was studied depending on the magnitude of the SNR at the input of the receivers. In particular, in [17], a neuron-like CF was used for the first time in the tasks of estimating the parameters of received hydroacoustic signals. Such a function showed good results in comparison with other algorithms.
In [18], structural schemes for calculating a neuron-like CF are presented, the use of the Neumann–Pearson criterion is explained and the modeling process is described in detail. It is also explained what False Acceptance Rate (FAR) and False Rejection Rate (FRR) errors are, and how the effectiveness of the proposed method is evaluated on their basis (how performance characteristics are constructed). In addition, the paper [18] studied the evaluation of the effect of the coherence value at the given threshold values of the FAR and FRR on the signal extraction procedure with Gaussian noise, when the location of underwater objects is determined using a sequence of coherent complex signals.
This work continues the cycle of studies on the effectiveness of utilizing a neuron-like CF in various acoustic signal processing tasks. The authors noted that in the case where the noise is stationary, the most effective method of detecting signals is the use of the classical covariance function. However, in the case of non-stationary noise, when the recorded noise sequence is characterized by an increasing or decreasing trend, the procedure of neuron-like signal processing proposed by the authors shows great efficiency. The study of the characteristics of marine noise obtained by the authors during experiments on remote sensing of the Black Sea bottom confirms the unsteadiness of real noises and the justification for the use of a neuron-like CF when detecting signals against the background of such noises. The neuron-like method of signaling location is based on the echolocation abilities of animals. These abilities are used to search for food and to communicate [19,20]. It is known that at the most basic level, animal echolocation depends on the neural anatomy of the auditory circuits of the brain. In modern works devoted to this topic, e.g., [21,22,23,24], the locational abilities of animals are recorded, but the mechanisms (procedures) of signal processing by the animals themselves that allow the implementing of these abilities are not explained, and the question of how locational abilities are implemented on the neural operational basis inherent in living organisms is not raised.
Neural networks are widely employed to calculate various models and algorithms for the underwater remote sensing of objects and bottom layers (see, e.g., [25,26,27,28]). Despite this, the use of the mismatch function, built on a neural basis for detecting and evaluating the parameters of received signals against various background noises, in our opinion, was proposed for the first time in [17].
The presented procedures for processing signals received against the background of additive noise (usually non-stationary) can be effectively used in various applications and, in particular, implemented in technical sonar systems for the remote sensing of underwater objects and bottom rocks in the form of digital filters in the channels of antenna arrays.

2. Materials and Methods

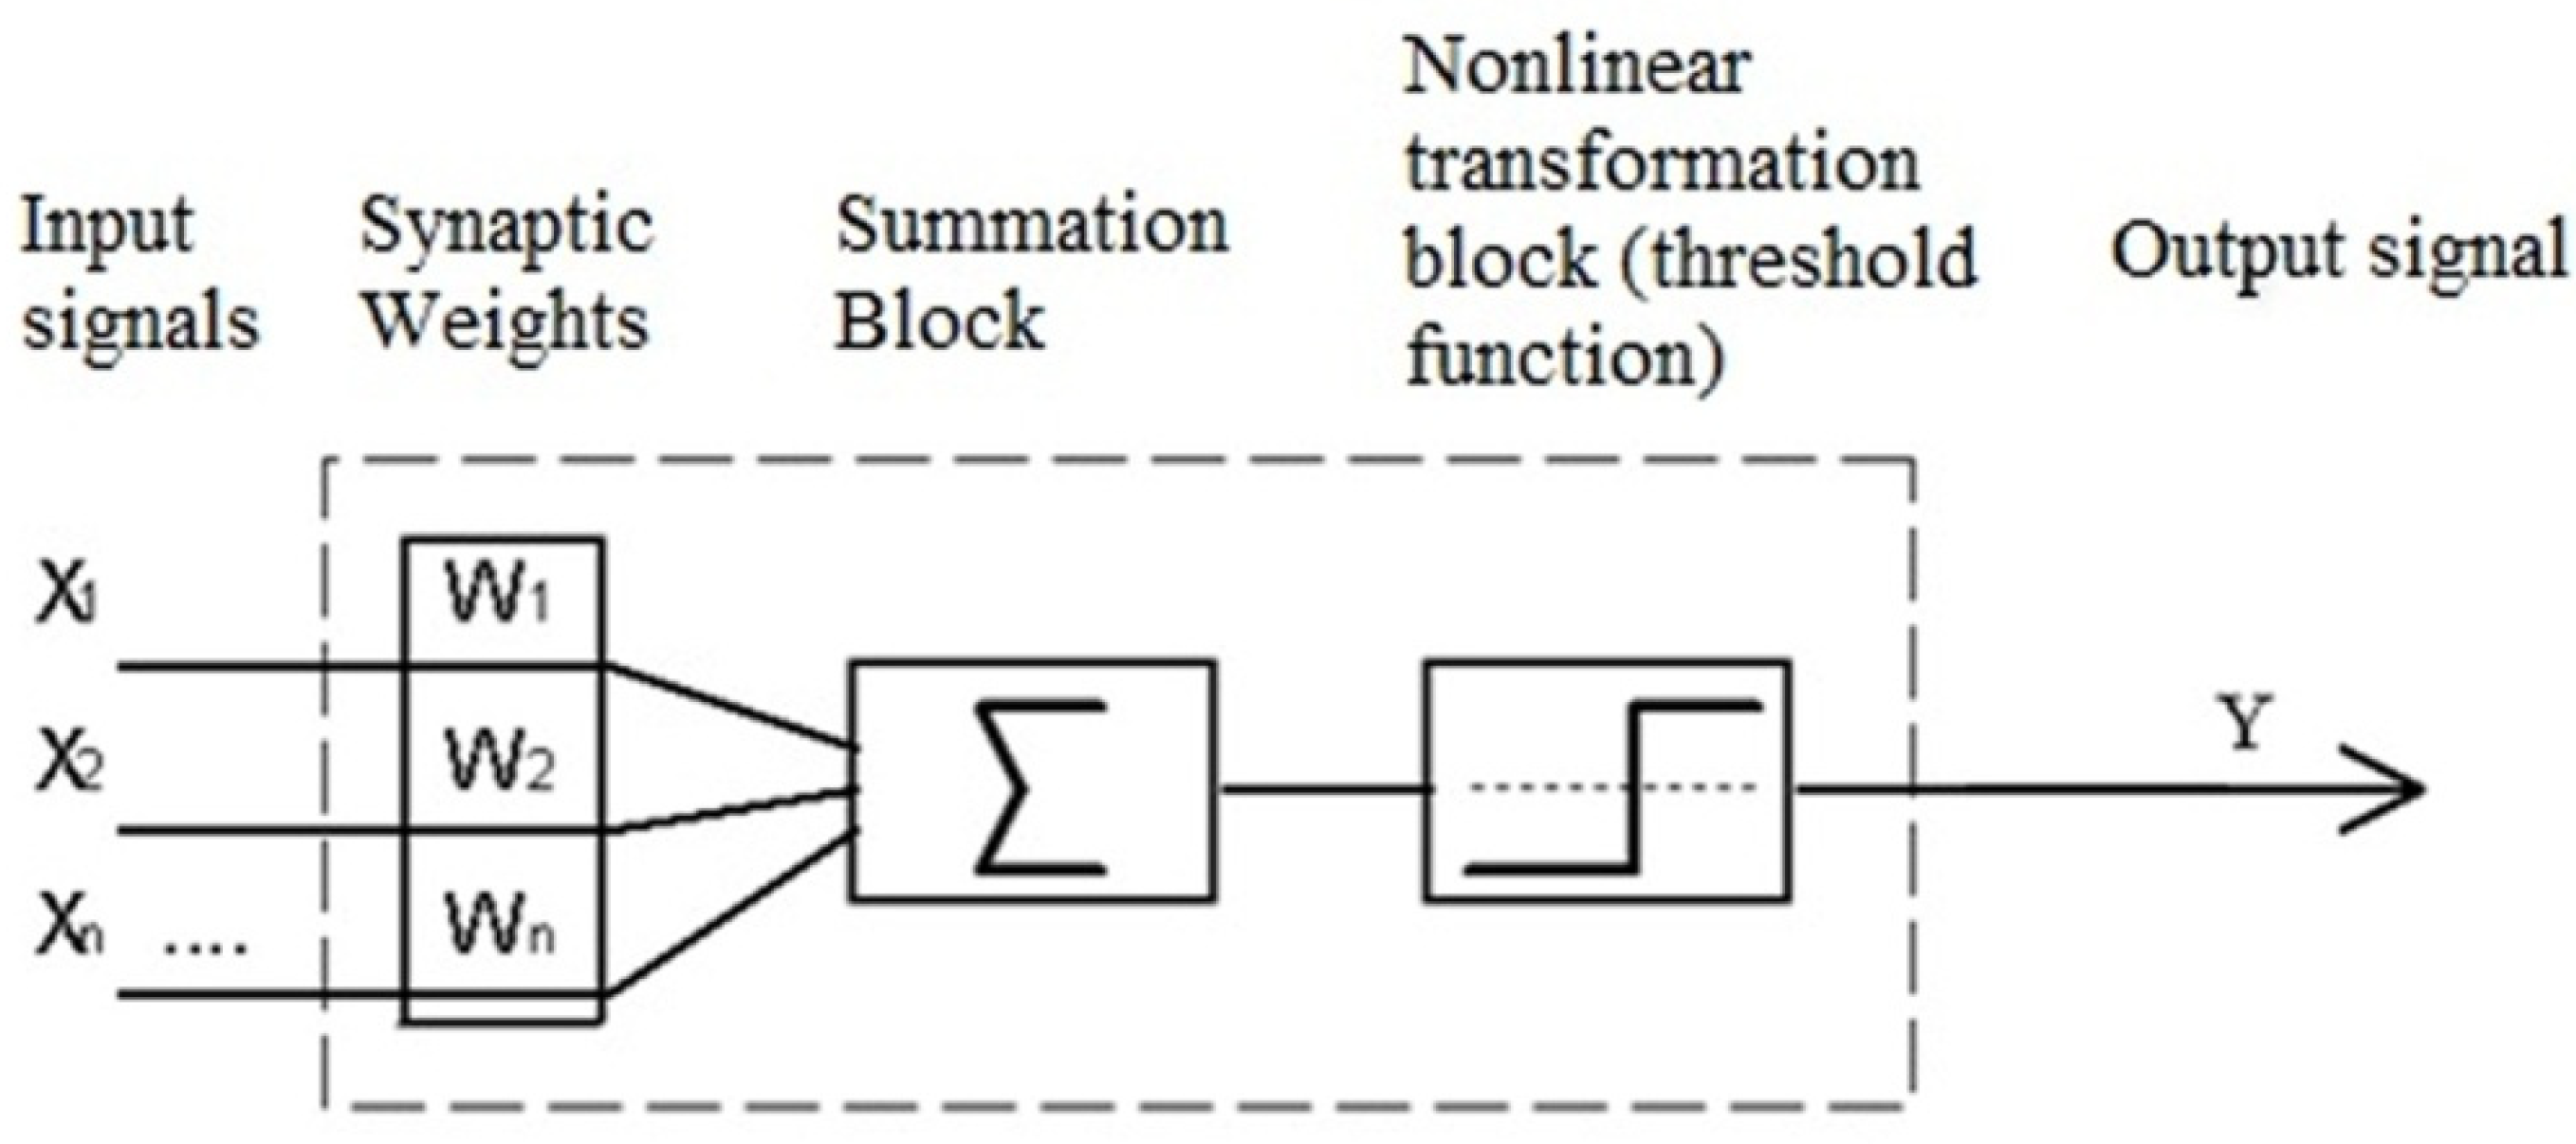
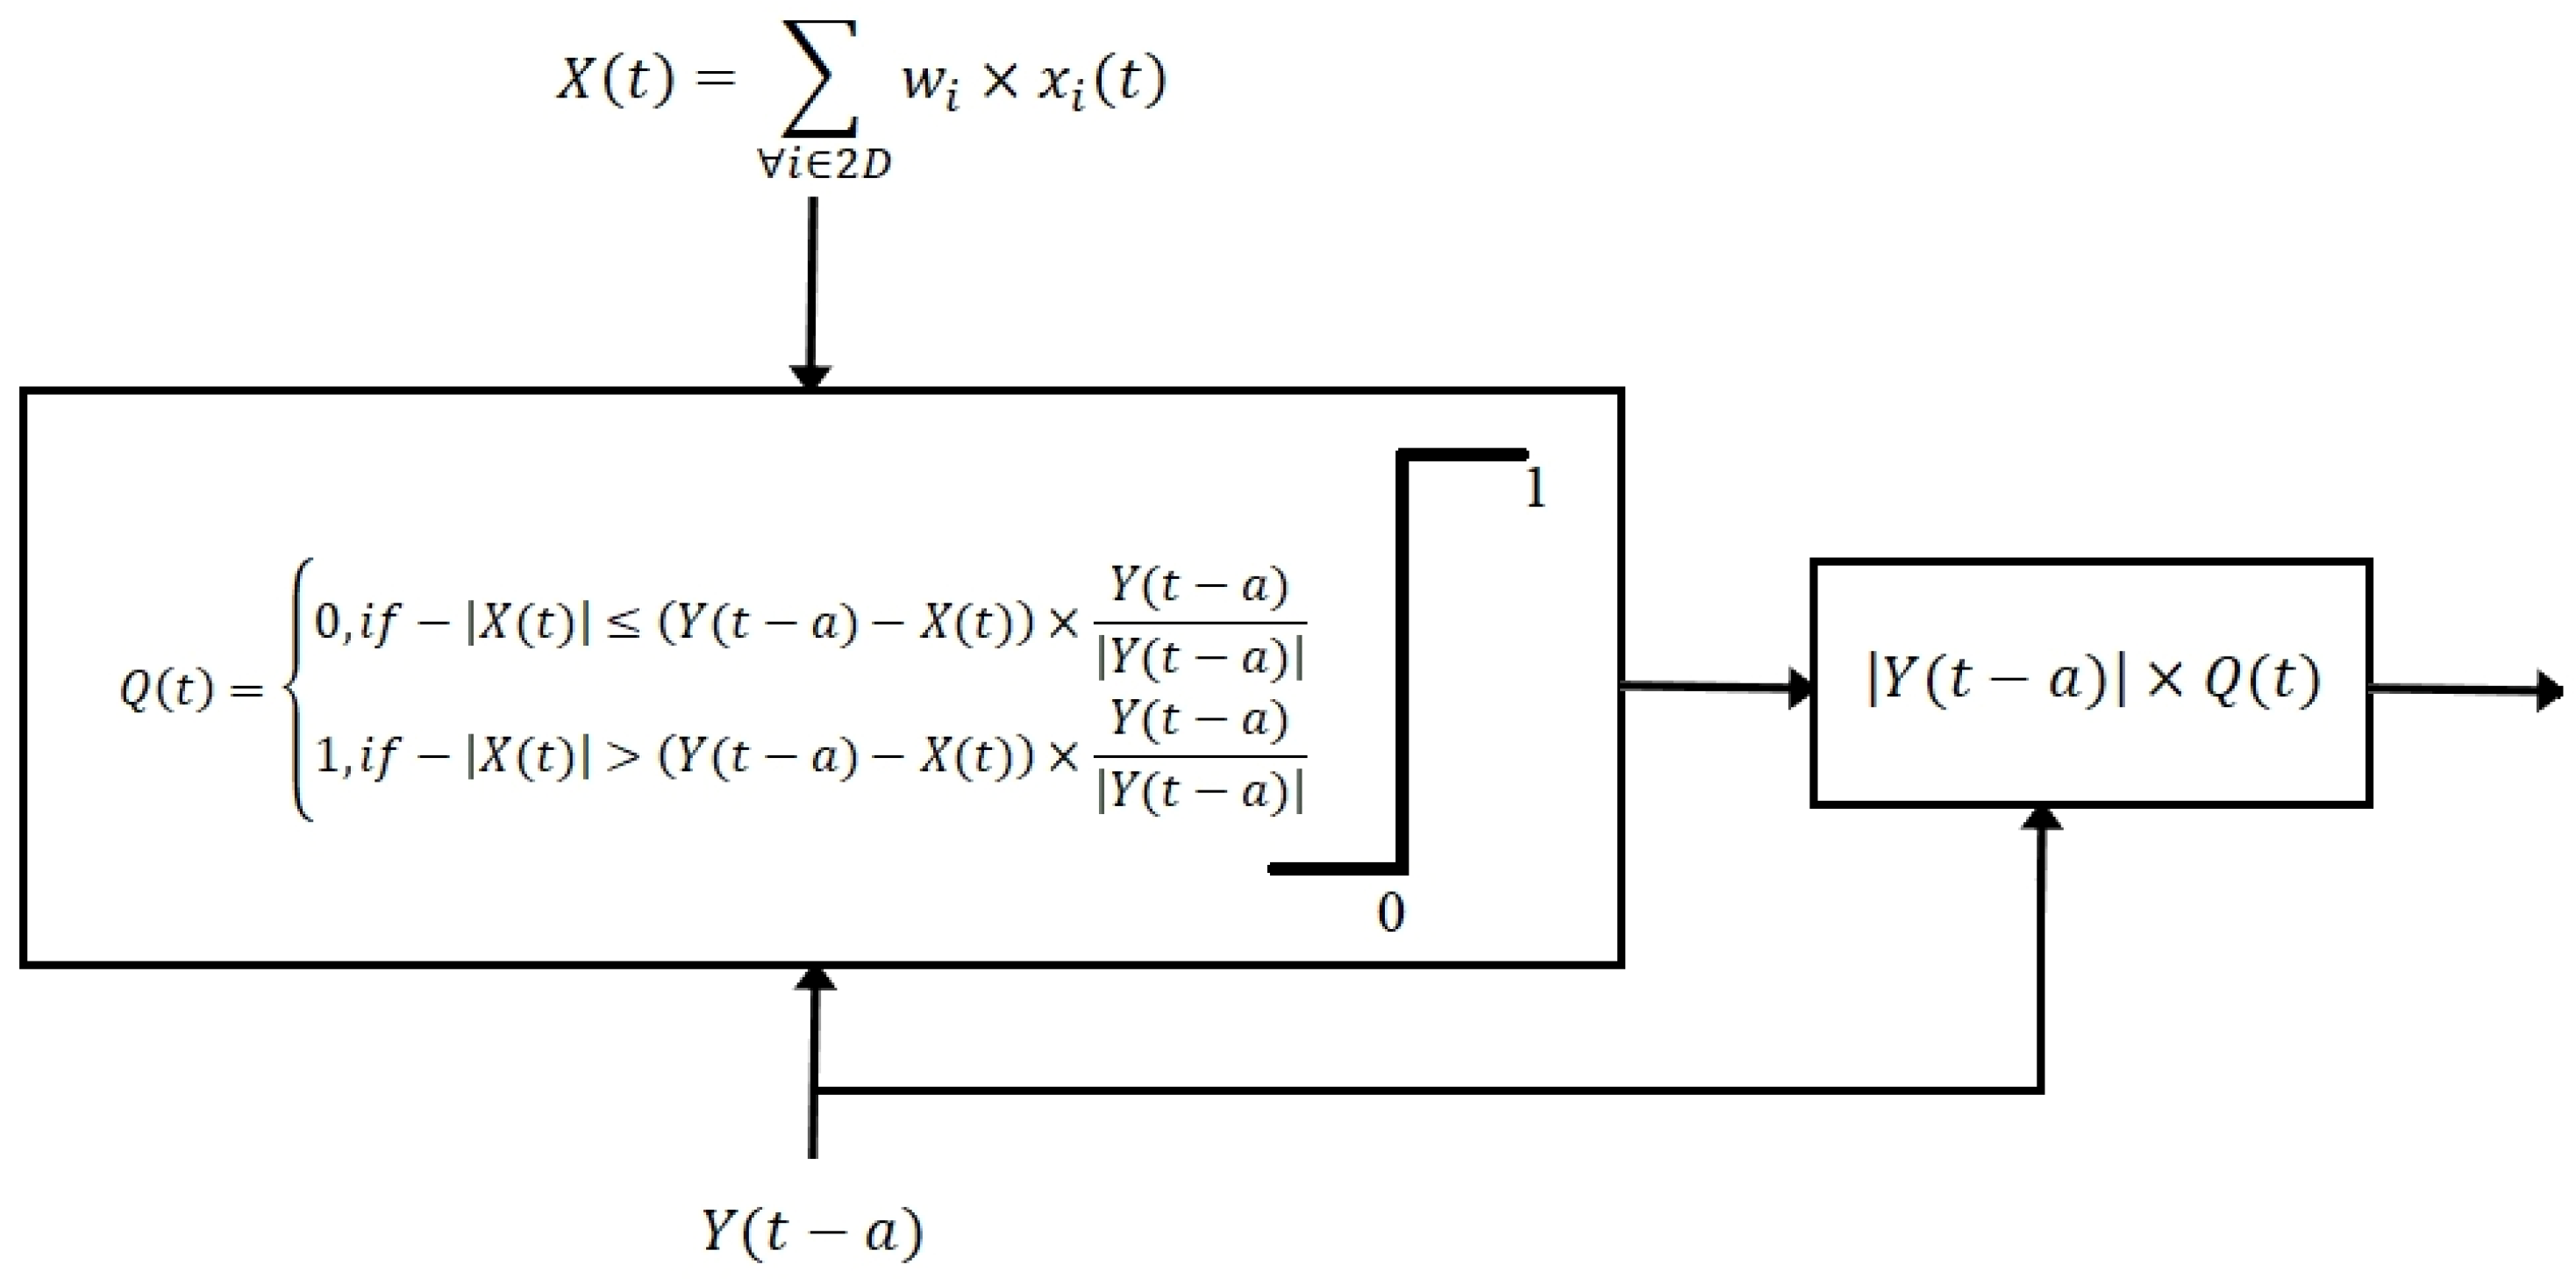
2.1. Theoretical Background: The Use of Neural-like Functions for Mismatch Functions Construction

From a technical point of view, location operations are largely determined by the matched filtering operation. Its essence lies in determining the value of the mismatch between the input and test signals. This value (number) is determined by calculating the value of a certain function, namely, the mismatch function. The mutual correlation function is used, in most cases, as a mismatch function in technical location systems.
Many animals are known to have the ability of echolocation. This ability is designated in the literature by a separate term “Animal Echolocation” [29]. Bats are capable of perceiving signals at a pressure of 0.001 mbar, i.e., 10,000 times less than that of signals emitted by them. At the same time, bats can avoid collisions with obstacles during flight, even when ultrasonic interference with a pressure of 20 mbar is superimposed on the echolocation signals [30]. It is stated that the mechanism of this effect is still unknown, and at the most basic level, echolocation depends on the neural anatomy of the brain hearing chains.
It can be assumed that for the implementation of the operation similar to the agreed filtering, animals use neurons that are basic functional brain elements, on the basis of which it is possible to implement a CF, an alternative to the function of mutual correlation. The correlation coefficient of the input and test signals, expressed in terms of mathematical expectation M ( X ) and M ( Y ) , respectively, the standard deviation of the input signal σ ( X ) and the standard deviation of the test signal σ ( Y ) , has the form:
R ( Y , X ) = 1 N i = 1 N [ Y i M ( Y ) ] × [ X i M ( X ) ] σ ( X ) × σ ( Y ) .
The above operation can be defined as an intermodulation operation. As can be observed from (1), the main operation of calculating the correlation function is the operation of multiplying signal samples.
As noted above, the main operational elements of objects of the animal world are neurons that carry out a nonlinear threshold operation on signals arriving at the dendrite inputs from synaptic contacts and forming signals at the axon outputs. The first formal model of neural networks (NN) was a model based on the McCulloch–Pitts neuron model [31]. This model formed the basis of the theory of logical networks and was actively used by psychologists and neurophysiologists in the modeling of some local processes of nervous activity. Figure 1 shows a mathematical model of the McCulloch–Pitts neuron. In the theory of neural networks, such a model is described as follows: Let there be n input quantities X 1 ,   X 2 ,   , X n as binary features describing the object X . The values of these signs are interpreted as the values of the impulses arriving at the input of the neuron through n input synapses. Let the impulses get into the neuron and add up with the weights W 1 ,   W 2 ,   , W n . If the weight is positive, then the corresponding synapse is excitatory, and if negative, then it is inhibitory. If the total pulse exceeds the specified activation threshold, then the neuron is excited and outputs 1, otherwise 0 is output. In the theory of neural networks, the function that converts the value of the total pulse into the output value of a neuron is commonly called the activation function. Thus, the McCulloch–Pitts model is equivalent to a threshold linear classifier (filter). Similarly, when applied to signal processing, the McCulloch–Pitts neuron model is a threshold function model, i.e., input signals are received at the input of the receiving device, they are summed with some weights, the received signal passes through the threshold device (function) and an output signal is obtained.
Consider the use of a modified McCulloch–Pitts formal neuron model for the formation of a nonlinear CF, an alternative to linear covariance. This is achieved by changing the threshold value in the McCulloch–Pitts model, depending on the ratios of the signal sample amplitudes [32]. Figure 2 shows an analytical model of the formation of a neuron-like CF proposed by the authors, based on the McCulloch–Pitts neuron model according to the algorithm in Figure 1. In this model, by analogy with the scheme in Figure 1, X ( t ) is, in general, the vector of the sum of the samples of the input signal x i ( t ) over some neighborhood determined by the size of the coupling function D , w i are the weight factors and Y ( t a ) is the vector of samples of the test signal ( a is a random time delay between the test and the received signals). The test signal is considered to be a noise-free signal, the parameter values of which correspond to the transformation used in the process of signal propagation (propagation, reflection and/or refraction, etc., of the emitted signal in a specific environment) during remote sensing. In the reduced version, the coupling function size is D = 0 (i.e., the input signal x ( t ) is an additive mixture of the signal under consideration and noise). The function Q ( X i , Y i ) = Q ( t ) (the signal has a time sweep) is here a threshold activation function that converts the test signal Y ( t a ) into the value of the signal at the output of such a neuron-like network | Y ( t a ) | × Q ( t ) .
The neuron-like CF is defined as follows:
Θ ( Y , X ) = 1 i = 1 N [ | Y i | × Q ( X i , Y i ) ] i = 1 N [ | Y i | ] ,
where
Q ( X i , Y i ) = { 0 ,   i f | X i | ( Y i X i ) × s i g n ( Y i ) 1 ,   i f | X i | > ( Y i X i ) × s i g n ( Y i ) .
Note that unlike the covariance function of the residual, the neuron-like residual function (2) is noncommutative, but it is easy to make it commutative [33]:
Θ ( Y , X ) = 1 i = 1 N m a x { [ | Y i | × Q ( X i , Y i ) ] ,   [ | X i | × Q ( Y i , X i ) ] } i = 1 N [ | Y i | ] + i = 1 N [ | X i | ] .
In this case, X and Y are interchanged in the expression for the Q function. Note that as in the case of the covariance mismatch function, with the neuron-like mismatch Functions (2)–(4), the mutual modulation of signals occurs (see Figure 3). The difference is that in this case the modulation has a nonlinear threshold character. Figure 3 demonstrates the neural-like mismatch function operation.

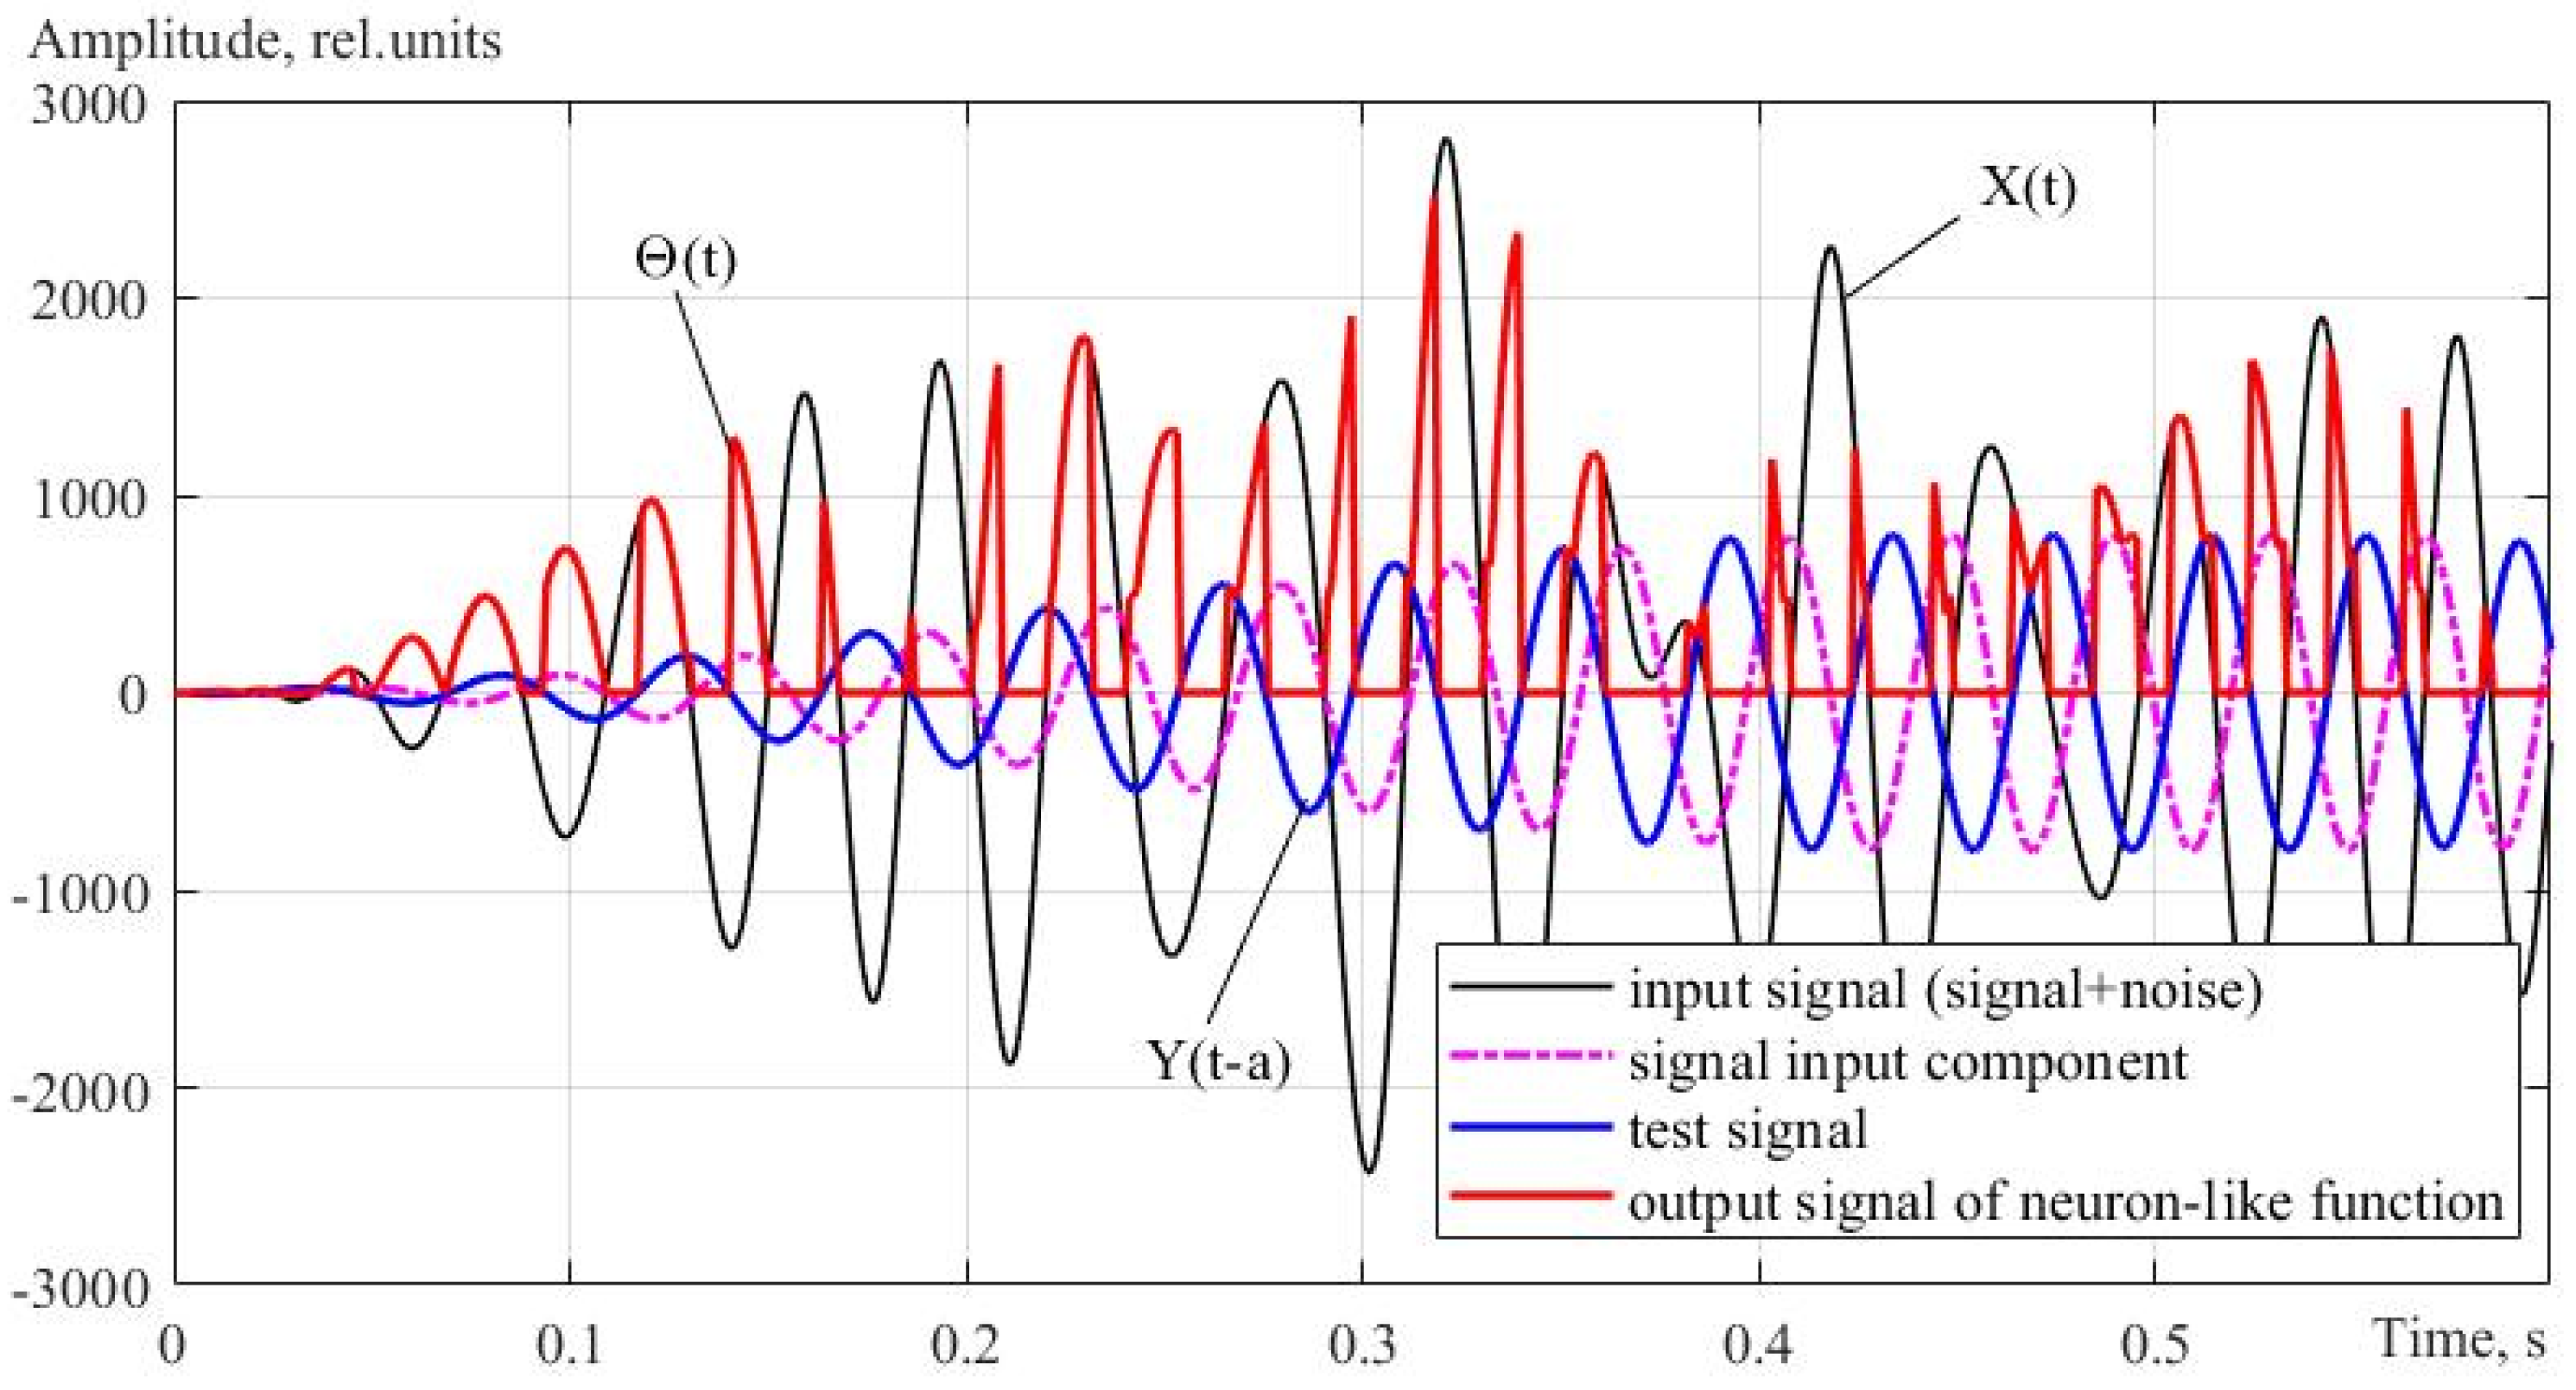
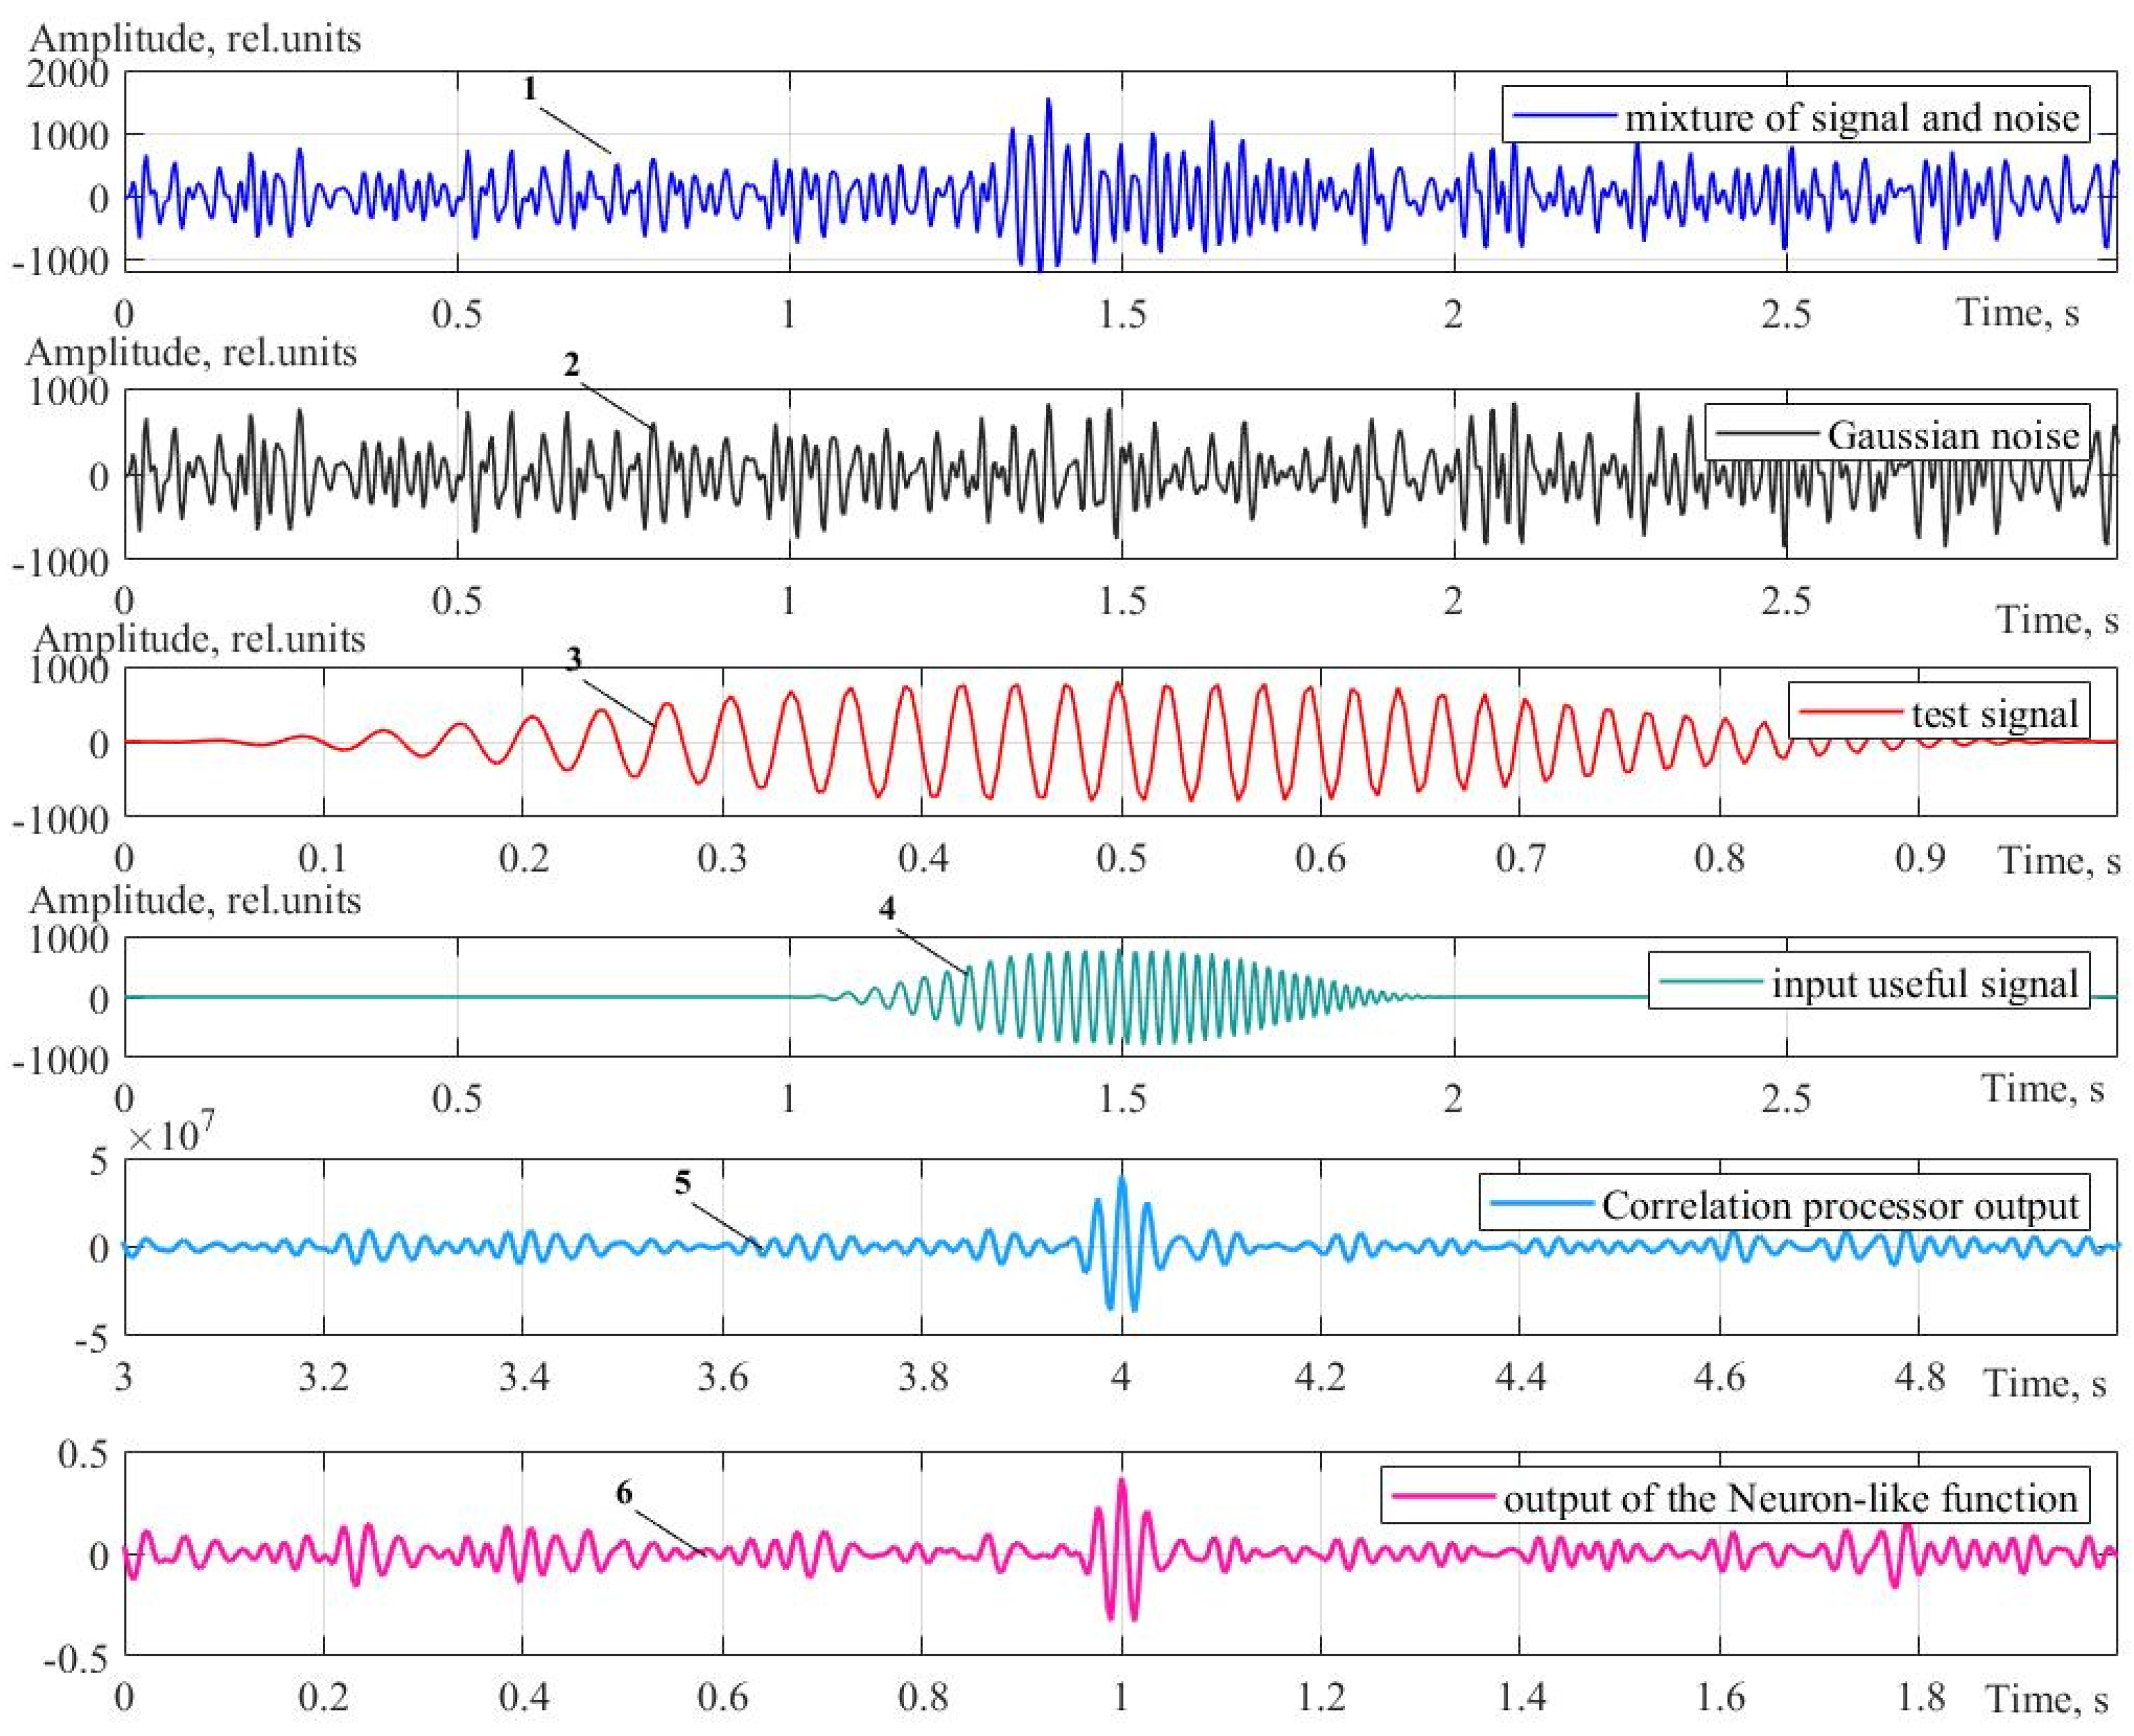
2.2. Description of the Research Method and Comparison of Location Signal Processing Procedures Based on Correlation and Neuron-like Criterion Functions

To study the procedures for the processing of location signals, the numerical mathematical modeling method was used. MATHCAD software is employed in the mathematical modeling. The modeling process involves the generation of a noise vector of normal or uniform distribution. The use of these types of distribution is due to the fact that they have the greatest differential entropy [34] and bring about the greatest distortion of the signal for a given noise level. The noise generator produces a broad-band noise vector n ( t ) (Figure 4, line 2), the greatest frequency of which corresponds to the discretization rate. The noise vector is additively mixed with the useful signal s ( t ) (Figure 4, line 4) to be recorded, forming an input signal (Figure 4, line 1). A chirp signal is used as a registered and test signal (Figure 4, line 3). The input and test signals are subjected to matched filtration, generating the readings of the covariance (Figure 4, line 5) and neuron-like mismatch functions (Figure 4, line 6). The degree of signal distortion at the input is estimated by calculating the SNR (5), while only the noise value of the test signal distributed in the band is taken into account n ( t ) :
S N R = 10 l g 0 T s 2 ( t ) d t 0 T n 2 ( t ) d t .
Figure 5 shows the energy spectra of the test and input noise-free signals, as well as the spectrum of the recorded noise.

2.3. Criteria for Making a Decision on the Presence of a Signal Component in the Registered Implementation

In the theory of statistical decisions, as a rule, the following decision criteria are considered:
  • Bayes criterion (is also the minimum average risk criterion).
  • The minimax criterion (is also the criterion for minimizing the maximum risk).
  • Neumann–Pearson criterion.
The disadvantage of the first two criteria is a large amount of a priori information about the losses and probabilities of object states, which should be at the observer’s disposal. This disadvantage is most clearly manifested in the analysis of object detection tasks, when it is very difficult to indicate a priori probabilities of the presence of a target in a specified area of space and loss due to a false alarm or missing a target [35,36]. Due to this, the Neumann–Pearson criterion [35,36], in which a specified probability value of a type I error (FAR) and the admissible value of the probability of a type II error (FRR) is determined [18,37], is used. The same criterion was employed in the modeling.
The operating characteristics of the covariance and neuron-like mismatch functions (the input SNR dependences of reliability (1-FRR) for a specified value of false alarm probability FAR) are generated to estimate the results.
The evaluation of the results of matched filtering by the Neumann–Pearson criterion was carried out using the following algorithm. At each step, histograms for estimating the densities of the probability functions of the value distribution of the correlation and neuron-like mismatch functions were formed. For this purpose, vectors of normally distributed noise were generated for a specified noise variance value. In the first case, for each independent implementation of the noise, the values of the correlation and neuron-like mismatch functions were calculated when comparing the noise vector with the chirp signal. On the basis of N realizations, histograms of the estimate of the distribution density functions of the values of the criterion functions are formed. In the second case, the same procedure is performed when adding the noise vector to the chirp signal. The number of realizations of the noise vector is N = 3000. As research has confirmed, an increase in the value of N did not lead to qualitative changes in the results. In the first case, for a specified FAR value (usually equal to 0.01), the decision threshold was determined to estimate the FRR value obtained in the formation of histograms of the distribution of the mismatch functions for a signal-noise mixture.
The procedures described above for determining the FRR values at given FAR values serve to form the performance characteristics of the covariance and neural-like mismatch functions, namely, confidence dependences (1-FRR) for a specified FAR value on the SNR at the input.

3. Results

3.1. Stationary Gaussian Noise

Generating 3000 implementations of the noise vector, the probability densities of the distribution of values from the output of the correlation and neuron-like criterion functions were constructed in the presence of a signal component in the input signal and in its absence at the solution point (the point of coincidence of the signal component of the input and the test signals) (Figure 6). The variance of the distribution of the residual functions in the absence of an input signal for the correlation function of the residual was 0.0441, and for the neuron-like residual function, 0.0443. Further, according to the Neumann–Pearson criterion, a threshold was set for the values of residuals, when only noise is applied to the processing input, taking the value of the false alarm probability FAR equal to 0.01. The probability of correct detection (1-FRR) was determined by the set threshold. Then, changing the SNR value, the performance characteristics of the correlation and neuron-like criterion functions were calculated (Figure 7).
Figure 6 and Figure 7 illustrate the advantages of the covariance function in comparison with the neuron-like one with stationary noise (when the dispersion of additive noise does not change over the signal registration time). By setting the threshold for the probability of a false alarm equal to 0.01 (the red vertical dotted line in Figure 6), calculations show that the probability of correct detection for the covariance function is 1, and for the neuron-like one, 0.998.
This can be observed in more detail from the analysis of the performance characteristics presented in Figure 7. In Figure 7, the horizontal red dotted line marks the probability level of correct detection equal to 0.99. The vertical dotted lines in Figure 7 show the SNR values at which this probability level of correct detection is achieved for covariance and a neuron-like CF. Figure 7 shows that the specified probability level of correct detection for the covariance function is achieved with a lower SNR than for a neuron-like CF, and the gain is on average about 0.6 dB.

3.2. Non-Stationary Gaussian Noise with an Incremental Trend

Consider the case where the variance of the noise determining the decision threshold (in the absence of a signal component at the input) is less than the variance of the noise when operating in analysis mode in the presence of a signal component at the input. For example, if the noise variance recorded before probing is less than that during the emission and reception of useful signals against the background of noise.
Similarly, for such a case, the probability densities of the distribution of values from the output of the correlation and neuron-like criterion functions were constructed in the presence of a signal component in the input signal and in its absence at the solution point (Figure 8). The variance of the distribution of the residual functions in the absence of an input signal for the correlation function of the residual was 0.0299 and for the neuron-like residual function, 0.0298.
Due to setting the threshold for the probability of a false alarm equal to 0.01 (the red vertical dotted line in Figure 8), it was found that the correct detection probability for a neuron-like function is 1, and the correlation function is 0.999.
The calculation of the performance characteristics presented in Figure 9 shows that with incremental non-stationary noise, a neuron-like function has a significant advantage. In Figure 9, the horizontal red dotted line marks the probability level of correct detection equal to 0.99. The vertical dotted lines in Figure 9 show the values of the SNR ratios at which this probability level of correct detection is achieved for covariance and neuron-like criterion functions. It can be observed that a specified probability level of correct detection for a neuron-like function is achieved with a lower SNR ratio than for a correlation function. The gain in this case averages about 1.5 dB in favor of a neuron-like function.

3.3. Non-Stationary Gaussian Noise with a Decreasing Trend

Another variant of non-stationary noise is the case where the noise variance that determines the decision threshold (in the absence of a signal component at the input) is higher than the noise variance when operating in analysis mode with a signal component at the input, e.g., if the noise variance recorded before probing is higher than that during the emission and reception of useful signals against the background of noise.
The probability densities of the distribution of values from the output of the correlation and neuron-like criterion functions in the presence of a signal component in the input signal and in its absence at the solution point were also constructed (Figure 10). The variance of the distribution of residual functions in the absence of an input signal for the correlation function of the residual was 0.0427 and for the neuron-like residual function, 0.0395.
Due to setting the threshold for the probability of a false alarm equal to 0.01 (the red vertical dotted line in Figure 10), it was found that the probability of correct detection for a neuron-like function is 1, and the correlation function is 0.998.
The calculation of the performance characteristics presented in Figure 11 shows that with incremental non-stationary noise, the neuron-like function operates better than the correlation function. In Figure 11, the horizontal red dotted line marks the probability level of correct detection equal to 0.99. The vertical dotted lines in Figure 11 show the values of the SNR ratios at which a given level of probability of correct detection is achieved for covariance and neuron-like criterion functions. The calculations have shown that a specified probability level of correct detection for a neuron-like function is achieved with a lower SNR ratio than that for a correlation function. The gain in this case averages about 1.22 dB in favor of a neuron-like function.

4. Discussion

Let us consider the empirical pattern discovered by Harold Edwin Hurst, which determines the trend of stochastic processes [38]. The pattern is described by the following relations:
X τ ¯ = 1 τ 0 τ X ( t ) d t ,
V ( t , τ ) = 0 τ [ X ( t ) X τ ¯ ] d t
R ( t ) = V m a x ( t , τ ) V m i n ( t , τ ) ,
S = [ 1 τ 0 τ ( X ( t ) X τ ¯ ) 2 d t ] 1 2 ,
R S = ( τ 2 ) H r ,
where X ( t )   is the value of the realizations of the process observed in time, S is the standard deviation from the average value at a specified interval τ , V is the time series of accumulated deviations from the average value for each subperiod, R is the span of a series of values V , the ratio R / S is called the normalized span during each subperiod, and H r is the Hurst exponent.
Subsequently, it turned out that many natural processes can be described well by this pattern. Time sequences for which H r is greater than 0.5 refer to the persistent class, namely, preserving the existing trend. If the increments have been positive for some time in the past, i.e., an increase has taken place, then the increase will continue on average. Thus, for a process with H r > 0.5, a tendency to increase in the past means a tendency to increase in the future. Conversely, a downward trend in the past means, on average, a continuation of the decline in the future. The greater the H r , the stronger the trend. At H r = 0.5, no pronounced tendency of the process has been revealed, and there is no reason to assume that the tendency will appear in the future. An example of such a process is Brownian motion (white noise). H r < 0.5 is characterized by antipersistence. The less the H r , the greater the likelihood of a trend change.
Mandelbrot showed that the fractal dimension is the reciprocal of the Hurst exponent [39]. For example, for H r = 0.5, the fractal dimension is 2 (1/0.5), and for H r = 0.8, the fractal dimension is 1.25 (1/0.8).
The Hurst exponent, as an estimate of the fractal dimension of time series, is widely used in such areas as the analysis of financial markets [40], geological data processing, flaw detection, etc.
This paper presents the results of processing real hydroacoustic noises of the sea obtained during experiments on hydroacoustic sounding in the Black Sea, for which the value of the Hurst index was determined. The exponent was calculated for 2000 implementations of real acoustic noise. The average value of the Hurst index of real experimental noise is H r ≈ 0.64 with the variance of this exponent σ H r = 0.001058. The results of calculating of the Hurst index of real hydroacoustic noises demonstrate that its value is significantly higher than 0.5, which indicates the presence of a stable trend (persistence) in the noise. In order to assess the reliability of the persistence of real noises, the values of their Hurst indices were compared with the values of the Hurst index of model implementations of white noise, having the same number of samples as real noise implementations. Figure 12 and Figure 13 demonstrate an example of the implementation of model noise in comparison with the implementation of real acoustic noise. Figure 12 shows graphs of implementations of experimental hydroacoustic noise (red line) and model Gaussian white noise (blue line). It can be observed that the time sweep of the real noise has no fullness in comparison with the model noise. This is confirmed by their energy spectra shown in Figure 13. These graphs demonstrate the contribution of various frequency components to the noise received during the field experiment. The estimates show that the Hurst index of real noise (red line in Figure 14) is 0.641, and the Hurst index of white model noise (blue line in Figure 14) is 0.511.
The average value of the Hurst exponent calculated for 5000 implementations of the model white noise was 0.52. The magnitude of the triple variance ( 3 σ H r ) of the spread of the Hurst exponent values was 3 σ H r = 0.0018. The calculated values indicate that real noise signals are non-stationary in nature with high persistence and the neuron-like method has an advantage under conditions of variation in time of noise dispersion.
In addition, 125 noise implementations recorded on different hydrophones were taken from the available data. For each hydrophone, diagrams of the dispersion values in each of the 125 implementations were plotted. Figure 14 shows a diagram of the distribution of variances depending on the implementation number for one of the hydrophones (black line). Further, the machine linear approximation of the obtained value spreads showed an increase in the dispersion of real noise over time (the blue line in Figure 14), which also confirms the presence of non-stationarity in real marine noise. This, in turn, indicates the advantage of the neuron-like CF in relation to the covariance function in the analysis of real hydroacoustic signals.

5. Conclusions

The development of methods of detecting signals in the presence of noise of various nature is an important research issue in remote sensing tasks. Currently, artificial neural networks, constructed by analogy with information processing systems in natural neural networks in living organisms, are actively studied and widely used to solve various practical problems. The development of such signal processing algorithms, which are based on the neuron operation, show the effectiveness of these algorithms in calculations.
The above results indicate the possibility of carrying out signal location operations based on a neuron-like operational basis. The analysis of the real hydroacoustic noise of the sea shows that it has a non-stationary character with significant persistence. The simulation results make it possible to conclude that in the conditions of non-stationary noises, signal location methods based on a neuron-like operational basis may have an advantage over correlation analysis. The results, which enable one to partially explain the principles of the functioning of animal echo locators, are of significant practical interest for the development of methods and algorithms for signal processing in hydroacoustic antennas.
An important feature of signal location procedures based on the use of neuron-like residual functions is a relatively simple scheme of implementation of these procedures. They are based on logical comparison operations, in contrast to the more computationally demanding operations of calculating the correlation or, e.g., LP2 (Euclidean distance norm) mismatch functions. In the case of correlation analysis, it is necessary to make calculations using statistical moments, multiplication operation and floating data representation, which entails the use of additional computing resources. The implementation of the calculation of a neuron-like CF is possible on the basis of the native processor code and integer arithmetic (representation of data in a fixed-point form). In addition, in a neuron-like function, only logical operations are employed, including addition operations and determining the sign of a number. From a computational point of view, this gives a gain in the amount of calculations (and, as a result, in speed) of at least an order of magnitude compared to the implementation of traditional methods.
The results obtained are significant for various practical situations related to remote sensing of the bottom and underwater objects in non-stationary conditions when the parameters of the statistical distribution of additive noise present in the experiment are not known a priori.

Author Contributions

Conceptualization, A.G.K. and A.I.K.; methodology, A.G.K.; software, A.G.K. and V.I.K.; validation, A.G.K., V.I.K., A.I.M. and A.I.K.; formal analysis, V.I.K.; investigation, A.G.K.; resources, A.G.K.; data curation, A.G.K. and V.I.K.; writing—original draft preparation, A.G.K. and A.I.M.; writing—review and editing, V.I.K. and A.I.M.; visualization, A.G.K.; supervision, A.G.K., V.I.K. and A.I.M.; project administration, A.G.K. and V.I.K. All authors have read and agreed to the published version of the manuscript.

Funding

This research was funded by the Russian Science Foundation, grant number 20-19-00383.

Data Availability Statement

Not applicable.

Acknowledgments

We thank anonymous reviewers for their comments towards improving this manuscript.

Conflicts of Interest

The authors declare no conflict of interest.

References

  1. Coulson, R.; Glegg, S. Imaging of ocean noise. J. Acoust. Soc. Am. 1996, 100, 2736. [Google Scholar] [CrossRef]
  2. Mishachandar, B.; Vairamuthu, S. Diverse ocean noise classification using deep learning. Appl. Acoust. 2021, 181, 108141. [Google Scholar] [CrossRef]
  3. Miksis-Olds, J. Global trends in ocean noise. Adv. Exp. Med. Biol. 2015, 875, 713–718. Available online: https://www.ncbi.nlm.nih.gov/pubmed/26611023 (accessed on 1 July 2022).
  4. Porter, M.; Henderson, L. Computation of ocean noise fields. J. Acoust. Soc. Am. 2013, 134, 4151. [Google Scholar] [CrossRef]
  5. Kuperman, W. Ocean noise: Lose it or use it. J. Acoust. Soc. Am. 2013, 133, 3504. [Google Scholar] [CrossRef]
  6. Guoli, W.; Hefeng, D.; Ganpan, K.; Junqiang, S. Shear-Wave Tomography Using Ocean Ambient Noise with Interference. Remote Sens. 2020, 12, 2969. [Google Scholar] [CrossRef]
  7. Askeland, B.; Ruud, B.O.; Hobak, H.; Mjelde, R. A seismic field test with a low-level acoustic combustion source and pseudo-noise codes. J. Appl. Geophys. 2008, 67, 66–73. [Google Scholar] [CrossRef]
  8. Claerbout, J.F.; Muir, F. Robust modeling with erratic data. Geophysics 1973, 38, 826–844. [Google Scholar] [CrossRef]
  9. Nadu, G. Classification Algorithms in Pattern Recognition. IEEE Trans. Audio Electroacoust. 1968, 16, 203–212. [Google Scholar] [CrossRef]
  10. Bai, J.; Yingst, D. Simultaneous inversion of velocity and density in time-domain full waveform inversion. In Proceedings of the SEG Denver 2014 Annual Meeting, Denver, CO, USA, 26–31 October 2014; pp. 922–927. [Google Scholar]
  11. Trees, H.V. Detection, Estimation, and Modulation Theory, Part I, Detection, Estimation, and Linear Modulation Theory; John Wiley & Sons: New York, NY, USA, 1968; p. 697. [Google Scholar] [CrossRef]
  12. Tikhonov, V.I. Optimal Signal Reception; Izdatel Radio Sviaz: Moscow, Russia, 1983; 390p. (In Russian) [Google Scholar]
  13. Kalinina, V.I.; Malekhanov, A.I.; Smirnov, I.P.; Khil’ko, A.I. Coherent marine seismoacoustics: New approaches to reconstructing bottom layer structures in shelf water areas. Bull. Russ. Acad. Sci. Phys. 2017, 81, 920–926. [Google Scholar] [CrossRef]
  14. Smirnov, I.P.; Kalinina, V.I.; Khil’ko, A.I. Reconstruction of the sea bottom parameters for coherent seismoacoustic sounding: I. Decision rules. Acoust. Phys. 2018, 64, 49–57. [Google Scholar] [CrossRef]
  15. Smirnov, I.P.; Kalinina, V.I.; Khil’ko, A.I. Reconstruction of sea bottom parameters for coherent seismoacoustic probing: II. Analysis of robustness. Acoust. Phys. 2018, 64, 205–214. [Google Scholar] [CrossRef]
  16. Kalinina, V.I.; Khil’ko, A.I.; Khil’ko, A.A.; Smirnov, I.P. Reconstruction of sea bottom parameters for coherent seismoacoustic probing: III. Signal accumulation and noise suppression. Acoust. Phys. 2019, 65, 30–40. [Google Scholar] [CrossRef]
  17. Kalinina, V.I.; Smirnov, I.P.; Khilko, A.I.; Malekhanov, A.I. Comparative analysis of the noise immunity of algorithms for reconstructing seabed geoacoustic parameters by the coherent sounding technique. Acoust. Phys. 2021, 67, 381–396. [Google Scholar] [CrossRef]
  18. Khobotov, A.G.; Kalinina, V.I.; Khilko, A.I. Investigation of the use of neuron-like procedures for processing coherent location signals. Opt. Mem. Neural Netw. 2021, 30, 327–337. [Google Scholar] [CrossRef]
  19. Teeling, E.C.; Jones, G.M.; Rossiter, S.J. Phylogeny, Genes, and Hearing: Implications for the Evolution of Echolocation in Bats, Bat Bioacoustics. Springer Handb. Audit. Res. 2016, 54, 25–54. [Google Scholar] [CrossRef]
  20. Tsagkogeorga, G.; Parker, J.; Stupka, E.; Cotton, J.A.; Rossiter, S.J. Phylogenomic analyses elucidate the evolutionary relationships of bats. Curr. Biol. 2013, 23, 2262–2267. [Google Scholar] [CrossRef]
  21. Do, M.N.; Lu, Y.M. Multidimensional filter banks and multiscale geometric representations. Found. Trends Signal Process. 2011, 5, 157–264. [Google Scholar] [CrossRef]
  22. Jones, G.; Teeling, E.C. The evolution of echolocation in bats. Trends Ecol. Evol. 2006, 21, 149–156. [Google Scholar] [CrossRef]
  23. Lewanzik, D.; Sundaramurthy, A.K.; Goerlitz, H.R. Insectivorous bats integrate social information about species identity, conspecific activity and prey abundance to estimate cost-benefit ratio of interactions. J. Anim. Ecol. 2019, 88, 1462–1473. [Google Scholar] [CrossRef] [Green Version]
  24. Griffin, D.R. Echolocation by Blind Men, Bats and Radar. Science 1944, 100, 589–590. [Google Scholar] [CrossRef] [PubMed]
  25. Wang, S.; Han, L.; Gong, X.; Zhang, S.; Huang, X.; Zhang, P. MCMC Method of inverse problems using a neural network—Application in GPR crosshole fullwaveform inversion: A Numerical Simulation Study. Remote Sens. 2022, 14, 1320. [Google Scholar] [CrossRef]
  26. Bradbury, M.C.; Conley, D.C. Using artificial neural networks for the estimation of subsurface tidal currents from high-frequency radar surface current measurements. Remote Sens. 2021, 13, 3896. [Google Scholar] [CrossRef]
  27. Yan, J.; Meng, J.; Zhao, J. Real-time bottom tracking using side scan sonar data through one-dimensional convolutional neural networks. Remote Sens. 2020, 12, 37. [Google Scholar] [CrossRef]
  28. Wang, X.; Liu, A.; Zhang Yu Xue, F. Underwater acoustic target recognition: A combination of multi-dimensional fusion features and modified deep neural network. Remote Sens. 2019, 11, 1888. [Google Scholar] [CrossRef]
  29. Shriram, U.; Simmons, J.A. Echolocating bats perceive natural-size targets as a unitary class using micro-spectral ripples in echoes. Behav. Neurosci. 2019, 133, 297–304. [Google Scholar] [CrossRef]
  30. Grinnell, A.D. Hearing in bats: An overview. In Hearing in Bats; Springer: New York, NY, USA, 1995; pp. 1–36. [Google Scholar] [CrossRef]
  31. McCalloch, W.S.; Pitts, W. A logical calculus of the ideas immanent in nervous activity. Bull. Math. Biophys. 1943, 5, 115–133. [Google Scholar] [CrossRef]
  32. Khobotov, A.G.; Khilko, A.I.; Romanova, V.I. Using free-dynamics neural-network structures with context-dependent parameters for observations in inhomogeneous nonstationary media. Radiophys. Quantum Electron. 2013, LVI, 104–124. [Google Scholar] [CrossRef]
  33. Altman, A.B.; Kleiman, S. A Term of Commutative Algebra; Worldwide Center of Mathematics, LLC.: Cambridge, MA, USA, 2013; p. 266. Available online: http://hdl.handle.net/1721.1/116075 (accessed on 11 March 2018).
  34. Khobotov, A.G.; Khilko, A.I.; Tel’nykh, A.A. Information approach to the digital recording of signals. Radiophys. Quantum Electron. 2020, 62, 618–626. [Google Scholar] [CrossRef]
  35. Vasiliev, K.K. Signal Processing Methods: A Textbook; UlGTU: Ulyanovsk, Russia, 2001; p. 80. ISBN 5-89146-200-0. (In Russian) [Google Scholar]
  36. Scott, C.D. Statistical Signal Processing; Rice University: Houston, TX, USA, 2011; p. 140. Available online: https://ftpmirror.your.org/pub/misc/cd3wd/1006/Statistical_Signal_Processing_stats_maths_dsp_cnx_x10232_.pdf (accessed on 4 February 2011).
  37. Khobotov, A.G.; Khilko, A.I.; Yakhno, V.G. Analysis of advantages of neuron-like systems in the procedure of signal comparison measure calculation. Opt. Mem. Neural Netw. 2008, 17, 299–307. [Google Scholar] [CrossRef]
  38. Hurst, H.E. Long-term storage capacity of reservoirs. Trans. Am. Soc. Civ. Eng. 1951, 116, 770–799. [Google Scholar] [CrossRef]
  39. Mandelbrot, B.; Van Ness, J. Fractional Brownian Motions, Fractional Noises and Application. SIAM Rev. 1968, 10, 422–437. [Google Scholar] [CrossRef]
  40. Mandelbrot, B.; Hudson, R.L.; Grunwald, E. The (mis)behavior of markets. Math. Intell. 2005, 27, 77–79. [Google Scholar] [CrossRef]
Figure 1. Mathematical model of McCulloch–Pitts neuron.
Remotesensing 14 04860 g001
Figure 2. The main model for the formation of a neuron-like CF.
Remotesensing 14 04860 g002
Figure 3. Formation of a neuron-like CF: Y ( t a ) is the test signal, X ( t ) is the input signal and Θ ( t ) is the output signal of a neuron-like CF.
Remotesensing 14 04860 g003
Figure 4. Diagrams of input and output signals: line 1 is the mixture of signal and noise at the input of the signal analysis procedure, line 2 is the Gaussian noise, line 3 is the test signal, line 4 is the input useful signal, line 5 is the correlation processor output and line 6 is the neuron-like function output.
Remotesensing 14 04860 g004
Figure 5. Line 1 is the test signal spectrum, line 2 is the input signal spectrum and line 3 is the noise spectrum.
Remotesensing 14 04860 g005
Figure 6. Probability density of the distribution of the values of the correlation and neuron-like criterion functions with stationary noise.
Remotesensing 14 04860 g006
Figure 7. Performance characteristics (stationary noise).
Remotesensing 14 04860 g007
Figure 8. Histograms of the distribution values of the correlation and neuron-like functions with non-stationary incremental noise.
Remotesensing 14 04860 g008
Figure 9. Performance characteristics (non-stationary incremental noise).
Remotesensing 14 04860 g009
Figure 10. Histograms of the distribution of the values of the functions of the correlation and neuron-like criterion functions with non-stationary decremental noise.
Remotesensing 14 04860 g010
Figure 11. Performance characteristics (non-stationary decremental noise).
Remotesensing 14 04860 g011
Figure 12. Diagrams of real experimental noise and Gaussian white model noise (red and blue lines, respectively).
Remotesensing 14 04860 g012
Figure 13. The energy spectra of the noise presented in Figure 14: white noise and real noise (blue and red colors, respectively).
Remotesensing 14 04860 g013
Figure 14. Dispersion distributions depending on the implementation number for one of the hydrophones.
Remotesensing 14 04860 g014
Publisher’s Note: MDPI stays neutral with regard to jurisdictional claims in published maps and institutional affiliations.

