1. Introduction
The Međimurje region is the smallest county in Croatia (729 km
2). However, after the Croatian capital City of Zagreb, this is the second highest populated area in Croatia, with 156 people/km
2 (
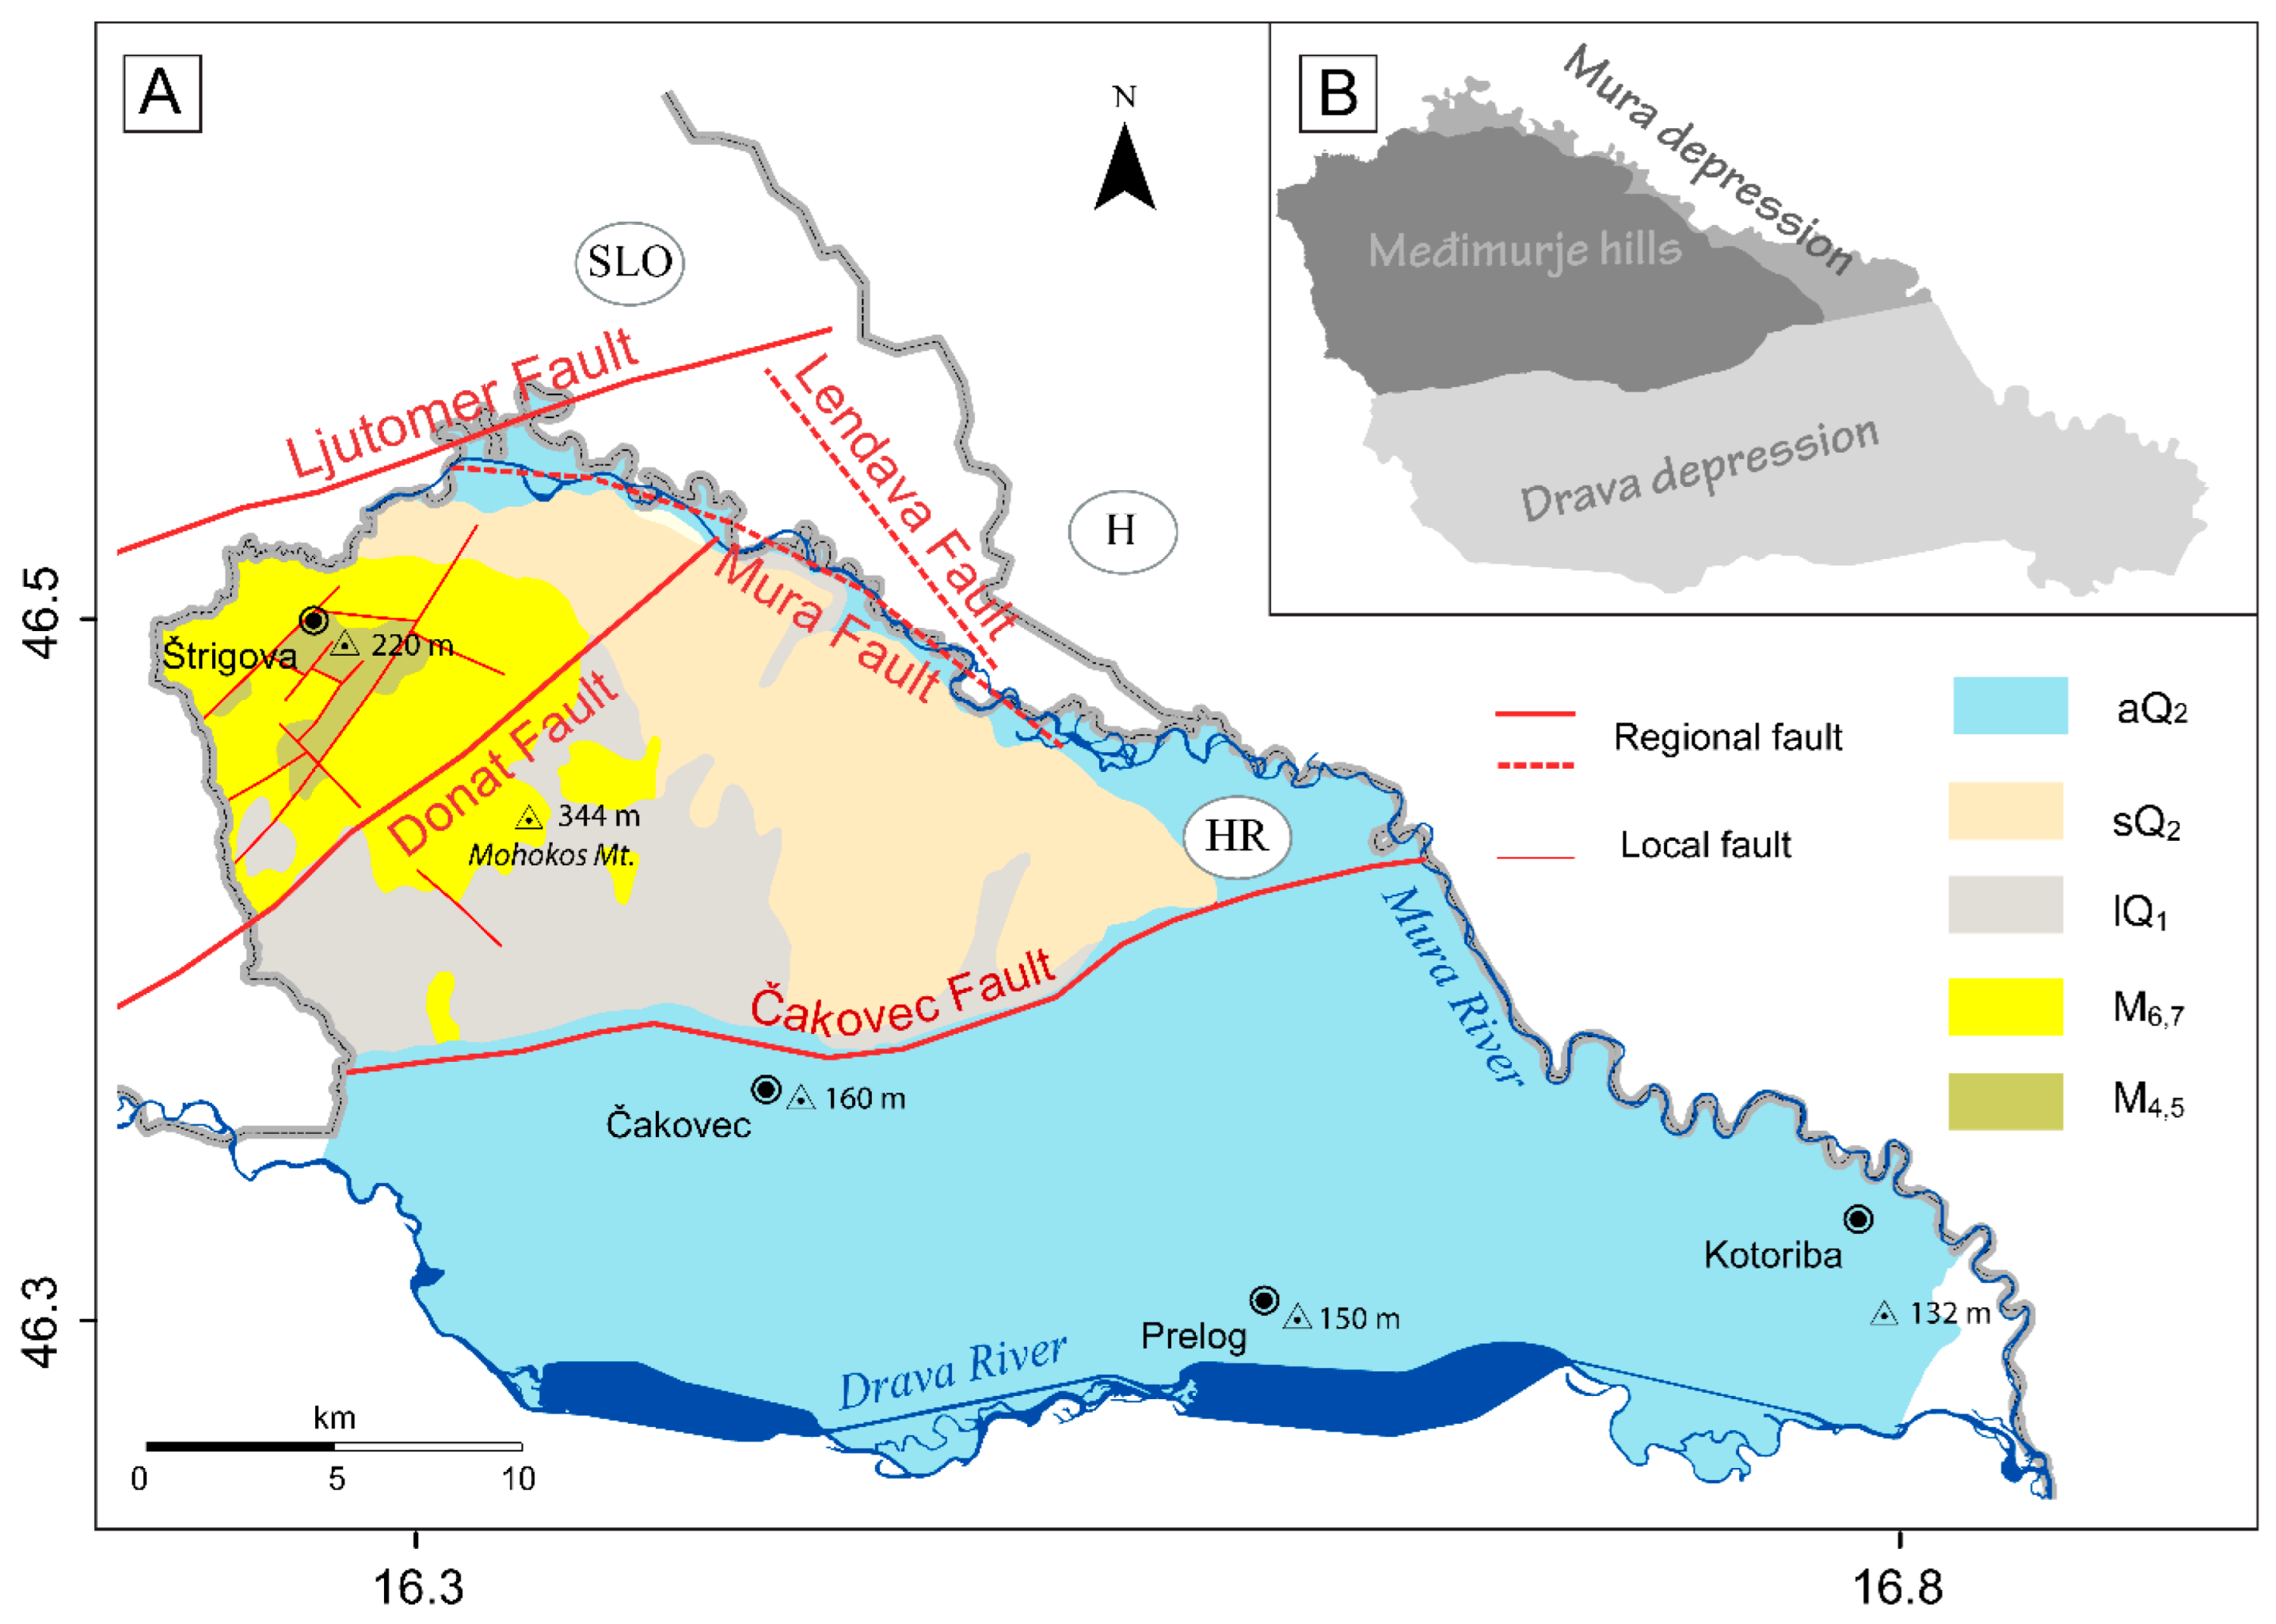
https://medjimurska-zupanija.hr/opci-podaci-mz/ (accessed on 10 July 2022)). It is situated between the Drava and Mura rivers and is divided into two subgeomorphological parts: Lowland Međimurje to the northeast, east, and south; Međimurje Hills to the northwest. Lowland Međimurje is an alluvial basin distinguished by three major subbasins: Mura, Čakovec, and Kotoriba. A slightly elevated hilly area is referred to as Međimurje Hills with elevations ranging between 132 and 344 m.a.s.l. The latter is the elevation of the highest hill—Mohokos, morphologically the most pronounced structure in Međimurje.
In terms of seismicity, Međimurje can be characterized as a low-seismicity area (0.14–0.19 g based on seismic hazard map for 475-year return period, [
1]). It is mostly controlled by the seismicity of neighboring areas in Slovenia, Hungary, as well by areas around Mts. Ivanščica and Kalnik with moderate magnitudes between 4 and 5 [
2,
3]. Significant earthquake consequences in the Međimurje region are those known from the most notable historical earthquakes [
4], namely the Great Zagreb 1880 earthquake with an estimated magnitude of 6.3, Koprivnica-Legrad earthquakes in 1778 and 1938 with magnitudes above 5.5, as well as the earthquake in Zajezda near Mt. Ivanščica in 1836 with an estimated magnitude of 5.7 (according to the Croatian Earthquake Catalog—CEC; updated version first described in Herak et al. [
5]).
On 30 March 1738, the Međimurje region was struck by an earthquake with a macroseismic intensity estimated in the epicenter of 7.9° MCS and a magnitude of 5.1 (Herak et al. [
3]). Historical archives reported heavy earthquake damage for the entire region, especially of brick wall and wooden structures, churches, and chapels. The famous Church of St. Jerome located in Štrigova was rebuilt in 1749 following the earthquake demolition of the original 15th-century-built chapel. Old Gothic architecture of the Zrinski Old Town Castle in Čakovec city was also damaged. On 22 March 2020, the M
L5.5 earthquake (Markušić et al. [
6]) struck the city of Zagreb and small damages to older churches were reported also in Međimurje (approx. 80 km from epicenter). However, moderate damages to churches and older buildings in the whole Međimurje region (approx. 100 km from epicenter) were reported following the destructive M
L6.2 Petrinja earthquake (Markušić et al. [
7]; Baize et al. [
8]), which occurred on 29 December 2020.
Local site effects, namely the topographic, morphological, and stratigraphic features, as well as their physical and mechanical properties of the local terrain, play a significant role in earthquake damage distribution (e.g., [
9]). The first scientific observation of the local site effects and variable earthquake damage in a relatively small local area was presented in 1871 by Stur [
10], analyzing the Klana earthquake sequence in 1871. Stur [
10] presented evidence of an unequal distribution of earthquake damage related to different soil conditions in the area around Klana and Studena villages near the city of Rijeka (Croatia). Local site effects are a known problem in earthquake engineering. Ground motions recorded on soft soil sites (e.g., alluvial sediments) or other soft sediment types in low-topographic areas are found to be significantly larger than those recorded on areas with bedrock subsurfaces. However, observations among different studies show that these effects are not the same for the similar local and regional sites, as well for earthquakes of similar magnitude and epicentral distance (e.g., [
11,
12,
13]). The Međimurje region offers a possibility to study local site effects in a hilly area covered with soft sediments known for landslides, and in a topographically low area with thick alluvial sediments with a relatively high groundwater level. Well described damage from past earthquakes is also of great importance for the research.
The main aim of this analysis is to understand what is the importance of local site effects in the Međimurje region when explaining the significant damage and observed higher intensities after historical earthquakes in 1738 (Međimurje) and 1880 (Zagreb); events that occurred in the instrumental era: 1938 M
L5.6 Koprivnica, 1982 M
L4.5 Ivanec, and the most recent 2020 Zagreb M
L5.5 and 2020 Petrinja M
L6.2 earthquakes. Based on macroseismic observations compared to macroseismic models for rock conditions, there is a reasonable indication that observed localized earthquake damages involved local site effects. The use of ambient seismic noise measurements has significantly increased over recent decades to help to distinguish natural hazard “diagnoses” of the areas prone to local site effects (e.g., [
14,
15,
16]). We used the ambient-noise Horizontal-to-Vertical Spectral Ratio (HVSR) Nakamura [
17] method to estimate the local site parameters: resonance frequency, sediment thickness, Vs30, and HVSR amplitude, as a first step toward microzonation of the Međimurje region. Estimated site parameters were compared with macroseismic data and observed damage localities in order to better understand the role of local site effects on local hazard mitigation from nearby and distant earthquakes.
2. Geological and Tectonic Features of the Međimurje Region
Međimurje is situated in the northernmost part of Croatia, in the Hrvatsko Zagorje Basin (HZB), a part of the Pannonian Basin System (PBS), which is an integral part of the Alpine orogenic system. The HZB and North Croatian Basin (NCB) represent two basins situated mostly in Croatia [
18,
19,
20,
21], which made the southwestern part of the Central Paratethys during the Neogene. According to Avanić et al. [
22], marine to brackish deposition started in the Early Miocene, and continued to the end of the Middle Miocene, whereas Sant et al. [
23] and Kovač et al. [
24,
25] suggested that the deposition during the Early Miocene was characterized with limited lacustrine and continental sedimentation. During the Middle Miocene, sediments were deposited in the marine environment of the Central Paratethys Sea, in both HZB and NCB. The sedimentation continued from the Late Miocene to the Holocene in lacustrine and then continental facieses [
20].
The HZB is sitting on the Southern Alps thrust sheet, the northernmost tectonic unit derived from the Adria plate, located between the ALCAPA Mega-Unit, i.e., Meliata plate, and the Ophiolitic accretionary prism system, i.e., Western Vardar Ophiolitic Unit (Schmid et al. [
26]). Međimurje is located between two major regional faults zones: Mid-Hungarian Fault System—MHFS and Periadriatic Fault System—PAFS (Atanackov et al. [
27]), wherein the Donat Fault and Ljutomer Fault (
Figure 1A), trending generally NE–SW, belong to the MHFS. Tomljenović and Csontos [
28] described the regional Drava Fault, located just south of Međimurje and trending generally E–W and SE–NW, corresponding to the eastern extension of the Periadriatic Line, i.e., Šoštanj Fault and Sava Fault in Slovenia. According to Atanackov et al. [
27], these faults are a part of the PAFS. This could suggest that the tectonic evolution in Međimurje is mainly controlled by these two major fault systems.
Stratigraphic regional data (derived from [
29,
30,
31,
33,
34]) show that the oldest sediments found on the surface in western Međimurje are of Badenian (M
4) and Sarmatian (M
5), i.e., Middle Miocene (M
4,5) age, with an overall thickness of approx. 200 m (
Figure 1A). Badenian rocks are represented typically with fossiliferous biomicrite and biosparite containing algae (Lithotamnium) and mollusc shells, as well as with calcareous sandstones and conglomerates, while younger Sarmatian deposits are dominantly thin layered to laminated marls, accompanied with clayey marls, clayey limestones, and coarse sands and conglomerates [
33]. Pannonian (M
62), Early Pontian (Pl
1), and Late Pontian (Pl
2), i.e., Late Miocene (M
6,7), sediments (
Figure 1A) are represented with sand, sandy marl, and marly clay, with sand as the dominant lithological variation on the surface. The approximated overall thickness of these deposits is estimated from 250–450 m in the subsurface [
33]. Holocene aeolian sands (sQ
2) cover a large area of the eastern part of the Međimurje Hills in the western part of Međimurje (
Figure 1A,B, [
34]).
Most of the Međimurje region, along the Mura and Drava rivers, is covered with several tens of meters in thickness of Holocene alluvial gravels and sands (aQ
2;
Figure 1A). Gravels are partly covered with re-deposited older deposits of the floodplain and the riverbed facieses [
34].
Međimurje generally consists of three tectonic units: Drava Depression, Međimurje Hills, and Mura Depression (
Figure 1B, [
30,
31,
33,
34]). The Drava Depression is the largest tectonic unit in Međimurje (
Figure 1B). It detached from the Međimurje Hills Unit probably in the Pleistocene, by the Čakovec fault (
Figure 1A), dropping its southern block and allowing the sedimentation of Quaternary deposits. The Čakovec fault is the most striking tectonic element in the area, oriented generally west–east, with the total vertical drop along its southern wing amounting up to 500 m [
33]. Međimurje Hills encompasses the area between the Drava Depression to the south and east, and the Mura Depression to the north (
Figure 1B). Međimurje Hills and its natural extension to the west—Slovene Hills—were tectonically elevated in regard to the Mura and Drava Depression in the Late Pliocene and during the Pleistocene. A dominant SW–NE-oriented structure of the Međimurje Hills Unit is characterized with a system of many local faults parallel and perpendicular to the structure. North of the Međimurje Hills Unit lies the smallest tectonic unit of Međimurje—the Mura Depression. (
Figure 1B, [
33]). The Mura tectonic hornbeam, with Quaternary deposits on the surface, represents the southern block of the Mura fault (
Figure 1A), while its northern block sits in Slovenia.
3. Seismicity of the Međimurje Region
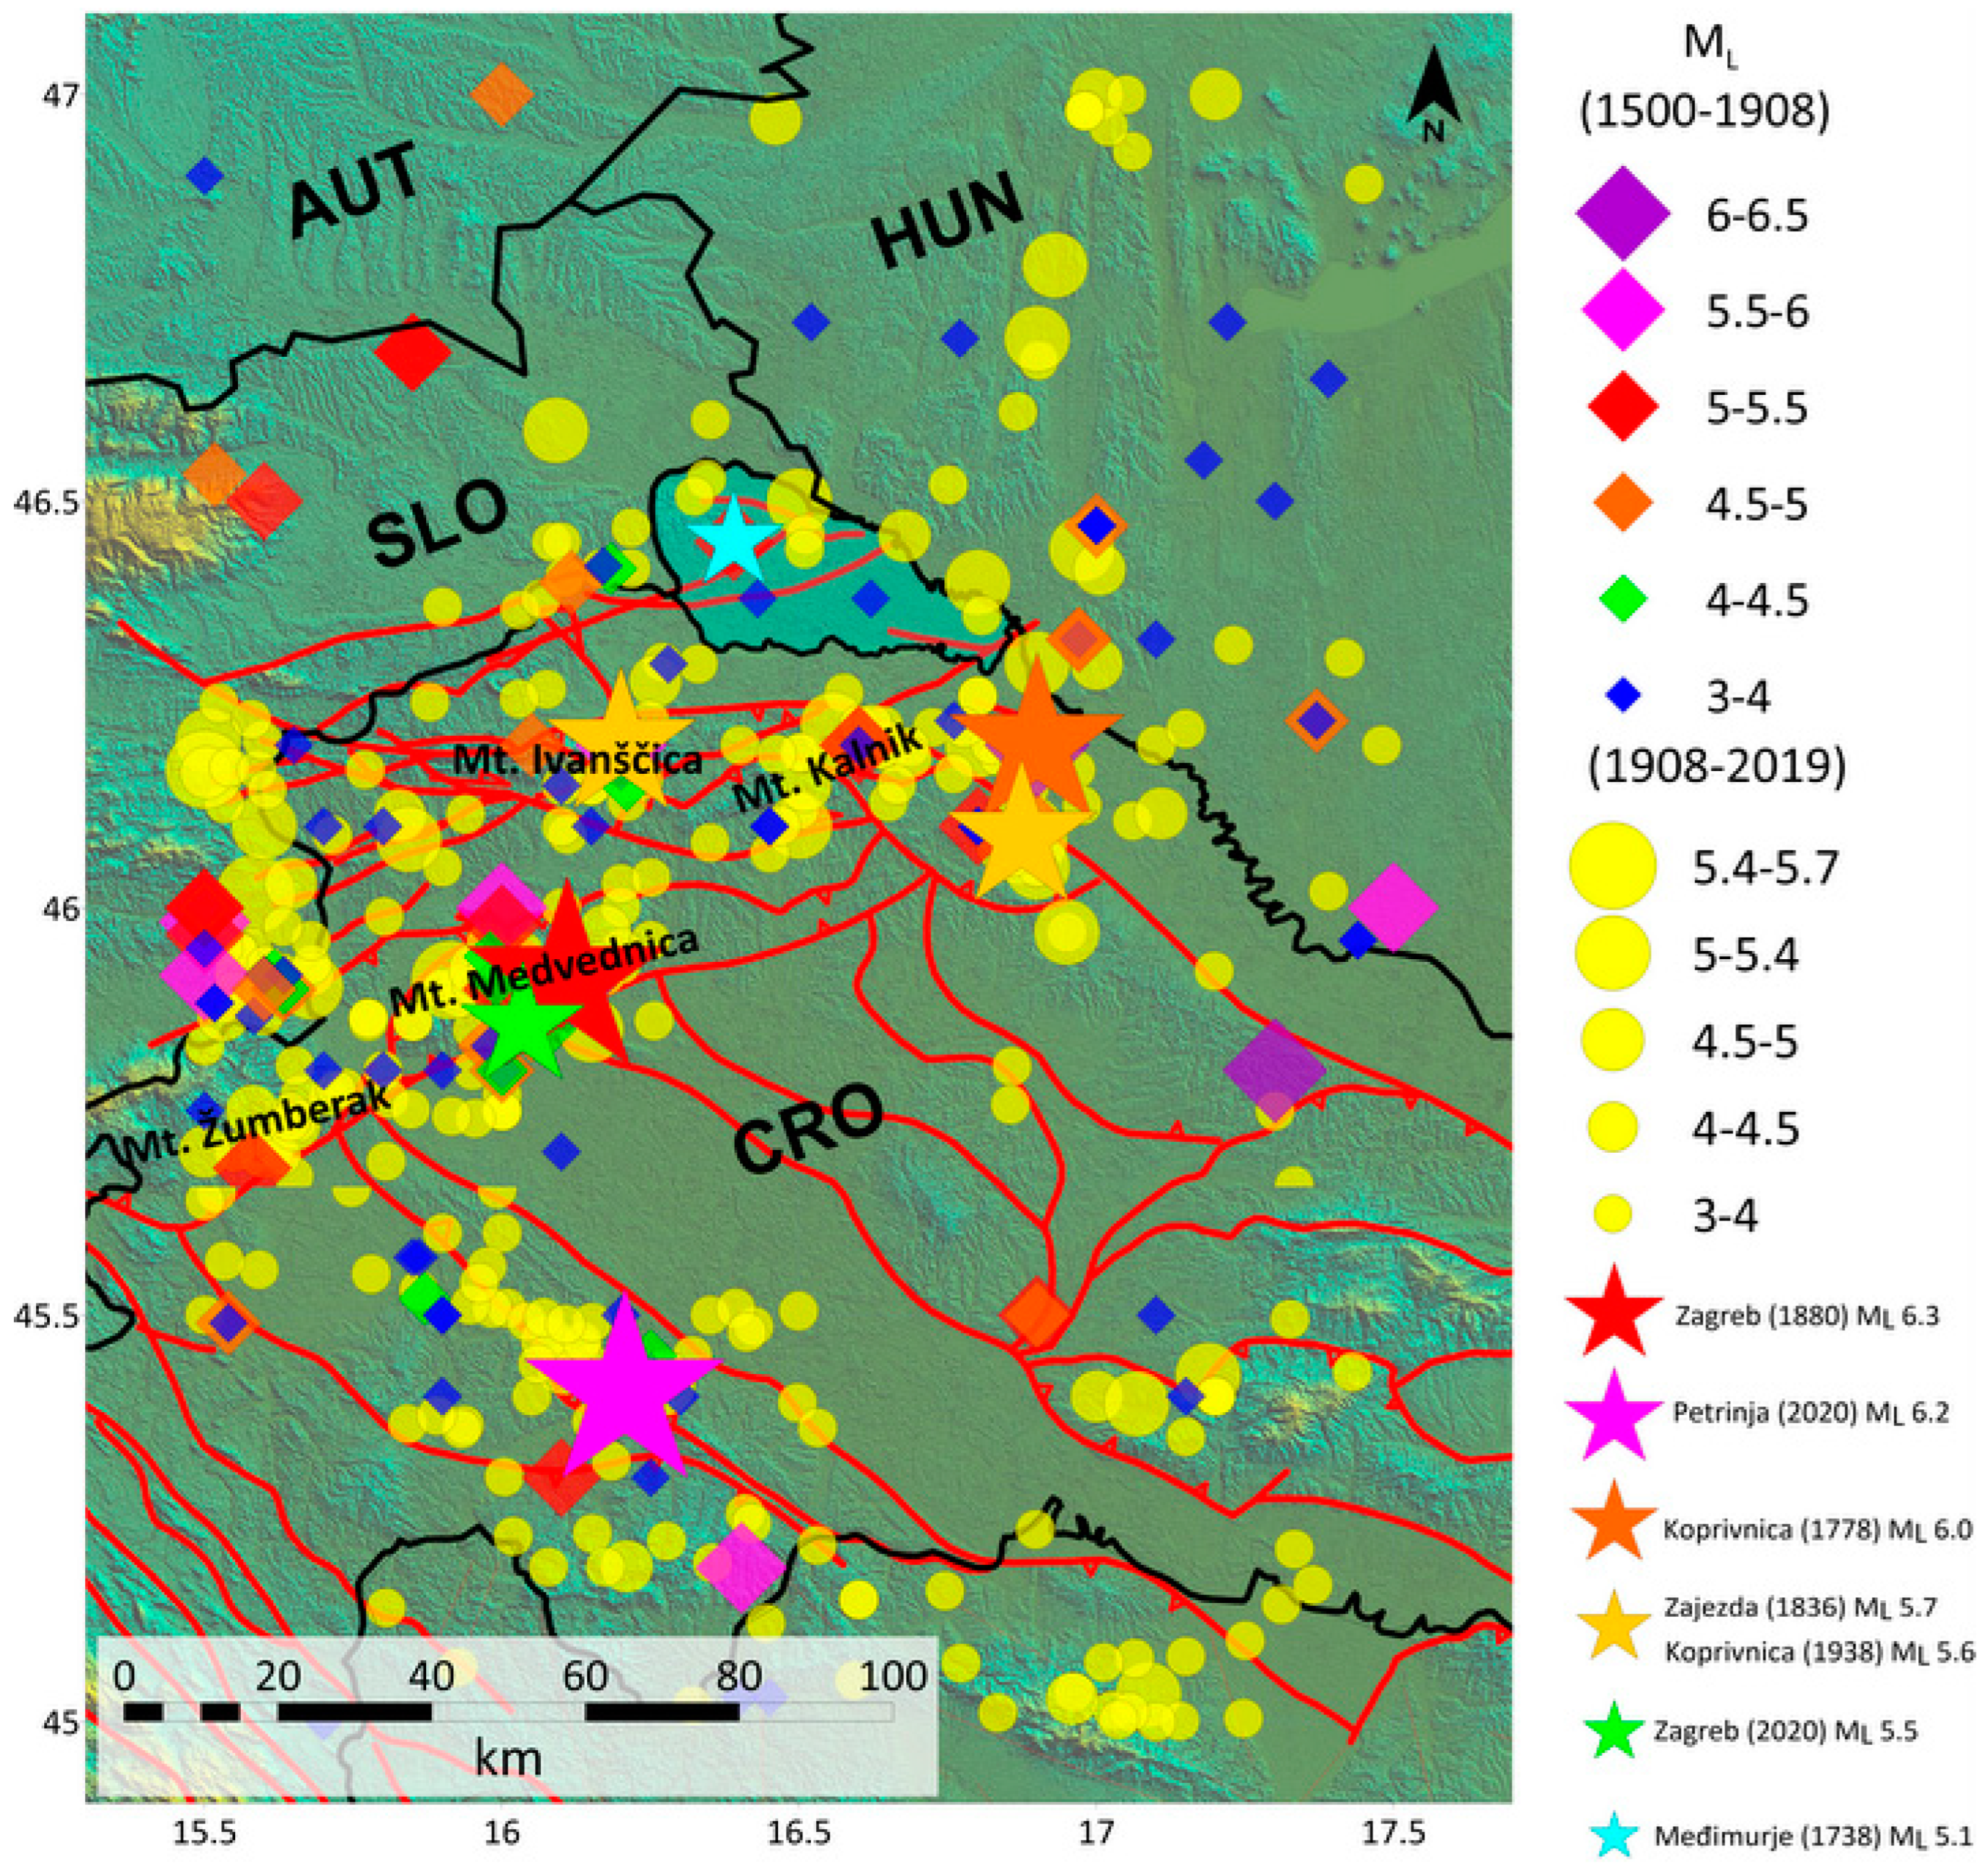
Most of the epicenters in NW Croatia are distributed along the Kalnik, Ivanščica, Medvednica, and Žumberak mountains. The closest seismically active zones to Međimurje are the Mt. Kalnik–Koprivnica and Varaždin–Mt. Ivanščica–Kozjansko epicentral areas. Situated in the immediate vicinity of the Međimurje region to the south, the buried Čakovec Fault (
Figure 1A; GKRH [
29]), the Drava River fault (the eastern extension of the PAFS; [
27,
28]), and the fault systems of Mt. Ivanščica and Mt. Kalnik North (GKRH 2009) are generally E–W-trending. Further to the south is the most seismically active zone in the Northwestern-Croatia–Zagreb epicentral area [
2] encompassing the Medvednica Mountains fault system with its surrounding area. It is believed that it is mainly controlled by the SW–NE-trending North Medvednica Boundary Fault, and SE–NW-trending Kašina Fault (Matoš et al. [
35]), and possibly by the Sava Fault with the similar trending to the Kašina Fault. A detailed description of the seismicity and earthquake focal mechanisms in northwestern Croatia can be found in Herak et al. [
2].
Figure 2 shows the spatial distribution of earthquake locations in the investigated area, based on the data from the Croatian Earthquake Catalogue [
5].
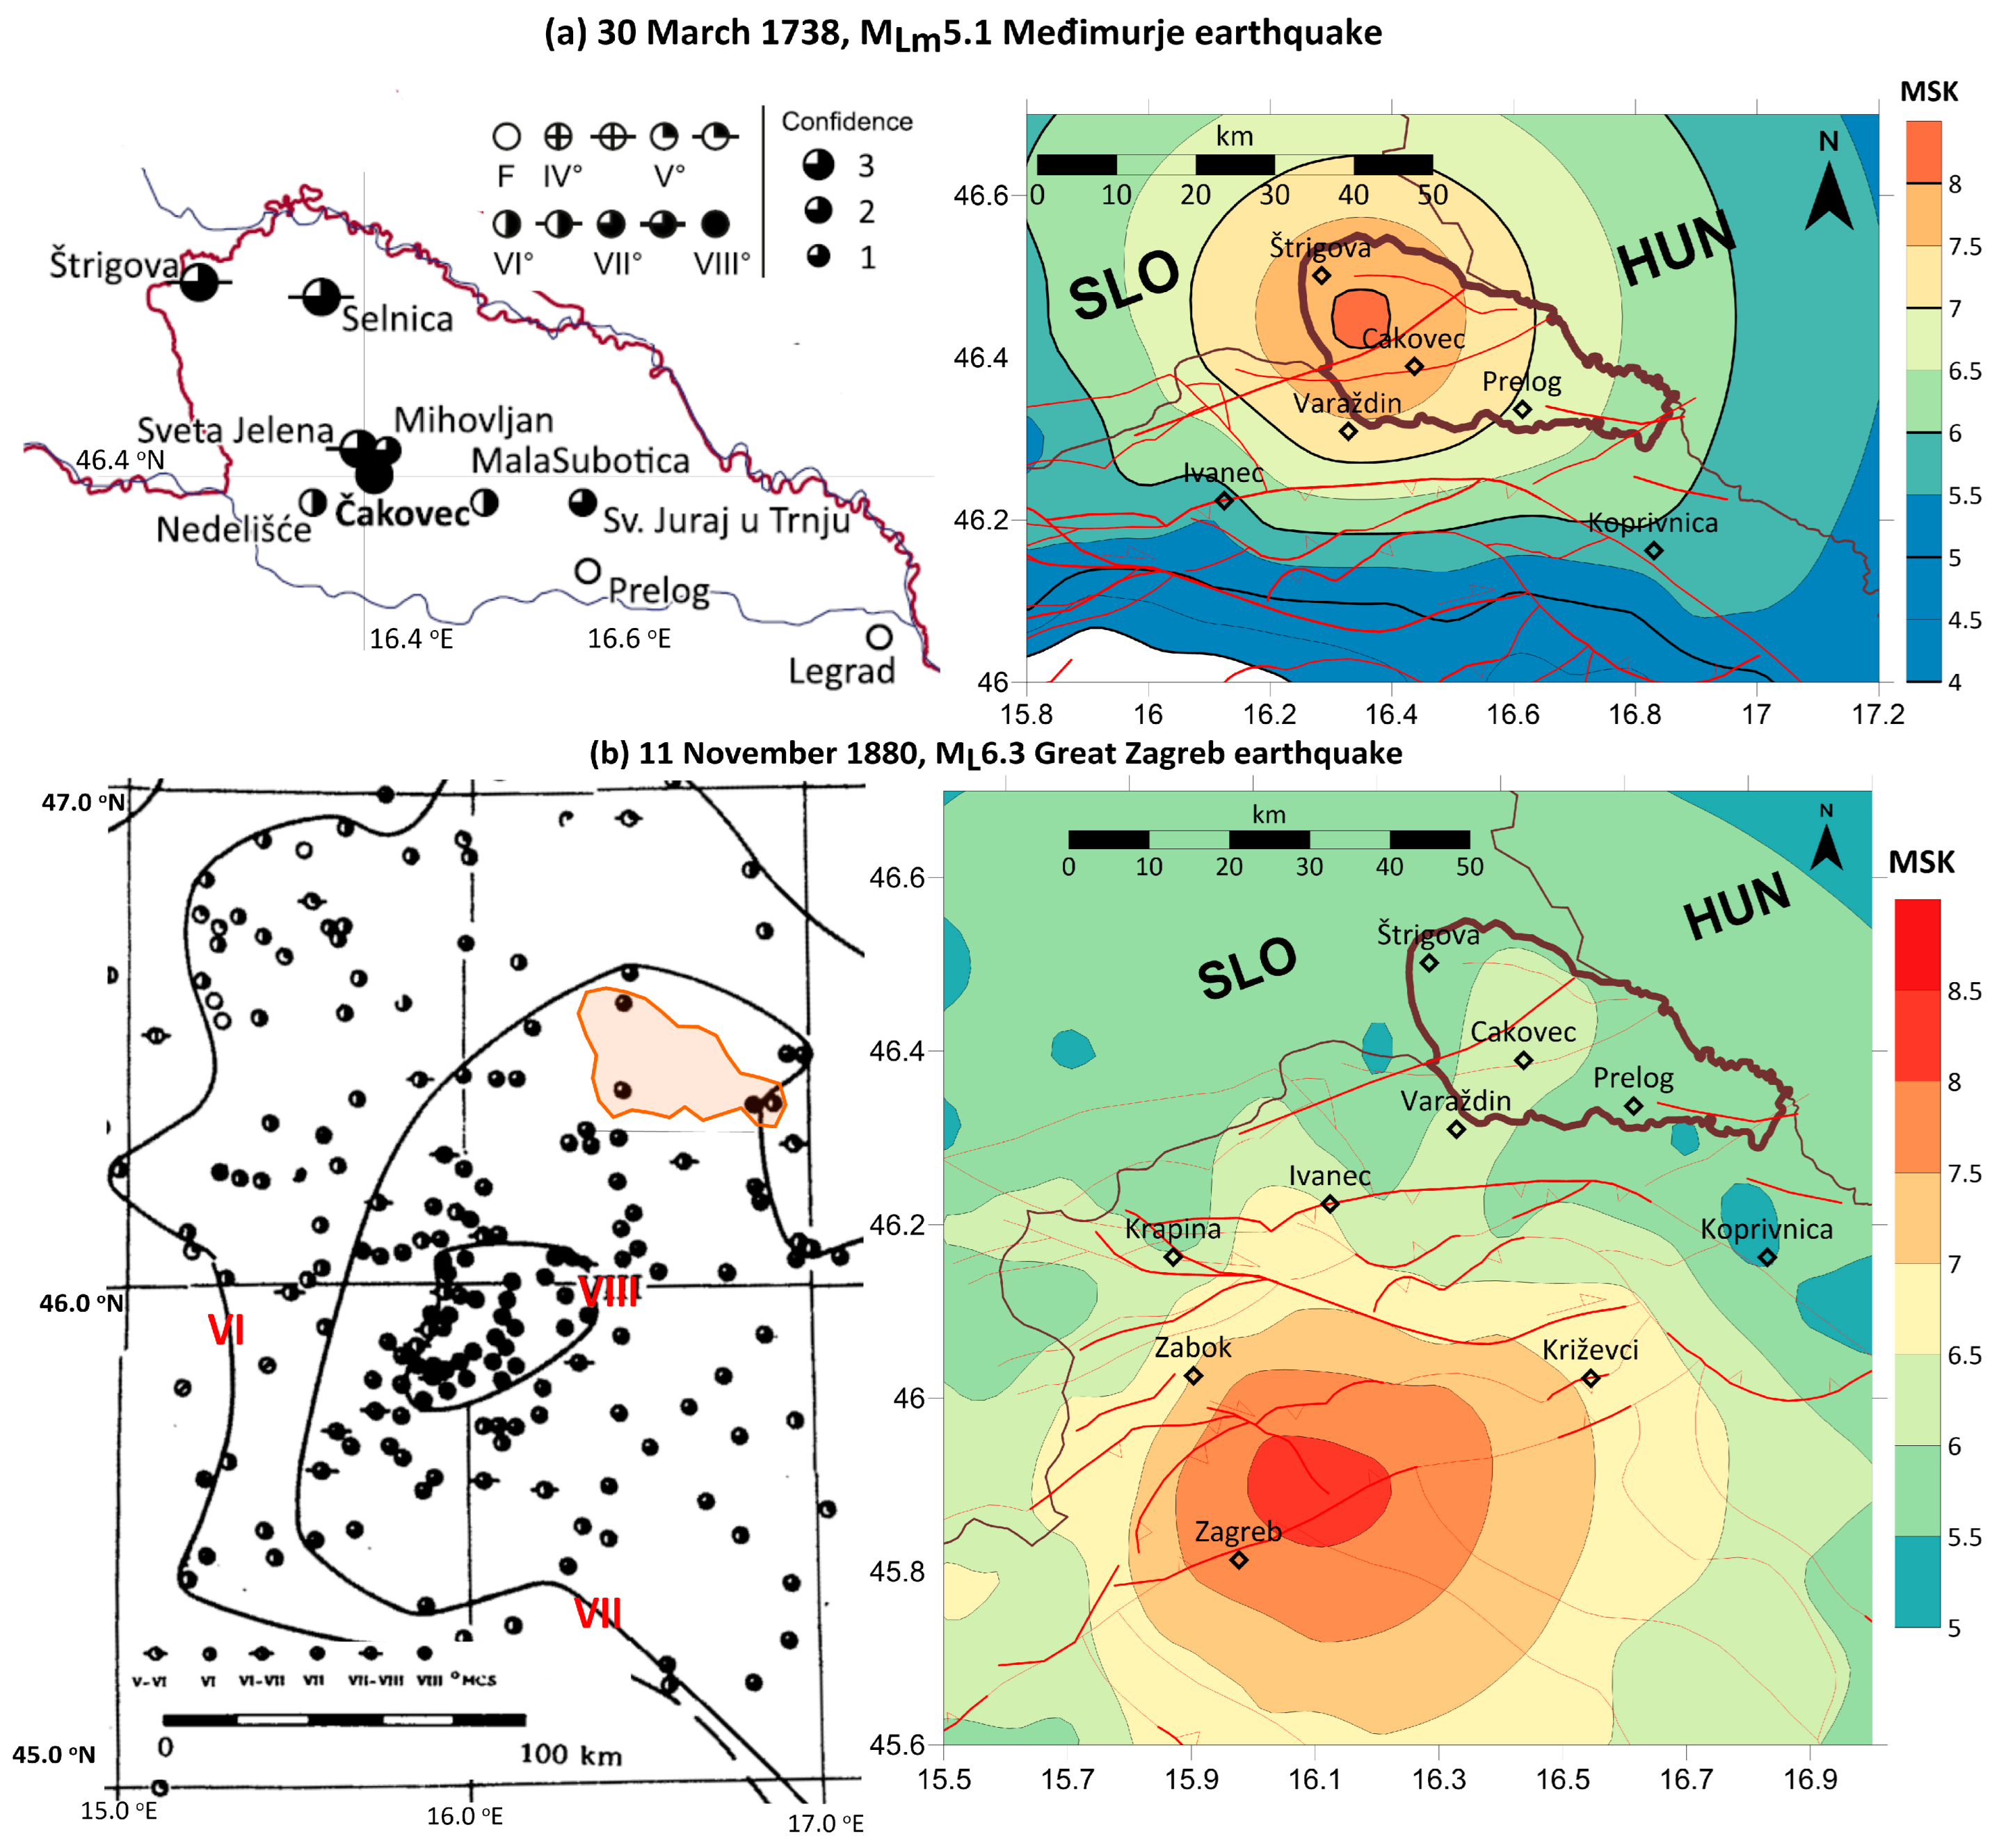
The most important earthquake for the Međimurje region occurred on 30 March 1738 with the epicenter about 8 km north-northwest of the town of Čakovec (Herak et al. [
3]). The estimated macroseismic magnitude of the Međimurje earthquake of M
Lm5.1 was probably triggered by the movement on the hanging wall of the reverse Čakovec fault. This earthquake was studied in detail by Herak et al. [
3] taking into account older seismological literature and primarily church archives to estimate earthquake effects in this region. The epicentral intensity was estimated to be I
0 = 7.9° MSK (Medvedev–Sponheuer–Karnik).
Figure 3a shows the observed macroseismic map for the earthquake of 30 March 1738 adapted from Herak et al. [
3] referring to average soil site conditions. Damages to individual sites were reported (details in Herak et al. [
3] and references therein): the Church of St. Jerome Štrigova built in the 15th century was demolished from the earthquake and was later reconstructed in 1749; the Monastery in Šenkovec (Sv. Jelena-St. Helen) was abandoned after the earthquake and completely destroyed in the 1880 Zagreb earthquake; churches in Selnica, Mihovljan, Nedelišće, Mala Subotica, Sveti Juraj u Trnju, and Prelog were also severely damaged as well as The Old Town Zrinski in Čakovec, built in the 13th century, and the Parish church and Franciscan monastery of St. Nicholas in Čakovec. In 18th-century Međimurje, traditional buildings were constructed from timber, except for prominent noble and church buildings, which were built of brick and stone.
Mt. Kalnik–Koprivnica and Varaždin–Mt. Ivanščica–Kozjansko epicentral areas are very close to the Međimurje region (approx. 20–30 km distant). Most notable historical M
L5.5+ earthquakes are the 8 November 1778 Koprivnica-Legrad M
L6.0 and the 12 November 1836 Zajezda M
L5.7, which were largely felt in the whole northwestern part of Croatia [
2,
4,
37]. The Great Zagreb Earthquake M
L6.3 that struck Zagreb on 9 November 1880 [
4,
38] was felt over a very wide area, as well in the Međimurje region (approx. 80 km from the epicenter) with the macroseismic intensity assessed from historical data of VI–VII °MCS (
Figure 3b). The abandoned monastery in Šenkovec (Sveta Jelena-St. Helen) and the parish court in Sveti Juraj u Trnju were completely destroyed. The 31 July 1838 M
wm4.8 earthquake (macroseismic moment magnitude), with the epicenter around the western Croatian border with Slovenia, was also largely felt, particularly in the part of Međimurje Hills [
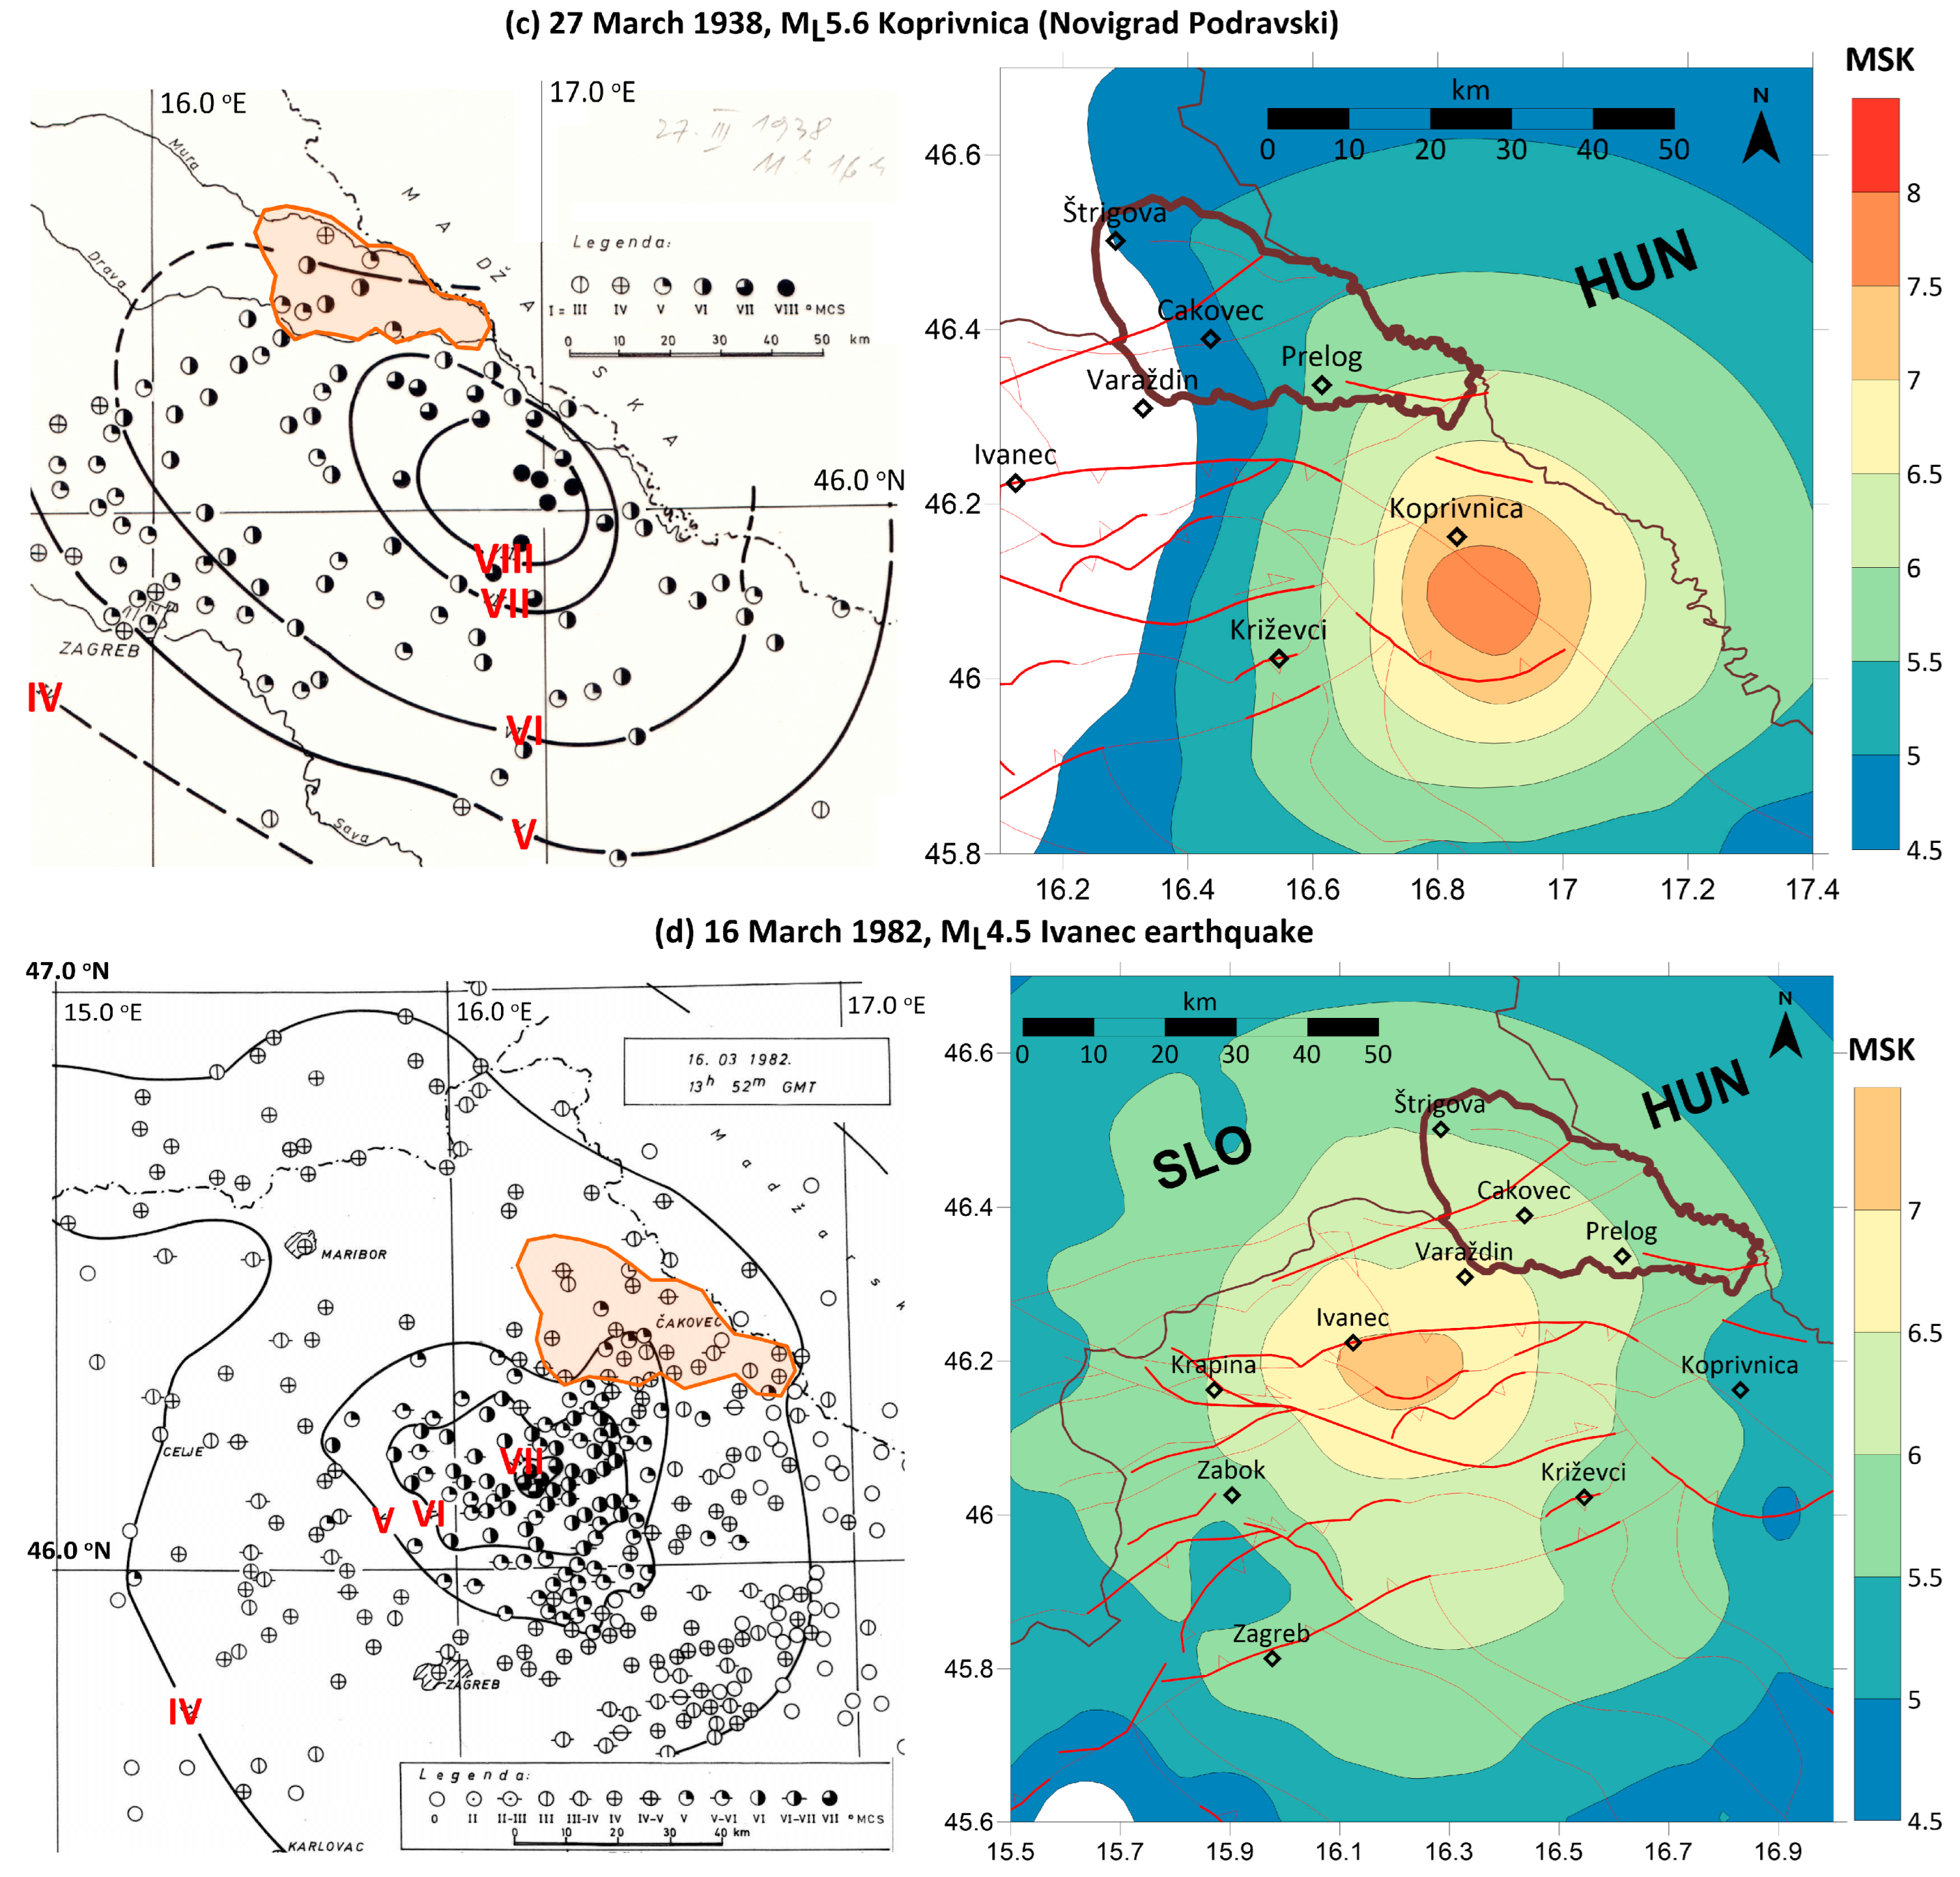
39]. The 27 March 1938 M
L5.6 earthquake with the epicenter near Koprivnica (Novigrad Podravski) destroyed many houses and churches in the epicentral area [
2,
4] with reported strong shaking in central and lowland Međimurje (observed macroseismic intensity of V–VI °MCS,
Figure 3c), especially around Legrad and Kotoriba (approx. 20–30 km from the epicenter). In the last 40 years, there were a few moderate 4–5-magnitude earthquakes (CEC, [
5]) with the epicenters nearby Međimurje that were largely felt across the region: the 16 March 1982 M
L4.5 earthquake with the epicenter below Mt. Ivanščica (macroseismic observations were assessed: VI-VII °MCS in epicentral area and at some localities in Međimurje: V °MCS,
Figure 3d) and the 1 June 1993 M4.7 earthquake with the epicenter in the Mt. Kalnik area. In addition, there had been several earthquakes with magnitudes varying from 4 to 5 close to the national border with Slovenia (western border) and Hungary (northeastern border) (
Figure 2).
To observe the difference between macroseismic observations on certain localities, macroseismic fields for rock conditions were modeled using the SAF (Strong Attenuation at Faults zones) model [
40] (
Figure 3). The SAF model assumes that the active faults attenuate macroseismic intensities; therefore, important input data are a map of the active faults [
36]. The only known faults from Croatia are used; therefore, the model is limited only within Croatian borders. For this analysis, the following earthquakes were taken into consideration: (a) 30 March 1738 M
Lm5.1 Međimurje, (b) 9 November 1880 M
L6.3 Great Zagreb, (c) 27 March 1938 Koprivnica (Novigrad Podravski) M
L5.6, and (d) 16 March 1982 M
L4.5 Ivanec. Modeled macroseismic intensity maps show that fault zones are responsible for a significant part of the wave attenuation and for the anisotropy of attenuation. It must be mentioned that the Sović and Šariri [
40] SAF model has been developed for the Karst region of the Outer Dinarides where local site effects are neglected because most of the buildings are founded on a rock. Comparing the macroseismic observations with SAF modeling (
Figure 3) for the Međimurje region, differences between the two intensity maps for the same earthquake (except in near-field epicentral area) can be observed, pointing to the influence of local site conditions of the Međimurje region (
Figure 1). Bottari et al. [
41] tried to connect the forms of isoseismal and the geological structure of the area in the context of new basement tectonics. They concluded that intensities outside the near-field mainly depend on the provision of lineaments without explaining how they affect the distribution of energy in space. The macroseismic intensity distribution is influenced by major geological and tectonic features and, at some point, by local geological conditions (surface-to-bedrock depth, soil structure in sedimentary basins, and topography) [
12,
42]. Herak et al. [
3] performed measurements of ambient noise at localities of Štrigova, Selnica, Šenkovec, and Čakovec and hinted at the possibility that amplification may have played a role in damages at those localities with the observed highest intensities (
Figure 3a). We extended the microtremor measurement to the whole Međimurje region (later presented in Chapter 5) to correlate it with intensity observations from historical earthquakes as well with recent 2020 earthquakes, and to try to estimate the intensity degree difference due to local site effects compared to rock conditions.
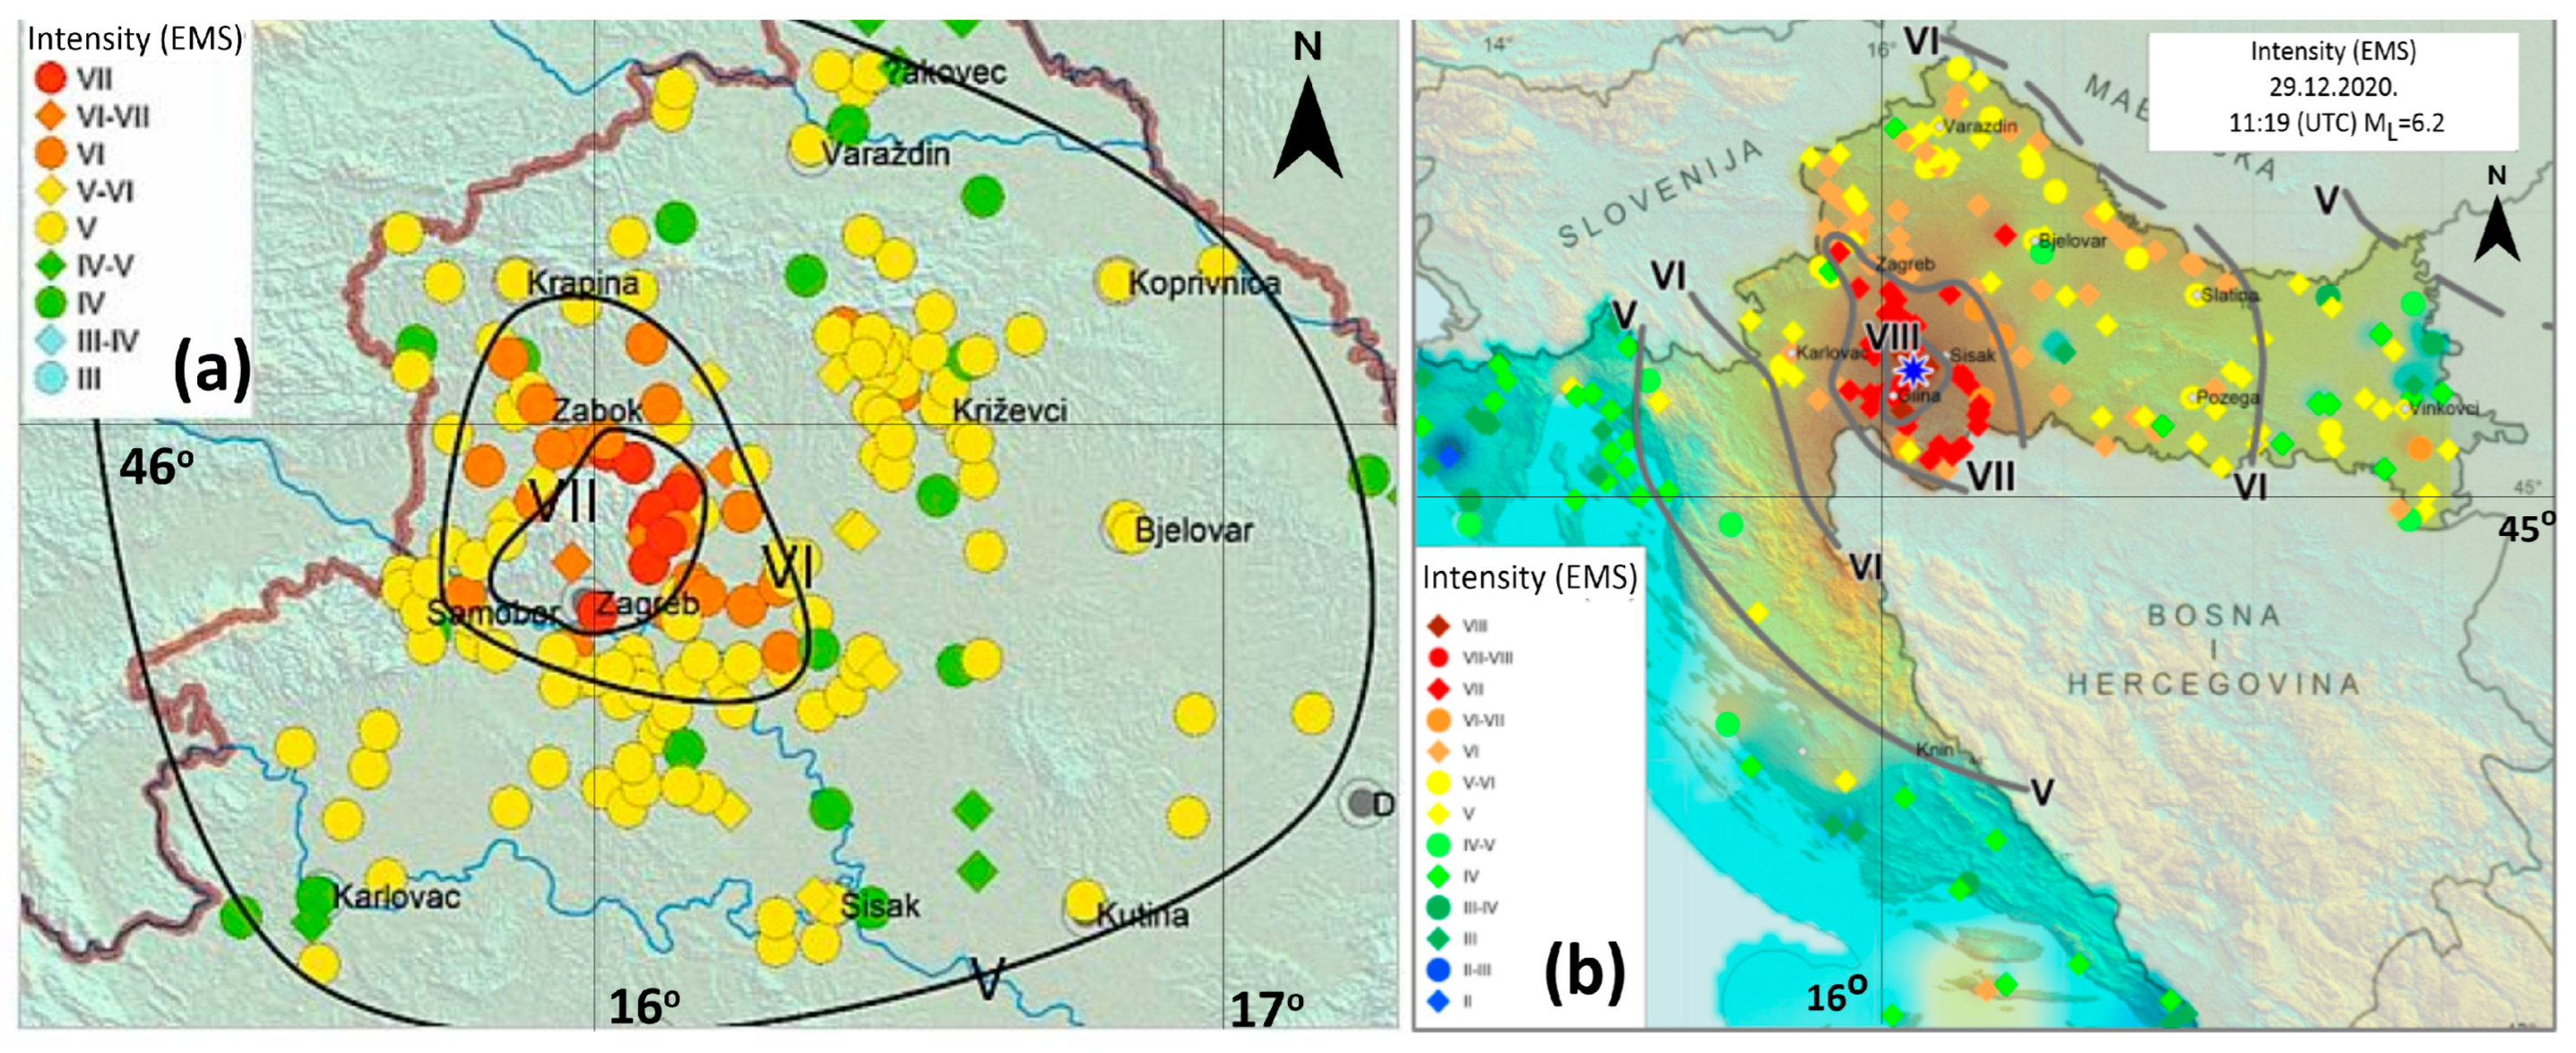
4. Observed Damage from M5.5 Zagreb and M6.2 Petrinja 2020 Earthquakes
On 22 March 2020, Croatian capital Zagreb was hit by the strongest earthquake since 1880 [
6] with a magnitude of 5.5. The intensity of VII–VIII °EMS-98 was observed close to the earthquake epicentral area, while the intensity felt in Međimurje was IV–V °EMS (
Figure 4a). On 29 December 2020, the wider area of Petrinja was hit by a destructive earthquake with a magnitude of 6.2 with an observed intensity of VIII-IX °EMS in the epicentral area [
7,
8]. The earthquake was felt across the entire territory of Croatia, in particular, in the northwestern part of Croatia. The observed intensity in the Međimurje region was V–VI °EMS (
Figure 4b). Further from the epicenter (distances > 30 km), the observed higher intensity (
Figure 3b) and recorded damages to older buildings were potentially affected by the local site effects, the area along the Sava River, Hrvatsko Zagorje, and the area along the Drava River, including the Međimurje region [
7]. Both Zagreb and Petrinja 2020 earthquakes had consequences in the northwestern part of Croatia. Numerous churches, and cultural and historical buildings were damaged in this part of Croatia with the main damage on roofs, chimneys, and unreinforced walls. For example, Trakošćan Castle was damaged by both earthquakes [
44].
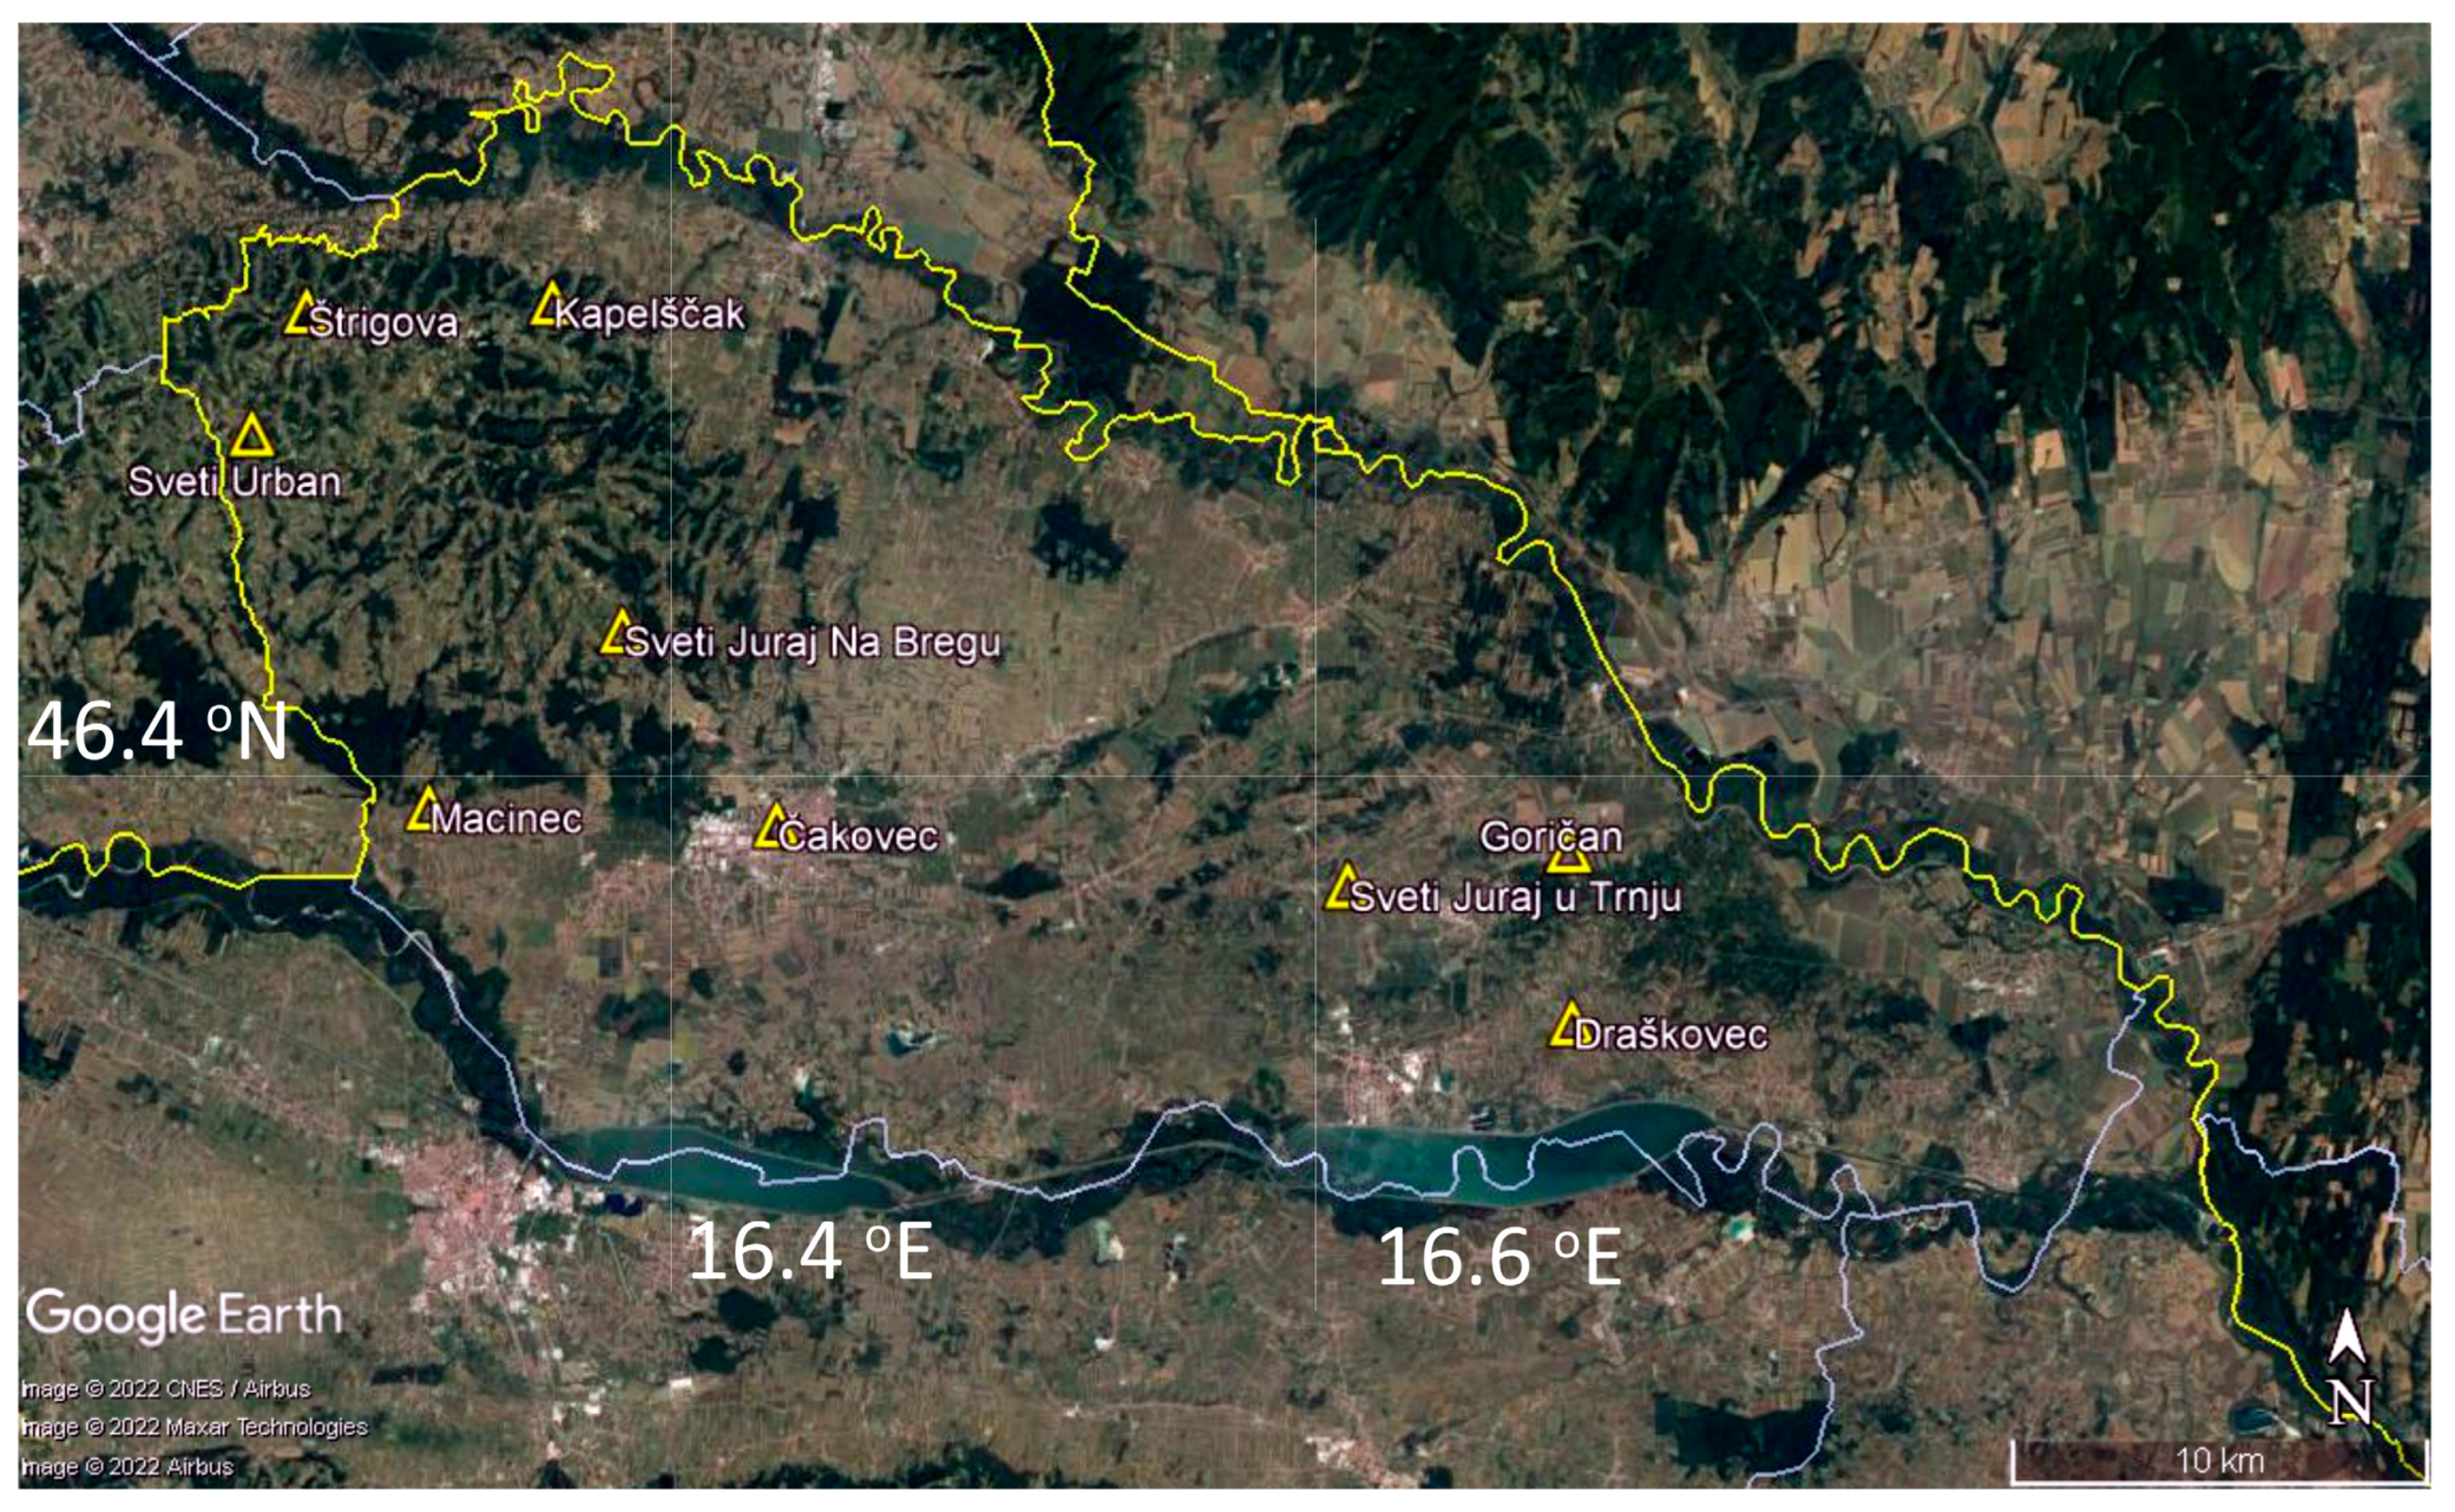
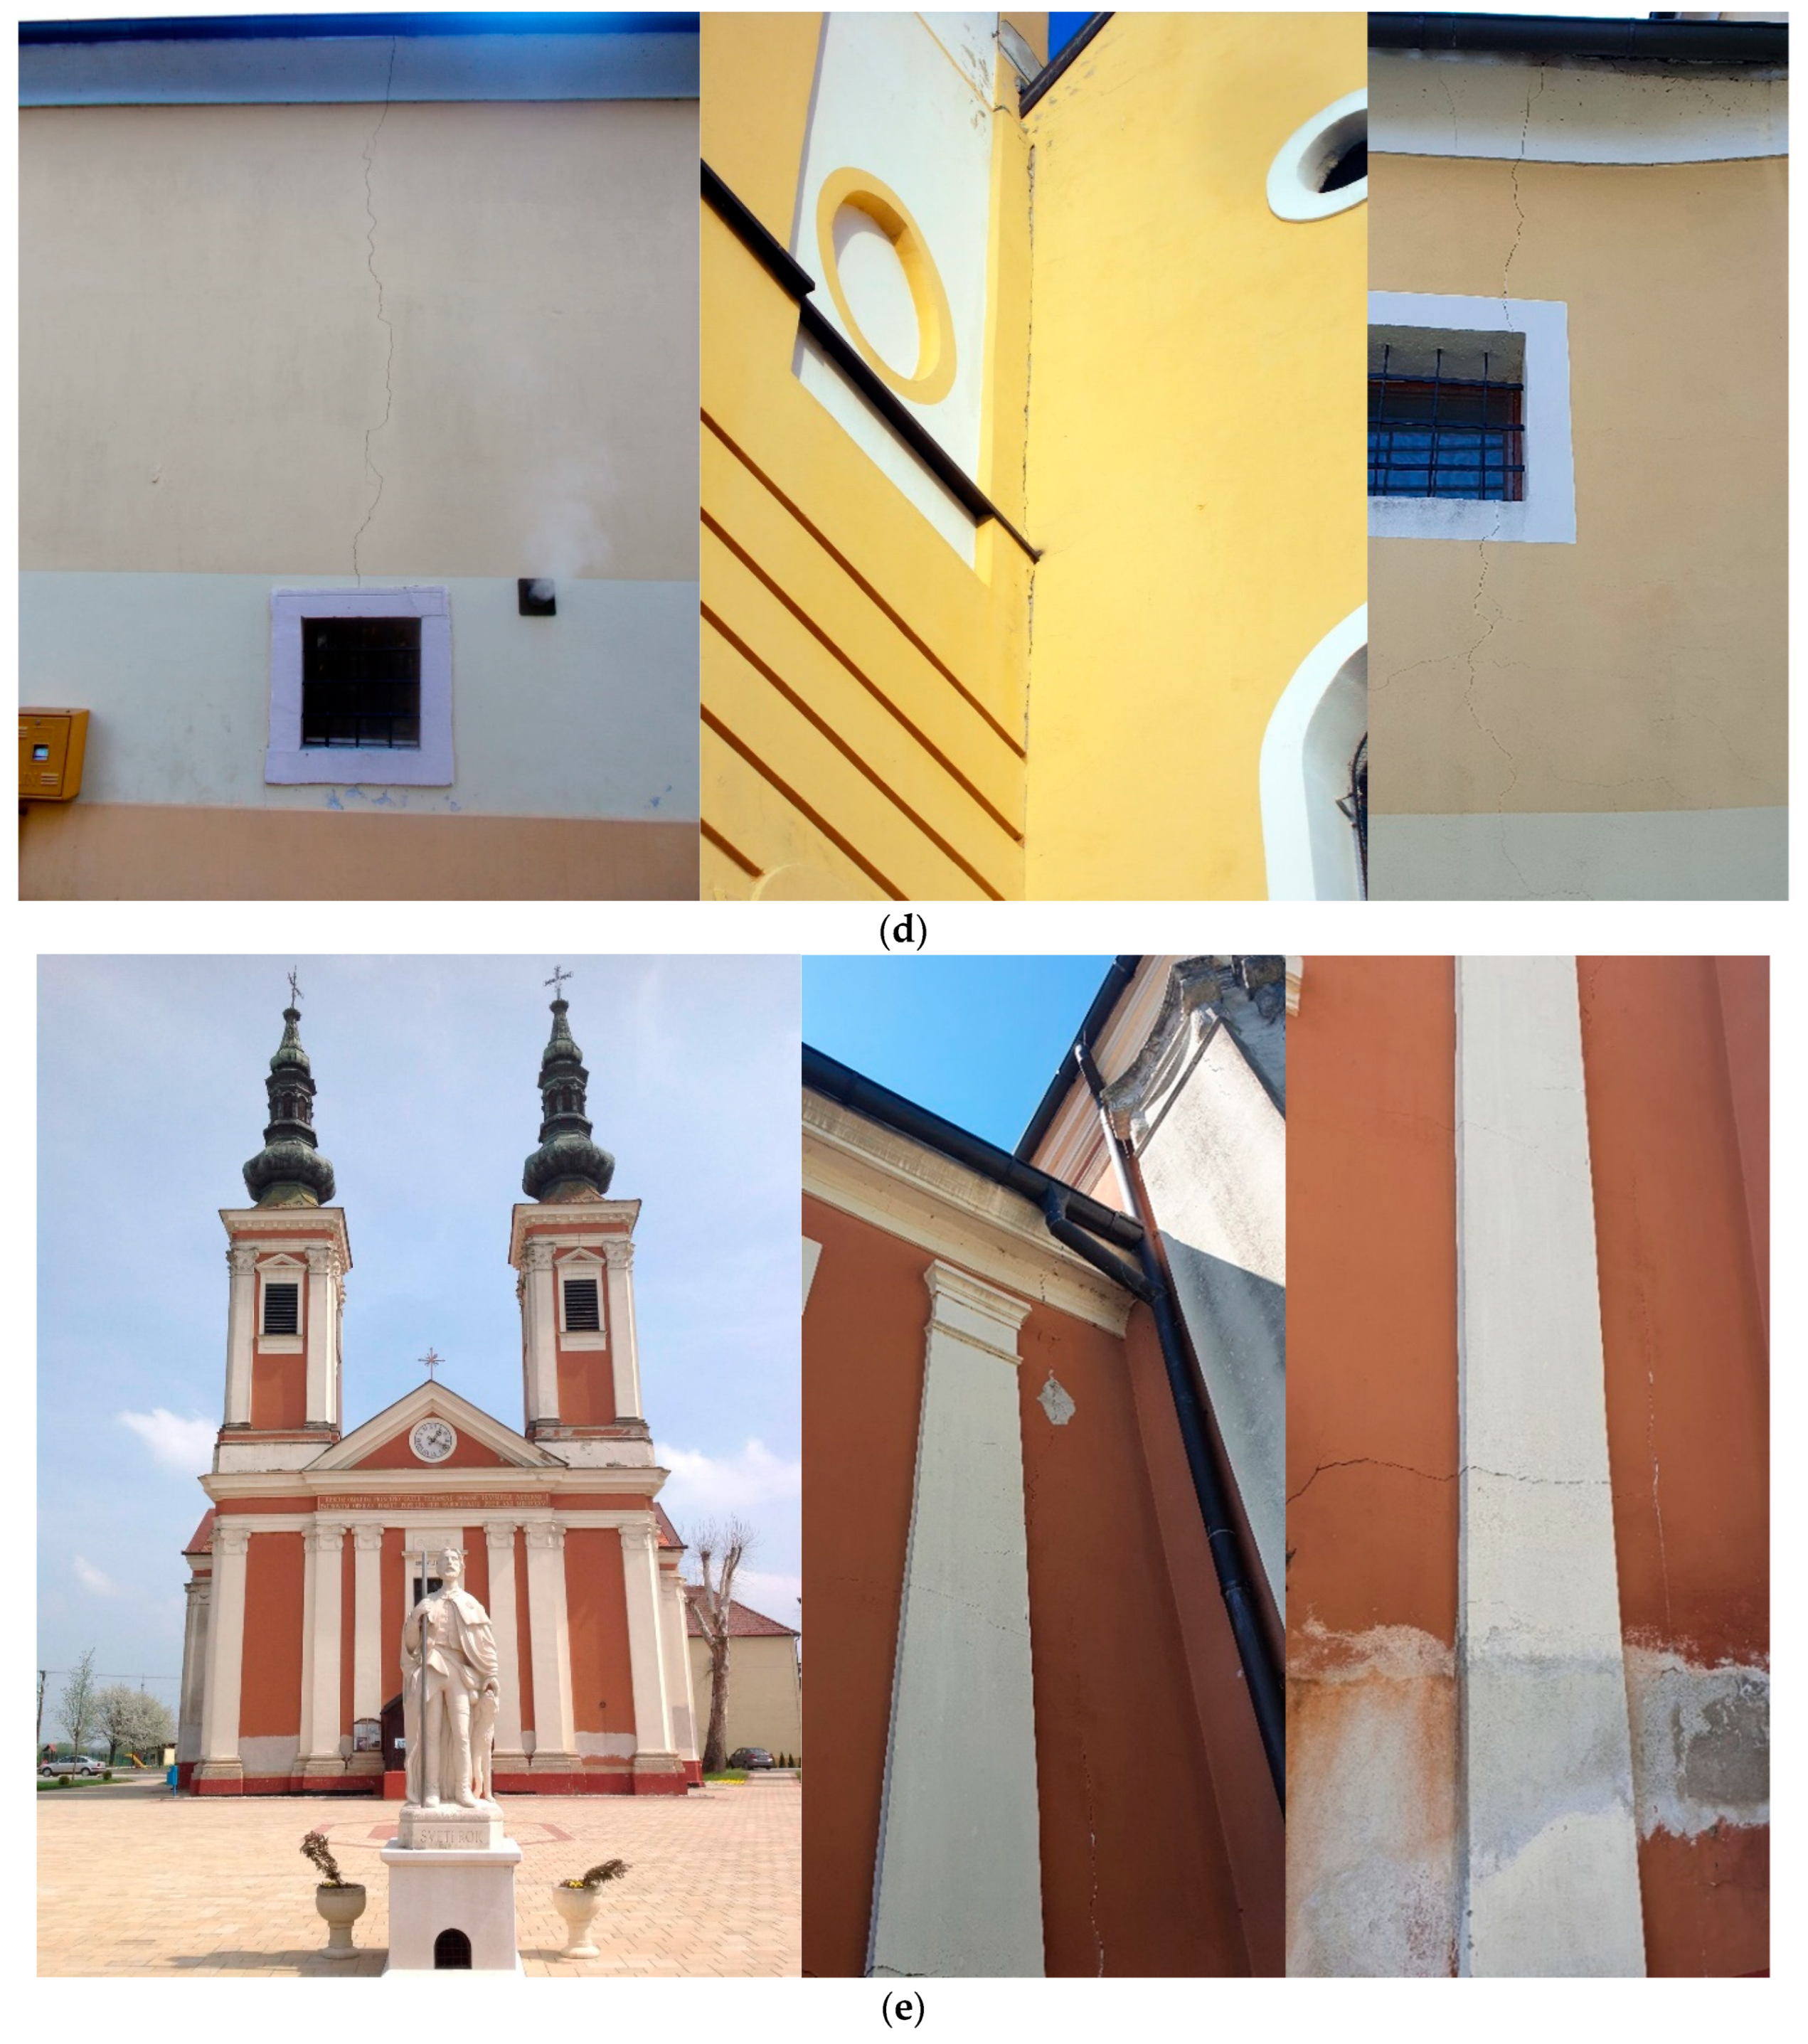
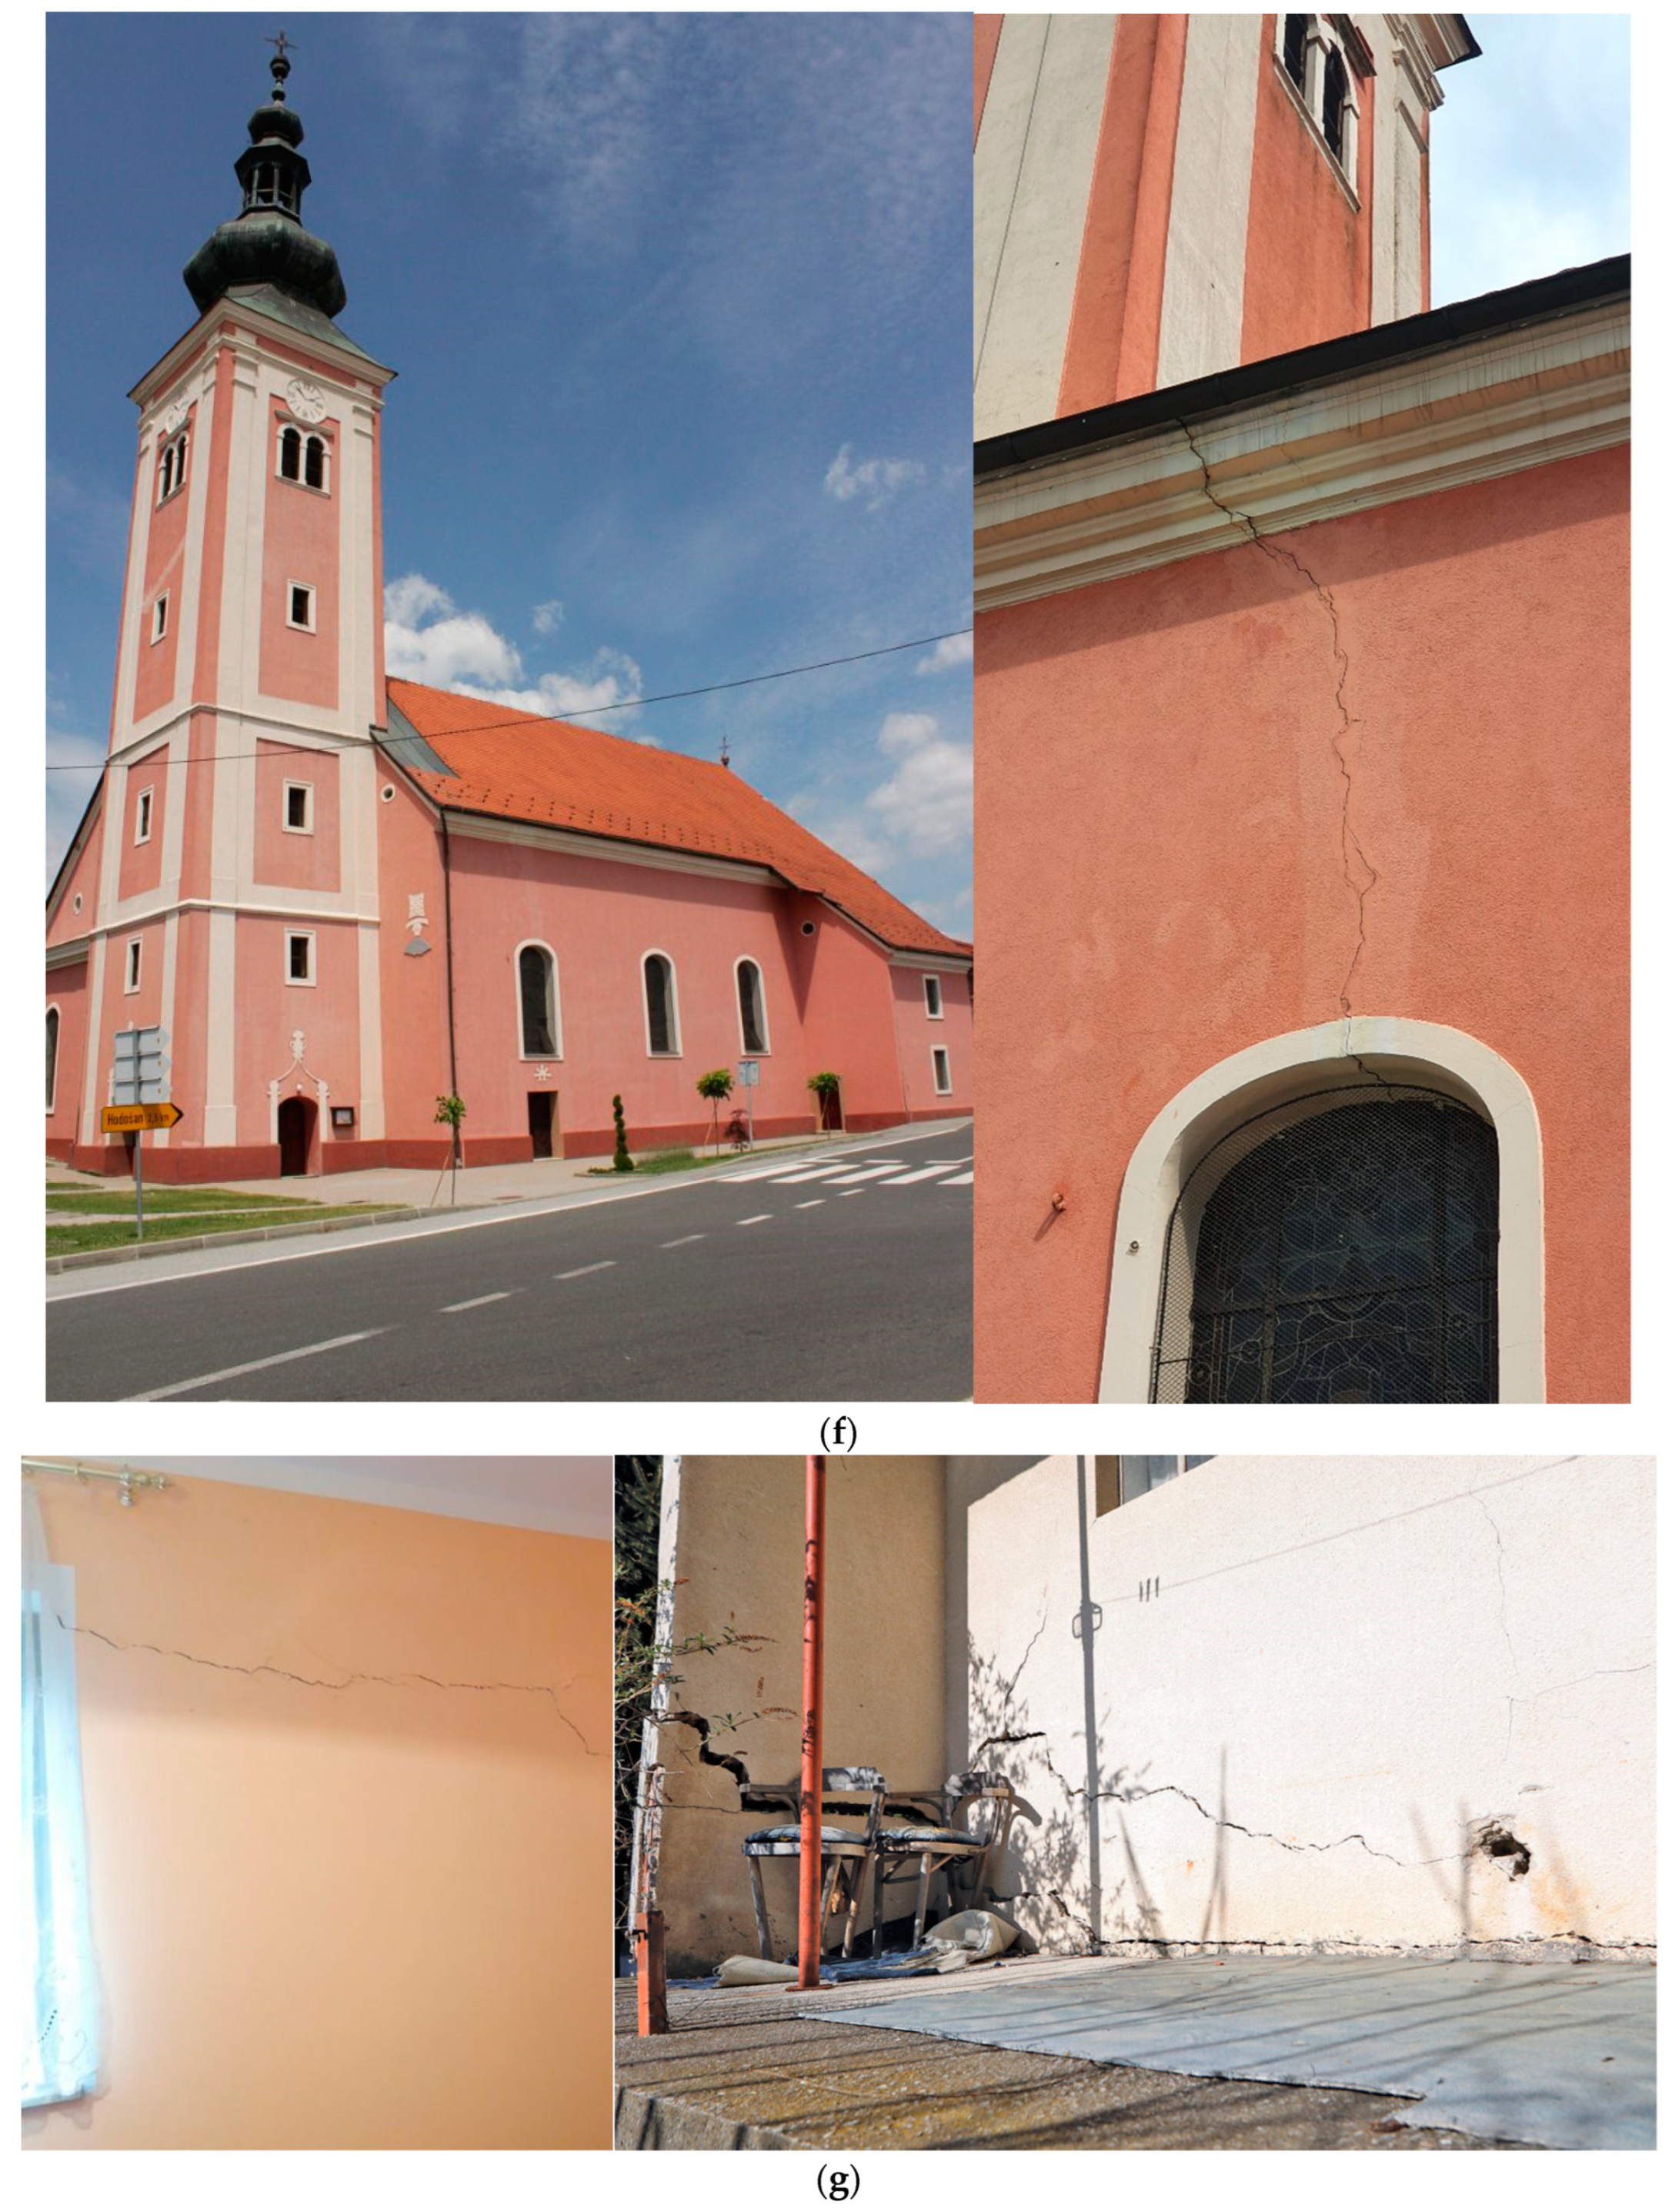
Figure 5 shows locations of observed damages (mostly visible cracks of a few mm) from Zagreb and Petrinja 2020 earthquakes in the Međimurje region (either reported in newspaper or observed personally by author): Kapleščak, Čakovec, Goričan, Draškovec, Sveti Juraj u Trnju, Macinec, Sveti Juraj na Bregu, Sveti Urban, and Štrigova, in order to be comparable with past damage (
Figure 3) and to gain insights into recent earthquake damages with the past ones.
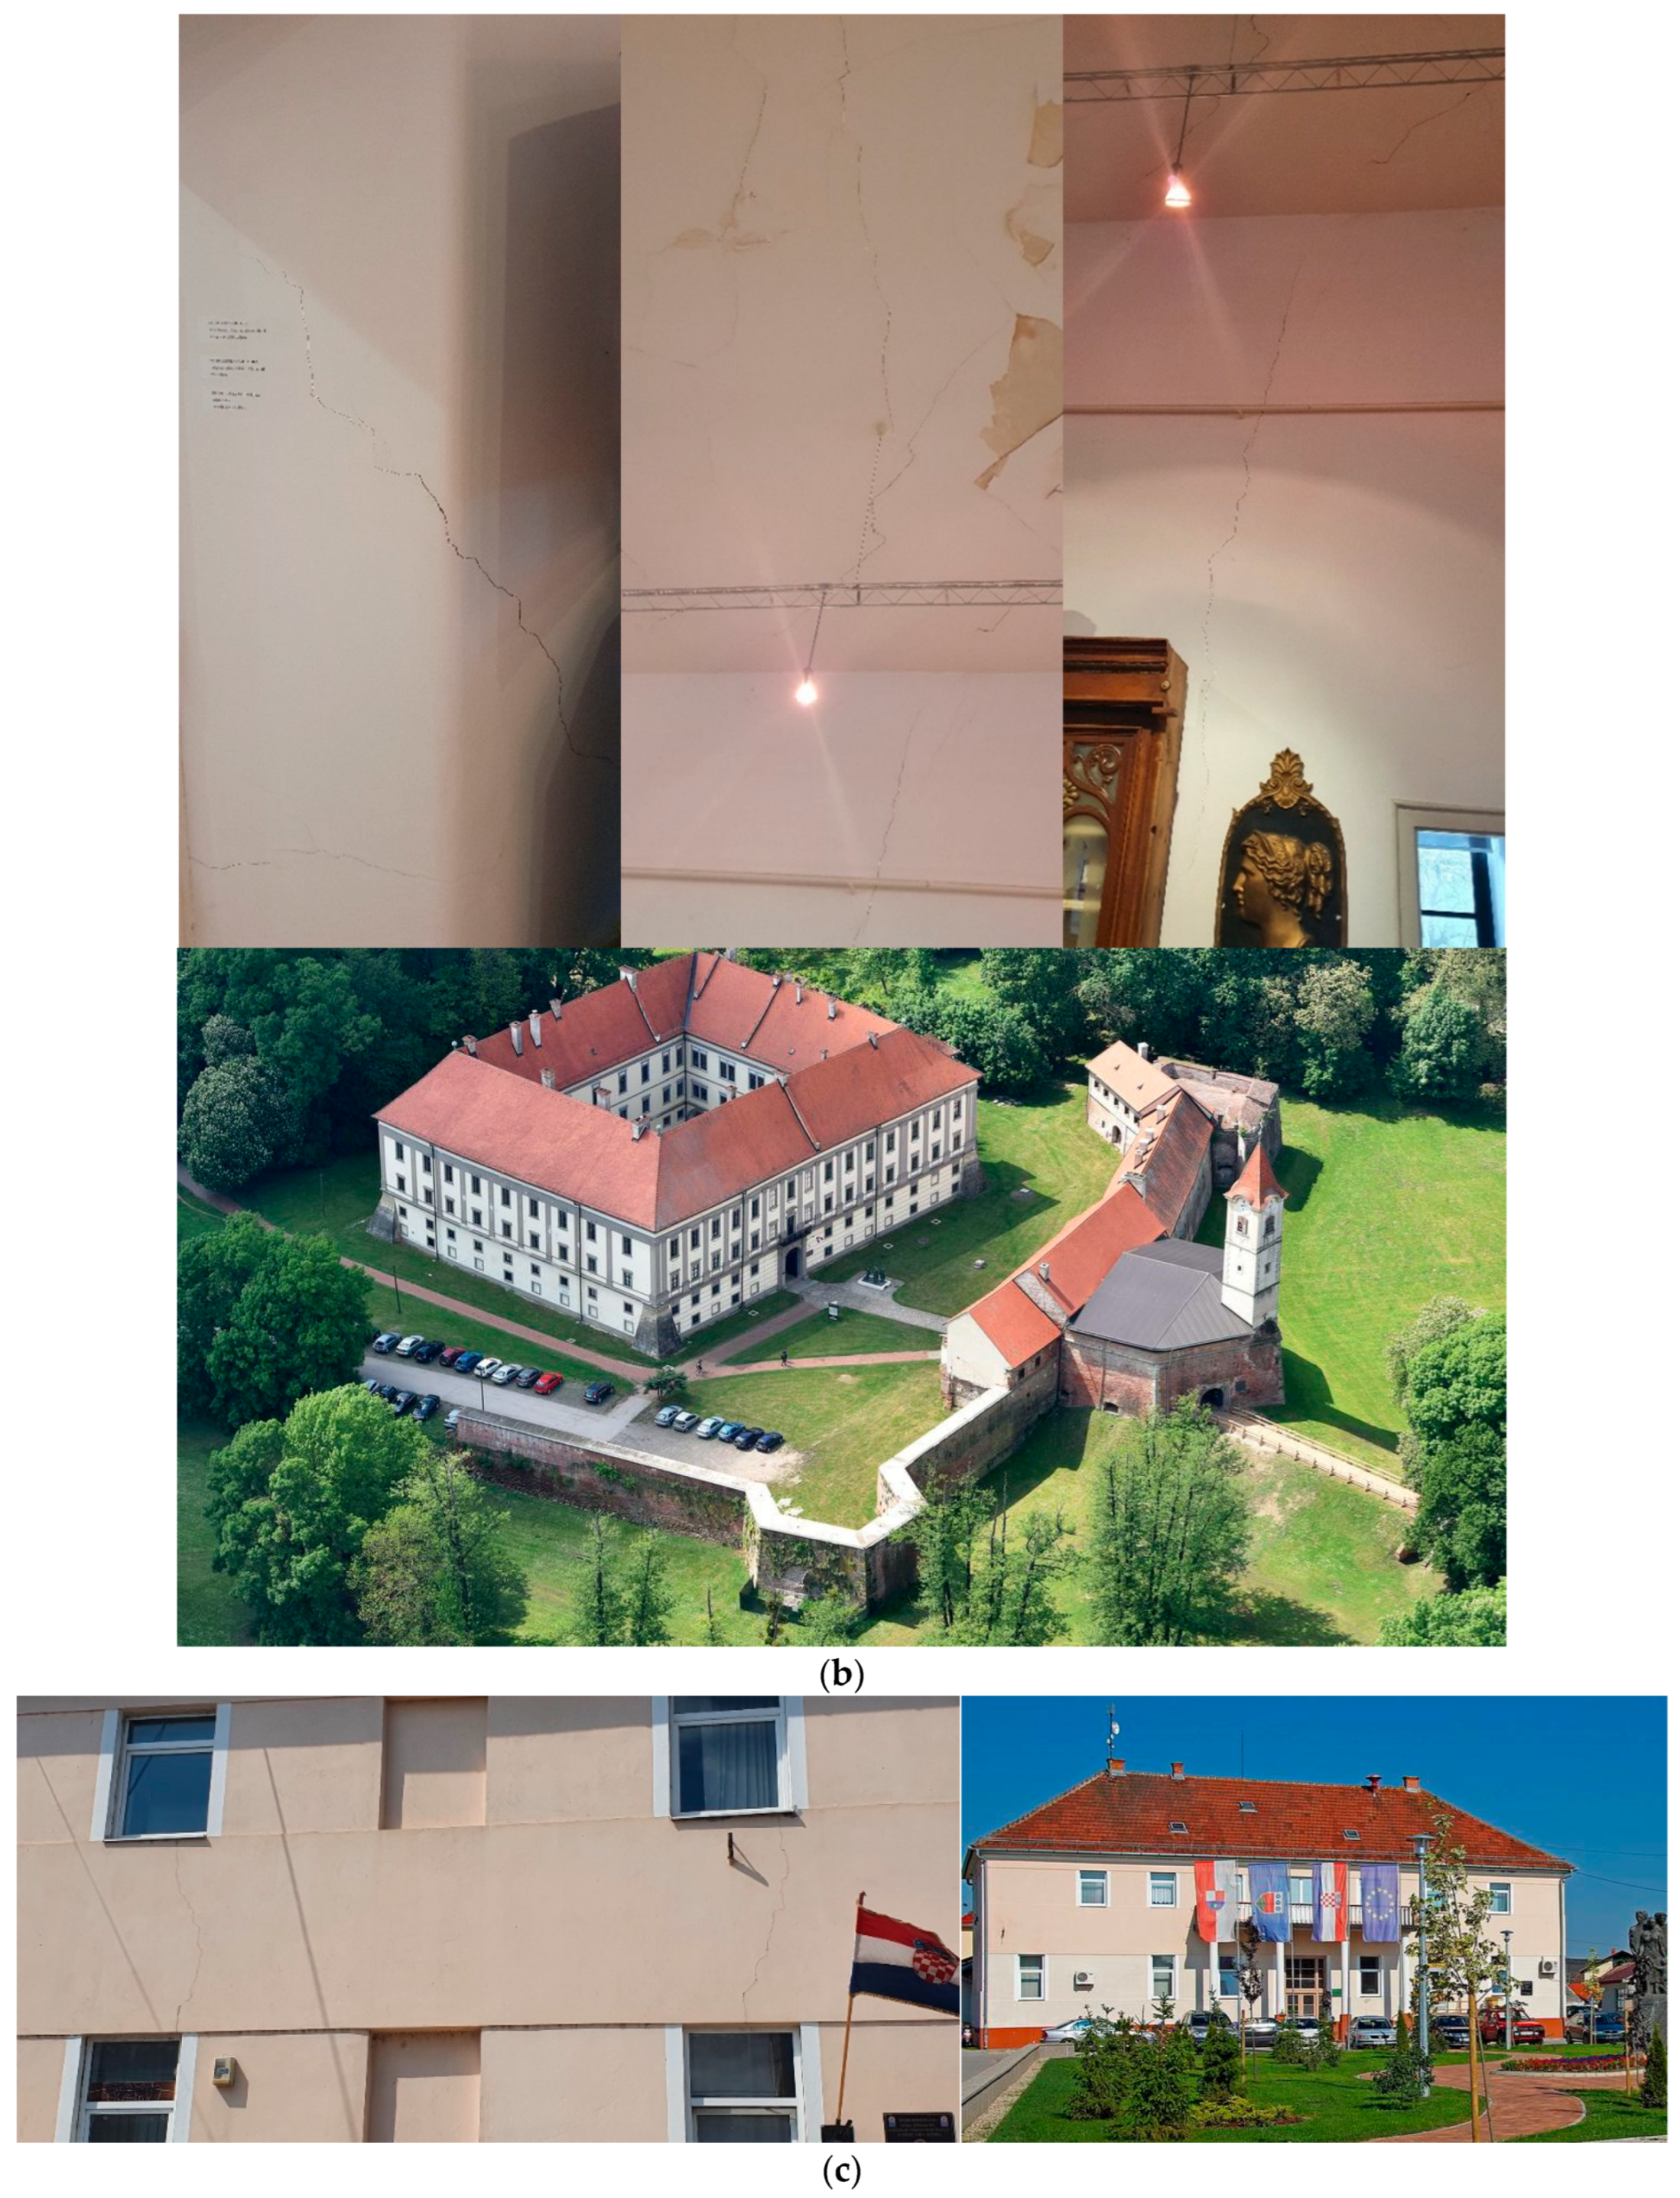
The Zagreb earthquake damaged the interior of the chapel of St. Margaret built of brick in 1775 in Kapelščak in Međimurje Hills (
Figure 6a, local newspaper report). The Petrinja earthquake damaged the museum in Čakovec that is part of the Old Town Zrinski. Ridge roof tiles of the SE and SW wings of the central palace were partially covered with ridge tiles, which caused occasional holes in the top of the roof. The decorative roof mace on the SE roof (metal, height about 130 cm) is tilted to the side (personal communication Čakovec Museum of Međimurje). In addition, visible cracks were observed in the interior of the museum (
Figure 6b, author’s observation). The town hall in Goričan (built in 1945) and churches in Goričan (built in in 1770,
Figure 6c,d) and Draškovec (built in 1822, famous for its two bell rowers,
Figure 6e) were slightly damaged from the Petrinja earthquake with visible cracks on the outer walls (author observation). Most interestingly, the parish church in Sveti Juraj u Trnju again suffered damage from both Zagreb and Petrinja earthquakes (
Figure 6f). The catastrophic earthquake that hit Međimurje on 30 April 1738 severely damaged the parish church in Sveti Juraj in Trnju. After that, a new church started to be built and was completed in 1747, but soon proved to be too small for a large number of believers. The wooden ceiling was removed and the church received a brick vault. The roof is, therefore, raised by 4 m. The construction of the belfry was completed in 1775. The strong earthquake that hit Međimurje on 9 November 1880 collapsed the old rectory and the church was also badly damaged. Renovation was completed in 1886.
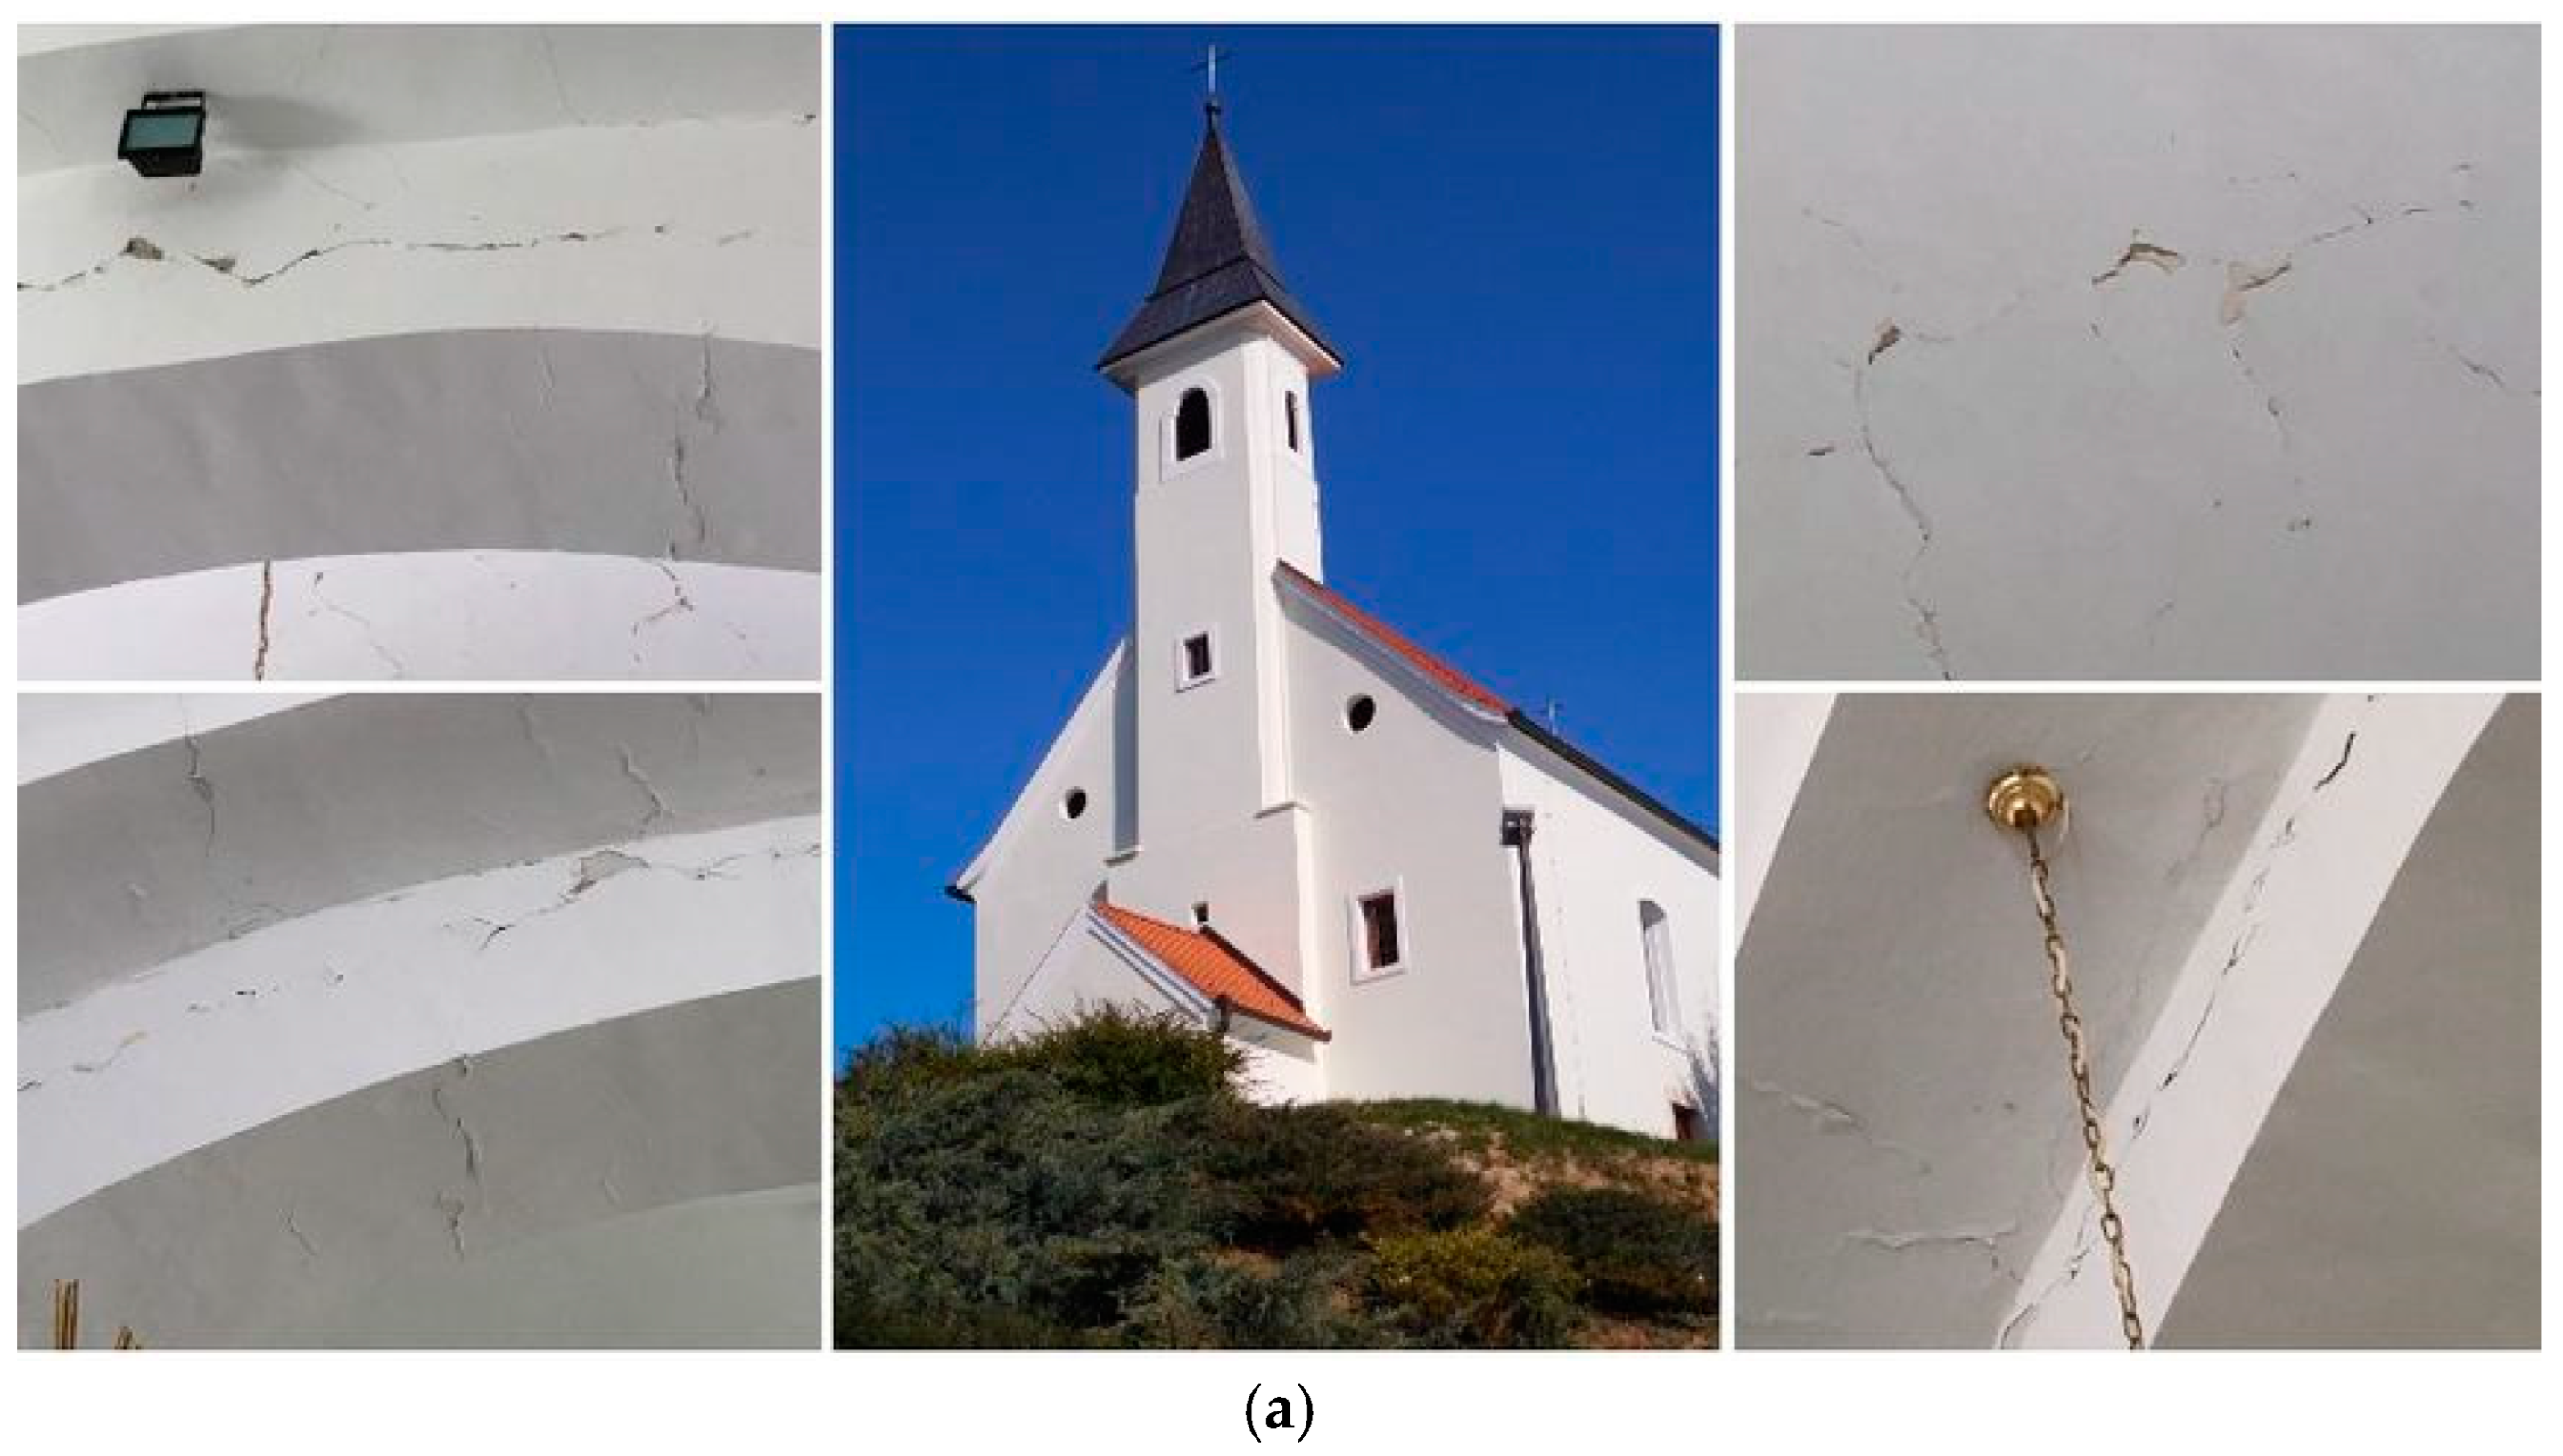
In the Sveti Urban area, a family house (
Figure 6g) showed deformations and cracks that were caused by an activated landslide after the Petrinja earthquake (personal communication, owner of the house). Significant earthquake damage from the Petrinja earthquake occurred in the Parish church of St. Mary Magdalene (built in the 18th century) in Štrigova where there were multiple cracks visible on the walls and vaults of the nave. Parish churches in Macinec (built in late-19th century) and Sv. Juraj na Bregu are (built in the middle of the 19th century) marked by characteristic contact movements of the bell tower, whose direct connections with arches and vaults resulted in cracks. Cracks were caused by the bell movements and local site effects. Bells have been reduced in all significantly damaged churches (personal communication Ordinariate of the Diocese of Varaždin). Numerous houses, mostly older ones (built before 1964), reported small material damage, in the form of damage to the roof and chimney (personal communication Civil Protection Headquarter of Međimurje County). Based on the EMS intensity scale, the observed damage effects, visible damage, and cracks to older masonry structures shown in
Figure 6 point to an intensity of V–VI, corresponding with observations in
Figure 4.
5. Microtremor Measurements and HVSR Analysis
To better understand local site effects in the Međimurje region and their consequences on the macroseismic observations of 1738 M
Lm5.1 Međimurje, 1880 M
L6.3 Great Zagreb, 1938 M
L5.6 Koprivnica, 1982 M
L4.5 Ivanec, 2020 M
L5.5 Zagreb, and 2020 M
L6.2 Petrinja earthquakes, the single-station microtremor HVSR method (Nakamura, [
17]) for the subsurface characterization and analysis of the local site effects was used. In particular, this method is quick and cheap [
45,
46], using a small portable seismograph to be implemented in a wide area such as the Međimurje region to investigate site effects in the alluvial basin of lowland Međimure, as well in the topographic area of Međimurje Hills that is known for landslide problems. Therefore, on a large area (729 km
2), using quick ambient noise measurements, we gained insights into the local site effects, in particular, to soft sediment amplification as well to directional amplification that can cause earthquake-induced landslides [
47,
48,
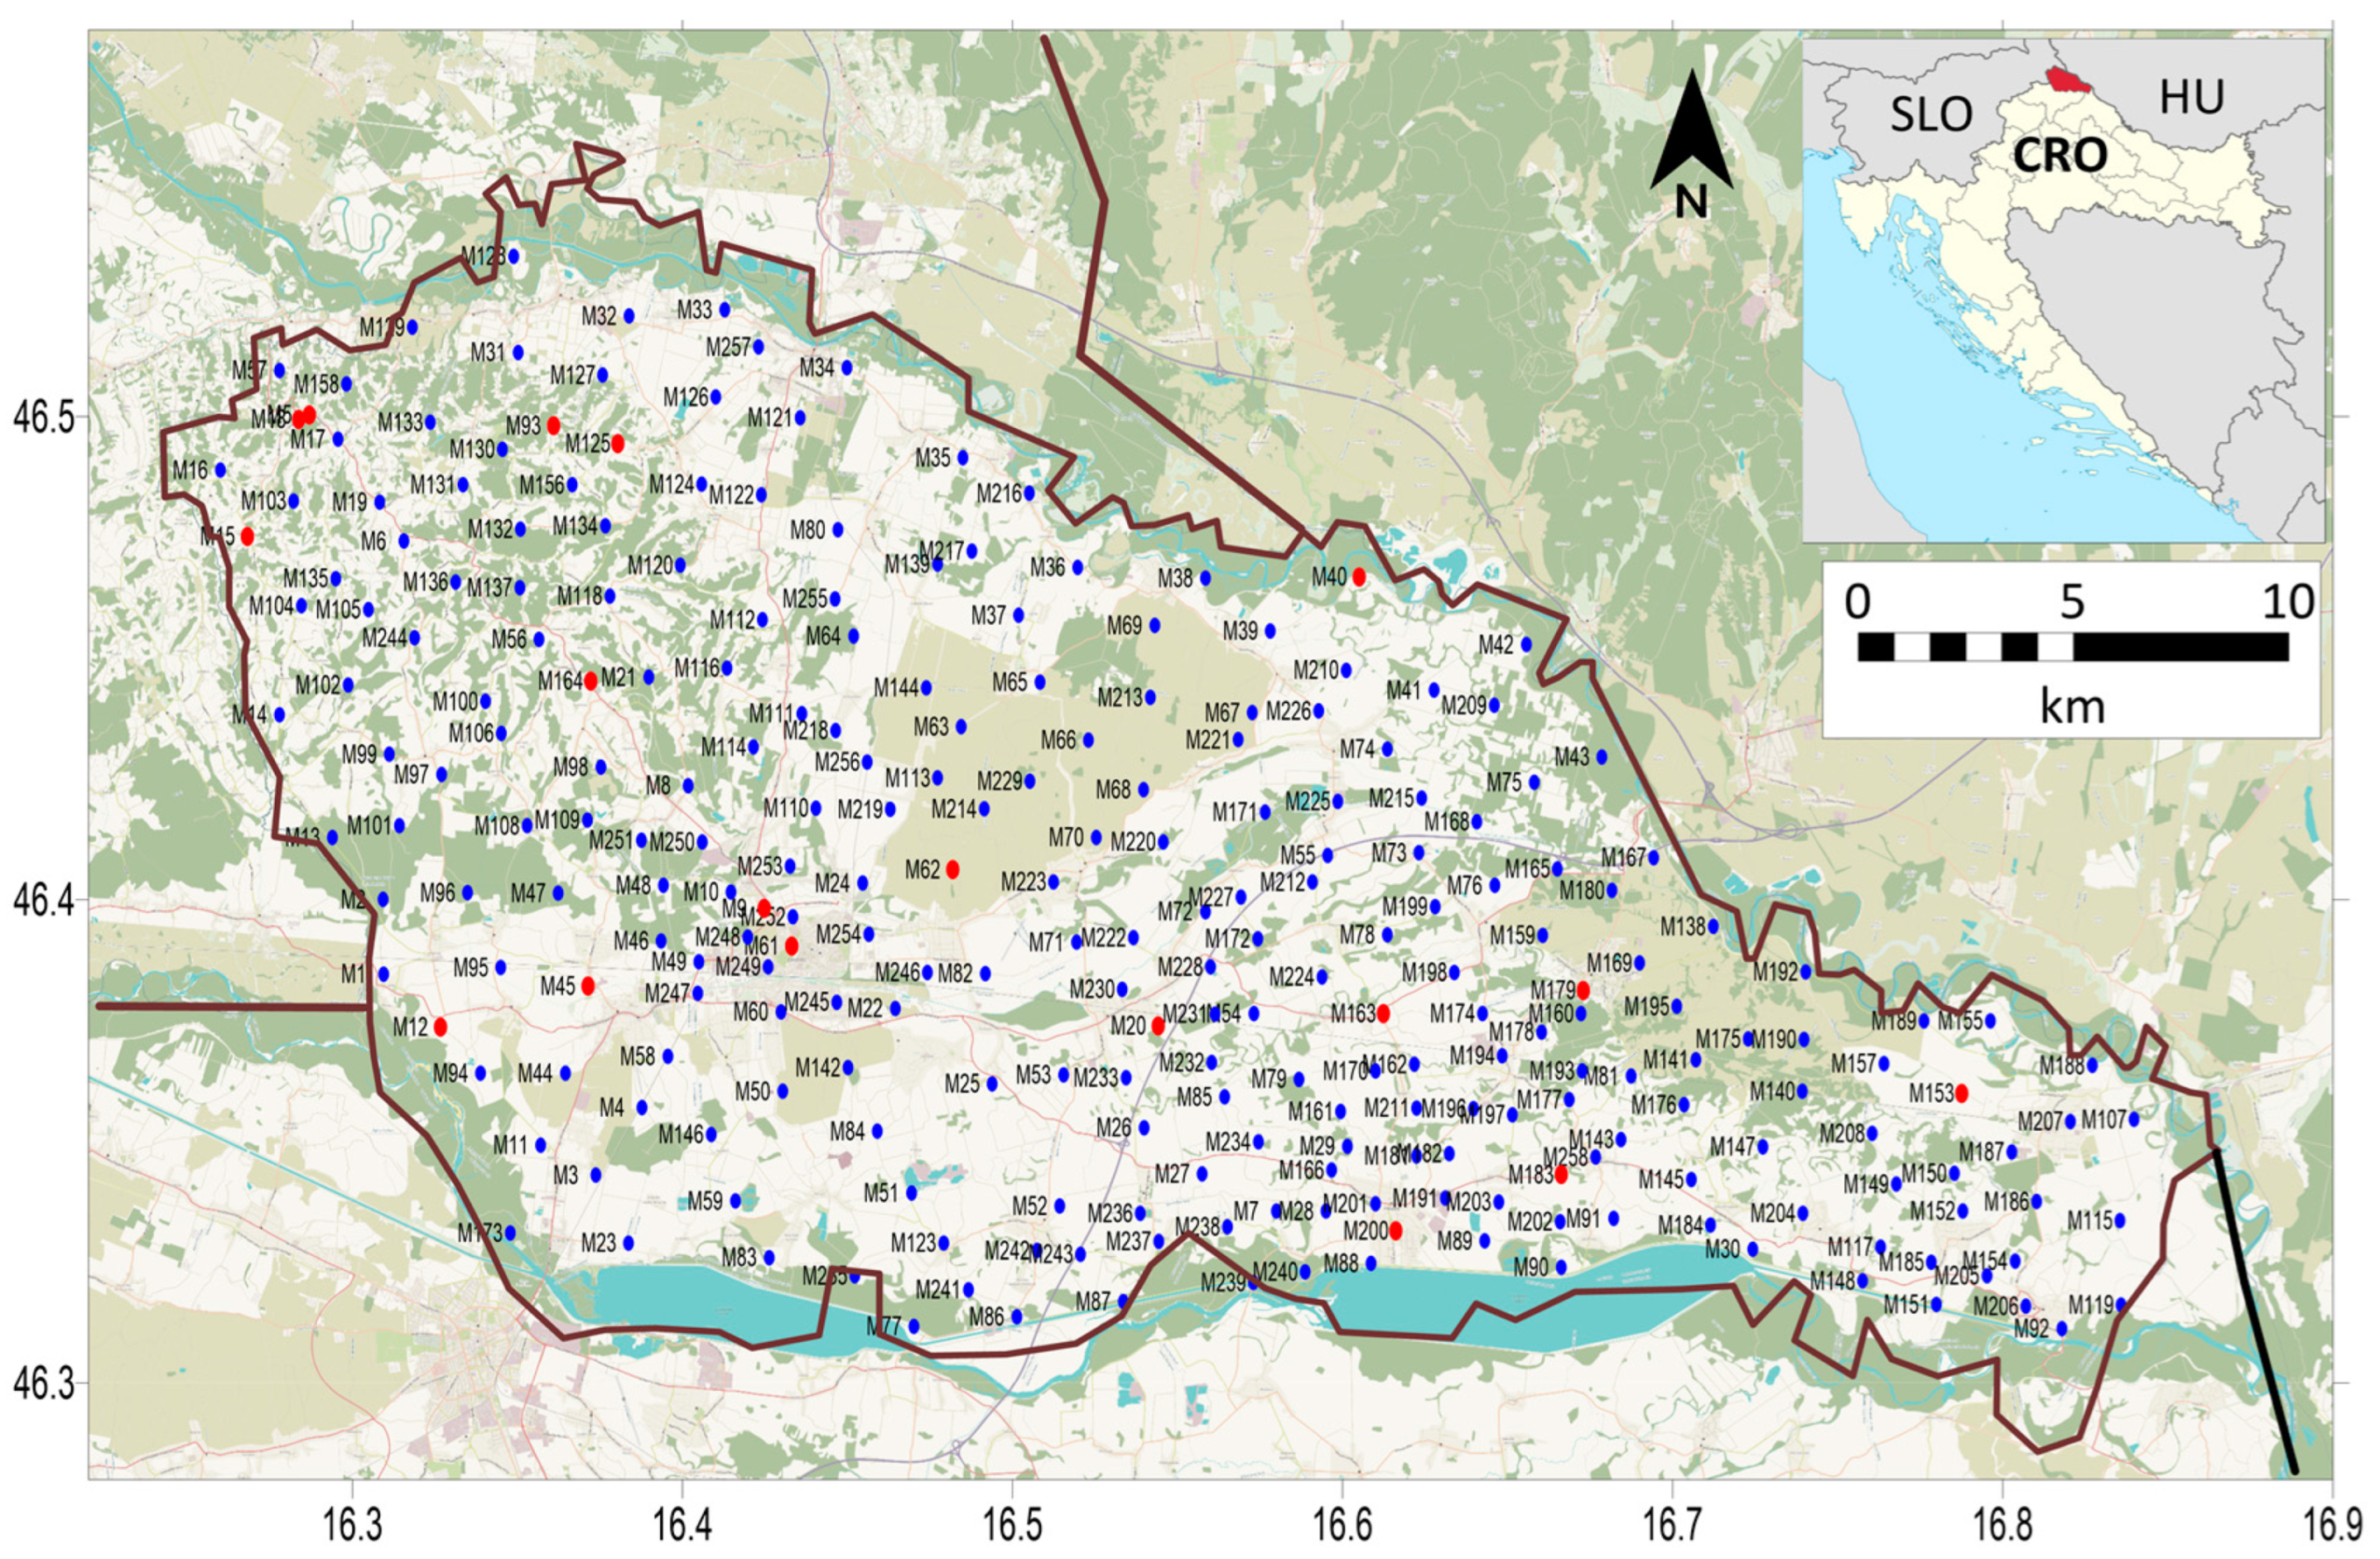
49]. For the purpose of this study, 257 measurements were performed in the Međimurje region using the Tromino 3G instrument (
Figure 7). The ambient noise measurement duration was 20 min at each measurement point. As the Međimurje region is about 60% of the agricultural fields and forest area, this allowed us to avoid noisy areas such as towns, roads, and industrial areas. This proved to be a good choice for measurement locations as more than 80% of HVSR analyses of the free-field microtremor recordings showed clear SESAME guidelines [
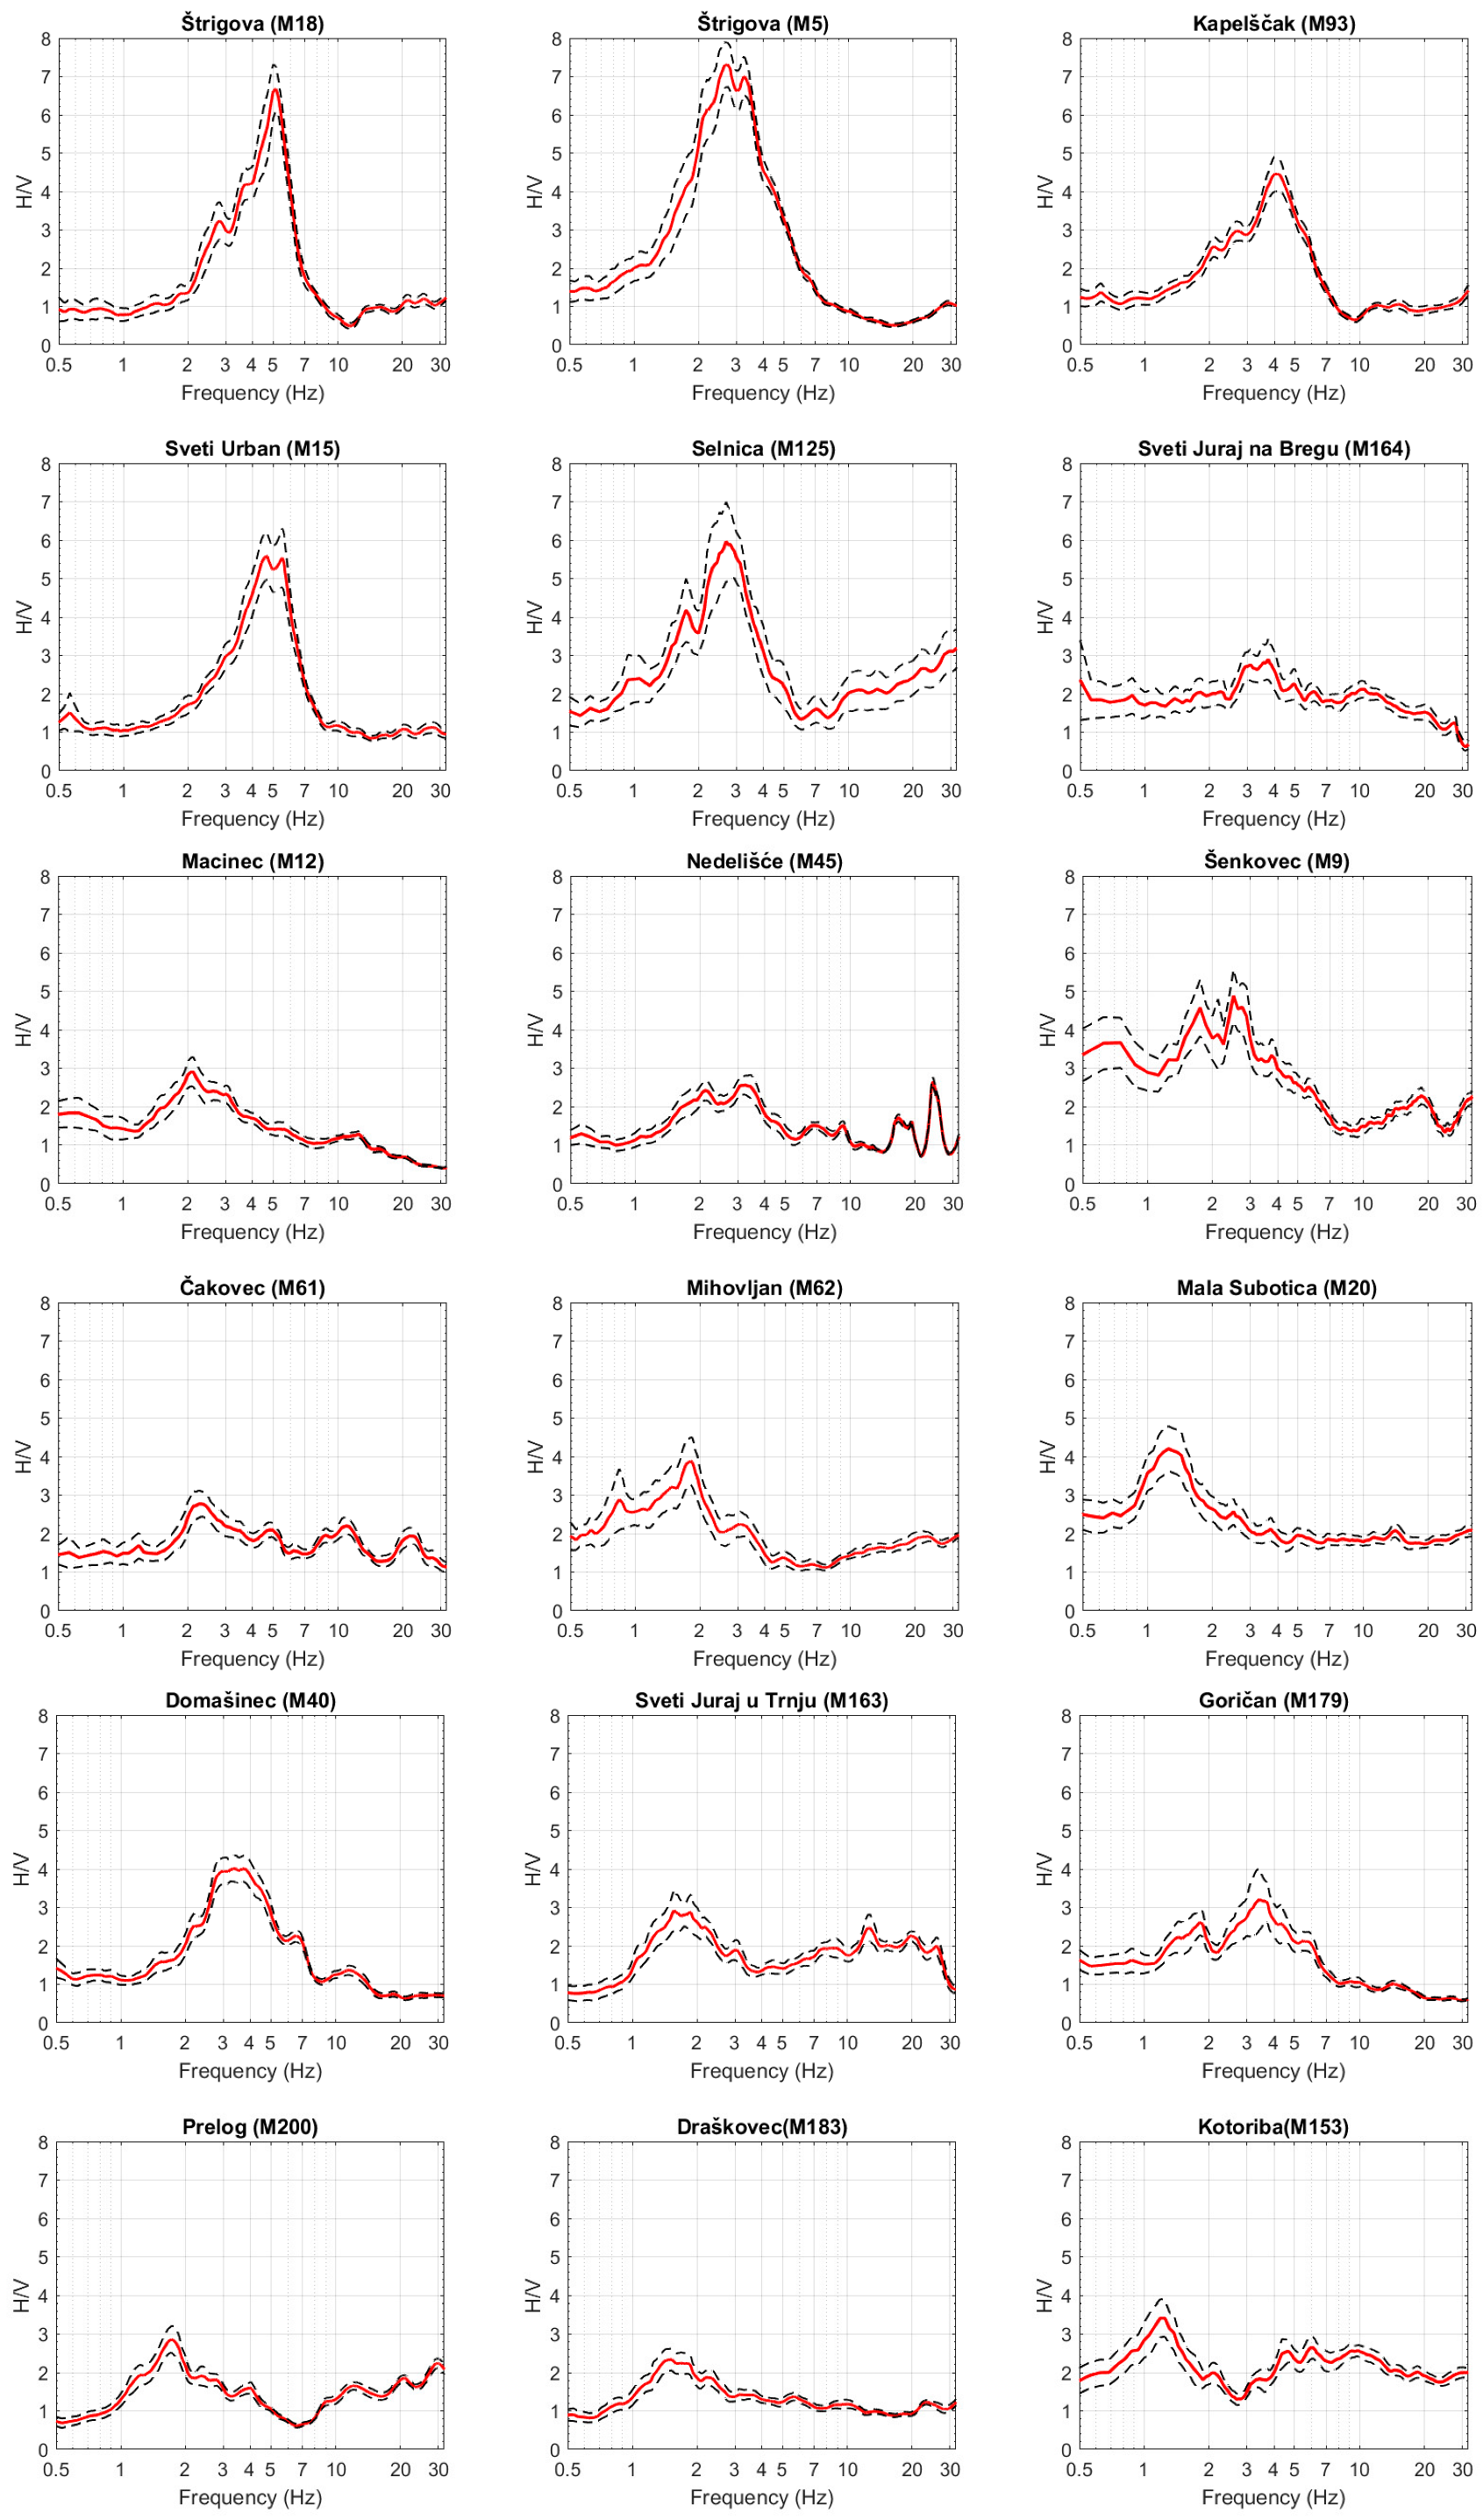
50] for criteria in obtaining reliable measurements and clear peaks. For clear HVSR peaks, standard deviations are small, pointing to geological origin, whereas higher standard deviations indicate influences of artificial and urban noise or wind at certain locations. For peaks that were not clear and showed large amplitudes of standard deviations, trace cleaning (transient removal) and comparison with nearby measurements were performed in order to obtain reliable and clear peaks. In addition, we repeated some measurements on locations that were not suitable for further analysis. In
Figure 8, examples of analyzed HVSR curves at different locations are shown for better understanding of the local site effects on sites with observed macroseismic intensity, shown in
Figure 3,
Figure 4,
Figure 5 and
Figure 6.
Microtremor measurement locations Štrigova (M5, M18), Kapelščak (M93), Sveti Urban (M15), Selnica (M125), and Sveti Juraj na Bregu (M164) are located in the Međimurje Hills area mostly composed of M
4,5—Middle Miocene and M
6,7—Late Miocene (
Figure 1). This example of HVSR curves showed high HVSR amplitude (except for Sveti Juraj na Bregu) with frequencies of 2–5 Hz on thin layered to laminated marls, accompanied with clayey marls, clayey limestones, and coarse sands and conglomerates. These frequencies correspond to estimated thicknesses (H
800) of 15 to 30 m based on an empirical relationship between resonance frequency and bedrock depth for Croatia (Stanko and Markušić [
51]). The high HVSR amplitude could indicate topographical site effects accompanied with shallower sediment deposits overlayed on older deposits, i.e., impedance contrasts between surface and bedrock are high [
47,
48,
52]. The HVSR curves and estimated site frequencies for Štrigova (M5) and Selnica (M125) correspond to HVSR results presented by Herak et al. [
3].
In the zone around Macinec-Nedelišće-Čakovec-Mihovljan, HVSR examples are presented for locations Macinec (M12), Nedelišće (M45), Šenkovec (M9), Čakovec (M61), and Mihovljan (M62). Estimated site frequencies vary between 1.7 Hz and 3.5 Hz. This is a zone that is characterized with an exchange of Pleistocene loess and loess-like deposits (
Figure 1, lQ
1), Holocene aeolian sands (
Figure 1, sQ
2), and Holocene alluvial gravels and sands (
Figure 1, aQ
2), and the estimated thicknesses H
800 to the harder bedrock layers vary between 20 and 60 m [
51]. The HVSR amplitude is not so high compared to topographical areas except for Šenkovec and Mihovljan that are in the transitional zone between alluvial sands and gravels and loess-like deposits. The HVSR curve in Šenkovec site (M9) again shows a similar site frequency as Herak et al.’s [
3] study, but with two observed peaks (note that the measurement is not taken on the same site, but about 200 m away). However, two close HVSR peaks observed in this wide transitional zone could indicate a possible influence of the reverse Čakovec fault zone.
Other examples, Mala Subotica (M20), Domašinec (M40), Sveti Juraj u Trnju (M163), Goričan (M179), Prelog (M200), Draškovec (M183), and Kotoriba (M153), show a variation in site frequency between lower frequencies around 1 Hz and 3.5 Hz. This is an area of Mura and Drava rivers covered with Holocene alluvial gravels and sands (
Figure 1, aQ
2). Estimated alluvial sediment thicknesses H
800 based on measured frequencies [
51] in this wide zone vary between 30 m and 130 m in the deepest part near Prelog.
Examples of HVSR analysis in
Figure 8 indicate how amplification of ground motion in Međimurje can be possibly affected by local site conditions. It can be related to the earthquake’s consequences in terms of observed damage from the 1738 Međimurje earthquake (
Figure 3, [
3]), damage observed after the Zagreb and Petrinja 2020 earthquakes (
Figure 6), together with the macroseismic intensity distribution (
Figure 3 and
Figure 6). With reference to Herak et al. [
3], HVSR measurements on three locations (Štrigova, Selnica, and Šenkovec), soil–structure resonance effects, and site amplification were considered together in order to explain damages on certain localities. To better understand all these effects, we used the macro-approach toward microzonation of the entire Međimurje region that is discussed in the next chapter.
6. Discussion
Broad ranges of observed site frequencies in
Figure 8 together with variations in deep soft-deposit thicknesses overlayed on hard deposits and topographical areas clearly indicate possible strong lateral variations that could localize the earthquake damage pattern [
47]. Conclusions based on single measurements on a certain location as presented in
Figure 8 could be sometimes misleading as strong lateral variations can be present in a small area [
16]. For this reason, we used the method of interpolation to derive microzonation maps to better understand the behavior of ground motion and the influence of local site effects in comparison to macroseismic intensities and past damage observations.
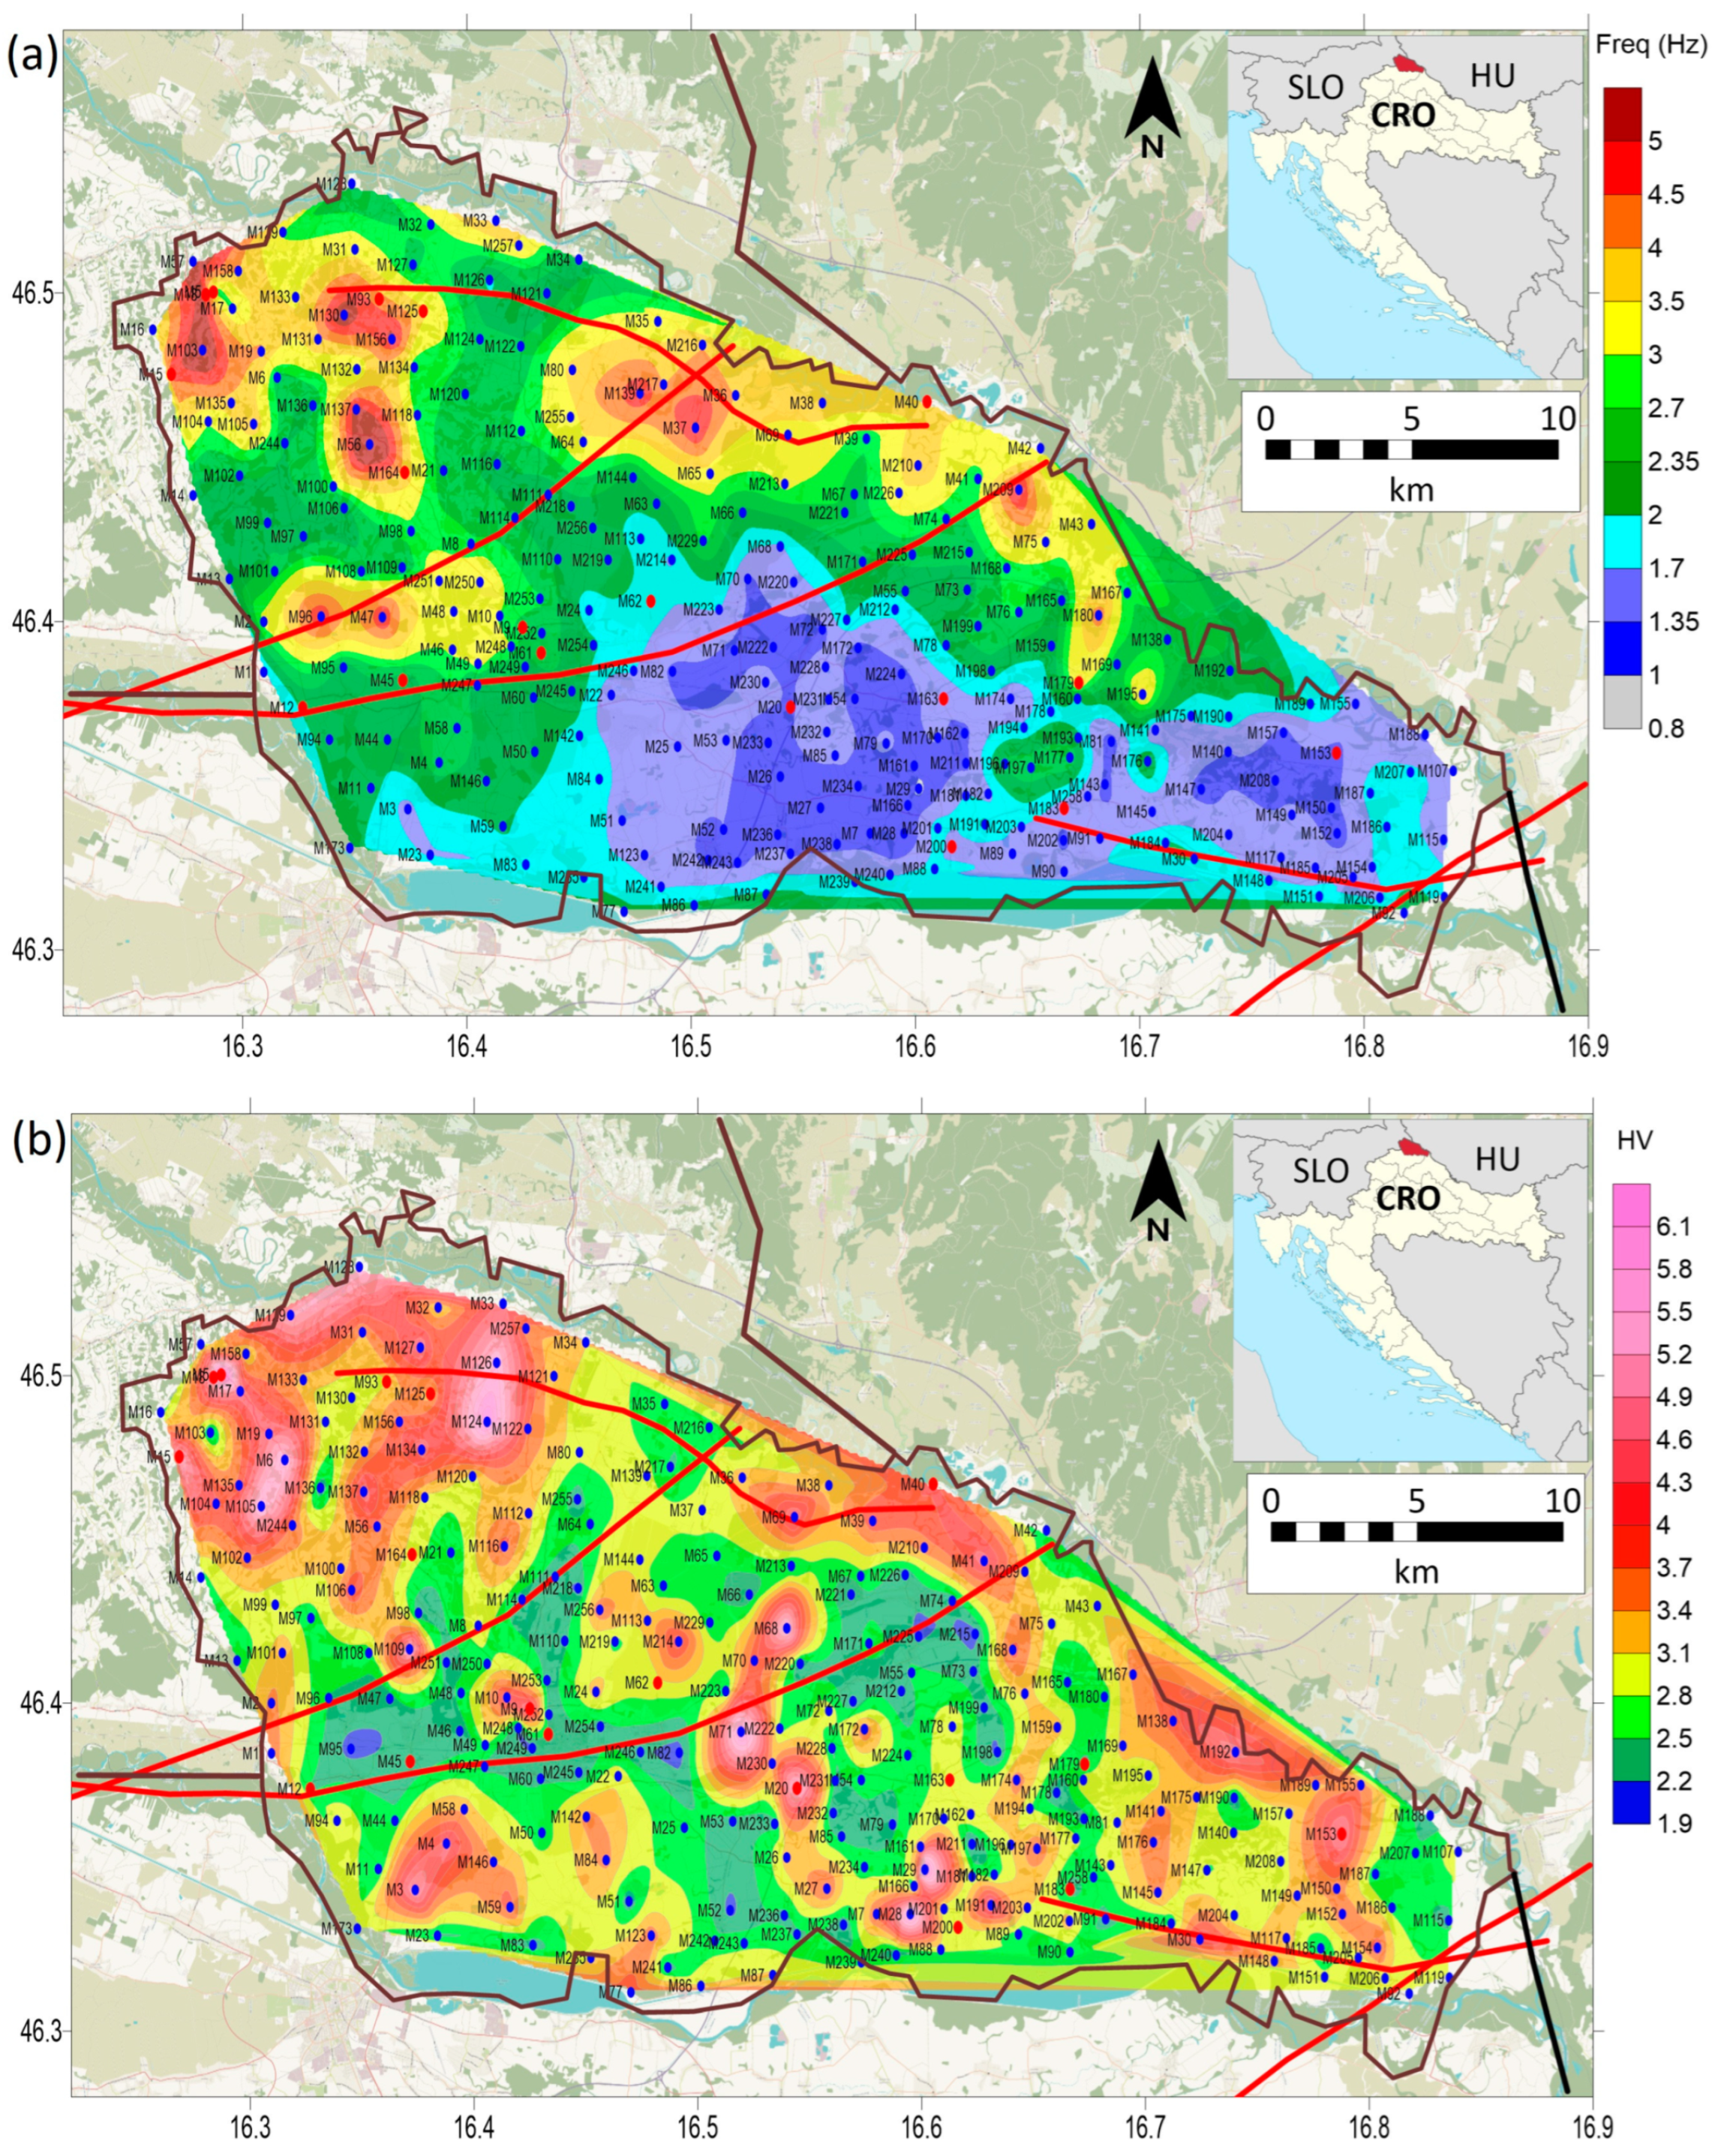
Figure 9 presents maps of interpolated site frequencies and HVSR peak amplitudes based on individual microtremor measurements (
Figure 8). We used the empirical relationship between site resonance frequency, bedrock depth, and V
s30 for Croatia based on HVSR forward modeling (Stanko and Markušić [
51]) to derive maps of V
s30 and H
800 of the Međimurje region (
Figure 10).
From the presented maps, macropattern zones can be indicated that are strongly correlated with local geology and topography (e.g., [
53,
54]). Amplification of ground motion is dependent on the local site conditions i.e., local site effects. Low-frequency ground motion is amplified on a deep and soft soil material on the harder bedrock layers with deamplification of high-frequency motions. On the opposite side, shallow bedrock and stiff soil materials would amplify high-frequency motions [
55]. Single HVSR measurements can be considered a good proxy for soil–structure resonance estimation. Herak et al. [
3] hinted at the possibility that soil–structure resonance and site amplification effects play roles in damage during the 1738 Međimurje earthquake, however, without direct buildings measurements. Lopez et al. [
56] derived frequency ranges for ancient churches in Italy of 5–20 m height ranges that correspond to 1.20–6.00 Hz depending on the year of construction, construction type, material used, local site, etc. Putting these frequency ranges [
55] in a relationship with the site frequency map of the Međimurje region (
Figure 9a) and especially with damage observations for different-height-range buildings from 2020 Zagreb and 2020 Petrinja earthquakes (
Figure 6), it can be concluded that soil–structure resonance certainly played a significant role in damage from historical and recent earthquakes. However, the severity of soil–structure resonance and its risk must be evaluated with ambient noise measurements in churches and older buildings, as well in other buildings of interest, to estimate the soil–structure resonance potential (e.g., [
57,
58]).
The behavior of ground motion at certain localities can be better understood by comparing observed macroseismic intensities and damages (
Figure 3,
Figure 4,
Figure 5 and
Figure 6) with presented microzonation maps (
Figure 9 and
Figure 10). Potentially dangerous zones that are prone to topographic effects (higher frequencies and high HVSR amplitude), zones with shallow bedrock (<30 m in depth) with the exchange of alluvial basin toward hilly areas, and zones of deeper alluvial basin (smaller frequencies, >50 m in depth) with isolated units of Pleistocene bar sediments (higher frequencies, depth < 40 m) around the Goričan-Domašinec Mura valley can be observed. For example, based on known data [
59], the thickness of the Drava alluvial sediments increases from west to east; near Prelog, it reaches 140 m, whereas the thickness of gravels and sands in the Mura river valley at northwestern parts is around 5–20 m; in southeastern parts, it is 20–40 m, corresponding to estimated bedrock depths (
Figure 10b). In alluvial basins of Mura and Drava rivers, especially with a water level relatively high (1.5–3 m, for example, in Goričan-Prelog zone, main author’s home area), multiple reflections, constructive interference, and site amplification resonant effects could be strongly localized [
40]. Moreover, this could explain damage observations on the locality of Sveti Juraj u Trnju from 1738, 1880, and the recent 2020 earthquakes, where the area is composed of water-saturated intermediate to deep sands and gravels of low frequency that may have increased the intensity level. These zones could also be prone to potential nonlinearity effects due to strong shaking on soft soils as well to possible liquefaction, especially in the case of strong and nearby earthquakes [
60]. For example, this was the case for the Petrinja area where liquefaction occurred from the strong M6.2 earthquake [
8,
61].
Following the Eurocode 8 [
62] V
s30 site classification (
Figure 10a), Međimurje can be divided into two site classes, category C for most of the Međimurje area, especially lowland Međimurje (Mura and Drava depression,
Figure 1), and category B for the Međimurje Hills area (
Figure 1). Site classes C are prone to higher site amplifications, whereas site class B tends to have lower site amplification (e.g., [
63]). However, the entire Međimurje Hills cannot be categorized as site class B, as there are changes in the local terrain between the hilly landscape and valleys in-between. Moreover, the area around Štrigova where higher intensities are observed (
Figure 3,
Figure 4,
Figure 5 and
Figure 6) tend to also show high HVSR amplitudes (strong impedance contrast between shallow clay layers overlayed on older harder deposits) (
Figure 3,
Figure 4,
Figure 5 and
Figure 6). This could indicate the possibility of localized amplification and directional variations oriented along local topographical features, as well possible susceptibility to seismically induced landslide-prone slope [
49,
52].
Higher levels of the observed macroseismic field, as well the exchange of low to intermediate site frequencies in the transitional zone Macinec-Nedelišće-Čakovec-Mihovljan between lowland Međimurje and Međimurje Hills, could indicate that this area is probably under the influence of the Čakovec near-fault zone combined with local site effects. Velocity structure variation, especially in the exchange zones with shallower to deeper sites, near-source characteristics, and the influence of local shallow macroseismic focal depth [
3] could cause strong ground motions within a few kilometers from the rupture plane, as in the case in the 2019 M
w4.9 Le Teil earthquake [
64].
Macroseismic observations from past earthquakes, 1738, 1880, 1938, and 1982 compared to SAF modeling that is derived for rock conditions (
Figure 3), indicated a difference in intensity of half a degree or even up to one degree at certain localities. HVSR analysis and estimated site parameters (
Figure 9 and
Figure 10), site frequency, HVSR amplitude as an indicator of site amplification [
16], V
s30, and bedrock depths, showed localized site effect variations that clearly influenced macroseismic observations and damages from past earthquakes in the Međimurje region. The correlation of microtremor analysis (
Figure 9 and
Figure 10) with intensity observations from historical earthquakes as well as with recent 2020 earthquakes (
Figure 3,
Figure 4,
Figure 5 and
Figure 6) can help to distinguish local site zones prone to the possible occurrence of higher earthquake damage from nearby and distant earthquakes as a post-earthquake reconnaissance role [
46,
65,
66,
67].
Together with estimated microzonation maps on a macro-approach, a local seismic hazard of the Međimurje region can now be better understood pointing to certain local site areas that are more prone to earthquake-localized effects rather than other ones. Future studies on a micro-approach can resolve problematic areas in terms of detailed site effects studies for possible susceptibility to seismically induced landslide-prone slopes [
49,
68], topographic and directional effects due to surface geometry [
52], and localized site amplification of ground motion in soft soil with variable bedrock depths, in particular, shallow bedrock [
69,
70]. Valuable microdata, i.e., local geotechnical studies, landslide investigations, and remediation studies as well historical data on certain localities in Međimurje (or in any other area in global terms) can be significant to better understand localized seismic site effects. Finally, all these data can be used for numerical site response analysis to better understand the significance of seismic site effects in the damage observation and localized ground motion variation in the Međimurje region in a similar manner as was performed for the Zagreb area (Uglešić et al. [
71]).
7. Conclusions
In this study, we have demonstrated a macro-approach to ambient seismic noise measurements in the Međimurje region (729 km2) to help to distinguish natural hazard “diagnoses” of the region microzones prone to local site effects. The main aim was to understand how the local site effects of the Međimurje region play a role in significant damage in terms of the observed higher intensities after the historical 1738 MLm5.1 Međimurje and 1880 ML6.3 Great Zagreb earthquakes and, in the instrumental era, the 1938 ML5.6Koprivnica, 1982 ML4.5 Ivanec, and the most recent 2020 ML5.5 Zagreb and 2020 ML6.2 Petrinja earthquakes.
Based on macroseismic observations from past earthquakes together with HVSR analysis and microzonation maps, there is a reasonable indication that these earthquakes involved several localized site effects that could explain the increased intensity of half a degree or even up to one degree at certain localities compared to SAF modeling for rock conditions:
Strong amplification due to variable soil-structure and surface-to bedrock depths;
Resonance effects between local site and certain buildings (mostly older churches);
Increased intensity due to influence of water-saturated sands and gravel;
Nonlinearity effects due to strong shaking on soft soils;
Liquefaction effects from strong and nearby earthquakes;
Localized amplification and directional ground motion variations oriented along local topographical features;
Possible susceptibility to seismically induced landslide;
Possible influence of shallow near-fault characteristics.
This study, although regionally oriented (Međimurje region in Northern Croatia), shows the potential to use a macro-approach as a first step of identifying potentially dangerous seismic zones in a larger region using ambient noise measurements and its connection to past earthquake macrointensity observations. Based on the observed microzones pattern, future research directions could involve a detailed micro-approach, i.e., dense ambient noise and geophysical survey together with collection of local geotechnical data, landslide investigations, and remediation data. Moreover, numerical ground response analysis can be performed on these data for different earthquake scenarios so that the seismic microzonation of certain town areas in the Međimurje region or any other area can be derived using the same macro-to-micro approach for the purpose of mitigation of local seismic hazards. In addition, it is important to consider additional ambient noise measurements in buildings to estimate the potential soil–structure resonance risk, in particular, for older churches and cultural heritage buildings as they are most vulnerable to earthquakes.


