
Cloud Detection of Gaofen-2 Multi-Spectral Imagery Based on the Modified Radiation Transmittance Map


1
College of Surveying and Geo-Informatics, Tongji University, Shanghai 200092, China
2
School of Remote Sensing and Information Engineering, Wuhan University, Wuhan 430072, China
*
Author to whom correspondence should be addressed.
Remote Sens. 2022, 14(17), 4374; https://doi.org/10.3390/rs14174374
Submission received: 14 July 2022
/
Revised: 30 August 2022
/
Accepted: 31 August 2022
/
Published: 2 September 2022
Abstract
:For optical remote sensing images with high spatial resolution and low spectral number, the complexity of ground objects poses great challenges to cloud detection algorithms, such as the differentiation of clouds from objects with similar features as clouds and the identification of thin clouds. In this paper, a novel cloud detection method is proposed for Gaofen-2 remote sensing imagery. The radiation transmittance is estimated based on the dark channel prior, and the overestimated radiation transmittance is corrected using spectral features. A three-step post-processing strategy is adopted to eliminate misidentification introduced by the highlighted surfaces based on object geometric, textural, and boundary features. In the experiments, Gaofen-2 multispectral images with different cloud categories and cloud thicknesses are involved to evaluate the performance of the proposed method. The results show that the proposed method can obtain an average cloud detection accuracy of 0.9573 on six different clouds. The proposed algorithm can also effectively detect both thick and thin clouds with an average accuracy of more than 0.9517. The advantages of the method for thin cloud detection are further demonstrated by comparison with existing algorithms.

1. Introduction
With the development of remote sensors, satellite images have been widely used in the field of earth observation [1,2,3]. Remote sensing images acquired by optical sensors are usually affected by clouds, which makes it difficult to identify and interpret ground objects [4]. Thick clouds can completely obstruct the ground objects and make them invisible, causing the cloud contamination problem [5], while thin clouds or haze usually attenuate the radiance entering the sensor and have a serious impact on the image fidelity.
Cloud detection methods can extract the cloud area and coverage on remote sensing images. As the pre-processing step for image processing and applications, the necessity of cloud detection methods is becoming more and more prominent [6]. Cloud occlusion generally affects the data quality of various optical images, but the difficulty of cloud detection varies from image to image. Some optical images, such as the Chinese earth observation satellite Gaofen-2 images, have a small number of wavebands and high spatial resolution, which makes the accuracy of cloud detection results obtained by employing traditional methods low. Advanced cloud detection methods for such remote sensing images will facilitate the analysis and application of the satellite data.
Cloud detection algorithms can be divided into two categories based on the strategy of using remote sensing images: multi-scene based methods and single-scene based methods [7]. Multi-scene cloud detection methods usually use time-series images of the same area with short time intervals, thus exploiting the significant differences in image features between non-clouds (considered as reference images) and cloud-covered ground [8]. The multi-scene based methods can achieve pleasurable cloud detection performance [9]. However, it is very challenging to find a suitable reference image that matches the image to be detected. The cloud-free reference image should have similar surface objects, shooting time, and spatial resolution to the image to be tested. It is particularly difficult for satellite images with long revisit periods or areas with high annual cloudiness.
Single-scene-based cloud detection methods mainly use features to distinguish ground objects from clouds [10]. Spectral analysis has been proposed in many cloud detection algorithms [5,11,12], and its performance has been validated [13]. Color spaces like RGB (Red, Green, and Blue) and HSL (Hue, Saturation, and Intensity) have been widely applied in cloud detection [14]. Top of Atmosphere (TOA) reflectance and Brightness Temperature (BT) were used in the function of the mask (Fmask) method to detect clouds and shadows and proved to be effective in Landsat imagery [12,15]. Normalized Difference Building Index (NDBI) [16] and Local Binary Pattern (LBP) [17] were also utilized in cloud detection methods. Single-scene based cloud detection methods can detect clouds directly from images by applying physical models, spectral analysis, etc., avoiding the need for reference images and becoming the main cloud detection methods at present [18].
The number of spectral bands and spatial resolution of the remote sensing image affect the application of cloud detection methods on models and features [19,20,21,22]. Many remote sensing images with low to medium spatial resolution have sufficient spectral information, such as Terra/Aqua Moderate-resolution Imaging Spectroradiometer (MODIS) [23,24], Landsat Thematic Mapper (TM)/Enhanced Thematic Mapper Plus (ETM+) [5,12] and Satellite pour l’Observation de la Terre 5 (SPOT5) imagery [25]. These images typically contain rich infrared and thermal infrared bands with a strong ability to penetrate clouds and haze. Therefore, combining infrared bands with visible bands makes it possible to use spectral features for cloud detection. While for some high spatial resolution images, the number of spectral bands is not sufficient for cloud detection, and the increased resolution invariably poses more problems as well.
As the spatial resolution of remote sensing images increases, more ground features emerge. The combination of point, line, and area details can be used to extract boundary and texture features to identify the complicated ground objects. An automatic operational scheme was designed for Advanced Very High Resolution Radiometer (AVHRR) satellite imagery and was tested in the George VI Strait and polynya, a coastal area of South Weddell [26]. A multi-feature combination (MFC) method was proposed for cloud and shadow detection in Chinese Gaofen-1 (GF-1) optical satellite imagery [17]. Machine learning methods combined with feature analysis, such as Markov random field (MRF) framework [27], support vector machine (SVM) [28], and deep learning [29], were also introduced [30].
High spatial resolution poses challenges for single-scene-based cloud detection algorithms. For example, some artificial building roof materials have high reflectance. Turbid water bodies contain many impurities, which leads to an increase in the reflectance of the water surface. MFC methods cannot distinguish these highlighted surface objects from clouds, which causes erroneous detection. Machine learning algorithms usually require a large number of high-quality samples, and their computational complexity is relatively large. Various cloud shapes and cloud thicknesses will present different morphological and spectral features on the imagery, which will increase the diversity of samples. As a result, in the absence of sample diversity, cloud detection based on machine learning algorithms becomes arduous.
Some effective methods for single-scene based cloud detection that rely on physical models and features are proposed, such as Digital Numbers (DNs) [31], Haze Optimized Transformation (HOT) [32], Haze Thickness Map (HTM) [33] and advanced Ground Radiance Suppressed HTM (GRS-HTM) [34]. He et al. [35] utilized a haze transmission recovery depth map to assess haze thickness, which has been widely used. By analyzing the scattering effect of atmospheric suspended particles, this method corrects the pixels obscured by the haze and restores the object’s spectral reflectance. This method has attracted extensive attention in the field of computer vision and has achieved favorable results in dehazing.
Inspired by He’s work, a processing flow based on the radiation transmittance was adopted in this paper for cloud detection of high-resolution remote sensing images. As shown in Figure 1, the radiation transmittance map was estimated using a dark channel prior to detecting thick and thin clouds. After that, the radiation transmittance map was fined with a water mask and brightness mask to eliminate false detections caused by turbid water bodies and highlighted artificial objects. Then, instead of using the hard threshold method, the clustering technique was used to automatically extract clouds as the initial cloud map. Finally, combined with geometry, texture, and boundary information, a three-step post-processing strategy was proposed to further eliminate false detection pixels. The proposed method can efficiently reduce the impact of buildings with high reflectance on cloud detection and achieve satisfactory detection performance on clouds of different morphologies and thicknesses.
The remainder of this paper is organized as follows: the cloud detection method based on modified radiation transmittance is introduced in detail in Section 2. The coarse cloud map extraction strategy is proposed in Section 2.1. The post-processing procedure is presented in Section 2.2. The hyperparametric decision experiment is illustrated in Section 2.3 and the evaluation metrics are introduced in Section 2.4. The experimental results and analysis are described in Section 3. In Section 3.1, the data and experimental setup are described. The results, evaluation, and comparison are contained in Section 3.2. Finally, the conclusion is given in Section 5.
2. Methodology
The method proposed in this paper is mainly based on radiation transmittance differences between cloud covered and non-cloud-covered landscapes. At first, the radiation transmittance map is estimated using the dark channel prior, and then modified by brightness mask and water mask. After that, the extinction coefficient is calculated by Koschmieder’s law [36] to describe the thickness of clouds. The K-means method is taken to cluster the extinction coefficient values. The coarse cloud map is obtained after filtering clustering results. Finally, the post-processing is carried out for the misclassified pixels according to the geometry, texture, and boundary features of the cloud.
2.1. Cloud Detection
The radiation observed by the sensor can be expressed as the sum of the reflected light of landscapes and the scattered airlight on the path from the ground point to the sensor based on a simplified radiation transmission model promoted by He [35]. The observed intensity, the reflected light of the object and the scattered airlight on the transmission path are all band dependent, and can be expressed as , and , respectively
The electromagnetic radiation attenuates on the path, since the influence of absorption and scattering of the medium, and the surviving light collected by the sensor is described as “transmission” [37], which is called radiation transmittance in remote sensing image processing and defined by Koschmieder’s law [36] as follows:
where, is the extinction coefficient of the medium, which measures the radiation attenuation caused by atmospheric absorption and scattering. d is the scene depth. In the observed intensity model, the reflected intensity of ground objects is given by the product of the inherent spectral intensity of the object and the radiation transmittance . Based on four basic assumptions for scattering airlight [38], a simplified observed intensity model is then established with denoting the global sky radiation intensity which is assumed as a constant. The observed intensity can be expressed as
For Gaofen-2 imagery with four spectral channels, Equation (3) is normalized by the global sky radiance in each band and then the minimum operators are carried out on both side:
where, is the estimated radiation transmittance, x is the spatial location of the pixel on the image, is the neighborhood centered on the position of x and y is the spatial location of the pixel in . The dark channel prior [35] assumes that in most of the non-sky patches, the observed intensity of some pixels in a certain color channel is at least close to zero. Thus, the minimum intensity of these pixels is zero in the local patch. According to the presented dark channel assumption, the estimated radiation transmittance can be written as follows:
In a radiation transmittance map, high values represent high transmittance, and pixels with high transmittance are often regarded as cloud-free pixels. Pixels with low transmittance are considered to be cloud-covered areas with high probability. In particular, the intensity of the transmittance can approximately represent the thickness of the cloud.
In the estimated radiation transmittance map estimated by dark channel prior, high brightness objects, such as artificial buildings and turbid water bodies, often show low transmittance and are usually misidentified as clouds. In the transmittance estimation, the low radiation transmittance value caused by the high reflectance of these objects is mistakenly considered to be caused by atmospheric particles. Therefore, it is necessary to extract and eliminate errors caused by these landscapes with high reflectance [13]. In this paper, a brightness mask and a water mask are designed to refine the radiation transmittance map. Since the mask operation is performed on the apparent reflectance image, it is necessary to perform radiometric correction first.
The input DN value of Gaofen-2 multispectral imagery is converted into Top of Atmosphere (TOA) reflectance :
where, d is the astronomical unit (the distance between sun and earth), is solar irradiance, and is solar zenith angle. is TOA reflectance which is calculated by:
where, Digital Number is noted as which indicates the brightness value of the pixel in the remote sensing image. The parameters and represent the gain value and the bias value respectively, which are band dependent. The satellite radiation correction parameters in Equations (6) and (7) can be obtained on the website of China Centre for Resources Satellite Data and Application (http://www.cresda.com/, accessed on 1 March 2021).
Normalized Difference Water Index (NDWI) is a normalized metric of the green band and near-infrared band and proposed on the basis of spectral analysis, which has been proved to be an effective method for rapid water detection [39]. The TOA reflectance in green and near-infrared bands are noted as and , respectively. The “” is generated based on NDWI
According to the significant characteristics of water in near-infrared band, some approaches utilize Normalized Difference Vegetation Index (NDVI) combined with near-infrared band to extract water. Through the parameter test, NDWI is more effective than NDVI to extract water on Gaofen-2 imagery, and adding a near-infrared band as the detection index has no significant impact on the water detection results.
The “” is designed for artificial structures with high reflectance:
where, the TOA reflectance in red, green and blue bands are noted as , and , respectively. The interpretation of brightness mask is that if the mean TOA reflectance value [12] on visible bands of the pixel is too high, or the TOA reflectance on any single band of the pixel is too high, it will be considered as part of brightness mask. and are empirical thresholds, which are obtained by experiments.
The radiation transmittance is modified by using and and is expressed as:
where, the addition of and implies the superposition of two mask maps with a value of 0 or 1 for each pixel. is an adjustment parameter and is taken as 0.15 here. is the corrected estimated radiation transmittance for the radiation transmittance values of turbid water bodies and highlighted buildings on the remote sensing imagery. When there are turbid water bodies or high reflectance buildings (i.e., or = 1), Equation (10) will help to improve the radiation transmittance and make it easier to distinguish the corresponding objects as non-cloud covered areas. On the contrary, under other conditions (i.e., and = 0), the radiation transmittance values will remain unchanged.
The proposed radiation transmittance modification aims to address the underestimation of radiation transmittance caused by surface objects with high reflectance. It can eliminate to some extent the error of the turbid water and bright man-made objects being misjudged as cloud pixels. For the non-cloud covered surface area, due to the clear sky, the radiation transmittance value should be high. For cloud-covered surface areas, the radiation transmittance value should be low, and the thicker cloud-covered surface areas correspond to the lower radiation transmittance values. However, the radiation transmittance of surface features with high observed intensities is underestimated, such as the highlighted artificial structures in Figure 2a. Compared with removing mask areas, modifying the radiation transmittance is a more moderate approach, and the effect of correcting highlighted objects can be seen in Figure 2d.
Due to the significant differences in reflectance values between clouds, the hard threshold method does not fit for extracting clouds. The relative reflectance differences between clouds and ground objects are obvious, hence the clustering method was adopted to generate a coarse cloud map (CCM). Among various clustering methods, the K-means clustering algorithm has been proven to be simple and effective [40] and is used to distinguish between cloud and non-cloud coverage areas.
The uneven distribution of atmospheric particles over a large area will directly lead to the variation of the extinction coefficient. Therefore, we further address the extinction coefficient by modifying radiation transmittance values and clustering the extinction coefficient map. The differences between the variable utilization in this paper and that in the process of image dehazing are explained. In He’s study [35], the scene depth is the distance from the camera to the point on the object, which can be used as an indicator to indicate the haze density. The scene depth varies greatly between objects, and the distribution of atmospheric particles is uniform over short distances. Therefore, the scene depth can be regarded as a variable and the extinction coefficient can be regarded as a constant. In remote sensing image processing, the scene depth is defined as the distance between the satellite and landscapes and can be considered as a fixed value. The extinction coefficient is a variable that affects the radiation transmittance. In this paper, the linear proportional value of the extinction coefficient is used as the estimation of the extinction coefficient.
K-means algorithm is operated on the extinction coefficient map according to the basic principle. The points and centroids of each cluster are updated based on the Euclidean distance matrix until they converge to the local optimum in the process [41]. Initial clustering centers are chosen randomly from the dataset, and the other points in a given dataset are assigned to the corresponding cluster to minimize the squared error E:
where c is the number of clusters. is the extinction coefficient value of point j at band i. represents the mean extinction coefficient value of the points in cluster . denotes the square of distance norms.
The clustering results are sorted by the average reflectance from low to high. Five pixel sets will be generated as , , , and , and represents the set of pixels in the i-th cluster. Two parameters and are set as 0.50 and 0.05 here, respectively. means the difference between the i-pixel set and the j-pixel set. These pixel sets will be filtered to determine which category is classified as coarse cloud map (CCM) according to the following rules for each i:
- if .
- if.
The first rule is to set a “limit reflectance threshold” for clustering judgment to avoid two extreme cases. One is that false detection occurs on imagery when the cloud coverage is 0%, and the other is that some clouds cannot be detected when the cloud coverage is 100%. At the same time, it is also very important to judge the class of because always oscillates between cloud class and non-cloud class, which is why we make the second rule. In this paper, if the difference between and is less than that of and , will be identified as cloud. Otherwise, if is close to but not too close, will be still considered as cloud covered area. It should be noted that if is regarded as cloud covered area, there is no need to judge the category of .
The number of clusters c has a great impact on the coarse cloud image. We designed a comparison experiment to cluster the extinction coefficient maps using different number of clusters. After filtering the clustering results, the binarization result with the highest accuracy is selected as the coarse cloud map (Figure 3b–e). The results demonstrate that the greater the number of clusters, the higher the accuracy of the coarse cloud detection results, but the time spent will also increase. While, as shown in Figure 3b, when the number of clusters is small, some thin cloud regions are missed. As the number of clusters increases, thin clouds and surface features can be distinguished by clustering, as shown in Figure 3d1,e1. By comparison with the reference image, the detection accuracies of coarse cloud with cluster number of two to five in Figure 3 are 0.8327, 0.9209, 0.9443 and 0.9449, respectively. With the increase of the number of clusters, the detection accuracy of coarse cloud mask gradually improves. Both considering the computation and precision cost of K-means clustering algorithm, the number of clusters is determined as five.
2.2. Post-Processing
Although the radiation transmittance has been corrected before solving the extinction coefficient, there are still some misclassified pixels in the coarse cloud map, including some ground pixels with high values of the extinction coefficient as the cloud pixels in the image. In order to eliminate the errors in the coarse cloud map and improve the detection accuracy, a three-step post-processing method is proposed. First, some small pieces pixels are removed using geometric features based on the size difference between clouds and general surface objects. Texture features [42] are utilized to eliminate the false detection caused by highlighted surface with large areas. Finally, edge features are employed to further remove non-cloud covered regions based on the apparent difference in spectral features between the edges of clouds and the edges of ground objects.
The coarse cloud map is a binary image in which the detected clouds are represented as connected regions. Pixel-based cloud detection algorithms will inevitably have fragments that do not match the morphological and structural characteristics of the clouds. In general, the area of a patch cloud is much larger than that of a single artificial structure. Using the size of region, some small erroneous fragments caused by surface buildings can be eliminated. The width and length of the minimum bounding rectangle (MBR) of each connected region in the coarse cloud map are calculated to determine whether the connected area is the cloud. The length and width of MBR are measured by the number of pixels.
where k represents the number of connected regions. and are taken as 20. In the post-processing strategy, before using texture features to remove errors, it is necessary to filter connected regions by using geometric information. The purpose of error processing in this order is that the number of connected regions in the cloud image will be greatly reduced by geometric information processing, so as to decrease the amount of calculation of of texture features and avoid a lot of time consumption.
It can be observed that, as the cloud cover increases, the surface texture becomes smoother. Due to the texture difference between cloud covered areas and non-cloud covered areas, thresholds are utilized to remove non-cloud covered pixels. “” is designed as follows. Correlation and uniformity of gradient distribution for each connected region k on the coarse cloud map are noted as and , respectively.
The texture features of non-cloud covered and cloud covered regions are calculated and compared, and thresholds are determined experimentally. By testing fifty remote sensing images, the texture features of ground objects appear to change significantly when covered by clouds, even if they are thin. Ten texture feature parameters (Table 1) are considered including correlation, gray level entropy, gradient entropy, mixing entropy, mean gray value, mean gradient value, standard deviation of gray value, standard deviation of gradient value, uniformity of gradient distribution and uniformity of gray distribution. By comparing the degree of difference of texture feature values in pair regions individually, two texture feature parameters, correlation and uniformity of gradient distribution, which have the greatest discriminative capability, are selected to identify the presence of clouds. The discriminability is calculated as the ratio of the difference between the texture value of cloud covered region and that of non-cloud covered region, and the texture value of cloud covered region. The experimental results indicate that there are positive and negative values of correlation parameter in the cloud and non-cloud covered areas. The uniformity of the gray distribution parameter of cloud covered areas is almost three times more than that in the non-cloud covered areas. and are determined as 0 and 8000, respectively.
“” is proposed to remove highlighted surface objects with large areas that are difficult to be separated from clouds in area tests, such as long roads and huge buildings. Through the analysis of the morphological characteristics of objects on the high-resolution remote sensing imagery, the cloud presents a gradual change state on the boundaries, while the spectral values around the surface object will be significantly different from the spectral values of the surface object itself. Therefore, it is feasible and effective to extract cloud regions by using the difference degree of boundary pixels. A metric is designed, which takes the difference between the boundary pixels and the adjacent external pixels with the specified step size, called “” (ED). The for each connected region k on the coarse cloud map in band is expressed as follows:
where is the TOA reflectance of pixel located at in band . and note the step size and direction. is band dependent, and it is the TOA reflectance of a pixel in the direction of and the distance from is length. In this paper, is set to 7 and is determined by a certain rule.
The edge difference is solved for each boundary pixel on three visible bands. The for each connected region k on the coarse cloud map in blue, green and red bands is noted as , and , respectively. Because of the difference of TOA in three bands, the threshold parameters for three bands are not the same here ( is 0.24, is 0.22, is 0.20). For a connected region with n edge pixels, if the following conditions are met, the connected region will be determined as a non-cloud covered region
The effectiveness of the edge test was verified by experiments. An example is shown in the Figure 4. Two bright buildings occupy a large area on the remote sensing imagery and cannot be removed during the geometric testing. In the edge test, highlighted buildings can be detected and eliminated based on the difference between blurred cloud boundaries and distinct building boundaries.
2.3. Parameter Decision
Parameters are determined by experiments. The Gaofen-2 remote sensing subimages are utilized for testing, the values with the highest detection accuracy are selected as the threshold. The parameters in each equation and the values obtained through experiments are shown in Table 2.
Taking the brightness mask as an example, brightness parametric tests were conducted on 24 remote sensing subimages containing highlighted artificial structures, such as buildings with high reflectance roofs, airport runways and turbid water. For each image, 400 pairs of parameter combinations are considered, that is, values between and , both of which ranged from 0.1 to 0.29 with an interval as 0.01. The detection accuracy of the highlighted area is obtained by comparing the ground truth with the detection results. The test results show that when both and are between 0.16 and 0.26, better brightness detection results can be obtained. In this paper, the brightness parameters that achieves the highest mean value of brightness detection accuracy of 24 remote sensing images is selected. The maximum brightness threshold of single visible bands is taken as 0.18 in Equation (9) and the brightness threshold of mean value of brightness is taken as 0.24 in Equation (9). An example of brightness detection test by applying brightness hyperparameters () is shown in Figure 5.
2.4. Evaluation Metrics
Reference cloud map for local and full-scene images were identified manually. F-Measure [43] is a general formula of the weighted harmonic mean of precision and recall and has been widely used in image evaluation [44]. In this article, precision P, recall R, and F-Measure F were employed as region-based evaluation metrics, and are defined respectively as following:
where and correspond to the number of cloud pixels which are extracted and correctly extracted respectively. denotes the number of cloud pixels on the reference map. is a weight index which controls the impact of precision and recall on F-Measure. It is taken as 0.5 in this paper, that is, the precision is dominant. The range of F-Measure is , and the high value reflects high similarity.
3. Results
3.1. Data Set and Experimental Setup
The performance of the proposed method was evaluated mainly on Gaofen-2 high spatial resolution remote sensing images. These multispectral images were obtained after relative radiometric correction and systematic geometric correction. Each Gaofen-2 remote sensing image has 7411 × 7025 pixels (4 m/pixel) with four spectral channels (blue, green, red and near-infrared). These images were taken from March 2015 to November 2018 at 98.6°E to 122.1°E, 29.8°N to 34.6°N, and contain clouds of various morphologies and different thicknesses.
Gaofen-2 full-scene images were cut into several 256 × 256 local images. With reference to the classification of meteorological cloud types defined in the International Cloud Atlas and considering the morphological differences of clouds in multispectral remote sensing images, the clouds in the selected images were divided into six categories: stratus, stratus fractus, altostratus, cumulus, cirrocumulus, stratocumulus.
A total of 100 subimages and 30 full-scene images were selected for the cloud detection experiment in Gaofen-2 remote sensing images. The cloud detection performance for six cloud types was analyzed in local images. Furthermore, the cloud detection performance of each process was tested and discussed. The experiments were also designed to show the detection accuracy based on different background conditions and different cloud thicknesses in full-scene images. In addition, 10 typical wide field view Gaofen-1 remote sensing images with different cloud shapes were utilized for method comparison.
3.2. Detection Performance
A total of 100 subimages and 30 full-scene images were selected for the cloud detection experiment in Gaofen-2 remote sensing images. The cloud detection performance of six types of clouds was analyzed in local images. Meanwhile, the cloud detection performance of each process was tested and discussed. The subimages were visually interpreted and divided into six groups corresponding to six cloud types, i.e., stratus, stratus fractus, cirrocumulus, cumulus, stratocumulus and altostratus. Tests were carried out for different forms of cloud in Gaofen-2 subimages which also contain different background surface objects such as urban areas, rural areas, mountains and water.
The average accuracy of the experimental results on 100 Gaofen-2 subimages is 0.9573, with a variance of 0.0016, while as shown in Table 3, the detection accuracy is different for different cloud types. The experimental results show a superior performance in the extraction of stratocumulus and altostratus. The average F-Measures of these two types of cloud are 0.9672 and 0.9880, respectively. These two types of cloud present a large and continuous distribution area with high cloud coverage. Even if there is a certain missing detection at the edge of thick cloud, the accuracy of cloud detection results is not greatly affected due to the small area of thin cloud at the edge of thick cloud.
The proposed method shows relatively stable performance in the detection of stratus and cumulus. The morphology of cumulus and stratocumulus is similar. The detection accuracy of cumulus (F-Measure as 0.9382) is lower than that of stratocumulus due to the presence of debris clouds. It is worth mentioning that the detection on stratus shows a good effect with the average F-Measure as 0.9327. Although it is relatively thin, the distribution of stratus is continuous, which can be well detected by the proposed algorithm.
The detection accuracies of stratus fractus and cirrocumulus are relatively lower than that of other clouds, with average F-Measures of 0.9091 and 0.9214, respectively. Due to lots of gaps between clouds, the shape of these clouds tends to be more fragmented. For both drawing samples and using clustering algorithm for classification, it is difficult to determine the boundary of the two clouds, which will influence the accuracy of cloud detection to some extent.
The experiments of the cloud detection on different types of clouds are shown in Figure 6. In addition to the stratus fractus with the F-Measure of 0.8814 (Figure 6b), the tests for the other five types of clouds achieved high accuracies. For stratus, like the example in Figure 6a, the clustering method can easily produce clear hierarchical results and the influence caused by artificial constructions can be eliminated after post-processing, which makes the detection result satisfactory. Here is another example of the experiment on stratus to show the results of each step in the proposed cloud detection strategy (Figure 7). The extinction coefficient map was obtained from the radiation transmittance map modified by brightness mask and water mask. After clustering by using K-means algorithm, the grade of cloud density variation can be clearly identified from the clustering result (Figure 7e). Filtering and post-processing were carried out to obtain a further-refined cloud map.
We tested the proposed method on different cloud thicknesses using 30 Gaofen-2 remote sensing images. The performance of the proposed method on full-scene images is similar to that of local images, with an average accuracy of 0.9517. The cloud detection examples of six Gaofen-2 remote sensing images are shown in Figure 8. In full-scene images test, due to the high reflectance of thick clouds, there is a great difference between the reflectance of non-cloud covered surfaces and that of thick clouds. Therefore, the accuracy of detection for thick clouds with large areas will be higher than that of clastic clouds, like Figure 8a with F-Measure of 0.9780.
The proposed algorithm can achieve satisfactory results on images taken in rural or mountainous areas with low reflectance values, as well as in urban areas. For clouds covering urban areas, the detection results of the method are shown in Figure 9. The detection results which are generally regarded as “cloud” in the image can be obtained like block clouds and clastic clouds in Figure 9d. It is worth noting that the urban area in the left half of Figure 9a has higher reflectance than that in other urban areas. The uniform variation of reflectance is different from that caused by the thin cloud in Figure 8f, which may be caused by aerosols over the urban area. If we choose a loose condition, i.e., we decrease and increase when filtering the clustering result of extinction coefficient map as the coarse cloud mask, the detection results will contain aerosols (Figure 9e). Here, we change the condition so that the coarse cloud mask contains the second cluster class. In the research of earth observation, it is very arduous to obtain the real surface reflectance value via inversion because of the abnormal surface reflectance caused by aerosols, especially for the remote sensing image such as Gaofen-2 image, which is lack of spectral bands to be used. Therefore, it is also necessary to take account of aerosols and thin clouds in cloud detection. The proposed strategy can also detect aerosols with a less stringent parameter (Figure 9e).
The detailed performance of the method can be analyzed by means of the example in Figure 9. A comparison of Figure 9d,e shows that more accurate detection results are obtained for the regions i–iii in Figure 9e. Thin clouds connected to thick clouds in i or independent thin clouds in region ii and region iii can all be detected under relaxed conditions. As can be seen from Figure 9b, there are some fragments with lower extinction coefficient produced by the modified radiation transmittance which helps to eliminate some false detection pixels, such as buildings in the lower right corner of the image.
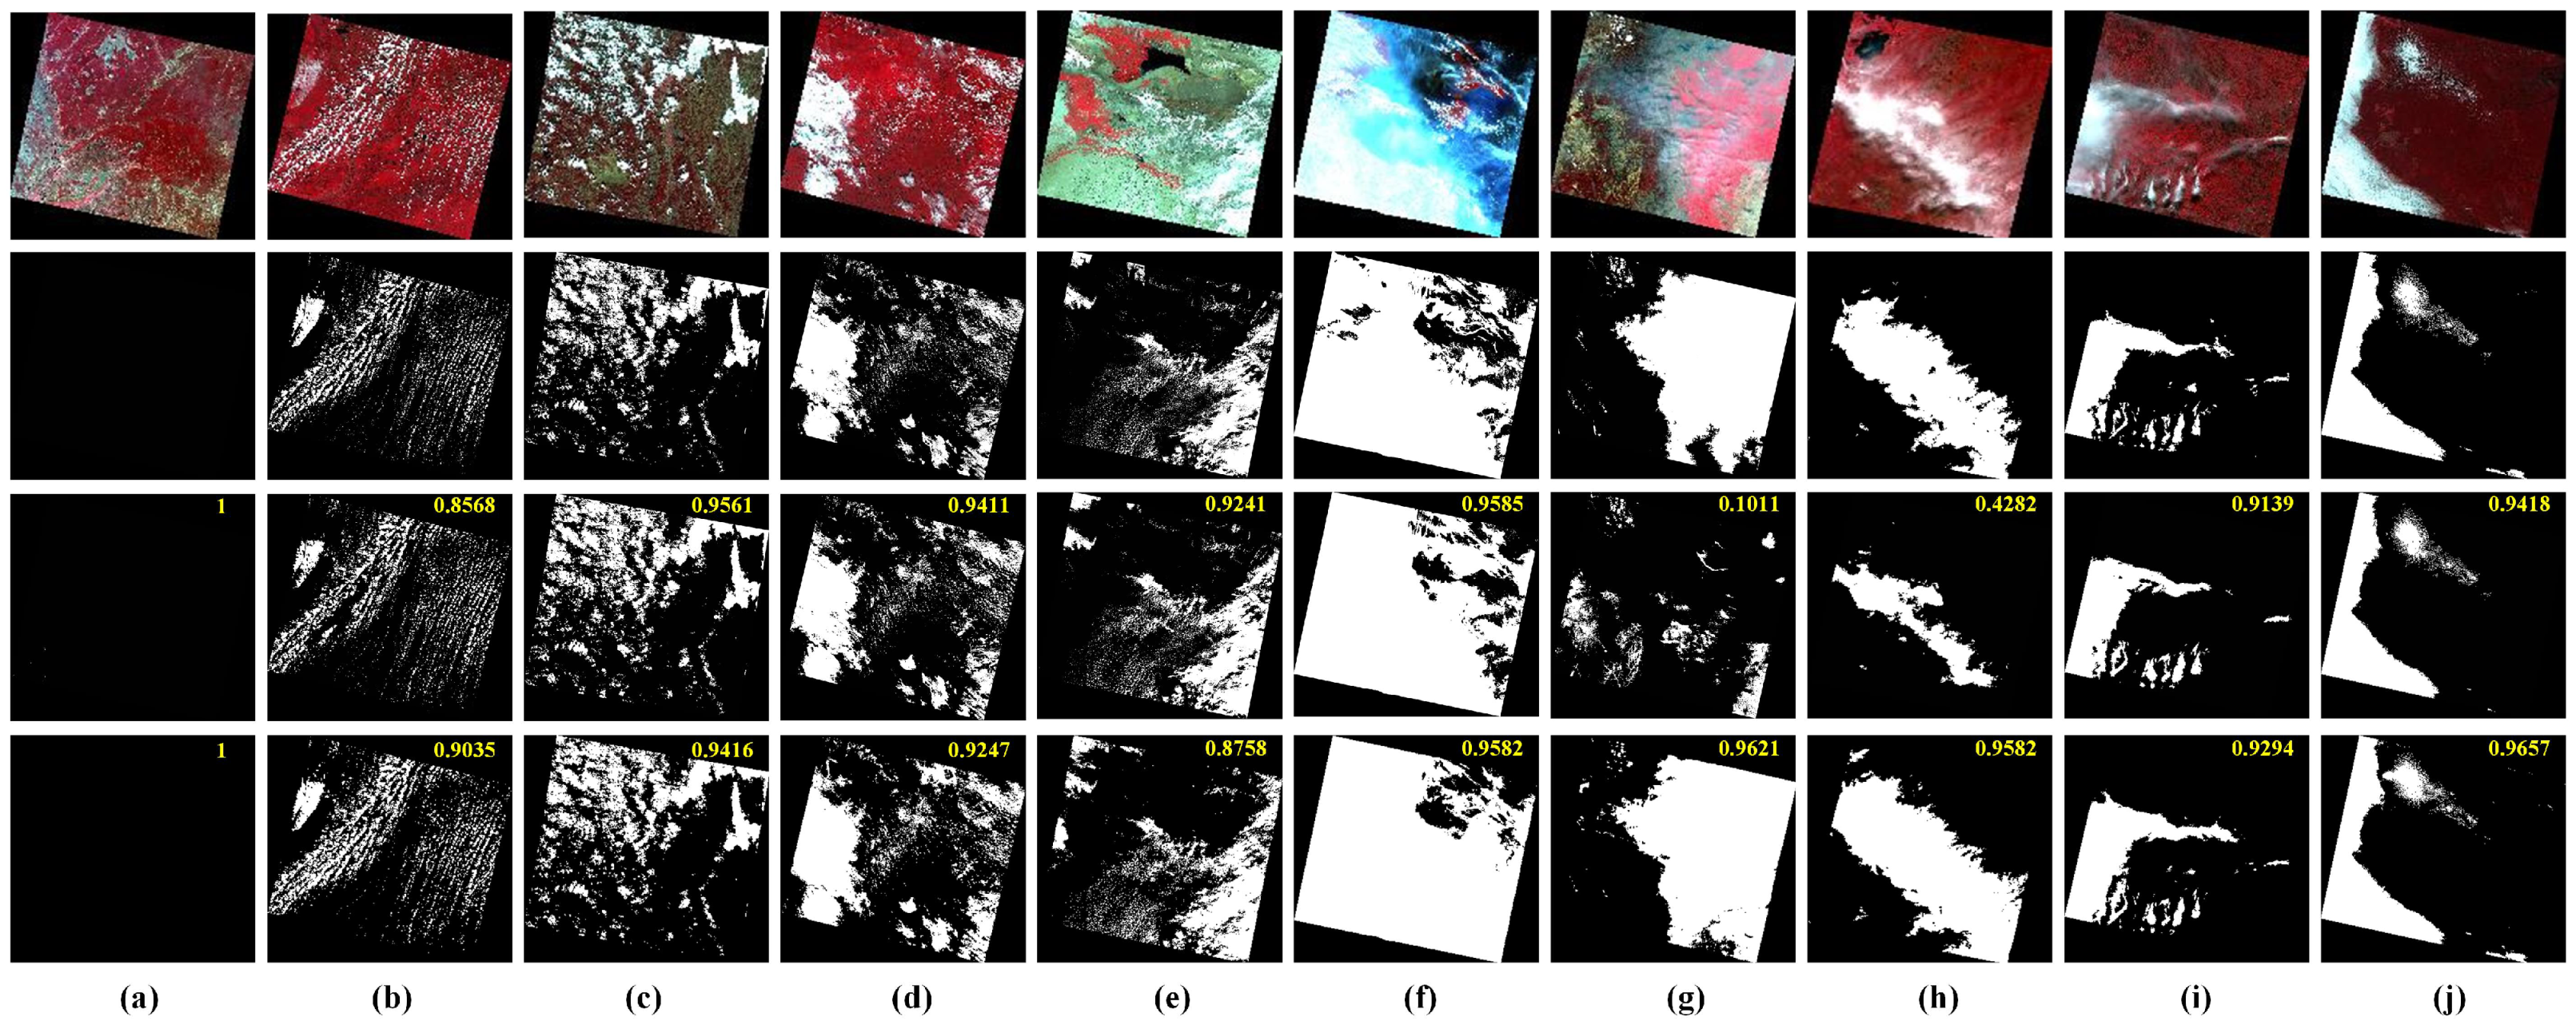
In order to test the cross-platform robustness of the algorithm and compare it with the existing similar algorithm, Gaofen-1 wide field view images containing different forms of clouds and various surface types of ground were selected in the given dataset [17]. The presented algorithm is applied to ten Gaofen-1 full-scene remote sensing images for cloud detection, and our algorithm is compared with that of Zhang’s algorithm [17] to derive the cloud extraction effect. Zhang’s method, that is, the multi-feature combined (MFC) algorithm, generates the preliminary cloud mask based on spectral features and mask refinement. Our algorithm is based on the modified radiation transmittance to produce the coarse cloud mask. In post-processing, geometric and texture features are exploited in different ways, and edge features are added, allowing for better error removal.
Except for Figure 10g,h with large differences in accuracy, the average cloud detection accuracy of the other eight images is 0.9374, which is slightly higher than that of the comparison algorithm with the average accuracy of 0.9365. For the non-cloud-covered highlighted surface in the remote sensing image (Figure 10a), neither the proposed algorithm nor the comparison algorithm detects clouds. For the detection accuracy of scattered small clouds, our algorithm and the comparison algorithm have little difference in the average detection accuracy with 0.9114 and 0.9195 in Figure 10b–e.
The obvious advantage of the proposed algorithm is in the detection of large-area thin clouds. As shown in Figure 10g, the large area of thin clouds in the image are not detected by the comparison algorithm, and some false detections occur on the ground surfaces with high brightness. The detection accuracy of the proposed method is 0.9621 in Figure 10g, while the accuracy of comparison algorithm is only 0.1011. Our algorithm can achieve better performance at the edge of thick clouds like the thin clouds around the large-area massive clouds in Figure 10h. With the given reference cloud mask as the ground truth, the accuracy of the comparison algorithm is 0.4282. Our algorithm can detect these thin clouds which are ignored in the comparison algorithm, with an accuracy of 0.9582.
4. Discussion
The challenge of removing complex ground features in cloud detection, especially eliminating the impact caused by highlighted ground surfaces, still has been a problem to be solved in the research of cloud detection algorithms. The modified radiation transmittance map for cloud detection proposed in this paper is focused on reducing the impact of buildings with high reflectance on cloud detection, thus enabling the extraction of clouds by a simple and efficient machine learning method. The three-step post-processing can also help to further eliminate most part of errors caused by highlighted ground objects. By experiments on Gaofen-2 full-scene images, the proposed method can eliminate the interference of ground objects and shows good adaptability to different ground feature conditions.
The exploration of different types of clouds is lacking in previous studies. The influence of cloud morphology and thickness on cloud detection cannot be ignored. In this paper, six representative cloud types are selected according to their characteristics, and the effectiveness of the method for detecting each type of cloud is analyzed. The method can achieve good detection results for different cloud types. Meanwhile, the feasibility and advantages of the cloud detection method are verified by a large number of local images.
There are many algorithms that can achieve excellent detection performance in clouds that completely obscure the surface, but will ignore the detection of thin clouds. These thin clouds cannot completely mask the spectral reflections of ground surfaces, so that we can still observe ground features through the clouds in the remote sensing images. Some thin clouds are objects of interest in the fields of pre-processing for quantitative remote sensing and environmental monitoring applications. The proposed method in this paper is more advantageous in the detection of thin clouds compared to similar algorithms because of using the modified radiation transmittance map. It can be seen from the detection effect of sheet thin cloud in the Figure 10 that our cloud detection method is more effective for thin cloud detection in remote sensing images, compared to the similar detection algorithm on Gaofen-1 full-scene images.
In the detection of different types of clouds, some small gaps in the middle of the cloud are usually found at the boundary of thick clouds (like cirrocumulus cloud mass), and covered by thin clouds (Figure 6c). Since the proposed method is sensitive to thin clouds, it will produce continuous large area detection results for small dense cloud patches, which is not due to detection errors. Cloud density can be intuitively reflected by different extinction coefficient values of clouds. The method in this paper can obtain different cloud maps by using different judgment conditions in the clustering process. If the selection condition of the clustering result is relaxed, more thin clouds can be detected. On the contrary, if the condition is strict, only thick clouds will be included in the cloud detection results. Hence, it provides the possibility for researchers to obtain cloud detection results with different cloud thicknesses according to the specific research purpose.
In addition, as shown in Figure 9e, some misdetections caused by the modification such as those missed detection pixels in region ivand some residual errors such as buildings in region v, should also be noticed. Methods to eliminate these errors need to be further investigated. It is also worth noting that, most existing K-means-type clustering algorithms consider only the dispersion among the objects, but the distance between centroids also plays an important role [45]. Therefore, the K-means clustering method applied in this paper also needs to be improved.
5. Conclusions
In this study, a cloud detection method for Gaofen-2 multispectral remote sensing imagery is proposed. The radiation transmittance is first estimated and modified by the brightness mask and the water mask to reduce the effect of highlighted ground objects. The extinction coefficient derived from the modified radiation transmittance is utilized to describe the thickness of cloud. Then the extinction coefficient map is clustered to produce a coarse cloud map. A three-step post-processing combined with geometric, texture and edge features is introduced to eliminate some misdetection pixels and to obtain the cloud map at final.
The cloud detection experiments were designed on six categories of clouds with different thicknesses and shapes in Gaofen-2 subimages and full-scene images, and comparative experiments were carried out on Gaofen-1 full-scene images. According to the experimental results, the cloud thickness can be well described by the extinction coefficient map based on the modified radiation transmittance, which allows the proposed method to better identify clouds of different thicknesses, especially thin clouds, and to adapt to different backgrounds. In addition, the strategy proposed in this paper can effectively remove the interference of highlighted surface objects such as buildings, and retain the structural characteristics of clouds to a large extent, making the cloud detection accuracy reach 0.95.
Author Contributions
Conceptualization, Y.L.; methodology, L.H.; software, L.H.; validation, Y.Z. and L.H.; formal analysis, Y.L.; investigation, Z.W.; resources, Z.W.; data curation, Y.Z.; writing—original draft preparation, L.H.; writing—review and editing, Y.Z.; visualization, Z.W.; supervision, Y.L.; project administration, Y.L.; funding acquisition, Y.L. All authors have read and agreed to the published version of the manuscript.
Funding
This research was funded by the Shanghai “Science and Technology Innovation Action Plan” research project (NO. 20dz1201200), and the National Natural Science Foundation of China under Grant (NO. 41771449).
Data Availability Statement
Not applicable.
Conflicts of Interest
The authors declare no conflict of interest.
References
- Chen, B.; Huang, B.; Xu, B. Multi-source remotely sensed data fusion for improving land cover classification. ISPRS J. Photogramm. Remote Sens. 2017, 124, 27–39. [Google Scholar] [CrossRef]
- Pellikka, P.K.E.; Heikinheimo, V.; Hietanen, J.; Schfer, E.; Siljander, M.; Heiskanen, J. Impact of land cover change on aboveground carbon stocks in Afromontane landscape in Kenya. Appl. Geogr. 2018, 94, 178–189. [Google Scholar] [CrossRef]
- Hongtao, D.; Zhigang, C.; Ming, S.; Dong, L.; Qitao, X. Detection of illicit sand mining and the associated environmental effects in China’s fourth largest freshwater lake using daytime and nighttime satellite images. Sci. Total Environ. 2018, 647, 606–618. [Google Scholar]
- Bo, P.; Fenzhen, S.; Yunshan, M. A cloud and cloud shadow detection method based on fuzzy c-means algorithm. IEEE J. Sel. Top. Appl. Earth Observ. Remote Sens. 2020, 13, 1714–1727. [Google Scholar] [CrossRef]
- Huang, C.; Thomas, N.; Goward, S.N.; Masek, J.G.; Townshend, J. Automated masking of cloud and cloud shadow for forest change analysis using Landsat images. Int. J. Remote Sens. 2010, 31, 5464–5549. [Google Scholar] [CrossRef]
- Mohajerani, S.; Krammer, T.A.; Saeedi, P. Cloud detection algorithm for remote sensing images using fully convolutional neural networks. In Proceedings of the IEEE 20th International Workshop on Multimedia Signal Processing, Vancouver, BC, Canada, 29–31 August 2018. [Google Scholar]
- Zhai, H.; Zhang, H.; Zhang, L.; Li, P. Cloud/shadow detection based on spectral indices for multi/hyperspectral optical remote sensing imagery. ISPRS J. Photogramm. Remote Sens. 2018, 144, 235–253. [Google Scholar] [CrossRef]
- Champion, N. Automatic cloud detection from multi-temporal satellite images: Towards the use of pléiades time series. ISPRS Int. Arch. Photogramm. Remote Sens. Spat. Inf. Sci. 2012, XXXIX-B3, 559–564. [Google Scholar] [CrossRef]
- Lin, C.H.; Lin, B.Y.; Lee, K.Y.; Chen, Y.C. Radiometric normalization and cloud detection of optical satellite images using invariant pixels. ISPRS J. Photogramm. Remote Sens. 2015, 106, 107–117. [Google Scholar] [CrossRef]
- Xiaolin, Z.; Helmer, E.H. An automatic method for screening clouds and cloud shadows in optical satellite image time series in cloudy regions. Remote Sens. Environ. 2018, 214, 135–153. [Google Scholar]
- Zhang, X.; Wang, H.; Che, H.Z.; Tan, S.C.; Yao, X.P. The impact of aerosol on MODIS cloud detection and property retrieval in seriously polluted East China. Sci. Total Environ. 2019, 711, 134634. [Google Scholar] [CrossRef]
- Zhu, Z.; Woodcock, C.E. Object-based cloud and cloud shadow detection in Landsat imagery. Remote Sens. Environ. 2012, 118, 83–94. [Google Scholar] [CrossRef]
- Irish, R.R.; Barker, J.L.; Goward, S.N.; Arvidson, T. Characterization of the Landsat-7 ETM+ Automated Cloud-Cover Assessment (ACCA) algorithm. Photogramm. Eng. Remote Sens. 2006, 72, 1179–1188. [Google Scholar] [CrossRef] [Green Version]
- Xie, F.; Shi, M.; Shi, Z.; Yin, J.; Zhao, D. Multilevel cloud detection in remote sensing images based on deep learning. IEEE J. Sel. Top. Appl. Earth Observ. Remote Sens. 2017, 10, 3631–3640. [Google Scholar] [CrossRef]
- Zhu, Z.; Wang, S.; Woodcock, C.E. Improvement and expansion of the Fmask algorithm: Cloud, cloud shadow, and snow detection for Landsats 4–7, 8, and Sentinel 2 images. Remote Sens. Environ. 2015, 159, 269–277. [Google Scholar] [CrossRef]
- Wei, J.; Huang, W.; Li, Z.; Sun, L.; Cribb, M. Cloud detection for Landsat imagery by combining the random forest and superpixels extracted via energy-driven sampling segmentation approaches. Remote Sens. Environ. 2020, 248, 112005. [Google Scholar] [CrossRef]
- Zhiwei, L.; Huifang, S.; Huifang, L.; Guisong, X.; Paolo, G.; Liangpei, Z. Multi-feature combined cloud and cloud shadow detection in GaoFen-1 wide field of view imagery. Remote Sens. Environ. 2017, 191, 342–358. [Google Scholar]
- Foga, S.; Scaramuzza, P.L.; Guo, S.; Zhu, Z.; Dilley, R.D.; Beckmann, T.; Schmidt, G.L.; Dwyer, J.L.; Joseph Hughes, M.; Laue, B. Cloud detection algorithm comparison and validation for operational Landsat data products. Remote Sens. Environ. 2017, 194, 379–390. [Google Scholar] [CrossRef]
- Katelyn, T.; Xiaojing, T.; Jeffrey, G.M.; Martin, C.; Junchang, J.; Shi, Q.; Zhe, Z.; Curtis, E.W. Comparison of cloud detection algorithms for Sentinel-2 imagery. Sci. Remote Sens. 2020, 2, 100010. [Google Scholar]
- Zhong, B.; Chen, W.; Wu, S.; Hu, L.; Luo, X.; Liu, Q. A cloud detection method based on relationship between objects of cloud and cloud-shadow for chinese moderate to high resolution satellite imagery. IEEE J. Sel. Top. Appl. Earth Observ. Remote Sens. 2017, 10, 4898–4908. [Google Scholar] [CrossRef]
- Sun, L.; Zhou, X.; Wei, J.; Wang, Q.; Liu, X.; Shu, M.; Chen, T.; Chi, Y.; Zhang, W. A new cloud detection method supported by GlobeLand30 data set. IEEE J. Sel. Top. Appl. Earth Observ. Remote Sens. 2018, 11, 3628–3645. [Google Scholar] [CrossRef]
- Trepte, Q.Z.; Minnis, P.; Sun-Mack, S.; Yost, C.R.; Chen, Y.; Jin, Z.; Hong, G.; Chang, F.L.; Smith, W.L.; Bedka, K.M.a. Global cloud detection for CERES edition 4 using Terra and Aqua MODIS data. IEEE Trans. Geosci. Remote Sens. 2019, 57, 9410–9449. [Google Scholar] [CrossRef]
- Tang, H.; Yu, K.; Hagolle, O.; Jiang, K.; Geng, X.; Zhao, Y. A cloud detection method based on a time series of MODIS surface reflectance images. Int. J. Digit. Earth 2013, 6, 157–171. [Google Scholar] [CrossRef]
- Zhang, X.; Tan, S.C.; Shi, G.Y.; Wang, H. Improvement of MODIS cloud mask over severe polluted eastern China. Sci. Total Environ. 2018, 654, 345–355. [Google Scholar] [CrossRef] [PubMed]
- Adrian, F. Cloud and cloud-shadow detection in SPOT5 HRG imagery with automated morphological feature extraction. Remote Sens. 2014, 6, 776–800. [Google Scholar]
- Turner, J.; Marshall, G.J.; Ladkin, R.S. An operational, real-time cloud detection scheme for use in the Antarctic based on AVHRR data. Int. J. Remote Sens. 2001, 22, 3027–3046. [Google Scholar] [CrossRef]
- Hégarat-Mascle, S.A.; Andre, C. Use of Markov Random Fields for automatic cloud/shadow detection on high resolution optical images. ISPRS J. Photogramm. Remote Sens. 2009, 64, 351–366. [Google Scholar]
- Latry, C.; Panem, C.; Dejean, P. Cloud detection with SVM technique. In Proceedings of the IEEE International Geoscience and Remote Sensing Symposium, Boston, MA, USA, 6–11 July 2008. [Google Scholar]
- Segal-Rozenhaimer, M.; Li, A.; Das, K.; Chirayath, V. Cloud detection algorithm for multi-modal satellite imagery using convolutional neural-networks (CNN). Remote Sens. Environ. 2020, 237, 111446. [Google Scholar] [CrossRef]
- Li, Y.; Chen, W.; Zhang, Y.; Tao, C.; Tan, Y. Accurate cloud detection in high-resolution remote sensing imagery by weakly supervised deep learning. Remote Sens. Environ. 2020, 250, 112045. [Google Scholar] [CrossRef]
- Chavez, P.S. An improved dark-object subtraction technique for atmospheric scattering correction of multispectral data. Remote Sens. Environ. 1988, 24, 459–479. [Google Scholar] [CrossRef]
- Zhang, Y.; Guindon, B.; Cihlar, J. An image transform to characterize and compensate for spatial variations in thin cloud contamination of Landsat images. Remote Sens. Environ. 2002, 82, 173–187. [Google Scholar] [CrossRef]
- Aliaksei, M.; Rudolf, R.; Rupert, M.; Peter, R. Haze detection and removal in remotely sensed multispectral imagery. IEEE Trans. Geosci. Remote Sens. 2014, 52, 5895–5905. [Google Scholar]
- Qi, L.; Xinbo, G.; Lihuo, H.; Lu, W. Haze removal for a single visible remote sensing image. Signal Process. 2017, 137, 33–43. [Google Scholar]
- He, K.; Jian, S.; Fellow; IEEE; Tang, X. Single image haze removal using dark channel prior. IEEE Trans. Pattern Anal. Mach. Intell. 2011, 33, 2341–2353. [Google Scholar]
- Middleton, W. Vision Through the Atmosphere; University of Toronto Press: Toronto, ON, Canada, 1952. [Google Scholar]
- Fattal, R. Single image dehazing. ACM Trans. Graph. 2008, 27, 1–9. [Google Scholar] [CrossRef]
- Cozman, F.; Krotkov, E. Depth from scattering. In Proceedings of the Conference on Computer Vision and Pattern Recognition Workshops (CVPRW), Boston, MA, USA, 7–12 June 1997. [Google Scholar]
- McFeeters, S.K. The use of the Normalized Difference Water Index (NDWI) in the delineation of open water features. Int. J. Remote Sens. 1996, 17, 1425–1432. [Google Scholar] [CrossRef]
- Jain, A.K. Data clustering: 50 years beyond K-means. Pattern Recognit. Lett. 2010, 31, 651–666. [Google Scholar] [CrossRef]
- Zahra, S.; Ghazanfar, M.A.; Khalid, A.; Azam, M.A.; Naeem, U.; Prugel-Bennett, A. Novel centroid selection approaches for KMeans-clustering based recommender systems. Inf. Sci. 2015, 320, 156–189. [Google Scholar] [CrossRef]
- Zhang, X.; Xiao, P.; Feng, X.; Yuan, M. Separate segmentation of multi-temporal high-resolution remote sensing images for object-based change detection in urban area. Remote Sens. Environ. 2017, 201, 243–255. [Google Scholar] [CrossRef]
- Rijsbergen, C.J.V. Information Retrieval, 2nd ed.; Butterworth-Heinemann: Oxford, UK, 1979. [Google Scholar]
- Peng, B.; Zhang, L.; Mou, X.; Yang, M.H. Evaluation of segmentation quality via adaptive composition of reference segmentations. IEEE Trans. Pattern Anal. Mach. Intell. 2017, 39, 1929–1941. [Google Scholar] [CrossRef]
- Huang, X.; Ye, Y.; Zhang, H. Extensions of kmeans-type algorithms: A new clustering framework by integrating intracluster compactness and intercluster separation. IEEE Trans. Neural Netw. Learn Syst. 2014, 25, 1433–1446. [Google Scholar] [CrossRef]
Figure 1.
Flow diagram of the proposed cloud detection approach.
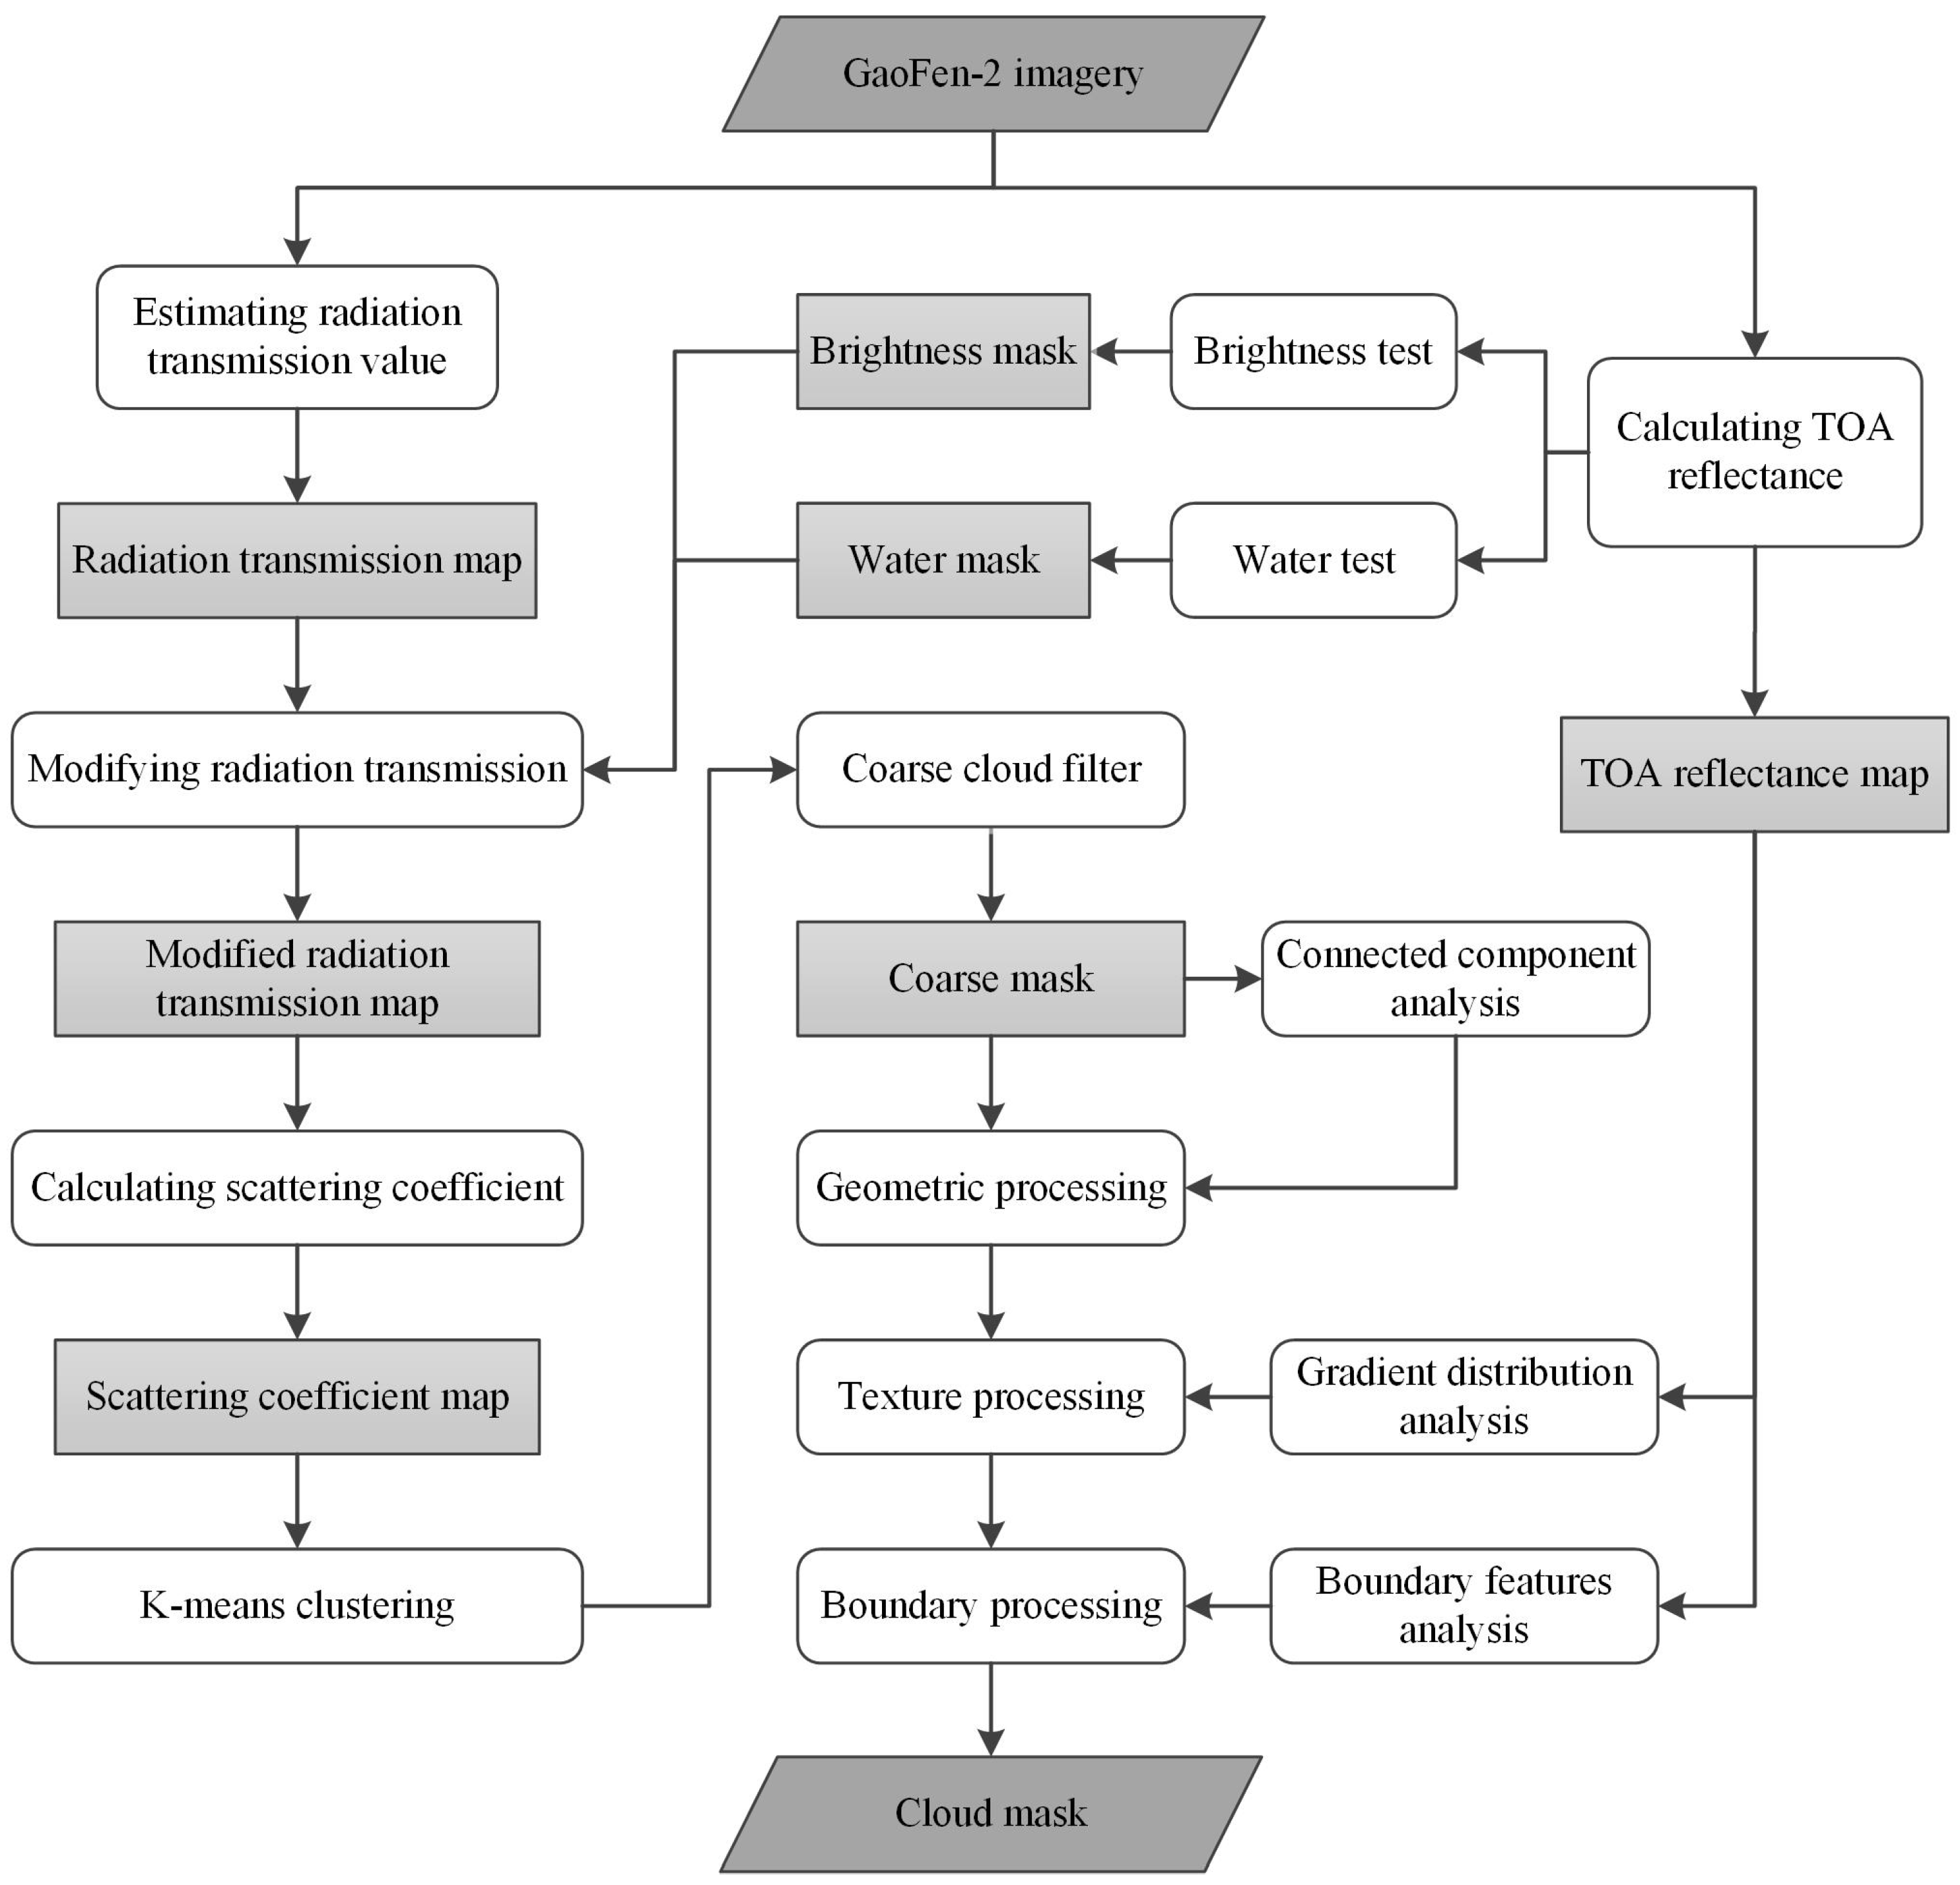
Figure 2.
An example of radiation transmittance modification. (a). Gaofen-2 subimage. (b). The addition of brightness mask and water mask. (c). The radiation transmittance estimation. (d). The modified radiation transmittance.
Figure 2.
An example of radiation transmittance modification. (a). Gaofen-2 subimage. (b). The addition of brightness mask and water mask. (c). The radiation transmittance estimation. (d). The modified radiation transmittance.
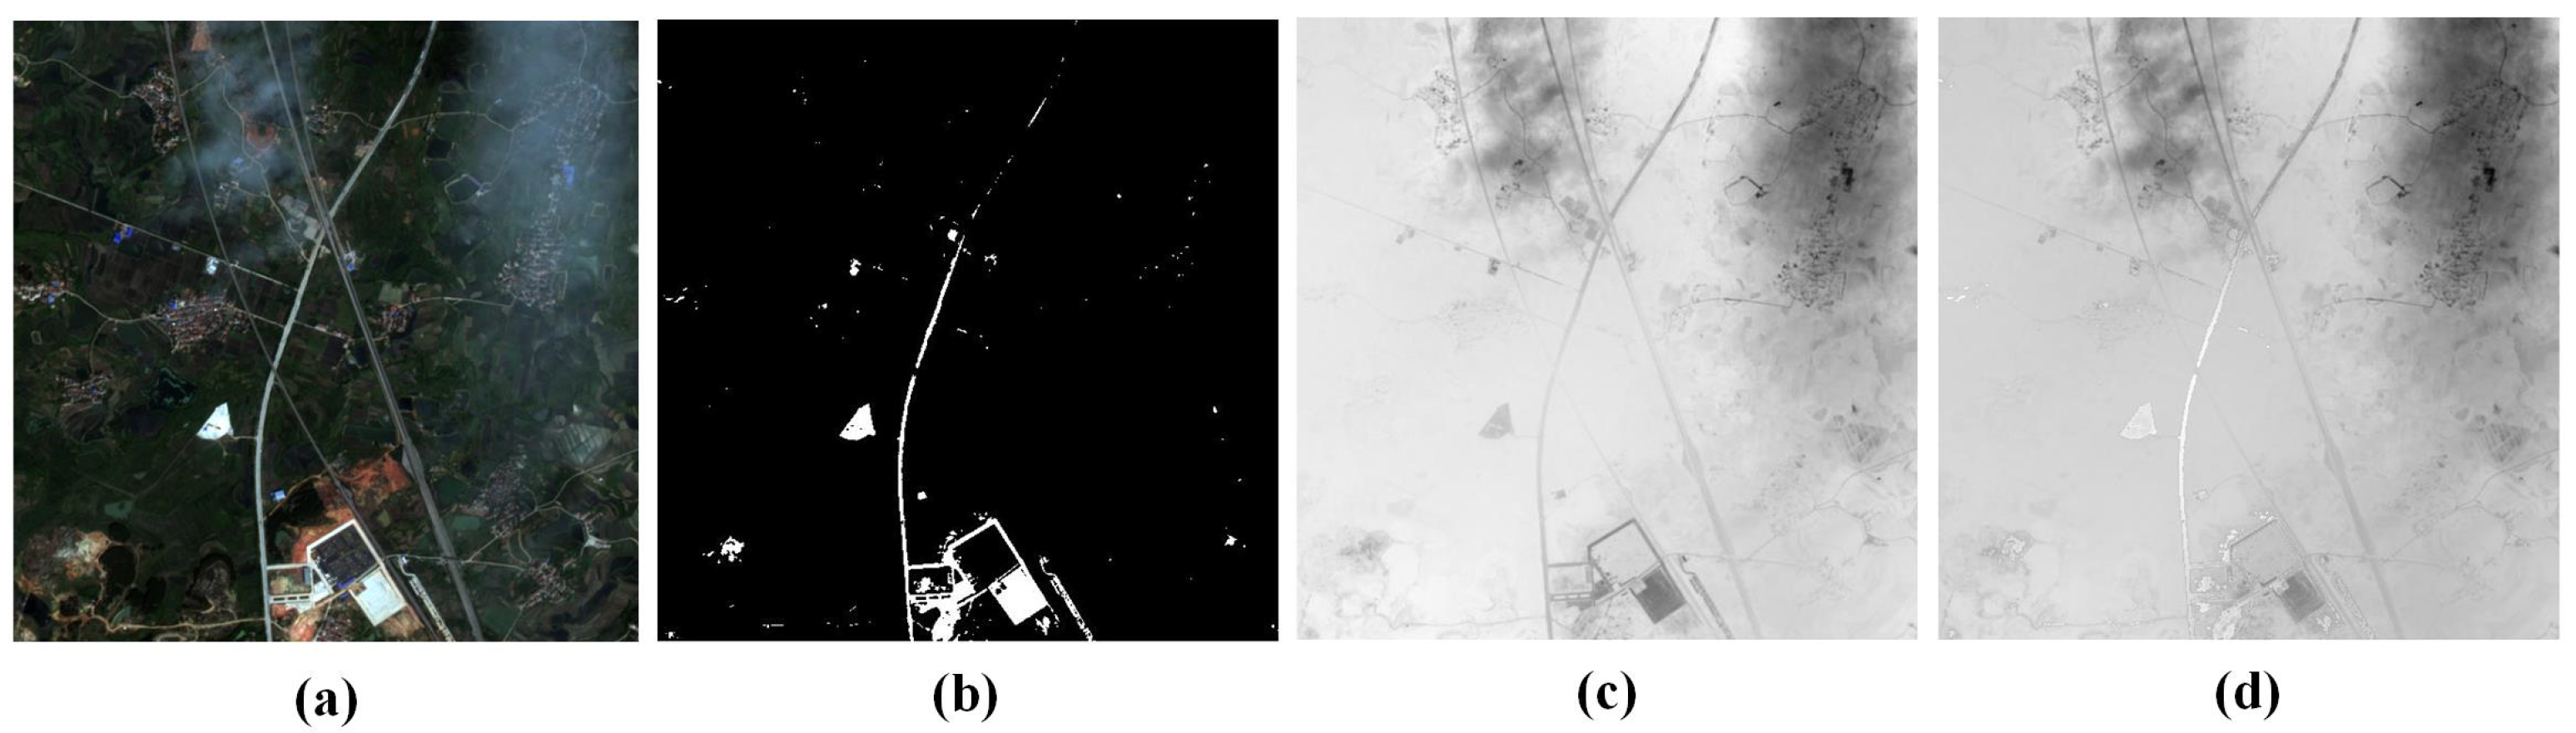
Figure 3.
An example of clustering results and optimal cloud maps with different number of clusters (The clustering class with higher average reflectance corresponds to higher gray value on the clustering map). (a). Gaofen-2 image. (b). CCM (c = 2). (c). CCM (c = 3). (d). CCM (c = 4). (e). CCM (c = 5). (c1). Clustering image (c = 3). (d1). Clustering image (c = 4). (e1). Clustering image (c = 5).
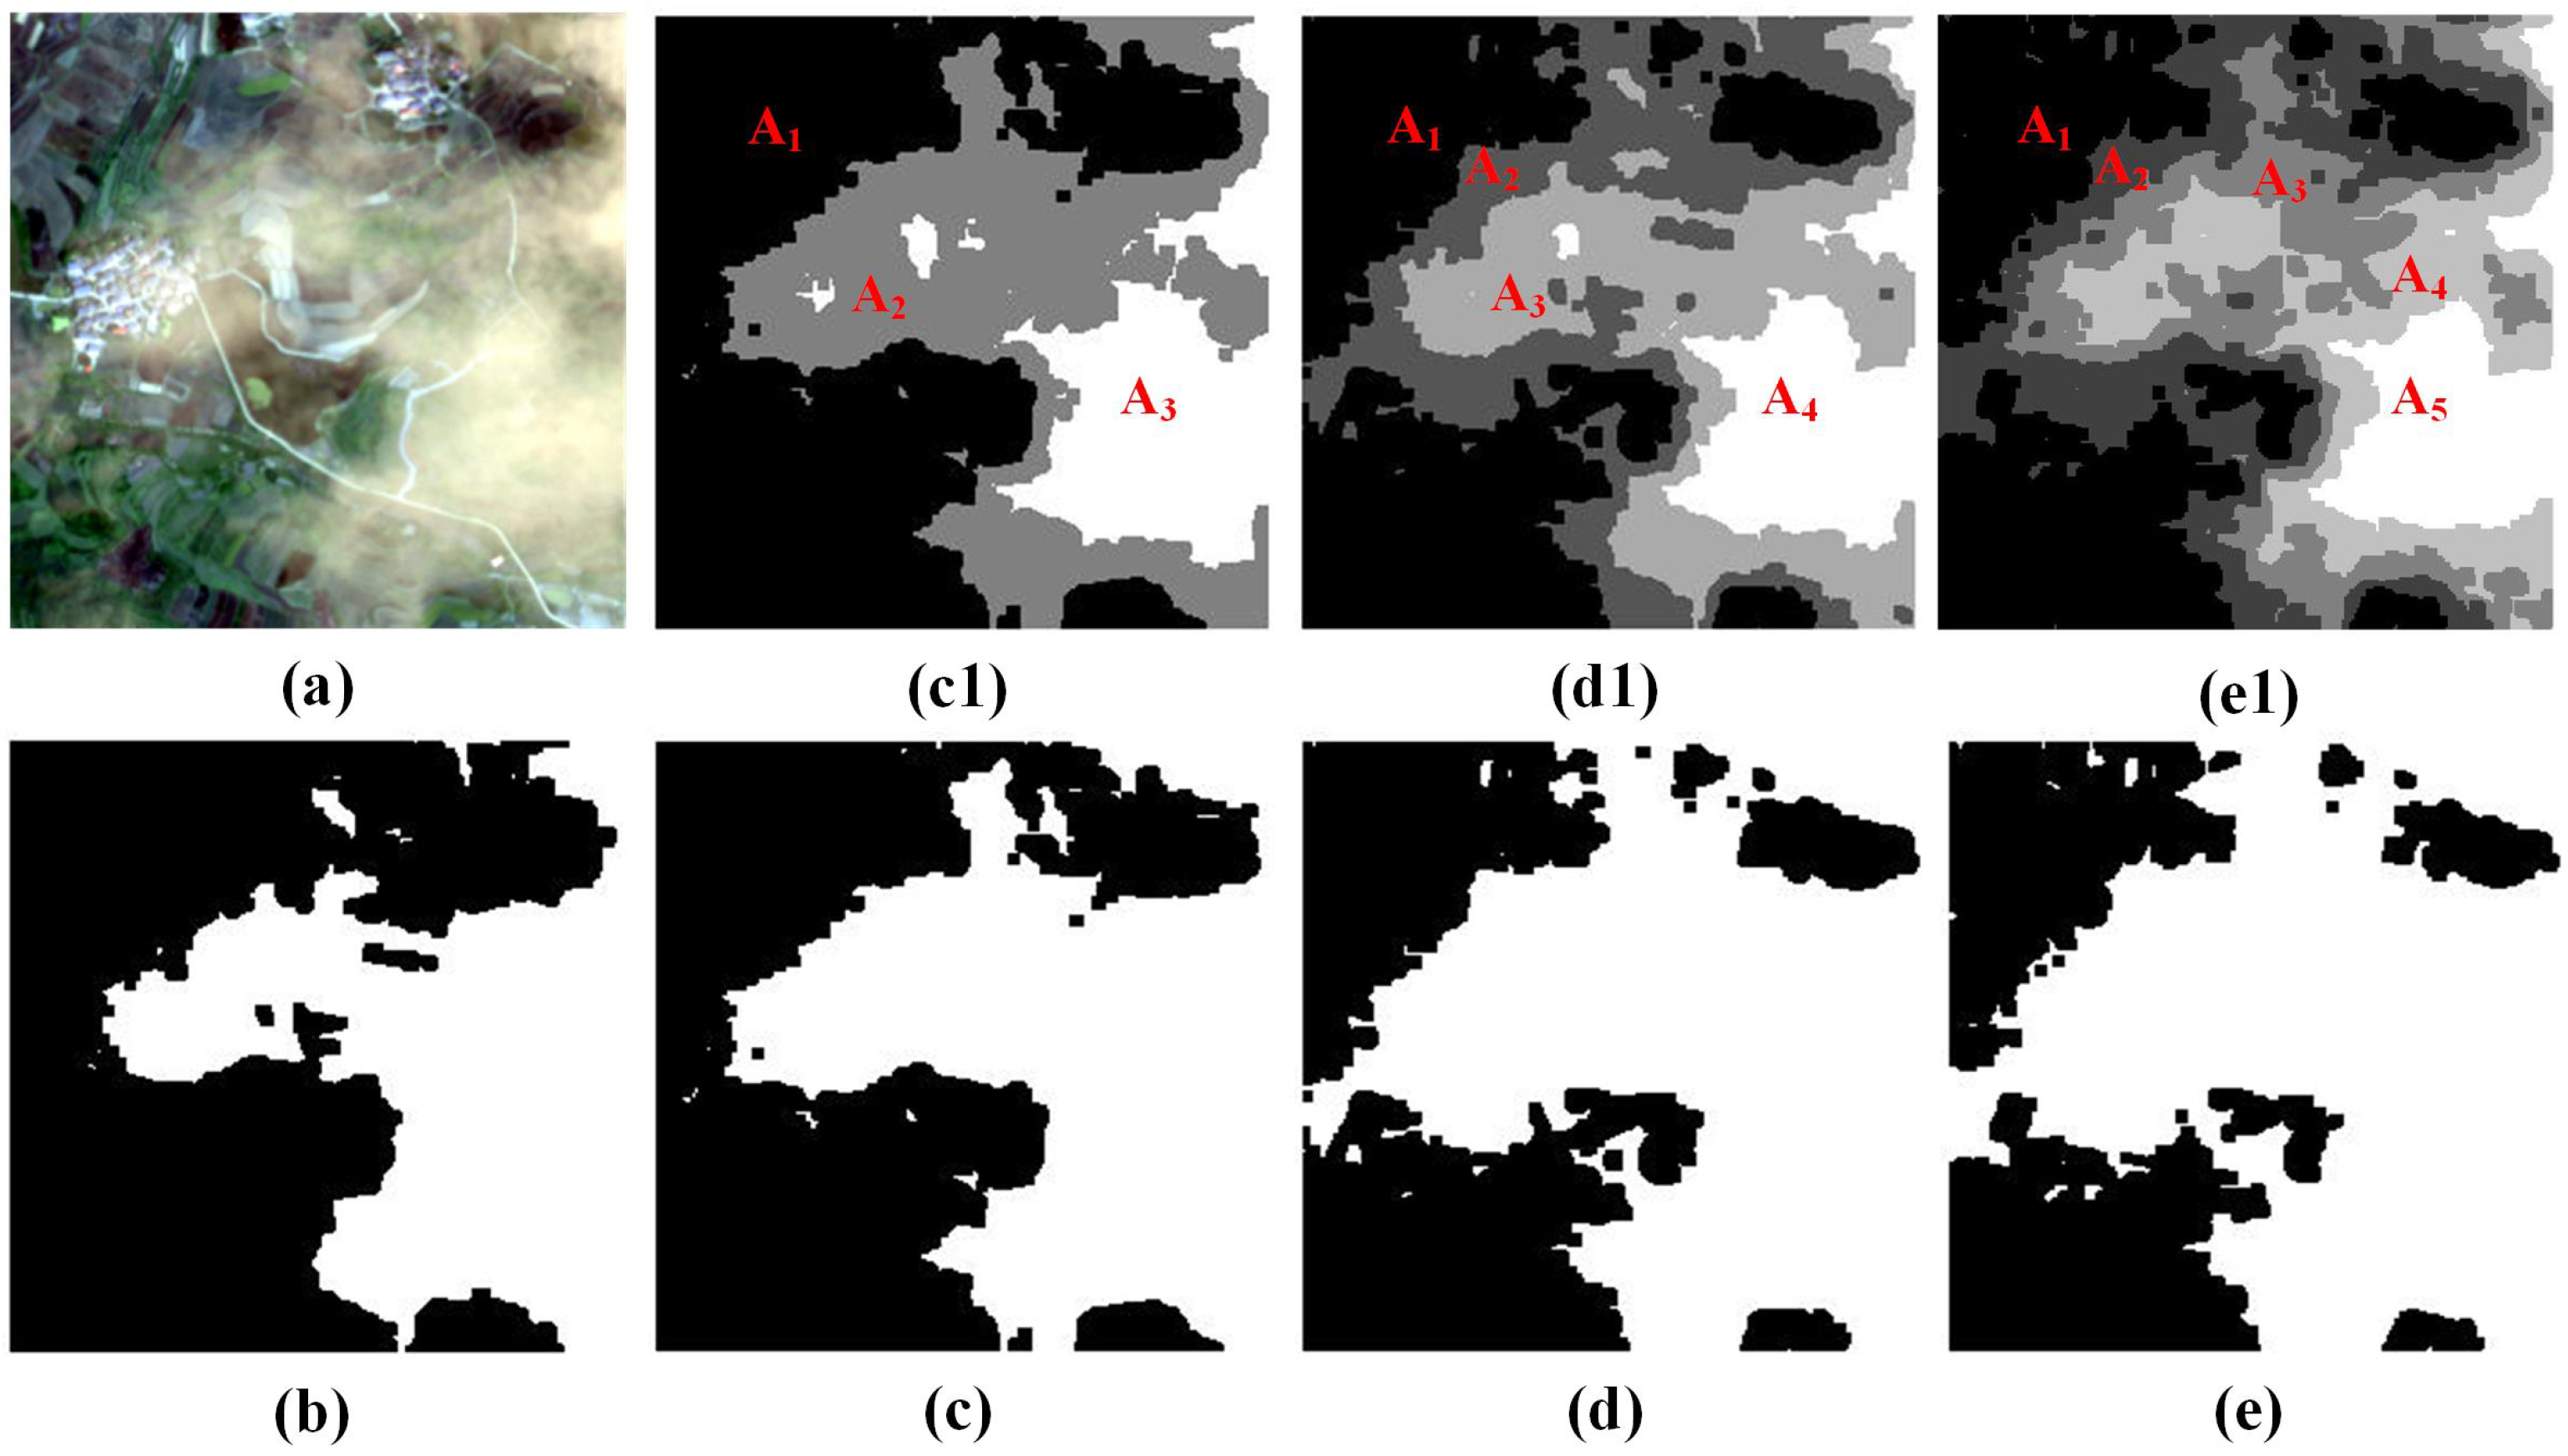
Figure 4.
An example of edge testing. (a). Gaofen-2 subimage. (b). Cloud map before the edge test. The roof of the building was wrongly identified as cloud. (c). Cloud map after the edge test.
Figure 4.
An example of edge testing. (a). Gaofen-2 subimage. (b). Cloud map before the edge test. The roof of the building was wrongly identified as cloud. (c). Cloud map after the edge test.
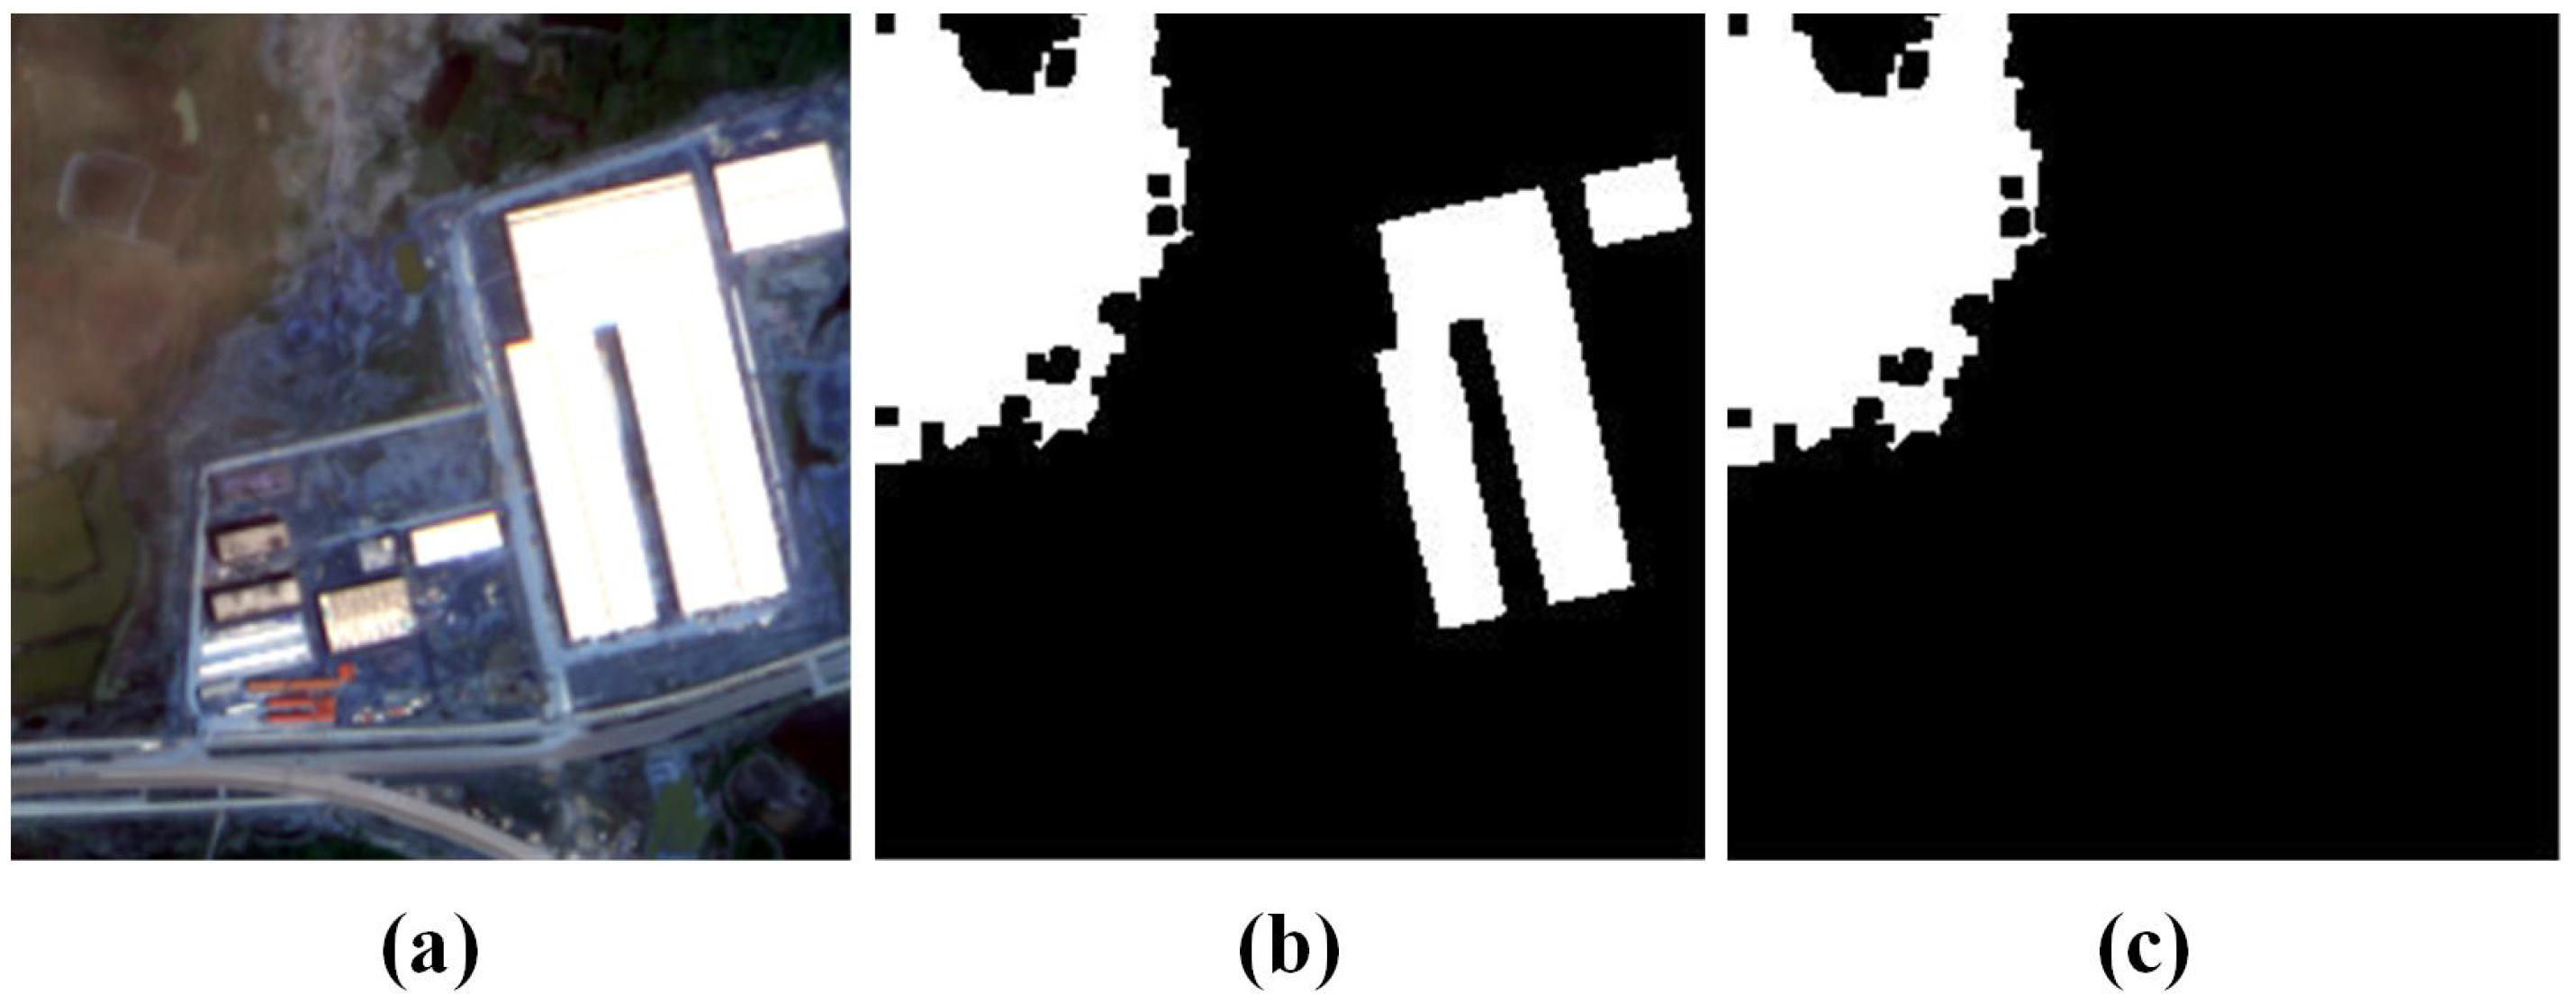
Figure 5.
Remote sensing subimages (left), the corresponding ground truth (middle), and the brightness detection results (right) for brightness hyperparameters test.
Figure 5.
Remote sensing subimages (left), the corresponding ground truth (middle), and the brightness detection results (right) for brightness hyperparameters test.

Figure 6.
The experimental results of the proposed method in Gaofen-2 subimges. The remote sensing subimages are in the first row and the corresponding cloud types in (a–f) are stratus, stratus fractus, cirrocumulus, cumulus, stratocumulus and altostratus. The images in the second row are the ground truth.The experimental results are in the third row.
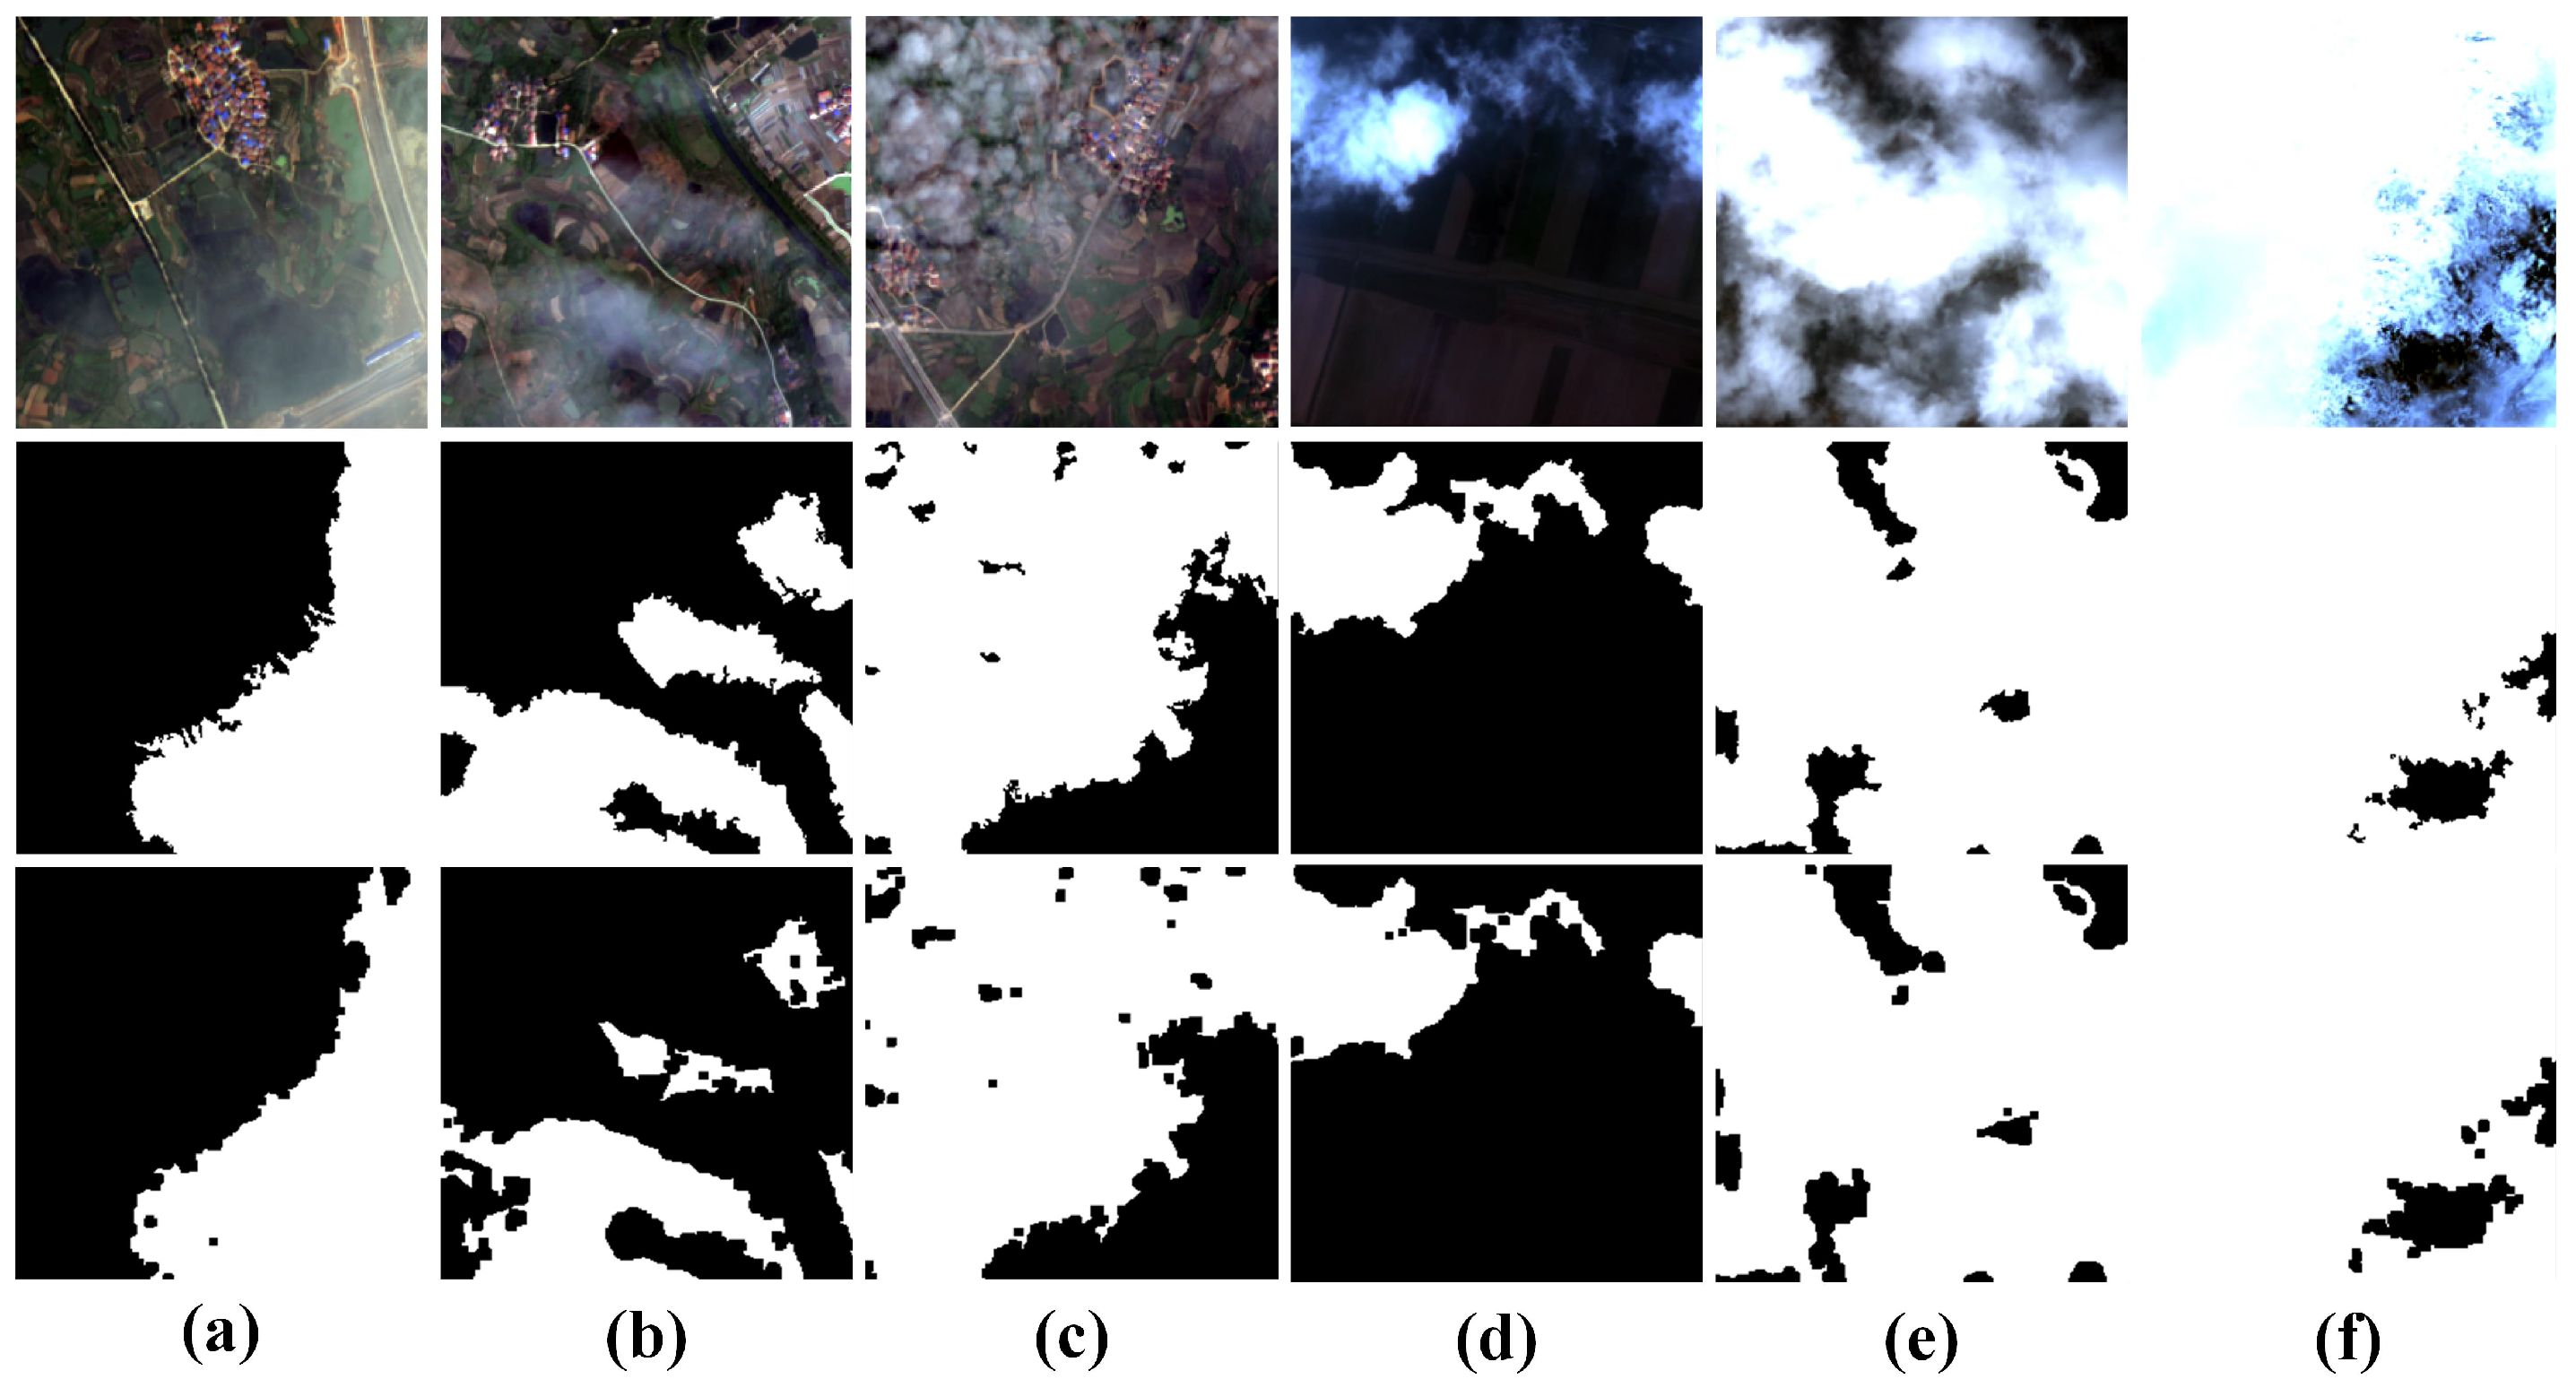
Figure 7.
Experimental results of each step in the proposed cloud detection strategy. (a). Gaofen-2 subimage. (b). Brightness mask. (c). Water mask. (d). Extinction coefficient map. (e). Clustering result. (f). Coarse cloud map. (g). Cloud map after post-processing.
Figure 7.
Experimental results of each step in the proposed cloud detection strategy. (a). Gaofen-2 subimage. (b). Brightness mask. (c). Water mask. (d). Extinction coefficient map. (e). Clustering result. (f). Coarse cloud map. (g). Cloud map after post-processing.
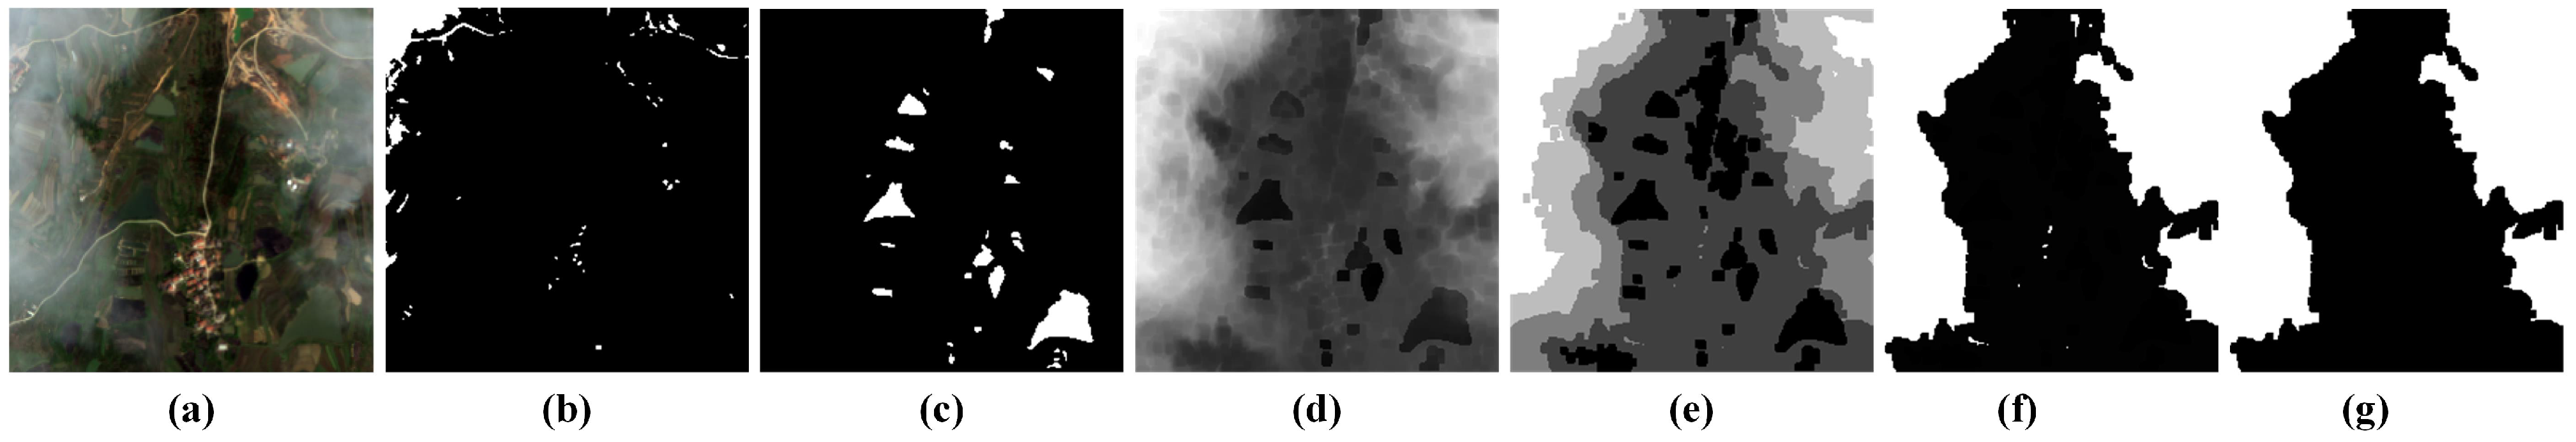
Figure 8.
Experimental examples (a–f) of the proposed method in Gaofen-2 full-scene images. The remote sensing images are in the first row. Extinction coefficient maps are in the second row. Clustering results are in the third row. The ground truth and the experimental results of the proposed method are in the fourth row and the fifth row, respectively.
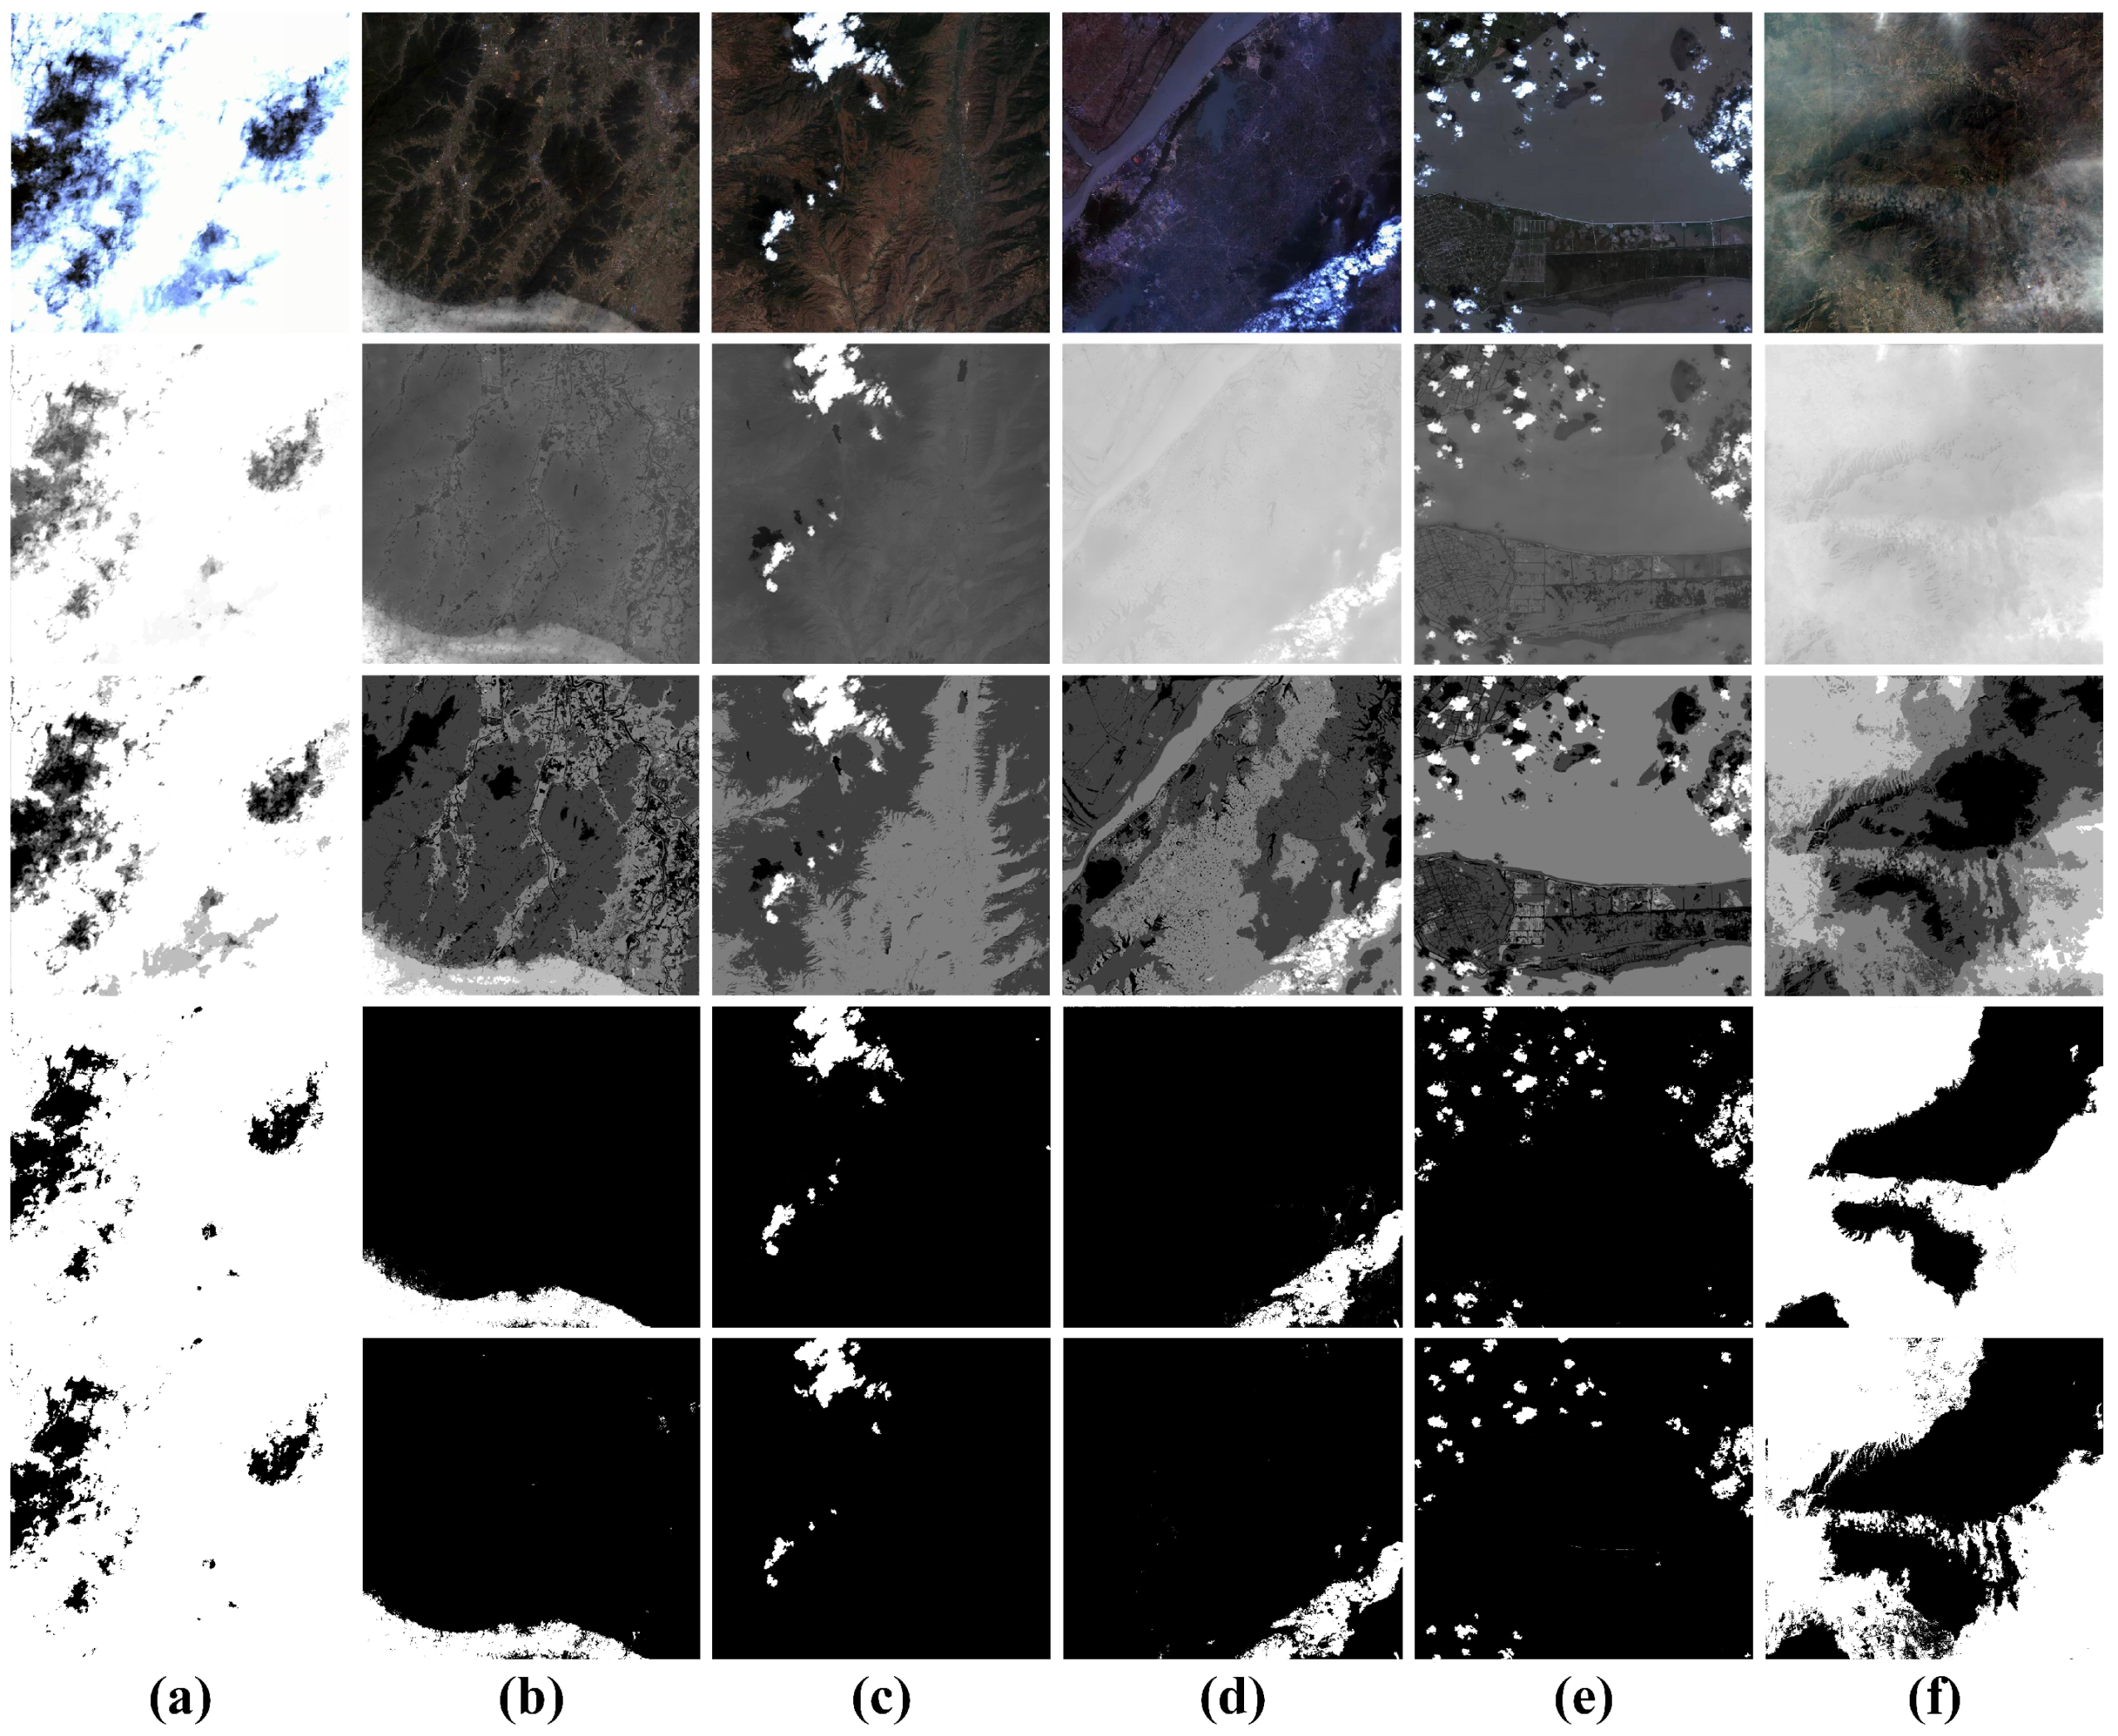
Figure 9.
An experimental example of the proposed method in Gaofen-2 full-scene image. (a). Gaofen-2 full-scene image. (b). Extinction coefficient map. (c). Clustering result. (d). Cloud detection results. (e). Cloud detection results with loose conditions. Three yellow highlighted regions mark areas of positive performance for thin cloud detection. Two red highlighted regions mark areas where the cloud detection performs unfavorably.
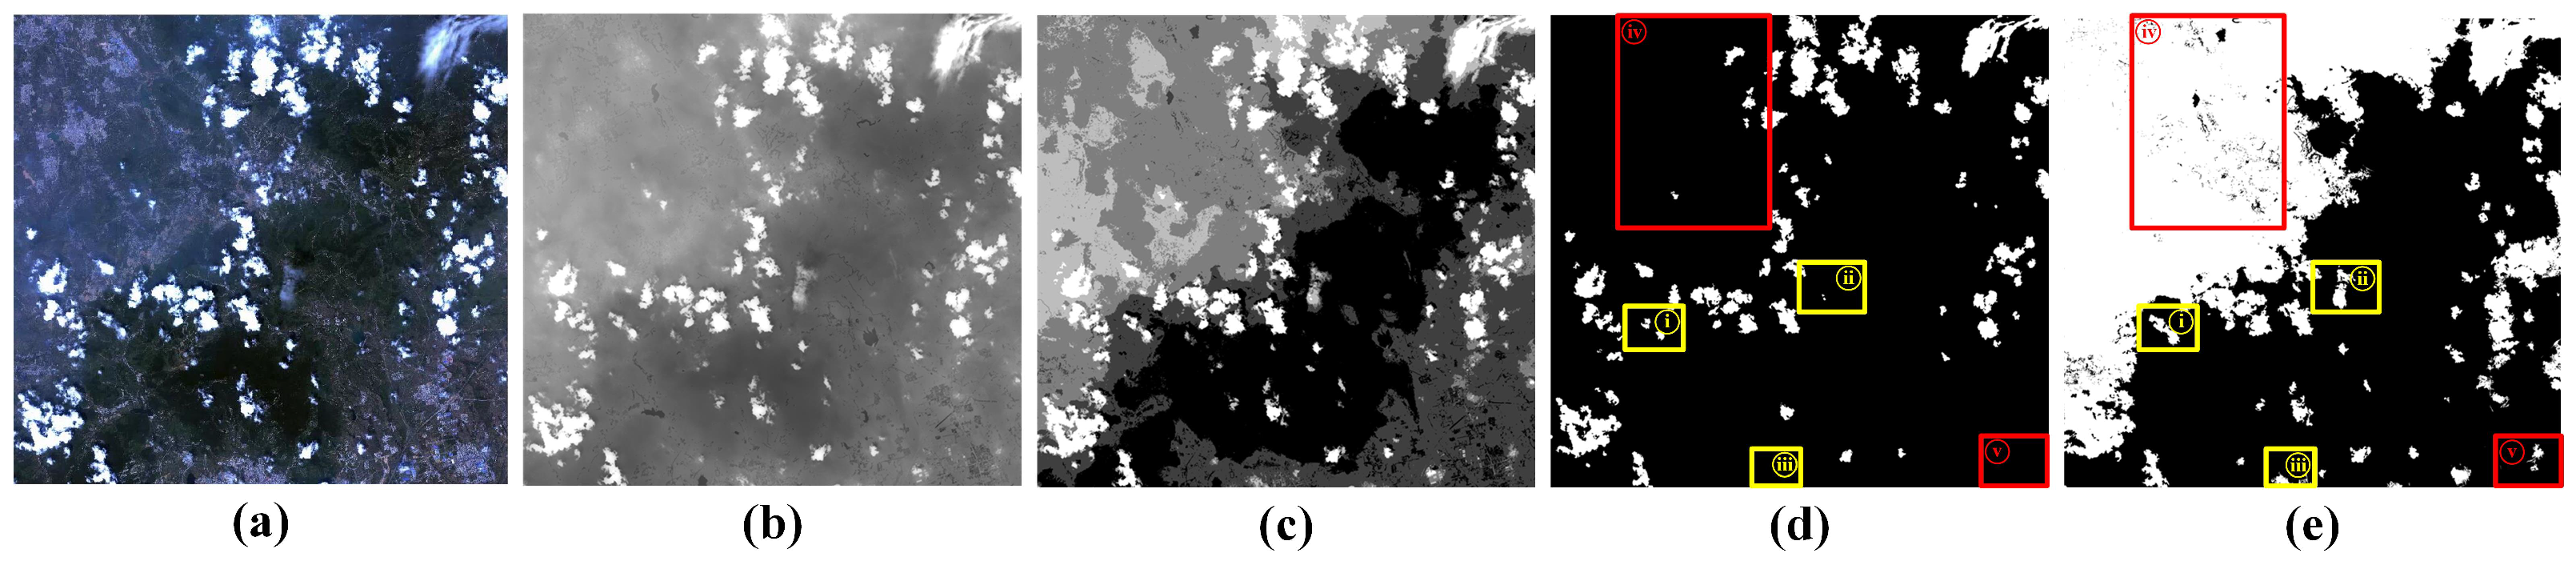
Figure 10.
Experimental results comparison of the proposed method and Zhang’s method [17] in Gaofen-1 full-scene images. The full-scene images are in the first row. The images in the second row are the ground truth. The experimental results of the compared algorithm and the method proposed in this paper are in the third row and the fourth row, respectively. The cloud detection accuracy (i.e., F-Measure) is marked on the top right of the images.

Table 1.
Texture feature parameter experiments for cloud covered region and non-cloud covered region.
Table 1.
Texture feature parameter experiments for cloud covered region and non-cloud covered region.
| Cloud Covered Region | Non-Cloud Covered Region | Discriminability | |
|---|---|---|---|
| Correlation | 54.0932 | −14.4269 | 1.2667 |
| Uniformity of gradient distribution | 16494.3488 | 6116.9381 | 0.6291 |
| Uniformity of gray distribution | 222.2017 | 110.4711 | 0.5028 |
| Standard deviation of gradient value | 1.7466 | 2.0770 | 0.1892 |
| Mean gradient value | 1.1392 | 1.3456 | 0.1812 |
| Standard deviation of gray value | 69.2241 | 59.4468 | 0.1412 |
| Mean gray value | 530.7838 | 488.7896 | 0.0791 |
| Gradient entropy | 2.4174 | 2.3055 | 0.0463 |
| Mixing entropy | 2.9431 | 2.8349 | 0.0368 |
| Gray level entropy | 0.6391 | 0.6543 | 0.0239 |
Table 2.
List of parameters in equations.
| Parameter | Value | Equation | Parameter | Value | Equation |
|---|---|---|---|---|---|
| 0.24 | Equation (9) | 20 | Equation (12) | ||
| 0.18 | Equation (9) | 0 | Equation (13) | ||
| 0.15 | Equation (10) | 8000 | Equation (13) | ||
| 0.50 | CCM Rule 1 | 0.24 | Equation (15) | ||
| 0.05 | CCM Rule 2 | 0.22 | Equation (15) | ||
| 20 | Equation (12) | 0.20 | Equation (15) |
Table 3.
Average cloud detection accuracies of the proposed method n Gaofen-2 subimages for six categories.
Table 3.
Average cloud detection accuracies of the proposed method n Gaofen-2 subimages for six categories.
| Cloud Type | stratus | stratus fractus | cirrocumulus | cumulus | stratocumulus | altostratus |
| F-measure (mean ± variance) | 0.9327 ± 0.0012 | 0.9091 ± 0.0093 | 0.9214 ± 0.0072 | 0.9382 ± 0.0010 | 0.9672 ± 0.0018 | 0.9880 ± 0.0008 |
Publisher’s Note: MDPI stays neutral with regard to jurisdictional claims in published maps and institutional affiliations. |
© 2022 by the authors. Licensee MDPI, Basel, Switzerland. This article is an open access article distributed under the terms and conditions of the Creative Commons Attribution (CC BY) license (https://creativecommons.org/licenses/by/4.0/).
Share and Cite
MDPI and ACS Style
Lin, Y.; He, L.; Zhang, Y.; Wu, Z. Cloud Detection of Gaofen-2 Multi-Spectral Imagery Based on the Modified Radiation Transmittance Map. Remote Sens. 2022, 14, 4374. https://doi.org/10.3390/rs14174374
AMA Style
Lin Y, He L, Zhang Y, Wu Z. Cloud Detection of Gaofen-2 Multi-Spectral Imagery Based on the Modified Radiation Transmittance Map. Remote Sensing. 2022; 14(17):4374. https://doi.org/10.3390/rs14174374
Chicago/Turabian StyleLin, Yi, Lin He, Yi Zhang, and Zhaocong Wu. 2022. "Cloud Detection of Gaofen-2 Multi-Spectral Imagery Based on the Modified Radiation Transmittance Map" Remote Sensing 14, no. 17: 4374. https://doi.org/10.3390/rs14174374
Note that from the first issue of 2016, this journal uses article numbers instead of page numbers. See further details here.