Article

Assessment of Urban Subsidence in the Lisbon Metropolitan Area (Central-West of Portugal) Applying Sentinel-1 SAR Dataset and Active Deformation Areas Procedure

by
José Cuervas-Mons
1,*,
José Luis Zêzere
2,
María José Domínguez-Cuesta
1,
Anna Barra
3,
Cristina Reyes-Carmona
4,
Oriol Monserrat
3,
Sergio Cruz Oliveira
2 and
Raquel Melo
2,5
1
Department of Geology, University of Oviedo, 33005 Oviedo, Spain
2
Institute of Geography and Spatial Planning, University of Lisbon, 1600-276 Lisbon, Portugal
3
Geomatics Division, Centre Tecnològic de Telecomunicacions de Catalunya (CTTC/CERCA), 08860 Castelldefels, Spain
4
Department of Geodynamics, University of Granada, 18071 Granada, Spain
5
Department of Geosciences, University of Evora, 7000-671 Evora, Portugal
*
Author to whom correspondence should be addressed.
Remote Sens. 2022, 14(16), 4084; https://doi.org/10.3390/rs14164084
Submission received: 21 July 2022 / Revised: 9 August 2022 / Accepted: 16 August 2022 / Published: 20 August 2022
(This article belongs to the Special Issue Monitoring Geohazard from Synthetic Aperture Radar Interferometry)

Abstract

:
The Lisbon metropolitan area (LMA, central-west of Portugal) has been severely affected by different geohazards (flooding episodes, landslides, subsidence, and earthquakes) that have generated considerable damage to properties and infrastructures, in the order of millions of euros per year. This study is focused on the analysis of subsidence, as related to urban and industrial activity. Utilizing the A-DInSAR dataset and applying active deformation areas (ADA) processing at the regional scale has allowed us to perform a detailed analysis of subsidence phenomena in the LMA. The dataset consisted of 48 ascending and 61 descending SAR IW-SLC images acquired by the Sentinel-1 A satellite between January 2018 and April 2020. The line-of-sight (LOS), mean deformation velocity (VLOS) maps (mm year−1), and deformation time series (mm) were obtained via the Geohazard Exploitation Platform service of the European Space Agency. The maximum VLOS detected, with ascending and descending datasets, were −38.0 and −32.2 mm year−1, respectively. ADA processing over the LMA allowed for 592 ascending and 560 descending ADAs to be extracted and delimited. From the VLOS measured in both trajectories, a vertical velocity with a maximum value of −32.4 mm year−1 was estimated. The analyzed subsidence was associated to four ascending and three descending ADAs and characterized by maximum VLOS of −25.5 and −25.2 mm year−1. The maximum vertical velocity associated with urban subsidence was −32.4 mm year−1. This subsidence is mainly linked to the compaction of the alluvial and anthropic deposits in the areas where urban and industrial sectors are located. The results of this work have allowed to: (1) detect and assess, from a quantitative point of view, the subsidence phenomena in populated and industrial areas of LMA; (2) establish the relationships between the subsidence phenomena and geological and hydrological characteristics.

Graphical Abstract

1. Introduction

Satellite-based A-DInSAR (advanced differential interferometry synthetic aperture radar) techniques have been used since the end of the last century as powerful tools to detect, monitor, and analyze the ground motion related to geohazards. The variety of applications of the satellite datasets is extensive, including seismic and volcanic risks [1,2], subsidence phenomena [3,4], landslide activity [5,6,7], aquifers overexploitation [8], and civil infrastructure monitoring [9].
Currently, A-DInSAR processing services, such as the Geohazard Exploitation Platform (GEP) and European ground motion service (EGMS) [10,11,12,13], are widely used and successfully applied in ground motion detection and monitoring [14,15,16]. This is due to the following reasons: (i) A-DInSAR processing is very fast (less than 24 h); (ii) it does not require an expert user; (iii) it allows obtaining results over large areas in the order of tens of thousands of km2. Likewise, the active deformation areas (ADA) procedure [17,18,19] was designed to facilitate the analysis and interpretation of LOS mean deformation velocity maps on a regional scale. The ADA procedure considerably reduces the analysis and interpretation of the results, focusing the study on specific areas with active ground motion. Works of [20,21] show the applicability and reliability of ADA tools for deformation detection and assessment. Subsidence phenomena are natural and anthropogenic processes that consist of sudden sinking or gradual downward settling of the ground surface with a few or no horizontal motion [22]. Ground subsidence can be produced by internal geological processes, such as isostatic adjustments, volcanism, or faulting, as well as by natural or anthropogenic exogenous processes [23]. The main causes of exogenous subsidence can be a dissolution, consolidation related to sediment loading, piezometric falls related to reduced aquifer recharge, fluid withdrawal, and underground mining and tunneling [24]. Active subsidence is one of the key factors damaging metropolitan areas and road networks. Additionally, there are many relevant studies with A-DInSAR that were carried out about active subsidences in large urban areas and transportation facilities, such as Shanghai [9], Rome [25], or Mexico City [26,27]. On the other hand, ref. [28] carried out a review regarding the subsidence phenomena analysis by means of conventional and A-DInSAR techniques, while [29] published a review regarding the application of ERS-1/2, Envisat ASAR, and Sentinel-1 datasets for subsidence research.
The Lisbon metropolitan area (LMA) is specially known for the geological hazards associated with seismic and tectonic activity [30,31]. In addition, slope instabilities and gravity processes along the coast, as well as inland, are common [32,33]. Moreover, in this region, flood episodes are usual during intense rainfall periods, producing damages valued at millions of euros per year [34]. Other geohazards, such as urban and industrial subsidence [35] and groundwater vulnerability [36], also have impacts in the study area.

1.1. Settings of Study Area

The LMA is located to the central-west of Portugal (Figure 1A) and encompasses 4378 km2 (Figure 1B). The LMA is composed by 18 urban and rural municipalities, of which the population is over 2.8 million inhabitants. Additionally, it is the largest urban agglomeration of Portugal, with about 27% of the country population [37]. The principal urban cores of the area are Lisbon (capital) and other cities, such as Cascais, Estoril, Setúbal, and Sesimbra (Figure 1B). It presents significant economic and industrial activity, as well as relevant port infrastructures. The study area is characterized by an annual mean rainfall of 709 mm, with annual precipitation average values ranging from 500 mm in Lower Tagus to 1000 mm at the Sintra mountain [34]. As per the elevation, the maximum altitude is over 528 m in the Sintra region and 666 m in the Montejunto mountain, to the North of the study area [38] (Figure 1B). The estuary of Tagus River, situated in the center of the area, is the most important geomorphological element of the study area. It is the largest estuarine system in the Iberian Peninsula, with an extension of 320 km2 (Figure 1B).
Regarding previous works in LMA, several authors [30,39] have addressed their studies from the seismic hazard and liquefaction soils points of view in recent years. On the other hand, other researchers have focused on the flood risk and damage in buildings produced by extreme rainfalls episodes [34,40]. Regarding the landslide topic, ref. [38] studied the landslide occurrence in the Lisbon region according to a regional rainfall threshold, while [41] performed a landslide risk index in Portugal, recognizing the LMA as an important landslide exposition area. In contrast, other studies have focused on urban planning and policies [42], the hydrodynamics and geochemistry of Tagus River [43], among other concerns. Regarding the A-DInSAR technique application, ref. [35,44] used ERS-1/2 and the Envisat ASAR dataset for subsidence analysis in Lisbon city from 1992 to 2006 and between 1995 and 2010, respectively. These works linked land subsidence to groundwater over-exploitation and the subsequent compaction of materials. Compared to these previous works, our research represents the first analysis and interpretation of ground motion using the Sentinel-1 SAR dataset (between January 2018 and April 2020). In addition, we have applied the GEP service and ADA procedure for the whole LMA, demonstrating its usefulness and applicability for urban subsidence assessment at both the regional and local scales.
From a geological point of view (Figure 1C), and according to [45,46], the LMA is located in two morpho-structural units, i.e., the Lower Tagus Cenozoic (which is composed of Paleogene and younger deposits) and Lusitanian (which is composed of Mesozoic rocks) basins. The bedrock mainly consists of sedimentary rocks, such as sandstones, conglomerates, claystones, and carbonates, with ages ranging from Jurassic to Pliocene. The extrusive and intrusive rocks presented in the LMA are of cretaceous age, and they are located in the center and center-west of the study area. In the case of volcanic rocks, these are defined by breccias, basalts, and the volcano-sedimentary complex of Lisbon. The intrusive materials consist of gabbros, granites, and sienites, among others. Lastly, the most modern materials are quaternary deposits, composed of fluvial terrace Pleistocene sediments (sands and clays with pebbles) and alluvial Holocene sediments [30]. The LMA includes two major hydrogeological systems, i.e., the Tagus—Sado and Western Meso—Cenozoic Basins. These systems define detrital and carbonate aquifers [47].

1.2. Objetives

The aims of this work are the following: (1) the detection and analysis of ground motion related to urban subsidence processes, applying the Sentinel-1 A-DInSAR techniques by means of the GEP service and ADA procedure; and (2) the establishment of subsidence origin, according to the geological and hydrological settings at the local scale.
A significative contribution of this work is to demonstrate the applicability and usefulness of the P-SBAS processing of the GEP service and ADA tools in the detection and monitoring of urban subsidence-related ground motion at the regional and local scales.
Figure 1. (A) Location of Lisbon metropolitan area in the southwest of Portugal. (B) Lisbon metropolitan area and the 18 municipalities and location of the S. Julião do Tojal Meteorological Station. (C) Geological map of LMA (at scale 1:500,000) [48] and water well analyzed.
Remotesensing 14 04084 g001

2. Materials and Methods

The methodology carried out in this work has involved the following tasks (Figure 2): (1) Sentinel-1 A-DInSAR processing by means of the ESA’s GEP service; (2) application of ADA processing of geomatics division of CTTC (Centre Tecnològic de Telecomunicacions de Catalunya) to extract and draw the ADAs, (3) decomposition of horizontal and vertical components and estimation of vertical velocity; (4) compilation and review of geological and spatial data trough field campaigns between September and November 2021 to validate the ADAs and A-DInSAR dataset; (5) GIS integration and interpretation of dataset.

2.1. A-DInSAR Processing

The A-DInSAR technique was applied to measure ground motion in the study area. This technique calculates the ground surface displacement occurring between two different radar images, collected by sensors on board a satellite [49]. A progressive comparison of the images during a certain period of time (usually years) allows for a multi-temporal analysis of the displacement, by which time series of surface displacement and annual mean velocities can be obtained.
In our work, ground motion was measured using ascending and descending images from Sentinel-1 satellite. A-DInSAR was used for image processing, and we used the Parallel Small Baseline Subset (P-SBAS) processing service, available at the GEP [12]. The P-SBAS is an on-demand and unsupervised service that was developed by the Institute for Electromagnetic Sensing of the Environment of the Italian National Research Council (CNR-IREA) [50,51,52]. This GEP service has been proven as an effective tool to quickly detect ground motion [10,14,16,53]. The algorithm is based on the SBAS technique [54], and it exploits Sentinel-1 images in single look complex (SLC) with interferometric wide (IW) acquisition mode and dual vertical polarisation (VV) (Table 1). The ascending set was composed of 48 SAR images from track 45 (26 January 2018–27 April 2020), whereas the descending set was composed of 61 SAR images from track 125 (26 January 2018–21 April 2020).
The automatic GEP P-SBAS processing chain follows these steps [50,52] (Table 1): (1) selection of S-1 IW SLC images in functional of the area of interest, track, and temporal period; (2) DEM conversion in SAR coordinates and geometrical co-registration of SAR images; (3) generation of differential interferograms with a Goldstein filtering applied; (4) performing of temporal and spatial phase unwrapping over a subset of pixels, identified according to coherence value and estimation of deformation and residual topography; (5) generation of surface displacement time series (cm) and LOS mean deformation velocity maps (cm year−1) (in this work, results are showed in mm year−1); (6) application of APS filter on the resulting time series; (7) geocoding and implementation of LOS mean deformation velocity maps and deformation time series in a GIS.
With respect to the processing conducted in this research, the A-DInSAR dataset consisted of large regional processing of the central southwest of Portugal using the P-SBAS GEP service. In the case of ascending dataset, the extension of processed area was 20,009 km2, whereas, in descending, the extension of the area processed was 13,904 km2. The geographical locations of the reference points are shown in Table 1 and Figure 3. During the processing of both, the reference points were selected in the city of Lisbon. However, in the case of descending processing, the geographical location of the reference point was automatically changed by the software. We performed reprocessing to try to correct this; however, as A-DInSAR processing is unsupervised, automatic, and does not allow for changing the parameters, in all cases, the reference point changed its location. Afterwards, we did focus the study on the Lisbon metropolitan area, with an extension of 4378 km2 (Figure 1).
Concerning measured PS, the sign indicates a movement towards the satellite if the value is positive, whereas the negative value indicates a movement away from the satellite. In this work, as the Sentinel-1 SAR images used were acquired in ascending and descending orbits, the highest sensitivity will be obtained when terrain orientations were 82 degrees, with respect to N and a slope of approximately 55° in ascending orbit. In the case of descending trajectory, the highest sensitivity will be obtained with 278 degrees, with respect to N and a slope of 55°. Additionally, in this work, the LOS mean deformation velocity maps are presented in mm year−1, as well as a time series in mm. To represent these velocity maps, the stability range (or the threshold for discriminating stable and unstable points) was estimated as two times the standard deviation of the velocity of all the measured points [17]. Therefore, the stability range was set between 6 and −6 mm year−1 for the ascending orbit processing and between 7 and −7 mm year−1 for the descending orbit.

2.2. Active Deformation Areas (ADA) Processing

We have applied the ADA procedure (software ADAFinder v 1.1.31®), designed by CTTC (Castelldefels, Catalunya, Spain) and described by [17,18,19]. This methodology performs the identification of ADAs, allowing us to focus the analysis and interpretation in those areas with active ground motion. These areas are composed of a given number of active PS, with mean, maximum, and minimum detected VLOS values (mm year−1), mean value of accumulated displacements (mm), velocity classes, and a quality index [17]. This quality index (QI), from 1 (very reliable) to 4 (is not reliable), allows us to recognize the temporal and spatial noise levels in the deformation time series within each identified ADA [19]. In this way, these authors recommended considering ADAs with QI = 1–2 for analysis. Since, in our work, the study area is extensive and we have a large number of ADAs, we have been as restrictive as possible, selecting only ADAs with QI = 1 for analysis and interpretation. The ADA procedure was carried out from both trajectories. The processing parameters for the definition and identification of the ADAs are summarized in Table 2. Additional information regarding these processing parameters can be found in the works of [18,19].

2.3. Decomposition of Vertical and Horizontal Deformation

The vertical and horizontal components were estimated by means of the procedure proposed by [55,56]. This methodology allows us to calculate the vertical and horizontal deformations from LOS ground motion detected in both trajectories, applying the inverse distance weighted (IDW) method and raster calculator in a GIS environment (ArcGIS 10.3®, Redlands, California 92373-8100, USA). In this work, the purpose of analyzing and studying the subsidence phenomena, only vertical deformation (mm year−1), has been considered.

2.4. Data Collection, Review and Field Campaigns

A recompilation and analysis of the followed geo-spatial data were carried out, including: (1) orthophotos acquired in 2018, covering the Portuguese territory [57], with a pixel resolution of 0.25 m; (2) topographic maps of Portugal at scale 1:25,000; digital terrain models: elevation, slope, and aspect (pixel 50 × 50 m); (3) geological map of Portugal at 1:1,000,000 and 1:500,000 [48,58]; (4) lithological map of LMA at scale 1:500,000, and the land use map of Portugal at scale 1:500,000. In addition, a different hydrological dataset was gathered. Firstly, daily rainfall dataset from January 2018 to April 2020 at S. Julião do Tojal Meteorological Station (Vialonga town; geographical location: 38′86°N, 9′13°W, Figure 1A) was compiled and reviewed. Secondly, the monthly mean depth of piezometric level registered in Carregado town (Alenquer council; geographical location: 38′86°N, 9′13°W, Figure 1B), between 2018 to 2020, was obtained from the Sistema Nacional de Informaçao de Recursos Hídricos website [59].
Two field campaigns were made during September and November 2021, with the purpose of validating A-DInSAR results and identified ADAs. These field campaigns consisted of the observation of ground motion evidence: presence of tense cracks and damage in buildings and roads, among others.

2.5. GIS Integration and Interpretation of Dataset

For the adequate interpretation of results obtained, the layers and rasters used were combined with geocoded PS in a GIS environment. Afterwards, the analysis and description of A-DInSAR dataset and ADAs was performed at regional scale. Lastly, we have assessed the urban subsidence in a local study area, according to the ground motion detected, geological characteristics, and hydrological data.

3. Results

In this section, we carry out the description, analysis, and interpretation of the Sentinel-1 A-DInSAR ground motion results. The results are divided in three parts: the (1) A-DInSAR results at the regional scale; (2) ADAs extracted and delimited at the regional scale for the LMA; (3) subsidence analysis at the local scale.

3.1. A-DInSAR Results

The LOS mean deformation velocity maps (mm year−1), obtained in ascending and descending trajectories by the GEP service, are presented in Figure 3 and summarized in Table 3. A total of 607,024 PS (30.3 PS km−2) were obtained in ascending processing, whereas a total of 975,215 PS were measured in descending processing (70.1 PS km−2). In the LMA, the measured PS densities were 55.3 PS km−2 in ascending and 71.6 PS km−2 in descending. In order to visualize and analyze the ground movement rates in the ascending dataset, we have considered those values above ±6.0 mm year−1 as active PS (Figure 3A). This threshold was selected according to the standard deviation obtained in the PS (σ = ±2.9) (Table 3). In the case of the descending dataset, values of ±7.0 mm year−1 were considered active PS (Figure 3A), because the standard deviation obtained was σ = ±3.6 (Table 3).
As far as the ascending dataset, the maximum LOS velocity rates ranged from −38.0 and 26.3 mm year−1, with an average value of −2.0 ± 2.9 mm year−1 (Figure 3A and Table 3). Regarding inactive PS (LOS mean velocity between −6.0 and 6.0 mm year−1), there were 520,963 PS (85.8%). This maximum VLOS of −38.0 mm year−1 was detected in Palmela council, located in the center of the study area (Figure 1 and Figure 3A). In this region, the materials are Holocene alluvial deposits. Additionally, a maximum accumulated displacement of −74.7 mm was detected in Vila Franca de Xira for alluvial materials (clays and sands of Tagus river) over an isolated PS with a VLOS of −35.0 mm year−1 (Figure 1 and Figure 3A). The mean value of accumulated displacement was −4.0 ± 6.5 mm. With respect to the descending dataset (Figure 3B and Table 3), the maximum LOS velocities measured were −35.4 and 23.0 mm year−1. The VLOS of −35.4 mm year−1 was measured over the located alluvial deposits in Palmela council (Figure 1 and Figure 3B). The average value of VLOS was −1.0 ± 3.6 mm year−1. On the other hand, the total inactive PS was 908,417 PS (93.2%). The maximum accumulated displacement (−74.0 mm) was detected over the Vila Franca de Xira region, associated with PS with a VLOS of −25.2 mm year−1. The mean value of the accumulated displacement was −0.6 ± 6.5 mm (Figure 3B and Table 3).

3.2. ADA at Regional Scale

From the PS in the LOS mean deformation velocity map in the ascending trajectory, a total number of 592 ADAs have been identified and extracted in the LMA (Figure 4A,B). ADAs are composed of a minimum and maximum number of PS, 5 and 795, respectively. The average number of PS per ADA is 16. The extension of ADAs ranges between 80,986.8 and 12,406,800.0 m2, with an average of 382,398.6 m2. On the other hand, Palmela is the council that registers the higher quantity of ADAs (82). It is located at Central South of study area, with Lisbon, Odivelas, and Sobral de Monte Agraço being the councils that register the minimum number of ADAs (3) (Table 4). On the contrary, a total of 560 ADAs have been extracted in the LMA from the descending dataset (Figure 4C,D). In this case, ADAs are composed of 5 to 620 PS, with an average of 19 PS per ADA. The extension of ADAs ranges between 65,389.5 and 11,795,965.3 m2, with an average of 426,379.6 m2. In contradistinction to the ascending ADAs, Benavente is the council that registers the higher quantity of ADAs (101), while Sobral de Monte Agraço is the council with the lowest number of ADAs (0) (Table 5).
Figure 4A,C shows the distribution of ADAs along the LMA, according to the maximum velocity class (mm year−1). In the case of ascending ADAs, the detected velocity rates range from 6.6 to 38.0 mm year−1. ADAs with velocities between 6.6 and 10.0 mm year−1 are represented throughout the study area and sometimes also appear in association with ADAs with velocities between 10.0 and 20.0 mm year−1 (Figure 4A). These 10.0 and 20.0 mm year−1 velocity rates define the areas with outstanding deformations: on the central coast, in the north-central of study area, and on the Setubal peninsula (Figure 4A). ADAs with velocities from 20.0 to 30.0 mm year−1 were extracted mostly in the center and north center of the study area (Alenquer and Vila Franca de Xira) (Figure 4A). Lastly, the ADAs with velocities higher than 30.0 mm year−1 present small extensions and are located in the Vila Franca de Xira and Palmela councils. In the case of Vila Franca de Xira, ADAs have been mostly identified in materials corresponding to the alluvial deposits of Tagus River. In the case of Alenquer, they have also been extracted on Jurassic, Paleogene, and Miocene rocky substrates. On the other hand, ADAs from the descending dataset present ranges from 6.6 to 35.4 mm year−1. Likewise, ADAs with velocities between 6.6 and 10.0 mm year−1 are represented throughout the study area and in association with ADAs with velocities between 10.0 and 20.0 mm year−1 (Figure 4C). These 10.0 and 20.0 mm year−1 velocity rates define the special deformation sectors on the south coast, in the north and east of the LMA (Figure 4C). ADAs with velocities from 20.0 to 30.0 mm year−1 were drawn mostly in the center and north center of the study area (Vila Franca de Xira and Benavente) (Figure 4C). Lastly, the ADAs with velocities higher than 30.0 mm year−1 present some small sectors to the south of the Vila Franca de Xira and Palmela councils. In the case of ADAs located in Vila Franca de Xira, Benavente, and Palmela, all ADAs have been extracted over quaternary alluvial deposits.
Figure 4B,D displays the ADAs QI. For the ascending dataset, a total of 408 have QI = 1, 136 have QI = 2, 8 have QI = 3, and 40 have QI = 4. On the contrary, in the descending dataset, a total of 93 ADAs have QI = 1, 113 have QI = 2, 100 have QI = 3, and 254 have QI = 4. In this work, we have taken only those ADAs with QI = 1 into account. Then, the ascending ADAs with a QI = 1 are located predominantly in the north central and west central areas of the study area. They can also be found more widely in the eastern center and south of the study area (Figure 4B). The ADAs with QI = 2–4 are located along the LMA, and they are isolated and disperse ADAs (Figure 4B). On the contrary, descending ADAs with QI = 1 are found as large and clustered zones in the central and east central regions of the study area. However, throughout the rest of the LMA, they can be found as isolated and dispersed deformation sectors (Figure 4D). In the case of ADAs with QI = 2–4, they appear predominantly to the east and south of the LMA and as isolated zones along the rest of the territory (Figure 4D). In both cases, most of the ADAs with QI = 1 are located in cities, towns, and isolated buildings. They have also been extracted from those PS that are located on infrastructures, such as the road and railway networks.
As it has been mentioned above, the most significant deformations from both trajectories have been measured in the sectors of Alenquer and Vila Franca de Xira. Taking the maximum velocity and QI = 1 of the ADAs drawn into account, we chose this region to carry out the urban subsidence analysis at the local scale (Table 4 and Table 5 and Figure 4).

3.3. Urban Subsidence Analysis at Local Scale

In this section, we present the analysis of urban subsidence at the local scale in the following order. (1) We present the settings, geological characteristics of the local area, and the movement evidence observed during the fields campaigns. (2) We describe and analyze the ascending and descending A-DInSAR datasets and ADAs extracted from both processing. (3) We compare the A-DInSAR dataset, with respect to hydrological data. In particular, we analyze the evolution of deformation time series, with respect to rainfall and piezometric level data. (4) The estimated vertical velocity is described, and we compare it with respect to VLOS detected and ADAs drawn.

3.3.1. Settings and Geology of Area

According to the ADAs extracted and drawn, we have chosen the Vila Franca de Xira-Alenquer for the local analysis regarding subsidence phenomena. This area is situated in the North Center of the LMA, including the councils of Vila Franca de Xira and Alenquer (Figure 4 and Figure 5). This sector is characterized by the presence of significance industries, factories, and urban areas (Figure 6A,B). Moreover, there are essential infrastructure networks that connect Lisbon with the center and North of Portugal. The most important infrastructure is the Thermoelectrical Station of Carregado (Figure 6A). From a lithological point of view, the bedrock is constituted by dolomite, limestone, slate, marl, sandstone, and conglomerates of the Jurassic, Paleogene, and Miocene ages.
The towns of Vila Franca de Xira, Carregado, and Alenquer are located over Jurassic and Miocene calcareous and siliciclastic materials and quaternary deposits (Figure 5). The quaternary materials include Pleistocene terraces (made of sands, clays, and pebbles) and Holocene alluvial deposits of Tagus River (made of clays and sands). Moreover, there are gravity and eluvial deposits covering the Jurassic bedrock. Anthropogenic deposits are also very common in the area (Figure 5).
As to validate the ground motion of field campaigns, evidence of movement could not be observed in the majority of the deformation locations because the area has wide, restricted access sectors (Figure 6A,B). However, near the Carregado thermoelectric plant, a group of open tense cracks could be observed as affecting the road. They are characterized by tens of meters of length and some centimeters wide (Figure 6C–E). The road runs parallel to a water channel, which connects the thermoelectric plant with the Tagus River.

3.3.2. A-DInSAR Results and ADAs

Figure 7A shows the ADAs defined and their PS detected in the detailed study area from the ascending processing. A total of 24 ADAs has been extracted, with 2717 PS measured into the ADAs. A total of 2616 isolated PS were rejected during ADA processing from a total of 4878 PS detected (53.6% of total). Regarding the type of terrain where the PS are located (Figure 7), all of them were detected above artificial reflectors, such as: (1) urban, industry, and factory areas located over alluvial deposits, (2) buildings located in the mountain and slope zones on Jurassic, Paleogene, and Miocene materials, and (3) infrastructures, such as roads, highways, and railways. The extensions of ADAs range from 104,928 to 12,406,800 m2. All ADAs present a QI = 1. The main ADA identified presents the maximum extension (12,406,800 m2), and it is constituted by 795 PS. It is located over the towns of Vila Franca de Xira, Carregado, and Alenquer (Figure 7A). The materials are mainly Quaternary alluvial and anthropic deposits, but also include Miocene and Paleogene sedimentary rocks (Figure 7A). It presents an average VLOS of −6 mm year−1 and maximum VLOS of −25.5 mm year−1 (Figure 7A). With respect to the accumulated displacement measured, a maximum displacement of −55.6 mm was detected and associated to this VLOS of −25.5 mm year−1 (Figure 7A). This maximum VLOS was detected over the industrial polygon of Vila Franca de Xira and Carregado. On the other hand, four other ADAs presented the maximum VLOS, from −7.4 to −18.5 mm year−1, and were located over buildings, industry, roads, and railway situated over alluvial and anthropic deposits (Figure 7A). These ADAs are characterized by maximum accumulated displacement of −33.3 mm. On the contrary, Figure 7B shows the ADAs drawn and their PS detected from descending dataset. A total of 6048 PS were measured, with VLOS rates from −25.2 to 17.4 mm year−1, of which, 5699 were subsequently rejected (94.2% of total). Thus, there were 349 PS in the ADAs. The main ADA, with an extension of 2216,415.1 m2, presents a maximum velocity of −25.2 mm year−1. On the other hand, the active deformations (<−7.0 mm year−1) are mainly restricted to the industrial area of Vila Franca de Xira-Carregado (Figure 7B) and small zones that coincide with the active PS and ADAs of the ascending dataset (locations of TS–1 and TS–3) (Figure 7B). However, the number of descending active PS is lower than that of the ascending. For the rest of area, only an area with QI = 4 was extracted.

3.3.3. A-DInSAR Dataset vs. Hydrological Data

Different time series (TS) were selected (Figure 7) and described below, with respect to the daily rainfall dataset and monthly piezometric level (PL 390/208) collection (Figure 7A and Figure 8). The TS have been selected according to these criteria: (1) ground motion detected and ADAs drawn and (2) evidence of movement found in the field campaigns (Figure 6).
We were able to identify three periods of rise (between January to February 2018, between September 2018 to March 2019, and between September 2019 to April 2020) and two periods of drop (between March to September 2018 and between April and September 2019) in the piezometric level. These periods match with rainfall episodes. For an all-time analysis, the average annual precipitation was 412.0 mm, with a total accumulated precipitation of 970.2 mm between January 2018 and April 2020. On the other hand, TS analysis showed different patterns and noise levels. Descending TS (Figure 8B) are noisier than ascending TS (Figure 8A). TS–1, located in an industrial area near of the Tagus river (Figure 7), present different cases. Ascending TS-1 (Figure 8A) displayed a general trend until September 2019, when it presented a stabilization of displacement until April 2020. However, descending TS–1 (Figure 8B) presented periods of increase and stabilization of displacement that are independent of the rainfall and piezometric records. Both TS–2, located in the industrial sector of Vila Franca de Xira-Carregado (Figure 7), showed independent linear trends of rainfall records and piezometric levels during all-time analysis (Figure 8). Both TS–3, located at North of study area (Figure 7), showed different patterns of rising and descending of displacement, with no direct relation to the rainfall data and piezometric level (Figure 8). Lastly, TS–4 is only displayed in ascending processing, and it is located where the evidence of movements was observed (Figure 6 and Figure 7). This TS shows increases of displacement that are not related to the rainfall and piezometric level records. Nevertheless, from September 2019, it showed a stabilization of the deformation, coinciding with a rise in the piezometric levels and rainfall episodes.

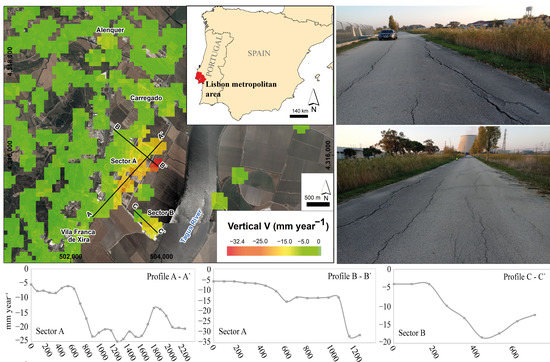
3.3.4. Vertical Velocity

Figure 9 shows the vertical velocity estimated from VLOS in both trajectories. The output format of vertical velocity map (mm year−1) is a raster with a pixel resolution of 90 × 90 m. Two sectors, A and B, have been identified with high vertical velocities. Sector A corresponds to the industrial polygon of Vila Franca de Xira-Carregado towns. This sector mainly presents vertical velocity from −20 to −25 mm year−1 and a maximum estimated vertical velocity of −32.4 mm year−1 (Figure 9B, Profiles A-A’ and B-B’). This sector is located on anthropic materials and alluvial deposits of Tagus River (clays and sands). It presents an approximated extension of 2,601,950 m2. In Sector B, a maximum vertical velocity of −19.0 mm year−1 was identified (Figure 9B, profile C-C’), although the average vertical velocity is near of −15.0 mm year−1. This sector corresponds to an industry located over alluvial and anthropic materials next to the Tagus River, with an approximate area of 222,846 m2.
Comparing the ADAs obtained from ascending and descending trajectories with vertical velocity, it can be observed as deformation zones (Sectors A and B) that better match the descending ADAs than the ascending ADAs (Figure 7 and Figure 9). Moreover, ADAs located at TS–3 and TS–4 (Figure 7), presented maximum vertical velocities of −5.0 mm year−1 (Figure 9). However, the maximum ascending and descending VLOS detected were −18.0 (Figure 7A) and −14.0 mm year−1 (Figure 7B), respectively.

4. Discussion

The extraction and draw of ADAs at the regional scale, from both LOS mean deformation velocity maps, has allowed us to: (1) remove isolated PS that can be due to uncorrected atmospheric components or noise and, therefore, avoid misinterpretation; (2) considerably reduce the analysis time of the LOS mean deformation velocity maps obtained (Figure 3); (3) focus on the study of urban subsidence at local scale (Figure 7). The application of the ADA procedure [17,18,19] has allowed us to obtain 592 ADAs from the ascending trajectory and 560 ADAs from the descending dataset. In the case of ascending ADAs, 492 present QI = 1 (very reliable), while 93 descending ADAs present QI = 1 (Figure 4 and Table 4 and Table 5). The differences observed between the ascending and descending ADAs (number of ADAs with QI = 1, velocities and location of ADAs) are due to the level of noise detected in the PS and number of isolated PS presented in the LOS mean deformation velocity maps (Figure 3). This difference of noise observed between ascending and descending processing could be due to the locations of the reference points. In the case of ascending processing, the reference point was located over the city of Lisbon (Figure 3A). However, the descending reference point was located over a rural area with very low density of measurement points (Figure 3B). The inadequate location of the reference point of the descending processing could have substantially affected the results obtained. This is shown by the low number of ADAs with QI = 1. Another reason could be the higher number of SAR images used in the descending (61) versus ascending (48) processing.
We have assessed the urban subsidence in the region of Vila Franca de Xira-Alenquer (Figure 3, Figure 7, Figure 8 and Figure 9), with maximum vertical velocity of −32.5 mm year−1 and maximum LOS velocity of −25.5 mm year−1 (in ascending) and −25.2 mm year−1 (in descending). A total of four ascending ADAs and three descending ADAs have been associated with urban and industrial subsidence (Figure 7). In this sense, ADAs from descending processing have proven to be more adequate that ascending ADAs because they focus better the subsidence area (Figure 7 and Table 6). In this case, 2616 PS (ascending) and 5699 PS (descending) were rejected (53.6 and 94.2% of total of PS detected) during the ADA procedure. Sectors A and B have extensions of approximately 2,601,950 and 222,846 m2 (Table 6). According to [44], the maximum rates of subsidence, measured in this region between 1992 and 2006 (more specifically, in Vialonga town, 10 km Southward from Vila Franca de Xira), were from 14 to 15 mm year−1, with an average of 6 and 11 mm year−1. This last rate was obtained over industrial and factory areas. These authors have proposed that subsidence phenomena are due to the over-exploitation of groundwater and subsequent compaction of the detrital layers of these aquifers. Additionally, they mentioned that the piezometric levels located in Vialonga descended 65 m in 27 years (from 1966 to 1993) [44]. The main hydrological systems identified in this region are [44]: a deep Cretaceous porous aquifer with a thickness of 180 m, intermediate clay aquitard of 150 m thickness, and sand–clay–limestone Miocene aquifer of 150 m thickness. Nevertheless, in our local study area, the main aquifer systems are the Holocene alluvial materials (clays and sands) and Pleistocene fluvial deposits (sands, clays, and pebbles) [59]. They are porous, free, and semi-confined aquifers [59]. In this work, the observed and analyzed time series shows that there is not a clear relation between the measured rates of subsidence, with respect to the rainfall dataset and piezometric level (Figure 8). Regarding the nature and origin of subsidence phenomena observed in this work, we argue that this subsidence can be mainly due to the compaction of the alluvial materials, whose thicknesses are from 5 to 20 m [30], and anthropic deposits. This process can be particularly observed in the industrial polygon of Vila Franca de Xira-Carregado, where the TS–2 is located (Figure 7), which we have identified as Sector 1 (Figure 9). Additionally, this process is almost continuous throughout the studied period. On the other hand, TS do not show correlation, with respect to piezometric level. Therefore, we cannot justify the attribution of the piezometry fluctuation, due to ground water exploitation. However, with the exposed results, we cannot exclude the process proposed by [44]. In any case, with respect to the previous research, our work represents an important advancement in the research of urban subsidence in the LMA, because we use, for the first time, Sentinel-1 A-DInSAR, using the P-SBAS technique of the GEP service and ADA tools. Additionally, the P-SBAS technique has been demonstrated to be a useful approach for detecting ground motion at the regional and local scales [10,14,16,53]. In the case of ADA tools [17,18,19], this software is very reliable for reducing the regional analysis of the ground motion detected and, therefore, allows us to analyze and interpret, in more detail, specific areas with active deformations [20,21].
Regarding ground subsidence control in this area, we suggest the continuation of ground motion monitoring using the Sentinel-1 A-DInSAR techniques. In addition, in situ instruments, such as levellers, inclinometers, and borehole extensometers [60,61,62], should be installed for monitoring and the follow-up of the detected land subsidence. These in situ measurements can substantially support the A-DInSAR and ADAs results. On the other hand, a larger piezometric dataset is required to improve knowledge regarding the groundwater exploitation process.
Regarding the maximum VLOS and vertical velocity detected and described in this research, these values can be compared with other published works on the subsidence issue [4,25,63,64]. These authors have measured the maximum VLOS from −6 to higher than −20 mm year−1. On the other hand, the ADAs obtained from both trajectories represent an opportunity to analyze, in the future, other areas of the LMA that are well-known, regarding the existing geohazards [44,65,66,67]. Lastly, some limitations of our research can be highlighted, such as the low precision of the results from P-SBAS processing (90 × 90 m) and short study time (2 years and 4 months). Therefore, the options for improvement of this research in the future are: (i) to perform a reprocessing with both trajectories using the commercial software of PSIG (Persistent Scatterer Interferometry of Geomatics Division of CTTC) [68,69,70]; (ii) to increase the survey period. This approach will substantially improve the resolution and accuracy of the obtained A-DInSAR results (pixel resolution of 14 × 4 m). More years of ground motion analysis will help to better understand the nature of the subsidence detected in the LMA and, more specifically, in Vila Franca de Xira and Alenquer. We will also have the potential to detect new areas that have not been observed in this research. Another future approach may be the application of ADA tools to extract and draw ADAs from vertical velocity. In this way, we will be able to better define and zone the A and B sectors identified in this research (Figure 9).

5. Conclusions

A-DInSAR processing and the ADA tool, using two datasets of 48 ascending and 61 descending IW-SLC SAR images of Sentinel-1 A from January 2018 to April 2020, have been presented. The study area is the highly populated and industrial region of the Lisbon metropolitan area (LMA, central-west of Portugal). For A-DInSAR processing, the P-SBAS GEP service of the ESA was applied.
The main contributions of these works are summarized as follows:
  • Detect and assess, from a quantitative point of view, the subsidence phenomena. In particular, four ascending and three descending ADAs have been related to urban and industrial subsidence. In these ADAs, the maximum VLOS have been −25.5 and −25.2 mm year−1, while the maximum vertical velocity has been −32.4 mm year−1. The comparison of VLOS, ADAs, and vertical velocity has helped to correctly interpret the results and properly zone the subsidence sectors.
  • The origin of the detected urban/industrial subsidence has been related, according to geological and hydrological data, to a continuous compaction of alluvial deposits and anthropic materials. However, the fact that the subsidence may also be due to groundwater overexploitation should not be disregarded.
This research represents a significant advancement in the quantitative assessment and interpretation of the nature/origin of the urban subsidence in the LMA. One of the main contributions of this work is to demonstrate the applicability and usefulness of the P-SBAS processing within the GEP service and ADA tools in the detection and monitoring of ground motion at the regional and local scales.

Author Contributions

Conceptualization, J.C.-M., J.L.Z. and M.J.D.-C.; methodology, J.C.-M.; software, J.C.-M., A.B., C.R.-C. and O.M.; validation, J.C.-M., J.L.Z., C.R.-C., S.C.O. and R.M.; formal analysis, J.C.-M.; investigation, J.C.-M.; resources, J.C.-M., J.L.Z., A.B., C.R.-C., O.M. and S.C.O.; data curation, J.C.-M., A.B. and O.M.; writing—original draft preparation, J.C.-M.; writing—review and editing, J.C.-M., J.L.Z., M.J.D.-C., A.B., C.R.-C., O.M., S.C.O. and R.M.; visualization, J.C.-M.; supervision, J.L.Z. and M.J.D.-C.; project administration, M.J.D.-C.; funding acquisition, M.J.D.-C. All authors have read and agreed to the published version of the manuscript.

Funding

This research was funded by the Programa de Apoyo y Promoción a la Investigación 2021 at University of Oviedo (Ref. PAPI-21-PF-22) and Project SLIDE-A&PCR (Ref. FUO-21-069). The development of ADATOOLS has been co-funded by the European Regional Development Fund (ERDF) through the project RISKCOAST (Ref. SOE3/P4/E0868) of the Interreg SUDOE Programme.

Data Availability Statement

Not applicable.

Acknowledgments

Thanks to Susana Pereira at IGOT (University of Lisbon) for providing part of the geological and spatial data of the Lisbon metropolitan area. We really appreciate the suggestions and comments of two anonymous referees who have contributed substantially to improving this manuscript. Thanks are also due to Omar Abdelazim for English editing.

Conflicts of Interest

The authors declare no conflict of interest.

References

  1. Hooper, A.; Zebker, H.A.; Segall, P.; Kampes, B. A new method for measuring deformation on volcanoes and other natural terrains using InSAR persistent scatterers. Geophys. Res. Lett. 2004, 31, L23611. [Google Scholar] [CrossRef]
  2. De Novellis, V.; Carlino, S.; Castaldo, R.; Tramelli, A.; De Luca, C.; Pino, N.A.; Pepe, S.; Convertito, V.; Zinno, I.; De Martino, P.; et al. The 21 August 2017. Ischia (Italy) Earthquake Source Model Inferred From Seismological, GPS, and DInSAR Measurements. Geophys. Res. Lett. 2017, 45, 2193–2202. [Google Scholar] [CrossRef]
  3. Raucoules, D.; Colesanti, C.; Carnec, C. Use of SAR interferometry for detecting and assessing ground subsidence. C. R. Geosci. 2007, 339, 289–302. [Google Scholar] [CrossRef]
  4. Solari, L.; Ciampalini, A.; Raspini, F.; Bianchini, S.; Moretti, S. PSInSAR Analysis in the Pisa Urban Area (Italy): A Case Study of Subsidence Related to Stratigraphical Factors and Urbanization. Remote Sens. 2016, 8, 120. [Google Scholar] [CrossRef] [Green Version]
  5. Barboux, C.; Delaloye, R.; Lambiel, C. Inventorying slope movements in an Alpine environment using DInSAR. Earth Surf. Process. Landf. 2014, 39, 2087–2099. [Google Scholar] [CrossRef] [Green Version]
  6. Barra, A.; Monserrat, O.; Mazzanti, P.; Esposito, C.; Crosetto, M.; Scarascia Mugnozza, G. First insights on the potential of Sentinel-1 for landslides detection. Geomat. Nat. Hazards Risk. 2016, 7, 1874–1883. [Google Scholar] [CrossRef] [Green Version]
  7. Dini, B.; Daout, S.; Manconi, A.; Loew, S. Classification of slope processes based on multitemporal DInSAR analyses in the Himalaya of NW Bhutan. Remote Sens. Environ. 2019, 233, 111408. [Google Scholar] [CrossRef]
  8. Haghighi, M.H.; Motagh, M. Ground surface response to continuous compaction of aquifer system in Tehran, Iran: Results from a long-term multi-sensor InSAR analysis. Remote Sens. Environ. 2019, 221, 534–550. [Google Scholar] [CrossRef]
  9. Perissin, D.; Wang, Z.; Lin, H. Shangai subway tunnels and highways monitoring through Cosmo-SkyMed Persistent Scatterers. ISPRS J. Photogramm. Remote Sens. 2012, 73, 58–67. [Google Scholar] [CrossRef]
  10. Galve, J.P.; Pérez-Peña, J.V.; Azañón, J.M.; Closson, D.; Caló, F.; Reyes-Carmona, C.; Jabaloy, A.; Ruano, P.; Mateos, R.M.; Notti, D.; et al. Evaluation of the SBAS InSAR Service of the European Space Agency´s Geohazard Exploitation Platform (GEP). Remote Sens. 2017, 9, 1291. [Google Scholar] [CrossRef] [Green Version]
  11. Crosetto, M.; Solari, L.; Mróz, M.; Balasis-Levinsen, J.; Casagli, N.; Frei, M.; Oyen, A.; Moldestad, D.A.; Bateson, L.; Guerrieri, L.; et al. The Evolution of Wide-Area DInSAR: From Regional and National Services to the European Ground Motion Service. Remote Sens. 2020, 12, 2043. [Google Scholar] [CrossRef]
  12. Geohazards-TEP. Geohazard Exploitation Platform. Available online: https://geohazards-tep.eu/#! (accessed on 21 September 2021).
  13. European Ground Motion Service. EGMS. Available online: https://land.copernicus.eu/pan-european/european-ground-motion-service (accessed on 2 August 2022).
  14. Cigna, F.; Tapete, D. Sentinel-1 Big Data Processing with P-SBAS InSAR in the Geohazards Exploitation Platform: An Experiment on Coastal Land Subsidence and Landslides in Italy. Remote Sens. 2021, 13, 885. [Google Scholar] [CrossRef]
  15. Crosetto, M.; Solari, L.; Balasis-Levinsen, J.; Bateson, L.; Casagli, N.; Frei, M.; Oyen, A.; Moldestad, D.A.; Mróz, M. Deformation Monitoring at European Scale: The Copernicus Ground Motion Service. Int. Arch. Photogramm. Remote Sens. Spatial Inf. Sci. 2021, XLIII-B3-2021, 141–146. [Google Scholar] [CrossRef]
  16. Cuervas-Mons, J.; Domínguez-Cuesta, M.J.; Mateos Redondo, F.; Barra, A.; Monserrat, O.; Valenzuela, P.; Jiménez-Sánchez, M. Sentinel-1 Data Processing for Detecting and Monitoring of Ground Instabilities in the Rocky Coast of Central Asturias (N Spain). Remote Sens. 2021, 13, 3076. [Google Scholar] [CrossRef]
  17. Barra, A.; Solari, L.; Béjar-Pizarro, M.; Monserrat, O.; Bianchini, S.; Herrera, G.; Crosetto, M.; Sarro, R.; González-Alonso, E.; Mateos, R.M.; et al. A Methodology to Detect and Update Active Deformation Areas Based on Sentinel-1 SAR Images. Remote Sens. 2017, 9, 1002. [Google Scholar] [CrossRef] [Green Version]
  18. Tomás, R.; Pagán, J.I.; Navarro, J.A.; Cano, M.; Pastor, J.L.; Riquelme, A.; Cuevas-González, M.; Crosetto, M.; Barra, A.; Monserrat, O.; et al. Semi-Automatic Identification and Pre-Screening of Geological-Geotechnical Deformational Processes Using Persistent Scatterer Interferometry Datasets. Remote Sens. 2019, 11, 1675. [Google Scholar] [CrossRef] [Green Version]
  19. Navarro, J.A.; Tomás, R.; Barra, A.; Pagán, J.I.; Reyes-Carmona, C.; Solari, L.; Vinielles, J.L.; Falco, S.; Crosetto, M. ADAtools: Automatic Detection and Classification of Active Deformation Areas from PSI Displacement Maps. ISPRS Int. J. Geo-Inf. 2020, 9, 584. [Google Scholar] [CrossRef]
  20. Solari, L.; Barra, A.; Herrera, G.; Bianchini, S.; Monserrat, O.; Béjar-Pizarro, M.; Crosetto, M.; Sarro, R.; Moretti, S. Fast detection of ground motions on vulnerable elements using Sentinel-1 InSAR data. Geomat. Nat. Hazards Risk. 2018, 9, 152–174. [Google Scholar] [CrossRef] [Green Version]
  21. Qiu, Z.; Monserrat, O.; Crosetto, M.; Krishnakumar, V.; Zhou, L. An innovative extraction methodology of active deformation areas based on sentinel-1 SAR dataset: The catalonia case study. Int. J. Remote Sens. 2021, 42, 6228–6244. [Google Scholar] [CrossRef]
  22. Jackson, J.A. Glossary of Geology, 4th ed.; American Geological Institute: Alexandria, VA, USA, 1997. [Google Scholar]
  23. Prokopovich, N.P. Genetic classification on land subsidence. In Proceedings of the International Conference on Evaluation and Prediction of Subsidence (Engineering Foundation Conference), Pensacola Beach, FL, USA, December 1978. [Google Scholar]
  24. Galloway, D.L.; Erkens, G.; Kuniansky, E.L.; Rowland, J.C. Preface: Land subsidence processes. Hydrogeol. J. 2016, 24, 547–550. [Google Scholar] [CrossRef] [Green Version]
  25. Delgado-Blasco, J.M.; Foumelis, M.; Stewart, C.; Hooper, A. Measuring Urban Subsidence in the Rome Metropolitan Area (Italy) with Sentinel-1 SNAP-StaMPS Persistent Scatterer Interferometry. Remote Sens. 2019, 11, 129. [Google Scholar] [CrossRef] [Green Version]
  26. Sowter, A.; Che Amat, M.B.; Cigna, F.; Marsh, S.; Athab, A.; Alshammari, L. Mexico City land subsidence in 2014–2015 with Sentinel-1 IW TOPS: Results using Intermittent SBAS (ISBAS) technique. Int. J. Appl. Earth Obs. Geoinf. 2016, 52, 230–242. [Google Scholar] [CrossRef]
  27. Cigna, F.; Tapete, D. Present-day land subsidence rates, surface faulting hazard and risk in Mexico City with 2014–2020 Sentinel-1 IW InSAR. Remote Sens. Environ. 2021, 253, 112161. [Google Scholar] [CrossRef]
  28. Tomás, R.; Romero, R.; Mulas, J.; Marturià, J.J.; Mallorquí, J.J.; López-Sánchez, J.M.; Herrera, G.; Gutiérrez, F.; González, P.J.; Fernández, J.; et al. Radar interferometry techniques for the study of ground subsidence phenomena: A review of practical issues through cases in Spain. Environ. Earth Sci. 2014, 71, 163–181. [Google Scholar] [CrossRef] [Green Version]
  29. Solari, L.; Del Soldato, M.; Bianchini, S.; Ciampalini, A.; Ezquerro, P.; Montalti, R.; Raspini, F.; Moretti, S. From ERS 1/2 to Sentinel-1: Subsidence Monitoring in Italy in the Last Two Decades. Front. Earth Sci. 2018, 6, 149. [Google Scholar] [CrossRef]
  30. Carvalho, J.; Dias, R.; Ghose, R.; Teves-Costa, P.; Borges, J.; Narciso, J.; Pinto, C.; Leote, J. Near-surface Characterization of the Lisbon and Lower Tagus Valley Area, Portugal, for Seismic Hazard Assessment: VS30 and Soil Classification Maps. Bull. Seismol. Soc. Am. 2018, 108, 2854–2876. [Google Scholar] [CrossRef]
  31. Oliveira, L.; Teves-Costa, P.; Pinto, C.; Carrilho Gomes, R.; Almeida, I.M.; Ferreira, C.; Pereira, T.; Sotto-Mayor, M. Seismic microzonation based on large geotechnical database: Application to Lisbon. Eng. Geol. 2020, 265, 105417. [Google Scholar] [CrossRef]
  32. Epifânio, B.; Zêzere, J.L.; Neves, M. Susceptibility assessment to different types of landslides in the coastal cliffs of Lourinhã (Central Portugal). J. Sea R. 2014, 93, 150–159. [Google Scholar] [CrossRef] [Green Version]
  33. García, R.A.C.; Oliveira, S.C.; Zêzere, J.L. Assessing population exposure for landslide risk analysis using dasymetric cartography. Nat. Hazards Earth Syst. Sci. 2016, 16, 2769–2782. [Google Scholar] [CrossRef] [Green Version]
  34. Leal, M.; Fragoso, M.; Lopes, S.; Reis, E. Material damage caused by high-magnitude rainfall based on insurance data: Comparing two flooding events in the Lisbon Metropolitan Area and Madeira Island, Portugal. Int. J. Disaster Risk Reduct. 2020, 51, 101806. [Google Scholar] [CrossRef]
  35. Catalão, J.; Nico, G.; Lollino, P.; Conde, V.; Lorusso, G. Integration of InSAR Analysis and Numerical Modeling for the Assessment of Ground Subsidence in the City of Lisbon, Portugal. IEEE J. Sel. Top. Appl. Earth Obs. Remote Sens. 2016, 9, 1663–1673. [Google Scholar] [CrossRef]
  36. Lobo Ferreira, J.P.; Oliveira, M.M. Groundwater vulnerability assessment in Portugal. Geofís. Int. 2004, 43, 541–550. [Google Scholar]
  37. Rodrigues, M.L.; Machado, C.R.; Freire, E. Geotourism Routes in Urban Areas: A Preliminary Approach to the Lisbon Geoheritage Survey. Geoj. Tour. Geosites. 2011, 8, 281–294. [Google Scholar]
  38. Vaz, T.; Zêzere, J.L.; Pereira, S.; Cruz Oliveira, S.; Garcia, R.A.C.; Quaresma, I. Regional rainfall thresholds for landslide occurrence using a centenary database. Nat. Hazards Earth Syst. Sci. 2018, 18, 1037–1054. [Google Scholar] [CrossRef] [Green Version]
  39. Campos Costa, A.; Sousa, M.L.; Carvalho, A.; Coelho, E. Evaluation of seismis risk and mitigation strategies for the existing building stock: Application of LNECloss to the metropolitan area of Lisbon. Bull. Earthq. Eng. 2010, 8, 119–134. [Google Scholar] [CrossRef]
  40. Leal, M.; Boavida-Portugal, I.; Fragoso, M.; Ramos, C. How much does an extreme rainfall event cost? Material damage and relationships between insurance, rainfall, land cover and urban flooding. Hydrol. Sci. J. 2019, 64, 673–689. [Google Scholar] [CrossRef]
  41. Pereira, S.; Santos, P.P.; Zêrere, J.L.; Tvares, A.O.; Garcia, R.A.C.; Oliveira, S.C. A Landslide risk index for municipal land use planning in Portugal. Sci. Total Environ. 2020, 735, 139463. [Google Scholar] [CrossRef]
  42. Medeiros, E.; Brandão, A.; Tormenta Pinto, P.; Silva Lopes, S. Urban Planning Policies to the Renewal of Riverfront Areas: The Lisbon Metropolis Case. Suistainability 2021, 13, 5665. [Google Scholar] [CrossRef]
  43. Vaz, N.; Mateus, M.; Pinto, L.; Neves, R.; Dias, J.M. The Tagus Estuary as a Numerical Modeling Test Bed: A review. Geosciences 2019, 10, 4. [Google Scholar] [CrossRef] [Green Version]
  44. Heleno, S.I.; Oliveira, L.G.; Henriques, M.J.; Falcão, A.P.; Lima, J.N.; Cooksle, G.; Ferreti, A.; Fonseca, A.M.; Lobo-Ferreira, J.; Fonseca, J. Persistent Scatterers Interferometry detects and measures ground subsidence in Lisbon. Remote Sens. Environ. 2011, 115, 2152–2167. [Google Scholar] [CrossRef] [Green Version]
  45. Cabral, J.; Moniz, C.; Ribeiro, P.; Terrinha, P.; Matias, L. Analysis of seismic reflection data as a tool for the seismotectonic assessment of a low activity intraplate basin—the Lower Tagus Valley (Portugal). J. Seismol. 2003, 7, 431–447. [Google Scholar] [CrossRef]
  46. Carvalho, J.; Matias, H.; Torres, L.; Manupella, G.; Pereira, R.; Mendes-Victor, L. The structural and sedimentary evolution of the Arruda and Lower Tagus sub-basin, Portugal. Mar. Pet. Geol. 2005, 22, 427–453. [Google Scholar] [CrossRef]
  47. Teixeira, P.; Almeida, L.; Brandão, J.; Costa, S.; Pereira, S.; Valério, E. Non-Potable use of Lisbon underground water: Microbiological and hydrochemical data from a 4-year case study. Environ. Monit. Assess. 2018, 190, 455. [Google Scholar] [CrossRef] [PubMed]
  48. Laboratório Nacional de Energia e Geologia (LNEG). Geological Map of Portugal (1992), Scale 1:1,000,000. Alfragide: Laboratório Nacional de Energia e Geologia. Available online: https://www.lneg.pt/en/product-category/cartography/ (accessed on 20 November 2021).
  49. Massonnet, D.; Feigl, K.L. Radar interferometry and its application to changes in the Earth’s surface. Rev. Geophys. 1998, 36, 441–500. [Google Scholar] [CrossRef] [Green Version]
  50. Casu, F.; Elefante, S.; Imperatore, P.; Zinno, I.; Manunta, M.; De Luca, C.; Lanari, R. SBAS-DInSAR parallel processing for deformation time-series computation. IEEE J. Sel. Top. Appl. Earth Obs. Remote Sens. 2014, 7, 3285–3296. [Google Scholar] [CrossRef]
  51. De Luca, C.; Cuccu, R.; Elefante, S.; Zinno, I.; Manunta, M.; Casola, V.; Rivolta, G.; Lanari, R.; Casu, F. An On-Demand Web Tool for the Unsupervised Retrieval of Earth’s Surface Deformation from SAR Data: The P-SBAS Service within the ESA G-POD Environment. Remote Sens. 2015, 7, 15630–15650. [Google Scholar] [CrossRef] [Green Version]
  52. Manunta, M.; De Luca, C.; Zinno, I.; Casu, F.; Manzo, M.; Bonano, M.; Fusco, A.; Pepe, A.; Onorato, G.; Berardino, P.; et al. The Parallel SBAS Approach for Sentinel-1 Interferometric Wide Swath Deformation Time-Series Generation: Algorithm Description and Products Quality Assessment. IEEE Trans. Geosci. Remote Sens. 2019, 57, 6259–6281. [Google Scholar] [CrossRef]
  53. Reyes-Carmona, C.; Galve, J.P.; Moreno-Sánchez, M.; Riquelme, A.; Ruano, P.; Millares, A.; Teixidó, T.; Sarro, R.; Pérez-Peña, J.V.; Barra, A.; et al. Rapid characterisation of the extremely large landslide threatening the Rules Reservoir (Southern Spain). Landslides 2021, 18, 3781–3798. [Google Scholar] [CrossRef]
  54. Berardino, P.; Fornaro, G.; Lanari, R.; Sansosti, E. A New Algorithm for Surface Deformation Monitoring Based on Small Baseline Differential SAR Interferograms. IEEE Trans. Geosci. Remote Sens. 2002, 40, 2375–2383. [Google Scholar] [CrossRef] [Green Version]
  55. Notti, D.; Herrera, G.; Bianchini, S.; Meisina, C.; García-Davalillo, J.C.; Zucca, F. A methodology for improving landslide PSI data analysis. Int. J. Remote Sens. 2014, 35, 2186–2214. [Google Scholar] [CrossRef]
  56. Béjar-Pizarro, M.; Notti, D.; Mateos, R.M.; Ezquerro, P.; Cetolanza, G.; Herrera, G.; Bru, G.; Sanabria, M.; Solari, L.; Duro, J.; et al. Mapping Vulnerable Urban Areas Affected by Slow-Moving Landslides Using Sentinel-1 InSAR Data. Remote Sens. 2017, 9, 876. [Google Scholar] [CrossRef] [Green Version]
  57. Direçao-Geral do Território (DGT). Cartografia Topográfica. Ortofotos Digitais. Available online: https://www.dgterritorio.gov.pt/cartografia/cartografia-topografica/ortofotos/ortofotos-digitais (accessed on 13 October 2021).
  58. Laboratório Nacional de Energia e Geologia (LNEG). Geological Map of Portugal (2010), Scale 1:500,000. Alfragide: Laboratório Nacional de Energia e Geologia. Available online: https://www.lneg.pt/en/product-category/cartography/ (accessed on 20 November 2021).
  59. Sistema Nacional de Informaçao de Recursos Hídricos (SNIRH). Águas Subterráneas. Pontos de Água Subterrânea. Available online: https://snirh.apambiente.pt (accessed on 13 December 2021).
  60. Galloway, D.; Jones, D.R.; Ingebritsen, S.E. Land Subsidence in the United States; US Geological Survey: Reston, VA, USA, 1999.
  61. Fernández-Oliveras, M.P. Determinación de Movimientos Verticales del Terreno Mediante Técnicas de Interferometría Radar DInSAR. Ph.D. Thesis, E.T.S. de Caminos, Canales y Puertos, University of Granada, Granada, Spain, 2009. [Google Scholar]
  62. Shirzaei, M.; Freymueller, J.; Törnqvist, T.E.; Galloway, D.L.; Dura, T.; Minderhoud, P.S. Measuring, modelling and projecting coastal land subsidence. Nat. Rev. Earth Environ. 2021, 2, 40–58. [Google Scholar] [CrossRef]
  63. Meisina, C.; Zucca, F.; Notti, D.; Colombo, A.; Cucchi, A.; Savio, G.; Giannico, C.; Bianchi, M. Geological Interpretation of PSInSAR Data at Regional Scale. Sensors 2008, 8, 7469–7492. [Google Scholar] [CrossRef] [PubMed] [Green Version]
  64. Polcari, M.; Albano, M.; Saroli, M.; Tolomei, C.; Lancia, M.; Moro, M.; Stramondo, S. Subsidence Detected by Multi-Pass Differential SAR Interferometry in the Cassino Plain (Central Italy): Joint Effect of Geological and Anthropogenic Factors? Remote Sens. 2014, 6, 9676–9690. [Google Scholar] [CrossRef] [Green Version]
  65. Zêzere, J.L. Distribução e Ritmo dos Movimientos de Vertente na Região a Norte de Lisboa. Ph.D. Thesis, Universidade de Lisboa, Lisbon, Portugal, 2001. [Google Scholar]
  66. Oliveira, S.C.; Zêzere, J.L.; Catalão, J.; Nico, G. The contribution of PSInSAR interferometry to landslide hazard in weak rock-dominated areas. Landslides 2015, 12, 703–719. [Google Scholar] [CrossRef]
  67. Marques, F. Regional Scale Sea Cliff Hazard Assessment at Sintra and Cascais Counties, Western Coast of Portugal. Geosciences 2018, 8, 80. [Google Scholar] [CrossRef] [Green Version]
  68. Biescas, E.; Crosetto, M.; Agudo, M.; Monserrat, O.; Crippa, B. Two Radar Interferometric Approaches to Monitor Slow and Fast Land Deformation. J. Surv. Eng. 2007, 133, 66–71. [Google Scholar] [CrossRef]
  69. Devanthéry, N.; Crosetto, M.; Monserrat, O.; Cuevas-González, M.; Crippa, B. An Approach to Persistent Scatterer Interferometry. Remote Sens. 2014, 6, 6662–6679. [Google Scholar] [CrossRef] [Green Version]
  70. Devanthéry, N.; Crosetto, M.; Monserrat, O.; Crippa, B.; Mróz, M. Data analysis tools for persistent scatterer interferometry based on Sentinel-1 data. Eur. J. Remote Sens. 2019, 52, 15–25. [Google Scholar] [CrossRef] [Green Version]
Figure 2. Flow diagram of the procedure used in this work.
Remotesensing 14 04084 g002
Figure 3. LOS mean deformation velocity maps (mm year−1) for the processed area, with indication of the Lisbon metropolitan area limits (red bounds). (A) Ascending trajectory; (B) descending trajectory. Black points indicate the location of reference points.
Remotesensing 14 04084 g003
Figure 4. ADA extracted in the LMA at regional scale. (A) Maximum velocity class (mm year−1) of ADA from ascending dataset; (B) ADA quality index (QI) in ascending trajectory; (C) maximum velocity class (mm year−1) of ADA from descending dataset; (D) ADA quality index (QI) in descending trajectory. Black rectangles represent the local area analyzed and presented in sub-Section 3.3.2. A-DInSAR Results and ADAs.
Remotesensing 14 04084 g004
Figure 5. Geological settings of local study area. See location of evidence observed in field campaigns in October and November 2021. Blue star and code 390/208 represent location of water well.
Remotesensing 14 04084 g005
Figure 6. Photos of evidence observed in field campaigns in October and November 2021. (A) Carregado thermoelectric plant; (B) industrial polygon of Vila Franca de Xira; (C) and (D) tension cracks affecting a road in Vila Franca de Xira surroundings and near to Carregado thermoelectric plant; (E) opened tense cracks with centimetric opening. See locations in Figure 5 and Figure 7.
Remotesensing 14 04084 g006
Figure 7. (A) ADAs identified and ascending detected PS (only PS into the ADA). (B) ADAs identified and descending detected PS (only PS into the ADA). Blue star represents the location of water well 390/208. See location of photos of evidence (Figure 6). Ortophoto 2018, with pixel resolution of 0.25 m, provided by ©Direcção-Geral do Território [57].
Remotesensing 14 04084 g007
Figure 8. Deformation time series (mm), daily rainfall dataset (mm), accumulated precipitation (mm), and piezometric level (m) between January 2018 and April 2020. (A) Time series from ascending dataset; (B) time Series from descending dataset. See location of TS in Figure 7.
Remotesensing 14 04084 g008
Figure 9. (A) Vertical velocity (mm year−1) raster (pixel 90 × 90 m) and location of vertical velocity profiles. (B) Profiles of vertical velocity (mm year−1). Ortophoto 2018, with a pixel resolution of 0.25 m, provided by ©Direcção-Geral do Território [57].
Remotesensing 14 04084 g009
Table 1. Main acquisition parameters of the SAR satellite used dataset and principal processing parameters of P-SBAS chain of the GEP. See location of reference points in Figure 3.
SatelliteSentinel-1
SensorA
BandC
Wavelength5.55 cm
Acquisition modeInterferometric wide
PolarizationVV
SAR productSingle look complex
Revisit period12 days
Resolution14 × 4 m
Mean incidence angle36°
Processing ParametersGEP service
A-DInSAR techniqueP-SBAS
Pixel resolution90 × 90 m
Used DEMSRTM_1arcsec (30 m)
Multilooking factor5 × 20 (azimuth × range)
Goldstein filter0.5
Applied filterAPS
Reference point in ascending−9.1902863/38.706933
Reference point in descending−9.7099499/38.771494
Table 2. Main processing parameters for the definition and identification of ADAs.
ParameterValue
Isolation distance180.0
Factor for standard deviation2
Clustering radio (m)120.0
Minimum ADA size5
Table 3. Main parameters of the LOS mean deformation velocity map (mm year−1) of the processed and Lisbon metropolitan areas with ascending and descending trajectory.
ParametersAscendingDescending
Area (km2)20,00913,904
Number of points (PS)607,024975,215
Density of points (PS km−2)30.370.1
LOS velocity (mm year−1)
Mean−2.0−1.0
Maximum26.323.0
Minimum−38.0−35.4
Standard deviation2.93.6
Accumulated LOS displacement (mm)
Mean−4.0−0.6
Maximum53.246.1
Minimum−74.7−74.0
Standard deviation6.58.2
Table 4. Main parameters of ADA with QI = 1 for each council in ascending trajectory. Number of PS, velocity (mm year−1), and deformation (mm) are shown according to the ADA with QI = 1. In bold are the councils corresponding to the local study area.
Council# Total ADA
(QI = 1–4)
# ADA (QI = 1) # PS of ADA Max VelocityMean VelocityMax DeformationMean Deformation
Alcohete1185–5413.23.8–8.3−28.2−5.9–−16.7
Alenquer67635–79525.53.2–13.7−43.7−5.0–−32.3
Almada635–814.43.6–9.0−32.3−4.7–−16.7
Amadora646–1629.53.9–8.2−64.1−8.3–−17.3
Arruda Dos Vinhos755–612.34.0–7.6−45.9−6.2–−12.8
Barreiro1046–1815.83.8–5.7−24.2−6.9–−11.9
Benavente71585–10120.73.2–13.1−44.0−5.3–−26.3
Cascais40355–48018.03.5–7.4−38.0−4.2–−15.7
Lisbon3159.13.6−46.3−6.8
Loures811113.03.8−31.0−11.0
Mafra2095–4013.13.3–5.7−29.0−7.4–−12.3
Moita20175–1815.83.2–6.2−34.2−5.2–−13.3
Montijo35195–5416.43.1–8.8−35.2−5.2–−20.2
Odivelas3No dataNo dataNo dataNo dataNo dataNo data
Oeiras27265–5618.53.5–5.5−31.7−4.1–−12.6
Palmela82485–6816.83.6–11.8−71.0−5.2–−21.8
Seixal2655–2116.33.2–6.2−35.1−5.0–−12.0
Sesimbra28105–12015.64.0–9.9−33.0−8.6–−16.5
Setúbal30175–5314.93.1–7.1−33.8−11.6–−13.3
Sintra79685–48025.92.4–11.1−50.6−5.5–−21.3
Sobral de Monte Agraço33510.93.5–4.6−20.9−8.9–−9.7
Torres Vedras43225–2817.33.8–13.6−36.0−6.0–−30.3
Vila Franca de Xira35295–79525.53.7–11.7−55.6−5.2–−29.1
Table 5. Main parameters of ADA with QI = 1 for each council in descending trajectory. Number of PS, velocity (mm year−1), and deformation (mm) are shown according to the ADA with QI = 1. In bold are the councils corresponding to the local study area.
Council# Total ADA
(QI = 1–4)
# ADA (QI = 1)# PS of ADA Max VelocityMean VelocityMax Deformation Mean Deformation
Alcohete1236–1812.24.0–6.5−38.5−4.9–−6.1
Alenquer44125–16525.24.7–9.7−43.517.8–−19.1
Almada4No dataNo dataNo dataNo dataNo dataNo data
Amadora2No dataNo dataNo dataNo dataNo dataNo data
Arruda Dos Vinhos835–6 13.24.0–6.2−26.08.8–−9.2
Barreiro3No dataNo dataNo dataNo dataNo dataNo data
Benavente101195–51924.14.6–13.0−43.315.5–−30.0
Cascais15No dataNo dataNo dataNo dataNo dataNo data
Lisbon725–1013.66.7–7.7−36.2−14.5–−14.6
Loures2325–611.86.6–7.7−18.6−13.7–−14.5
Mafra4029–22 17.410.6–17.4−37.19.1–−18.8
Moita4No dataNo dataNo dataNo dataNo dataNo data
Montijo87186–63 18.73.4–9.1−40.615.9–−13.2
Odivelas1No dataNo dataNo dataNo dataNo dataNo data
Oeiras2No dataNo dataNo dataNo dataNo dataNo data
Palmela7085–10018.64.9–13.4−48.3−4.0–−33.3
Seixal8No dataNo dataNo dataNo dataNo dataNo data
Sesimbra481119.55.7−17.7−3.1
Setúbal2585–87 18.44.4–8.7 −37.3 −2.9–−16.3
Sintra3835–13 14.66.0–10.8 −35.8−7.3–−20.7
Sobral de Monte AgraçoNo dataNo dataNo dataNo dataNo dataNo dataNo data
Torres Vedras50125–15 21.34.4–11.5−49.710.2–−27.1
Vila Franca de Xira1557–16528.66.4–11.4−53.19.1–−22.4
Table 6. Comparative analysis of main subsidence sectors, identified by ascending and descending ADAs and vertical deformation. Velocities are showed in mm year−1, with areas in m2.
SectorAscendingDescendingVertical Deformation
Max. VLOSArea of ADAMax. VLOSArea of ADAMax. VelocityArea
1−25.512,406,800−25.22,216,415−32.42,601,950
2−18.5251,940−20.8233,685−19.0222,846
Publisher’s Note: MDPI stays neutral with regard to jurisdictional claims in published maps and institutional affiliations.

