
Automatic Detection and Assessment of Pavement Marking Defects with Street View Imagery at the City Scale
by
 , and
, and
Wanyue Kong
1,2,3, 
Teng Zhong
1,2,3,*,
Xin Mai
4,
Shuliang Zhang
1,2,3,
Min Chen
1,2,3 and
Guonian Lv
1,2,3 1
Key Laboratory of Virtual Geographic Environment (Ministry of Education), Nanjing Normal University, Nanjing 210023, China
2
State Key Laboratory Cultivation Base of Geographical Environment Evolution, Nanjing Normal University, Nanjing 210023, China
3
Jiangsu Center for Collaborative Innovation in Geographical Information Resource Development and Application, Nanjing Normal University, Nanjing 210023, China
4
School of Geography, South China Normal University, Guangzhou 510631, China
*
Author to whom correspondence should be addressed.
Remote Sens. 2022, 14(16), 4037; https://doi.org/10.3390/rs14164037
Submission received: 19 July 2022
/
Revised: 11 August 2022
/
Accepted: 17 August 2022
/
Published: 18 August 2022
(This article belongs to the Special Issue Optical Remote Sensing Applications in Urban Areas II)
Abstract
:Pavement markings could wear out before their expected service life expires, causing traffic safety hazards. However, assessing pavement-marking conditions at the city scale was a great challenge in previous studies. In this article, we advance the method of detecting and evaluating pavement-marking defects at the city scale with Baidu Street View (BSV) images, using a case study in Nanjing. Specifically, we employ inverse perspective mapping (IPM) and a deep learning-based approach to pavement-marking extraction to make efficient use of street-view imageries. In addition, we propose an evaluation system to assess three types of pavement-marking defects, with quantitative and qualitative results provided for each image. Factors causing pavement-marking defects are discussed by mapping the spatial distribution of pavement-marking defects at the city scale. Our proposed methods are conducive to pavement-marking repair operations. Beyond this, this article can contribute to smart urbanism development by creating a new road maintenance solution and ensuring the large-scale realization of intelligent decision-making in urban infrastructure management.
1. Introduction
Pavement markings display information about lanes and traffic conditions and are crucial for driving and walking safety. The integrity and maintenance of pavement markings is one critical mission for municipal administration to ensure sustainable urban management [1]. In addition, the emergence of the autonomous driving industry in recent years has entailed a greater reliance on pavement markings in applications such as self-driving cars [2]. Therefore, it is essential for road maintenance systems to detect and evaluate pavement-marking defects. Figure 1 shows examples of pavement-marking defects on the road.
Today, smart cities are gaining popularity as a result of technological innovation. Smart is the fundamental ethos for governing future cities, involving four aspects: economy, governance, environment, and society [3,4]. A wide range of technologies, especially artificial intelligence (AI), is making inroads into urban services such as infrastructure maintenance, business efficiency, environmental sustainability, land use, and transport, supporting or even replacing decision-makers in urban maintenance and planning. In smart cities, urban management should be intelligent, efficient, and sustainable, which requires the capability of systematic processes [4]. The entire process of maintaining urban roadways can be divided into four steps: daily monitoring, quality assessment, decision-making, and execution [5]. There is a need for cooperation between data providers who supply daily monitoring, technology providers who can offer quality assessment and decision-making, and local authorities who are responsible for the execution; thus, a systematic process can be achieved [3]. As a solution for the second step, an automatic assessment system for pavement-marking defects at the city scale is urgently required.
When implementing the framework, however, local setting, local development agenda, local context, and local needs should also be considered [3]. Roads could have been built decades ago in some cities where urban infrastructure is already substantially developed [6]. Inevitably, however, infrastructure deteriorates over time. This is especially true for pavement markings, which are frequently worn out due to road traffic [7]. Therefore, when it comes to the sustainable development of smart cities, the completion of construction does not mean the end of the task of municipal construction. Maintenance is also important in urban services, and smart cities expect the work to be efficient, comprehensive, and low-cost.
When an application needs to be put into use, among the three elements that act on the issues of city life—technology, policy, and community—technology is the first hurdle to overcome. AI, the foundational technology for smart cities, is expected to be able to learn based on the perception of the environment to acquire information and even form knowledge. Thus, information and communication technology (ICT) is fundamental to decision-making [3,8]. The traditional manual spotting of broken pavement markings at a large geographical scale is time-consuming and labor-intensive. As a new source of large geographic data, street-view imageries provide a visual scene description of urban space from numerous angles. Today, street-view imageries have already covered many cities worldwide, and map vendors are continuously updating these data [9]. Massive amounts of street-view imageries are sent to the cloud server and are accessible via the internet. By extensively photographing urban road networks, street-view imageries have played an important role in the efficient monitoring of, and quantitative research on, the urban environment [10,11,12]. However, detecting pavement markings with street-view imageries is challenging, since vehicle-mounted cameras shoot these images from a horizontal angle and under various lighting conditions. This begs the question of how to assess pavement-marking defects by employing street-view imageries.
Moreover, multi-layered and quantitative monitoring results are needed in pavement-marking detections since large-scale road management requires more than identifying whether or not the pavement markings on the road are damaged. The qualitative and quantitative evaluation of pavement-marking defects is also highly needed. However, very few studies have quantified the severity of pavement-marking defects at the city scale to date [13,14].
To fill in this gap, the primary objective of this study is to develop a methodological framework for detecting and assessing pavement-marking defects at the city scale. We use the city of Nanjing, China, as an example to illustrate our pavement-marking detection and assessment methodology using motorways and trunk roads. A macro-scaled analysis based on the spatial distribution map of pavement-marking defects is also given. Our research provides a comprehensive framework and methodological advancement of pavement-marking defect detection, which can underpin decision-making of restorative necessity and priority.
The remainder of the paper is organized as follows. Section 2 reviews previous studies, followed by an elucidation of data sources and experimental methods. Section 3 introduces the study area and the pavement-marking defect assessment procedure. Section 3 presents the experimental results of the study case, including the validation of the semantic image segmentation model, spatial contribution maps, and factors leading to defects based on the city-scale analysis. Section 4 highlights the research significance and discusses potential limitations. Section 5 provides a conclusion to this study.
2. Literature Review
2.1. Pavement Marking Defect Detection
Pavement markings are subject to a variety of factors and have the probability of being severely worn out before their expected service life expires [15]. If pavement markings are unclear, drivers and pedestrians may fail to distinguish these indications, leading to incorrect judgments about traffic conditions. In particular, under autonomous driving scenarios, if the pavement markings are slightly worn, the semantics could stand an excellent chance of being recognized by humans based on previous experience. However, since the automated driving assistance system relies heavily on real-time road information, it can generate inaccurate recognition results when pavement markings are defective. As a result, pavement-marking defects pose a higher safety risk than anticipated.
Therefore, it is highly important to regularly inspect pavement markings so that timely maintenance is possible before accidents occur. Although manual-based pavement inspection is inefficient and costly, it is important to advance pavement-marking damage detection methods with the help of specialized instruments [16,17]. Methods for pavement defect detection include image processing, machine learning, and 3D imaging-based methods, with different kinds of inspection equipment and data sources [18].
The state-of-the-art approaches to monitoring pavement-marking conditions are not without problems. For example, an adaptable and trustworthy method of pavement-marking condition monitoring is unmanned aerial vehicles (UAVs) [19]. The UAV research framework in the transportation system has been evaluated [20], and researchers have provided instances of using UAV pictures to identify pavement-marking defects [21,22]. Although it is quick and relatively inexpensive to obtain UAV images, there is still a shortage in identifying pavement-marking defects. The expense of acquiring large-area road images is high, as the battery capacity of UAVs is constrained. Moreover, UAVs typically fly at a high altitude, making it challenging to detect subtler pavement-marking defects.
There are various types of specialist inspection equipment besides UAVs, mainly concentrating on applying 3D technologies and acceleration sensors [18]. A vehicle AMAC equipped with a laser pointer and a line-scan camera has been used for road monitoring [23]. Since 2012, Ireland has deployed the Laser Crack Measurement System (LCMS) to monitor the state of the roads [24]. Li et al. suggested an accurate road-quality metric and employed a professional monitoring vehicle equipped with a GPS receiver, a frontal-view camera, and light detection and ranging (LIDAR) to monitor pavement markings [25]. A lane-marking quality assessment (LMQA) approach is presented to statistically evaluate pavement-marking quality in terms of accuracy, shape, and visibility. A professional inspection of vehicles of relevant government departments showed that they are also equipped with accelerometer devices and a proprietary road-defect library, which can automatically identify and label pavement defects such as cracks [26]. Methods based on 3D laser scanning pavement data are also employed to detect pavement cracks and pavement deformation defects [27]. However, as these professional devices are costly, obtaining pavement conditions at the city scale is challenging.
To advance the methods, we devised the idea of using street-view imageries taken by vehicle-mounted cameras to detect pavement-marking defects in this article. Since LiDAR and accelerometer devices are more appropriate for detecting the flatness and stability of pavement, there is no need to use pricey complex gadgets to monitor pavement markings. However, vision cameras are the most cost-effective compared to other types of sensors. They allow machine vision to simulate the human eye when capturing visible light to recognize pavement markings.
2.2. Application of Street-View Imageries
Street-view imageries recorded by vehicle-mounted cameras are a new sort of big geographic data, characterized by numerous data, rich information, clear images, strong presentability, and a low cost. Street-view imagery is a type of crowd-sourcing geodata. This is also known as participatory sensing, as anyone can use it to capture images on the go with vehicle-mounted cameras [28]. This data source will grow even more with the increasing development of crowd-sourcing platforms and urban infrastructure. Using horizontal view images captured by vehicle-mounted cameras for road monitoring is a viable method [29]. Maeda et al. used images captured by a smartphone on the dashboard of a general passenger car to produce a dataset of road-damage images, and achieved high-accuracy pavement-defect detection based on a target-detection model trained using this dataset [7]. A method of detecting and quantitatively assessing the quality of lane marking from a vehicle-egocentric view has also been proposed [25].
Since images captured by vehicle-mounted cameras can be used to detect and analyze pavement-marking defects, the autonomous maintenance process of urban streets can be facilitated. In the entire process of urban roadway maintenance, street-view imageries are the results of the first step of daily monitoring. They can be effectively used to achieve quantitative assessment as the second step, and the assessment results can help in the third step of the decision-making and the fourth step of execution [5].
Map vendors provide free and publicly available mass street-view data. However, street-view imageries are not intended for detecting pavement conditions. There are drawbacks to pavement-marking assessment, such as distortions of the true ground due to horizontal-view photography. Moreover, obscuration by moving vehicles and pedestrians and the low information density of pavement markings in the images are problematic for efficient and accurate detection. As a result, a birds’-eye view perspective converter and deep-learning technology are required to evaluate pavement-marking defects based on street-view imageries.
2.3. Pavement-Marking Defect Assessment
With the growth in self-driving, more attention has been paid to pavement markings, especially recognition techniques. Many scholars have sought to use machine vision to recognize broken pavement markings or pavement markings under poor lighting conditions [30,31,32]. For instance, Line-CNN (L-CNN) has been applied to real-time unmanned systems [30]. Highly robust pavement-marking recognition under lousy weather and illumination conditions has been achieved in the previous studies [31]. An intensity thresholding strategy using unsupervised intensity normalization and a deep-learning-based method has been proposed for lane-marking extraction [33].
While studies on automatic detection and the assessment of pavement deterioration are not new, most of the present research has focused on pavement defects such as road cracks instead of pavement-marking defects [34]. An anisotropy measure has been applied to pavement-damage identification based on the characteristics of damaged pavement areas, such as their being darker than the surrounding environment [23]. Their study also combined a backpropagation neural network to classify the pavement conditions into four categories: defect-free, crack, joint, and bridged. MEMS acceleration sensors and GPS receivers within a tablet have been employed to detect and localize road-surface anomalies [35]. Pavement roughness can be measured using a cost-effective and sufficiently accurate RGB-D sensor [36]. Multiple deep-learning models have been applied to detect road-damage conditions; for example, the You Only Look Once version 3 (YOLO v3) deep-learning model has been used to identify and classify road defects on street-view imageries [37,38]. However, little research has been conducted on pavement-marking defects. In contrast to the automatic detection of pavement distress, the detection of pavement-marking defects is often divided into two steps: pavement-marking recognition and degradation assessment.
To save labor, the initiative of using digital images to assess the integrity of pavement markings was proposed. Conventional image-processing methods rely on color spectrum features, texture features, a Scale-Invariant Feature Transform (SIFT), Histograms of Oriented Gradients (HoG), etc., which can be applied to computer vision but have limitations in terms of their generalization ability [18]. Deep-learning techniques, however, can fill the gap. In the study by Kawano M et al., the road surface was photographed using a vehicle camera on a garbage truck. The pavement-marking wear was identified and instantly recorded on mobile using a YOLO model using an outer frame to label areas where pavement markings were blurred [14]. Maeda et al. used a vehicle-mounted smartphone to photograph the road surface and used the YOLO v4 target-detection model to detect and classify various pavement defects, such as pavement cracks and blurred pavement markings [7]. Although they both used a camera on the moving vehicle for the identification and qualitative assessment of pavement-marking blurring, a quantitative evaluation of the degree of defects is not supported, as only the target detection method was used.
2.4. Semantic Image Segmentation Based on Deep Learning
Traditional computer image-processing methods have often employed shallow and manually designed features to display images, necessitating a myriad of expert knowledge of feature engineering. Thus, the efficiency of image expression is questionable. In addition, the features are specific, which limits the generalizability of different tasks. Therefore, it cannot fully meet the needs of pavement-marking assessment, and deep learning can fill this gap.
Deep-learning-based methods use multilayer artificial neural networks as the basic structure to learn data representations [39]. Although computer image-processing methods can achieve a level of recognition that approximates human recognition, this is mainly carried out by manually designing feature extractors and implementing multiple rules. With the advancement of hardware and computing power, deep learning can significantly improve the efficiency of machine recognition [40]. With vehicle-mounted cameras, pavement markings present different color characteristics and intensities in different environments. Image-processing methods rely on singular features and specific but incomplete assumptions and lack the ability to learn from examples. Therefore, they are poorly adapted to various complex environments [41]. Training a deep-learning-based model to recognize pavement markings enables the computer to simulate the human visual-recognition process and extract the visible range of pavement markings in the image in an effective manner.
In this study, DeepLab V3+ was used for semantic image segmentation. DeepLab V3+ is a semantic image-segmentation model aiming to assign semantic labels to each pixel in an image. Compared with other semantic segmentation models, DeepLab V3+ introduces many null convolutions, which increases the perceptual field without losing information, thus balancing the accuracy and time consumption of the semantic segmentation task implementation [42]. An end-to-end framework is used for semantic image segmentation and classifying pavement markings on images. A qualitative and quantitative assessment of pavement-marking defects can be achieved by building a quantitative system based on the output of the deep-learning-based model. The process combines end-to-end supervised training and image-processing methods, which is helpful for road maintenance in the infrastructure management of smart cities.
3. Materials and Methods
3.1. Research Framework
We have developed an automatic evaluation process to assess the condition of pavement markings using street-view imageries at the city scale. The process aims to determine whether pavement markings are broken, where they are broken, and the degree of the breakage. Eventually, quantitative assessments of the extent of pavement-marking defects can be obtained based on the sampling points.
Nanjing, the provincial capital city of Jiangsu Province in eastern China, was selected as the study area. The process for assessing the state of pavement markings included the following three steps.
The first step was to obtain street-view imageries based on OpenStreetMap and Baidu Street View (BSV) Application Programming Interface (API). The OpenStreetMap road network of the target area was downloaded and preprocessed through filtering and simplifying. To completely cover the whole street, sampling points were generated based on the road network at 20 m intervals to ensure that the monitoring range completely covered the entire street. The parameters for calling BSV API were generated based on the coordinates and the orientation of the street at which the sampling points were located. After downloading street-view imageries based on the API, Gaussian filtering and a brightness adjustment were performed. The street-view imageries were converted to a birds’-eye view using inverse perspective mapping (IPM), then cropped to preserve the proper range of the road.
The second step for the semantic image segmentation model was training, verification, testing, and operation. The DeepLab V3+ model was trained to segment and recognize pavement markings in birds’-eye-view images of the road. Once the model was trained, it was applied to the street-view imageries of the experimental area, and the shape extraction and recognition of pavement markings could be performed for each sampling point in the testing area.
The third step was to obtain the recovered results and the actual shape of the pavement markings based on the semantic segmentation results and the birds’-eye street view. We acquired qualitative and quantitative evaluation results by comparing the properties of the line-type markings, arrow-type markings, and evenly spaced-type markings. Finally, the results were spatially visualized in a hierarchical manner.
Figure 2 shows the flowchart used to assess pavement-marking conditions using street-view imageries at the city scale.
3.2. Experimental Data Acquisition
Nanjing city’s study area has 11 districts and a built-up area of 868.28 square kilometers, with a relatively well-developed transport, road network, and urban infrastructure. The 2020 UN-Habitat Top 100 Asian Cities list ranked Nanjing 11th in Asia. Regarding the mature development of the urban built environment and data availability, we used this city as an illustrative case to test our evaluation approach.
Firstly, the original data were acquired from street-view imageries. The main idea was to take sampling points based on the OpenStreetMap road network and then call Baidu API. Urban road network data were obtained from the open and free geographic data source OpenStreetMap (https://www.openstreetmap.org/, accessed on 2 October 2021) and filtered according to road types after downloading. According to the preliminary studies, many paths in metropolitan areas are afflicted by the intense shadows cast by street trees and buildings, leading to more interference when assessing pavement-marking conditions. There are also many paths with no pavement markings among the lower-grade roadways. We selected the streets of motorways and trunk roads in the OpenStreetMap road network. These two types of roads are of high grade, with a road width of 3.5 m or greater, and are generally unaffected by shadows on both sides. Figure 3 shows the study area.
The street-view imageries we used were derived from Baidu Map. By calling on the Baidu Map API service, we acquired street-view imageries centered on each sampling point and taken in both directions along the road. We set the size of each street-view image to 800 × 600 pixels, with FOV set to 90° and pitch set to 0° to obtain a higher proportion of the road surface area in every image.
Sampling points were taken at regular intervals along the road network to gather street-view data. According to tests, the crawl in street-view imageries will duplicate image acquisition if the distance between the sampling points is too small. Therefore, the sampling point intervals should not be shorter than 15 m. Furthermore, there are limitations on the shooting angle and clarity of the major map vendors’ street-view map, as a photo can only show a maximum clear road length of around 10 m. Considering the above factors, the sampling points were taken at 20 m intervals. Each point needed to record the angle of the current road direction during collection so that a street view could be obtained facing both ends of the road.
A total of 88,827 street images of Nanjing were obtained. Preprocessing was required to obtain clear photos. As the vehicle-mounted cameras were used in different seasons and at different times of day, the brightness of the photographs needed be modified to compensate for the varying light circumstances. The brightness bias was first detected using 128 as the mean brightness value, and then the brightness and contrast were adjusted using the exposure module in the Skimage package for images that were too bright or too dark. A Gaussian filter of 5 × 5 slider size was set, which effectively reduced noise under the optical lens.
3.3. Inverse Perspective Mapping on Photographs Taken by Vehicle-Mounted Camera
The street-view imageries captured by a vehicle-mounted camera are horizontal. The perspective effect in horizontal view can negatively impact pavement-marking recognition. In the case of pavement markings, the distant markings are thinner than the nearby ones, which is not conducive to scientific damage assessment. Moreover, as the horizontal view contains a large and complex content, the roadways only occupy a small proportion of the image. This involves small target segmentation in complex scenes, thus affecting pavement-marking identification. In contrast, in the birds’-eye view, pavement markings such as lane lines are typically parallel, ensuring that they can be quickly recognized and extracted [43]. For all these factors, converting the horizontal view to a vertical perspective, where the entire road surface is flattened in the image, is better for pavement-marking recognition and defect assessment.
IPM was adopted to convert the street-view imageries from horizontal to vertical. The transformed image’s content was constrained to the image area corresponding to the road, which aided in deep-learning-based recognition and segmentation of pavement markings. Furthermore, the perspective effect was eliminated, and the actual world area corresponding to each pixel grid on the image was approximately the same, which was also beneficial to detecting pavement-marking defects.
The fundamental theoretical conversion formula for the birds’-eye view that we adopted uses the method described in the study by Bertozzi et al. [44]. IPM transformation converts the region-of-interest (ROI) coordinate plane to the global coordinate plane. This requires prior acquisition of the camera’s internal parameters (including the optical center and focal length) and the external parameters (including the camera’s position in the 3D world).
Assuming that the road in front of the camera is horizontal and flat, the space of the real 3D world is defined as follows [44]:
The space of the 2D image obtained by projecting the scene of a 3D world is defined as follows [44]:
The global coordinate plane obtained by remapping the space of in the space of is defined as follows [44]:
After setting up the ROI in the space of , the definition of the projection transform is obtained through the combination of the 3D space and 2D image space ; the space of a remapped image can be generated as follows [44]:
where is the camera’s position in , is the range of horizontal view of the camera, is the range of vertical view of the camera, is the angle between the camera’s optical axis and its projection onto the Y-axis (heading angle), is the angle between the camera’s optical axis and its projection onto the ground (pitch angle), and is the resolution of the image taken by the camera.
Thus, each pixel in can be assigned to the corresponding one in . If pixels in are outside the range of the 2D image, they will be set to black.
Images can be converted from horizontal to birds’-eye views once internal references and control points have been calibrated. As street-view imagery is standardized, the vehicle-mounted camera parameters obtained from the same map vendor are generally the same, and some parameters are user-supplied. In the conversion step, we chose parameters that satisfied the need for the maximum percentage of the road surface in the street-view imageries while causing the lowest amount of image distortion, which can simplify the partial parameters of the preceding equation. We used a horizontal camera angle that was consistent with the direction of the road (0° and 180° from the direction of vehicle travel), a camera pitch angle of 0° (parallel to the ground, with the center of the camera approximately aligned with the vanishing point), and a view range of 180° in the horizontal direction and 180° in the vertical direction. Investigation showed that the camera heights of the vehicle-mounted cameras from the same map provider are generally the same, and their parameters are publicly available. For example, the camera height of BSV is around 2.5 m.
Both and were assumed to be 0, i.e., the X-coordinate and Y-coordinate of the camera in 3D coordinates were 0. The vanishing point was fixed at the center of the image. We assumed the vehicle-mounted camera was in the center of the road. The road in front of the vehicle-mounted camera was presumed to be flat and straight. Unfortunately, in the actual street image, the vanishing point moved due to the road’s curvature. However, since only part of the original image near the vehicle was selected for conversion, this deviation had little impact on the conversion result. Furthermore, the roads chosen for the experiment are high-grade roads; thus, high-curvature bends are rare.
Accordingly, all the parameters can be expressed using known physical quantities. The simplified formulae are:
Figure 4 shows a schematic diagram of the process of IPM for street-view imageries. The process of camera imaging ranges from the space of to the space of , whereas IPM is the reverse process.
The conversion range needs to be determined before the conversion calculation. The upper end of the conversion range must be below the vanishing point. To ensure the clarity of the converted image, it must be adjusted further downwards. The conversion range’s bottom-left and -right boundaries can be set to the edge of the original shot. These ranges should also be limited to reduce distortion at the edge of the shot. For Baidu Street View, the conversion process is set as in Figure 5.
3.4. Deep-Learning-Based Extraction of Complete Pavement Markings
Road surfaces can have different lighting and road-material environments, resulting in the same type of markings appearing in different shapes and colors in the image. Traditional image-processing approaches extract the target using more individual features. However, when the target has slight distortion, breakage, light changes, or other distractions, these approaches encounter problems due to their inability to cope with various situations. In addition, as street-view imagery is not dedicated to monitoring the road surface, there are many interfering items in the image. Therefore, traditional image-processing methods cannot meet the demand for extracting pavement markings over a wide range and in multiple situations. Even if the pavement marking is distorted or damaged or under different lighting circumstances, it can still be recognized by a human. This is because there are so many characteristics in an image that the misjudgment of a single feature will not influence the human’s recognition of pavement markings.
Instead, we developed a deep-learning-based model for pavement-marking recognition and extraction. Deep-learning-based models can learn features from examples on their own by building artificial neural networks with interconnected neurons transmitting the information. This can mimic the human image-perception process, thus making it possible to recognize and extract pavement markings while ignoring small fading or shadows.
We used the DeepLab V3+ semantic segmentation model, the latest semantic segmentation algorithm model proposed by the Google team. The DeepLab V3+ semantic segmentation model can capture multi-scale features from images via ASPP and explicit object boundaries via the encoder-decoder structure. The training of DeepLab V3+ was conducted on an NVIDIA Quadro P4000 using the PyTorch framework. The datasets were generated with a random sliding window of 321 × 321, with the batch size set to 16 and the learning rate set to 0.007. A total of 78 epochs were trained. Figure 6 shows the structure of DeepLab V3+ for the segmentation of pavement markings.
To train a DeepLab V3+ model for pavement-marking recognition, we used training data from the competition of PaddlePaddle’s unmanned vehicle-lane-line detection (https://aistudio.baidu.com/aistudio/datasetdetail/1919/0, accessed on 13 May 2022). The annotated data were collected from two cities in China, Beijing, and Shanghai, and included various traffic scenarios involving common and uncommon pavement markings. A total of 33 different pavement-marking categories were annotated in the dataset, and 8294 finely annotated lane-line data were available. However, for statistical and inspection purposes, we only selected typical pavement-marking labels, dividing them into line-type markings, arrow-type markings, and evenly spaced-type markings [38]. Figure 7 shows the classification system. The pavement markings in this dataset were primarily clear and intact, with a very sparse sample of pavement markings containing wear.
To train the model to identify better diverse pavement markings and damaged and distorted ones, we also selected street images from the Liuhe District of Nanjing for annotation. As the Liuhe District is far from the core area of Nanjing, the proportion of worn and faded pavement markings is relatively high. As a result, we used this area as a training area to supplement the sample set.
Before training the network, we employed data augmentation to expand the sample data through random cropping, image flipping, minor rotation, and luminance dithering, which has been shown to improve performance by approximately 3% and avoid overfitting problems [45]. Samples in the sample dataset were placed in a 9:1 ratio between the training and validation sets.
For model training, we applied the MobileNet V2 neural network structure as the backbone network, a classical deep-learning-based model with fewer parameters to consider than other neural networks. Therefore, this is suitable for mobile and embedded vision applications [46].
For model validation, we evaluated Precision, Recall, and F1-score. By comparing the image semantic segmentation results predicted by the model with the real ones, each pixel of the image could be divided into the following four categories: true positives (TP), true negatives (TN), false positives (FP), and false negatives (FN).
For each type of pavement marking, Precision refers to the proportion of the correct results in the identified positive samples, and Recall refers to the ratio of the correctly identified positive samples to all the positive samples. The F1-score integrates the two metrics above to make a comprehensive evaluation. These three metrics are as follows [47].
Since the model has different effects for each type of pavement marking, we also calculated the indexes’ macro average and weighted average to get a sense of all types. The macro average is the arithmetic mean value of all classes. In contrast, the weighted average considers the number of samples in each category as a percentage of the overall samples in the average calculation. These two metrics are as follows [47].
3.5. Quantitative and Qualitative Assessment of Pavement-Marking Defects
Our goal was to assess whether there was damage to pavement markings and quantify the degree of damage. The basic idea was to compare the area of the undamaged part of the road with the area of the visible recovered area where the pavement marking would have been if it had not worn away. The flowchart for this step is shown in Figure 8.
The method for extracting the undamaged part of the pavement markings was the local threshold based on the segmentation results using the DeepLab V3+ model. As the road surface may have had an uneven background color under illumination and the aerial view also contained part of the landscape content on both sides of the road, the global threshold segmentation could have interfered. However, an adaptive local threshold enables the pavement markings to be accurately extracted.
The extraction of the recovered range was based on the segmentation results obtained by the semantic segmentation model. If blurred pavement markings were in the model training set, we annotated their recovered shapes. Therefore, by training these samples, minor marking damage did not interfere with the segmentation of the pavement markings. Thus, the extracted markings also contained blurred parts. Based on the segmentation results, image-processing methods such as closed operations and contour approximation could be used to remove minor distortions from the segmentation edges while preserving the original shape of the pavement markings. The pavement-marking defects could be assessed by comparing the area of the undamaged part of the pavement markings with the area of the recovered markings in the visible region.
Assuming that the aberrations caused by perspective were eliminated in the birds’-eye-view conversion step, every block in the real world corresponding to each pixel on the image had the same area. Thus, areas could be compared according to the number of pixels.
We calculated two indexes for each pavement-marking type to measure the defects, and a discriminant matrix was used to combine these indexes. The evaluation results were divided into five grades: no markings, undamaged, slight damage, moderate damage, and severe damage. No markings means no pavement markings were detected. Undamaged means that there is no need for maintenance or service. Slight damage means that there are some visible cracks and other minor defects that do not require immediate repair. Moderate damage means that the defects have reached the point of needing repair. Severe damage means that there is severe damage that urgently needs to be inspected and repaired. Assuming that the aberrations caused by perspective were eliminated in the birds’-eye-view conversion step, every block in the real world corresponding to each pixel on the image had the same area. Thus, areas could be compared according to the number of pixels.
The basic reference index for the integrity of three types of pavement marking is the area ratio, and can be measured as follows:
where is the number of pixels of the undamaged part, is the number of pixels of the recovered part, and is the ratio of to . If is less than a specified threshold, damage is determined to exist and can be quantitatively assessed based on its value. On the other hand, the larger is, the better the integrity of the pavement markings.
For line-type markings, the lengths of lines should also be considered as an index, which can be measured as follows:
where is the length of the line extracted from the undamaged line markings, is the length of the line extracted from the recovered line markings, and is the ratio of to . If is less than a specified threshold, damage is determined to exist and can be quantitatively assessed based on its value.
The discriminant matrix of assessment is shown for the line-type markings in Table 1.
Some indices related to the semantic expressiveness of arrow-type markings should be considered. Considering that the representation of an arrow-type marking is mainly realized by its shape, we used the similarity between the corresponding shape descriptors for the residual marking and the recovered marking to measure the degree of pavement-marking defects. A reasonable shape-similarity measure should allow for the identification of objects that are perceptually similar but not mathematically similar [48]. As a result, Hu moments were employed, as they have translation, rotation, and scale invariance characteristics. Furthermore, contour approximation was conducted, as the perceived appearance of the pavement markings needed to be obtained before calculating the Hu moments.
A grayscale image can be described using its seven Hu-moment invariants, which are expressed as follows [49]:
The following equation is used to measure the distance between the shapes of the undamaged part of the pavement markings and the recovered shapes [49]:
where refers to the undamaged part, refers to the recovered part, and is the distance between shapes.
Since there could be more than one arrow-type marking in a birds’-eye-view image, the result of the area-weighted average distance is applied here:
where refers to the number of pixels of the recovered shape .
Thus, on the pavement of an image monitored by the sampling point, arrow-type markings with a larger area have a greater weight. Suppose the value is greater than the specified threshold. In that case, it is determined that there is a significant difference between the shapes of the undamaged and recovered pavement markings, i.e., there is a breakage in arrow-type markings in the current pavement.
The assessment discriminant matrix for arrow-type markings is shown in Table 2.
Evenly spaced-type markings are judged to be damaged if the undamaged portion corresponding to an element in the markings is too small or disappears altogether. If the area ratio of the undamaged and recovered element is less than a specified threshold, the damage is determined to exist.
The discriminant assessment matrix for evenly spaced-type markings is shown in Table 3.
Although the area ratio is used as an indicator in every discriminant matrix, the evaluation criteria of each type are not the same. This is because the missing effect of different markings is different even under the same missing area. For example, when the area ratio reaches 60%, lane markings are likely to be too thin, shallow, or even missing and will have a greater hidden danger, as the driver cannot recognize the markings. However, although there is apparent damage to pavement markings such as crosswalks, this is not very urgent, as they can still be recognized.
The discriminant matrix is used because the results obtained for the same markings are not scientific and accurate enough if only the area ratio is used as the evaluation index. For example, with the same missing area, the visual effects of arrow markings caused by the internal patchiness of arrows and the external shape of missing arrows are different. The latter is more of a safety hazard than the former and has a higher priority for repair. Thus, the evaluation index combines the various markings’ areas and characteristics.
4. Results
We conducted a case study in Nanjing, China, to evaluate the defects of pavement markings. The study validates the viability of assessing the urban pavement markings based on street-view imageries, semantic image segmentation, and image-processing methods. The sampling points for evaluation were collected at the motorway and trunk roads using OpenStreetMap. Two street-view imageries were retrieved at each sampling point: one towards one end of the road and one towards the other end. A total of 88,827 Nanjing city street-view imageries were downloaded. For each street image, a degradation assessment was performed by calculating the quantitative indexes of three types of pavement markings, and the results were stratified into colors based on the evaluation system. The results allow macro-scale spatial investigation and inference of the factors affecting pavement-marking defects.
4.1. Validation of Semantic Image Segmentation Model
A semantic image segmentation model was trained, and could extract all of the pavement markings from the converted birds’-eye view of the street-view imageries. Since the annotation range included worn and faded markings when labeling the samples, the model could also extract the damaged parts of the pavement markings. The output of the semantic segmentation model approximated the original shape of the pavement markings, which could be used as the result of pavement markings’ recovery with little processing.
After training the DeepLab V3+ semantic segmentation model of pavement markings to obtain a birds’-eye view of the streetscape, the recognition accuracy was evaluated using the accuracy index evaluation model. We used 1200 randomly selected street-view imageries from Qixia District in Nanjing as the test set. They were taken from different road sections at different times of the day under different lighting conditions, with different road surface materials and containing different pavement markings.
We applied the evaluation index of multi-label semantic segmentation model validation by comparing the manually annotated samples on converted birds’-eye views and the output of the semantic segmentation model.
From the confusion matrix (Table 4), there was a certain probability that the three types of pavement markings would be mixed up because the three colors were similar, especially when the pavement markings in an image were incomplete (e.g., the front arrow of the arrow markings was blocked). However, as the same indicator of area ratio was used to evaluate the degree of damage to the three types of pavement markings, a small amount of confusion among the three was allowed.
If the broken pavement marking area loses its color, it is difficult for the machine-vision-based method to extract the markings. However, it is rare for pavement markings to become completely invisible in urban areas. This study looked at the scenario of daily urban monitoring before the pavement markings were totally worn down.
The test set included a total of 314,880,000 pixels, among which 308,711,222 pixels were correctly marked. Accuracy was 98.04%, and mIoU was 82.70%.
Table 5 shows the test result of the model. Due to the large proportion of background (non-marking) area, the overall correctness was higher than that of any of the other three types.
The continuous, homogeneous semantic segmentation results were viewed as a mask based on the semantic segmentation results. Inside this mask, a threshold based was set on the local histogram to divide the image-foreground and image-background sections. Since the color of pavement markings should be lighter than the pavement color regardless of the pavement material, the part of the markings with a clear paint surface could be extracted based on this feature. Then, the defects could be estimated by comparing this component to the recovered part using deep-learning-based extraction.
4.2. Spatial Distribution of Pavement-Marking Defects
4.2.1. Mapping of Pavement-Marking Defects of Three Types of Markings
According to the damage-assessment system, the quantitative assessment results were classified as “no markings”, “undamaged”, “slight damage”, “moderate damage”, and “severe damage”. The results were visualized on the map by layering the color of the sampling points (Figure 9, Figure 10 and Figure 11).
Since each sampling point had two images from opposite camera directions, we used the Disperse Marker function of ArcGIS Pro to avoid a complete overlap of points.
The damage degree of the different pavement markings in the same place was inconsistent. There were roads with clear arrow markings, despite severe damage to the lane markings. Pavement markings with regular intervals were generally more severely worn than other pavement markings, as most were slow markings on high-traffic roads. Therefore, the detection results of the three types of markings complement each other and support the quantitative assessment and precise positioning of worn-out markings, thus supporting the municipal departments’ efficient road maintenance work. Analyzing the spatial distribution of damage for different types of markings also revealed some hidden patterns; thus, the mechanism behind them can be exposed.
4.2.2. Clustering Characteristics of Pavement-Marking Defects
We analyzed the spatial distribution of broken pavement markings at the city level based on the results of qualitative and quantitative assessments. Generally, pavement-marking defects showed prominent clustering characteristics, as the pavement markings on the same road section were in a similar environment and were subject to similar external influences; thus, they are likely to have been worn out for similar reasons. Moreover, due to the zoning-jurisdiction feature of urban management, the near-road sections are painted with markings or simultaneously inspected and repaired. Therefore, the pavement-marking conditions on the same road sections were more similar.
In contrast, pavement markings in different regions showed different characteristics. They are influenced by different regional jurisdictions of municipal departments, as some jurisdictions may have only conducted one round of road maintenance before the street-scene shooting. In contrast, some jurisdictions could have a more significant timespan for the maintenance cycle, etc.
On the one hand, this feature helps to apply big data such as street-view imageries. If sampling points on the same roadway generally exhibit low scores, it indicates that the current roadway desperately needs repair. In contrast, if there are roadways where most of the markings have high scores and only occasional sampling points show worse assessment values, this indicates that the overall marking condition of the road is good. Brakes, oil, etc., could temporarily deface the pavement markings at these lower-rated locations, or the machine may have made a misjudgment due to light, object obscuration, etc. As a result, identifying abnormalities within the entire road section can improve assessment accuracy.
On the other hand, this can enhance repair efficiency by prioritizing the road sections where aggregated, and continuous marking defects occur. After thoroughly repairing these roads, inspection and repair work for scattered anomalies should be performed based on their rating and spatial position.
4.2.3. Conjectures of Causes of Defects Based on Spatial Analysis
Based on the mapping of pavement-marking defects, we analyzed the road sections with pavement-marking defects and speculated on the factors leading to these defects.
The most common situation of pavement-marking defects was when there was a construction site near the road. In a construction zone, pavement markings could be covered by sand and dust, contaminated by construction paint and waste materials, or destroyed due to crushing by dump trucks, heavy concrete transporters, and so on. Figure 12 shows a road section where the markings were badly damaged. It was verified that construction sites, construction facilities, excavation trucks, and other related contents could be seen in the original street-view imageries. Therefore, after each construction project is finished, the municipal department should swiftly organize personnel to go to the corresponding site to fix the pavement markings. Similarly, pavement markings are frequently destroyed near concrete-processing factories and other enterprises, where dump trucks and heavy concrete trucks pass. Therefore, these places are also maintenance priorities that require special attention.
Secondly, traffic volumes have a more significant impact on the state of the pavement markings. As shown in Figure 13, this is near the exit to Jiuhuashan Tunnel. This tunnel is a vital traffic node, helping people from the city’s eastern residential region go to the northern part of the city across the river; therefore, traffic flow is heavy. The pavement markings in this area were highly worn, with some even becoming illegible. Thus, for these critical traffic nodes, the frequency of road maintenance for inspection and repair should be increased to ensure traffic safety.
Thirdly, the tunnel entrances and exits, and the portion connecting the viaduct to the ordinary road, often have severe pavement-marking defects. Figure 14 provides an example. Sampling points located solely at the tunnel’s entrances and exits could have been due to the improper extraction of pavement markings, caused by the poor lighting circumstances induced by the difference in brightness inside and outside the tunnel. However, scores for the sampling points some distance away from entrances and exits were still low.
After manual validation, it was found that this problem did exist. On the one hand, these areas had more deceleration pavement markings. Since the deceleration markings cover the road surface where vehicles move, they are easily worn out. On the other hand, these places are often on uphill and downhill slopes, where the friction between the car wheels and the sloping ground is more remarkable than on the flat ground and, therefore, more prone to damage. However, it is crucial to have pavement markings in these areas to indicate lane changes, slow driving, and other information. Therefore, the pavement markings in these road articulation zones should be considered.
In addition, due to the city’s policy of restricting heavy-truck traffic, large vehicles are limited to driving on the prescribed roads. These roads tend to be high-rated bypass roads on the outskirts of urban centers, which are included in motorway and trunk roads downloaded from OpenStreetMap. Due to the crushing degree of big vehicles on the road surface and passing long-term transport, pavement-marking defects are more severe in these regions (Figure 12). To solve this problem, the frequency of road maintenance should be increased.
5. Discussion
5.1. Evaluating the Spatial Distribution of Pavement-Marking Defects at the City Scale
Previous studies on detecting pavement-marking defects were mainly conducted based on UAVs and professional monitoring vehicles. These approaches face difficulties in their application at the city scale for many reasons. However, the data source of street-view imageries can compensate for the above shortage. Many map vendors make street-view imageries available for free, and generally include all routes that are accessible to automobiles in cities. Our study justifies the idea that street-view imageries can be used as useful data sources to cost-effectively investigate the distribution of pavement-marking defects at the city scale.
Although inspection of pavement-marking defects is not a high priority for every city since pavement-marking deterioration is a slow process, it will cause traffic-safety hazards if not detected and repaired promptly. As a result, the goal needs to be reached with few resources for the urban infrastructure maintenance issue. Thus, AI should be employed, as manual and autonomous inspection utilizing inspection equipment such as UAVs is inefficient for cities with complicated road networks and large areas. In addition, using street-view imageries enables rapid detection and investigation of pavement-marking defects throughout the city. There may be differences in color, shape, and layout rules of pavement markings in different regions. The method used in this study can be applied in all cities covered with street-view imageries worldwide. It is an image-based evaluation without limiting a priori knowledge related to pavement-marking standards.
Compared with conventional pavement-marking defect-detection approaches, our research combines street-view imageries, deep learning, image processing, and GIS analysis tools to discover the spatial distributional characteristics of pavement-marking defects. This allows for the discovery of more universal and macroscopic patterns, which supports the analysis of the factors that cause pavement-marking defects at the city scale. The large-scale assessment of pavement-marking defects will effectively assist city-level municipal management.
5.2. Contributions for Precise Urban Road Maintenance
Pavement markings are essential in the urban traffic system. However, as they are painted on the road surface, they are very vulnerable to wear. Moreover, pavement-marking degradation differs from one roadway to another. During the same period, some pavement markings have become illegible, whereas others remain as good as new. Although frequent comprehensive pavement inspections are needed for pavement-marking preservation, they are inefficient and costly.
However, using images taken from vehicles, qualitative and quantitative assessments of the deteriorated condition of urban pavement markings can quickly be completed. Based on this evaluation, personnel can prioritize the restoration of road sections with severely damaged pavement markings. In addition to previous studies on pavement-marking inspection based on object detection, our method employs a deep-learning-based semantic segmentation model that not only reveals where the damage exists but also provides an evaluation of the degree of the damage.
The proposed method for assessing pavement-marking defects is a generic framework that can be adopted in the context of vehicle image data and big data mining. Although street-view imageries are updated irregularly and with a time lag in lower-level cities in terms of the urban hierarchy, they can be evaluated in the future using vehicle-mounted images of public vehicles and cabs with the development of crowd-sourced data. Hence, this study can support data-driven, accurate, urban road maintenance, thus supporting the construction of smart cities [50].
In the future, access to daily road-surface monitoring will no longer be limited to street-view imagery provided by map vendors. Each car can be outfitted with an optical camera to snap photos of the road while driving. They will form a dynamic network for comprehensive and effective urban environmental monitoring. After privacy-protection processing, the images’ data, location positioning, and shooting time will be automatically uploaded to the cloud server. Based on the data, smart cities will be able to assess the conditions of pavement markings around the city quantitatively. It will be possible to rank the damage level of pavement markings on different streets based on the evaluation results, thereby aiding the decision of repair priority. Furthermore, for city management, the macro-scale evaluation results can be overlaid and compared using big data from other sources, such as traffic flow, functional area distribution, and climate conditions.
5.3. Limitations and Future Steps
The limitations of this study are mainly associated with our exclusive reliance on street-view imageries, which are captured using vehicle-mounted cameras. Under bad weather and poor lighting conditions, these photos fail to precisely reflect the status of pavement markings (Figure 15). Other disturbing factors include the shadows of trees and buildings at the side(s) of a narrow urban street. In this study, the actual shape and area of the paint surface of pavement markings were extracted based on the characteristic that the painted part is brighter than the surrounding road surface. However, the local light reflection on the pavement markings could be changed under these conditions. Harsh shadows and rain can cause part of the area on undamaged markings to become overly dark or even similar in color to the road surface, resulting in these areas being declared worn (Figure 15).
Our testing revealed more cases of error in the evaluation results of small roads within the city. The detection results were less accurate than those on trunk roads, viaducts, motorways, and belt highways. Although these problems can be rectified by taking additional photographs of the same site, few street-view imageries are available with varied capture periods. In the future, the popularity of crowd-sourced data and the supplementation of more data sources could solve the problem.
6. Conclusions
This study attempted to detect and assess pavement-marking defects based on street-view imageries. Nanjing was used as a case study to test our proposed methods and the procedure of detection and assessment at the city scale. In addition, we presented the spatial distribution of pavement marking defects based on the assessment of three types of markings, which can support an analysis of the possible causes of defects.
The framework in this study is applicable to other cities and at a larger geographical scale. Aiming to enhance proper urban road maintenance, our approach is data-driven in nature, benefiting from the ongoing computing-technology advancement and simultaneously showing great potential to contribute to smart-city building and management. As the data source from vehicle-mounted cameras will grow with the increasing development of crowd-sourcing platforms and urban infrastructure development, future work is expected to engage with multiple sources and various types of data. Since pavement markings are used to convey information, the influence of defects on the semantic expression of pavement markings will also be considered in the assessment system in the future.
Author Contributions
Conceptualization, W.K. and T.Z.; methodology, T.Z., X.M. and W.K.; experiments, W.K.; data curation, W.K.; writing—original draft preparation, W.K. and T.Z.; writing—review and editing, T.Z., X.M., S.Z. and M.C.; funding acquisition, T.Z., S.Z. and G.L. All authors have read and agreed to the published version of the manuscript.
Funding
This research was funded by the National Key R&D Program of China, grant number 2021YFE0112300.
Data Availability Statement
Not applicable.
Acknowledgments
We would like to thank the editors and anonymous referees for their constructive suggestions and comments that helped to improve the quality of this paper. We are grateful to Xing Ji, Yuxuan Wang, and Chengwei Zhao for their help with the preparation of the sample dataset for training model.
Conflicts of Interest
The authors declare no conflict of interest.
References
- Carlson, P.J.; Park, E.S.; Andersen, C.K. Benefits of pavement markings: A renewed perspective based on recent and ongoing research. Transp. Res. Rec. 2009, 2107, 59–68. [Google Scholar] [CrossRef]
- Yao, L.; Qin, C.; Chen, Q.; Wu, H. Automatic road marking extraction and vectorization from vehicle-borne laser scanning data. Remote Sens. 2021, 13, 2612. [Google Scholar] [CrossRef]
- Karvonen, A.; Cugurullo, F.; Caprotti, F. Inside Smart Cities; Routledge: London, UK, 2019. [Google Scholar] [CrossRef]
- Yigitcanlar, T.; Desouza, K.C.; Butler, L.; Roozkhosh, F. Contributions and risks of artificial intelligence (AI) in building smarter cities: Insights from a systematic review of the literature. Energies 2020, 13, 1473. [Google Scholar] [CrossRef]
- Liu, Z.; Wu, W.; Gu, X.; Li, S.; Wang, L.; Zhang, T. Application of combining YOLO models and 3D GPR images in road detection and maintenance. Remote Sens. 2021, 13, 1081. [Google Scholar] [CrossRef]
- AAoSHaT, O. Bridging the Gap-Restoring and Rebuilding the Nation’s Bridges; American Association of State Highway and Transportation Officials: Washington, DC, USA, 2008. [Google Scholar]
- Maeda, H.; Sekimoto, Y.; Seto, T.; Kashiyama, T.; Omata, H. Road damage detection and classification using deep neural networks with smartphone images. Comput. Aided Civ. Infrastruct. Eng. 2018, 33, 1127–1141. [Google Scholar] [CrossRef]
- Cugurullo, F. Urban artificial intelligence: From automation to autonomy in the smart city. Front. Sustain. Cities 2020, 2, 38. [Google Scholar] [CrossRef]
- Biljecki, F.; Ito, K. Street view imagery in urban analytics and GIS: A review. Landsc. Urban Plan. 2021, 215, 104217. [Google Scholar] [CrossRef]
- Zhong, T.; Ye, C.; Wang, Z.; Tang, G.; Zhang, W.; Ye, Y. City-scale mapping of urban façade color using street-view imagery. Remote Sens. 2021, 13, 1591. [Google Scholar] [CrossRef]
- Stubbings, P.; Peskett, J.; Rowe, F.; Arribas-Bel, D. A hierarchical urban forest index using street-level imagery and deep learning. Remote Sens. 2019, 11, 1395. [Google Scholar] [CrossRef]
- Wang, Z.; Tang, G.; Lü, G.; Ye, C.; Zhou, F.; Zhong, T. Positional error modeling of sky-view factor measurements within urban street canyons. Trans. GIS 2021, 25, 1970–1990. [Google Scholar] [CrossRef]
- Kang, K.; Chen, D.; Peng, C.; Koo, D.; Kang, T.; Kim, J. Development of an automated visibility analysis framework for pavement markings based on the deep learning approach. Remote Sens. 2020, 12, 3837. [Google Scholar] [CrossRef]
- Kawano, M.; Mikami, K.; Yokoyama, S.; Yonezawa, T.; Nakazawa, J. Road marking blur detection with drive recorder. In Proceedings of the 2017 IEEE International Conference on Big Data (Big Data), Boston, MA, USA, 11–14 December 2017; pp. 4092–4097. [Google Scholar] [CrossRef]
- Chimba, D.; Kidando, E.; Onyango, M. Evaluating the service life of thermoplastic pavement markings: Stochastic approach. J. Transp. Eng. Part B Pavements 2018, 144, 4018029. [Google Scholar] [CrossRef]
- Choubane, B.; Sevearance, J.; Holzschuher, C.; Fletcher, J.; Wang, C. Development and Implementation of a Pavement Marking Management System in Florida. Transp. Res. Rec. 2018, 2672, 209–219. [Google Scholar] [CrossRef]
- Kawasaki, T.; Kawano, M.; Iwamoto, T.; Matsumoto, M.; Yonezawa, T.; Nakazawa, J.; Tokuda, H. Damage detector: The damage automatic detection of compartment lines using a public vehicle and a camera. In Proceedings of the Adjunct Proceedings of the 13th International Conference on Mobile and Ubiquitous Systems: Computing Networking and Services, Hiroshima, Japan, 28 November–1 December 2016; pp. 53–58. [Google Scholar] [CrossRef]
- Cao, W.; Liu, Q.; He, Z. Review of pavement defect detection methods. IEEE Access 2020, 8, 14531–14544. [Google Scholar] [CrossRef]
- Bu, T.; Zhu, J.; Ma, T. A UAV photography–based detection method for defective road marking. J. Perform. Constr. Facil. 2022, 36, 04022035. [Google Scholar] [CrossRef]
- Khan, M.A.; Ectors, W.; Bellemans, T.; Janssens, D.; Wets, G. UAV-based traffic analysis: A universal guiding framework based on literature survey. Transp. Res. Procedia 2017, 22, 541–550. [Google Scholar] [CrossRef]
- Ruiza, A.L.; Alzraieeb, H. Automated Pavement Marking Defects Detection. In Proceedings of the ISARC, International Symposium on Automation and Robotics in Construction, Kitakyushu, Japan, 26–30 October 2020; pp. 67–73. [Google Scholar] [CrossRef]
- Alzraiee, H.; Leal Ruiz, A.; Sprotte, R. Detecting of pavement marking defects using faster R-CNN. J. Perform. Constr. Facil. 2021, 35, 04021035. [Google Scholar] [CrossRef]
- Nguyen, T.S.; Avila, M.; Begot, S. Automatic detection and classification of defect on road pavement using anisotropy measure. In Proceedings of the 2009 17th European Signal Processing Conference, Glasgow, UK, 24–28 August 2009; pp. 617–621. [Google Scholar]
- Mulry, B.; Jordan, M.; O’Brien, D.A. Automated pavement condition assessment using laser crack measurement system (LCMS) on airfield pavements in Ireland. In Proceedings of the 9th International Conference on Managing Pavement Assets, Washington, DC, USA, 18–21 May 2015. [Google Scholar]
- Li, B.; Song, D.; Li, H.; Pike, A.; Carlson, P. Lane marking quality assessment for autonomous driving. In Proceedings of the 2018 IEEE/RSJ International Conference on Intelligent Robots and Systems (IROS), Madrid, Spain, 1–5 October 2018; pp. 1–9. [Google Scholar] [CrossRef]
- Jeong, Y.; Kim, W.; Lee, I.; Lee, J. Bridge inspection practices and bridge management programs in China, Japan, Korea, and US. J. Struct. Integr. Maint. 2018, 3, 126–135. [Google Scholar] [CrossRef]
- Zhang, D.; Zou, Q.; Lin, H.; Xu, X.; He, L.; Gui, R.; Li, Q. Automatic pavement defect detection using 3D laser profiling technology. Autom. Constr. 2018, 96, 350–365. [Google Scholar] [CrossRef]
- Estrin, D.; Chandy, K.M.; Young, R.M.; Smarr, L.; Odlyzko, A.; Clark, D.; Reding, V.; Ishida, T.; Sharma, S.; Cerf, V.G. Participatory sensing: Applications and architecture [internet predictions]. IEEE Internet Comput. 2009, 14, 12–42. [Google Scholar] [CrossRef]
- Chen, C.; Seo, H.; Zhao, Y.; Chen, B.; Kim, J.; Choi, Y.; Bang, M. Pavement damage detection system using big data analysis of multiple sensor. In International Conference on Smart Infrastructure and Construction 2019 (ICSIC) Driving Data-Informed Decision-Making; ICE Publishing: London, UK, 2019; pp. 559–569. [Google Scholar] [CrossRef]
- Li, X.; Li, J.; Hu, X.; Yang, J. Line-cnn: End-to-end traffic line detection with line proposal unit. IEEE Trans. Intell. Transp. Syst. 2019, 21, 248–258. [Google Scholar] [CrossRef]
- Lee, S.; Kim, J.; Shin Yoon, J.; Shin, S.; Bailo, O.; Kim, N.; Lee, T.-H.; Seok Hong, H.; Han, S.-H.; So Kweon, I. Vpgnet: Vanishing point guided network for lane and road marking detection and recognition. In Proceedings of the IEEE International Conference on Computer Vision, Cambridge, MA, USA, 20–23 June 2017; pp. 1947–1955. [Google Scholar] [CrossRef]
- Kim, Z. Robust lane detection and tracking in challenging scenarios. IEEE Trans. Intell. Transp. Syst. 2008, 9, 16–26. [Google Scholar] [CrossRef]
- Cheng, Y.-T.; Patel, A.; Wen, C.; Bullock, D.; Habib, A. Intensity thresholding and deep learning based lane marking extraction and lane width estimation from mobile light detection and ranging (LiDAR) point clouds. Remote Sens. 2020, 12, 1379. [Google Scholar] [CrossRef]
- Song, W.; Jia, G.; Zhu, H.; Jia, D.; Gao, L. Automated pavement crack damage detection using deep multiscale convolutional features. J. Adv. Transp. 2020, 2020, 6412562. [Google Scholar] [CrossRef]
- El-Wakeel, A.S.; Li, J.; Rahman, M.T.; Noureldin, A.; Hassanein, H.S. Monitoring road surface anomalies towards dynamic road mapping for future smart cities. In Proceedings of the 2017 IEEE Global Conference on Signal and Information Processing (GlobalSIP), Montreal, QC, Canada, 14–16 November 2017; pp. 828–832. [Google Scholar] [CrossRef]
- Mahmoudzadeh, A.; Golroo, A.; Jahanshahi, M.R.; Firoozi Yeganeh, S. Estimating pavement roughness by fusing color and depth data obtained from an inexpensive RGB-D sensor. Sensors 2019, 19, 1655. [Google Scholar] [CrossRef]
- Lei, X.; Liu, C.; Li, L.; Wang, G. Automated pavement distress detection and deterioration analysis using street view map. IEEE Access 2020, 8, 76163–76172. [Google Scholar] [CrossRef]
- Cao, M.-T.; Tran, Q.-V.; Nguyen, N.-M.; Chang, K.-T. Survey on performance of deep learning models for detecting road damages using multiple dashcam image resources. Adv. Eng. Inform. 2020, 46, 101182. [Google Scholar] [CrossRef]
- LeCun, Y.; Bengio, Y.; Hinton, G. Deep learning. Nature 2015, 521, 436–444. [Google Scholar] [CrossRef]
- Srinivas, S.; Sarvadevabhatla, R.K.; Mopuri, K.R.; Prabhu, N.; Kruthiventi, S.S.; Babu, R.V. A taxonomy of deep convolutional neural nets for computer vision. Front. Robot. AI 2016, 2, 36. [Google Scholar] [CrossRef]
- Zhang, A.; Wang, K.C.; Li, B.; Yang, E.; Dai, X.; Peng, Y.; Fei, Y.; Liu, Y.; Li, J.Q.; Chen, C. Automated pixel-level pavement crack detection on 3D asphalt surfaces using a deep-learning network. Comput. Aided Civ. Infrastruct. Eng. 2017, 32, 805–819. [Google Scholar] [CrossRef]
- Chen, L.-C.; Papandreou, G.; Schroff, F.; Adam, H. Rethinking atrous convolution for semantic image segmentation. arXiv 2017, arXiv:1706.05587. [Google Scholar] [CrossRef]
- Aly, M. Real time detection of lane markers in urban streets. In Proceedings of the 2008 IEEE Intelligent Vehicles Symposium, Eindhoven, The Netherlands, 4–6 June 2008; pp. 7–12. [Google Scholar] [CrossRef]
- Bertozz, M.; Broggi, A.; Fascioli, A. Stereo inverse perspective mapping: Theory and applications. Image Vis. Comput. 1998, 16, 585–590. [Google Scholar] [CrossRef]
- Chatfield, K.; Simonyan, K.; Vedaldi, A.; Zisserman, A. Return of the devil in the details: Delving deep into convolutional nets. arXiv 2014, arXiv:1405.3531. [Google Scholar] [CrossRef]
- Howard, A.G.; Zhu, M.; Chen, B.; Kalenichenko, D.; Wang, W.; Weyand, T.; Andreetto, M.; Adam, H. Mobilenets: Efficient convolutional neural networks for mobile vision applications. arXiv 2017, arXiv:1704.04861. [Google Scholar] [CrossRef]
- Pedregosa, F.; Varoquaux, G.; Gramfort, A.; Michel, V.; Thirion, B.; Grisel, O.; Blondel, M.; Prettenhofer, P.; Weiss, R.; Dubourg, V. Scikit-learn: Machine learning in Python. J. Mach. Learn. Res. 2011, 12, 2825–2830. [Google Scholar]
- Latecki, L.J.; Lakamper, R. Shape similarity measure based on correspondence of visual parts. IEEE Trans. Pattern Anal. Mach. Intell. 2000, 22, 1185–1190. [Google Scholar] [CrossRef]
- Flusser, J.; Zitova, B.; Suk, T. Moments and Moment Invariants in Pattern Recognition; John Wiley & Sons: Hoboken, NJ, USA, 2009. [Google Scholar] [CrossRef]
- Yeh, A.G.; Zhong, T.; Yue, Y. Hierarchical polygonization for generating and updating lane-based road network information for navigation from road markings. Int. J. Geogr. Inf. Sci. 2015, 29, 1509–1533. [Google Scholar] [CrossRef]
Figure 1.
Examples of pavement-marking defects on the road. (a) Line-type marking defects, (b) arrow-type marking defects, (c) evenly-spaced-type marking defects.
Figure 1.
Examples of pavement-marking defects on the road. (a) Line-type marking defects, (b) arrow-type marking defects, (c) evenly-spaced-type marking defects.
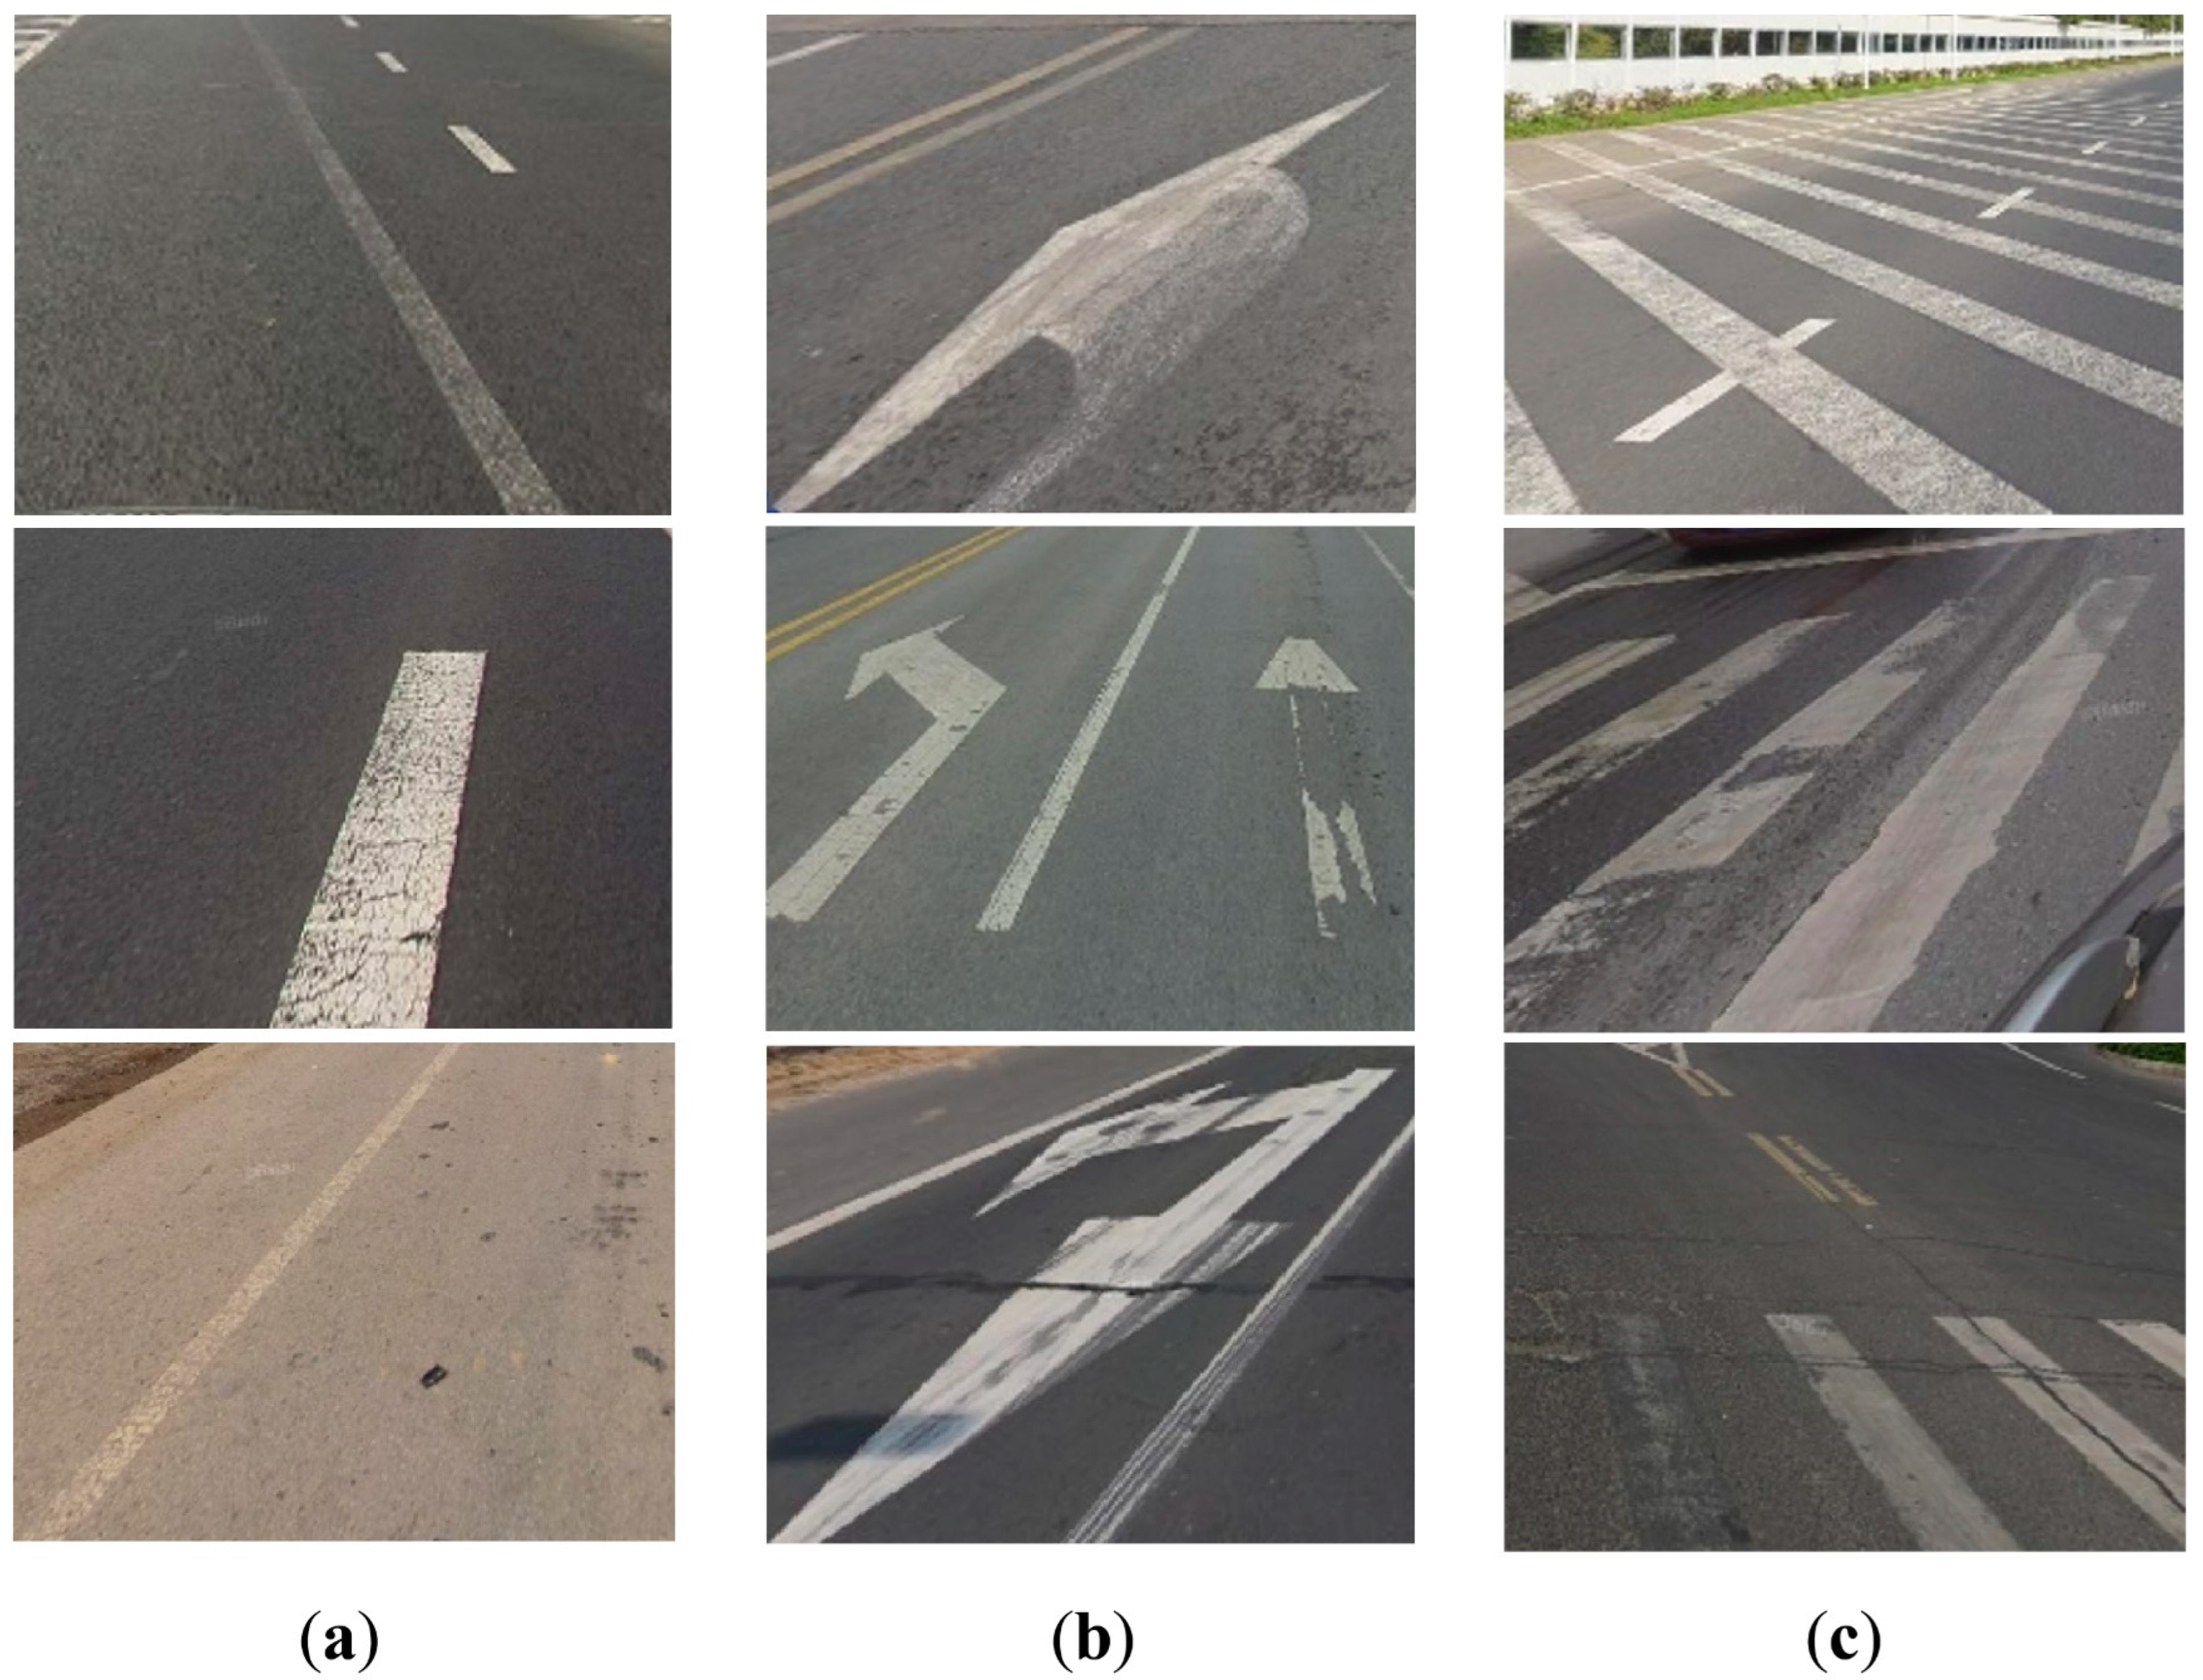
Figure 2.
The flowchart of assessing pavement-marking conditions using street-view imageries.

Figure 3.
The study area of this experiment. (a) High-grade roads in Nanjing City, (b) a detailed display of roads in the middle of the city.
Figure 3.
The study area of this experiment. (a) High-grade roads in Nanjing City, (b) a detailed display of roads in the middle of the city.

Figure 4.
Schematic diagram of process of inverse perspective mapping. (a) The XY plane in the space, i.e., the top view of the vehicle-mounted camera; (b) the schematic diagram of the three defined spaces and the camera position in the space; (c) the YZ plane in the space, i.e., the side view of the vehicle-mounted camera.

Figure 5.
The conversion process of BSV from horizontal to vertical: (a) the ROI range for IPM on BSV, (b) the transformed image of panel (a) using inverse perspective mapping, and (c) the output image of the conversion process.
Figure 5.
The conversion process of BSV from horizontal to vertical: (a) the ROI range for IPM on BSV, (b) the transformed image of panel (a) using inverse perspective mapping, and (c) the output image of the conversion process.

Figure 6.
Structure of DeepLab V3+ for segmentation of pavement markings.

Figure 7.
The classification system of pavement markings for segmentation by DeepLab V3+.

Figure 8.
Flowchart of quantitative assessment on defects of three types of pavement markings. (a) An example of line-type markings, (b) an example of arrow-type markings, (c) an example of evenly-spaced-type markings.
Figure 8.
Flowchart of quantitative assessment on defects of three types of pavement markings. (a) An example of line-type markings, (b) an example of arrow-type markings, (c) an example of evenly-spaced-type markings.

Figure 9.
The assessment results for line-type pavement markings of each sampling point in Nanjing. (a) Location of detected roads in Nanjing, (b) an overview of the assessment results of line-type markings, and (c) a detailed display of the marked areas in panel (b).
Figure 9.
The assessment results for line-type pavement markings of each sampling point in Nanjing. (a) Location of detected roads in Nanjing, (b) an overview of the assessment results of line-type markings, and (c) a detailed display of the marked areas in panel (b).

Figure 10.
The assessment results for arrow-type pavement markings of each sampling point in Nanjing. (a) Location of detected roads in Nanjing, (b) an overview of the assessment results of arrow-type markings, and (c) a detailed display of the marked areas in panel (b).
Figure 10.
The assessment results for arrow-type pavement markings of each sampling point in Nanjing. (a) Location of detected roads in Nanjing, (b) an overview of the assessment results of arrow-type markings, and (c) a detailed display of the marked areas in panel (b).

Figure 11.
The assessment results for evenly spaced-type pavement markings of each sampling point in Nanjing. (a) Location of detected roads in Nanjing, (b) an overview of the assessment results of evenly-spaced-type markings, and (c) a detailed display of the marked areas in panel (b).
Figure 11.
The assessment results for evenly spaced-type pavement markings of each sampling point in Nanjing. (a) Location of detected roads in Nanjing, (b) an overview of the assessment results of evenly-spaced-type markings, and (c) a detailed display of the marked areas in panel (b).

Figure 12.
An example of road markings affected by both construction site and heavy-truck access. (a) Approximate location in Nanjing city, (b) explicit position of the images captured at sampling point, (c) original street-view image of the sampling point, (d) converted birds’-eye view of panel (c), (e) assessment of pavement markings at the sampling point.

Figure 13.
An example of pavement markings on the road near the exit of Jiuhuashan Tunnel. (a) Approximate location in Nanjing City, (b) explicit position of the images captured at the sampling point, (c) original street-view image of the sampling point, (d) converted birds’-eye view of the panel (c), (e) assessment of pavement markings at the sampling point.

Figure 14.
An example of pavement markings on the portion connecting the ordinary road to the viaduct. (a) Approximate location in Nanjing city, (b) explicit position of the images captured at the sampling point, (c) original street-view image of the sampling point, (d) converted birds’-eye view of the panel (c); (e) assessment of pavement markings at the sampling point.

Figure 15.
Examples of misjudgments on street-view imageries shot in bad conditions. A Shadow interference on the path, B Interference caused by poor lighting and surface water, (a,e) are original images of A and B, (b,f) are the birds’-eye-view images of A and B, (c,g) are the recovered part of pavement markings of A and B predicted by the DeepLab V3+ model, (d,h) are the undamaged part of pavement markings of A and B extracted by a local threshold, which has a large discrepancy from the real situation in panel (b,f).


Table 1.
The discriminant matrix of assessment on line-type marking defects.
| Area Ratio | ||||||
|---|---|---|---|---|---|---|
| 0 | 90–100% | 80–90% | 60–80% | 0–60% | ||
| Length Ratio | 0 | / 1 | / | / | / | / |
| 90–100% | / | Un-d 2 | Un-d | Slt-d | M-d | |
| 80–90% | / | Un-d | Slt-d 3 | M-d | M-d | |
| 70–80% | / | Slt-d | M-d | M-d 4 | Sv-d | |
| 0–70% | / | M-d | M-d | Sv-d | Sv-d 5 | |
1 / refers to no line-type markings; 2 Un-d refers to undamaged; 3 Slt-d refers to slight damage; 4 M-d refers to moderate damage; 5 Sv-d refers to severe damage.
Table 2.
The discriminant matrix of assessment on arrow-type marking defects.
| Area Ratio | ||||||
|---|---|---|---|---|---|---|
| 0 | 85–100% | 75–85% | 60–75% | 0–60% | ||
| AWD of Hu | No Markings | / 1 | / | / | / | / |
| 0–1 | / | Un-d | Un-d | Slt-d | M-d | |
| 1–5 | / | Un-d | Slt-d | M-d | M-d | |
| >5 | / | Slt-d | M-d | M-d | Sv-d | |
1 / refers to no arrow-type markings.
Table 3.
The discriminant matrix of assessment on evenly spaced-type marking defects.
| Area Ratio | ||||||
|---|---|---|---|---|---|---|
| 0 | 85–100% | 75–85% | 50–75% | 0–50% | ||
| Element Loss | No Markings | / 1 | / | / | / | / |
| No Loss | / | Un-d | Un-d | Slt-d | Sv-d | |
| Loss | / | Slt-d | M-d | Sv-d | Sv-d | |
1 / refers to no evenly-spaced-type markings.
Table 4.
The confusion matrix of the multi-label semantic segmentation model.
| Predicted Outcome | Ground Truth | |||
|---|---|---|---|---|
| Background | Line | Arrow | Evenly Spaced | |
| Background | 293,049,472 | 1,476,021 | 248,676 | 302,936 |
| Line | 2,238,121 | 9,454,275 | 193,597 | 86,328 |
| Arrow | 453,794 | 287,205 | 2,581,344 | 35,489 |
| Evenly spaced | 615,122 | 231,184 | 305 | 3,626,131 |
| Sum | 296,356,509 | 11,448,685 | 3,023,922 | 4,050,884 |
Table 5.
The multi-label classification reports macro-average and the weighted average for Precision, Recall, and F1 score.
Table 5.
The multi-label classification reports macro-average and the weighted average for Precision, Recall, and F1 score.
| Type | Precision | Recall | F1-Score |
|---|---|---|---|
| Background | 0.99 | 0.99 | 0.99 |
| Line | 0.83 | 0.79 | 0.81 |
| Arrow | 0.85 | 0.77 | 0.81 |
| Evenly spaced | 0.90 | 0.81 | 0.85 |
| Macro avg | 0.89 | 0.84 | 0.86 |
| Weighted avg | 0.98 | 0.98 | 0.98 |
Publisher’s Note: MDPI stays neutral with regard to jurisdictional claims in published maps and institutional affiliations. |
© 2022 by the authors. Licensee MDPI, Basel, Switzerland. This article is an open access article distributed under the terms and conditions of the Creative Commons Attribution (CC BY) license (https://creativecommons.org/licenses/by/4.0/).
Share and Cite
MDPI and ACS Style
Kong, W.; Zhong, T.; Mai, X.; Zhang, S.; Chen, M.; Lv, G. Automatic Detection and Assessment of Pavement Marking Defects with Street View Imagery at the City Scale. Remote Sens. 2022, 14, 4037. https://doi.org/10.3390/rs14164037
AMA Style
Kong W, Zhong T, Mai X, Zhang S, Chen M, Lv G. Automatic Detection and Assessment of Pavement Marking Defects with Street View Imagery at the City Scale. Remote Sensing. 2022; 14(16):4037. https://doi.org/10.3390/rs14164037
Chicago/Turabian StyleKong, Wanyue, Teng Zhong, Xin Mai, Shuliang Zhang, Min Chen, and Guonian Lv. 2022. "Automatic Detection and Assessment of Pavement Marking Defects with Street View Imagery at the City Scale" Remote Sensing 14, no. 16: 4037. https://doi.org/10.3390/rs14164037
Note that from the first issue of 2016, this journal uses article numbers instead of page numbers. See further details here.