
Influence of Block Geometry Configuration on Multi-Image Dense Matching


1
Department of Engineering and Architecture, University of Parma, Parco Area delle Scienze, 181/a, 43124 Parma, Italy
2
Centre for Geotechnical and Materials Modelling, The University of Newcastle, Callaghan, NSW 2308, Australia
*
Author to whom correspondence should be addressed.
Remote Sens. 2022, 14(15), 3784; https://doi.org/10.3390/rs14153784
Submission received: 22 June 2022
/
Revised: 2 August 2022
/
Accepted: 2 August 2022
/
Published: 6 August 2022
(This article belongs to the Special Issue New Trends in High Resolution Imagery Processing)
Abstract
:Digital photogrammetry is a widespread surveying technique in different fields of application due to its flexibility, versatility and cost-effectiveness. Despite its increasing automation and simplicity, a proper image block design is crucial to ensure high standards of performance and accuracy. Studies on camera network design have been largely dealt with in the scientific literature with reference to image orientation process, while they are still poor on dense matching. This paper investigates the influence of different block geometry configurations on multi-image dense matching. Starting from the same orientation solution, dense matching was performed considering different combinations of number of images and base length distance between the first and the last image within a strip. The raster Digital Elevation Models (DEM) resulting from each sequence of images were compared with a reference DEM to assess accuracy and completeness. The tests were conducted using different cameras and at various test sites to assess different survey conditions and generalize the findings. The presented results provide some operational guidance on block geometry optimization to maximize the accuracy and completeness.
1. Introduction
Digital photogrammetry is currently a well-established and widely used surveying technique in different fields of application due to its cost-effectiveness, scalability, accuracy and simplicity of components [1]. Close-range terrestrial photogrammetry and Unmanned Aerial Vehicles (UAVs) are commonly used to support routine geohazard assessments for major infrastructure corridors, construction works and mining operations. Their application is particularly cost-effective in supporting landscape monitoring [2,3] and surveying landslides and rock slope instabilities [4,5,6,7,8], particularly for extended, hazardous and barely accessible areas [9].
Several geoscience domains use photogrammetric survey techniques to assess soil erosion [10,11,12], mass movement [13,14,15,16] and coastal and fluvial morphology [17,18]. In ecology and biology, soil geometry and conditions are investigated to infer the relationship with vegetation, animal life [19] and climate change [20]. In the architectural and cultural heritage domains, photogrammetry is employed to document the state of conservation of buildings and support maintenance and restoration interventions [21,22,23,24].
Recent advances in data acquisition and processing have further enhanced the versatility and flexibility of digital photogrammetry and made it user-friendly. The availability of a wide range of high-performance and inexpensive digital sensors ensures accurate results even with consumer-grade digital cameras [25].
The development of Structure from Motion (SfM) and dense matching algorithms allows practitioners to obtain dense point clouds (comparable to those acquired by range-based survey techniques) with high levels of automation [26]. Simultaneously, growing computational capabilities and software developments have increased automation and performance in the processing of large image datasets.
Nevertheless, to ensure high standards of performance and accuracy, adequate field surveys and processing have to be properly identified accordingly to the specific field conditions. In particular, image acquisition geometry has to be accurately investigated. This paper investigates the influence of different block geometry configurations on multi-image dense matching accounting for various numbers and spatial distributions of images.
The number of images framing the same area determines the redundancy of observations for the reconstruction of 3D points, and thus it affects the reliability of the survey. At least two images are required to capture the area of interest, and applications of such a network can be found in fixed monitoring systems [27,28]. Multi-image systems are currently used for most photogrammetric applications [1,29], and the number of images varies according to the site characteristics (extension, shape complexity and occlusions) and the objective of the survey (accuracy and detail).
Previous studies have shown that the use of a higher number of images improves the quality and accuracy of the survey [2,16]. However, given the high storage capacity and capture-efficiency of new digital cameras and the high software and hardware processing performance recently achieved, the risk becomes to over-capture images: the increase in accuracy is not linearly correlated to the number of images as the benefit becomes irrelevant above a certain number of images [30,31] and results in unnecessary computation costs.
The base length between adjacent images affects the ray intersection angle, and the greater the angle of intersection, the greater the accuracy of the 3D point reconstruction. For parallel axis acquisition schemes, wide base lengths result in higher accuracies, especially in the direction of the camera axis, which is the most affected by the error. At the same time, a proper image overlap needs to be preserved. Convergent image configurations allow increasing the base length while maintaining the image overlap and, by improving the ray intersection angle, strengthening the block geometry [31]. Nevertheless, the convergence angle should not affect the perspective changes in the scene and the successful matching of corresponding points [10].
Studies on camera network design addressing the number of images, side overlap and intersection angle have been largely covered in the scientific literature, both from theoretical [2,31,32] and applied perspectives [16,33,34,35,36,37]. However, few works have considered a wide range of different configurations and conducted a thorough examination of the implications in relation to the same number of images but with different base-lengths, varying number of images within the same strip, symmetrical/asymmetrical capture geometry and so forth. Previous studies mainly focused on the final accuracy of the whole photogrammetric process [26], mixing the effect of image orientation and dense (multi-image) matching. The influence of block geometry on dense matching remains a rarely investigated topic.
For this purpose, in this paper, a unique orientation solution was computed and kept fixed to initialize all the dense matching tests, performed, instead, on different combinations of number of images and spatial distributions. The decoupling of dense matching from orientation allows a better understanding of its influence with respect to different multi-image configurations. Further investigations were conducted considering different multi-image dense-matching approaches.
Dense matching strategies have long been considered and compared in the scientific community for the evaluation of their accuracy and general performance [26,38,39]. In this paper, two commonly implemented approaches for dense matching (i.e., Multiview Stereo-Matching—MVS in image space and true multi-image matching in object space) were considered and analyzed to assess their behavior in relation to different block configurations. It is worth noting that the objective of this work is not to identify the gaps of the algorithms used in the current software commonly applied but to assess their applicability and efficiency in the 3D construction using different multi-view configurations.
The paper is organized as follows. Section 2 introduces the theoretical background on the estimation of the expected accuracy and the multi-image matching algorithms alongside the methodology adopted in this study. Section 3 and Section 4 present and discuss the results, while Section 5 presents our conclusions.
2. Materials and Methods
The influence of block geometry on dense matching was evaluated considering different configurations accounting for a variable number of images and base lengths. The tests were conducted using different cameras and different test sites to assess various survey conditions and generalize the results. Two different dense-matching approaches (MVS and true multi-image matching in object space) were considered and compared.
2.1. Test Overview
Terrestrial photogrammetric blocks consisting of one single strip of seven images were considered to ensure a sufficient variability of image combinations. Images were acquired in a near nadir configuration, with a slightly convergent axis to ensure about 100% overlap between all the images in the strip and strengthen the camera network, resulting in the reduction of systematic Digital Elevation Model (DEM) errors [40]. The maximum base (B_max) to object distance (Z) ratio was set to avoid excessive changes in perspective between the first and last images of the strip. This acquisition scheme (Figure 1) allowed testing of all the possible combinations of number of images and base length.
The focus of this work was on dense matching only, and the orientation was not evaluated in relation to different block geometries. Nevertheless, the orientation solution (with related errors) impacts the dense matching; thus, to obtain the same effect of potential orientation errors in all the tests, a Bundle Block Adjustment (BBA) was performed on all the seven images, and the estimated Interior and Exterior Orientation (IO and EO) parameters were kept fixed and used to run all the dense-matching tests.
The dense matching was computed considering different combinations of number of images (referred to as multiplicity—M) and base length distance between the first and the last image considered in a specific strip (referred to as max-base—B). Since a total of seven images were taken (Figure 1), the multiplicity M was assumed to range between 2 and 7, while the max-base B within a considered strip was assumed to vary between 1 and 6 times the average base length (b) between consecutive images, i.e., B = N ∗ b where N = 1…6 (N = max-base factor). Note that, for simplicity, in the following, the values of multiplicity will be addressed by M followed by the number of images (e.g., M2, M3 to M7), and the max-base values will be provided in the form B1, B2 to B6, which stand for B1 = 1 ∗ b, B2 = 2 ∗ b and so forth.
The combination of all possible multiplicity and max-base values results in 120 different configurations of images for each strip. As shown in Table 1, for each multiplicity/max-base pair, different image configurations are available, ranging from a minimum of one configuration for the couples “B6-M2” and “B6-M7”, to a maximum of 12 configurations for the pair “B5-M4”.
The processing of each sequence of images resulted in the corresponding point cloud Digital Surface Model (DSM) and raster Digital Elevation Model (DEM). To assess the accuracy and completeness, the results were evaluated by comparing the DEMs obtained with a reference DEM. Despite the recommendation of some scholars to work on the 3D point clouds (which are the raw output of the dense matching process) [26], in this case, the DEMs were preferred for their continuity and higher computational efficiency.
2.2. Theoretical Background
The theoretical precision of the models in relation to different block geometries can be modelled according to previous studies in the literature. The expected precision of a stereo pair is described by Kraus [32] and outlined in Equation (1). While the solution is generally used to estimate the theoretical precision for stereo restitution in the normal case, it can also be extended to slightly convergent stereo pairs [41], such as those considered in this study.
In Equation (1), Z is the object distance, B is the base length, represents the image scale (Z/c where c is the principal distance of the optical system), and is the expected precision of the parallax between two homologous points.
Equation (1) provides the precision along the direction parallel to the camera axis, which usually (except for very wide base-lengths) is the direction with the highest uncertainty. For this study, all parameters can be considered constant, except for the base length. Therefore, the expected uncertainty (sz) for stereo pairs is inversely proportional to the base length and increases as the base length decreases. Equation (1) can be used to estimate the expected precision of M2 models (stereo-pair models) as the base length changes, thereby, obtaining a theoretical trend as shown in Figure 2a.
In multi-image block configurations, the expected precision cannot be computed applying a closed-form equation but can be estimated through a simulated least-squares (LS) Bundle Block Adjustment, as for the homologous rays. Figure 2b shows the result of a LS computed on a block with max-base equal to B6 and accounting for different image configurations from 2 to seven images. This is a numerical solution that is affected by the base to distance ratio (a similar geometry to the real performed acquisition was applied); however, it is useful to analyze the expected trend.
If the stereo-pair (M2) is considered as a starting image configuration, intermediate additional images within the strip improve the precision up to 22% with a linear trend (Figure 2b). As far as the dense matching algorithms are concerned, the problem of 3D reconstruction from multiple images has been an important topic both in photogrammetry and computer vision [26,38]. To date, several multi-view matching algorithms were implemented, which allow reconstructing 3D points by triangulating in space corresponding rays between images.
All these algorithms compare pixel values and search for a solution optimizing a cost function that usually considers both image similarity and geometric coherence. However, two main approaches are currently commonly implemented for multi-view (i.e., using more than two images) reconstruction, concerning the number of images that are simultaneously considered for the definition of the cost function. The first approach is MVS, which works on couples of images (stereo-pairs) and searches for the matches in the images space. For each stereo-pair, corresponding points are matched along the epipolar lines and, then, triangulated in space to produce a corresponding depth map. The final 3D object surface is obtained by merging pair-wise depth maps. The second approach performs an actual multi-view matching directly in the 3D Euclidean space defined by a specific coordinate reference system.
In this approach, the search space of the matching solution coincides with the object space (rather than image space) with all images concurring simultaneously, i.e., a point in the 3D space is adjusted and its corresponding image point position is calculated on all images defining the location of the matching image patch. Collecting the matching costs for all the patches, the 3D solution providing the optimal cost is computed (e.g., with a semi-global matching algorithm). In other words, this method computes a true multi-view matching between all the images framing the point to be reconstructed [38,42].
In both approaches, the base length between images considered in the matching affects the ray intersection angle and, therefore, the precision of the observations. The multiplicity of images provides more redundant measurements and additional constraints to the 3D point reconstruction [43]; however, at the same time, it significantly influences how different and potentially conflicting observations are merged and weighted to obtain a unique 3D surface.
2.3. Software Packages
In this paper, the two different algorithmic behaviors were considered to be represented by two well-known software packages, namely Agisoft Metashape Professional (version 1.5.4) [44] and MicMac (version 1.1) [45].
Metashape is a commercial software package, developed by Agisoft LLC (St. Petersburg, Russia). It is largely used by the scientific and professional community. Although the general approaches and methods used by the software are well known, the specific matching algorithmic implementation is not known since it is a commercial package. Nevertheless, the available documentation indicates that the image matching algorithm is a Semi–Global MVS matching method [26], and the dense surface reconstruction is based on pair-wise depth map computation. Depth maps are calculated using the stereo-pairs [46] and are then merged to obtain a single, final, 3D dense point cloud. For a review and examples of depth map fusion strategies, the reader is referred to [47].
MicMac is an open-source package developed by the Institut National de l’information Géographique et Forestière (IGN) (Paris, France) and the National School of Geographic Sciences (ENSG) (Champs-sur-Marne, France). It implements both matching approaches. It is organized in several modules that allow the user to follow all the steps of a typical photogrammetric process. A thorough description of the methods it implements can be found in the literature [42,45,48,49]. Image dense matching is solved as an energy function minimization problem, which seeks a disparity map that minimizes energy. With high-resolution images, the software applies a multi-resolution approach using a coarse-to-fine resolution disparity map evaluation.
It implements two alternative restitution geometries for disparity calculation, called “image” and “ground” geometry. While the former works in image space, matching a master image and a set of slave images with a similar methodology to the one implemented by Metashape, the latter computes all the disparities directly in the 3D Euclidean space. In this approach, the search space is the Z coordinate, and the similarity is calculated from the normalized cross correlation (NCC) coefficient, used as a function of multiple images. The “ground” geometry method was adopted in the current work to obtain a different behavior to Metashape.
To evaluate the difference between MVS and true multi-view matching methods, all tests were run with both software packages. For brevity, the results provided by Metashape were thoroughly presented, while findings using MicMac were addressed in the discussion as a comparison and check of specific results.
2.4. Study Sites
Four study sites were considered with different characteristics and complexity (Figure 3). Test site A consists of a brick wall of a building inside the campus of the University of Parma (Italy). It is a simple wall, with regular planar geometry of about 9 × 5 m2, without protruding elements and few openings, characterized by a recognizable and well-contrasted pattern made of bricks. The site was chosen for its regular shape to test the different block geometry configurations on objects with no evident complexity.
Sites B, C and D are sections of sub-vertical rock faces characterized by higher complexity and irregularities. Sites B and C belong to the same rock wall located in the municipality of Pollein in Aosta Valley (Aosta—Italy). The rock face resulted from the erosive activity of the Comboé river, a typical alpine stream that excavated a deep rock canyon. The two areas selected have an extension of about 34 × 22 m2 and 26 × 18 m2 and are characterized by a low presence of vegetation and minor occlusions. Site D, instead, is in the municipality of Arnad (Aosta—Italy), has a glacial origin and presents a more regular surface with less jutting elements. The site shows some vegetation, including bushes and outcropping trees. It extends about 33 × 32 m2, which is similar to the surface area of sites B and C.
In addition, four virtual test sites were considered (A1, B1, C1 and D1) (Figure 4). The mesh models obtained from terrestrial laser scanning (TLS) surveys of sites A, B, C and D were imported into the modelling software Autodesk 3D Studio Max [50] and used as the virtual surface to be surveyed. A well-contrasted black and white texture, ensuring easy feature extraction to facilitate image matching, was applied to the surface. Diffuse ambient light was used to illuminate the scene well and uniformly and to avoid that sharp shadows could prevent the correct reconstruction of some parts of the model. Virtual sensors, represented by the rendering camera provided by the software, were used to capture images following the same procedure accounted for the real test sites.
This approach was considered to prevent errors resulting from the estimation of interior and exterior orientation parameters as to the position, rotation and focal length (lens distortions were assumed to be absent) of the virtual cameras are exactly known. The virtual acquisitions have therefore allowed acquiring data under controlled conditions and, hence, avoiding any contingent environmental factors (such as unfavorable lighting conditions, not well-distinguished patterns) that could potentially affect the results.
2.5. Image Sensors
Three different cameras were considered in this study to expand the available dataset and check possible related effects of equipment (sensor and optic quality) and acquisition geometry on results. The three camera models used were a Nikon D3, Nikon Coolpix S3100 and ELP USB08MP02G, and the specifications are summarized in Table 2.
The three cameras are off-the-shelf solutions and have different sensors and geometric features. The ELP USB08MP02G is a Plug-&-Play (UVC compliant) USB2.0 camera module, which adopts the SONY IMX179 Color CMOS Sensor characterized by a resolution of 8 MPixel and a pixel size of about 1.4 µm. The module can be equipped with different optics. During these tests, 2.8–12 mm (i.e., 21–95 mm 35 mm equivalent) zoom lenses were used.
The Nikon S3100 is a compact digital camera equipped with a 14 MPixel 1/2.3″ sized CCD sensor and a 5× wide-angle optical Zoom-NIKKOR glass lens (4.45–22.3 mm or 26–130 mm 35 mm equivalent focal length). The Nikon D3 is a full-frame DSLR camera, equipped with a CMOS sensor with 12.1 MPixel resolution (4256 × 2832 pixel) and mounted fixed focal length optics. The Nikon D3 camera model is currently considered obsolete as new modern DSLR cameras have much higher resolution (and better quality) sensors. Nevertheless, it was used in this specific application because its sensor resolution is comparable to those of the other two sensors.
2.6. Data Acquisition
The block geometry was the same for all the test sites. A total of seven images were taken with a regular base length along a straight line parallel to the object. The capturing positions of the various sensors during the survey campaign were approximately the same. The Nikon D3 and Nikon S3100 cameras were hand-held, while the USB camera was installed on a tripod. An almost 100% overlap (except for the occlusions caused by rock wall irregularities) between all images was pursued to ensure the highest DSM completeness despite the use of different combinations of images.
In the architectural case study (Site A), only the Nikon D3 and Nikon S3100 cameras were used. At this site, the distance from the object was equal to 14.5 m and the base length was 1.2 m, while the adopted focal lengths were 50 mm for Nikon D3 and 8.8 mm (51 mm equivalent) for the Nikon S3100. For sites B, C and D, the images were acquired with all three types of cameras. The distance from the rock walls varied in a range of 55 to 90 m due to accessibility and safe operational conditions, while the base lengths varied between 5.5 and 6 m. The Nikon D3 mounted a fixed focal length optic of 85 mm and the zoom lenses of the USB and S3100 were set to approximately frame the same area as the D3 image block, resulting in 10.1 mm (80 mm equivalent) for the USB camera and 13.5 mm (79 mm equivalent) for the S3100.
For all test sites, several Ground Control Points (GCP) (11, 27, 25 and 29 GCP for sites A, B, C and D, respectively) were acquired with a Topcon Image Station IS203 total station to constrain the image orientation. In addition, a laser scan acquisition was performed using a Leica C10 laser scanner to have a reference ground truth for the photogrammetric assessment of the models and a 3D mesh for the virtual model.
Image acquisitions were also performed for all the virtual test sites. Seven rendering cameras were positioned in front of each virtual vertical surface to simulate the real image block. To better control the EO parameters, for each site, the object distance was kept equal to the real one, while the base length was regularized and assumed equal to the real average base length. The position of the cameras was set to ensure a convergent geometry and perfectly horizontal optical axis.
Regarding the IO parameters, the same focal lengths as for the Nikon D3 camera, were considered, and the lenses were assumed to be distortion-free. The scene framed by each camera has then been rendered to obtain seven images similar to the ones obtained at the real sites. Rendering options were set to maintain an image resolution equal to the one of the Nikon D3. Table 3 shows the camera network characteristics and the GSD for the different sites and camera models.
2.7. Image Processing
The image orientation process followed a similar workflow for all test sites and camera models. All 15 blocks (four for each environmental test site and three for the architectural site) were processed using the commercial software package Agisoft Metashape Professional.
For the processing of images acquired using real sensors, the BBA was constrained by the GCP. Initially, all the surveyed reference points were considered as GCP to improve orientation stability and reliability. Then, to assess the orientation’s accuracy, most of the points were unconstrained and used as Check Points (CP), while only four points at the corners and one in the center of the model were kept as GCP. Table 4 lists the residuals on CP for the four sites. Regarding the camera calibration, an on-the-job self-calibration procedure was applied in all cases. This procedure is generally recommended for cameras with not stable optics, such as the compact and USB cameras used in this study. Nevertheless, to ensure uniformity of results, an on-the-job calibration was also performed for the Nikon D3.
In the virtual cases, no GCP were used to constrain the BBA; however, all the EO and IO parameters were fixed, since they are all known. Therefore, only tie point extraction was performed to initialize the dense matching. The orientation obtained for each block, was maintained for all the following elaborations.
For each block, starting from the same orientation, dense matching was performed considering 120 combinations of images, accounting for different multiplicity and max-base, as described in Section 2.1.
The entire process was performed within Metashape by the use of a specifically developed Python script to automate the processing steps. For each of the 120 image combinations, tie points were extracted to initialize the dense matching. Then, the dense cloud and the 3D mesh were obtained. Finally, raster DEM were produced within given boundaries and referred to a given reference plane.
The process parameters were set to reach the best quality provided by the software. Interpolation was disabled to avoid incorrect surface reconstruction in correspondence of holes, and no decimation was applied to mesh triangles to preserve all the reconstructed faces. The raster DEM was then generated by projecting the 3D model on to a vertical plane passing through a midpoint of the reconstructed DSM. The plane position and the DEM boundaries are the same for all the models within the same test site, so that the DEM grids are perfectly overlapping. A total of 1800 raster DEM (for the 15 image blocks) were obtained, with a resolution equal to 1 cm (consistent with the GSD of all blocks).
Each DEM was compared to a site-specific reference DEM. For the real acquisitions TLS triangulated data were used as a reference, while, for the virtual sites, the original 3D mesh models were used. A MATLAB [51] sub-routine was written to automate the comparisons, focusing on the evaluation of the distance between the DEMs and the reference model (differences in elevation) and on the estimation of the completeness of each model (corresponding to the number of reconstructed points).
To compute differences in elevation, only the reconstructed cells in all the 120 DEMs within the same test site were considered, excluding the effect of variable occlusions depending on the geometry of the block. For each DEM, the mean, minimum, maximum values, standard deviation, root mean square error (RMSE) and median of the differences were computed. The degree of accuracy was inferred from standard deviation, considering values from 5th to 95th percentile, to remove the influence of possible outliers.
The completeness of each DEM was considered as the ratio between the number of cells reconstructed on that DEM and the total number of cells reconstructed at least on one DEM within the site. The results of the comparisons were grouped and averaged according to max-base and multiplicity values.
3. Results
The results refer to DEM accuracy and completeness. The influence of max-base length is discussed first, and then the influence of multiplicity is examined. The combination B1-M2 (stereo-pair combination) was assumed as basic combination and excluded from the graphs. Its corresponding value of standard deviation is reported in the main text and captions. The values of standard deviation are expressed in GSD units for easier comparison among sites and cameras.
All DEMs analyzed in this section were processed using Agisoft Metashape Professional, while in the Discussion section, they will be compared with results obtained by MicMac processing.
3.1. Accuracy Assessment of Different Block Geometry Configurations
3.1.1. Virtual Sites
Figure 5 shows the results for Site A1, which is characterized by low geometrical complexity with a regular and smooth pseudo-planar surface. It can be observed that the results improve with increasing multiplicity and base-length. The higher value of standard deviation was obtained for combinations B1-M2 (1.89 times the GSD), while for all the other combinations, the accuracy spans from 0.31 to 0.93 times the GSD.
As far as the max-base is concerned, in accordance with the theoretical analysis in Section 2.2, an asymptotic behavior is observed; therefore, the contribution of larger max-base becomes progressively less relevant. With the same multiplicity, the best results are obtained using a max-base length equal to B6; however, the difference compared to B4 and B5 is low. Therefore, values of max-base higher than B4 do not provide significant improvements. Very small base lengths generate uncertainty in the 3D reconstruction of the point, especially in the direction of the optical axis. While large base lengths have the advantage of offering a good intersection angle between matching rays, their use leads to high change of perspective between images and could worsen the dense matching results.
As far as the multiplicity is concerned, the results show that an increasing number of images positively affects model accuracy and completeness; however, the positive contribution is progressively less relevant. For instance, considering a max-base length B6, the percentage increase of accuracy from multiplicity 2 to 3 is equal to 15%, while from multiplicity 6 to 7, it is only 5%.
The influence of more complex object geometry with respect to the architectural site A1 can clearly be seen from Figure 6 where the results of Sites B1, C1 and D1 are shown. In this case, the worst results are provided by combinations B1-M2 (Site B1 = 1.79, Site C1 = 1.68, Site D1 = 2.44 times the GSD); however, the analysis of the DEM referring to the other combinations demonstrates a different behavior compared to Site A1 (cf. Figure 5). As far as the max-base is concerned, especially for multiplicity equal to M2, higher values of max-base result in lower standard deviation values, up to max-base length equal to B3 or B4 (Figure 6a). For higher values of the max-base length, the max-base graph reverses the slope, and the values of standard deviation increase again. This could be caused by the presence of stronger irregularities and depth changes in the natural rock faces compared to the architectural one, which make the image matching more difficult (Section 3.2). Figure 6b shows that the highest values of standard deviation are not always related to models obtained using two images only (as in Site A1). These models, instead, in most cases provide better or fully comparable results with models obtained from more than two images. This is particularly evident for small max-base lengths (up to B4).
For Site B1 and C1, the trend of the graphs for B5 and B6 is like the one observed for Site A1, with increasing error for M2 and progressive improvement as the multiplicity increases. On the contrary, for the max-base values equal to B2, B3 and B4, the error of the graphs has a peak for M3, i.e., a low standard deviation for M2, considerable worsening at M3 and progressive improvement for the higher multiplicities.
For Site D1, regardless of the max-base, the behavior is the same as the one provided by small bases in Sites B1 and C1. In contrary to the expectations, the accuracy of DEMs does not increase as the multiplicity increases; however, there is an unusual trend when switching from M2 to M3. The models obtained from only two images generally provide the lowest standard deviation or results in line with average values. The standard deviation values peak at M3, and then the accuracy increases accordingly to the increase of multiplicity (as also highlighted by the results of Site A1).
3.1.2. Real Sites
The results referred to all the real test sites retrace the behavior observed in most of the cases of the virtual sites. Although Site A is a different object compared to rock walls (different texture, smaller size, no occlusions) and is characterized by an almost planar geometry, if the images are acquired with physical sensors, regardless of the camera used, the results are more similar to those obtained for Sites B1, C1 and D1 than for A1.
The worst results are provided (as expected) by combinations B1-M2 (Nikon D3: Site A = 1.70, Site B = 2.87, Site C = 2.27 and Site D=2.32 times the GSD; Nikon S3100: Site A = 2.68, Site B = 4.18, Site C = 3.67 and Site D = 3.90 times the GSD; USB: Site B = 9.09, Site C = 5.79 and Site D = 12.71 times the GSD).
In general, we observed that the increase of max-base positively affects the accuracy. Figure 7a, Figure 8a and Figure 9a indicate that higher values of max-base correspond to lower standard deviation values, with the minimum at max-base length B4 or B5. Then, the standard deviation values become worse again. Differently from the virtual acquisitions, here such behavior occurs for all the values of multiplicity (not only for multiplicity equal to 2) and is particularly visible for models generated with the Nikon S3100 and USB images. The lower quality of the Nikon S3100 and USB sensors can cause this disparity, emphasizing model reconstruction uncertainty when long base lengths occur.
On the contrary, the increase of multiplicity is not always significant in terms of accuracy variation, as shown in Figure 7b, Figure 8b and Figure 9b where data are grouped by max-base value to highlight the influence of multiplicity. In general, as can be seen from the graphs, the accuracy values when varying multiplicity (if M3 combinations are excluded) do not vary significantly. In some cases, image pairs (M2 combinations) provide the best results and perform, on average, slightly better even than M7 combinations (e.g., Site B using Nikon D3, where B6-M2 combination performs 5% better than B6-M7 combination). In other cases, however, image combinations with higher multiplicity provide much better results, as in the case of Site D using USB, where B6-M7 performs 38% better than B6-M2 combination.
In all graphs, the unusual trend with a peak of high standard deviation values at M3 is evident, as previously highlighted in some cases in sites B1, C1 and D1. Despite the absolute variations being quite low and in the order of a few mm (considering the GSD is in the order of 1 cm) (i.e., negligible in some applications), from a relative point of view, the decrease of accuracy from M2 to M3 can rise to 25%. In addition, this behavior occurs in all the tests conducted for different test sites and sensors.
A further analysis was conducted by analyzing the behavior of individual combinations of images within each max-base/multiplicity grouping. We observed that different patterns of images (with the same max-base and multiplicity) generate different results, and the positioning of the images within the strip plays a key role. If the pattern is quite regular and symmetrical (Figure 10a), high values of accuracy are obtained. On the contrary, if camera distribution along the strip is asymmetrical (Figure 10b), accuracy reductions occur.
Figure 11 shows the ranges of accuracy variability (minimum, average and maximum values) that can be obtained within each multiplicity, according to the arrangement of the images in the strip. The graph refers to combinations with max-base equal to B6 since this max-base allows all multiplicities to be considered. The data refer, by way of example, to Site B (Nikon D3).
The most significant variations are observed within the combinations at M3, where for some sites the accuracy varies up to 50%, as for Site B (Nikon D3). In these cases, the best combination is the symmetrical one (with the central image taken in the midpoint between the other two), which provides good results, completely in line with those obtained for the other multiplicities. Otherwise, asymmetrical combinations, where the central image is taken near one of the other two images, perform the worst. This argument can be extended to all multiplicities.
The reasons why the variability of the results is more evident at M3 and generates an overall anomalous and unexpected trend deserve further examination and are discussed in Section 4.
3.2. Completeness Assessment of the Photogrammetric Models
The results of the completeness analysis between DEMs and the reference model are similar for all sites. As for the cameras, the Nikon D3 and Nikon S3100 perform the same for all tests, while the USB provides more variable results, in particular for Site D. For brevity, only the graphs referring to Site A1 (virtual), Site B (Nikon D3) and Site D (USB) are provided below. These results are representative of the general behavior of the completeness assessment.
As expected, Figure 12 and Figure 13 show that the lowest values of completeness were obtained using only two images. In such cases, the number of unreconstructed points increases with increasing max-base value. This behavior can be explained by considering an increase in change of perspective between two consecutive images as the distance between them increases, which may turn into invalid matches or occlusions. This is particularly evident for the real sites, where the presence of protruding elements and vegetation in the scene requires more images for a complete reconstruction of the model. For Site A1, all the models provide completeness values higher than 99%, with 100% of completeness for models corresponding to the pairs max-base B6 and multiplicity M5, M6 and M7.
The best combinations in terms of accuracy are the same for completeness. The same can be observed for Site A, where completeness varies in the range of 95.7% to 99.7%. These extremely good results are linked to the regularity of the brick wall. On the contrary, for the natural Sites B, C and D, the completeness varies between 48.8% and 94.6% for Site B, between 30.6% and 97.1% for Site C and between 40.8% and 94.4% for Site D.
Evident improvements can be observed for the natural sites by using an increasing number of images compared to the architectural Sites A and A1, in particular from multiplicity 2 to 3 (Figure 13a). This improvement is closely related to the characteristics of a natural site (overhanging elements, vegetation and distance from the wall). The highest increases in completeness occur in the transition from M2 to M3, for all the test sites and camera models. For the subsequent multiplicities, the increase is not so evident.
Related to the base length variation, higher values of max-base result in a decrease in completeness (excepting some sites, e.g., site D using the USB camera).
4. Discussion
The results presented in Section 3 confirm that the geometry of the object affects the average accuracy of the matching and the completeness of the blocks. For instance, considering the images acquired with the Nikon D3 only, the overall agreement between image-based DEMs and the reference DEM for the architectural Site A (brick wall with regular planar geometry, without protruding elements) is in the range of 0.75 to 1.77 times the GSD, while for the natural test sites, the residuals span on average from 1.2 to 2.4 times the GSD. On the contrary, the trend of accuracy variability when changing max-base length and multiplicity remains basically the same regardless of the geometric complexity of the site.
As for the cameras, results are significantly affected by the quality of the sensor. As already pointed out in [41], the overall accuracy provided by the USB camera is considerably lower than the other two cameras. The analysis also shows that the USB camera produces the greatest variability in accuracy among the tested block geometries. The accuracy obtained by the USB camera is always worse than that of the other two cameras, regardless of the block geometry adopted. The best configuration with the USB camera still provides worse results than the application of Nikon D3 and S3100.
The study of the influence of block geometry on the dense matching, which is the focus of the paper, demonstrates a strong correlation between image multiplicity and base length and the depth accuracy of multiple view matchings, even if the same orientation solution is maintained. The best results in terms of accuracy are provided by the blocks with the max-base and multiplicity values (B6-M7), while the worse are obtained considering a small max-base length and low multiplicity (B1-M2).
The percentage difference in DEM accuracy between the best and the worst block geometry is significant: considering images acquired with the Nikon D3 camera for Site B, the increase of standard deviation of the distances is equal to +130% and rises to +160% if the USB camera is considered. On average, such increment is about +160%, spanning from a minimum of +42% (Site B1) to a maximum of +509% (Site A1).
The percentage variation of depth accuracy provided by different image combinations remains high (on average 75%) even if the blocks belonging to the worst combination (B1-M2) are excluded from the analysis. The virtual Sites B1, C1 and D1 provide the highest internal consistency among all block configurations with an average increase of 38% between the best and worst block configurations. Site A1 shows the greatest variability in block accuracy when passing from a block geometry with multiplicity M7 and max-base B6 to one with max-base B1 and multiplicity M2.
The analysis of the variation of multiplicity and base length shows results that are not fully matching with the theoretical expectations from the literature. A good agreement was observed for blocks with the same multiplicity, where the accuracy increases as the base increases. This is significant up to max-base values equal to B3 or B4 (ratio B:Z equal to 1:3). Beyond these values, the change of perspective between shots, especially in cases with an irregular rock wall, leads to a greater number of occlusions (hence lower model completeness) and a negligible improvement (and sometimes a significant worsening) in accuracy for the reconstructed parts.
The influence of multiplicity was also observed according to site conditions. Except for Site A1, with the same max-base length, the positive contribution produced by the increase in number of cameras is not significant. Passing from M2 to M3, an unexpected behavior was observed: contrary to the current scientific knowledge, the consistency between the DEM and the reference decreases. This behavior is quite counterintuitive and contradicts the commonly accepted theoretical models. To the best of the authors’ knowledge, graphs showing a similar performance are presented in [43]; however, no additional investigation is provided.
According to the analyses performed in the current study, this phenomenon could be associated with the Semi–Global MVS matching method implemented in Metashape, which reconstructs the dense surface based on pair-wise depth maps. The depth maps are computed from overlapping image pairs [46] and are then merged to obtain the 3D dense point cloud. MVS reconstruction requires specific strategies on how potentially conflicting observations, obtained from couples of images with different expected precision (according to Equation (1)), can be filtered and/or weighted to be merged.
If only one pair of images is considered, there is no redundant data to check the correctness of 3D point reconstructions. When more than two images are used, three or more pairs contribute to determining the 3D point position: the consistency of the results can be analyzed, and overly discordant observations can be removed. To check if specific strategies (e.g., the one using a visibility-based method proposed in [47]) might lead to the same unexpected behavior experienced in the tests (i.e., peak of worst accuracy performance at M3), a Monte Carlo simulation was considered to compute the accuracy on 3D point reconstruction at different combinations of images.
In the simulation, the same combinations of images as in the experimental tests were considered. Given a grid of 3D points with known coordinates in the object space, the respective reprojections on the images were produced. The 2D coordinates of the reprojected points on images were perturbed by a zero mean Gaussian error (note that, for simplicity, the errors were considered uncorrelated). For each pair of images, given the set of perturbed 2D measurements, the 3D positions of the respective points were computed by triangulation and the pair-wise depth map was obtained.
The depth map fusion (i.e., the estimation of the resulting 3D point reconstruction) was resolved as the arithmetic mean of the highest number of consistent depth observations. According to [47], observations are consistent if their depth estimates differ less than a supporting threshold e. For each estimate, the number of supporting depth maps (i.e., the number of observations within e) was computed and the combination of depth maps with the highest support was merged. In other words, the algorithm merged the coordinates supported by the largest number of pairs of images. In the end, as in the experimental tests, the obtained 3D reconstruction was compared with a reference for accuracy assessment.
Figure 14 shows the results of the Monte Carlo simulation. The results show similar behavior to the one observed in the experimental tests. This can be explained by considering that the algorithm used for the dense matching merges the depth maps resulting from agreeing pairs of images. When blocks of three images are processed, three stereo-pairs are considered, two with small base length and one with larger base length.
If the two pairs with smaller base length give consistent depth values, the dense matching algorithm will prioritize the contribution of these two pairs over that of the larger base pair. However, from Equation (1) (and as confirmed by the studies of [43] on benefits of image redundancy for 3D reconstruction), it is known that a small base length results in lower depth precision. This may explain the clear reduction in accuracy, especially in multiplicity three blocks where the contribution of the less accurate observations may become predominant.
To assess the effect of the pairs’ filtering to keep only the most agreeing observations, an additional simulation (Simulation 2) was conducted: the 3D position of the points was estimated with a least-squares system considering the contributions of all stereo pairs (true multi-image dense matching). A simple variance propagation was also applied assuming the absence of gross errors. The simulation shows that, on average (mean RMS value in Figure 15), the accuracy improves at the increase of multiplicity, without demonstrating unexpected peaks at M3.
Focusing on the individual combinations, the internal variability of the results is much lower than in the real cases (cf. Figure 11) and it is higher for M4 and M5 (Figure 15), which account for the greater numerosity of image configurations. Contrary to what was observed before, the combinations in which intermediate images were placed in the middle of the strip provide the worst results. In these combinations, it is preferable to have one large and one small base (Figure 10b) rather than two medium-sized bases (Figure 10a).
To assess whether the use of an alternative dense matching method might affect the results and avoid a reduction in accuracy for M3 blocks, the open-source package MicMac [45] was used for processing, considering a restitution geometry that seeks disparity in the object space, i.e., performing a true multi-image matching.
In MicMac (with “ground” geometry) the image dense matching is solved as a function of multiple images in the object space and, therefore, should not demonstrate a similar behavior to MVS. In other words, the concurrent use of all the observations, without discarding the ones that might not support each other as in a MVS matching, should increase accuracy performances passing from M2 to M3 and so on. Figure 16 shows the results obtained with MicMac. For brevity, only results obtained for datasets of Sites B, C and D (for which the reduction of accuracy from M2 to M3 was particularly evident) using the Nikon D3100 are presented. The behavior is similar for all the other camera models.
In this case, the worst results are provided by image combinations B1-M2 (values of standard deviation for site B = 7.60, site C = 4.22 and site D = 5.02 times the GSD). In Figure 16a, the results improve as the max-base increases. On the contrary, analyzing data by max-base indicates that the influence of multiplicity is not evident (Figure 16b) if compared to the one provided by Metashape (cf. Figure 8). Except for some outliers at Sites C and D, the standard deviation ranges around an average value, and no recurring peaks of worse accuracy can be observed at M3.
Looking at the absolute standard deviation with respect to the results obtained with Metashape, the results change according to the test site: in most cases, Metashape outperforms MicMac, with mean differences around 30% up to 65% better. This is particularly evident for models obtained using few images (low multiplicity), where (as expected from the analysis of the graphs provided above) Metashape performs better.
In the case of models that account for a higher number of images, the performances of the two software packages are comparable and, in some cases, MicMac provides better accuracy (with an average of 12% better and a maximum of 34%, obtained for M3 in Site C with Nikon S3100). Regarding models at M3, which are generally less accurate if produced by Metashape, their accuracy is always comparable to the one obtained using MicMac, and, in some cases, it is even better.
It is worth noting that the processing with MicMac was conducted using the semi-automatic tools provided by the software. It cannot be excluded that, with a more advanced use of the software and a more accurate parameterization, the performance could be better.
5. Conclusions
The current work investigated multi-image dense matching 3D reconstruction using different block geometries analyzing the influence of various base lengths, multiplicities of images, their distribution and the dense matching strategy adopted. Although block geometry has been extensively addressed in the literature, an examination related only to dense matching and systematically analyzing the implications related to the type of acquisition (the number of images, maximum distance between the first and last image within a strip, regularity and symmetry) was still lacking.
The results show that, on average, while (as expected) the use of large max-bases between the first and the last image of the strip results in a significant increase in accuracy, surprisingly, no clear correlation was observed between the increase in multiplicity and accuracy considering configurations with the same max-base. A higher number of images does not necessarily lead to clear accuracy improvements and, in some cases, provides counterintuitive results, as for the image configurations at M3.
The results clearly show considerable and unexpected reductions in accuracy (usually lower accuracy than a single stereo pair) when processing three images using MVS algorithms based on pair-wise depth map fusion. This unexpected result is demonstrated (although to varying degrees) in all the tests performed (with different shapes of objects, sensor, etc.). The additional investigations conducted via a Monte Carlo simulation demonstrated that this effect might be related to the MVS algorithm implementation, which, with this multiplicity, may prioritize the contribution of mutually supporting pairs with smaller base length (generally less accurate observations) and lead to a clear reduction of accuracy.
The concept behind most visibility-based depth map fusion commonly implemented in MVS routines (see [47]) is to leverage the information coming from different depth map supports (i.e., agreement between different stereo-pairs) to remove wrong 3D correspondences (the fusion is performed in object space)—for instance, due to occlusions. It cannot be excluded that, if a different approach is used (the most naïve being merging all the information without discarding any not supported depth map data), this behavior may change, as it does not occur when using algorithms that perform true dense multi-image matching.
However, this could imply a higher number of matching outlier or worse accuracies under certain configurations and object complexities. In this context, we also observed that the specific imaging geometry (position of the images within the strip) plays a central role and can mitigate, or even eliminate, these recurring peaks of worse accuracy at M3. Regular and symmetrical acquisition geometries (cf. Figure 10a) provide the best performance when using MVS matching algorithms, and, as far as M3 is concerned, a block geometry with the central image placed in a mid-position between the other two images ensures accuracies comparable to those obtained for other image combinations.
On the contrary, with algorithms running true multi-image dense matching, surprisingly, geometries of acquisition that ensure large angles between images are preferable, i.e., block geometry with intermediate images placed near the extremes of the strip rather than equally distributed shooting points (cf. Figure 10b).
The main objective of this paper was not to provide a rank of the most appropriate dense-matching approaches nor to identify/solve their drawbacks but to assess their applicability and highlight their possible limits under different multi-view configurations to, thus, give operational indications to the users. Both the investigated approaches are valuable and applicable; however, especially with low multiplicity, the spatial distribution of the images appeared to considerably influence the results.
Since, in many applications, there appeared to be no significant advantage in increasing multiplicity, it is possible to reduce the number of images acquired/processed simultaneously. This result is significant and advantageous from an operational point of view, as it speeds up acquisition and processing times. It is therefore particularly useful for rapid surveys or applications requiring the installation of permanent equipment. In addition, for applications requiring a strong block geometry to constrain orientation, it is possible to acquire a high number of images to perform orientation and then, keeping the orientation parameters fixed, perform the dense matching only on a sub-set of images. This significantly reduces costs and processing time (dense matching is a highly demanding operation) without a significant loss of accuracy.
On the contrary, the positive effect of high multiplicity (if the same max-base is considered) is significant as completeness is concerned, particularly in the case of irregular objects with changes in perspective and occlusions. In these cases, going from configurations of only two images (M2) to three images (M3) increases the completeness by up to 200%, while the benefit becomes less important for higher multiplicities. Therefore, from an operational point of view, it would be preferable to favor completeness during the block design, to maximize the distance between the first and last image acquired and to insert intermediate images that are required for a complete acquisition of the object.
Author Contributions
Conceptualization, N.B. and R.R.; methodology, N.B. and R.R.; software, R.R.; validation, N.B., R.R., F.D., K.T. and A.G.; data curation, N.B., R.R. and F.D.; writing—original draft preparation, N.B.; writing—review and editing, R.R., K.T. and A.G.; project administration, A.G.; funding acquisition, A.G., K.T. and R.R. All authors have read and agreed to the published version of the manuscript.
Funding
This research was funded by the Australian Research Council, grant number DP210101122.
Data Availability Statement
Data supporting the findings of this study is available from the authors on request.
Acknowledgments
The authors would like to acknowledge Gianfranco Forlani for the support in result validation and analysis and Angelica Cantarelli for the collaboration in data processing and curation.
Conflicts of Interest
The authors declare no conflict of interest. The funders had no role in the design of the study; in the collection, analyses, or interpretation of data; in the writing of the manuscript, or in the decision to publish the results.
References
- Eltner, A.; Kaiser, A.; Castillo, C.; Rock, G.; Neugirg, F.; Abellán, A. Image-based surface reconstruction in geomorphometry-merits, limits and developments. Earth Surf. Dyn. 2016, 4, 359–389. [Google Scholar] [CrossRef] [Green Version]
- James, M.R.; Robson, S. Straightforward reconstruction of 3D surfaces and topography with a camera: Accuracy and geoscience application. J. Geophys. Res. Earth Surf. 2012, 117, F03017. [Google Scholar] [CrossRef] [Green Version]
- Qin, R. An Object-Based Hierarchical Method for Change Detection Using Unmanned Aerial Vehicle Images. Remote Sens. 2014, 6, 7911–7932. [Google Scholar] [CrossRef] [Green Version]
- Gabrieli, F.; Corain, L.; Vettore, L. A low-cost landslide displacement activity assessment from time-lapse photogrammetry and rainfall data: Application to the Tessina landslide site. Geomorphology 2016, 269, 56–74. [Google Scholar] [CrossRef]
- Travelletti, J.; Delacourt, C.; Allemand, P.; Malet, J.-P.; Schmittbuhl, J.; Toussaint, R.; Bastard, M. Correlation of multi-temporal ground-based optical images for landslide monitoring: Application, potential and limitations. ISPRS J. Photogramm. Remote Sens. 2012, 70, 39–55. [Google Scholar] [CrossRef] [Green Version]
- Liu, W.-C.; Huang, W.-C. Close Range Digital Photogrammetry Applied to Topography and Landslide Measurements. Int. Arch. Photogramm. Remote Sens. Spat. Inf. Sci. 2016, 41, 875–880. [Google Scholar] [CrossRef] [Green Version]
- Yu, M.; Huang, Y.; Zhou, J.; Mao, L. Modeling of landslide topography based on micro-unmanned aerial vehicle photography and structure-from-motion. Environ. Earth Sci. 2017, 76, 520. [Google Scholar] [CrossRef]
- Turner, D.; Lucieer, A.; de Jong, S. Time Series Analysis of Landslide Dynamics Using an Unmanned Aerial Vehicle (UAV). Remote Sens. 2015, 7, 1736–1757. [Google Scholar] [CrossRef] [Green Version]
- Tannant, D.D. Review of Photogrammetry-Based Techniques for Characterization and Hazard Assessment of Rock Faces. Int. J. Georesources Environ. IJGE 2015, 1, 76–87. [Google Scholar] [CrossRef] [Green Version]
- Stöcker, C.; Eltner, A.; Karrasch, P. Measuring gullies by synergetic application of UAV and close range photogrammetry—A case study from Andalusia, Spain. Catena 2015, 132, 1–11. [Google Scholar] [CrossRef]
- Kaiser, A.; Neugirg, F.; Rock, G.; Müller, C.; Haas, F.; Ries, J.; Schmidt, J. Small-Scale Surface Reconstruction and Volume Calculation of Soil Erosion in Complex Moroccan Gully Morphology Using Structure from Motion. Remote Sens. 2014, 6, 7050–7080. [Google Scholar] [CrossRef] [Green Version]
- Pineux, N.; Lisein, J.; Swerts, G.; Bielders, C.L.; Lejeune, P.; Colinet, G.; Degré, A. Can DEM time series produced by UAV be used to quantify diffuse erosion in an agricultural watershed? Geomorphology 2017, 280, 122–136. [Google Scholar] [CrossRef]
- Maas, H.G.; Casassa, G.; Schneider, D.; Schwalbe, E.; Wendt, A. Photogrammetric techniques for the determination of spatio-temporal velocity fields at Glaciar San Rafael, Chile. Photogramm. Eng. Remote Sens. 2013, 79, 299–306. [Google Scholar] [CrossRef]
- Dall’Asta, E.; Forlani, G.; Roncella, R.; Santise, M.; Diotri, F.; Morra di Cella, U. Unmanned Aerial Systems and DSM matching for rock glacier monitoring. ISPRS J. Photogramm. Remote Sens. 2017, 127, 102–114. [Google Scholar] [CrossRef]
- Bradley, D.; Boubekeur, T.; Heidrich, W. Accurate Multi-View Reconstruction Using Robust Binocular Stereo and Surface Meshing. In Proceedings of the 2008 IEEE Conference on Computer Vision and Pattern Recognition, Anchorage, AK, USA, 23–28 June 2008; IEEE: New York, NY, USA, 2008; pp. 1–8. [Google Scholar]
- Piermattei, L.; Carturan, L.; Guarnieri, A. Use of terrestrial photogrammetry based on structure-from-motion for mass balance estimation of a small glacier in the Italian alps. Earth Surf. Process. Landforms 2015, 40, 1791–1802. [Google Scholar] [CrossRef]
- Mancini, F.; Dubbini, M.; Gattelli, M.; Stecchi, F.; Fabbri, S.; Gabbianelli, G. Using Unmanned Aerial Vehicles (UAV) for High-Resolution Reconstruction of Topography: The Structure from Motion Approach on Coastal Environments. Remote Sens. 2013, 5, 6880–6898. [Google Scholar] [CrossRef] [Green Version]
- Woodget, A.S.; Carbonneau, P.E.; Visser, F.; Maddock, I.P. Quantifying submerged fluvial topography using hyperspatial resolution UAS imagery and structure from motion photogrammetry. Earth Surf. Process. Landforms 2015, 40, 47–64. [Google Scholar] [CrossRef] [Green Version]
- Niederheiser, R.; Rutzinger, M.; Lamprecht, A.; Steinbauer, K.; Winkler, M.; Pauli, H.; Niederheiser, R. Mapping alpine vegetation location properties by dense matching. Int. Arch. Photogramm. Remote Sens. Spat. Inf. Sci. 2016, 41, 881–886. [Google Scholar] [CrossRef] [Green Version]
- De Michele, C.; Avanzi, F.; Passoni, D.; Barzaghi, R.; Pinto, L.; Dosso, P.; Ghezzi, A.; Gianatti, R.; Vedova, G. Della Using a fixed-wing UAS to map snow depth distribution: An evaluation at peak accumulation. Cryosphere 2016, 10, 511–522. [Google Scholar] [CrossRef] [Green Version]
- Fassi, F.; Achille, C.; Fregonese, L. Surveying and modelling the main spire of Milan Cathedral using multiple data sources. Photogramm. Rec. 2011, 26, 462–487. [Google Scholar] [CrossRef]
- Dall’Asta, E.; Bruno, N.; Bigliardi, G.; Zerbi, A.; Roncella, R. Photogrammetric Techniques for Promotion of Archaeological Heritage: The Archaeological Museum of Parma (Italy). ISPRS Int. Arch. Photogramm. Remote Sens. Spat. Inf. Sci. 2016, 41, 243–250. [Google Scholar] [CrossRef] [Green Version]
- Nannei, V.M.; Fassi, F.; Mirabella Roberti, G. Photogrammetry for quick survey in emergency conditions: The case of villa Galvagnina. Int. Arch. Photogramm. Remote Sens. Spat. Inf. Sci. 2019, 42, 835–842. [Google Scholar] [CrossRef] [Green Version]
- Perfetti, L.; Polari, C.; Fassi, F. Fisheye multi-camera system calibration for surveying narrow and complex architectures. Int. Arch. Photogramm. Remote Sens. Spat. Inf. Sci. 2018, 42, 877–883. [Google Scholar] [CrossRef] [Green Version]
- Thoeni, K.; Giacomini, A.; Murtagh, R.; Kniest, E. A comparison of multi-view 3D reconstruction of a rock wall using several cameras and a Laser scanner. Int. Arch. Photogramm. Remote Sens. Spat. Inf. Sci. ISPRS Arch. 2014, 40, 573–580. [Google Scholar] [CrossRef] [Green Version]
- Remondino, F.; Spera, M.G.; Nocerino, E.; Menna, F.; Nex, F. State of the art in high density image matching. Photogramm. Rec. 2014, 29, 144–166. [Google Scholar] [CrossRef] [Green Version]
- Roncella, R.; Forlani, G.; Fornari, M.; Diotri, F. Landslide monitoring by fixed-base terrestrial stereo-photogrammetry. ISPRS Ann. Photogramm. Remote Sens. Spat. Inf. Sci. 2014, 2, 297–304. [Google Scholar] [CrossRef] [Green Version]
- Giacomini, A.; Thoeni, K.; Santise, M.; Diotri, F.; Booth, S.; Fityus, S.; Roncella, R. Temporal-Spatial Frequency Rockfall Data from Open-Pit Highwalls Using a Low-Cost Monitoring System. Remote Sens. 2020, 12, 2459. [Google Scholar] [CrossRef]
- Carrivick, J.; Smith, M.; Quincey, D. Structure from Motion in the Geosciences; Wiley: New York, NY, USA, 2016; ISBN 978-1-118-89584-9. [Google Scholar]
- Micheletti, N.; Chandler, J.H.; Lane, S.N. Investigating the geomorphological potential of freely available and accessible structure-from-motion photogrammetry using a smartphone. Earth Surf. Process. Landf. 2015, 40, 473–486. [Google Scholar] [CrossRef] [Green Version]
- Fraser, C.S. Network design considerations for non-topographic photogrammetry. Photogramm. Eng. Remote Sens. 1984, 50, 1115–1125. [Google Scholar]
- Kraus, K. Photogrammetry—Geometry from Images and Laser Scans; Walter de Gruyter: Berlin, Germany, 2011; ISBN 9788578110796. [Google Scholar]
- Scaioni, M.; Crippa, J.; Corti, M.; Barazzetti, L.; Fugazza, D.; Azzoni, R.; Cernuschi, M.; Diolaiuti, G.A. Technical aspects related to the application of sfm photogrammetry in high mountain. ISPRS Int. Arch. Photogramm. Remote Sens. Spat. Inf. Sci. 2018, 42, 1029–1036. [Google Scholar] [CrossRef] [Green Version]
- Parente, L.; Chandler, J.H.; Dixon, N. Optimising the quality of an SfM-MVS slope monitoring system using fixed cameras. Photogramm. Rec. 2019, 34, 408–427. [Google Scholar] [CrossRef]
- Kromer, R.; Walton, G.; Gray, B.; Lato, M.; Group, R. Development and optimization of an automated fixed-location time lapse photogrammetric rock slope monitoring system. Remote Sens. 2019, 11, 1890. [Google Scholar] [CrossRef] [Green Version]
- Wenzel, K.; Rothermel, M.; Fritsch, D.; Haala, N. Image acquisition and model selection for multi-view stereo. ISPRS Int. Arch. Photogramm. Remote Sens. Spat. Inf. Sci. 2013, 40, 251–258. [Google Scholar] [CrossRef] [Green Version]
- Dall’Asta, E.; Thoeni, K.; Santise, M.; Forlani, G.; Giacomini, A.; Roncella, R. Network Design and Quality Checks in Automatic Orientation of Close-Range Photogrammetric Blocks. Sensors 2015, 15, 7985–8008. [Google Scholar] [CrossRef]
- Seitz, S.M.; Curless, B.; Diebel, J.; Scharstein, D.; Szeliski, R. A Comparison and Evaluation of Multi-View Stereo Reconstruction Algorithms. In Proceedings of the 2006 IEEE Computer Society Conference on Computer Vision and Pattern Recognition, New York, NY, USA, 17–22 June 2006; IEEE: New York, NY, USA, 2006; Volume 1, pp. 519–528. [Google Scholar]
- Gruen, A. Development and Status of Image Matching in Photogrammetry. Photogramm. Rec. 2012, 27, 36–57. [Google Scholar] [CrossRef]
- James, M.R.; Robson, S. Mitigating systematic error in topographic models derived from UAV and ground-based image networks. Earth Surf. Process. Landforms 2014, 39, 1413–1420. [Google Scholar] [CrossRef] [Green Version]
- Bruno, N.; Thoeni, K.; Diotri, F.; Santise, M.; Roncella, R.; Giacomini, A. A comparison of low-cost cameras applied to fixed multi-image monitoring systems. ISPRS Int. Arch. Photogramm. Remote Sens. Spat. Inf. Sci. 2020, 43, 1033–1040. [Google Scholar] [CrossRef]
- Rupnik, E.; Daakir, M.; Pierrot Deseilligny, M. MicMac—A free, open-source solution for photogrammetry. Open Geospat. Data Softw. Stand. 2017, 2, 1–9. [Google Scholar] [CrossRef]
- Rumpler, M.; Irschara, A.; Bischof, H. Multi-view stereo: Redundancy Benefits for 3d Reconstruction. In Proceedings of the 35th Workshop of the Austrian Association for Pattern Recognition, Graz, Austria, 26–27 May 2011. [Google Scholar]
- Agisoft Metashape. Available online: https://www.agisoft.com/ (accessed on 29 December 2020).
- MicMac. Available online: https://micmac.ensg.eu/index.php/Accueil (accessed on 21 May 2022).
- Agisoft Forum. Available online: https://www.agisoft.com/forum/index.php?topic=89.0 (accessed on 29 December 2020).
- Merrell, P.; Akbarzadeh, A.; Wang, L.; Mordohai, P.; Frahm, J.M.; Yang, R.; Nistér, D.; Pollefeys, M. Real-time visibility-based fusion of depth maps. In Proceedings of the IEEE 11th International Conference on Computer Vision, Rio de Janeiro, Brazil, 14–21 October 2007. [Google Scholar]
- Pierrot Deseilligny, M.; Clery, I. Apero, An Open Source Bundle Adjusment Software for Automatic Calibration and Orientation of Set of Images. In Proceedings of the International Archives of the Photogrammetry, Remote Sensing and Spatial Information Science, Trento, Italy, 2–4 March 2011; Volume 38, pp. 269–276. [Google Scholar]
- Pierrot-Deseilligny, M.; Paparoditis, N. A multiresolution and optimization-based image matching approach: An application to surface reconstruction from SPOT5-HRS stereo imagery. Int. Arch. Photogramm. Remote Sens. Spat. Inf. Sci. 2006, 36, 1–5. [Google Scholar]
- Autodesk 3D Studio Max v. 2020. Available online: https://www.autodesk.com/products/3ds-max/overview?term=1-YEAR&tab=subscription (accessed on 22 May 2022).
- The MathWorks Inc. MATLAB R2021a (9.10.0.1602886) 2021. Available online: https://it.mathworks.com/?s_tid=gn_logo (accessed on 22 May 2022).
Figure 1.
Characteristics of the camera networks used in this study. “B_max” is the distance between the first and the last camera station, “b” is the average value of base length between two consecutive camera stations, and “Z” is the object distance.
Figure 1.
Characteristics of the camera networks used in this study. “B_max” is the distance between the first and the last camera station, “b” is the average value of base length between two consecutive camera stations, and “Z” is the object distance.

Figure 2.
Graphs showing the theoretical performance of precision as a function (a) of the max-base at M2 (data are plotted to show the influence of max-base variability and are computed applying equation 1) and (b) of the multiplicity at B6 (data are plotted to show the influence of multiplicity variability and are simulated using a least-squares system).

Figure 3.
The four sites considered in the study: (a) Site A—Brick wall of a building at University of Parma. (b) Site B—Pollein area 1. (c) Site C—Pollein area 2. (d) Site D—Arnad.
Figure 3.
The four sites considered in the study: (a) Site A—Brick wall of a building at University of Parma. (b) Site B—Pollein area 1. (c) Site C—Pollein area 2. (d) Site D—Arnad.
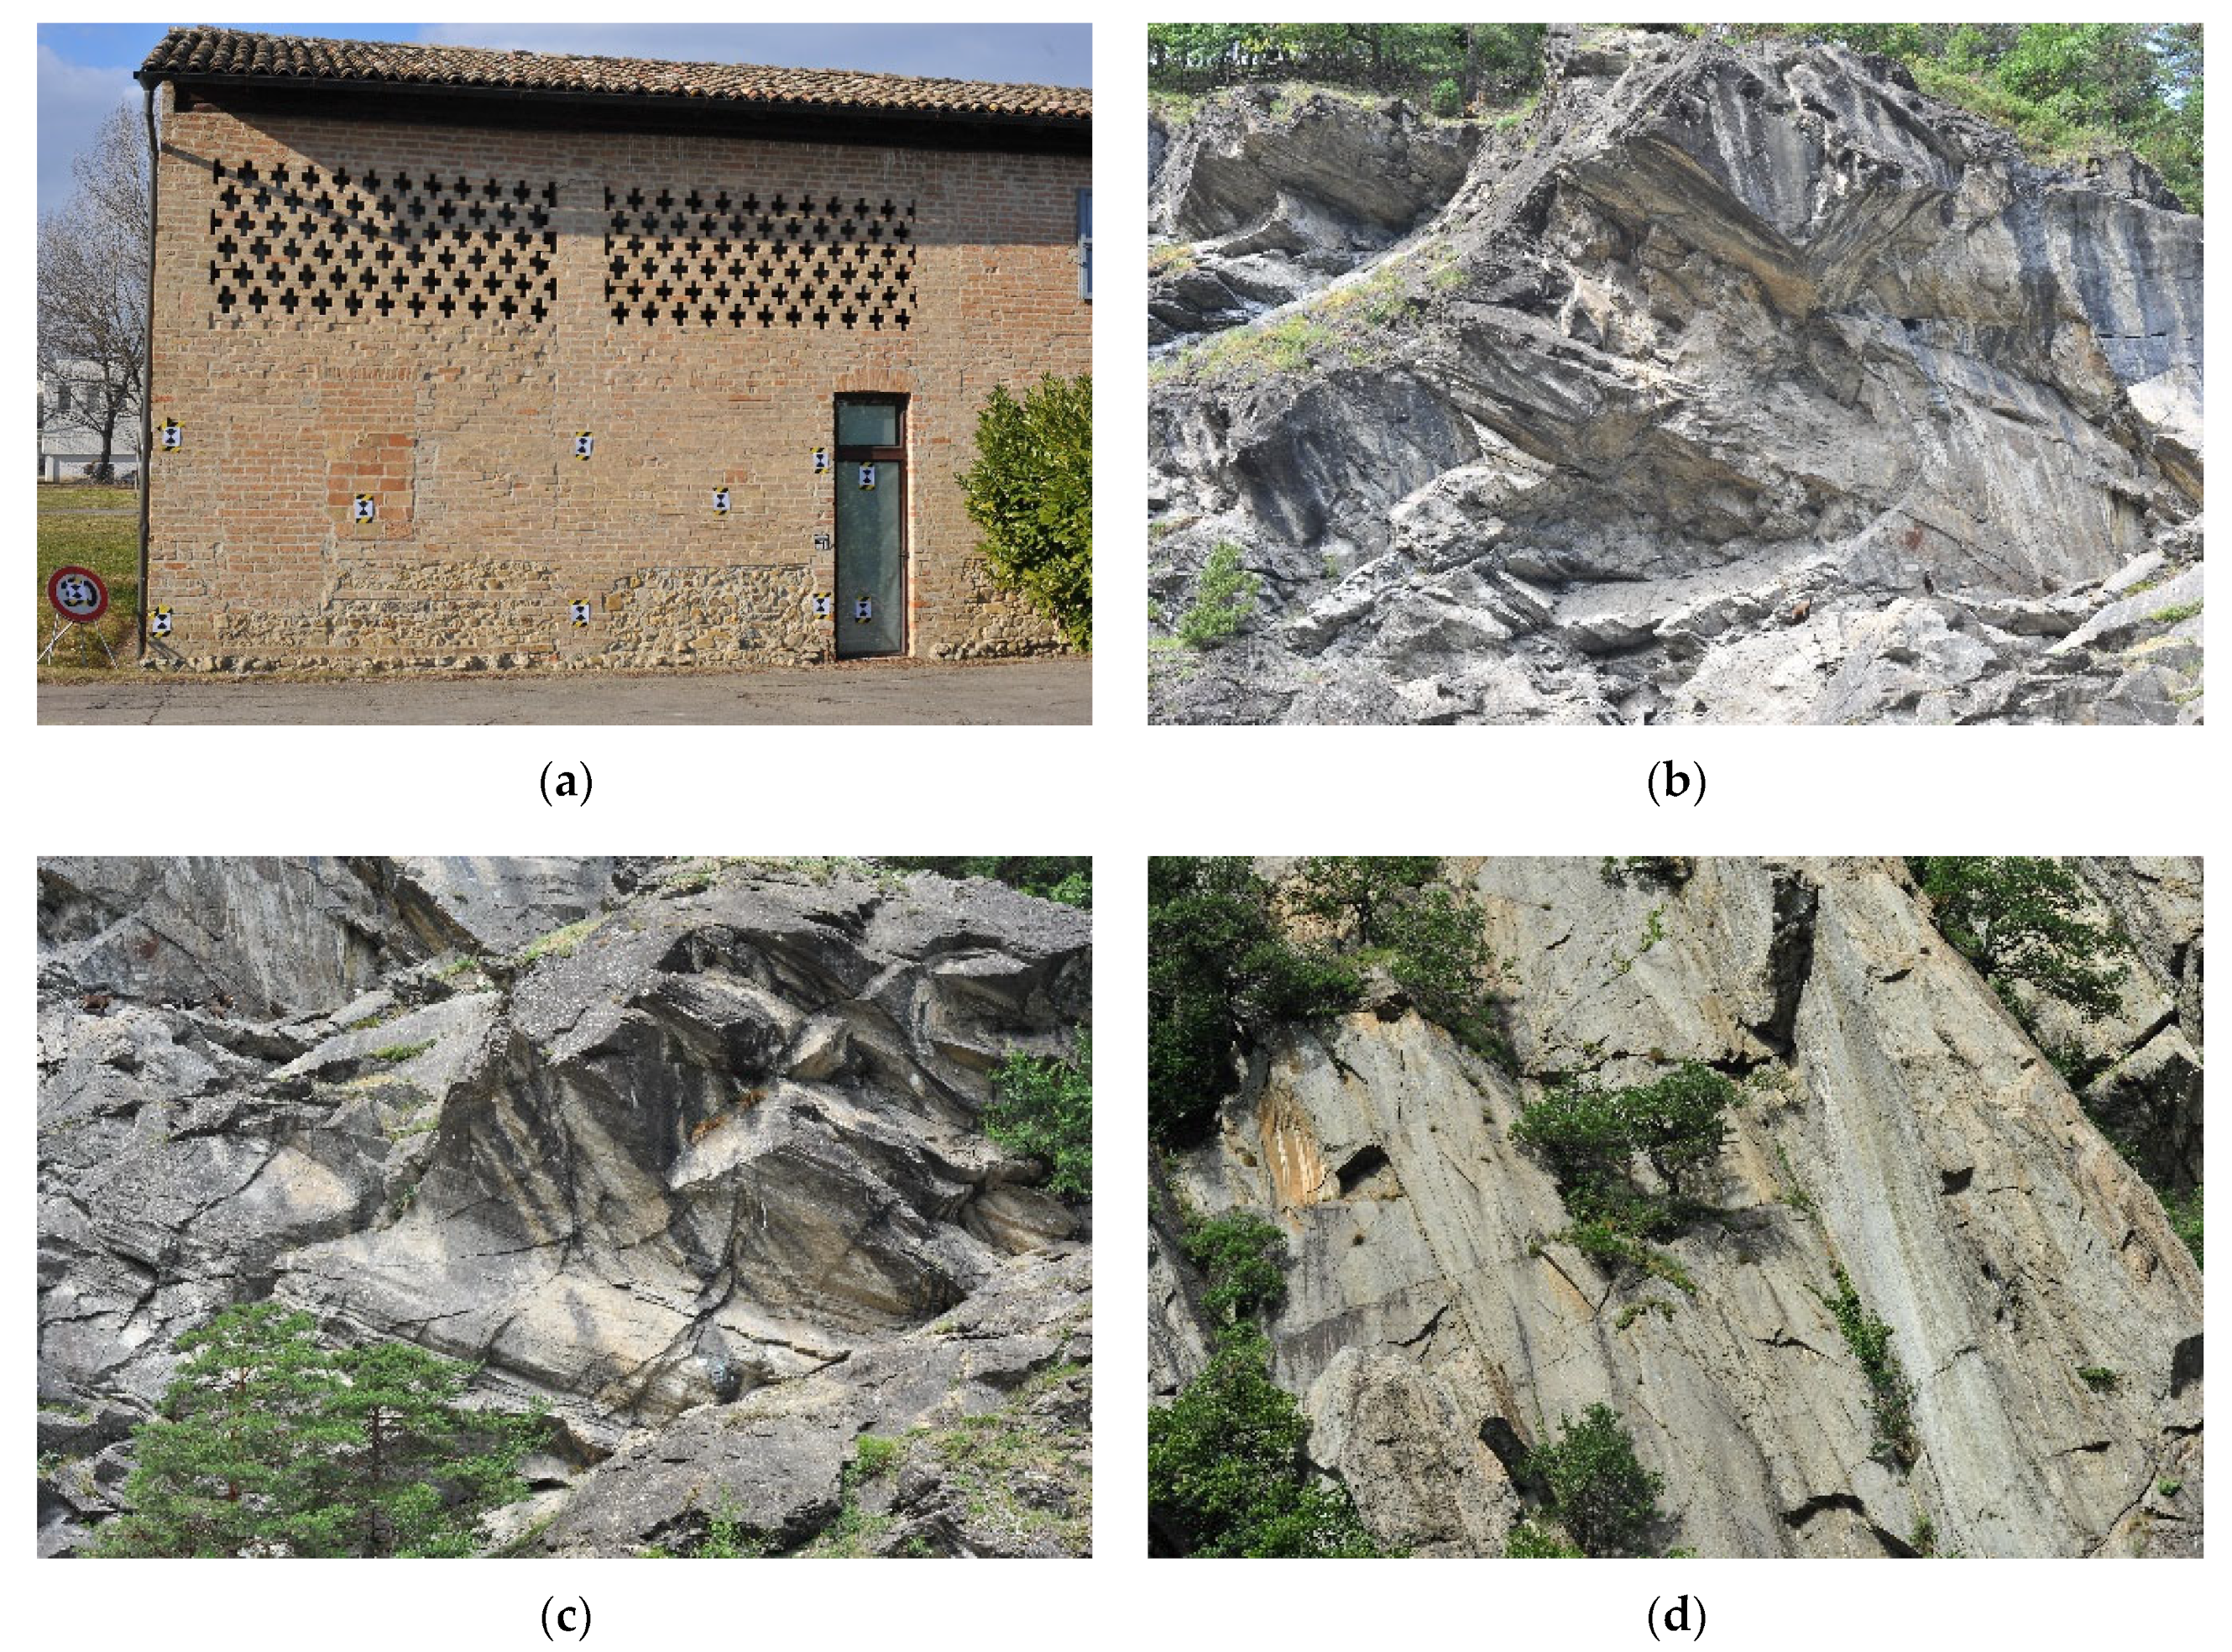
Figure 4.
The four virtual sites considered in the study: (a) Site A1. (b) Site B1. (c) Site C1. (d) Site D1.
Figure 4.
The four virtual sites considered in the study: (a) Site A1. (b) Site B1. (c) Site C1. (d) Site D1.
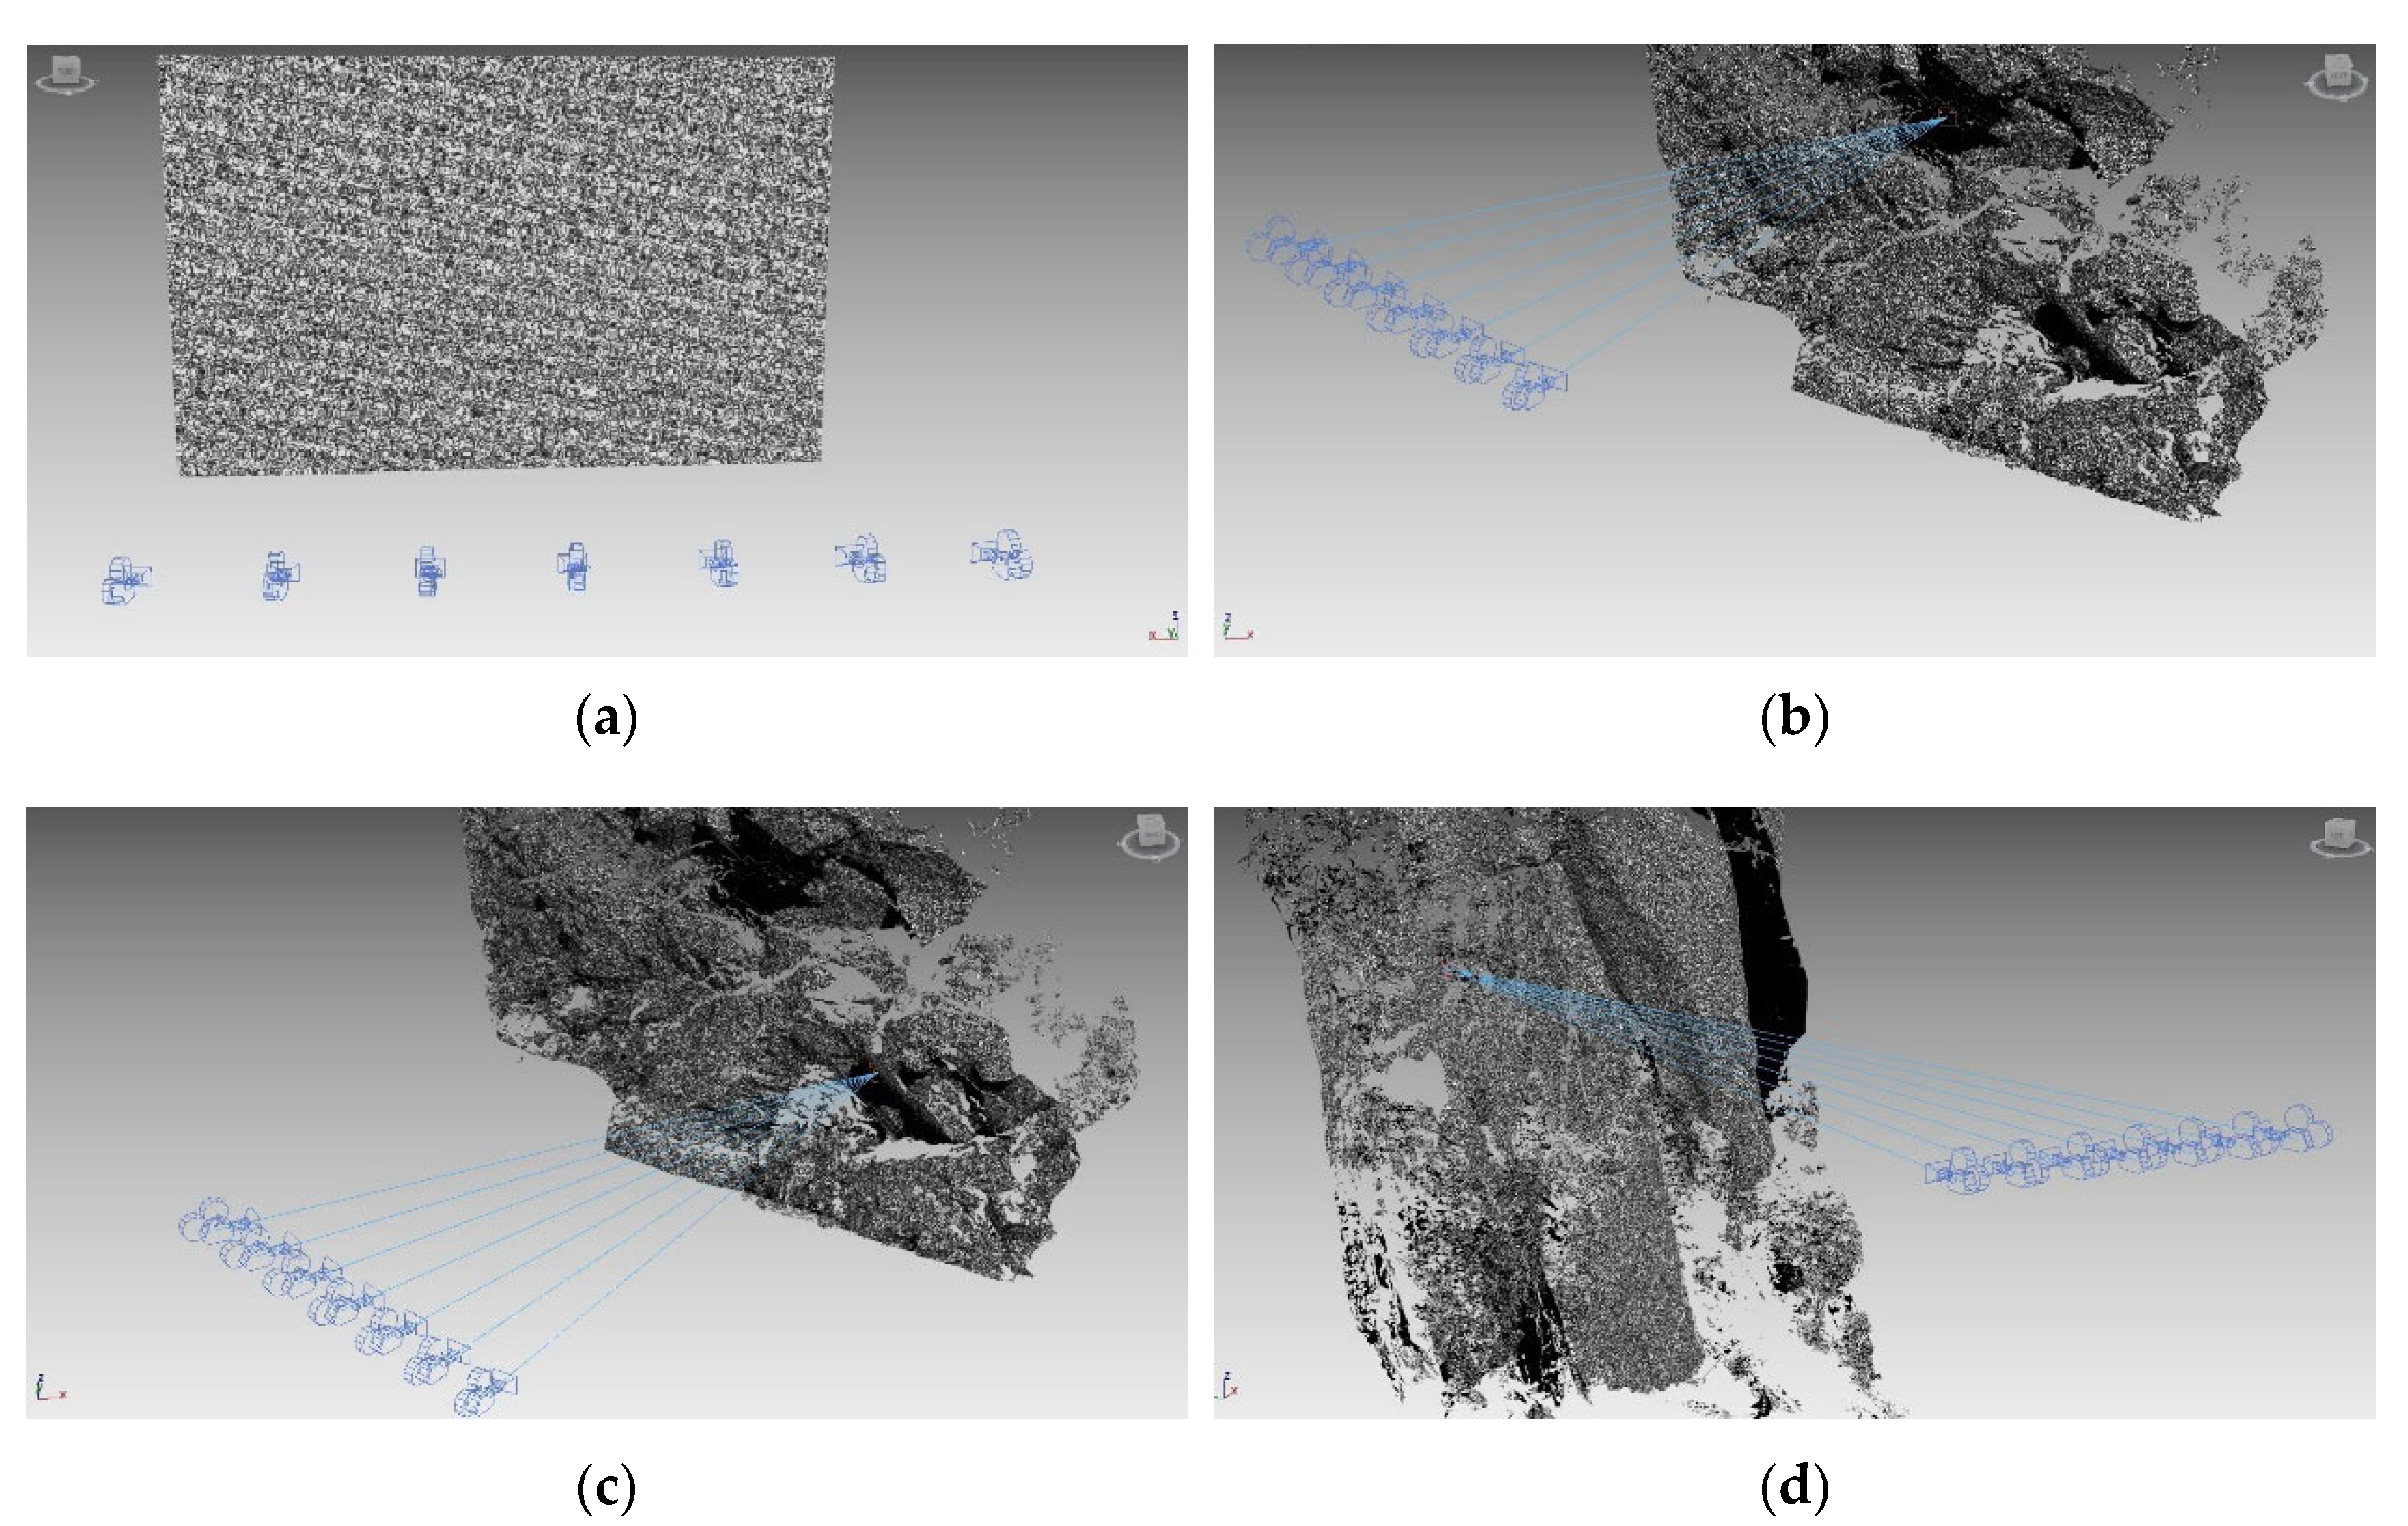
Figure 5.
Graphs showing the standard deviation of the elevation disparity between DEMs and the reference model for Site A1 as a function of (a) max-base variability and (b) multiplicity. (Value of standard deviation for combinations B1-M2 = 1.89 times the GSD).
Figure 5.
Graphs showing the standard deviation of the elevation disparity between DEMs and the reference model for Site A1 as a function of (a) max-base variability and (b) multiplicity. (Value of standard deviation for combinations B1-M2 = 1.89 times the GSD).
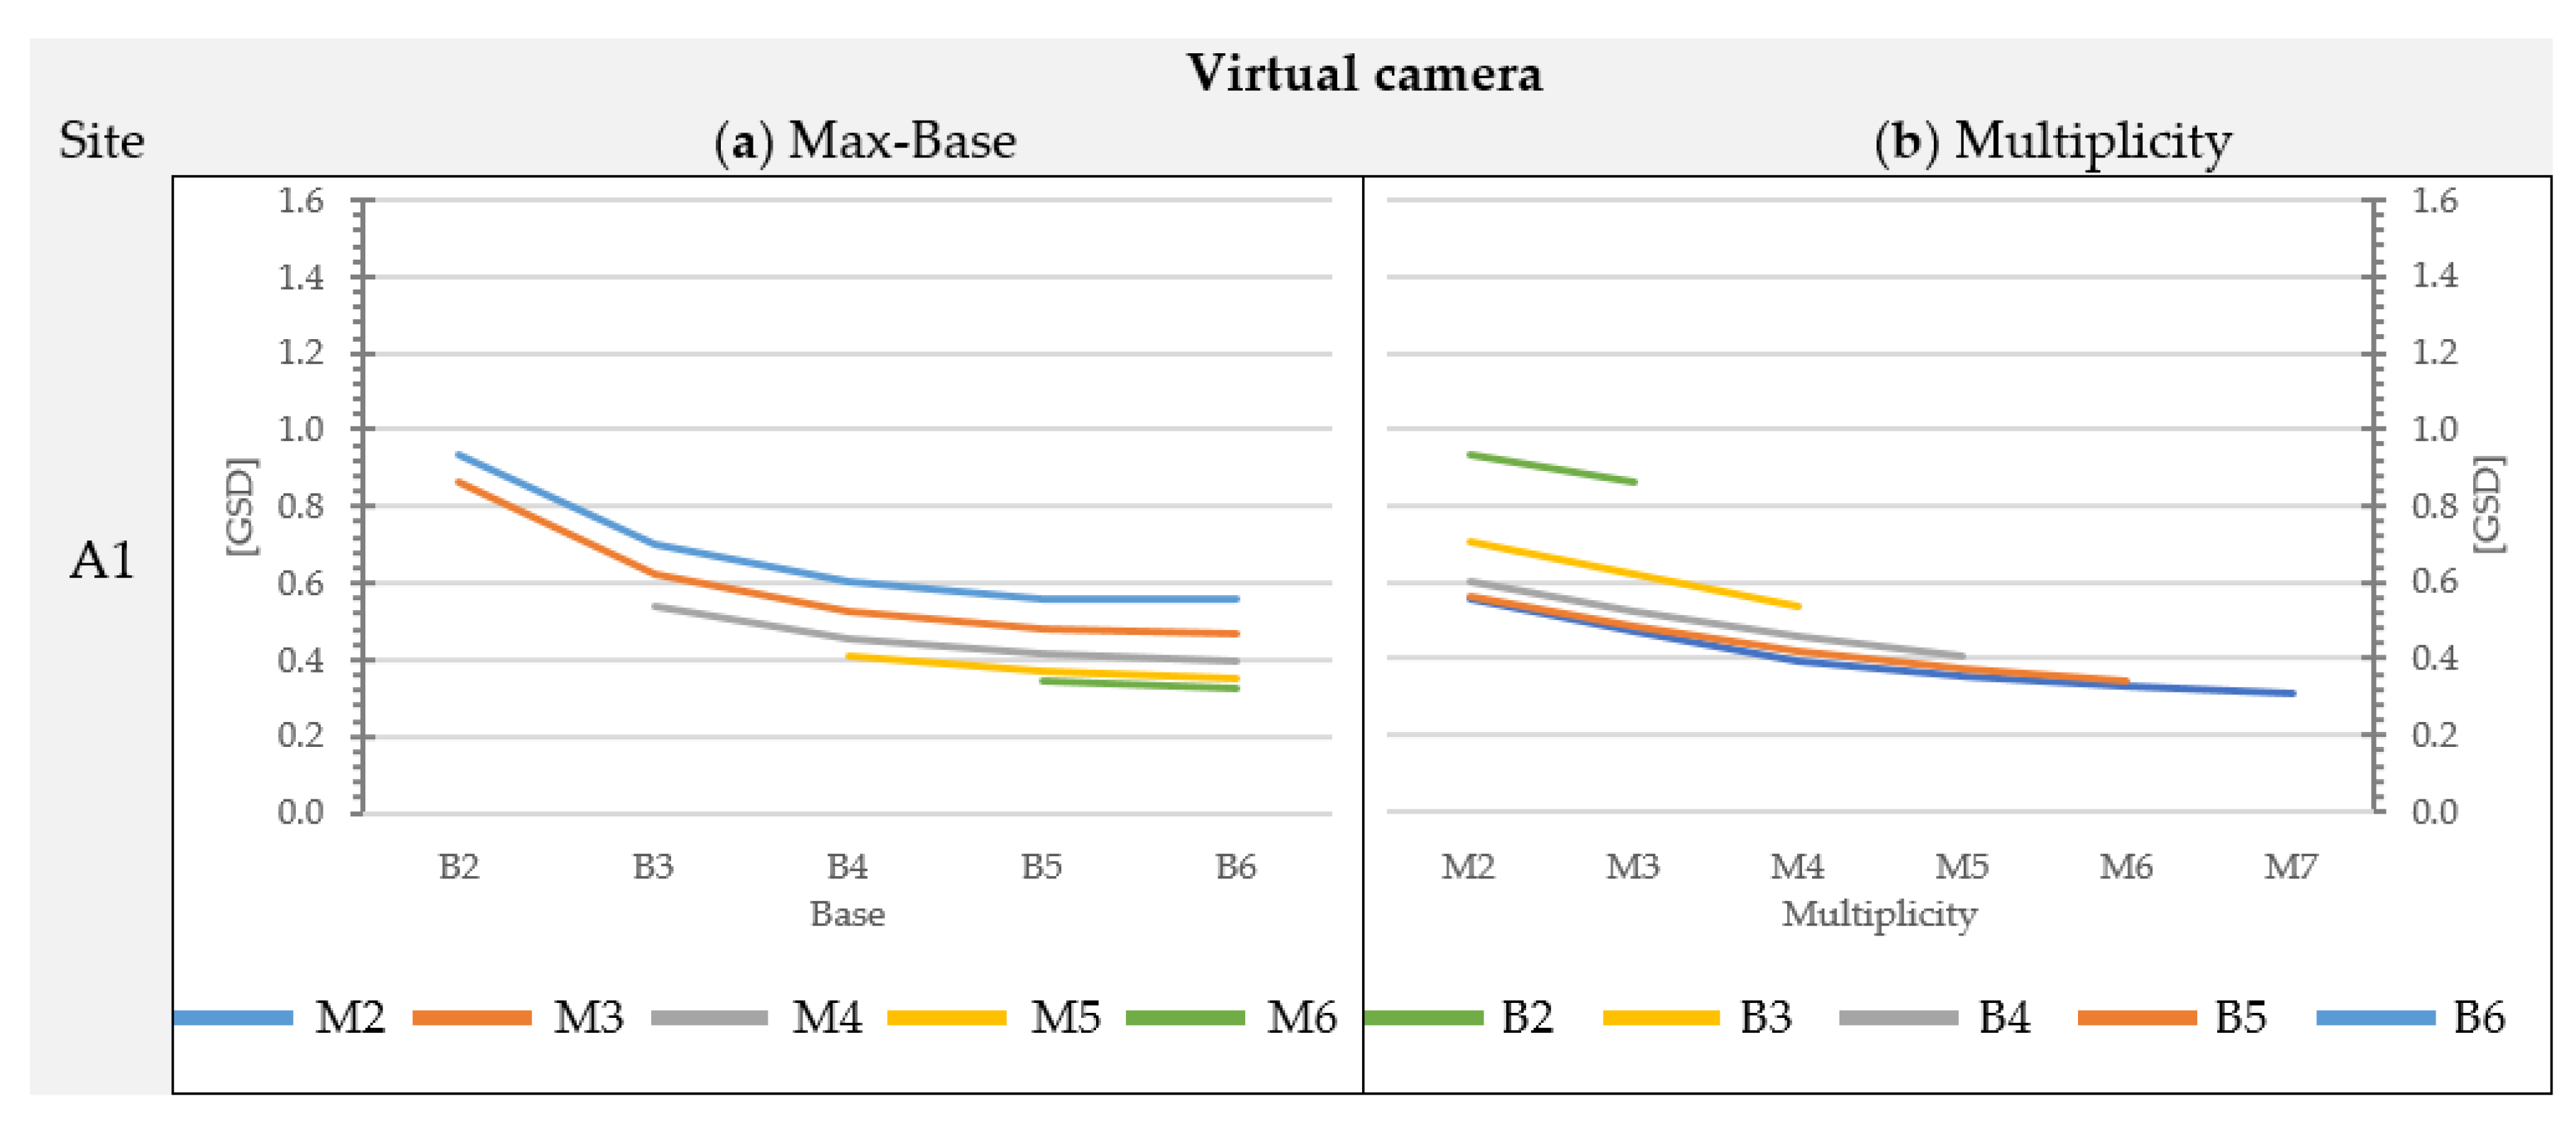
Figure 6.
Graphs showing the standard deviation of the elevation disparity between DEMs and the reference model for Sites B1, C1 and D1 as a function of (a) max-base variability and (b) multiplicity. (Value of standard deviation for combinations B1-M2: Site B1 = 1.79, Site C1 = 1.68 and Site D1 = 2.44 times the GSD).
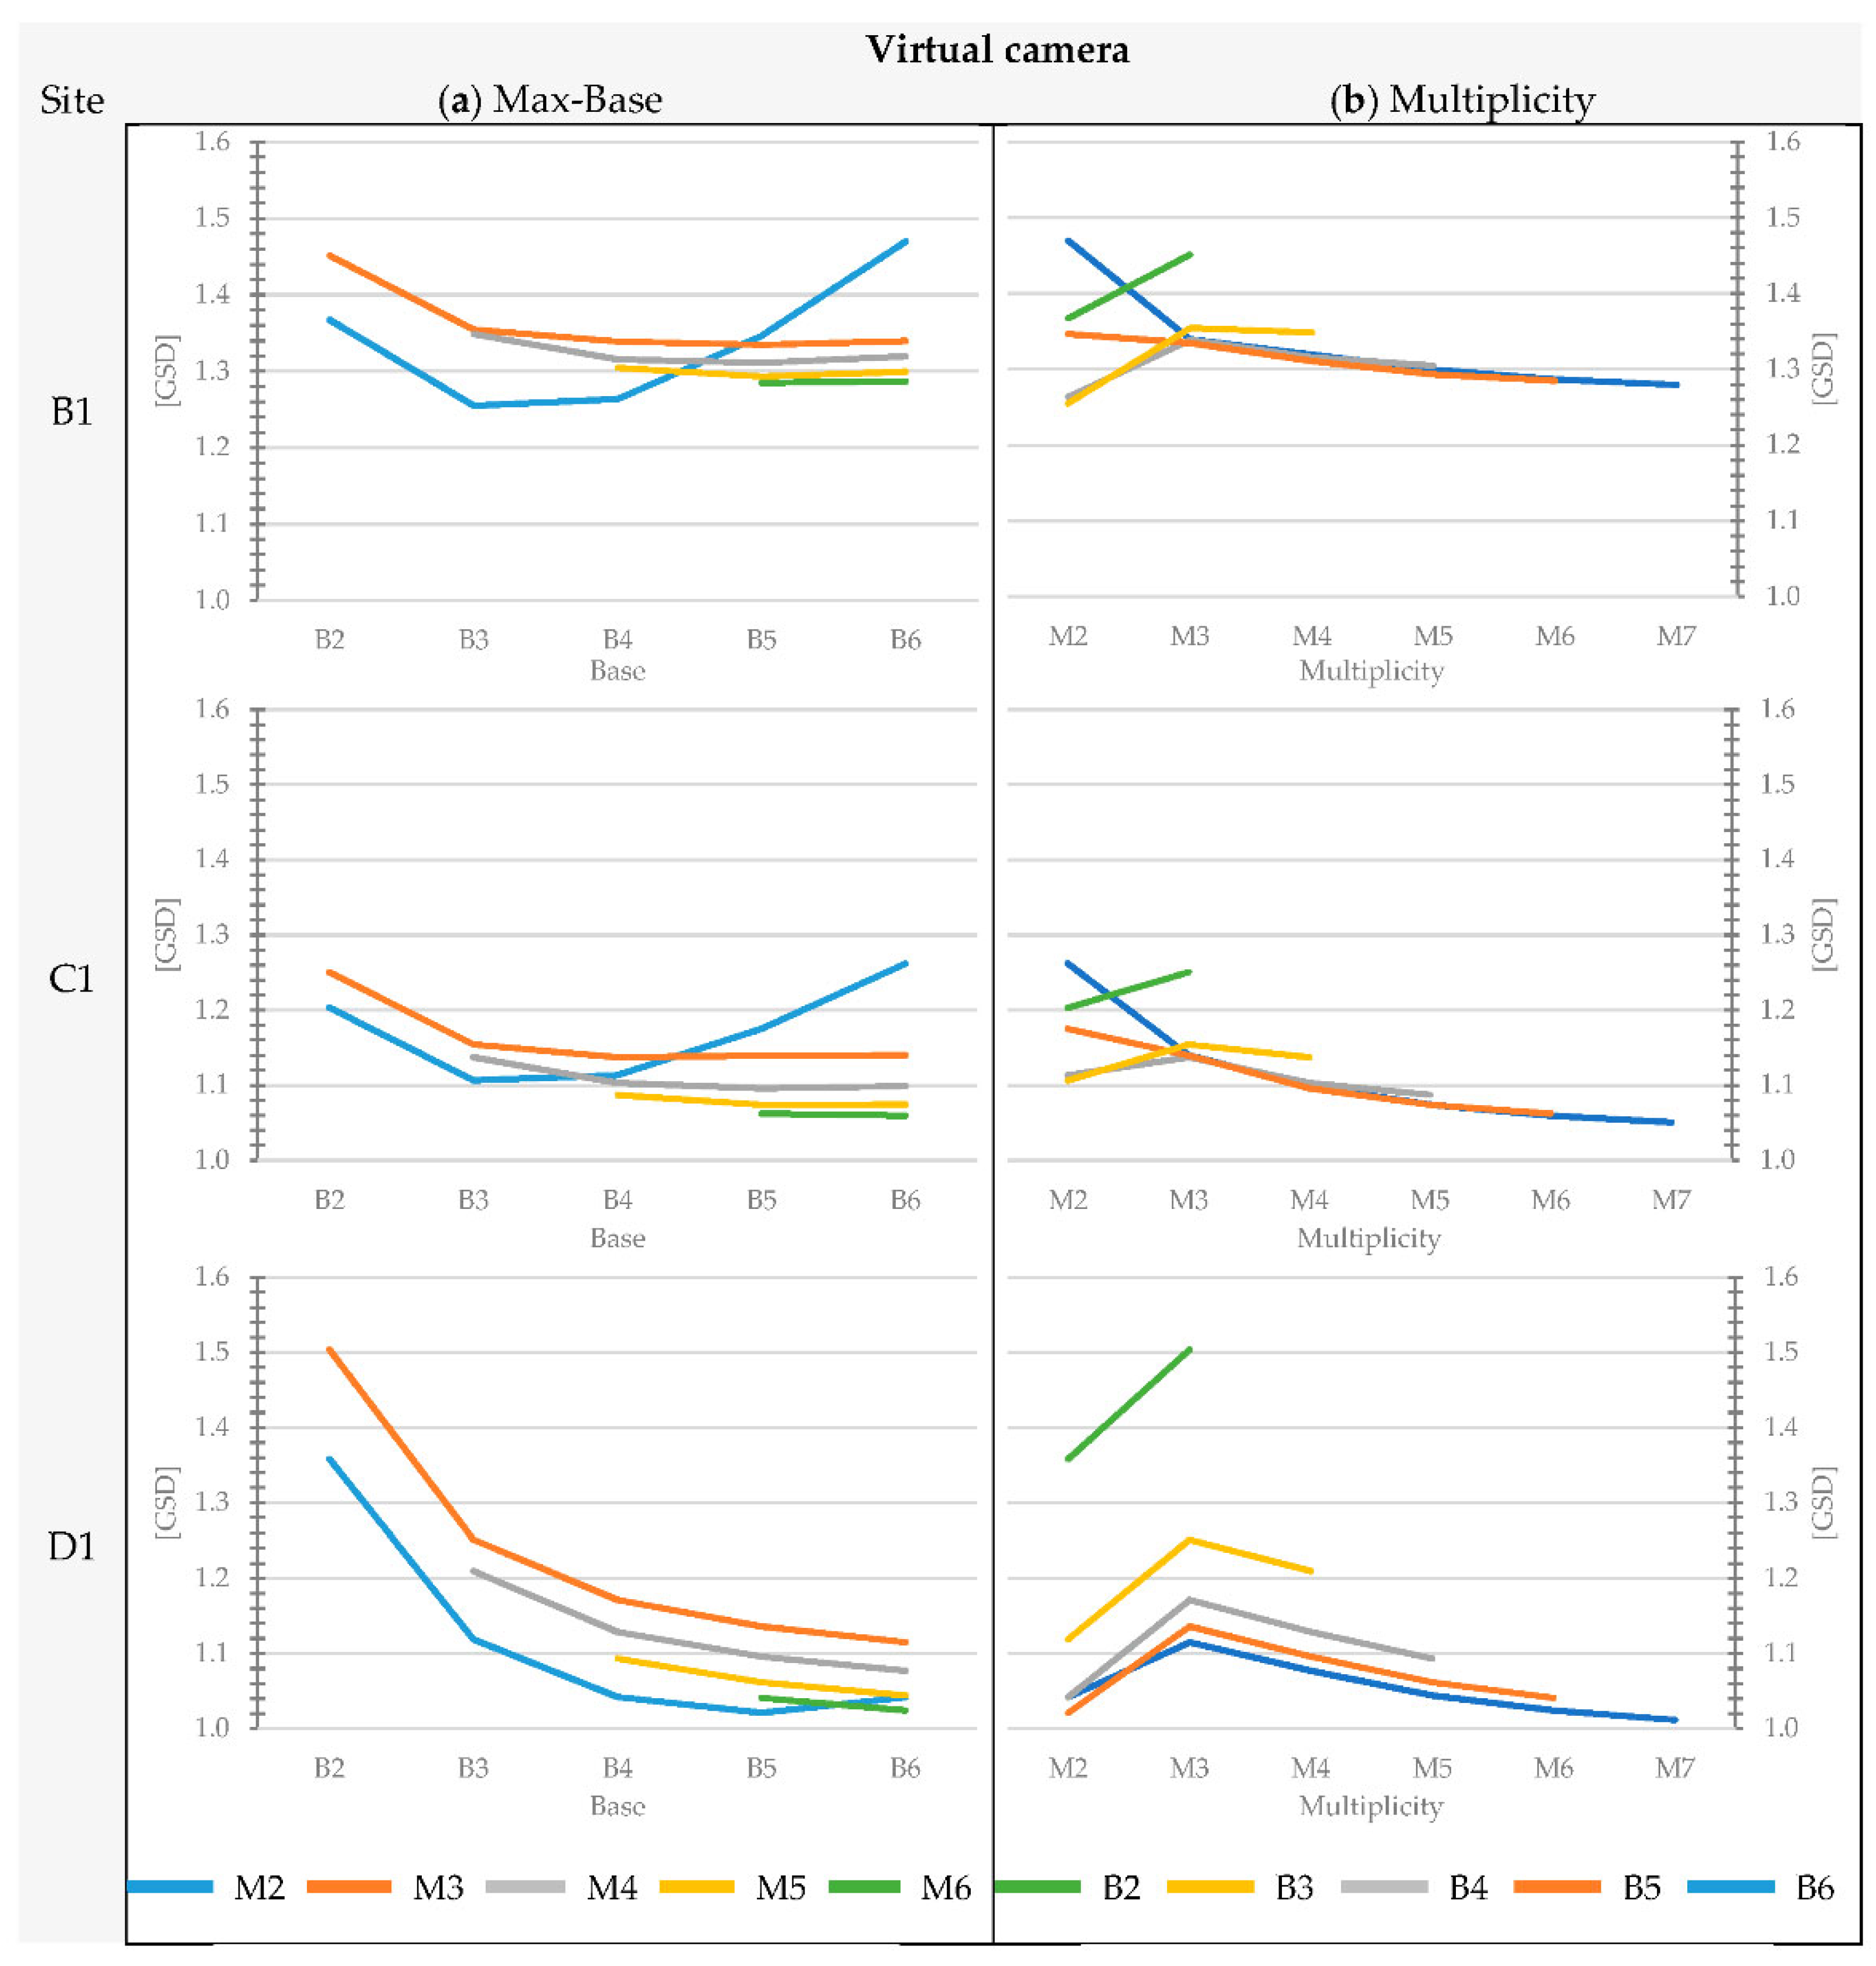
Figure 7.
Graphs showing the standard deviation of the elevation disparity between DEMs and the reference model for Sites A, B, C and D, using Nikon D3, as a function of (a) max-base variability and (b) multiplicity. (Value of standard deviation for combinations B1-M2: Site A = 1.70, Site B = 2.87, Site C = 2.27, Site D = 2.32 times the GSD).
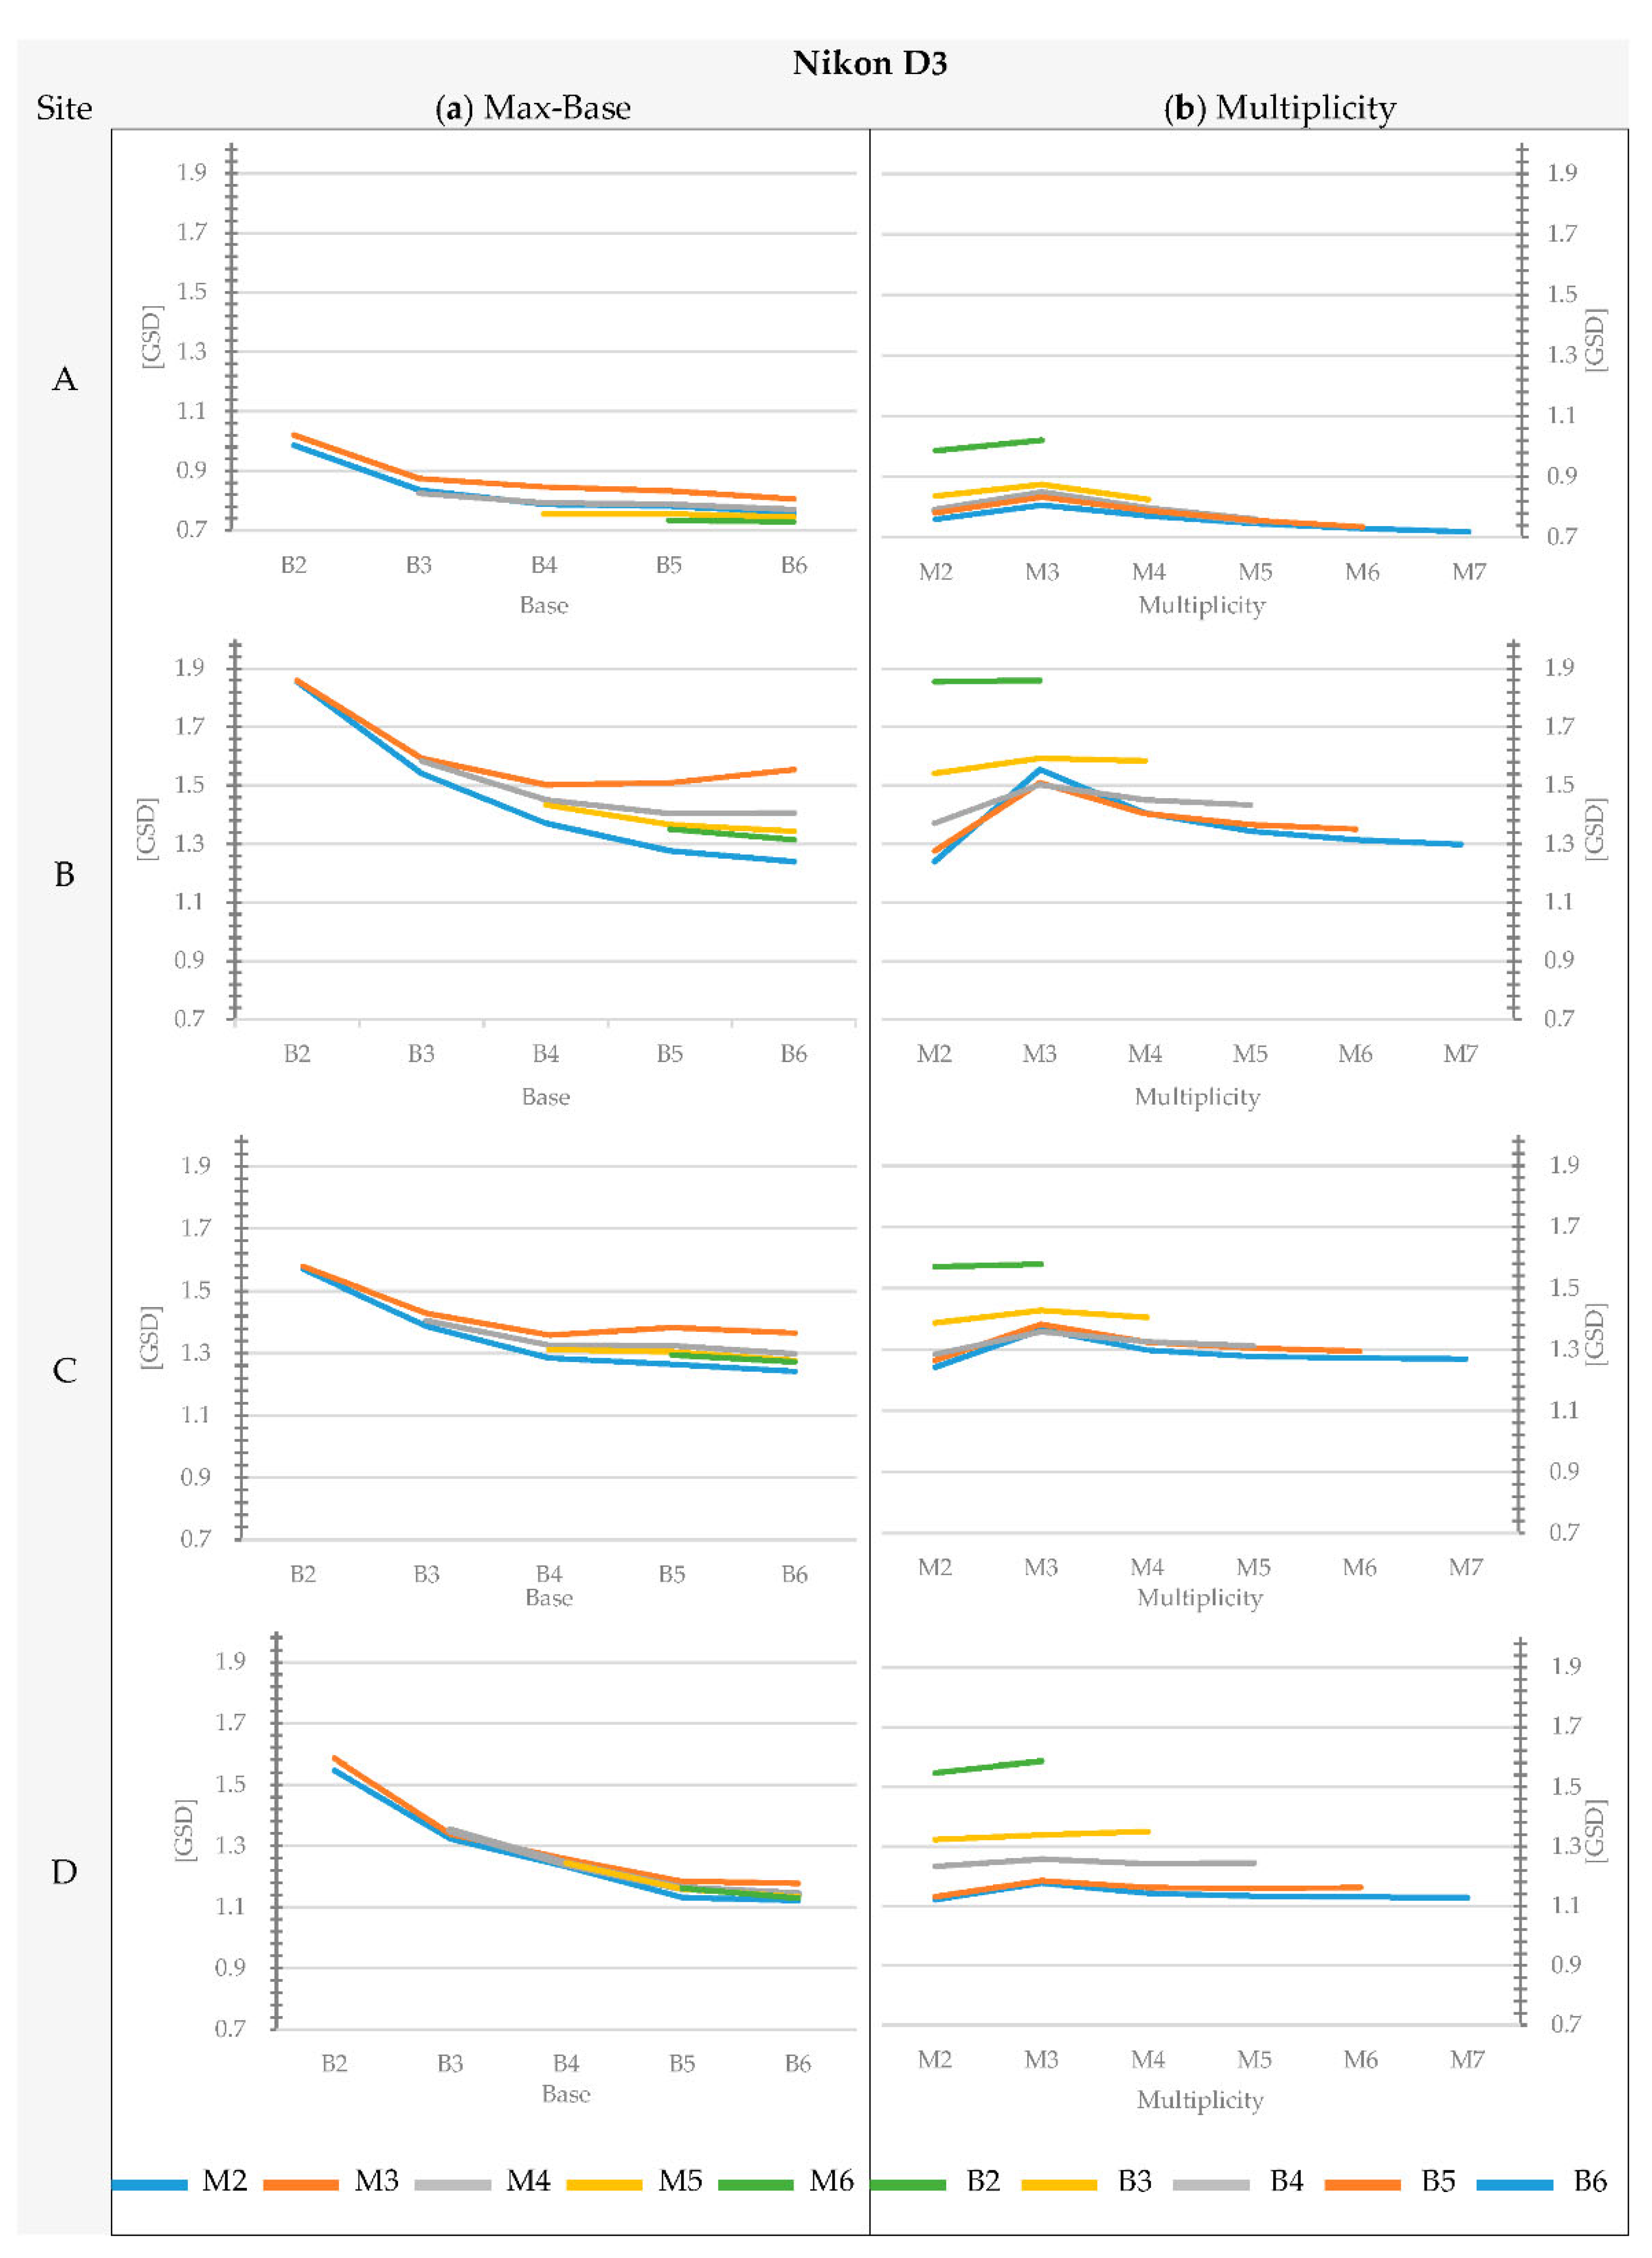
Figure 8.
Graphs showing the standard deviation of the elevation disparity between DEMs and the reference model for Sites A, B, C and D, using Nikon S3100, as a function of (a) max-base variability and (b) multiplicity. (Value of standard deviation for combinations B1-M2: Site A = 2.68, B = 4.18, Site C = 3.67 and Site D = 3.90 times the GSD).
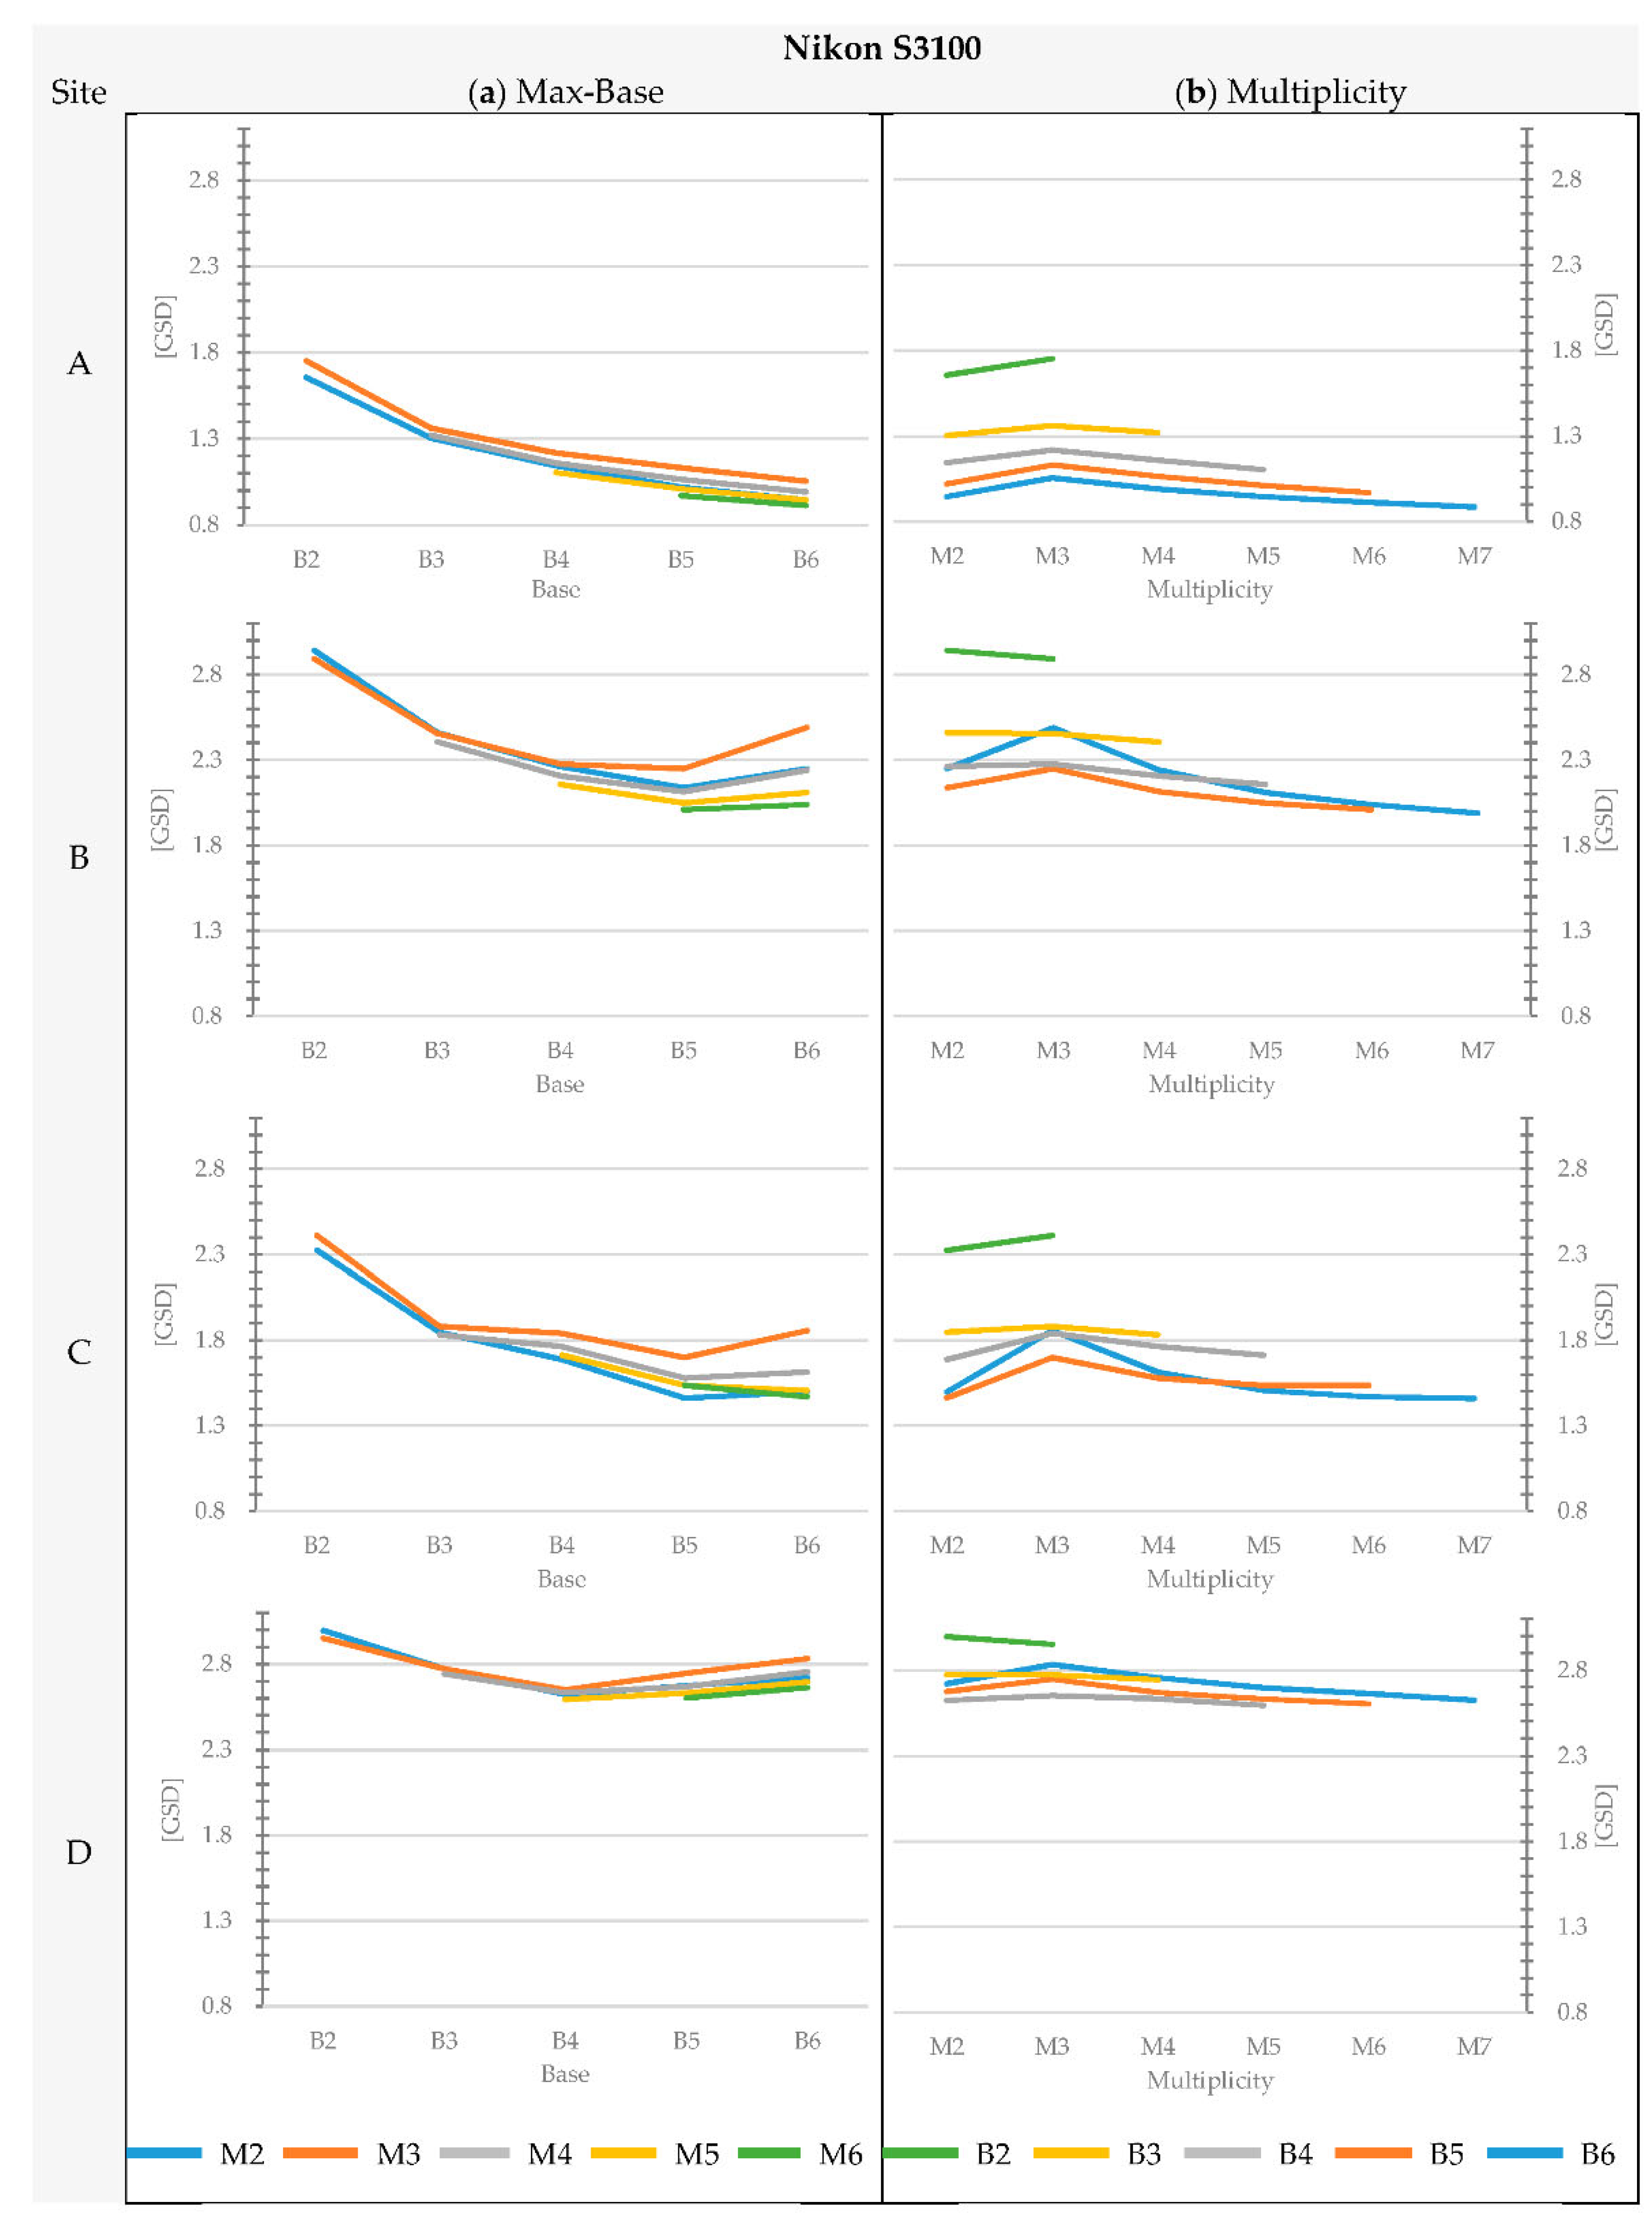
Figure 9.
Graphs showing the standard deviation of the elevation disparity between DEMs and the reference model for Sites B, C and D, using USB camera, as a function of (a) max-base variability and (b) multiplicity. (Value of standard deviation for combinations B1-M2: Site B = 9.09, Site C = 5.79 and Site D = 12.71 times the GSD).

Figure 10.
Examples of (a) symmetrical and (b) asymmetrical geometry of image acquisition referred to M3.
Figure 10.
Examples of (a) symmetrical and (b) asymmetrical geometry of image acquisition referred to M3.
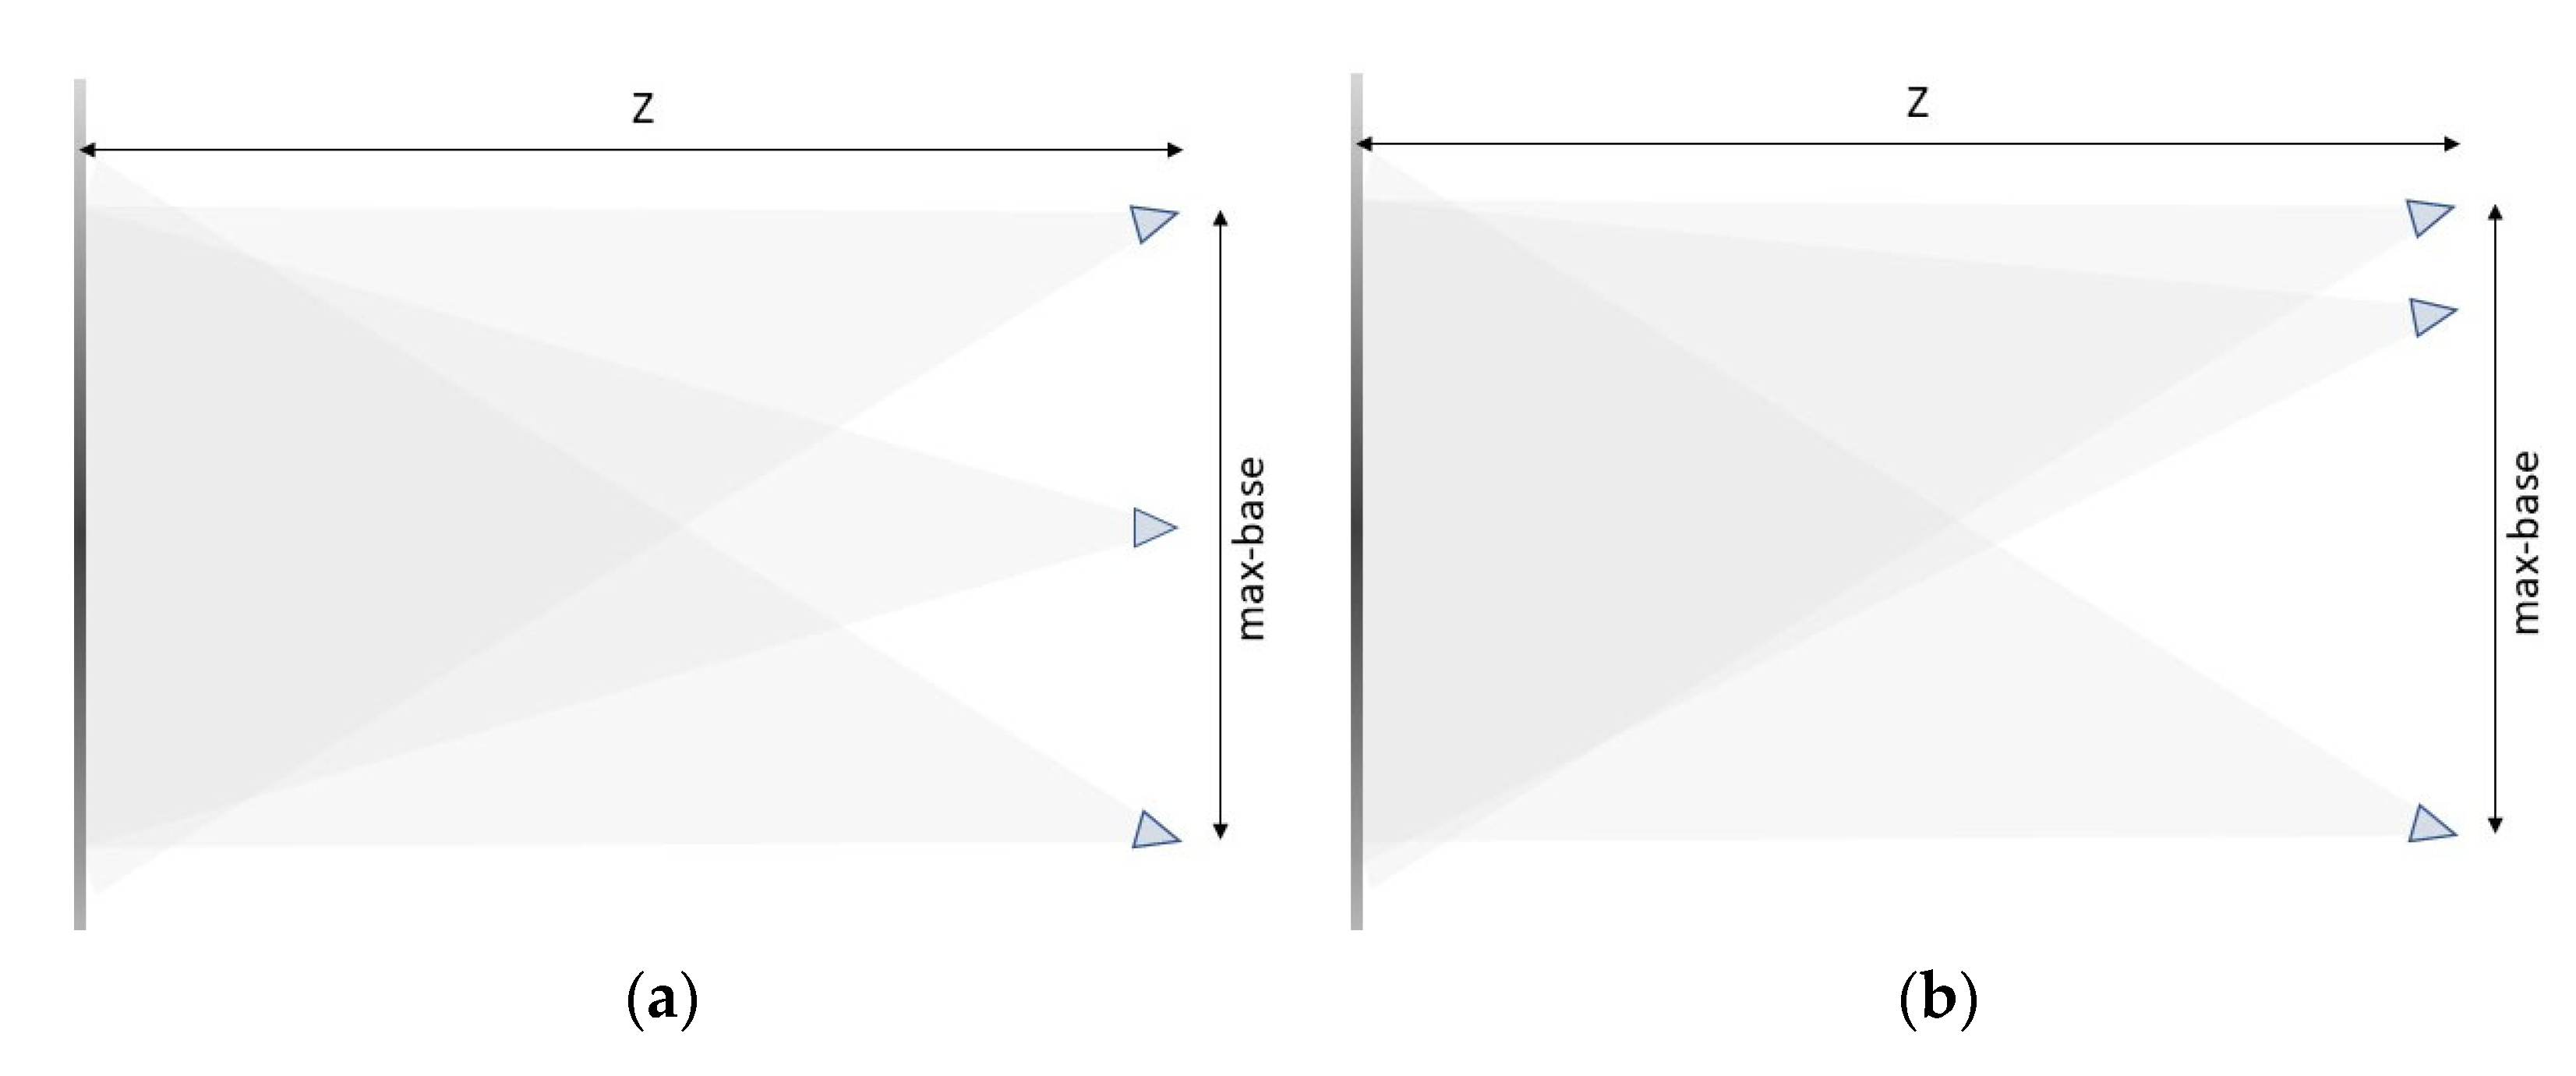
Figure 11.
Graphs showing the standard deviation variability within each multiplicity grouping (minimum, average and maximum values). The data refer to Site B (Nikon D3).
Figure 11.
Graphs showing the standard deviation variability within each multiplicity grouping (minimum, average and maximum values). The data refer to Site B (Nikon D3).
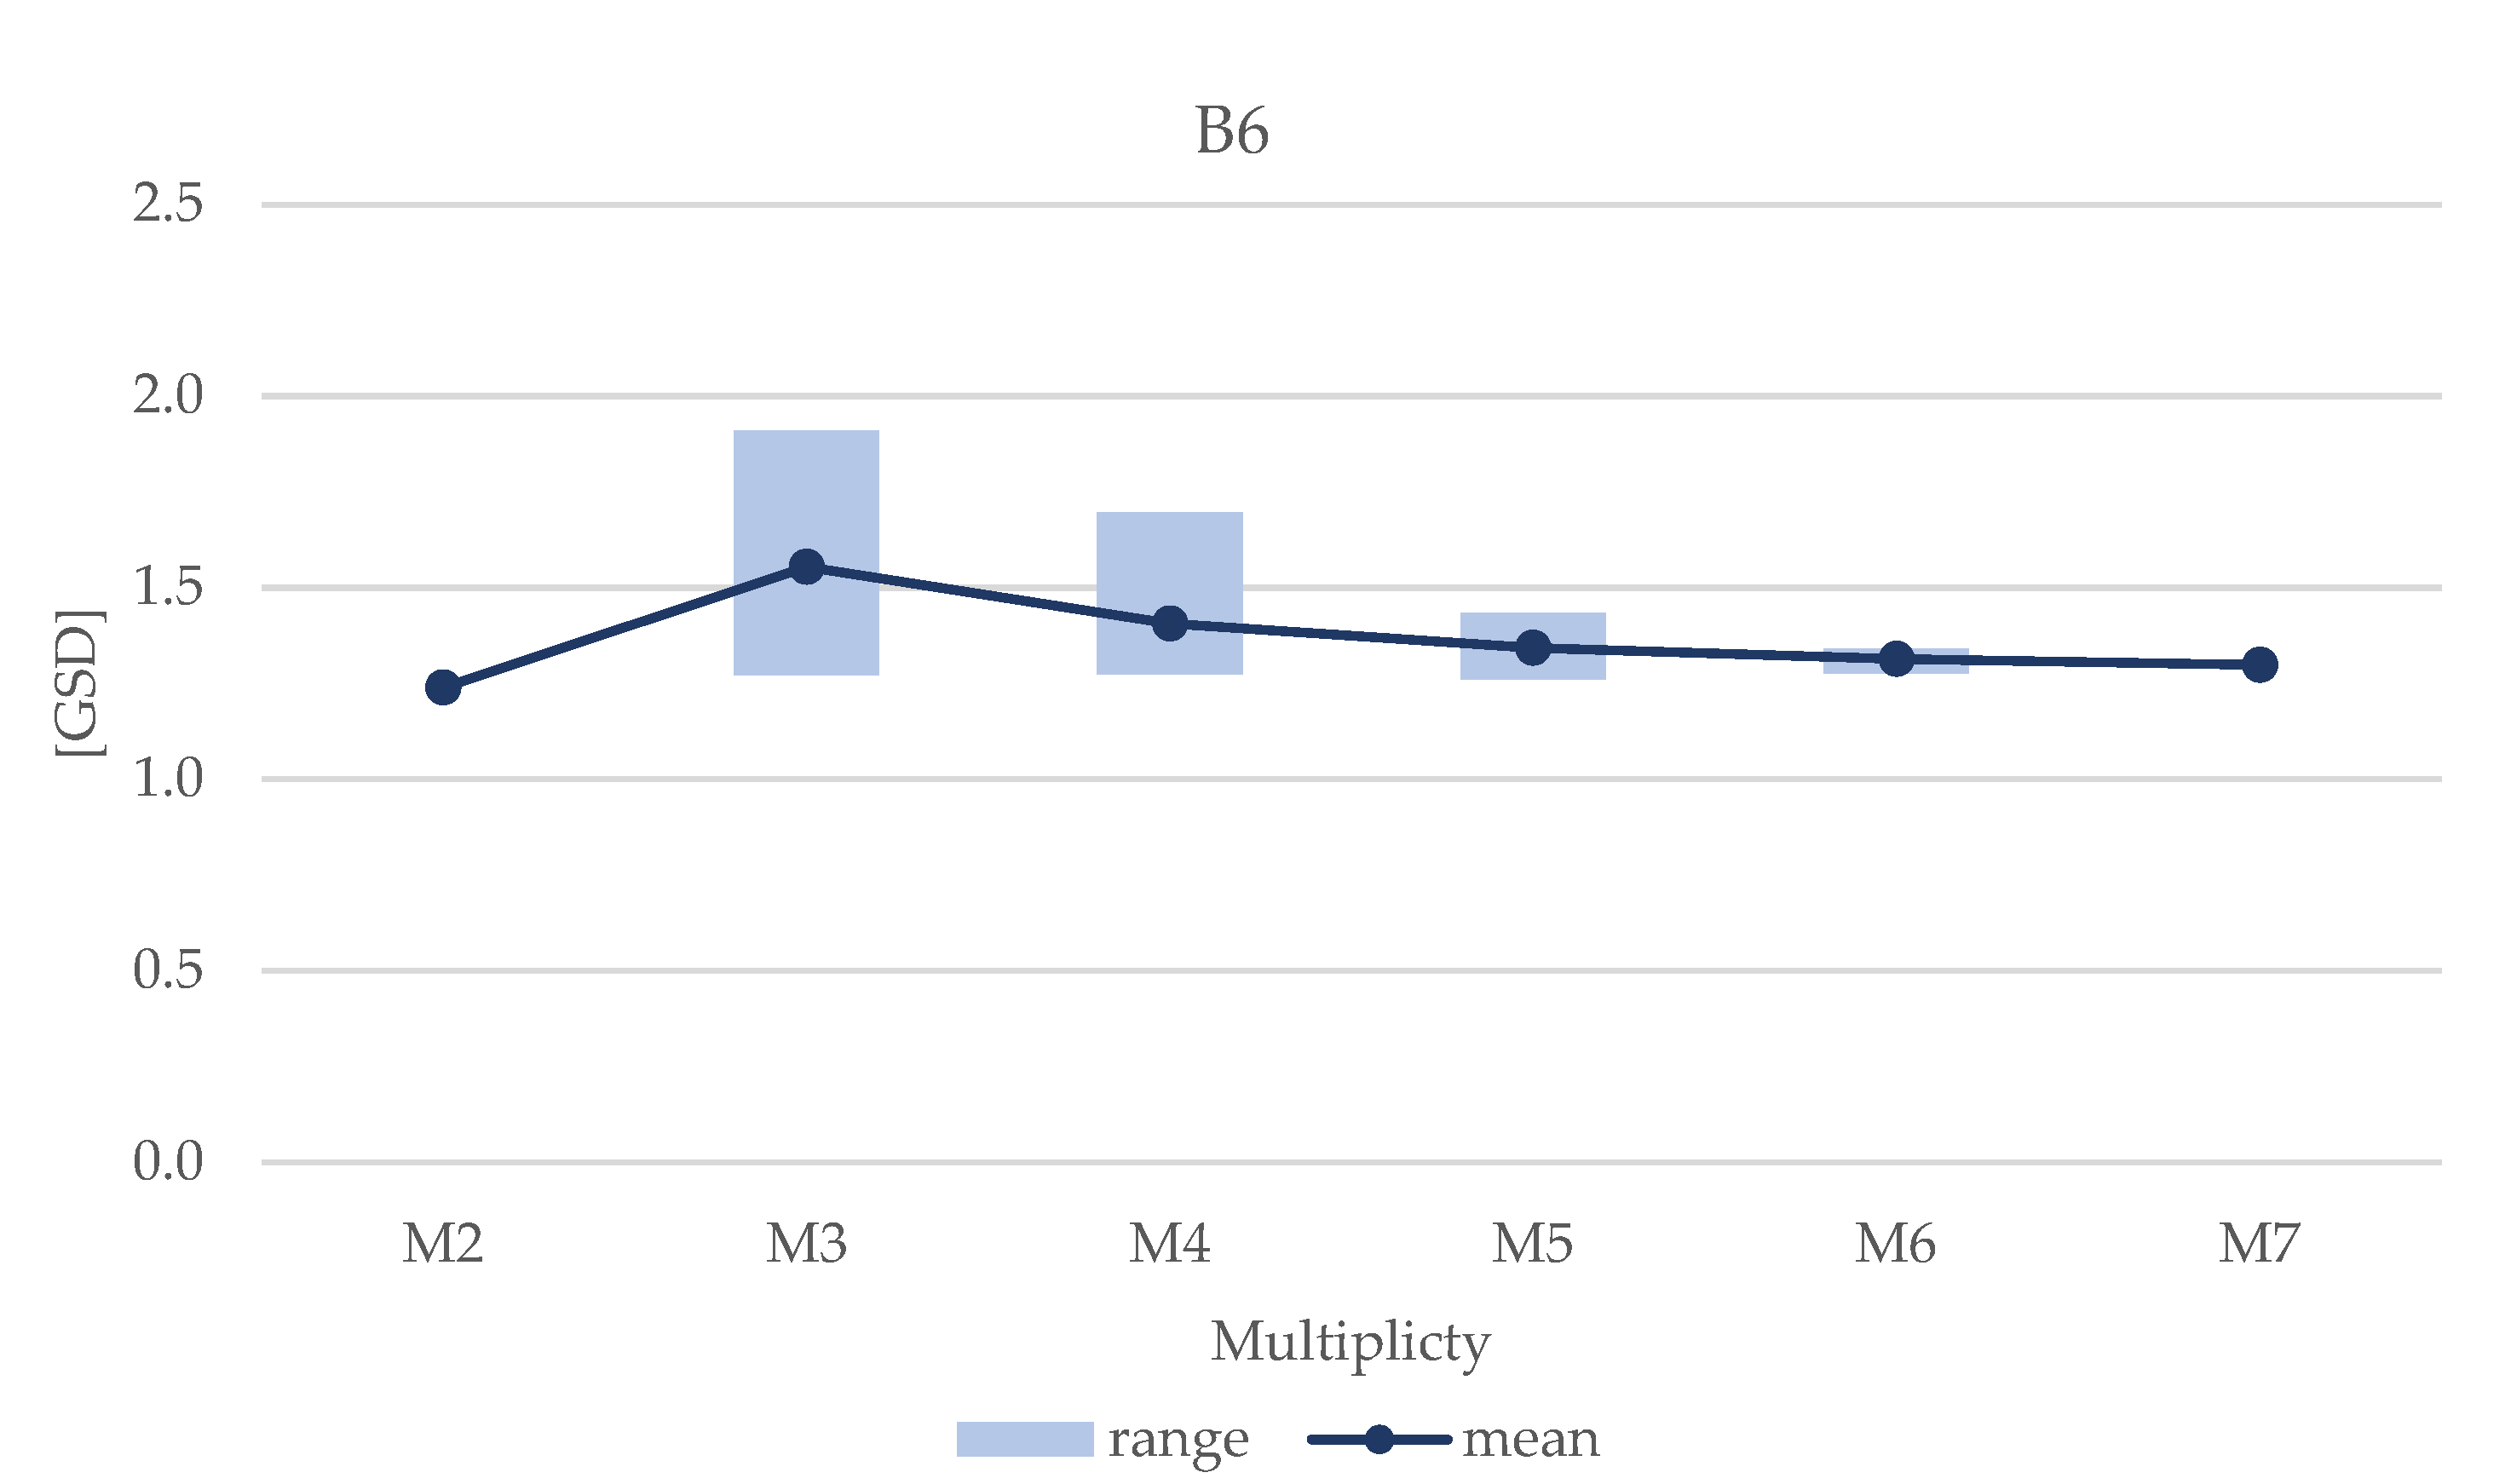
Figure 12.
Graphs showing the DEM completeness in percent for Site A1: (a) influence of max-base variability and (b) the influence of multiplicity.
Figure 12.
Graphs showing the DEM completeness in percent for Site A1: (a) influence of max-base variability and (b) the influence of multiplicity.
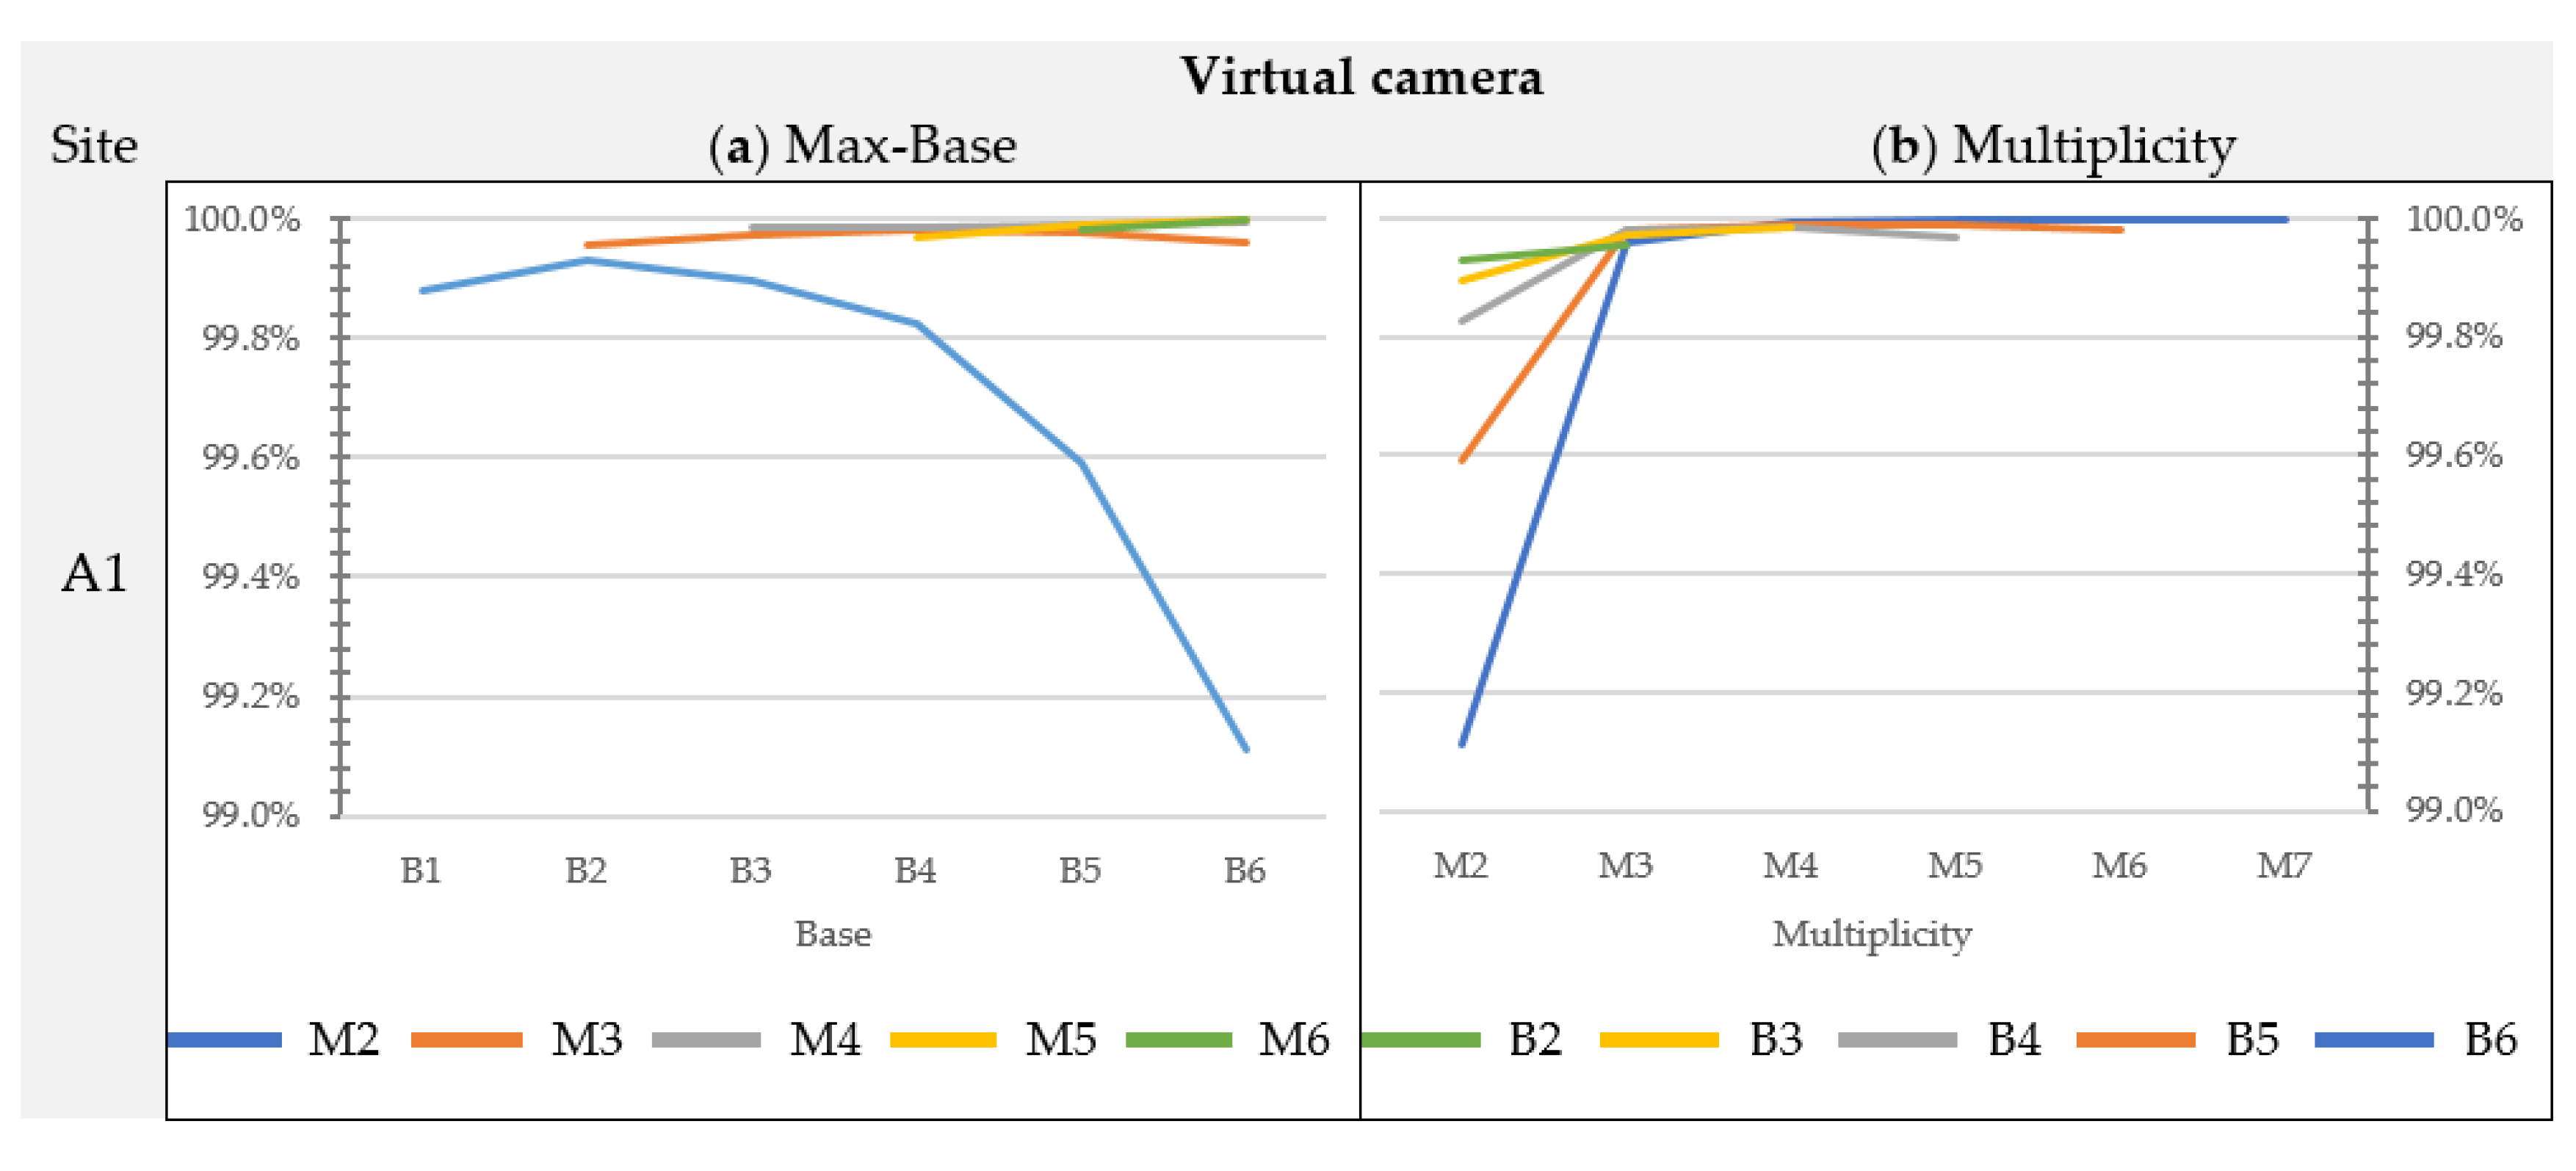
Figure 13.
Graphs showing the DEM completeness in percent for Sites B and Site D using the Nikon D3 and USB, respectively: (a) the influence of max-base variability and (b) the influence of multiplicity.
Figure 13.
Graphs showing the DEM completeness in percent for Sites B and Site D using the Nikon D3 and USB, respectively: (a) the influence of max-base variability and (b) the influence of multiplicity.
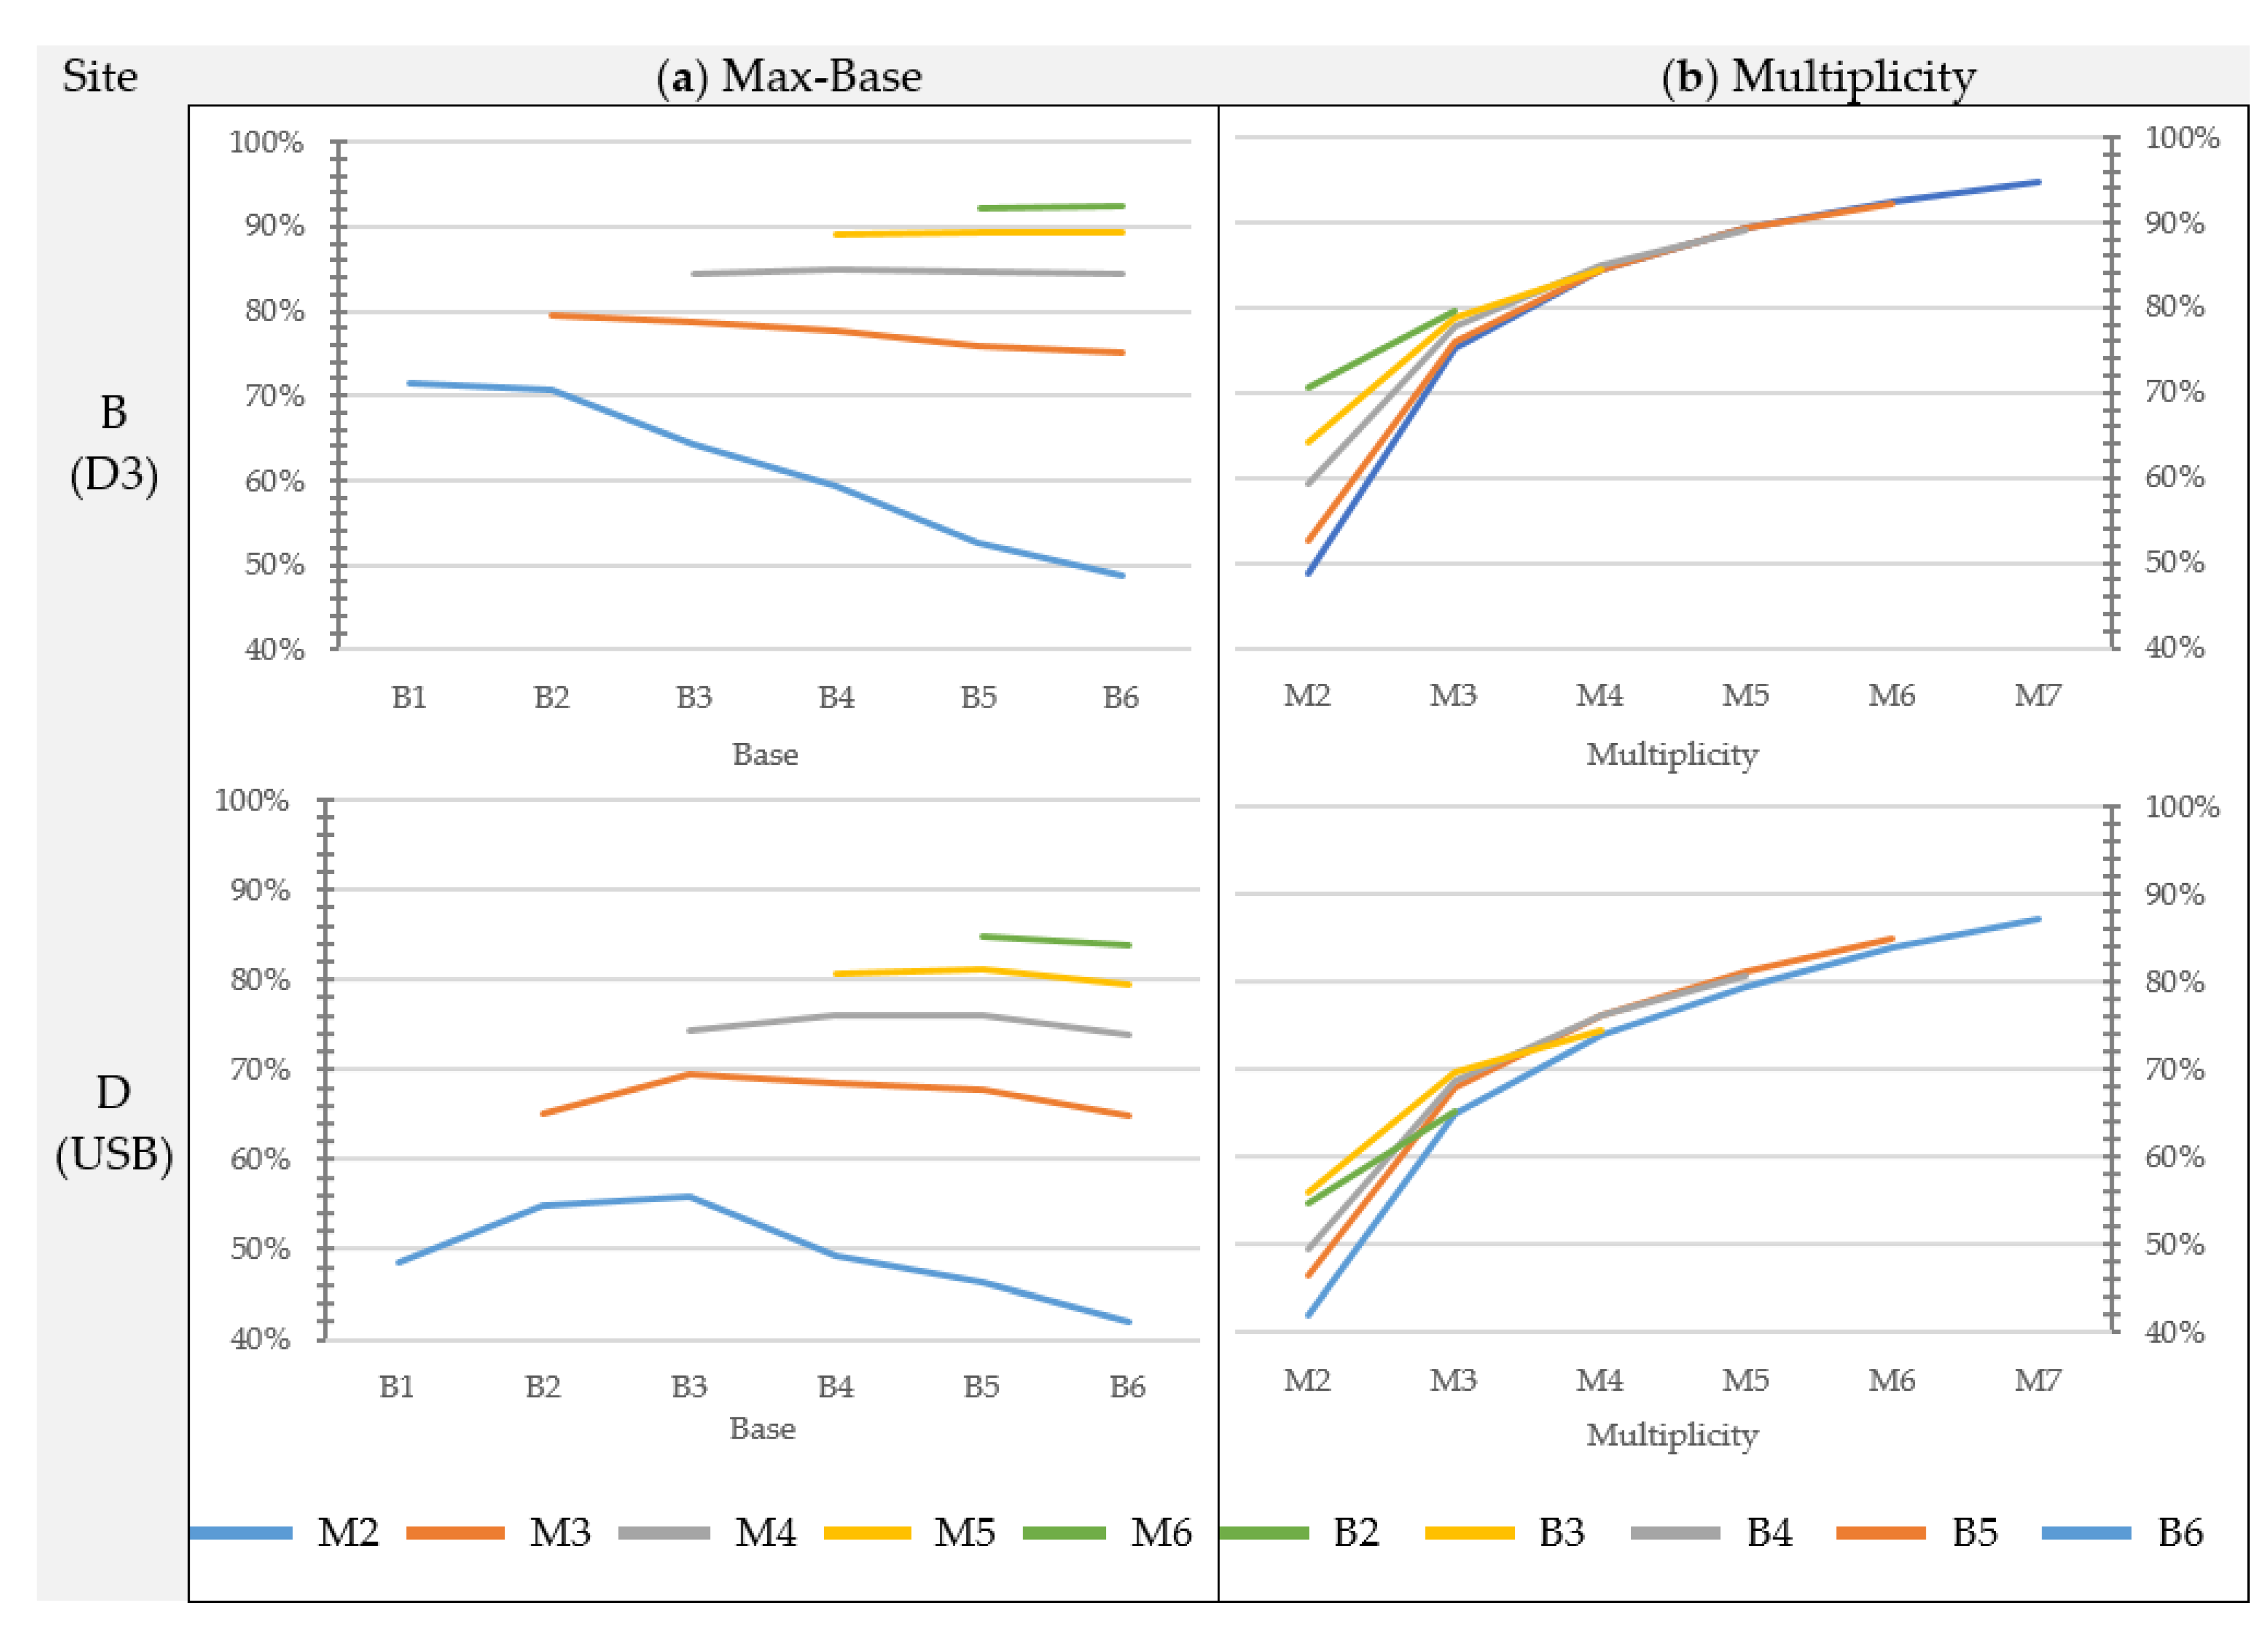
Figure 14.
Graphs showing the standard deviation of errors on the Z coordinate obtained as a result of the Monte Carlo simulation: (a) influence of max-base and (b) influence of multiplicity.
Figure 14.
Graphs showing the standard deviation of errors on the Z coordinate obtained as a result of the Monte Carlo simulation: (a) influence of max-base and (b) influence of multiplicity.

Figure 15.
Graphs showing the standard deviation variability within each multiplicity grouping (minimum, average and maximum values). The data refer to Simulation 2.
Figure 15.
Graphs showing the standard deviation variability within each multiplicity grouping (minimum, average and maximum values). The data refer to Simulation 2.
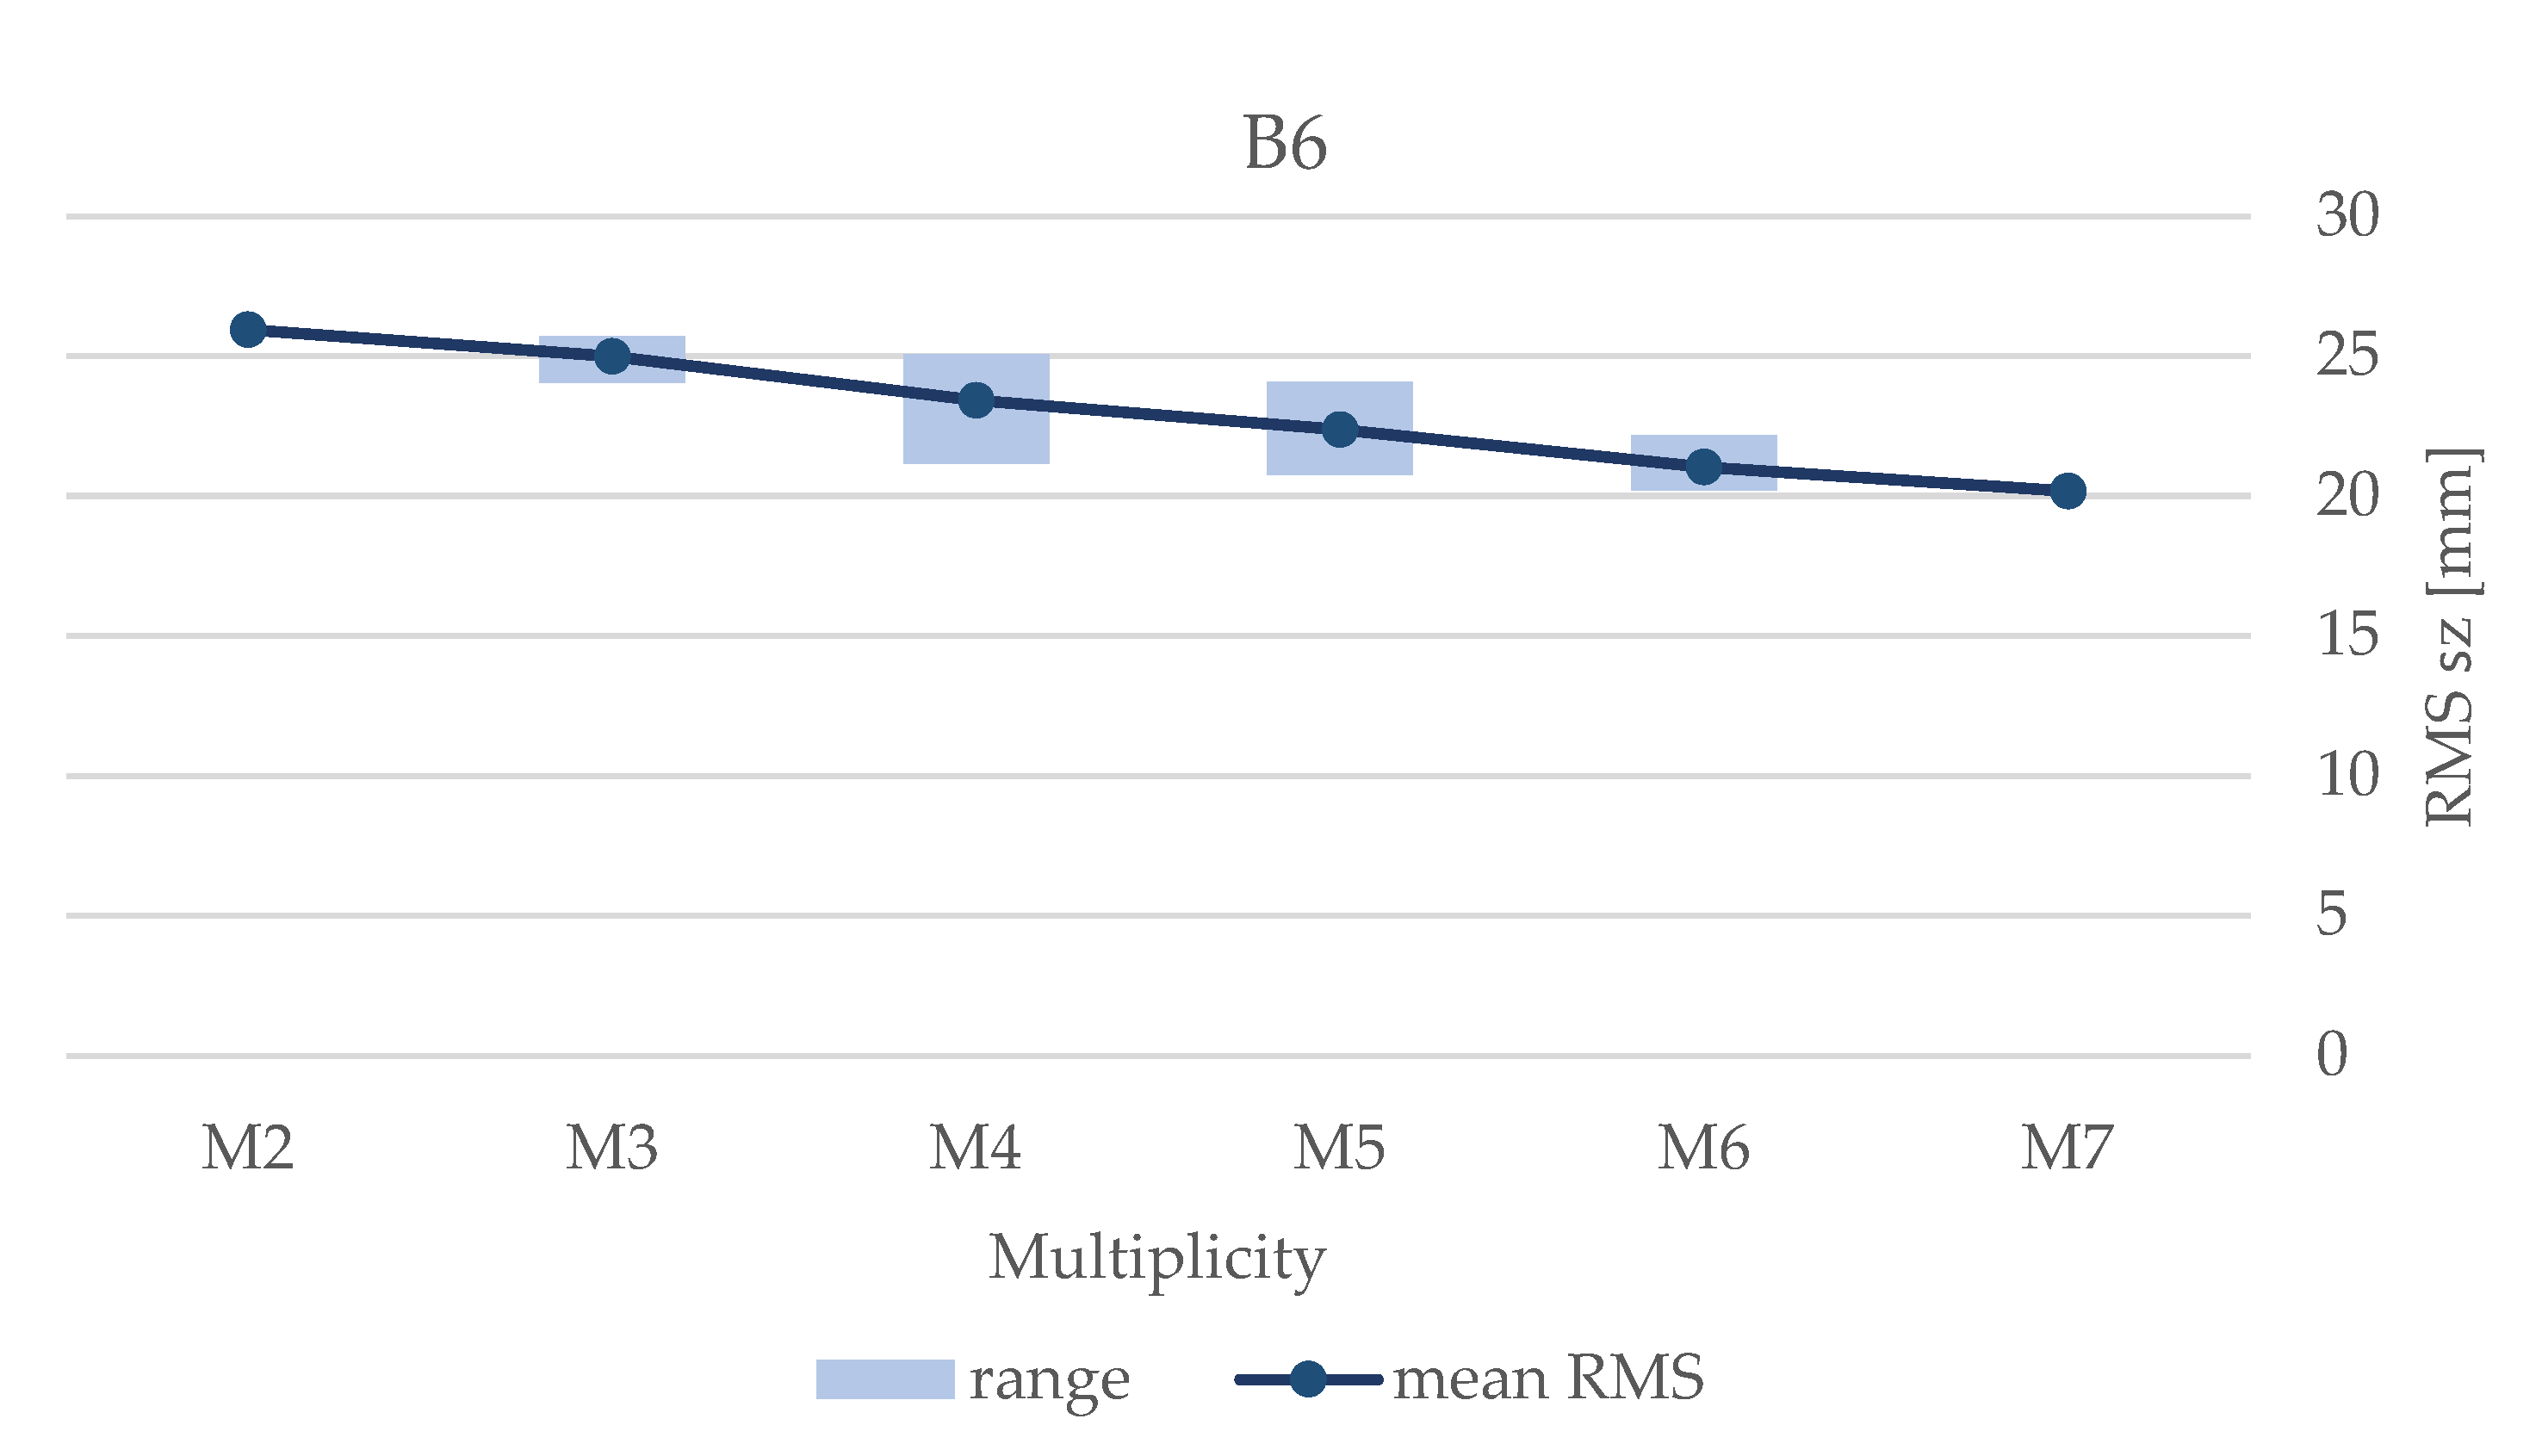
Figure 16.
Graphs showing the standard deviation of the elevation disparity between DEMs and the reference model for Sites B, C and D, processed using MicMac, as a function of (a) the max-base variability and (b) multiplicity. (Value of standard deviation for combinations B1-M2: B = 7.60, C = 4.22 and D = 5.02 times the GSD).
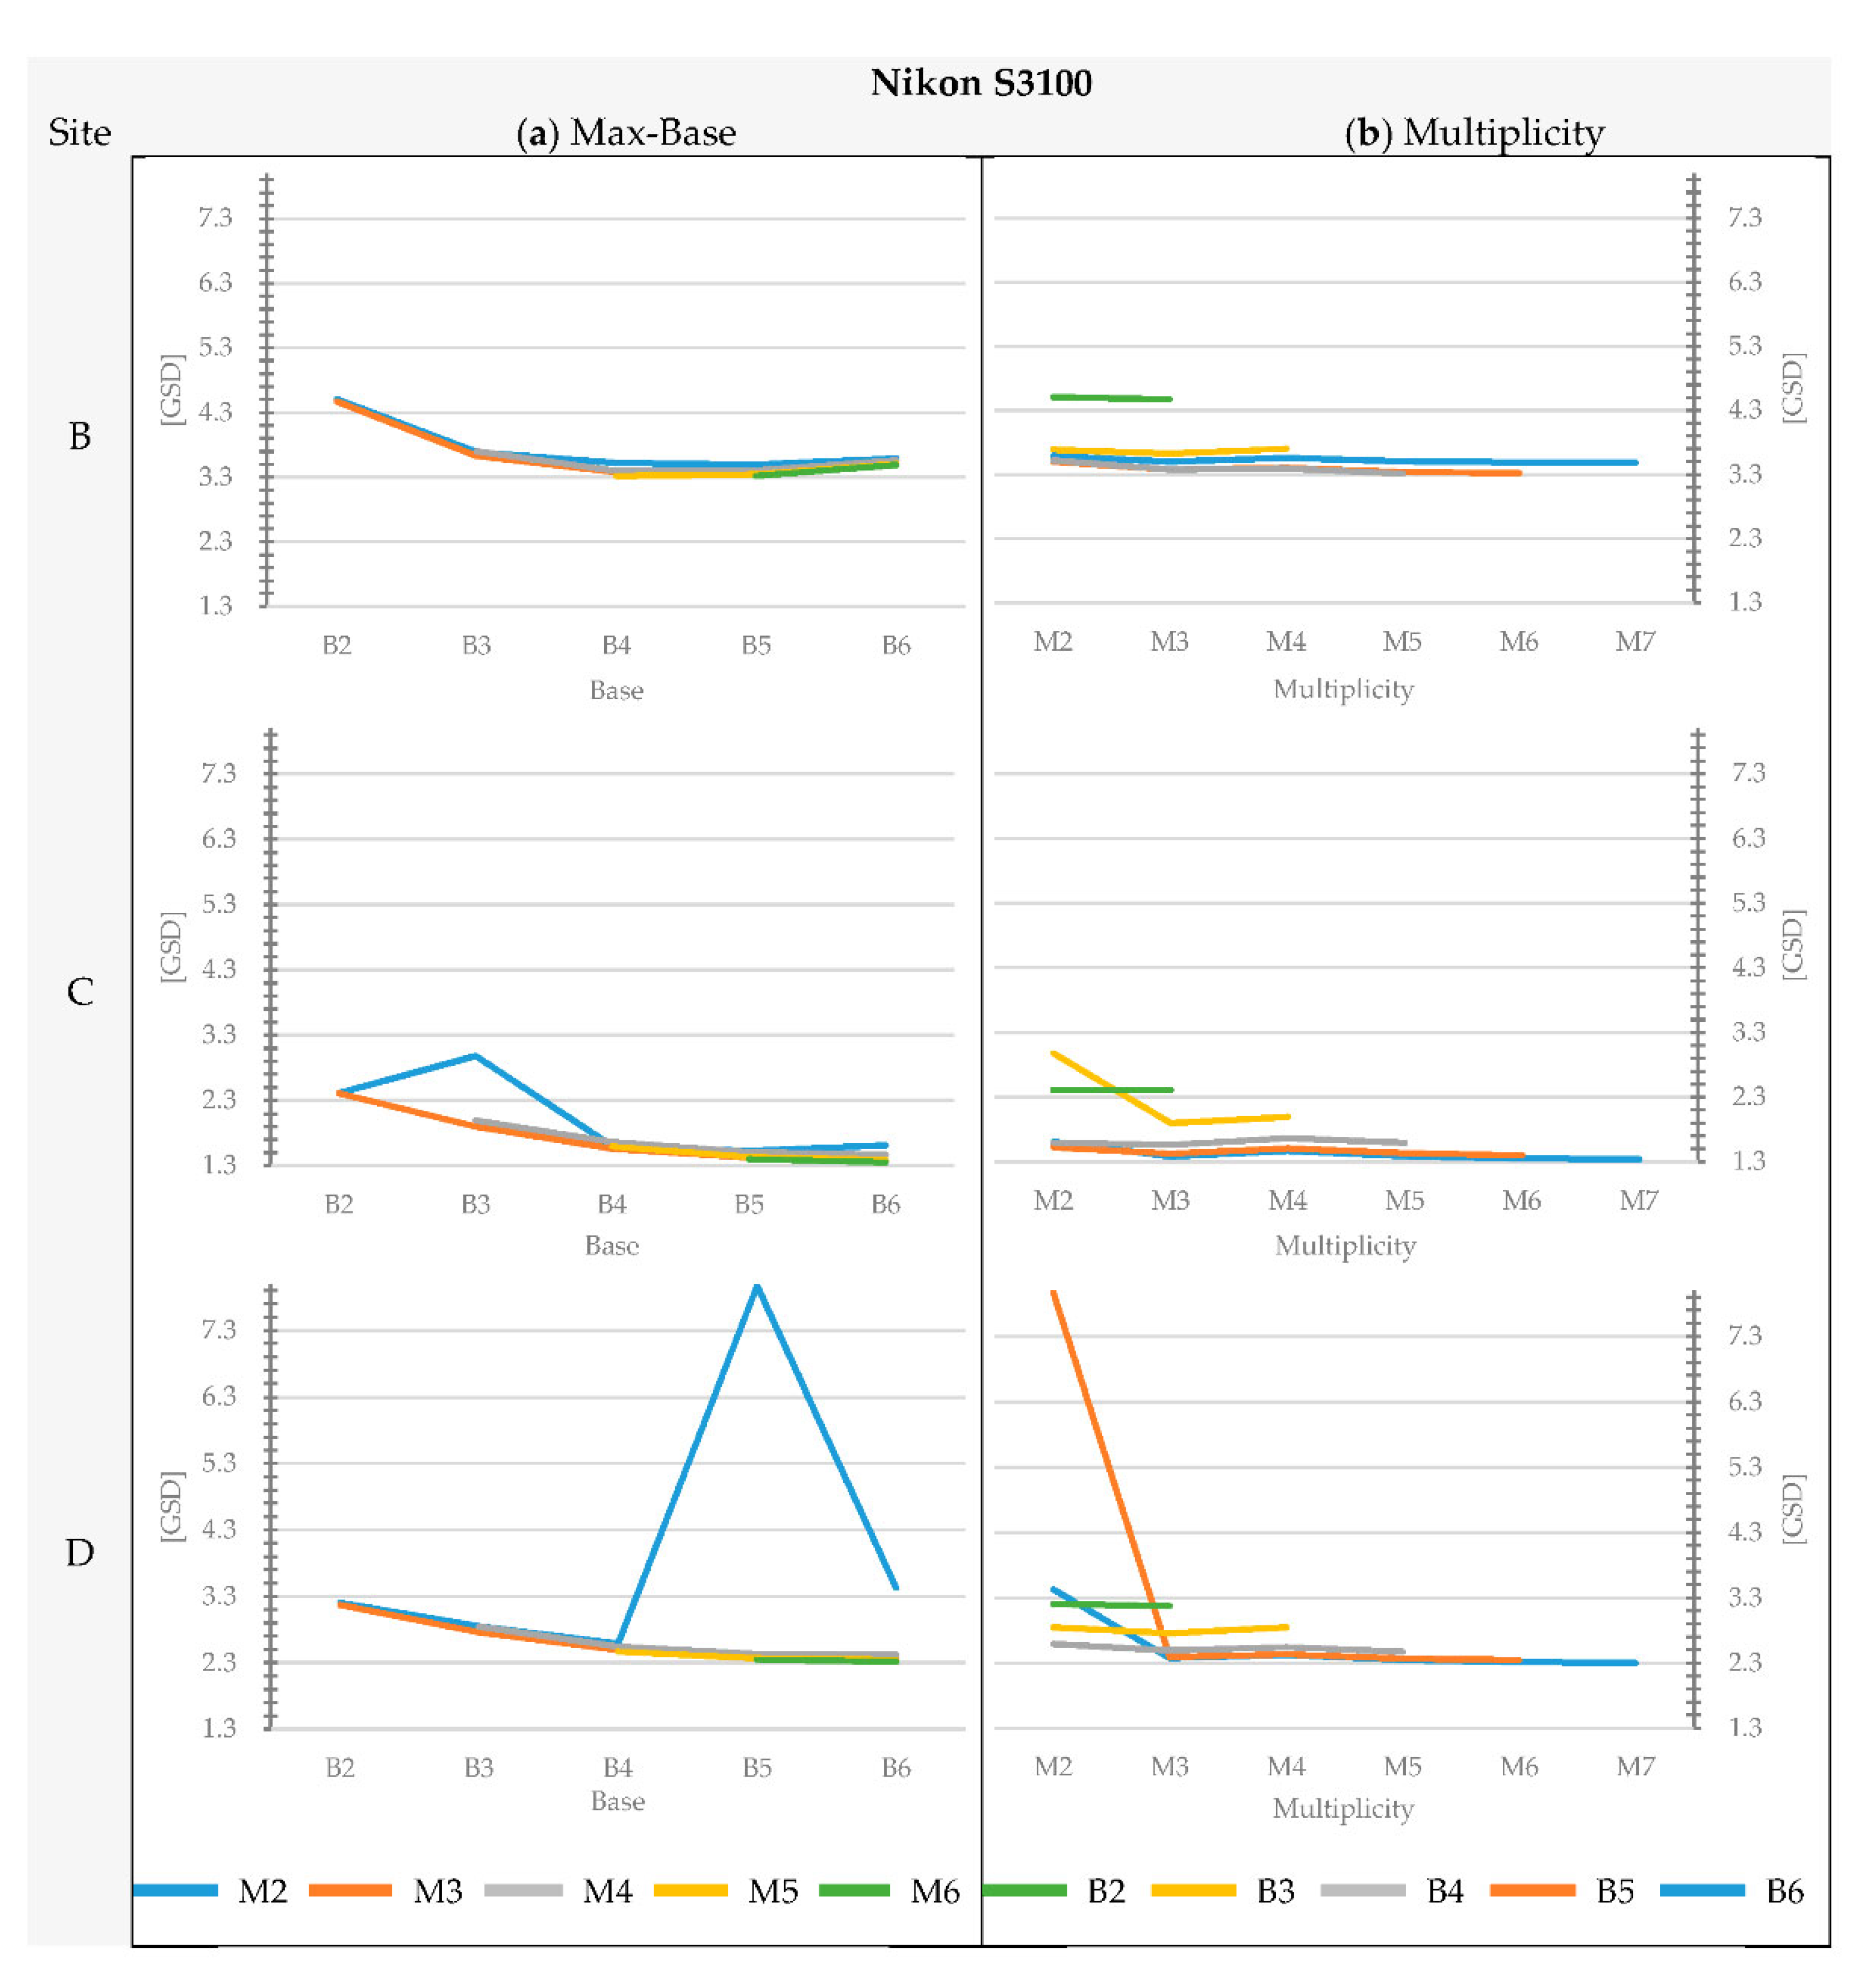

Table 1.
The table summarizes the number of image configurations provided by each pair of max-base and multiplicity values.
Table 1.
The table summarizes the number of image configurations provided by each pair of max-base and multiplicity values.
| Dense Matching and DSM Generation: 120 Different Configurations | |||||||
|---|---|---|---|---|---|---|---|
| Multiplicity (M) | |||||||
| - | - | - | - | - | 1 config. | M7 | |
| - | - | - | - | 2 config. | 5 config. | M6 | |
| - | - | - | 3 config. | 8 config. | 10 config. | M5 | |
| - | - | 4 config. | 9 config. | 12 config. | 10 config. | M4 | |
| - | 5 config. | 8 config. | 9 config. | 8 config. | 5 config. | M3 | |
| 6 config. | 5 config. | 4 config. | 3 config. | 2 config. | 1 config. | M2 | |
| Max-base (B) | B1 | B2 | B3 | B4 | B5 | B6 | |
| 120 configurations/dataset | |||||||
Table 2.
Technical specifications of the three tested camera systems.
| Camera | Resolution | Sensor Type | Sensor Size [mm × mm] | Pixel Size [µm] | Lens [mm] | Cost [€] |
|---|---|---|---|---|---|---|
| ELP-USB8MP02G (USB) | 8 MPixel (3264 × 2448) | CMOS SONY IMX179 | 4.54 × 3.42 | 1.4 | Zoom 2.8–12 (21–95) 1 | 50–55 |
| Nikon Coolpix S3100 (S3100) | 14 MPixel (4320 × 3240) | CCD | 6.17 × 4.56 | 1.42 | Zoom 4.45–22.3 (26–130) 1 | 40–80 (used) |
| Nikon D3 (D3) | 12.1 MPixel (4256 × 2832) | CMOS | 36 × 23.9 | 8.46 | Fixed 85 and 50 | 400–500 (used) |
1 35 mm equivalent focal length.
Table 3.
Characteristics of the camera network and average GSD of the acquired images.
| Site | Avg. b [m] | B_max [m] | Z [m] | GSD [mm] | |||
|---|---|---|---|---|---|---|---|
| D3 | S3100 | USB | Virtual | ||||
| A-A1 | 1.2 | 7.2 | 14.5 | 2.5 | 2.3 | - | 2.5 |
| B-B1 | 5.5 | 33 | 69 | 6.9 | 7.3 | 9.6 | 6.9 |
| C-C1 | 5.5 | 33 | 55 | 5.5 | 5.8 | 7.6 | 5.5 |
| D-D1 | 5.85 | 35 | 89 | 8.9 | 9.4 | 12.3 | 8.9 |
Table 4.
Average residuals in GSD and in mm (in parenthesis) on check points (CP) for Nikon D3, Nikon S3100 and USB.
Table 4.
Average residuals in GSD and in mm (in parenthesis) on check points (CP) for Nikon D3, Nikon S3100 and USB.
| Site | Nikon D3 | Nikon S3100 | USB |
|---|---|---|---|
| A | 1.35 (3.3) | 2.71 (6.3) | - |
| B | 2.63 (18.1) | 4.29 (31.2) | 2.74 (26.2) |
| C | 3.12 (17.1) | 2.17 (12.5) | 3.98 (30.4) |
| D | 1.92 (17.0) | 1.65 (15.4) | 2.14 (26.5) |
Publisher’s Note: MDPI stays neutral with regard to jurisdictional claims in published maps and institutional affiliations. |
© 2022 by the authors. Licensee MDPI, Basel, Switzerland. This article is an open access article distributed under the terms and conditions of the Creative Commons Attribution (CC BY) license (https://creativecommons.org/licenses/by/4.0/).
Share and Cite
MDPI and ACS Style
Bruno, N.; Roncella, R.; Diotri, F.; Thoeni, K.; Giacomini, A. Influence of Block Geometry Configuration on Multi-Image Dense Matching. Remote Sens. 2022, 14, 3784. https://doi.org/10.3390/rs14153784
AMA Style
Bruno N, Roncella R, Diotri F, Thoeni K, Giacomini A. Influence of Block Geometry Configuration on Multi-Image Dense Matching. Remote Sensing. 2022; 14(15):3784. https://doi.org/10.3390/rs14153784
Chicago/Turabian StyleBruno, Nazarena, Riccardo Roncella, Fabrizio Diotri, Klaus Thoeni, and Anna Giacomini. 2022. "Influence of Block Geometry Configuration on Multi-Image Dense Matching" Remote Sensing 14, no. 15: 3784. https://doi.org/10.3390/rs14153784
Note that from the first issue of 2016, this journal uses article numbers instead of page numbers. See further details here.