
Change Detection Techniques with Synthetic Aperture Radar Images: Experiments with Random Forests and Sentinel-1 Observations


1
School of Engineering, University of Basilicata, 85100 Potenza, Italy
2
Institute for Electromagnetic Sensing of the Environment (IREA), Italian National Research Council, 328, Diocleziano, 80124 Napoli, Italy
*
Author to whom correspondence should be addressed.
Remote Sens. 2022, 14(14), 3323; https://doi.org/10.3390/rs14143323
Submission received: 7 June 2022
/
Revised: 1 July 2022
/
Accepted: 5 July 2022
/
Published: 10 July 2022
(This article belongs to the Special Issue New Developments in Remote Sensing for the Environment)
Abstract
:This work aims to clarify the potential of incoherent and coherent change detection (CD) approaches for detecting and monitoring ground surface changes using sequences of synthetic aperture radar (SAR) images. Nowadays, the growing availability of remotely sensed data collected by the twin Sentinel-1A/B sensors of the European (EU) Copernicus constellation allows fast mapping of damage after a disastrous event using radar data. In this research, we address the role of SAR (amplitude) backscattered signal variations for CD analyses when a natural (e.g., a fire, a flash flood, etc.) or a human-induced (disastrous) event occurs. Then, we consider the additional pieces of information that can be recovered by comparing interferometric coherence maps related to couples of SAR images collected between a principal disastrous event date. This work is mainly concerned with investigating the capability of different coherent/incoherent change detection indices (CDIs) and their mutual interactions for the rapid mapping of “changed” areas. In this context, artificial intelligence (AI) algorithms have been demonstrated to be beneficial for handling the different information coming from coherent/incoherent CDIs in a unique corpus. Specifically, we used CDIs that synthetically describe ground surface changes associated with a disaster event (i.e., the pre-, cross-, and post-disaster phases), based on the generation of sigma nought and InSAR coherence maps. Then, we trained a random forest (RF) to produce CD maps and study the impact on the final binary decision (changed/unchanged) of the different layers representing the available synthetic CDIs. The proposed strategy was effective for quickly assessing damage using SAR data and can be applied in several contexts. Experiments were conducted to monitor wildfire’s effects in the 2021 summer season in Italy, considering two case studies in Sardinia and Sicily. Another experiment was also carried out on the coastal city of Houston, Texas, the US, which was affected by a large flood in 2017; thus, demonstrating the validity of the proposed integrated method for fast mapping of flooded zones using SAR data.
1. Introduction
One of the most critical applications of remote sensing (RS) technologies concerns detecting and monitoring changes occurring on Earth’s surface using multi-temporal, remotely-sensed images [1,2,3,4,5,6,7,8,9,10,11,12]. In this context, optical RS sensors have historically extensively been used for addressing change detection (CD) with a variety of heterogeneous applications, including the hazard assessment of large earthquakes [13,14,15], crop growth monitoring [16,17], analysis of vegetation and forest changes [18,19,20,21,22], urban changes and urban sprawl detection [23,24,25,26], and snow cover monitoring [27,28,29,30]. Essentially, change detection is a process that analyzes two or more images captured over the same geographical area at different times to identify those significant land cover changes that have occurred. A first distinction was made between supervised and unsupervised [31] CD methods, depending on whether any a priori knowledge about the imaged scenes is available. Such information is exploited for supervised methods to discriminate between the two opposite classes representing the changed and unchanged areas. Unlike optical sensors, microwave RS images acquired by synthetic aperture radar (SAR) have less been exploited for CD purposes. This circumstance can be explained by the fact that SAR images are corrupted by the presence of speckle noise [32,33,34]. Despite its complexity, SAR images in change detection [35,36,37,38,39,40,41,42,43,44,45] were attractive from the operational viewpoint since SAR sensors are active instruments operating in any atmospheric and sunlight conditions. This means that they can monitor geographical areas recurrently, even while covered by clouds and during periods when solar illumination is severely limited.
Unsupervised SAR CD methods usually consist of three steps [35]: (1) pre-processing; (2) pixel-by-pixel comparison; and (3) image thresholding and classification to identify changed areas.
During the first step, the modeling and removal of speckle-noise are performed. Many adaptive filters for speckle reduction have been proposed, e.g., the Frost [46,47], Lee [32,33], Kuan [48,49], and Gamma [50,51] filters. They essentially belong to the three classes of linear Minimum Mean Square Error (MMSE) [32,52,53], Bayesian Maximum a Posteriori (MAP) [54], or auto-regressive, e.g., the Frost Filter [46] estimators. Multi-temporal filters that consider the correlation of the SAR signal among image acquisitions over time have also been proposed [35,40,55,56]. They also include inter-channel characteristics in the used statistical models, such as the speckle independency and the time variations of radar reflectivity.
The second step, consisting of the pixel-by-pixel comparison between two SAR images, is usually carried out using a log-ratio operator (see, e.g., [35,39]), relying on the consideration that the texture is a zero-mean multiplicative signal [57]; accordingly, the log-ratio image detector is usually preferable to the image differencing, which is conventionally used working with optical data.
In the third step, the image difference is binarized through thresholding (e.g., [40,58,59,60]) and clustering (e.g., [61,62,63]). A decision threshold is selected with a manual trial-and-error procedure or an automatic selection technique on the image difference. Several unsupervised parametric approaches for identifying the optimal thresholds have been developed, see [35,40]. Among them, the Otsu [64], the Kittler and Illingworth (KI) minimum-error thresholding algorithm [65], and the expectation-maximization (EM) algorithms [66] have been proposed. Such parametric approaches’ efficiency depends on the overlapped changed/unchanged classes. In particular, the classification uncertainty is highest in portions of the images where the histograms significantly overlap. Graph-based methods have also recently been proposed in the literature showing good performances [67,68]. In the literature, non-parametric classification methods have been developed in various contexts. For instance, in ref. [69], the authors used Cumulative Distribution Analysis (CDA) that reveals flexibility enough and adapts well to different classification strategies. Regarding clustering methods, the fuzzy c-means (FCM) algorithm [70] is one of the most popular ones that is very sensitive to noise.
Another class of CD methods relies on applying the foundations of hypothesis testing and maximum likelihood theories. In this case, the likelihood ratio is computed to retrieve the difference image, in which the changed pixels correspond to significant signal variations. The difference image can be obtained using the generalized likelihood ratio test (GRLT) [71,72] using a fixed or an adaptively selected spatial window. Note that a large window is chosen in homogenous areas, whereas small window sizes are used to preserve the edge details in a heterogeneous region.
The interferometric SAR approach is an alternative to the exclusive use of the SAR backscattering signature. From the interferometric SAR side, multi-temporal coherence maps are the most profitable products that can be exploited for CD mapping. The coherence between pairs of SAR images can be used as an indicator of the phase stability of the imaged scene over time, and tracking its temporal variations allows correlating it to the physical characteristics of imaged scenes. The degree of coherence between the images has a potential application as a classification tool for different land surfaces.
Combining sequences of SAR backscattering and multi-temporal InSAR coherence maps is beneficial for tracking the modifications/disturbances of vegetation cover and can be exploited in several contexts. Within this framework, a significant application concerns the RS of vegetation cover and the effects of fire disturbances. This is typically done by exploiting mostly passive Earth observation methods conducted in the electromagnetic spectrum’s optical and thermal IR regions [73]. The optical wavelength region is generally used to map wildfire-burned areas soon after a fire event, often based on spectral reflectance changes compared to a pre-fire scene [74]. The IR is used to identify active fires while still burning and estimate their characteristics, such as the effective temperature and area of the burning region and its radiative power output that correlates to fuel consumption and smoke emission. Conversely, SAR measurements are used only relatively rarely, for example, to identify burns in near-continuously cloud-covered areas or where older burns have had long-lasting effects on canopy structural properties [75,76,77,78].
Over the recent decades, a new emerging research line relying on machine learning (ML) [31] approaches have gained a very central role in CD, as a result of their ability to outperform traditional methods [79,80]. The adoption of ML-based CD methods in RS is primarily driven by the availability of constellations of new advanced RS sensors, capable of collecting a wide range of data, allowing sensing information with unprecedented temporal/spatial accuracy and resolution. In this context, the availability of RS data has increased exponentially. With such an amount of data, it is difficult to apply and use traditional CD methodologies, which require, to be effective, a pre-processing step of the data related to the observed scene that is, in most of the cases, pursued with manual or semi-automated analyses. Specifically, the difficulties are primarily due to data and model complexity. The first is related to the fact that the data distribution becomes more complex and sparser by increasing volumes, so manually extrapolating a set of samples that can be effectively modeled and processed by traditional CD methods becomes cumbersome. The second is that traditional CD methods’ objective functions often depend on the starting values. Thus, it is straightforward for these methods to be data-dependent and get stuck in different local optima; thus, dramatically limiting generalization performance.
Conversely, there is an ongoing effort toward developing ML-based algorithms that, in contrast to traditional ones, have the intrinsic ability to automatically interpret data, learn and extrapolate information from such data [81], and use it to accomplish specific tasks (e.g., classification, regression, etc.) through flexible adaption, such as in [81] where the authors investigated the performance of a Support Vector Machine (SVM) classifier to learn and detect changes from X- and L- band SAR acquisitions. Their study demonstrated that a well-optimized ML algorithm could outperform traditional CD image thresholding, achieving excellent performance in a critical situation where only a small subset of training examples is available.
An unsupervised change detection method using convolutional neural networks (CNNs) was also proposed in [82].
The main objectives of our study are (i) to introduce and discuss the statistical properties, as well as the pros and cons, of some synthetic coherent/incoherent change detection indices that are capable of capturing complementary information on changed areas; (ii) to describe the abilities of ML methodologies in the change detection task, and (iii) to show the potential of the ensemble ML learning method based on random forest (RF) to predict binary CD maps of areas affected by disruptive phenomena, such as fires or floods.
An integrated, coherent/incoherent SAR CD approach aided by RF is presented and applied for the mapping of burned areas and flooded regions, considering two test sites in Sicily and Sardinia (Southern Italy), located in areas affected by severe fires for the 2021 summer season, as well as the test-site of the Houston (US) coastal city, which is prone to frequent inundations and was affected by one of these events in August 2017. The developed strategy can be applied in heterogeneous contexts, and RFs trained in several independent case-study areas are expected to improve the overall CD algorithm performance.
The rest of the paper is organized as follows. Section 2 summarizes the fundamentals of coherent and incoherent CD methods. Section 3 introduces some synthetic change detection indices (CDIs) used to feed an RF. The overall CD strategy is then detailed. Available SAR images and ancillary data are shown in Section 4. Experimental results are presented in Section 5. Discussion, conclusions, and future perspectives are finally presented in Section 6 and Section 7.
2. Fundamentals of Coherent and Incoherent Change Detection Methods
This section introduces the fundamentals of SAR change detection, distinguishing between incoherent and coherent approaches.
Let us consider two co-registered complex-valued SAR images and acquired at times and , respectively, and let be the pixel pair data vector extracted from SAR data values corresponding with a generic k-th pixel P of the imaged scene. The CD problem may generally be modeled as a binary classification [1], where each pixel is mapped into the set of possible labels related to the unchanged and changed classes. Such a problem can effectively be formulated in a hypothesis-testing framework. In this context, the goal is to determine whether the pixel pair is a realization of a null hypothesis (unchanged scene) or an alternative hypothesis (changed scene). Under these two hypotheses, we can write that [83]:
and:
where the term is the complex reflectivity at the given pixel P that is common to both SAR images under the hypothesis, and is the complex reflectivity of the second image under the assumption that a change happened. Note that and the phase term accounts for a possible displacement of the second flight track for the first image related to a height topography change. Finally, the terms and account for noise decorrelation sources affecting the two available SAR images. For homogeneous natural distributed target environments, the observed SAR scenes can be modeled as consisting of many discrete scatterers with a uniform random phase and identically-distributed random amplitudes [57]. The observed complex radar backscattered signal can then be modeled as a zero-mean complex circular Gaussian process with the following probability density function (pdf) [11]:
where is the covariance matrix of that, under the two hypotheses, is given by:
where , and . Note that stands for the statistical expectation extraction operation that, under the hypothesis that the signals are ergodic, can effectively be implemented with the spatial averaging procedure performed over a set of neighbor SAR pixels (i.e., with a multi-looking process [84]). The term can also be expressed as a function of the complex correlation coefficient between the two interfering SAR images [85], as follows:
The amplitude of the complex correlation coefficient is commonly referred to as coherence, and it assumes values between 0 and 1. Coherence is usually factorized into the product of several different contributions [84,86,87,88]:
Interested readers can refer to [86,88] to have a more detailed description of the different decorrelation sources.
Assuming perfect knowledge of the unknown parameters that are present in the covariance matrices of Equations (4) and (5), a formal way to solve a CD problem is to compute the log-likelihood ratio:
considering a population made by N SAR pixels located neighboring a selected SAR pixel. After some mathematical manipulations and considering that the complex radar backscattered signal has the pdf of Equation (3), the decision variable can then be re-written as:
which is referred to in the literature as the clairvoyant detector. Note that the operator is the trace of a matrix. This detector gives the optimal detection performance given the perfect knowledge of the unknown parameters in the covariance matrices and . The expressions for the probability of detection and false alarm for the log-likelihood clairvoyant detector have also been derived in [85] as a function of a decision threshold. Nonetheless, the values of the covariance matrices are generally unknown, and thus, in practice, sub-optimal tests are implemented where the unknown parameters are measured directly through the data with their maximum likelihood estimates (MLEs) to form a generalized likelihood test (e.g., see [71]).
Due to the complexity of these optimal tests and the need to estimate the mentioned model parameters, several approximate unsupervised/supervised CD approaches have been proposed in the literature (among others, see [14,45,89,90,91,92,93,94]). Overall, they can be distinguished in the two general categories of the methods based exclusively on the analysis of the amplitude of SAR backscattered returns (incoherent approaches) and those that also consider the phase of the radar backscattered signals (coherent strategies).
The following sub-sections provide the readers with additional details on these two categories of CD methods.
2.1. Incoherent CD Approaches
Despite their intrinsic differences, the incoherent CD methods can be seen as made by three main steps: (1) pre-processing of the SAR images; (2) comparison of the pair of SAR images; and (3) automatic extraction of the changed areas by proper thresholding algorithms.
The first step consists of the radiometric calibration of the available SAR images [57,95] and the subsequent application of adaptive filters that reduce the impact of speckle noise in the SAR images. Among others, the most used de-noised filters are Lee [32], Kuan [48], and Frost [46]. Jointly, a spatial multi-look operation [96] is typically applied to enhance the SNR and reduce the images’ spatial resolution as a side effect. The consequences of local topography can also be corrected [97], and the SAR images could then potentially be georeferenced for subsequent analyses.
The second step consists of comparing the two pre-processed SAR images. To this aim, we observe that signature variations in SAR images are due to texture and speckle, where texture is a measure of the intrinsic spatial variability of the backscattered coefficient (in the absence of noise), and the speckle is a multiplicative term. Mathematically, the received power can be written as [44,57]:
where is the backscattered power, and and are the texture and speckle noise random terms, respectively. When dealing with SAR images, the ratio operator is preferred to the image difference. Indeed, the ratio image pdf is given by [36]:
where is the true (unknown) value of the images’ ratio. Accordingly, the first-order statistics depend only on the relative change and not on the single average values, separately. Moreover, the mean amplitude values ratio is more robust to calibration errors, typically represented by multiplicative terms that moderately vary from one image to another and then they are almost cancelled out in the image ratio. Furthermore, the ratio is reported on a log scale to represent significantly high and shallow intensity values. Accordingly, the detection image is obtained as:
The third step consists of analyzing the log-ratio image and identifying a proper threshold that allows discriminating between the two changed and unchanged classes. This problem can be solved in the context of Bayesian decisions. A general algorithm for the threshold decision was proposed by Kittler and Illingworth (KI), which derives the best threshold from being used through a parametric estimation based on the assumption that the two classes are Gaussian distributed [65]. Some extensions of the KI method that assume a more reliable distribution of the two classes (e.g., a generalized Gaussian distribution) have also been proposed [35].
2.2. Coherent CD Approaches
Coherent change detection methods rely on using the interferometric cross-correlation factor (see Equation (7)). The statistics of the sample coherence have extensively been addressed in the literature [88,98]. In particular, the pdf of the sample coherence , given the true coherence value , is given by [84,98]:
where N is the effective number of looks (ENL) and is the Gauss hypergeometric function. It is worth mentioning that the coherence is a biased estimator: this means that the measured sample coherence obtained by computing the expectation values using spatial averaging operations has an average value different from the actual coherence value . In particular, the first moment of the spatial coherence is given by [98]:
and, consequently, the coherence bias is . An approximate expression for the coherence bias, which could be considered to “calibrate” the coherence estimates for CD purposes, can straightforwardly be obtained in the complex domain by observing that the interferometric phase can be encoded in this domain as a point in a unitary circle. The mean resultant length of the circular data representing the interferometric phases into the N-points averaging multi-look window is obtained as:
As demonstrated in ref. [99,100], the computed mean resultant length is an alternative measure of the coherence with , and the two coherence factors, both biased, are related to one another as:
The mean value of the mean resultant length of the circular data vector representing the phase of the scatterers within the multi-looking spatial window, under the suitable assumption that the latter is distributed with a Von-Mises probability density function [100] of concentration parameter , can be calculated as follows [101]:
where and on the right-hand side of Equation (17) is the big-O Landau symbol. Hence, taking into account these mathematical relations, an approximate estimate of the bias for the mean resultant length is:
Equation (18) can straightforwardly be interpreted and shows that, as expected, the coherence bias reduces as the number of looks increases and the bias is more significant in low-coherence regions. Accordingly, to estimate the unbiased value of the coherence, the correction factor in Equation (18) might eventually be applied.
Using interferometric coherence values, changed and unchanged regions can be discriminated against one another by thresholding them. Specifically, using Equation (16), for a given detection threshold , the probabilities of correct detection of a changed pixel and the probability of false alarm were derived in [85]:
To improve the detection performance, the sample coherence can also be further averaged over a window and/or other alternative adaptations of the detector can be used, such as the ordered statistic coherence detector and the censored mean level detector [102]. It is worth noting that the coherence detector is sensitive not only to abrupt changes due to a disaster event (such as a fire, a flood, the effects of extreme weather conditions or man-made disturbances), which are the goals of change detection techniques, but also to other temporal decorrelation effects that are not directly related to the main event under investigation. Thus, ambiguities in change detection remain where the temporal decorrelation caused by the background environment is dominant to those components strictly related to the natural/human-induced events. For instance, this happens over vegetated areas, likely affected by wind or seasonal changes. When decorrelation caused by a specific event is coupled with temporal decorrelation from wind or rain, isolating the two different decorrelation sources becomes challenging. Tracking coherence differences between couples of SAR images has been exploited to study various phenomena (e.g., [103,104,105,106]). Some investigations address the problem of developing proper temporal decorrelation models that can be adopted to discriminate the background changes due to temporal decorrelation from those ascribed to the primary disastrous event. To overcome some limitations in low coherence regions, the work [107] proposed an alternative maximum likelihood coherence change detector that lowers the false alarm probability in low coherent areas considering the clutter-to-noise power ratio of the SAR images. Specifically, the new estimator is expressed as follows:
where and are the mean noise power values of the two interfering SAR images. Over recent years, new methods have also emerged that consider both amplitude and phase information for the unsupervised extraction of surface changes from a sequence of co-registered SAR images, by extending the analyses from two single SAR images to a set of multi-temporal SAR images, e.g., see [39,92,108]. Specifically, the abrupt changes in the radar returns in a time series of SAR data can be detected using a maximum-likelihood approach by assuming that the transition times (TTs) are single or multiple. TTs can vary from one region to another, especially for long time-series of data. In this context, as a further extension of GRLT to multi-pass SAR images, the work [92] proposed a method to detect changes in sequences of dual-pol Sentinel-1 multi-pass SAR data by considering both point targets and distributed targets on the terrain. The automatic identification of the transition times is also a problematic task to achieve. Nowadays, the level of maturity of such methodologies is high; however, their use in the context of rapid mapping just after and/or between a disastrous event is still challenging and poses the base for subsequent developments, where the help of artificial intelligence (AI) frameworks can be beneficial for the identification and quantification of damaged regions.
2.3. Introduction to AI-Aided Change Detection Methods
Another emerging class of CD methods can overcome the limitations of traditional CD methods while working with a short-term sequence of multi-pass SAR data. It is represented by the methods based on AI. Machine Learning (ML) methods are increasingly applied to study and analyze data because of their ability to find relationships between target and input variables, such as those arising in satellite remote sensing of geophysical parameters. Over the last 20 years, the launch of a new constellation of RS satellites enabled the observation of the Earth system with an improved time–space granularity. Thus, unprecedented large amounts of data have been produced [109,110].
In this context, the RS community started the development of new advanced methodologies through the adoption of ML-based frameworks. Two factors drove the adoption of those frameworks:
- The development of methodologies capable of ingesting and analyzing a large amount of data automated and extrapolating useful new information [110].
Different unsupervised and supervised [31] ML methodologies have been explored in the RS CD task context.
Among supervised methodologies of relevant importance is the application of Support Vector Machine (SVM) [38,114,115,116], models based on Neural-Network (NN) [117,118,119], ensemble models such as Breiman RF [120,121,122] and derivatives (e.g., XGBoost [123] and AdaBoost [124]). For unsupervised methodologies, kernel and fuzzy clustering-based strategies are the most commonly used [125,126,127].
Finally, in recent years, the combinations of unsupervised and supervised ML methodologies, namely called semi-supervised, have been proposed [126,128,129,130,131]. The scope of these methods is to integrate the merit of both unsupervised and supervised methods to extrapolate information from RS data and construct new helpful knowledge. Semi-supervised methodologies are particularly useful in CD scenarios where it is very challenging to collect information for labeling the class to be predicted.
3. Proposed Multi-Temporal SAR Change Detection Strategy
Rapid damage assessment mapping and analysis after a disastrous event exploiting SAR data stacks can efficiently be carried out using CD methods, profiting from the availability of short sequences of SAR images, encompassing the selected primary disastrous event under investigation, and regularly collected before, between, and after the event itself. SAR technology’s current and future trend is to operate in a synergic way with data collected by constellations of SAR sensors that are jointly in orbit and capable of collecting data in different portions of the electromagnetic spectrum and with short revisiting times (weekly basis or less). A significant step forward in this direction has been represented by the sending into orbit, starting from 3 April 2014, of the twin sensors Sentinel-1A/B of the ESA Copernicus Constellation [133], which have long been mapping Earth’s surface regularly every six days (in the most favorable case), permitting extensive analyses on the state of Earth’ surface and the environment. Collected SAR data are freely available and have been fostering the development of new studies and processing methods for rapidly estimating changed areas. This section proposes and describes a joint multi-pass coherent/incoherent CD strategy that allows analyzing a short-term sequence of calibrated SLC images and fast computing damaged areas using incoherent/coherent change detection indices (CDIs). These indices are then cooperatively used to automatically extract changed areas using a random forest (RF) classifier.
First, in Section 3.1, we describe the set of synthetic incoherent/coherent indices used in our work. Subsequently, in Section 3.2, we shortly introduce the fundamentals of RF, which employ the values of the selected CDIs as inputs for binary classification (unchanged/changed). Finally, Section 3.3 details the steps of the proposed multi-pass CD strategy.
3.1. Coherent Change Detection Indices
When dealing with SAR multi-pass CD in the occurrence of a disastrous event that occurred at a known time, namely , the easiest way to obtain a reliable change map is to use one single pair of SAR images collected at times and in such a way to encompass the principal disastrous event, i.e., , with one single image before the event and one single image after the event. Incoherent CD methods estimate and subsequently threshold the log-ratio image map (see Equation (12)).
However, the information on the changes that occurred, ascribed to the disastrous event (e.g., a fire, an inundation, etc.), is also enclosed in all SAR data pairs that encompass the main event, i.e., more than one pre/post-SAR image can jointly be used to circumvent better the effects of noise and other disturbances in SAR images, which could lead to inaccurate decisions while using one single SAR data pair. This is especially true when coherent CD methods are exploited. Indeed, the coherence (see Equation (6)) measures the similarity between two SAR images. Thus, necessarily tracking of coherence changes requires the availability of at least three SAR images: two images are collected before the event at times and and used to estimate the (background) coherence of the scene just before the event occurred, and one SAR image is collected just after the occurrence of the event at the time , to compute the coherence change between the event, namely , see Figure 1. In this way, common coherence variations due to other causes unrelated to the main natural or man-made disastrous event can be isolated. In particular, the coherence ratio (CR) or the normalized coherence difference ratio (ND) of the pre- and post-coherence images can be calculated. The coherence ratio has long been explored for building damage assessment [134,135,136]; it is defined as follows:
Considering the three-pass configuration of Figure 1, the pre- and co-event coherence maps are and , respectively. Inherited from studies of the building damage assessment, it is also the normalized coherence ratio, which is defined as follows:
It is worth remarking that both the used change detection indices (CDIs) of Equations (22) and (23) depend exclusively on three SAR images; however, one image is common for the coherence estimation. If the values of the selected CDIs are associated with the common reference image, a time-series of these indices could also be generated and employed for unsupervised CD analyses, automatically tracking, for instance, the correct transition times where significant changes occurred on the imaged scene.
3.2. Temporal Decorrelation Models: Implications for Change Detection
In the previous Section 3.1., we presented two simple, coherent change indices based on the ratio and the normalized difference of a pair of coherence maps formed from a triplet of SAR images collected before and between a disastrous event. In this sub-section, we want to discuss the benefits of these two CDIs, considering the interferometric coherence properties and especially the contributions due to volumetric and temporal changes. Equation (7) shows that coherence depends on several factors. With constellations of SAR sensors characterized by a narrow orbital tube, such as the Sentinel-1A/B Copernicus constellation, the geometric decorrelation is somewhat limited and, in any case, it can be estimated and compensated for [86,88] when the topography of the area is known with sufficient details. For our analyses, the most important contributions of the coherence are the temporal and volumetric components. To address these signals, we exploit in this work the temporal coherence model proposed in [137] that incorporates the effects of temporally correlated changes and those that randomly occur (i.e., temporally uncorrelated) in the case of disastrous events, which are due to differences in the arrangement and dielectric properties of the scatterers on the ground.
The work [137] shows that temporal decorrelation for zero-spatial baseline and long-temporal baseline can be expressed as follows:
where is the interferometric temporal baseline, and are the unique characteristic time constants for the ground and volume contributions, and are the temporally uncorrelated (random) complex cross-correlation changes for volume and ground layers, is the ground-to-volume scattering ratio and represents the polarimetric scattering mechanism. Using Equation (24), we can express the ratio coherence of Equation (21) as follows:
For a narrow sensors’ orbital tube (e.g., for Sentinel-1A/B SAR sensors) the variations of the geometric decorrelation effects into the two coherence maps are reduced by the coherence ratio, which is only sensitive to perpendicular baseline double difference (i.e., the difference between the perpendicular baseline of the considered InSAR data pair), and the thermal noise components almost cancel out. Assuming limited mis-registration errors and almost aligned Doppler spectra between the three involved SAR images, the most prominent contributions that persist in the coherence ratio operator are the volumetric and the temporal decorrelation effects. Considering Equation (25), the most relevant contributions are thus:
where represents the residual terms accounting for the other decorrelation artefacts that do not perfectly cancel out by the coherence ratio. When the ground contributions are prevalent, and we assume the availability of a set of SAR data acquired regularly, we can generate the pre- and co-event interferometric data pairs with the same temporal baseline, i.e., . In this case, Equation (26) particularizes as:
Similarly, if the prevalent contribution to the coherence is the volumetric component, we have:
Accordingly, the coherence ratio results more sensitive than the single coherence measurement to time-uncorrelated (random) coherent components that are beneficial for coherent change detection purposes.
Let us now focus on the normalized coherence ratio estimator. Equation (24) shows that the coherence model’s ground and volumetric components are two additive terms. Accordingly, the coherence difference in a somewhat homogenous region can better discriminate the two separate ground and volumetric contributions separately. For small values of the topographic phase , i.e., for flat terrains, and considering that the prevalent contributions to the coherence are the volumetric and temporal decorrelation terms, we respectively have:
Equations (27)–(30) clarify that, depending on the physical phenomena under investigation, the volumetric or the ground decorrelation terms can become predominant and be emphasized by the coherence ratio and the normalized coherence difference estimators. For example, if a fire happens in a forest, we can assume that most of the changes are associated with the canopy volume consumed by the fire. In contrast, the ground is less disturbed, especially for low to mid-fire severities.
The analyses proposed in this sub-section demonstrate that the coherence ratio is preferable to the single co-event coherence map because it is more sensitive to the random time-uncorrelated changes. Moreover, in somewhat homogenous regions, when the primary event under investigation does not drastically change the structural properties of the imaged scene, the normalized coherence difference can be superior because it allows isolating the predominant time-uncorrelated coherence changes. In-depth analyses are still required to calculate the pdfs of these two operators to statistically determine the probability of false alarm and the detection probability of such two synthetic coherence detection indices. This is a matter for future research.
3.3. Extension to the Multi-Pass Case
Let us now extend our analysis to the case when SLC SAR images are available before the primary event, collected at times , and additional SLC SAR images are available after the primary event, collected at times , with .
Information on occurred changes related to the main event that happened at the time can be extracted by singularly analyzing all SAR image pairs between the primary event, see Figure 2. In particular, given the SAR data pair with , the log-ratio image can be computed. In general, with SAR images, different SAR data pairs satisfy the condition . As imaged by the satellite sensors, the effects on the ground related to the primary event can be detected and extracted from every single log-ratio image . Accordingly, we could generally have different looks for the same scene. The time average of these different looks allows one to obtain a temporal multi-look log-ratio image which is less affected by noise. Mathematically, multi-look log-ratio image map is obtained as follows:
where the summation is performed pixel-by-pixel. Note that random changes and systematic subtle multiple changes can happen in the whole time interval; accordingly, the temporal multi-look log-ratio image will tend to filter out the small random amplitude fluctuations that are present in the single maps and emphasize the major systematic contributions due to the primary event. On the other hand, if the selected time window is too large and the scene rapidly comes back to original pre-event conditions (and/or in a new state after that has a reduced memory of the disastrous event), the temporal multi-look LR image will be sensitive to changes different from those we want to extract. For this reason, the proposed methodology is adequate for short-term time-series of data, with a maximum time span (temporal baseline) of one/two months (or less) between the main event, and it looks appropriate for fast damage assessment.
If dual-pol SAR data are available, the incoherent temporal multi-looking of Equation (31) can be computed for the two polarizations, separately. In addition, with dual-pol VV/VH Sentinel-1 SAR data, the sum and difference of incoherent temporal multi-looking log-ratio images can be computed and used as two separate, dependent synthetic incoherent CDIs; see the experimental results presented in Section 5.
The joint exploitation of coherent and incoherent information in a unique framework is attractive. In a multi-pass scenario with SAR images, some interferometric data pairs with the same temporal baseline before the event and co-event can be selected. The relevant coherence ratio and normalized coherence difference ratio images can be computed. Using interferometric SAR data pairs with the same temporal baseline partially compensates for the effects of temporal decorrelation not related to the primary event. Indeed, coherence decorrelation is at the first order the same in pre- and in-between-event coherence maps.
Nonetheless, as the temporal baseline increases, the single coherence maps will be more decorrelated, and the performance of the coherence detectors diminishes. For this reason, the coherence analyses should be retained to shorter time windows. This statement is supported by the experimental results shown in Section 5, demonstrating that the relative weight/importance of longer baseline coherence in the binary decision between changed/unchanged regions drastically reduces as the interferometric SAR temporal baseline increases. The developed method relies on the computation and subsequent utilization of the following two sets of coherence ratio and normalized coherence differences:
Note that the families of used CDIs are composed of elements, representing the number of pairs of InSAR data pairs between the primary event that can be formed from the available SAR scenes.
3.4. Random Decision Forest: Basic Rationale and Application to Change Detection Analyses
This section introduces Breiman’s random forest (RF), an ensemble learning method [120] widely used for classification and regression tasks, and shows how the change detection indices presented above can jointly derive surface change maps.
In the context of ML methods, Breiman’s random forest (RF) is an ensemble learning method [120] widely used for classification and regression tasks. These ensemble algorithms often address non-linear and dimensional problems. Specifically, differently to Maximum Likelihood Classification (MLC) classifiers that assume a normal data distribution, the RF method is based on the Classification and Regression Tree (CART) algorithm [120,138] that does not make any assumptions regarding the frequency distribution of data. To this aim, the RF method is very suitable for inferring information of input data from remotely sensed acquisitions, which have multi-modal distribution and very rarely the normal one. In Breiman’s RF, the joint use of randomness in CART and bagging techniques is the key that allows this model to perform better than many other classifiers [139].
Specifically, given a training dataset representing the set of inputs and the corresponding outputs where is the size of training data and the number of features, the RF learning is pursued by applying the CART algorithm on several training subsets , produced by random sampling , either with or without replacement.
In this framework, each decision tree is grown by the CART algorithm that works by recursively splitting the subsets of , randomly sampling input features , and choosing from among those as split nodes the ones that better optimize a specific impurity function (e.g., Gini or Entropy). The recursive subdivision process stops once the maximum depth is reached, or no further subdivisions can be performed. Within the decision tree structure, subsets which are not split are called leaf nodes. A class label designates each leaf node. There may be two or more leaf nodes with the same class label. Figure 3 shows a decision tree structure for a binary classification problem.
This process allows the construction of L decision tree classifiers by maximizing their strength and jointly minimizing their correlation [120,140], forming a bagged predictor able to map . Finally, RF prediction is computed as majority votes overall tree predictions (see Figure 4).
RF models further produce additional information about the analyzed data: (i) the feature importance [141] used to perform the classification or regression task and (ii) the internal structure of the data in terms of similarity of different data samples to one another. The RF model determines the former during its training (tree by tree as the RF structure is formed), estimating each feature’s error rate variability when permuted while all others remain unchanged. The latter is determined in terms of proximity matrix where the element represents the fraction of trees in which the samples , fall in the same leaf node. The higher the proximity measure, the more similar the pair of samples.
As with many other ML methods also, RF uses different hyperparameters. Nowadays, hyperparameter optimization is one of the most important tasks to perform. In the recent literature [36,37,38,39,40], hyperparameter optimizations have extensively been addressed, demonstrating that the correct tuning of ML model hyperparameters is mandatory to obtain high generalization performance. Specifically, RF models depend mainly on three hyperparameters: (i) the number of decision trees () that compose the model, (ii) the number of features () that will be considered in the CART splitting procedure, and (iii) the tree depth . Only the first hyperparameter has a robust analytical demonstration [142,143,144,145,146] of its impact on forest generalization performance. For the other two, there is no theory to guide the best choice; they are strictly dependent on the problem to solve, and the related dataset of measurements [144] and this aim has to be tuned appropriately.
3.5. Proposed RF-Aided CD Strategy
In this section, we describe the proposed RF CD framework. As illustrated in Figure 5, the proposed framework consists of three modules.
- ➢
- Starting from a sequence of calibrated, co-registered, and geocoded SAR acquisitions, the first module consists of pre-processing data and calculating the incoherent and coherent change detection indices.
- ➢
- In this work, we treated change detection as a pixel-based binary classification task that uses 1 and 0 to indicate changed and unchanged pixels. Therefore, we used an RF model combining CDIs and a reference change mask in the second module to perform supervised learning.
- ➢
- The final module applies a spatial average with a moving window to the RF predicted binary change mask. Eventually, the binary change mask is retrieved.
4. Material
We processed three SAR datasets consisting of 15, 13, and 12 SAR images collected in the Single-Look-Complex (SLC) format and Terrain Observation with Progressive Scans SAR (TOPSAR), Interferometric Wide (IW) mode by the Sentinel-1A/B sensors over the areas of interest (AOIs) of the central-western sector of Sardinia Island, the central-western area of Sicilia Island regions in Italy, as well as the Southern-Eastern sector of Texas coastal area, the US.
Table 1 shows the list of used SAR data. The AOIs include:
- i.
- The Montiferru region in Sardinia (see Figure 6A). The territory is mainly characterized by a mountain chain and some valleys located in its inner parts, particularly in the municipalities of Santu Lussurgiu, Cuglieri, and Scano Montiferro. The terrain elevation of the investigated area ranges from the sea level to the highest point of Monte Urtigu, about 1050 m a.s.l., located in the municipality of Santu Lussurgiu. The site is historically characterized by the Mediterranean climate, presenting dry summers, cold and wet winters, and intermediate conditions in spring and autumn. In recent decades, due to global warming, the region has also been facing alterations drastically in precipitation regimes, with the most considerable precipitation runoff decrease [147].
- ii.
- The Sicilian Apennines, specifically the area of the “Madonie” (see Figure 6B). Within this area is situated the Parco delle Madonie, which is the second nature reserve in Sicily. Its 35,000 hectares are home to towering mountains (at 1979 m, the highest peak is Pizzo Carbonara), large expanses of woodland, and a flourishing variety of flora and fauna. In terms of flora, there are over 2600 different species of plants, many of which are endemic to the area. Specifically, at an altitude of 1500 m, the land is entirely covered by the Madonie Forest. Below, on the hillsides, the area is mainly characterized by crops, including the cultivation of wheat, olives, and fruits. The area incorporates several historic towns and villages such as Polizzi Generosa, Petralia Soprana and Sottana, Gangi and Castelbuono.
- iii.
- The Houston metropolitan area (see Figure 6C) is the fifth-most populous urban area in the USA. The region contains the city of Houston (the most significant economic and cultural center of the South). Its port (the second largest port in the United States and the 16th largest globally) leads the US international trade. The metropolitan area is in the Mexico Gulf Coastal Plains. Much of the urbanized area was built on forested land, marshes, and prairie.
Concerning the Italian sites, the characterizing phenomena are wildfires. Wildfires have affected the Italian areas between July and August of 2021. In the Sardinia area, on 23 July 2021, at around 5.30 pm CET, a wildfire started in the Montiferru region, specifically on the road that connects Bonarcado and Santu Lussurgiu. In the first phase of its propagation, the wildfire affected an area mainly covered by herbaceous vegetation and wooded pastures. Then, on 24 July, the fire quickly got out of control due to the region’s complex topography, extreme weather conditions (temperature close to 40 °C), low relative humidity, and strong winds from S-SE. The wildfire spread towards N-NW, favored by the increasing slopes and higher amounts of fuel load and started burning the forest areas of Santu Lussurgiu. The wildfire spreading caused huge damage, devastating an area of about 20,000 ha. In Sicily, the wildfire started simultaneously between 6 and 12 August of 2021. In Sicily, due to criminal acts on the night of 6 August in the territory of Gangi, in the Madonie Mountains, several wildfires started. The wildfires surrounded first the Gangi village and later spread out over two directions: one towards San Mauro Castelverde village and one towards Collesano, Lascari, and Geraci Siculo villages. The wildfire spread, devastating an area of about 2000 ha, damaging villages, houses, animals, and farms drastically and changing the whole Madonie ecosystem irreversibly.
Concerning the US area, on the morning (11:00 p.m. ET) of 25 August 2017, Category 4 Hurricane Harvey made landfall along the Texas coast near Port Aransas and brought a devastating impact. The hurricane had a diameter of about 280 miles and generated winds of 130 mph during its landfall. The intense phenomenon busted all the US records for rainfall from a single storm, with a maximum of 60.5 inches of rain in some parts of Texas. Counting only coastal areas, Beaumont, Port Arthur, and Galveston received about 26 inches of rain in 24 h. This rainfall caused catastrophic drainage issues and made rivers rise considerably. Flooding forced 39,000 people out of their homes and into shelters. Only around 10% of the forecast river points in southeast Texas remained below flood stage due to the event, and approximately 46% of the river forecast points reached new record levels. Harvey had a considerable economic impact, causing about USD 130 billion in damage, moving Harvey to be ranked as the second-costliest hurricane to hit the US mainland since 1900.
Fire and flooding perimeters were derived using the Copernicus Emergency Management Service (EMS), which provides geospatial information within hours or days after the catastrophic phenomenon with its Rapid Mapping component. Specifically, the Rapid Damage Assessment (RDA) module of the European Forest Fire Information System (EFFIS) has been used for wildfire events. By analyzing near real-time MODIS daily images at 250 m spatial resolution, the RDA provides the daily update of the perimeters of the burn areas in Europe. The process involves delineating the extent of wildfire events based on the semi-automatic classification of MODIS satellite imagery using ancillary spatial datasets such as CORINE Land Cover, the active-fire detection products from MODIS and VIIRS. The Global Flood Awareness (GloFAS) system has been used for flood events. GloFAS provides a floods map using flood-mapping algorithms developed by the Global Flood Mapping (GFM) consortium (https://wiki.c-scale.eu/GFM/PUM/ConsortiumMembers, accessed on 1 June 2022). Specifically, three individual flood-mapping algorithms operate in parallel, analyzing historical time-series of Sentinel-1 SAR intensity data [148,149,150,151]. Topography-derived indices are used to refine the classification of water bodies. Once each algorithm generates its own “observed flood extent” map, an ensemble-based approach is used to combine the maps into a single “consensus map” in which a pixel is accepted as “flooded” when at least most of the classification algorithms that compose the ensemble classify it accordingly.
5. Experimental Results
Temporal multi-looked (amplitude) maps and Coherence Changes Indexes (CCDIs) extracted from the available SAR images were used to detect changes due to the wildfire and flooding events characterizing the selected AOIs. The SAR images were preliminarily radiometrically calibrated [152] to extract from the digital data the maps of the radar backscatter, i.e., the sigma naught maps [153]. We assumed the 24 July 2021 date as that related to the primary fire event. We selected a time series of acquisitions with a temporal baseline of days, before (6, 12, and 18 July), during (24 July), and after (30 July, 5 and 11 August) the wildfire event, respectively. Each SAR image of the time series was independently post-processed by applying the de-speckling noise-filtering algorithm [154] and co-registered using Enhanced Spectral Diversity (ESD) with respect to the 24 July acquisition. The maps of sigma nought were finally converted from linear to decibel, and six sigma naught differences (dB) with respect to the 24 July maps were computed and geocoded. SAR data pre-processing was accomplished using the Sentinel Application Platform tool [155].
For the sake of representability, Figure 7 shows the maps of (dB) with a temporal baseline of days for the VH and VV polarization.
Once the sigma nought difference time series was computed, the incoherent temporal multi-looking step described in Section 3.3. was singularly applied to the VH and VV SAR sigma nought time series.
As shown in Figure 8, the temporal multi-looking operation allows us to highlight better the variations of amplitude SAR backscatter at VH and VV polarizations connected to changes in ground properties related to the wildfire event.
Finally, as described in Section 2, the sum and difference of two incoherent temporal multi-look maps obtained at the two available VV and VH polarization channels were used as additional CDIs. The relevant maps are shown in Figure 9A,B.
Interferometric SAR coherence change and CCIs were also determined and used to detect changes related to the wildfire disaster event. Considering triplets of SAR images using temporal baselines of ,,,,, and days with respect to the 24 July 2021 primary event date acquisition, pre- and co-fire event interferometric pairs CCDI time-series were obtained by applying Equations (22) and (23). The use of these temporal baselines was chosen to highlight as much as possible the changes between the pre- and co-disaster coherence maps. Figure 10 shows the maps of coherence ratio and normalized difference coherence obtained using the interferometric coherence related to pairs of SAR acquisitions with a temporal baseline of days (24–30 July and 18–24 July) for VH and VV polarization.
It is worth highlighting that both for the sigma nought and coherence maps, changes depend on several natural phenomena that can act simultaneously (e.g., soil moisture and humidity changes due to weather conditions), and their use in vegetated areas, such as the investigated one, is more challenging due to the presence of volume scattering decorrelation, especially at C- and X-bands. As shown in Figure 8, Figure 9 and Figure 10, the fire event signal is easily visible and in agreement with the fire perimeter provided by the EFFIS platform. The same processing methodology was used for the Sicily and Texas AOIs. The acquisition of the 8 August 2021 and 24 August 2017 was used as main event dates, respectively.
6. Discussion on Random Forest Training and Research Outcomes
For the three selected case-study areas in Italy and the US, we applied the RF-aided strategy described in Section 3.4 and Section 3.5. In this section, we discuss the results of the experiments that were carried out using an RF model trained using as inputs the set of synthetic incoherent (sigma naught) and coherent (coherence-based) change detection indices at VV and VH polarizations.
Supervised training was carried out using the fire and flood perimeters from EFFIS and Glo-FAS by the determination of a synthetic binary change mask, in which all pixels within the perimeters are identified as changed and labeled as one and all pixels outside the perimeters are identified as unchanged and labeled as 0; see Figure 11.
In addition, to avoid the class imbalance problem, an additional preprocessing step was carried out. Specifically, the dataset of samples related to the Sardinia and Sicily AOIs presents a class imbalance of about 3:1 for the positive (1) class; see Figure 12.
As we can see from Figure 12A, the dataset presents a class imbalance for the positive class (1). Imbalanced datasets pose a challenge for predictive modeling such as RF because they introduce a bias in the training that results in the poor predictive performance of the minority class with respect to the majority one [156,157,158,159]. In this way, the random-oversampling and -undersampling techniques [157,158] were used to make the training dataset imbalance less severe; see Figure 12B.
After the class balancing, the dataset was split into two subsets. For the former, 60% of the total dataset was used for training and cross validation, for the latter the remaining 40% was used for the testing. Using Optuna’s [143] hyperparameter optimization framework, an RF structure composed of 209 decision trees was designed. Stratified K-Fold [160,161] used 10-fold to cross-validate the RF model in the training step. To evaluate the effectiveness of the proposed method, we decided to use only the data related to the Sardinia and Sicily AOIs to train, validate, and test the RF model, and subsequently assess it considering the new totally unseen AOI related to the Galveston Bay, Texas. It is worth noting the overestimation performance of random forest while the dependent training and test dataset were used, as recently claimed in the work of [162,163]. However, in our case this effect is limited because the training and the validation pixels were taken from two independent datasets.
Figure 13 shows the RF predicted change masks. By a spatial comparison with the binary change mask used as truth, the RF model can identify the area related to the wildfire and flooding events very well. However, it is also clear that misclassification of regions is generated by the proposed method. This is due to the presence of speckle noise consistently in each AOI analyzed. We used the confusion matrix (CM) test to quantitatively examine the RF prediction performance.
Confusion matrices of the tested AOIs are shown in Figure 14. From their analysis, it is straightforward to note the goodness of the proposed method. We want to remark that the probability values reported in the confusion matrices were calculated starting from available polygons of burned/changed areas; thus, errors due to incorrect knowledge of the true areas affected by changes can affect the reported estimates.
In addition, starting from the information given by the confusion matrices, (i) precision, (ii) recall, and (iv) F-1 scores were determined. We report these scores in Table 2.
Analyzing the results shown in Table 2, from the precision and recall scores of the classification of unchanged/changed pixels, it is evident that the RF model expresses very high change detection capacity in all the three analyzed areas. F1 scores are also very high. In particular, for the Texas case the F1 scores indicate that the proposed RF model is able to identify changes with high precision and accuracy in new unseen areas afflicted by a different phenomenon.
Finally, we determined how much each selected feature contributes to the classification of changed, unchanged pixels in the analyzed phenomenon using the RF feature importance statistic. Figure 15 shows that among the coherent and incoherent set of features, the incoherent temporal multi-look VH map significantly contributes to the final estimate. The sum follows this, and the difference in mutual sigma naught ratio maps between different polarization is also relevant. Features related to CCDIs also make a high contribution. The ranking of importance reported in Figure 15 further confirms that, for what attains the SAR backscattered returns, the cross-polarization channel is more sensitive than the co-polarization one to fire damage. This result is in good agreement with the findings of the work [78] where the authors demonstrated with theoretical observations and direct evidence with Sentinel-1 SAR data that the VH channel is more apt to detect fire disturbance scars and this outcome is ascribable to the associated reduction in the volumetric scattering contribution after a fire event. Furthermore, the results show that the sum of SAR backscattered signals (sigma nought) on the co-pol VV and cross-pol VH channels has a great importance in the final estimate of changed areas.
It is remarkable that the results of Figure 15 show that the coherent indices contribute to the final estimate of changed areas but with less importance than information coming from incoherent indices. This finding was expected, knowing that coherence is more sensitive to subtle spatial-varying changes in ground properties over time after a disastrous event.
Summarizing, the importance rank of the different coherent layers for a fire-disturbed region, which is described in Figure 15, demonstrates that:
- (i)
- Short temporal InSAR baselines are preferred to long-baselines because coherence rapidly varies after a primary event and tends to achieve a new (random) state, not linked to the primary event under investigation, just a few days after the event itself. This finding is in accordance with the fact that temporal decorrelation is sensitive not only to random changes (linked to the event) but also to composite ground and volumetric changes that determine a systematic decay of the coherence over time (see the model in Section 3.2).
- (ii)
- The normalized coherence difference has generally an enhanced importance than the coherence ratio. This finding was also expected, and it agrees with theory (see Section 3.2). Indeed, the normalized coherence difference has the beneficial effect of including in a unique estimator the advantage of the coherence difference and coherence ratio to discriminate and better isolate the random coherent components.
- (iii)
- The co-pol and cross-pol channels have almost the same importance, with a slight marked preference versus the co-pol VV polarization.
7. Conclusions and Future Perspective
This paper addressed a review of the theory of existing coherent and incoherent CD methodologies used to study and monitor ground surface changes that arise when a disaster event (i.e., wildfires or floods) occurs, using sequences of synthetic aperture radar (SAR) images. Then, we focused on new trends of evolution of the research branch on Change Detection with SAR data, by addressing specifically the emerging ML-driven CD approaches. We investigated the potential of different synthetic coherent/incoherent CDIs and their mutual interactions for the rapid mapping of “changed areas” relying on the joint exploitation of SAR sigma naught and interferometric coherence maps.
A classifier based on RF was trained combining different information coming from coherent/incoherent CDIs in a unique corpus, over different AOIs characterized by wildfire and flood phenomena.
Specifically, the study of the Montiferru and Madonie wildfires showed that the combined use of different CDIs able to synthetically describe ground surface changes associated with a disaster event (i.e., the pre-, cross-, and post-disaster phases) and RF classifier is a powerful way to quickly identify areas related to wildfire events and quickly assess fire damage.
The proposed methodology was also tested considering a flood event that affected the south of Texas in August of 2017, in the Galveston Bay, using S-1 SAR data.
The goodness of RF CD performance was also verified using a quantitative analysis using confusion matrix statistics that show a very high rate in identify changed and unchanged areas. The achieved F-1 scores of about 0.9 highlight the potential of RF methods in remote sensing CD tasks.
As a result, our findings demonstrate that S-1 C-band SAR data can provide suitable information on fire and flood events over the most severely affected areas (the highest level of fire or flood damage), supporting how such systems can be a complementary source of data to optical ones, in the case of cloud covers or plumes due to extreme weather and fire events.
As a further development, we intend to extend our research on change detection based on sets of heterogeneous optical and radar images. The inclusion of optical features and the fusion with the SAR one in the RF forest classifier is expected to improve generalization performance (e.g., in flooded areas). Fine tuning and extensive exploitation of the proposed method on a large scale requires the selection and processing of several independent SAR datasets and a heterogenous family of disasters (e.g., floods, droughts, extreme events, forest and vegetation disturbance, urban changes, earthquakes, volcano eruptions, man-made changes, etc.). This perspective is worthwhile and is an issue to be investigated in the future.
Author Contributions
P.M. is the principal investigator. He reviewed the literature and performed the experiments on real data. A.P. supervised the work and reviewed the literature related for the damage fast assessment. C.S. and G.M. contributed to the drafting of the manuscript and to the organization of the experimental results. All authors have read and agreed to the published version of the manuscript.
Funding
This research received no external funding.
Data Availability Statement
The data presented in this study are available on request from the corresponding author.
Conflicts of Interest
The authors declare no conflict of interest.
References
- Hansen, M.C.; Loveland, T.R. A Review of Large Area Monitoring of Land Cover Change Using Landsat Data. Remote Sens. Environ. 2012, 122, 66–74. [Google Scholar] [CrossRef]
- Afanasyev, A.; Zamyatin, A.; Cabral, P. Land Cover Change Analysis Using Change Detection Methods. In Information Technologies and Mathematical Modelling: Proceedings of the 13th International Scientific Conference, Anzhero-Sudzhensk, Russia, 20–22 November 2014; Dudin, A., Nazarov, A., Yakupov, R., Gortsev, A., Eds.; Springer: Cham, Switzerland, 2014; pp. 11–17. [Google Scholar]
- Bruzzone, L.; Prieto, D.F. Automatic Analysis of the Difference Image for Unsupervised Change Detection. IEEE Trans. Geosci. Remote Sens. 2000, 38, 1171–1182. [Google Scholar] [CrossRef] [Green Version]
- Lu, D.; Mausel, P.; Brondizio, E.; Moran, E. Change Detection Techniques. Int. J. Remote Sens. 2004, 25, 2365–2407. [Google Scholar] [CrossRef]
- Zhu, Z. Change Detection Using Landsat Time Series: A Review of Frequencies, Preprocessing, Algorithms, and Applications. ISPRS-J. Photogramm. Remote Sens. 2017, 130, 370–384. [Google Scholar] [CrossRef]
- Coppin, P.; Jonckheere, I.; Nackaerts, K.; Muys, B.; Lambin, E. Digital Change Detection Methods in Ecosystem Monitoring: A Review. Int. J. Remote Sens. 2004, 25, 1565–1596. [Google Scholar] [CrossRef]
- Singh, A. Digital Change Detection Techniques Using Remotely-Sensed Data. Int. J. Remote Sens. 1989, 10, 989–1003. [Google Scholar] [CrossRef] [Green Version]
- Radke, R.J.; Andra, S.; Al-Kofahi, O.; Roysam, B. Image Change Detection Algorithms: A Systematic Survey. IEEE Trans. Image Process. 2005, 14, 294–307. [Google Scholar] [CrossRef]
- Lunetta, R.S.; Knight, J.F.; Ediriwickrema, J.; Lyon, J.G.; Worthy, L.D. Land-Cover Change Detection Using Multi-Temporal MODIS NDVI Data. Remote Sens. Environ. 2006, 105, 142–154. [Google Scholar] [CrossRef]
- Walter, V. Object-Based Classification of Remote Sensing Data for Change Detection. ISPRS-J. Photogramm. Remote Sens. 2004, 58, 225–238. [Google Scholar] [CrossRef]
- Oliver, C.; Quegan, S. Understanding Synthetic Aperture Radar Images; Artech House: Boston, MA, USA, 1998; ISBN 978-0-89006-850-2. [Google Scholar]
- Celik, T. Unsupervised Change Detection in Satellite Images Using Principal Component Analysis and K-Means Clustering. IEEE Geosci. Remote Sens. Lett. 2009, 6, 772–776. [Google Scholar] [CrossRef]
- Andre, G.; Chiroiu, L.; Mering, C.; Chopin, F. Building Destruction and Damage Assessment after Earthquake Using High Resolution Optical Sensors. The Case of the Gujarat Earthquake of January 26, 2001. In Proceedings of the Igarss 2003 IEEE International Geoscience and Remote Sensing Symposium, Toulouse, France, 21–25 July 2003; IEEE: New York, NY, USA, 2003; Volume I–VII, pp. 2398–2400. [Google Scholar]
- Brunner, D.; Lemoine, G.; Bruzzone, L. Earthquake Damage Assessment of Buildings Using VHR Optical and SAR Imagery. IEEE Trans. Geosci. Remote Sens. 2010, 48, 2403–2420. [Google Scholar] [CrossRef] [Green Version]
- Wieland, M.; Pittore, M.; Parolai, S.; Zschau, J. Exposure Estimation from Multi-Resolution Optical Satellite Imagery for Seismic Risk Assessment. ISPRS Int. Geo-Inf. 2012, 1, 69–88. [Google Scholar] [CrossRef] [Green Version]
- El Hajj, M.; Begue, A.; Guillaume, S.; Martine, J.-F. Integrating SPOT-5 Time Series, Crop Growth Modeling and Expert Knowledge for Monitoring Agricultural Practices—The Case of Sugarcane Harvest on Reunion Island. Remote Sens. Environ. 2009, 113, 2052–2061. [Google Scholar] [CrossRef]
- Huber, K.; Dorigo, W.A.; Bauer, T.; Eitzinger, J.; Haumann, J.; Kaiser, G.; Linke, R.; Postl, W.; Rischbeck, P.; Schneider, W.; et al. Changes in Spectral Reflectance of Crop Canopies Due to Drought Stress. In Earth Observation for Vegetation Monitoring and Water Management; D’Urso, G., Jochum, M.A.O., Moreno, J., Eds.; Amer Inst Physics: Melville, NY, USA, 2006; Volume 852, p. 258. [Google Scholar]
- Gomez, C.; White, J.C.; Wulder, M.A. Optical Remotely Sensed Time Series Data for Land Cover Classification: A Review. ISPRS-J. Photogramm. Remote Sens. 2016, 116, 55–72. [Google Scholar] [CrossRef] [Green Version]
- Lu, D.; Chen, Q.; Wang, G.; Liu, L.; Li, G.; Moran, E. A Survey of Remote Sensing-Based Aboveground Biomass Estimation Methods in Forest Ecosystems. Int. J. Digit. Earth 2016, 9, 63–105. [Google Scholar] [CrossRef]
- Anderson, L.O.; Malhi, Y.; Aragao, L.E.O.C.; Ladle, R.; Arai, E.; Barbier, N.; Phillips, O. Remote Sensing Detection of Droughts in Amazonian Forest Canopies. New Phytol. 2010, 187, 733–750. [Google Scholar] [CrossRef]
- Pereira, J.M.C. Remote Sensing of Burned Areas in Tropical Savannas. Int. J. Wildland Fire 2003, 12, 259–270. [Google Scholar] [CrossRef] [Green Version]
- Hu, T.; Su, Y.; Xue, B.; Liu, J.; Zhao, X.; Fang, J.; Guo, Q. Mapping Global Forest Aboveground Biomass with Spaceborne LiDAR, Optical Imagery, and Forest Inventory Data. Remote Sens. 2016, 8, 565. [Google Scholar] [CrossRef] [Green Version]
- Tapete, D.; Cigna, F. Appraisal of Opportunities and Perspectives for the Systematic Condition Assessment of Heritage Sites with Copernicus Sentinel-2 High-Resolution Multispectral Imagery. Remote Sens. 2018, 10, 561. [Google Scholar] [CrossRef] [Green Version]
- Yang, Y.; Wong, L.N.Y.; Chen, C.; Chen, T. Using Multitemporal Landsat Imagery to Monitor and Model the Influences of Landscape Pattern on Urban Expansion in a Metropolitan Region. J. Appl. Remote Sens. 2014, 8, 083639. [Google Scholar] [CrossRef]
- Hafner, S.; Nascetti, A.; Azizpour, H.; Ban, Y. Sentinel-1 and Sentinel-2 Data Fusion for Urban Change Detection Using a Dual Stream U-Net. IEEE Geosci. Remote Sens. Lett. 2022, 19, 4019805. [Google Scholar] [CrossRef]
- Zarro, C.; Cerra, D.; Auer, S.; Ullo, S.L.; Reinartz, P. Urban Sprawl and COVID-19 Impact Analysis by Integrating Deep Learning with Google Earth Engine. Remote Sens. 2022, 14, 2038. [Google Scholar] [CrossRef]
- Zhu, Z.; Wang, S.; Woodcock, C.E. Improvement and Expansion of the Fmask Algorithm: Cloud, Cloud Shadow, and Snow Detection for Landsats 4–7, 8, and Sentinel 2 Images. Remote Sens. Environ. 2015, 159, 269–277. [Google Scholar] [CrossRef]
- Eckerstorfer, M.; Buehler, Y.; Frauenfelder, R.; Malnes, E. Remote Sensing of Snow Avalanches: Recent Advances, Potential, and Limitations. Cold Reg. Sci. Technol. 2016, 121, 126–140. [Google Scholar] [CrossRef]
- Peters, J.; Bolch, T.; Gafurov, A.; Prechtel, N. Snow Cover Distribution in the Aksu Catchment (Central Tien Shan) 1986-2013 Based on AVHRR and MODIS Data. IEEE J. Sel. Top. Appl. Earth Observ. Remote Sens. 2015, 8, 5361–5375. [Google Scholar] [CrossRef]
- Muhuri, A.; Gascoin, S.; Menzel, L.; Kostadinov, T.S.; Harpold, A.A.; Sanmiguel-Vallelado, A.; Lopez-Moreno, J. Performance Assessment of Optical Satellite-Based Operational Snow Cover Monitoring Algorithms in Forested Landscapes. IEEE J. Sel. Top. Appl. Earth Observ. Remote Sens. 2021, 14, 7159–7178. [Google Scholar] [CrossRef]
- Murphy, K.P. Machine Learning: A Probabilistic Perspective; Adaptive Computation and Machine Learning Series; MIT Press: Cambridge, MA, USA, 2012; ISBN 978-0-262-01802-9. [Google Scholar]
- Lee, J. Speckle Analysis and Smoothing of Synthetic Aperture Radar Images. Comput. Graph. Image Process. 1981, 17, 24–32. [Google Scholar] [CrossRef]
- Lee, J.-S.; Wen, J.-H.; Ainsworth, T.L.; Chen, K.-S.; Chen, A.J. Improved Sigma Filter for Speckle Filtering of SAR Imagery. IEEE Trans. Geosci. Remote Sens. 2009, 47, 202–213. [Google Scholar] [CrossRef]
- Xie, H.; Pierce, L.E.; Ulaby, F.T. SAR Speckle Reduction Using Wavelet Denoising and Markov Random Field Modeling. IEEE Trans. Geosci. Remote Sens. 2002, 40, 2196–2212. [Google Scholar] [CrossRef] [Green Version]
- Bazi, Y.; Bruzzone, L.; Melgani, F. An Unsupervised Approach Based on the Generalized Gaussian Model to Automatic Change Detection in Multitemporal SAR Images. IEEE Trans. Geosci. Remote Sens. 2005, 43, 874–887. [Google Scholar] [CrossRef] [Green Version]
- Rignot, E.; Vanzyl, J. Change Detection Techniques for Ers-1 Sar Data. IEEE Trans. Geosci. Remote Sens. 1993, 31, 896–906. [Google Scholar] [CrossRef] [Green Version]
- Conradsen, K.; Nielsen, A.A.; Sehou, J.; Skriver, H. A Test Statistic in the Complex Wishart Distribution and Its Application to Change Detection in Polarimetric SAR Data. IEEE Trans. Geosci. Remote Sens. 2003, 41, 4–19. [Google Scholar] [CrossRef] [Green Version]
- De, S.; Pirrone, D.; Bovolo, F.; Bruzzone, L.; Bhattacharya, A. A Novel Change Detection Framework Based on Deep Learning for the Analysis of Multi-Temporal Polarimetric SAR Images. In Proceedings of the 2017 IEEE International Geoscience and Remote Sensing Symposium (IGARSS), Fort Worth, TX, USA, 23–28 July 2017; pp. 5193–5196. [Google Scholar]
- Bovolo, F.; Bruzzone, L. A Detail-Preserving Scale-Driven Approach to Change Detection in Multitemporal SAR Images. IEEE Trans. Geosci. Remote Sens. 2005, 43, 2963–2972. [Google Scholar] [CrossRef]
- Moser, G.; Serpico, S.B. Generalized Minimum-Error Thresholding for Unsupervised Change Detection from SAR Amplitude Imagery. IEEE Trans. Geosci. Remote Sens. 2006, 44, 2972–2982. [Google Scholar] [CrossRef]
- Giustarini, L.; Hostache, R.; Matgen, P.; Schumann, G.J.-P.; Bates, P.D.; Mason, D.C. A Change Detection Approach to Flood Mapping in Urban Areas Using TerraSAR-X. IEEE Trans. Geosci. Remote Sens. 2013, 51, 2417–2430. [Google Scholar] [CrossRef] [Green Version]
- Gao, F.; Dong, J.; Li, B.; Xu, Q.; Xie, C. Change Detection from Synthetic Aperture Radar Images Based on Neighborhood-Based Ratio and Extreme Learning Machine. JARS 2016, 10, 046019. [Google Scholar] [CrossRef]
- Carincotte, C.; Derrode, S.; Bourennane, S. Unsupervised Change Detection on SAR Images Using Fuzzy Hidden Markov Chains. IEEE Trans. Geosci. Remote Sens. 2006, 44, 432–441. [Google Scholar] [CrossRef]
- Dierking, W.; Skriver, H. Change Detection for Thematic Mapping by Means of Airborne Multitemporal Polarimetric SAR Imagery. IEEE Trans. Geosci. Remote Sens. 2002, 40, 618–636. [Google Scholar] [CrossRef]
- Pincus, P.B.; Preiss, M. Coherent Change Detection Under a Forest Canopy. In Proceedings of the 2018 International Conference on Radar (RADAR), Brisbane, Australia, 27–31 August 2018; pp. 1–6. [Google Scholar]
- Frost, V.S.; Stiles, J.A.; Shanmugan, K.S.; Holtzman, J.C. A Model for Radar Images and Its Application to Adaptive Digital Filtering of Multiplicative Noise. IEEE Trans. Pattern Anal. Mach. Intell. 1982, 4, 157–166. [Google Scholar] [CrossRef]
- Qiu, F.; Berglund, J.; Jensen, J.R.; Thakkar, P.; Ren, D. Speckle Noise Reduction in SAR Imagery Using a Local Adaptive Median Filter. GISci. Remote Sens. 2004, 41, 244–266. [Google Scholar] [CrossRef] [Green Version]
- Kuan, D.; Sawchuk, A.; Strand, T.; Chavel, P. Adaptive Restoration of Images with Speckle. IEEE Trans. Acoust. Speech Signal Process. 1987, 35, 373–383. [Google Scholar] [CrossRef]
- Akl, A.; Tabbara, K.; Yaacoub, C. An Enhanced Kuan Filter for Suboptimal Speckle Reduction. In Proceedings of the 2012 2nd International Conference on Advances in Computational Tools for Engineering Applications (ACTEA), Beirut, Lebanon, 12–15 December 2012; pp. 91–95. [Google Scholar]
- Baraldi, A.; Parmiggiani, F. A Refined Gamma MAP SAR Speckle Filter with Improved Geometrical Adaptivity. IEEE Trans. Geosci. Remote Sens. 1995, 33, 1245–1257. [Google Scholar] [CrossRef]
- Touzi, R.; Lopes, A.; Bousquet, P. A Statistical and Geometrical Edge Detector for SAR Images. IEEE Trans. Geosci. Remote Sens. 1988, 26, 764–773. [Google Scholar] [CrossRef]
- Lee, J.-S. A Simple Speckle Smoothing Algorithm for Synthetic Aperture Radar Images. IEEE Trans. Syst. Man Cybern. 1983, 1, 85–89. [Google Scholar] [CrossRef]
- Lee, J.-S. Statistical Modelling and Suppression of Speckle in Synthetic Aperture Radar Images; Institute of Electrical and Electronics Engineers, Inc.: New York, NY, USA, 1987; Volume 2, pp. 1331–1339. [Google Scholar]
- Adaptive Speckle Filtering in Radar Imagery. IntechOpen. Available online: https://www.intechopen.com/chapters/46699 (accessed on 31 May 2022).
- Bruzzone, L.; Serpico, S.B. An Iterative Technique for the Detection of Land-Cover Transitions in Multitemporal Remote-Sensing Images. IEEE Trans. Geosci. Remote Sens. 1997, 35, 858–867. [Google Scholar] [CrossRef] [Green Version]
- A Variational Change Detection Method for Multitemporal SAR Images: Remote Sensing Letters: Vol 5, No 4. Available online: https://www.tandfonline.com/doi/abs/10.1080/2150704X.2014.904970 (accessed on 31 May 2022).
- Ulaby, F.T.; Moore, R.K.; Fung, A.K. Microwave Remote Sensing Active and Passive. Rader Remote Sens. Surf. Scatt. Emiss. Theory 1982, 2, 848–902. [Google Scholar]
- Chini, M.; Hostache, R.; Giustarini, L.; Matgen, P. A Hierarchical Split-Based Approach for Parametric Thresholding of SAR Images: Flood Inundation as a Test Case. IEEE Trans. Geosci. Remote Sens. 2017, 55, 6975–6988. [Google Scholar] [CrossRef]
- Bazi, Y.; Bruzzone, L.; Melgani, F. Automatic Identification of the Number and Values of Decision Thresholds in the Log-Ratio Image for Change Detection in SAR Images. IEEE Geosci. Remote Sens. Lett. 2006, 3, 349–353. [Google Scholar] [CrossRef] [Green Version]
- Hu, H.; Ban, Y. Unsupervised Change Detection in Multitemporal SAR Images Over Large Urban Areas. IEEE J. Sel. Top. Appl. Earth Obs. Remote Sens. 2014, 7, 3248–3261. [Google Scholar] [CrossRef]
- Gong, M.; Zhou, Z.; Ma, J. Change Detection in Synthetic Aperture Radar Images Based on Image Fusion and Fuzzy Clustering. IEEE Trans. Image Process. 2012, 21, 2141–2151. [Google Scholar] [CrossRef]
- Gong, M.; Su, L.; Jia, M.; Chen, W. Fuzzy Clustering With a Modified MRF Energy Function for Change Detection in Synthetic Aperture Radar Images. IEEE Trans. Fuzzy Syst. 2014, 22, 98–109. [Google Scholar] [CrossRef]
- Zheng, Y.; Zhang, X.; Hou, B.; Liu, G. Using Combined Difference Image and K-Means Clustering for SAR Image Change Detection. IEEE Geosci. Remote Sens. Lett. 2014, 11, 691–695. [Google Scholar] [CrossRef]
- Otsu, N. A Threshold Selection Method from Gray-Level Histograms. IEEE Trans. Syst. Man Cybern. 1979, 9, 62–66. [Google Scholar] [CrossRef] [Green Version]
- Kittler, J.; Illingworth, J. Minimum Error Thresholding. Pattern Recognit. 1986, 19, 41–47. [Google Scholar] [CrossRef]
- Hao, M.; Shi, W.; Zhang, H.; Li, C. Unsupervised Change Detection With Expectation-Maximization-Based Level Set. IEEE Geosci. Remote Sens. Lett. 2014, 11, 210–214. [Google Scholar] [CrossRef]
- Sun, Y.; Lei, L.; Li, X.; Tan, X.; Kuang, G. Structure Consistency-Based Graph for Unsupervised Change Detection With Homogeneous and Heterogeneous Remote Sensing Images. IEEE Trans. Geosci. Remote Sens. 2022, 60, 1–21. [Google Scholar] [CrossRef]
- Jimenez-Sierra, D.A.; Benítez-Restrepo, H.D.; Vargas-Cardona, H.D.; Chanussot, J. Graph-Based Data Fusion Applied to: Change Detection and Biomass Estimation in Rice Crops. Remote Sens. 2020, 12, 2683. [Google Scholar] [CrossRef]
- Amato, U.; Lavanant, L.; Liuzzi, G.; Masiello, G.; Serio, C.; Stuhlmann, R.; Tjemkes, S.A. Cloud Mask via Cumulative Discriminant Analysis Applied to Satellite Infrared Observations: Scientific Basis and Initial Evaluation. Atmos. Meas. Technol. 2014, 7, 3355–3372. [Google Scholar] [CrossRef] [Green Version]
- Yan, W.; Shi, S.; Pan, L.; Zhang, G.; Wang, L. Unsupervised Change Detection in SAR Images Based on Frequency Difference and a Modified Fuzzy C-Means Clustering. Int. J. Remote Sens. 2018, 39, 3055–3075. [Google Scholar] [CrossRef]
- Barber, J. A Generalized Likelihood Ratio Test for Coherent Change Detection in Polarimetric SAR. IEEE Geosci. Remote Sens. Lett. 2015, 12, 1873–1877. [Google Scholar] [CrossRef]
- Xiong, B.; Chen, J.M.; Kuang, G. A Change Detection Measure Based on a Likelihood Ratio and Statistical Properties of SAR Intensity Images. Remote Sens. Lett. 2012, 3, 267–275. [Google Scholar] [CrossRef]
- Fuller, D.O. Satellite Remote Sensing of Biomass Burning with Optical and Thermal Sensors. Prog. Phys. Geogr. Earth Environ. 2000, 24, 543–561. [Google Scholar] [CrossRef]
- Lentile, L.B.; Morgan, P.; Hudak, A.T.; Bobbitt, M.J.; Lewis, S.A.; Smith, A.M.S.; Robichaud, P.R. Post-Fire Burn Severity and Vegetation Response Following Eight Large Wildfires Across the Western United States. Fire Ecol. 2007, 3, 91–108. [Google Scholar] [CrossRef]
- Siegert, F.; Ruecker, G. Use of Multitemporal ERS-2 SAR Images for Identification of Burned Scars in South-East Asian Tropical Rainforest. Int. J. Remote Sens. 2000, 21, 831–837. [Google Scholar] [CrossRef]
- Bourgeau-Chavez, L.L.; Kasischke, E.S.; Brunzell, S.; Mudd, J.P.; Tukman, M. Mapping Fire Scars in Global Boreal Forests Using Imaging Radar Data. Int. J. Remote Sens. 2002, 23, 4211–4234. [Google Scholar] [CrossRef]
- Tanase, M.A.; Belenguer-Plomer, M.A.; Roteta, E.; Bastarrika, A.; Wheeler, J.; Fernandez-Carrillo, A.; Tansey, K.; Wiedemann, W.; Navratil, P.; Lohberger, S.; et al. Burned Area Detection and Mapping: Intercomparison of Sentinel-1 and Sentinel-2 Based Algorithms over Tropical Africa. Remote Sens. 2020, 12, 334. [Google Scholar] [CrossRef] [Green Version]
- Imperatore, P.; Azar, R.; Calo, F.; Stroppiana, D.; Brivio, P.A.; Lanari, R.; Pepe, A. Effect of the Vegetation Fire on Backscattering: An Investigation Based on Sentinel-1 Observations. IEEE J. Sel. Top. Appl. Earth Observ. Remote Sens. 2017, 10, 4478–4492. [Google Scholar] [CrossRef]
- Khelifi, L.; Mignotte, M. Deep Learning for Change Detection in Remote Sensing Images: Comprehensive Review and Meta-Analysis. IEEE Access 2020, 8, 126385–126400. [Google Scholar] [CrossRef]
- Shi, W.; Zhang, M.; Zhang, R.; Chen, S.; Zhan, Z. Change Detection Based on Artificial Intelligence: State-of-the-Art and Challenges. Remote Sens. 2020, 12, 1688. [Google Scholar] [CrossRef]
- Wieland, M.; Liu, W.; Yamazaki, F. Learning Change from Synthetic Aperture Radar Images: Performance Evaluation of a Support Vector Machine to Detect Earthquake and Tsunami-Induced Changes. Remote Sens. 2016, 8, 792. [Google Scholar] [CrossRef] [Green Version]
- Liu, J.; Gong, M.; Qin, K.; Zhang, P. A Deep Convolutional Coupling Network for Change Detection Based on Heterogeneous Optical and Radar Images. IEEE Trans. Neural Netw. Learn. Syst. 2018, 29, 545–559. [Google Scholar] [CrossRef]
- Preiss, M.; Gray, D.; Stacy, N. A Change Detection Statistic for Repeat Pass Interferometric SAR. In Proceedings of the 2003 IEEE International Conference on Acoustics, Speech, and Signal Processing, (ICASSP ’03), Hong Kong, China, 6–10 April 2003; Volume 5, p. V-241. [Google Scholar]
- Bamler, R.; Hartl, P. Synthetic Aperture Radar Interferometry. Inverse Probl. 1998, 14, R1–R54. [Google Scholar] [CrossRef]
- Preiss, M.; Gray, D.A.; Stacy, N.J.S. Detecting Scene Changes Using Synthetic Aperture Radar Interferometry. IEEE Trans. Geosci. Remote Sens. 2006, 44, 2041–2054. [Google Scholar] [CrossRef] [Green Version]
- Pepe, A.; Calò, F. A Review of Interferometric Synthetic Aperture RADAR (InSAR) Multi-Track Approaches for the Retrieval of Earth’s Surface Displacements. Appl. Sci. 2017, 7, 1264. [Google Scholar] [CrossRef] [Green Version]
- Detecting Scene Changes Using Synthetic Aperture Radar Interferometry. IEEE Journals & Magazine. IEEE Xplore. Available online: https://ieeexplore.ieee.org/document/1661793 (accessed on 31 May 2022).
- Zebker, H.A.; Villasenor, J. Decorrelation in Interferometric Radar Echoes. IEEE Trans. Geosci. Remote Sens. 1992, 30, 950–959. [Google Scholar] [CrossRef] [Green Version]
- Mercier, G.; Derrode, S. SAR Image Change Detection Using Distance between Distributions of Classes. In Proceedings of the IGARSS 2004, 2004 IEEE International Geoscience and Remote Sensing Symposium, Anchorage, AK, USA, 20–24 September 2004; Volume 6, pp. 3872–3875. [Google Scholar]
- Amitrano, D.; Di Martino, G.; Iodice, A.; Riccio, D.; Ruello, G. Unsupervised Rapid Flood Mapping Using Sentinel-1 GRD SAR Images. IEEE Trans. Geosci. Remote Sens. 2018, 56, 3290–3299. [Google Scholar] [CrossRef]
- Ma, J.; Gong, M.; Zhou, Z. Wavelet Fusion on Ratio Images for Change Detection in SAR Images. IEEE Geosci. Remote Sens. Lett. 2012, 9, 1122–1126. [Google Scholar] [CrossRef]
- Monti-Guarnieri, A.V.; Brovelli, M.A.; Manzoni, M.; Mariotti d’Alessandro, M.; Molinari, M.E.; Oxoli, D. Coherent Change Detection for Multipass SAR. IEEE Trans. Geosci. Remote Sens. 2018, 56, 6811–6822. [Google Scholar] [CrossRef]
- Zhuang, H.; Hao, M.; Deng, K.; Zhang, K.; Wang, X.; Yao, G. Change Detection in SAR Images via Ratio-Based Gaussian Kernel and Nonlocal Theory. IEEE Trans. Geosci. Remote Sens. 2022, 60, 1–15. [Google Scholar] [CrossRef]
- Martin, J.C.; Dobbs, K.; Koehler, F.W. Sentinel-1 Spatially Varying Maximum-Likelihood Coherent Change Detection. In Proceedings of the 2018 IEEE Radar Conference (RadarConf18), Oklahoma City, OK, USA, 23–27 April 2018; pp. 1234–1238. [Google Scholar]
- Freeman, A. Sar Calibration—An Overview. IEEE Trans. Geosci. Remote Sens. 1992, 30, 1107–1121. [Google Scholar] [CrossRef]
- Liu, G.; Huang, S.; Xiong, H.; Torre, A.; Rubertone, F. Study on Speckle Reduction in Multi-Look Polarimetric SAR Image. J. Electron. 1999, 16, 25–31. [Google Scholar] [CrossRef]
- Schuler, D.L.; Lee, J.-S.; Ainsworth, T.L. Compensation of Terrain Azimuthal Slope Effects in Geophysical Parameter Studies Using Polarimetric SAR Data. Remote Sens. Environ. 1999, 69, 139–155. [Google Scholar] [CrossRef]
- Touzi, R.; Lopes, A. Statistics of the Stokes Parameters and of the Complex Coherence Parameters in One-Look and Multilook Speckle Fields. IEEE Trans. Geosci. Remote Sens. 1996, 34, 519–531. [Google Scholar] [CrossRef]
- Lopez-Martinez, C.; Fabregas, X. Modeling and Reduction of SAR Interferometric Phase Noise in the Wavelet Domain. IEEE Trans. Geosci. Remote Sens. 2002, 40, 2553–2566. [Google Scholar] [CrossRef] [Green Version]
- Pepe, A.; Mastro, P.; Jones, C.E. Adaptive Multilooking of Multitemporal Differential SAR Interferometric Data Stack Using Directional Statistics. IEEE Trans. Geosci. Remote Sens. 2021, 59, 6706–6721. [Google Scholar] [CrossRef]
- Jupp, P.E.; Mardia, K.V. Directional Statistics; John Wiley & Sons: Hoboken, NJ, USA, 2009; ISBN 978-0-470-31781-5. [Google Scholar]
- Bouaraba, A.; Younsi, A.; Aissa, A.B.; Acheroy, M.; Milisavljevic, N.; Closson, D. Robust Techniques for Coherent Change Detection Using Cosmo-Skymed SAR Images. Prog. Electromagn. Res. M 2012, 22, 219–232. [Google Scholar] [CrossRef] [Green Version]
- Gebremichael, E.; Molthan, A.L.; Bell, J.R.; Schultz, L.A.; Hain, C. Flood Hazard and Risk Assessment of Extreme Weather Events Using Synthetic Aperture Radar and Auxiliary Data: A Case Study. Remote Sens. 2020, 12, 3588. [Google Scholar] [CrossRef]
- Tzouvaras, M.; Danezis, C.; Hadjimitsis, D.G. Small Scale Landslide Detection Using Sentinel-1 Interferometric SAR Coherence. Remote Sens. 2020, 12, 1560. [Google Scholar] [CrossRef]
- Bouaraba, A.; Belhadj-Aissa, A.; Closson, D. Man-Made Change Detection Using High-Resolution Cosmo-SkyMed SAR Interferometry. Arab. J. Sci. Eng. 2016, 41, 201–208. [Google Scholar] [CrossRef]
- Le, T.T.; Froger, J.-L.; Baghdadi, N.; Ho Tong Minh, D. Volcanic Eruption Monitoring Using Coherence Change Detection Matrix. In Proceedings of the Igarss 2020—2020 IEEE International Geoscience and Remote Sensing Symposium, Waikoloa, HI, USA, 26 September–2 October 2020; IEEE: New York, NY, USA, 2020; pp. 324–327. [Google Scholar]
- Wahl, D.E.; Yocky, D.A.; Jakowatz, C.V.; Simonson, K.M. A New Maximum-Likelihood Change Estimator for Two-Pass SAR Coherent Change Detection. IEEE Trans. Geosci. Remote Sens. 2016, 54, 2460–2469. [Google Scholar] [CrossRef]
- Dogan, O.; Perissin, D. Detection of Multitransition Abrupt Changes in Multitemporal SAR Images. IEEE J. Sel. Top. Appl. Earth Obs. Remote Sens. 2014, 7, 3239–3247. [Google Scholar] [CrossRef]
- Ma, Y.; Wu, H.; Wang, L.; Huang, B.; Ranjan, R.; Zomaya, A.; Jie, W. Remote Sensing Big Data Computing: Challenges and Opportunities. Future Gener. Comput. Syst. 2015, 51, 47–60. [Google Scholar] [CrossRef] [Green Version]
- Sun, A.Y.; Scanlon, B.R. How Can Big Data and Machine Learning Benefit Environment and Water Management: A Survey of Methods, Applications, and Future Directions. Environ. Res. Lett. 2019, 14, 073001. [Google Scholar] [CrossRef]
- Zhang, J. Multi-Source Remote Sensing Data Fusion: Status and Trends. Int. J. Image Data Fusion 2010, 1, 5–24. [Google Scholar] [CrossRef] [Green Version]
- Pohl, C.; Van Genderen, J.L. Review Article Multisensor Image Fusion in Remote Sensing: Concepts, Methods and Applications. Int. J. Remote Sens. 1998, 19, 823–854. [Google Scholar] [CrossRef] [Green Version]
- Hussain, M.; Chen, D.; Cheng, A.; Wei, H.; Stanley, D. Change Detection from Remotely Sensed Images: From Pixel-Based to Object-Based Approaches. ISPRS J. Photogramm. Remote Sens. 2013, 80, 91–106. [Google Scholar] [CrossRef]
- Huang, C.; Song, K.; Kim, S.; Townshend, J.R.G.; Davis, P.; Masek, J.G.; Goward, S.N. Use of a Dark Object Concept and Support Vector Machines to Automate Forest Cover Change Analysis. Remote Sens. Environ. 2008, 112, 970–985. [Google Scholar] [CrossRef]
- Mo, D.; Lin, H.; Li, J.; Sun, H.; Zhang, Z.; Xiong, Y. A SVM-Based Change Detection Method from Bi-Temporal Remote Sensing Images in Forest Area. In Proceedings of the First International Workshop on Knowledge Discovery and Data Mining (WKDD 2008), Adelaide, Australia, 23–24 January 2008; pp. 209–212. [Google Scholar]
- Mountrakis, G.; Im, J.; Ogole, C. Support Vector Machines in Remote Sensing: A Review. ISPRS J. Photogramm. Remote Sens. 2011, 66, 247–259. [Google Scholar] [CrossRef]
- Lyu, H.; Lu, H.; Mou, L. Learning a Transferable Change Rule from a Recurrent Neural Network for Land Cover Change Detection. Remote Sens. 2016, 8, 506. [Google Scholar] [CrossRef] [Green Version]
- Gong, M.; Yang, H.; Zhang, P. Feature Learning and Change Feature Classification Based on Deep Learning for Ternary Change Detection in SAR Images. ISPRS J. Photogramm. Remote Sens. 2017, 129, 212–225. [Google Scholar] [CrossRef]
- Liu, X.; Lathrop, R.G. Urban Change Detection Based on an Artificial Neural Network. Int. J. Remote Sens. 2002, 23, 2513–2518. [Google Scholar] [CrossRef]
- Breiman, L. Random Forests. Mach. Learn. 2001, 45, 5–32. [Google Scholar] [CrossRef] [Green Version]
- Belgiu, M.; Drăguţ, L. Random Forest in Remote Sensing: A Review of Applications and Future Directions. ISPRS J. Photogramm. Remote Sens. 2016, 114, 24–31. [Google Scholar] [CrossRef]
- Feng, Q.; Liu, J.; Gong, J. Urban Flood Mapping Based on Unmanned Aerial Vehicle Remote Sensing and Random Forest Classifier—A Case of Yuyao, China. Water 2015, 7, 1437–1455. [Google Scholar] [CrossRef]
- Chen, T.; Guestrin, C. XGBoost: A Scalable Tree Boosting System. In Proceedings of the 22nd ACM SIGKDD International Conference on Knowledge Discovery and Data Mining, San Francisco, CA, USA, 13–17 August 2016; Association for Computing Machinery: New York, NY, USA, 2016; pp. 785–794. [Google Scholar]
- Wyner, A.J.; Olson, M.; Bleich, J.; Mease, D. Explaining the Success of AdaBoost and Random Forests as Interpolating Classifiers. J. Mach. Learn. Res. 2017, 18, 1558–1590. [Google Scholar]
- Lei, Y.; Liu, X.; Shi, J.; Lei, C.; Wang, J. Multiscale Superpixel Segmentation With Deep Features for Change Detection. IEEE Access 2019, 7, 36600–36616. [Google Scholar] [CrossRef]
- Du, B.; Ru, L.; Wu, C.; Zhang, L. Unsupervised Deep Slow Feature Analysis for Change Detection in Multi-Temporal Remote Sensing Images. IEEE Trans. Geosci. Remote Sens. 2019, 57, 9976–9992. [Google Scholar] [CrossRef] [Green Version]
- Touazi, A.; Bouchaffra, D. A K-Nearest Neighbor Approach to Improve Change Detection from Remote Sensing: Application to Optical Aerial Images. In Proceedings of the 2015 15th International Conference on Intelligent Systems Design and Applications (ISDA), Marrakech, Morocco, 14–16 December 2015; pp. 98–103. [Google Scholar]
- Roy, M.; Ghosh, S.; Ghosh, A. A Novel Approach for Change Detection of Remotely Sensed Images Using Semi-Supervised Multiple Classifier System. Inf. Sci. 2014, 269, 35–47. [Google Scholar] [CrossRef]
- Roy, M.; Ghosh, S.; Ghosh, A. A Neural Approach Under Active Learning Mode for Change Detection in Remotely Sensed Images. IEEE J. Sel. Top. Appl. Earth Obs. Remote Sens. 2014, 7, 1200–1206. [Google Scholar] [CrossRef]
- Hedjam, R.; Abdesselam, A.; Melgani, F. Change Detection from Unlabeled Remote Sensing Images Using SIAMESE ANN. In Proceedings of the IGARSS 2019—2019 IEEE International Geoscience and Remote Sensing Symposium, Yokohama, Japan, 28 July–2 August 2019; pp. 1530–1533. [Google Scholar]
- Patra, S.; Ghosh, S.; Ghosh, A. Change Detection of Remote Sensing Images with Semi-Supervised Multilayer Perceptron. Fundam. Inform. 2008, 84, 429–442. [Google Scholar]
- Ma, L.; Liu, Y.; Zhang, X.; Ye, Y.; Yin, G.; Johnson, B.A. Deep Learning in Remote Sensing Applications: A Meta-Analysis and Review. ISPRS J. Photogramm. Remote Sens. 2019, 152, 166–177. [Google Scholar] [CrossRef]
- Potin, P.; Rosich, B.; Roeder, J.; Bargellini, P. Sentinel-1 Mission Operations Concept. In Proceedings of the 2014 IEEE International Geoscience and Remote Sensing Symposium (Igarss), Quebec City, QC, Canada, 13–18 July 2014; IEEE: New York, NY, USA, 2014; pp. 1465–1468. [Google Scholar]
- Ito, Y.; Hosokawa, M. Damage Estimation Model Using Temporal Coherence Ratio. In Proceedings of the IEEE International Geoscience and Remote Sensing Symposium, Toronto, ON, Canada, 24–28 June 2002; Volume 5, pp. 2859–2861. [Google Scholar]
- Ge, P.; Gokon, H.; Meguro, K. A Review on Synthetic Aperture Radar-Based Building Damage Assessment in Disasters. Remote Sens. Environ. 2020, 240, 111693. [Google Scholar] [CrossRef]
- Lee, H.; Liu, J.G. Analysis of Topographic Decorrelation in SAR Interferometry Using Ratio Coherence Imagery. IEEE Trans. Geosci. Remote Sens. 2001, 39, 223–232. [Google Scholar] [CrossRef]
- Jung, J.; Kim, D.; Yun, S.; Lavalle, M. Damage Mapping Based on Coherence Model Using Multi-Temporal Polarimetric-Interferometric UAVSAR Data. In Proceedings of the 2017 IEEE International Geoscience and Remote Sensing Symposium (IGARSS), Fort Worth, TX, USA, 23–28 July 2017; pp. 189–192. [Google Scholar]
- Breiman, L.; Friedman, J.H.; Olshen, R.A.; Stone, C.J. Classification and Regression Trees; Routledge: New York, NY, USA, 2017; ISBN 978-1-315-13947-0. [Google Scholar]
- Fernández-Delgado, M.; Cernadas, E.; Barro, S.; Amorim, D. Do We Need Hundreds of Classifiers to Solve Real World Classification Problems? J. Mach. Learn. Res. 2014, 15, 3133–3181. [Google Scholar]
- Bernard, S.; Heutte, L.; Adam, S. A Study of Strength and Correlation in Random Forests. In Advanced Intelligent Computing Theories and Applications; Huang, D.-S., McGinnity, M., Heutte, L., Zhang, X.-P., Eds.; Communications in Computer and Information Science; Springer: Berlin/Heidelberg, Germany, 2010; Volume 93, pp. 186–191. ISBN 978-3-642-14830-9. [Google Scholar]
- Liaw, A.; Wiener, M. Classification and Regression by RandomForest. R News 2002, 2, 18–22. [Google Scholar]
- Thornton, C.; Hutter, F.; Hoos, H.H.; Leyton-Brown, K. Auto-WEKA: Combined Selection and Hyperparameter Optimization of Classification Algorithms. In Proceedings of the 19th ACM SIGKDD International Conference on Knowledge Discovery and Data Mining, Chicago, IL, USA, 11–14 August 2013; ACM: Chicago, IL, USA, 2013; pp. 847–855. [Google Scholar]
- Akiba, T.; Sano, S.; Yanase, T.; Ohta, T.; Koyama, M. Optuna: A Next-Generation Hyperparameter Optimization Framework. In Proceedings of the 25th ACM SIGKDD International Conference on Knowledge Discovery & Data Mining, Anchorage, AK, USA, 4–8 August 2019; ACM: Anchorage, AK, USA, 2019; pp. 2623–2631. [Google Scholar]
- Scornet, E. Tuning Parameters in Random Forests. ESAIM Proc. Surv. 2017, 60, 144–162. [Google Scholar] [CrossRef] [Green Version]
- Victoria, A.H.; Maragatham, G. Automatic Tuning of Hyperparameters Using Bayesian Optimization. Evol. Syst. 2021, 12, 217–223. [Google Scholar] [CrossRef]
- Bergstra, J.; Bengio, Y. Random Search for Hyper-Parameter Optimization. J. Mach. Learn. Res. 2012, 13, 281–305. [Google Scholar]
- Montaldo, N.; Oren, R. Changing Seasonal Rainfall Distribution With Climate Directs Contrasting Impacts at Evapotranspiration and Water Yield in the Western Mediterranean Region. Earth’s Future 2018, 6, 841–856. [Google Scholar] [CrossRef]
- Wagner, W.; Freeman, V.; Cao, S.; Matgen, P.; Chini, M.; Salamon, P.; McCormick, N.; Martinis, S.; Bauer-Marschallinger, B.; Navacchi, C.; et al. Data Processing Architectures for Monitoring Floods Using Sentinel-1. In Proceedings of the 24th ISPRS Congress, Nice, France, 4–10 July 2020; pp. 641–648. [Google Scholar]
- Twele, A.; Martinis, S.; Cao, W.; Plank, S. Automated Flood Mapping and Monitoring Using Sentinel-1 Data. In Proceedings of the ESA Living Planet Symposium 2016, Prague, Czech Republic, 9–13 May 2016; Ouwehand, L., Ed.; Volume SP-740, p. 1. [Google Scholar]
- Martinis, S.; Kuenzer, C.; Twele, A. Flood Studies Using Synthetic Aperture Radar Data. In Remote Sensing Handbook; CRC Press: Boca Raton, FL, USA, 2015; ISBN 978-0-429-08943-5. [Google Scholar]
- Giustarini, L.; Hostache, R.; Kavetski, D.; Chini, M.; Corato, G.; Schlaffer, S.; Matgen, P. Probabilistic Flood Mapping Using Synthetic Aperture Radar Data. IEEE Trans. Geosci. Remote Sens. 2016, 54, 6958–6969. [Google Scholar] [CrossRef]
- Small, D. Flattening Gamma: Radiometric Terrain Correction for SAR Imagery. IEEE Trans. Geosci. Remote Sens. 2011, 49, 3081–3093. [Google Scholar] [CrossRef]
- Franceschetti, G.; Lanari, R. Synthetic Aperture Radar Processing; CRC Press: Boca Raton, FL, USA, 1999; ISBN 978-0-8493-7899-7. [Google Scholar]
- Zhu, J.L.; Wen, J.; Zhang, Y. A New Algorithm for SAR Image Despeckling Using an Enhanced Lee Filter and Median Filter. In Proceedings of the 2013 6th International Congress on Image and Signal Processing (CISP), Hangzhou, China, 16–18 December 2013; Volume 1, pp. 224–228. [Google Scholar]
- STEP—Science Toolbox Exploitation Platform. Available online: http://step.esa.int/main/ (accessed on 4 June 2022).
- Japkowicz, N. The Class Imbalance Problem: Significance and Strategies. In Proceedings of the 2000 International Conference on Artificial Intelligence (ICAI), Las Vegas, NV, USA, 12–15 July 2000; pp. 111–117. [Google Scholar]
- He, H.; Ma, Y. (Eds.) Imbalanced Learning: Foundations, Algorithms, and Applications; John Wiley & Sons, Inc.: Hoboken, NJ, USA, 2013; ISBN 9781-118-07462-6. [Google Scholar]
- Batista, G.E.A.P.A.; Prati, R.C.; Monard, M.C. A Study of the Behavior of Several Methods for Balancing Machine Learning Training Data. SIGKDD Explor. Newsl. 2004, 6, 20–29. [Google Scholar] [CrossRef]
- Chawla, N.V. Data Mining for Imbalanced Datasets: An Overview. In Data Mining and Knowledge Discovery Handbook; Maimon, O., Rokach, L., Eds.; Springer: Boston, MA, USA, 2010; pp. 875–886. ISBN 978-0-387-09823-4. [Google Scholar]
- James, G.; Witten, D.; Hastie, T.; Tibshirani, R. (Eds.) An Introduction to Statistical Learning: With Applications in R; Springer Texts in Statistics; Springer: New York, NY, USA, 2013; ISBN 978-1-4614-7137-0. [Google Scholar]
- Molinaro, A.M.; Simon, R.; Pfeiffer, R.M. Prediction Error Estimation: A Comparison of Resampling Methods. Bioinformatics 2005, 21, 3301–3307. [Google Scholar] [CrossRef] [PubMed] [Green Version]
- Cánovas-García, F.; Alonso-Sarría, F.; Gomariz-Castillo, F.; Oñate-Valdivieso, F. Modification of the Random Forest Algorithm to Avoid Statistical Dependence Problems When Classifying Remote Sensing Imagery. Comput. Geosci. 2017, 103, 1–11. [Google Scholar] [CrossRef] [Green Version]
- Meyer, H.; Reudenbach, C.; Wöllauer, S.; Nauss, T. Importance of Spatial Predictor Variable Selection in Machine Learning Applications—Moving from Data Reproduction to Spatial Prediction. Ecol. Model. 2019, 411, 108815. [Google Scholar] [CrossRef] [Green Version]
Figure 1.
Coherence change tracking scheme using two SAR images acquired before the event (: 18 August 2021; : 24 August 2021) and one after the event (: 30 August 2021). The shown coherence maps are related to the Montiferru area in Sardinia, Italy.
Figure 1.
Coherence change tracking scheme using two SAR images acquired before the event (: 18 August 2021; : 24 August 2021) and one after the event (: 30 August 2021). The shown coherence maps are related to the Montiferru area in Sardinia, Italy.
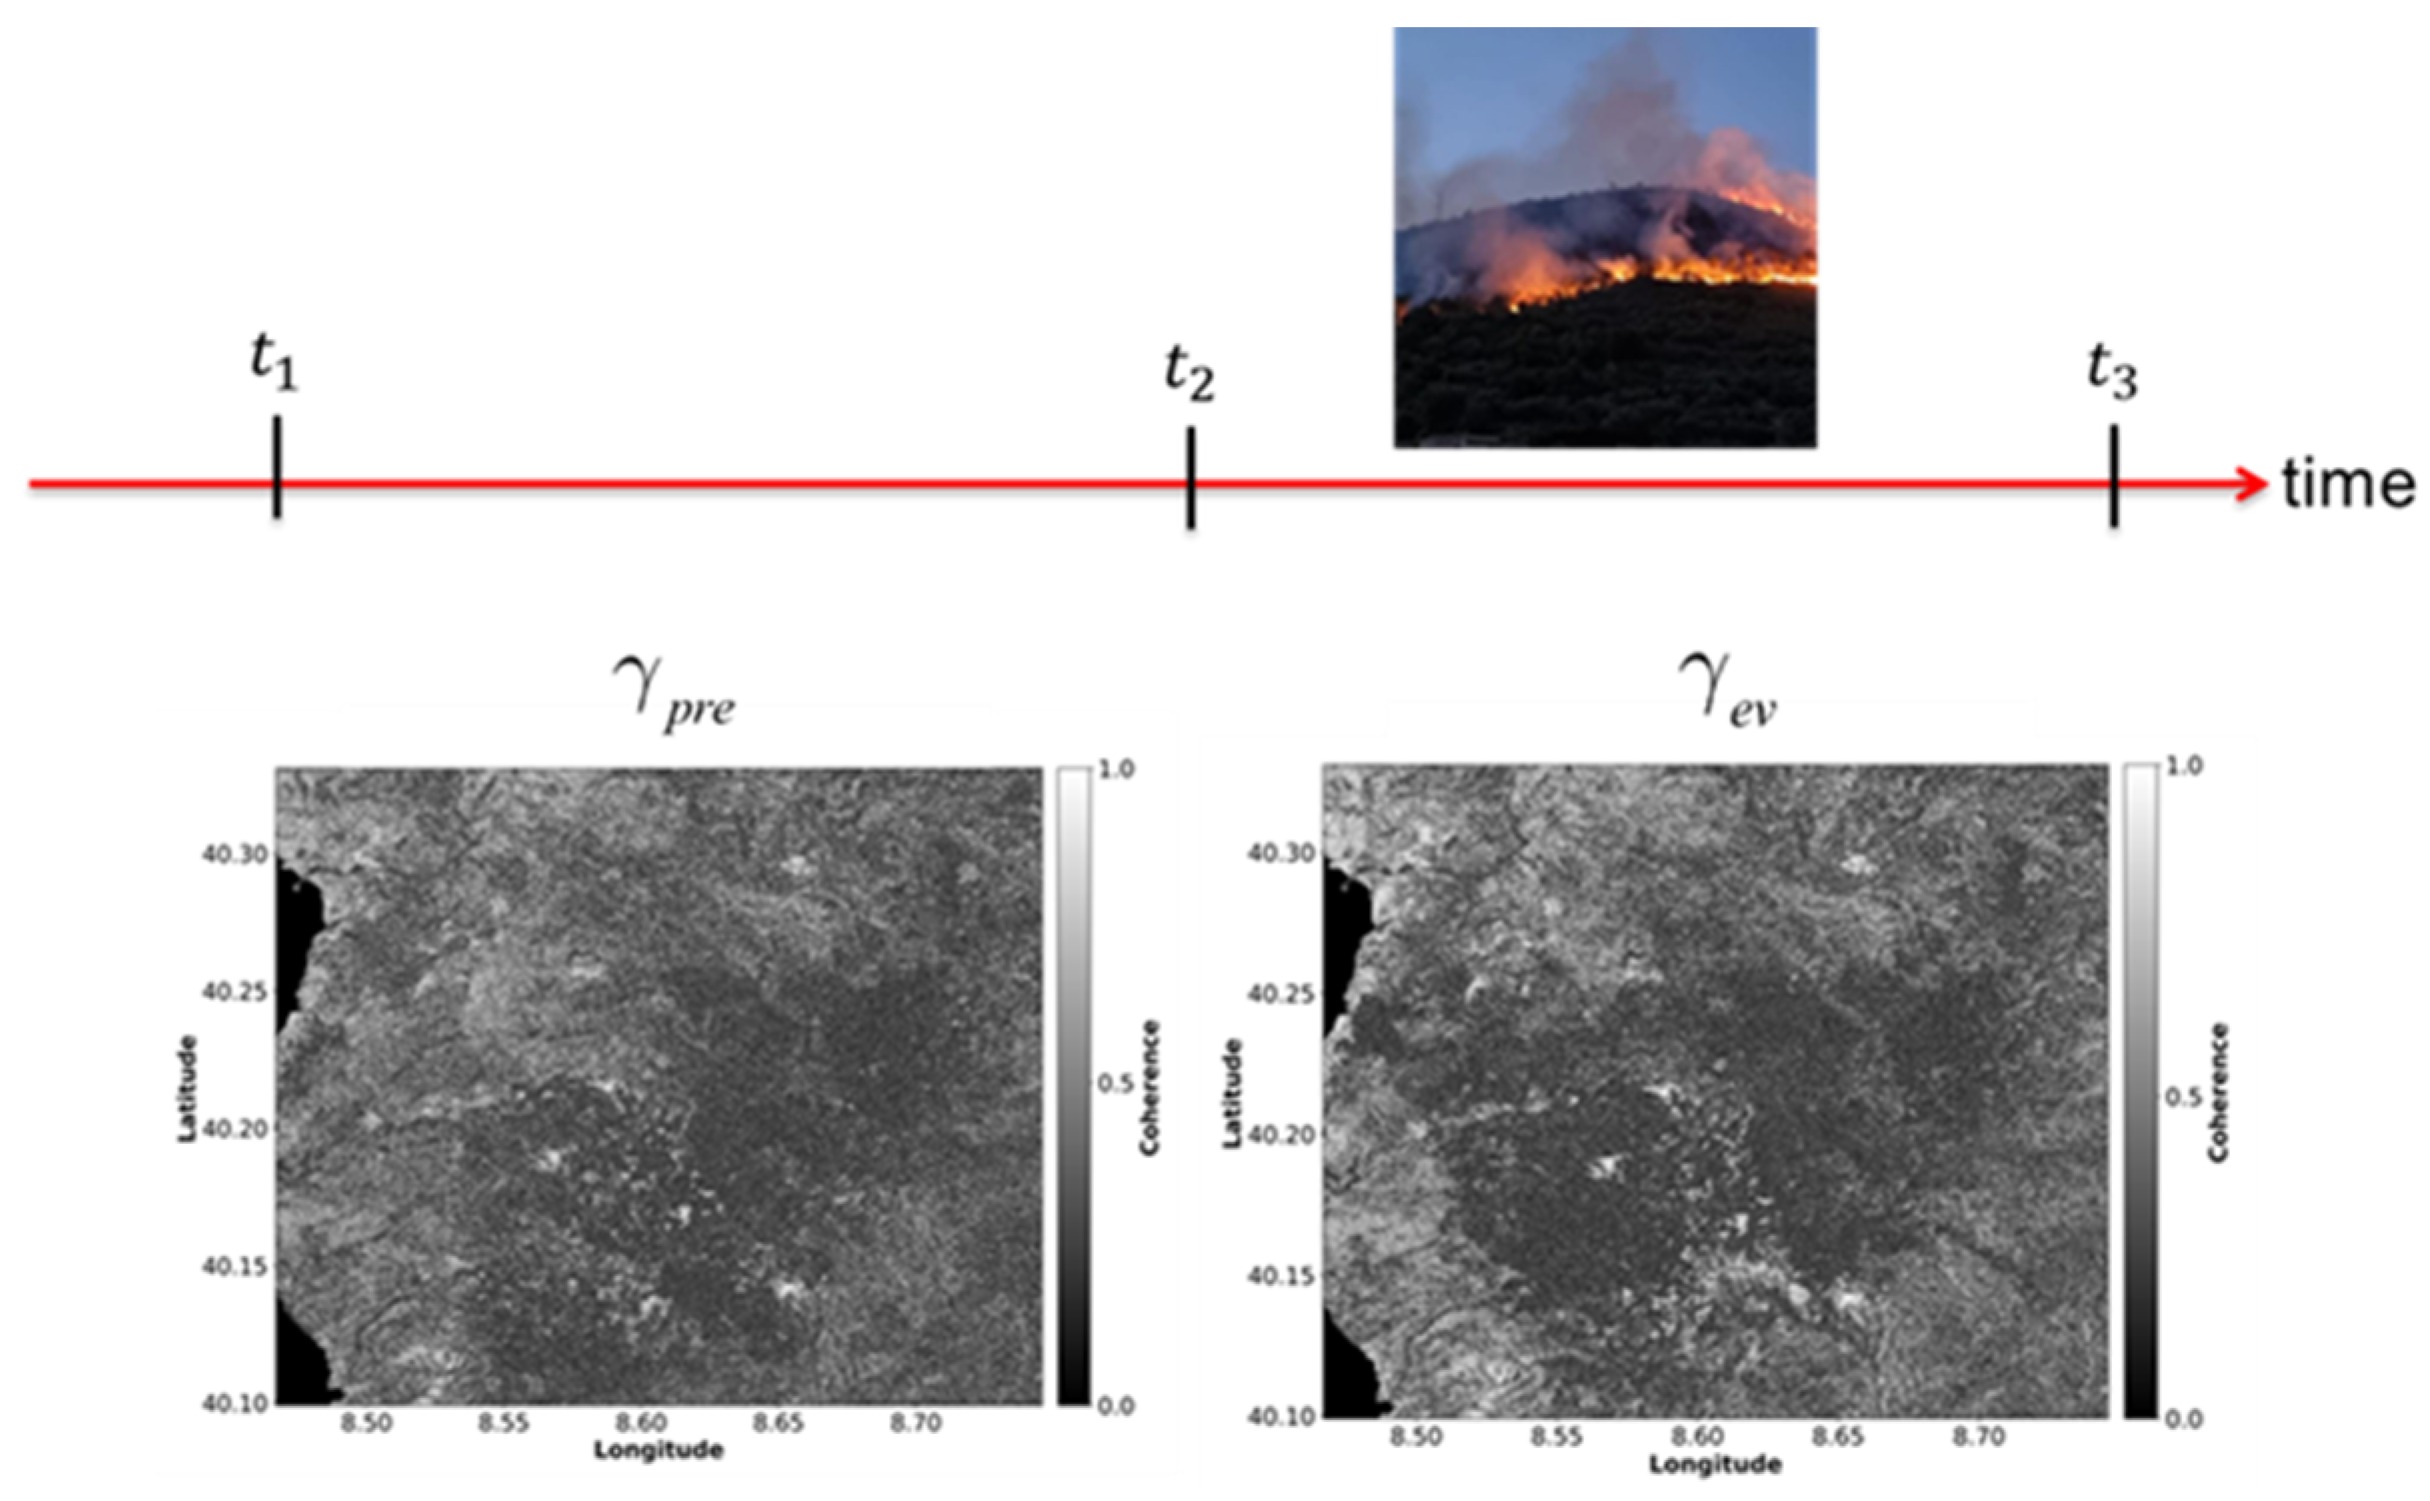
Figure 2.
Coherence change tracking scheme in the multi-pass case.
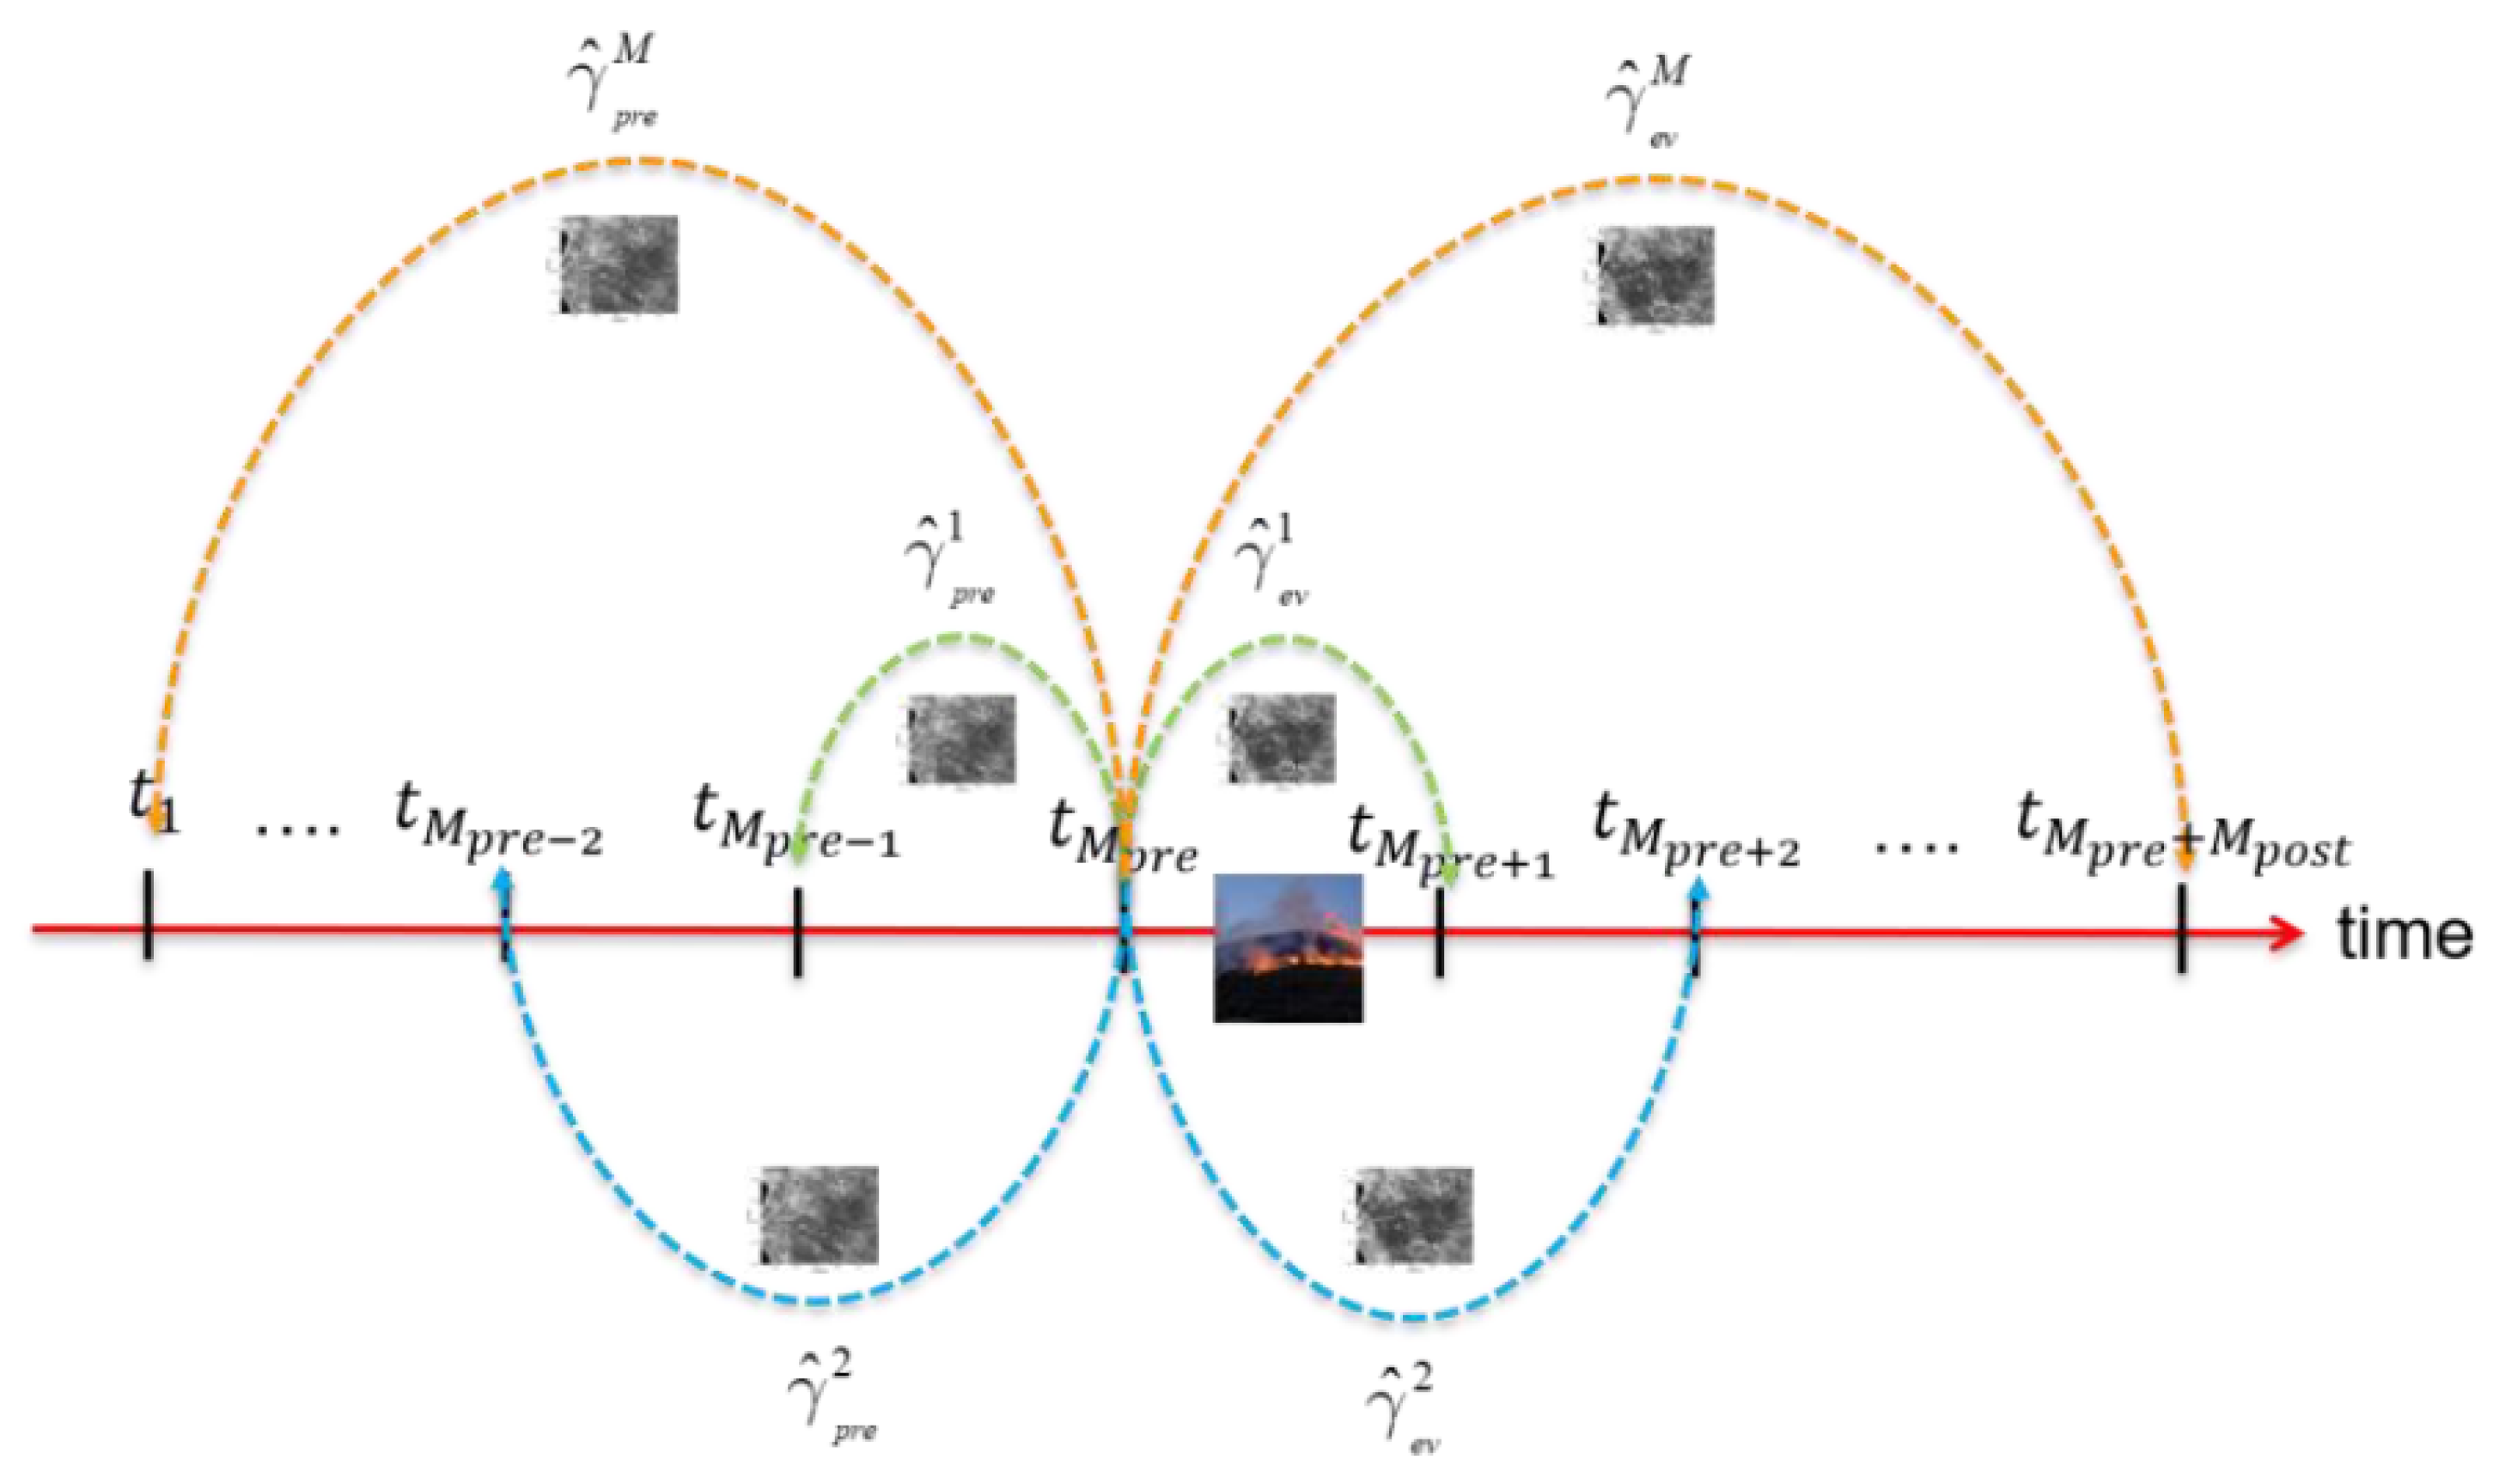
Figure 3.
Simple sketch of a decision tree for binary classification. Split nodes are depicted as circles with features. Leaf nodes are represented as triangles, colored in orange and green for and classes, respectively.
Figure 3.
Simple sketch of a decision tree for binary classification. Split nodes are depicted as circles with features. Leaf nodes are represented as triangles, colored in orange and green for and classes, respectively.

Figure 4.
Example of Breiman’s random forest classifier.
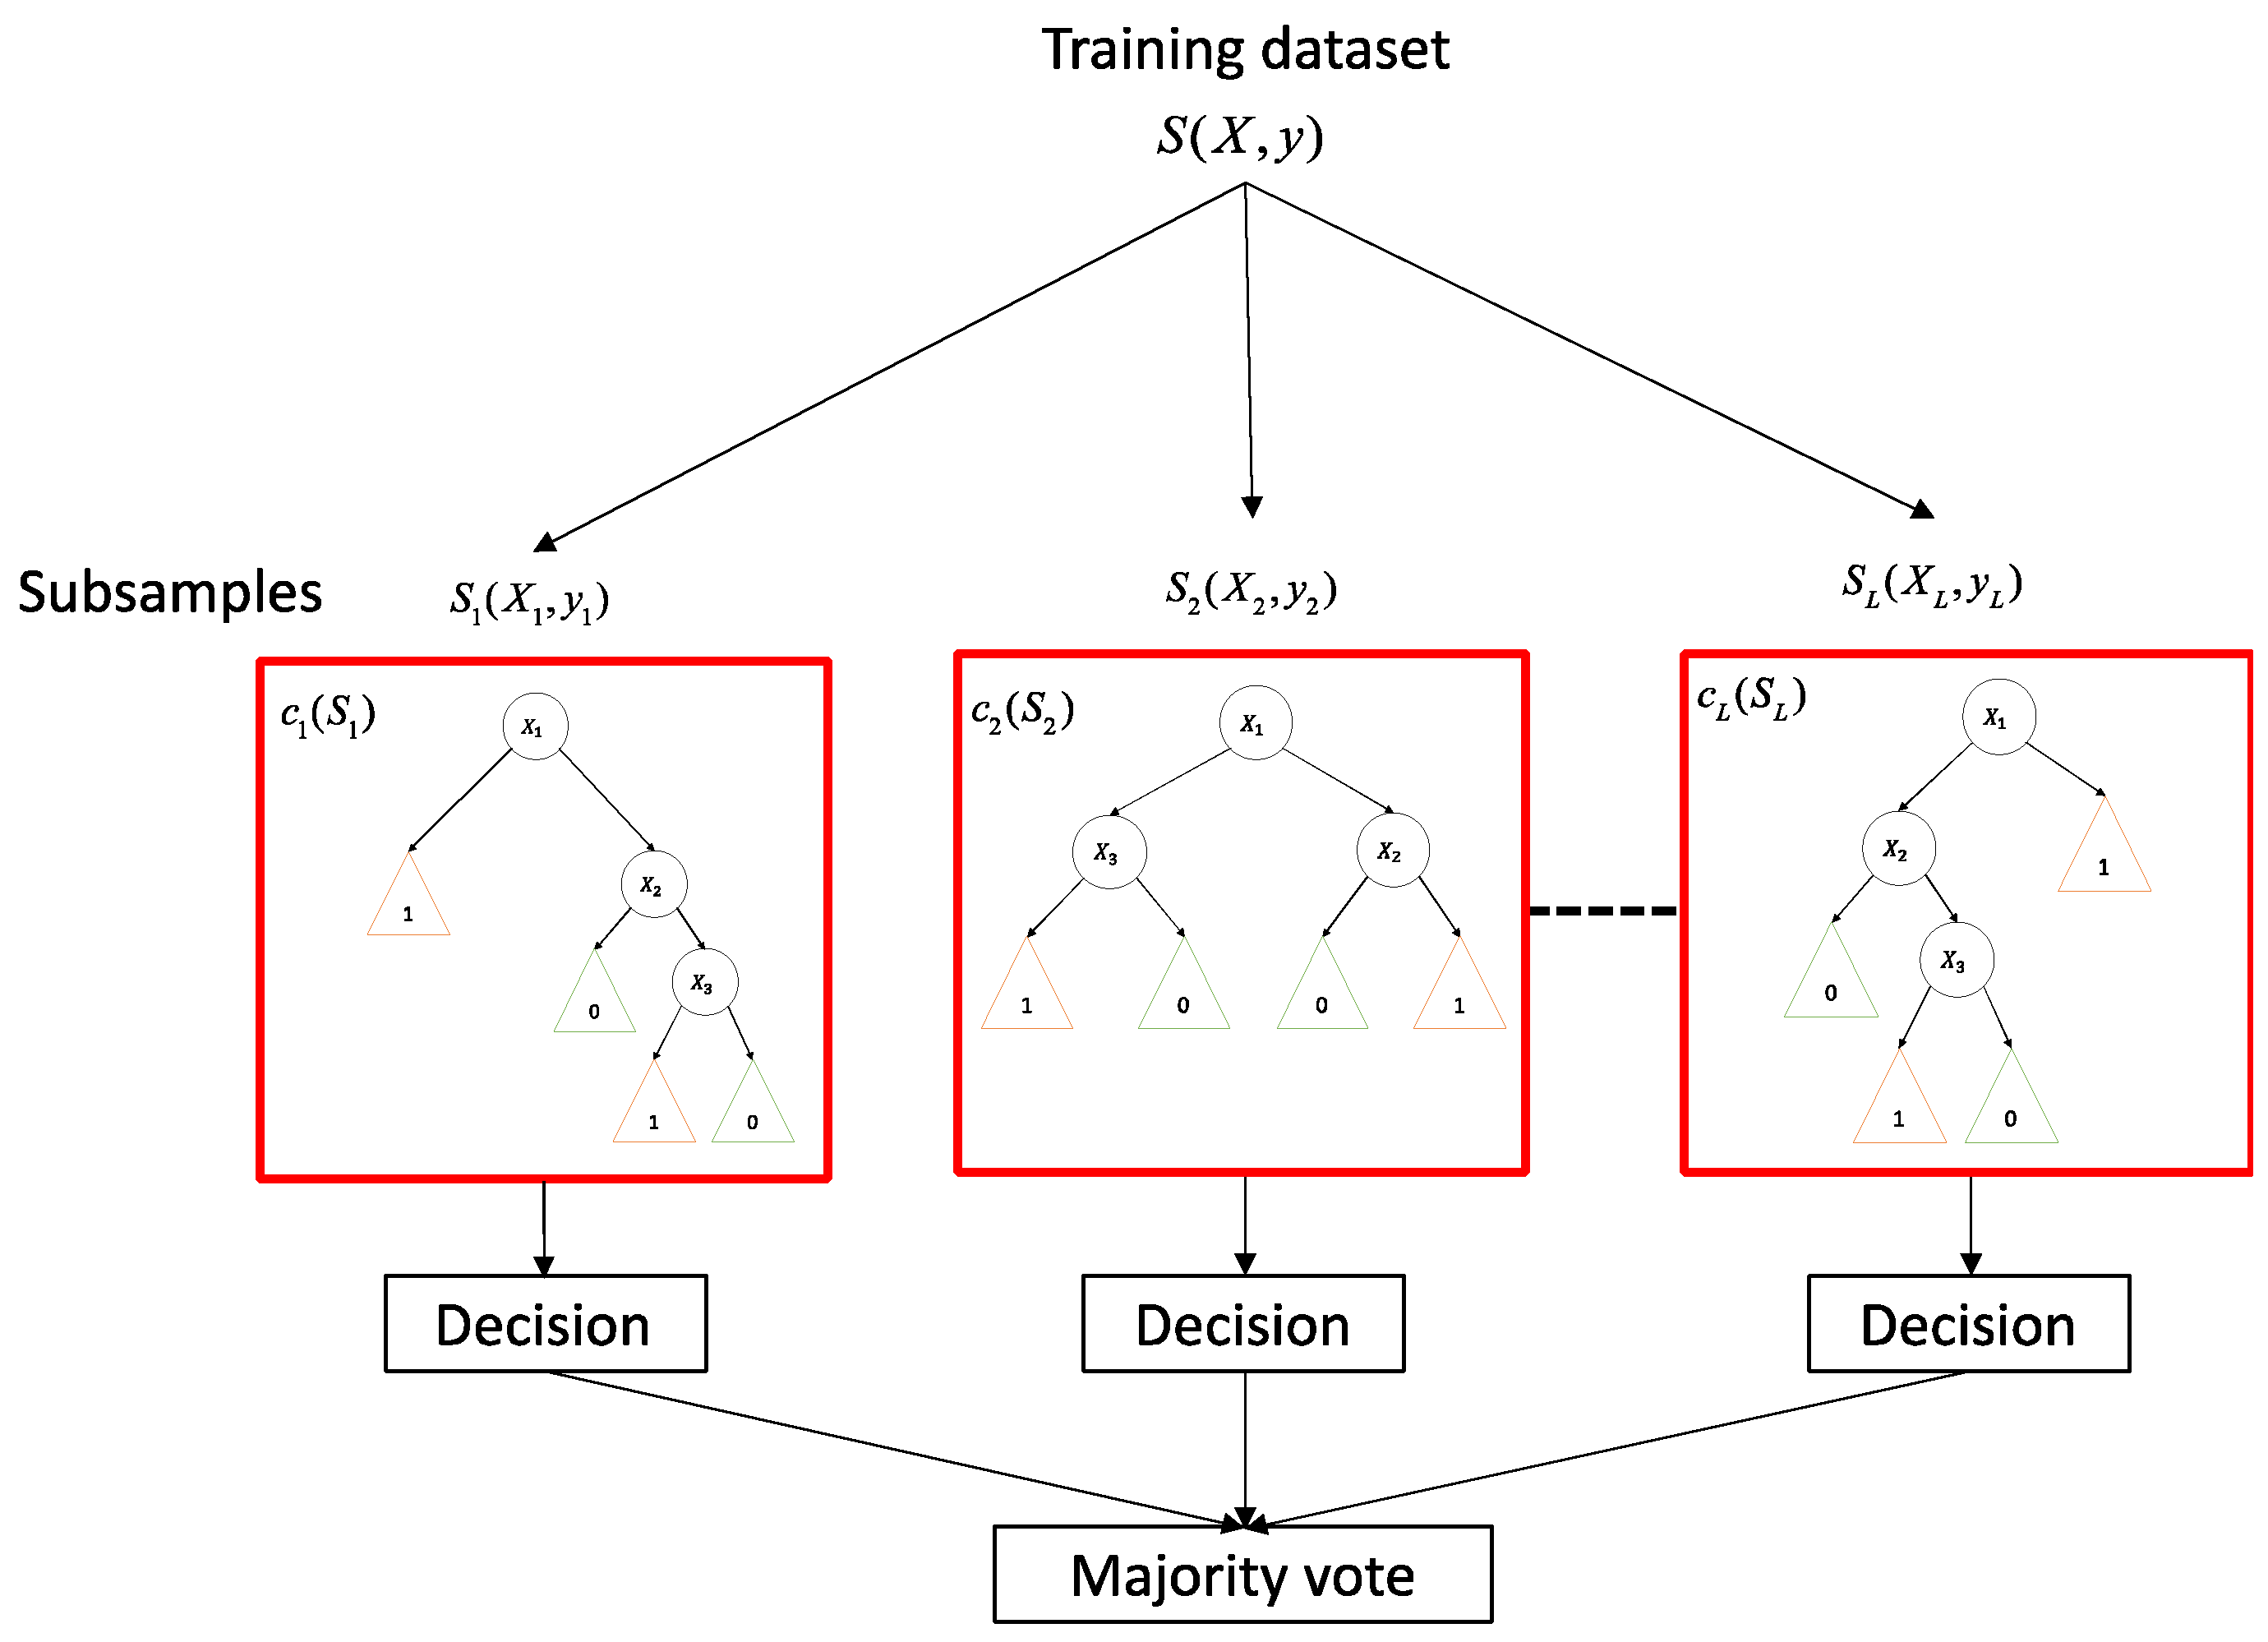
Figure 5.
Sketch of modules of the proposed CD framework.
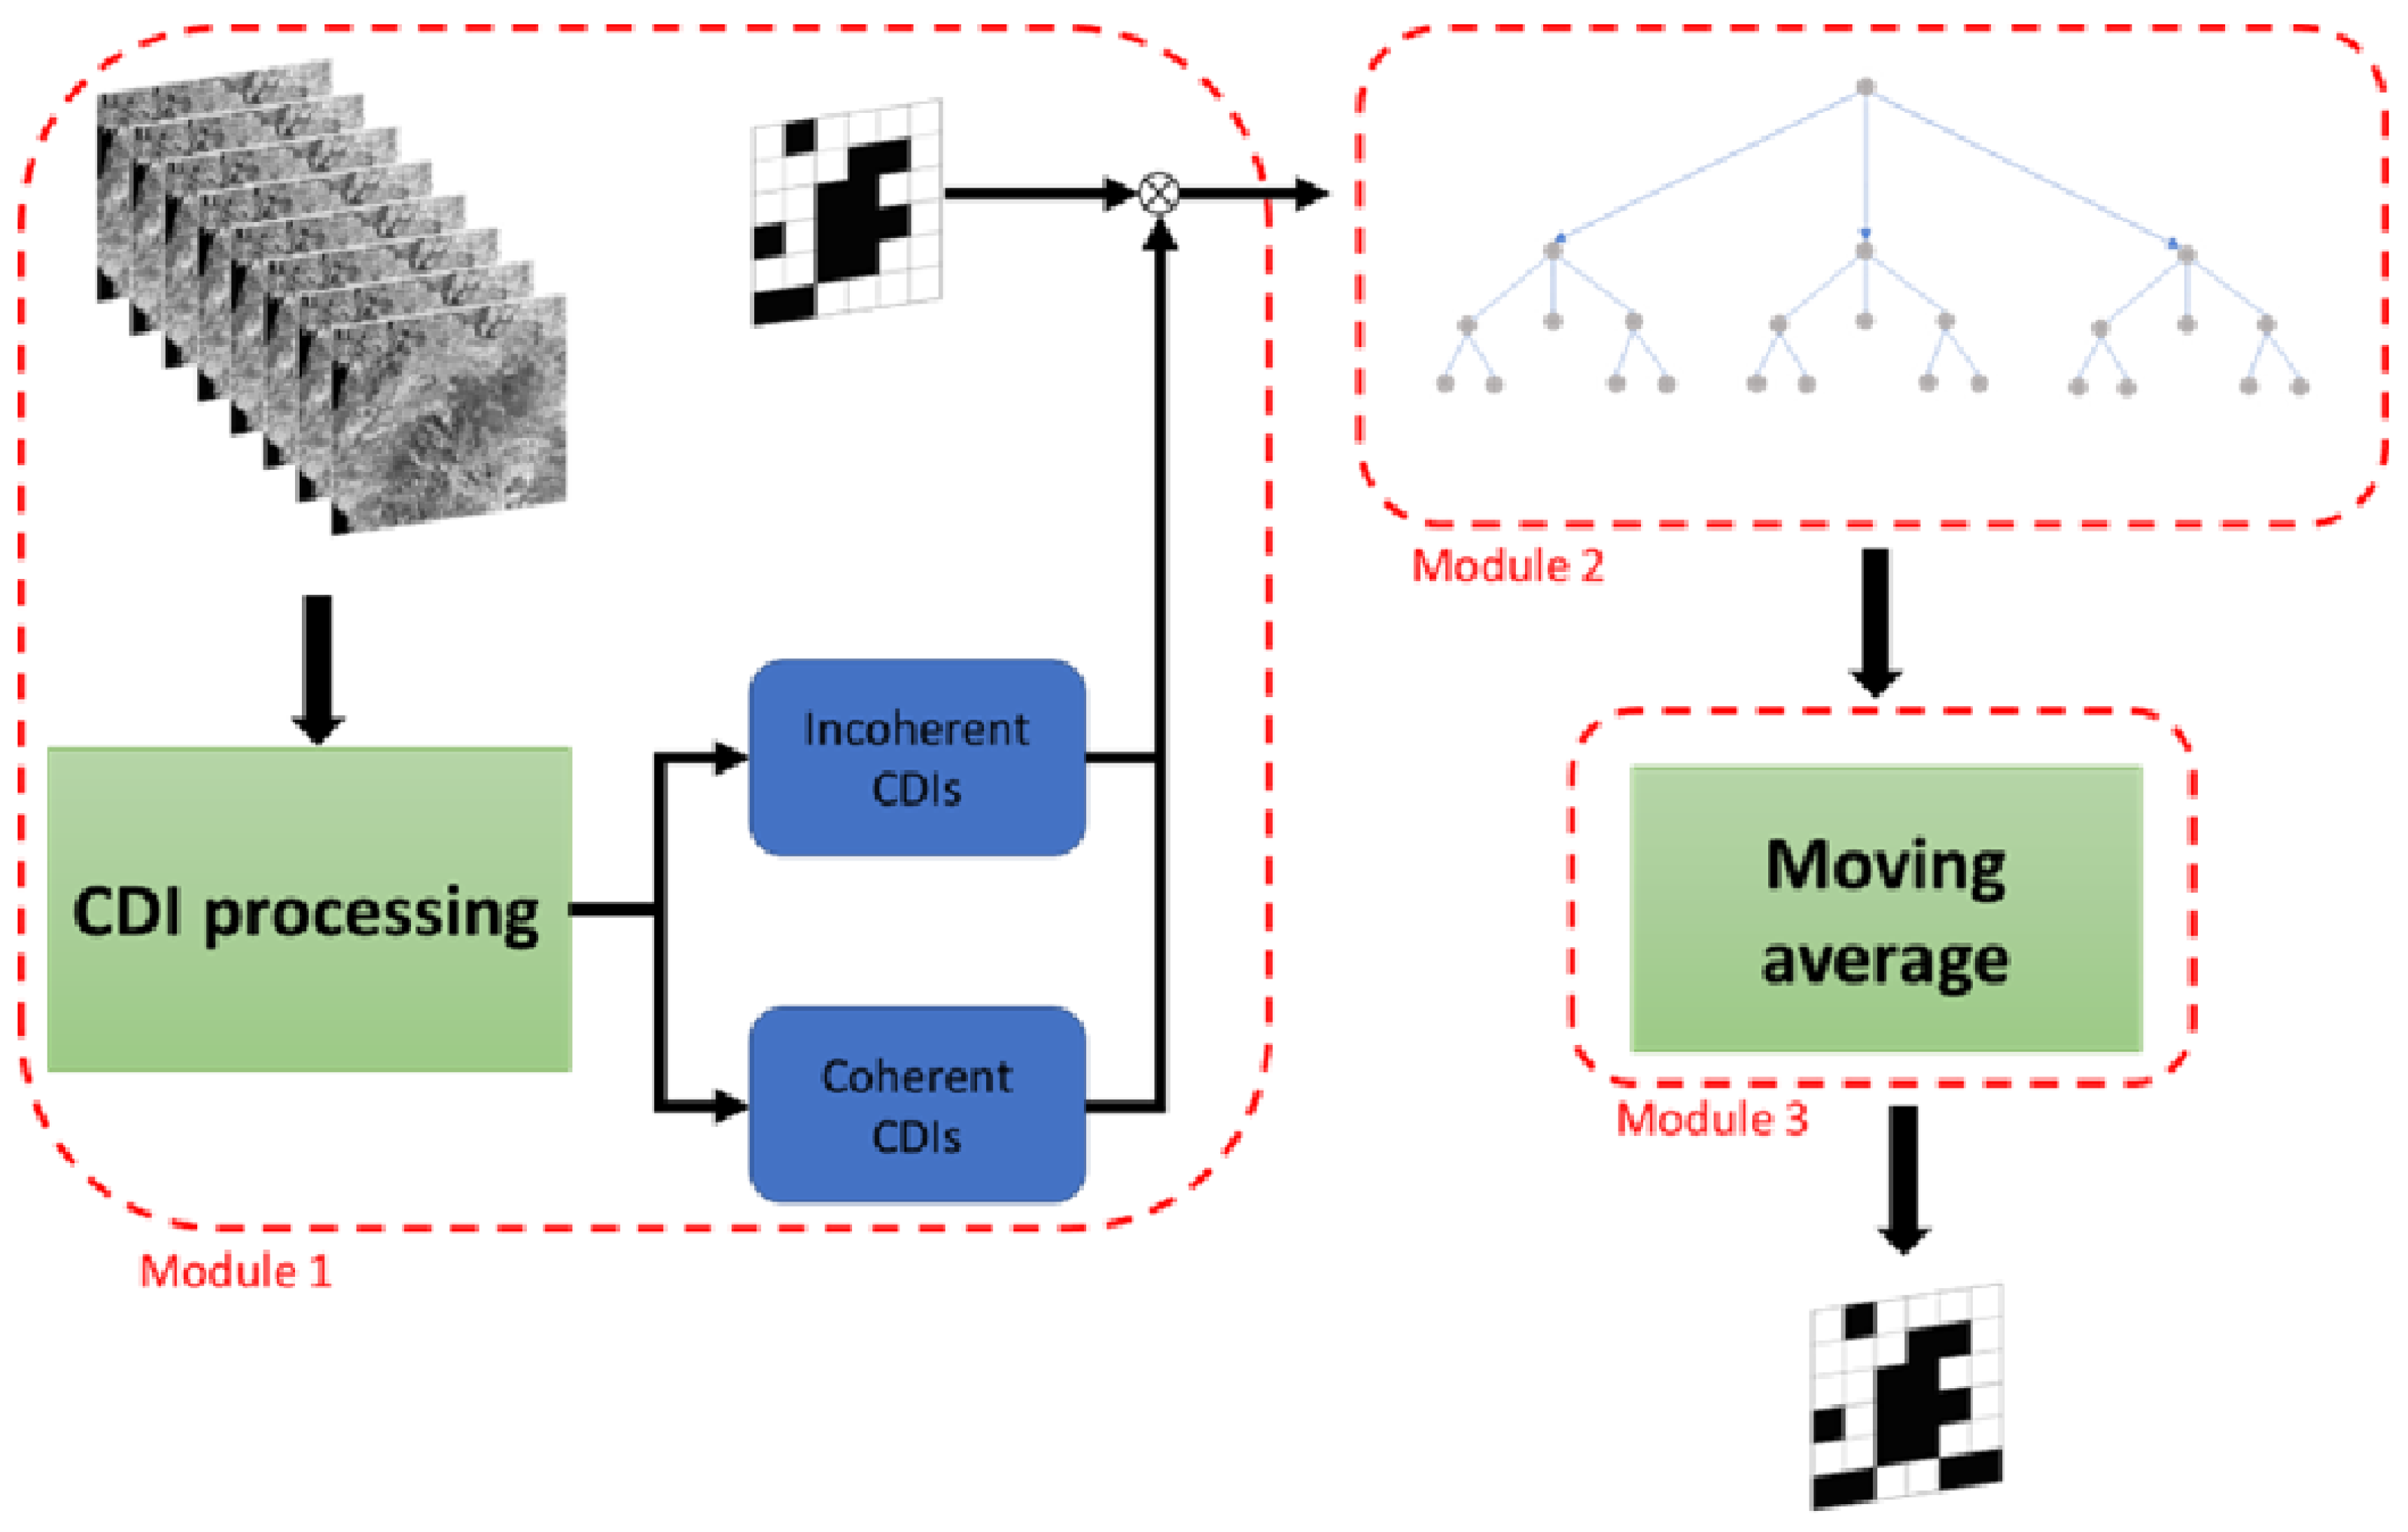
Figure 6.
(A) Geographical map of Sardinia, (B) Sicily, and (C) Southern-eastern sector of Texas coastal area, respectively. The green boxes indicate the Montiferru, Madonie, and Galveston AOIs. The AOIs are zoomed within the insets where the wildfires and flooding perimeter are highlighted in red.
Figure 6.
(A) Geographical map of Sardinia, (B) Sicily, and (C) Southern-eastern sector of Texas coastal area, respectively. The green boxes indicate the Montiferru, Madonie, and Galveston AOIs. The AOIs are zoomed within the insets where the wildfires and flooding perimeter are highlighted in red.
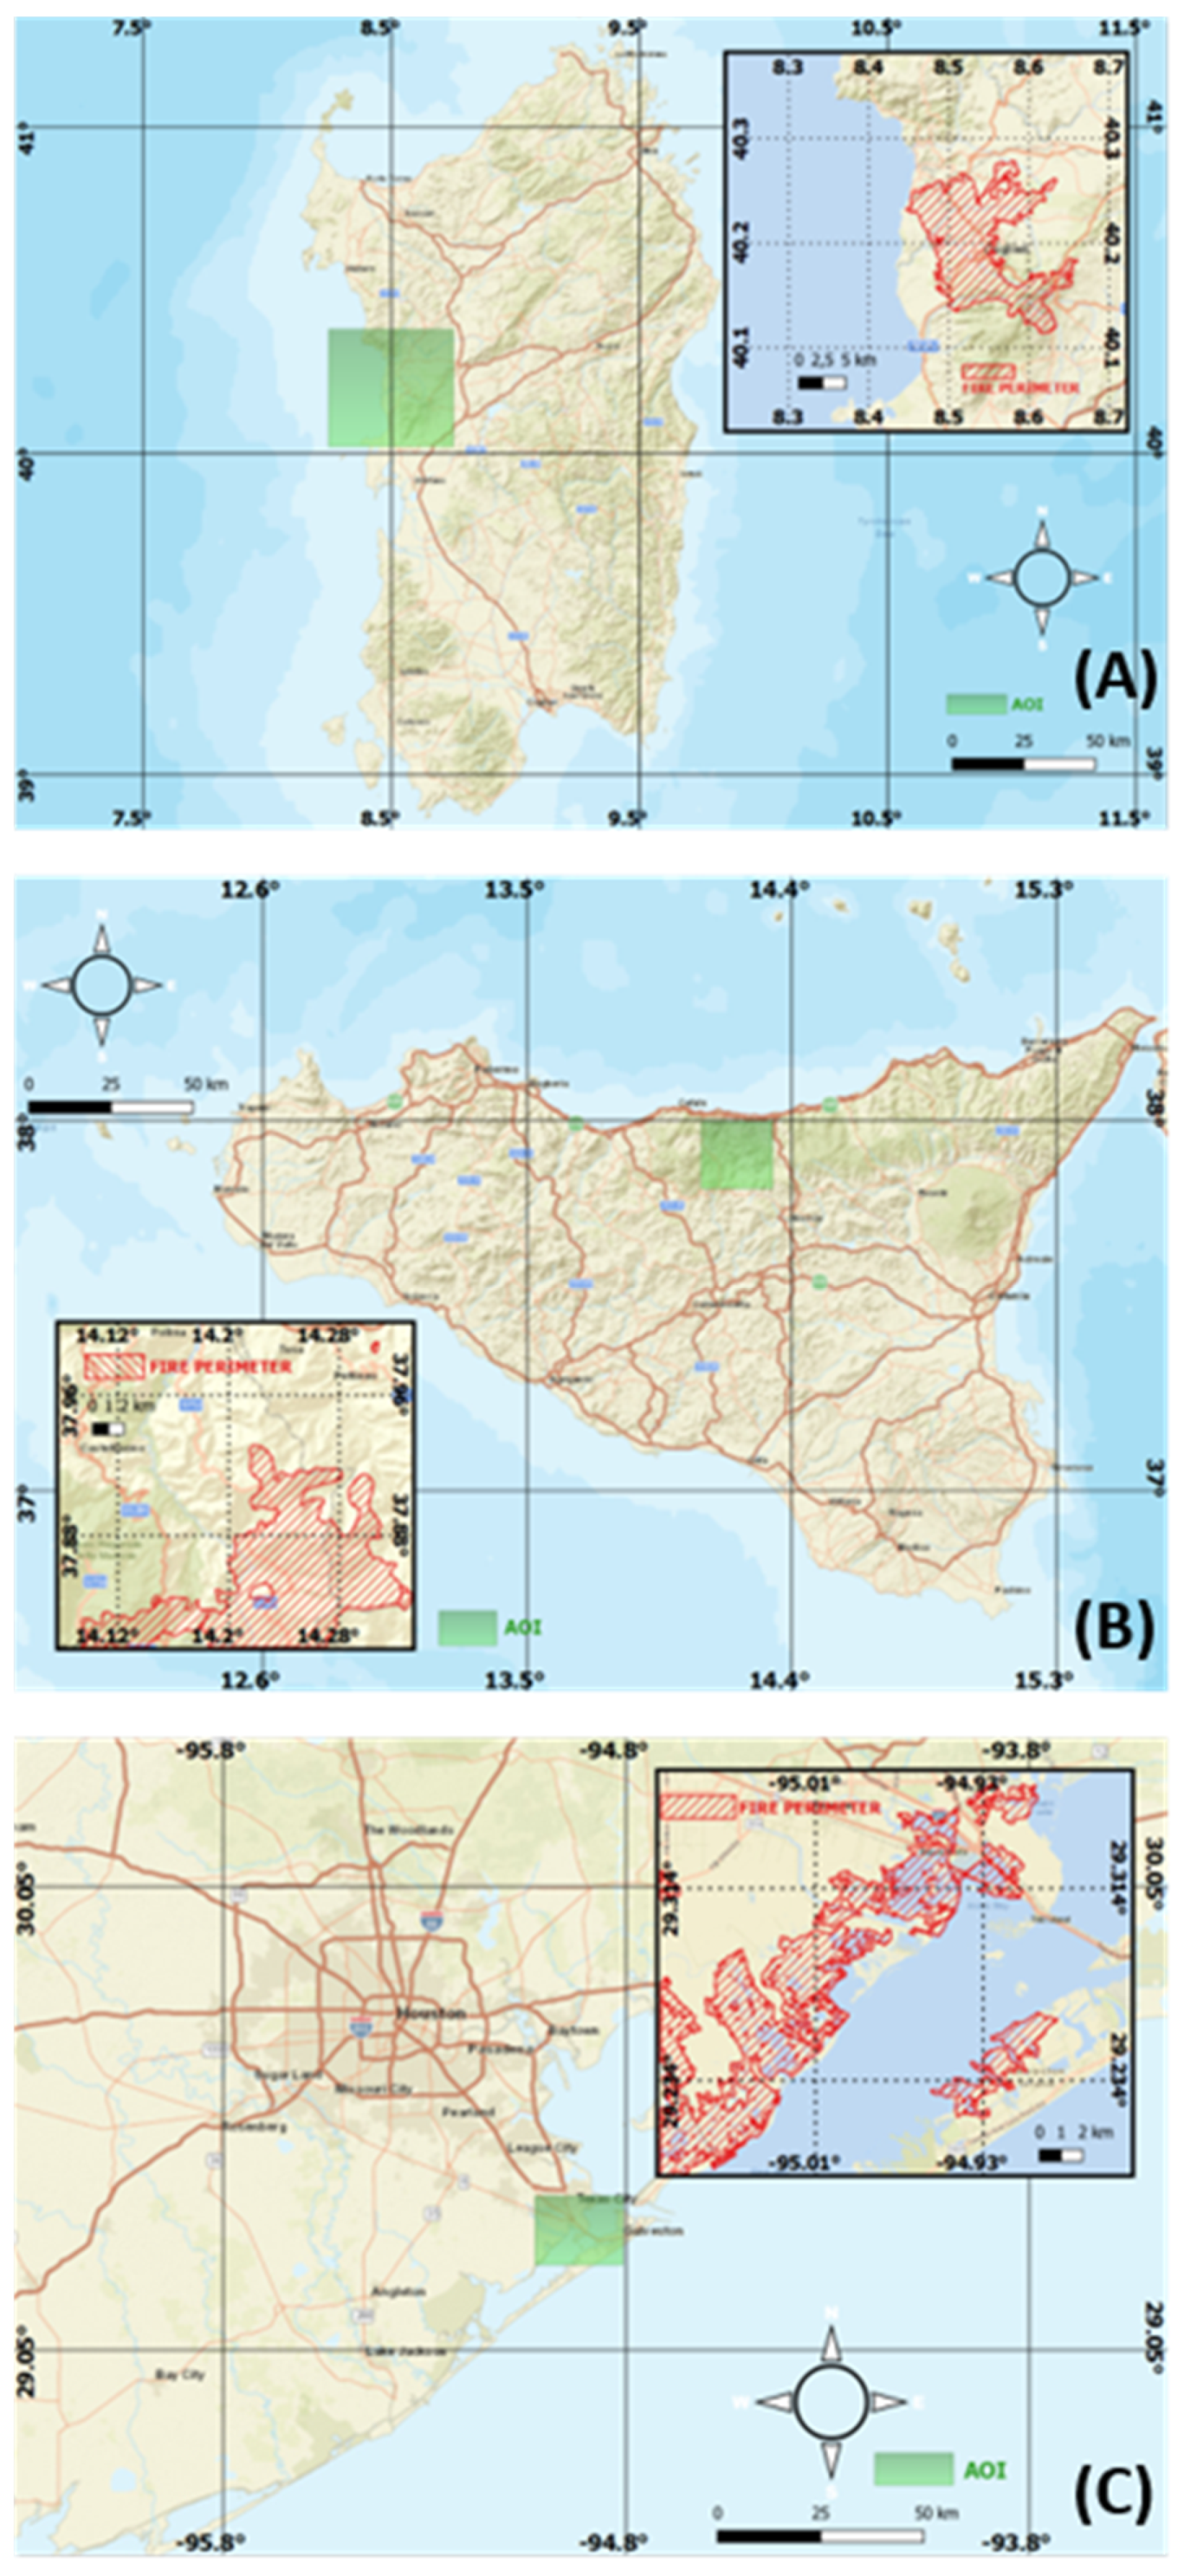
Figure 7.
Sigma naught differences (dB) were computed over the Sardinia AOI for VH polarization. (A–C) Pre-fire event differences. (D–F) Post-fire event differences.
Figure 7.
Sigma naught differences (dB) were computed over the Sardinia AOI for VH polarization. (A–C) Pre-fire event differences. (D–F) Post-fire event differences.
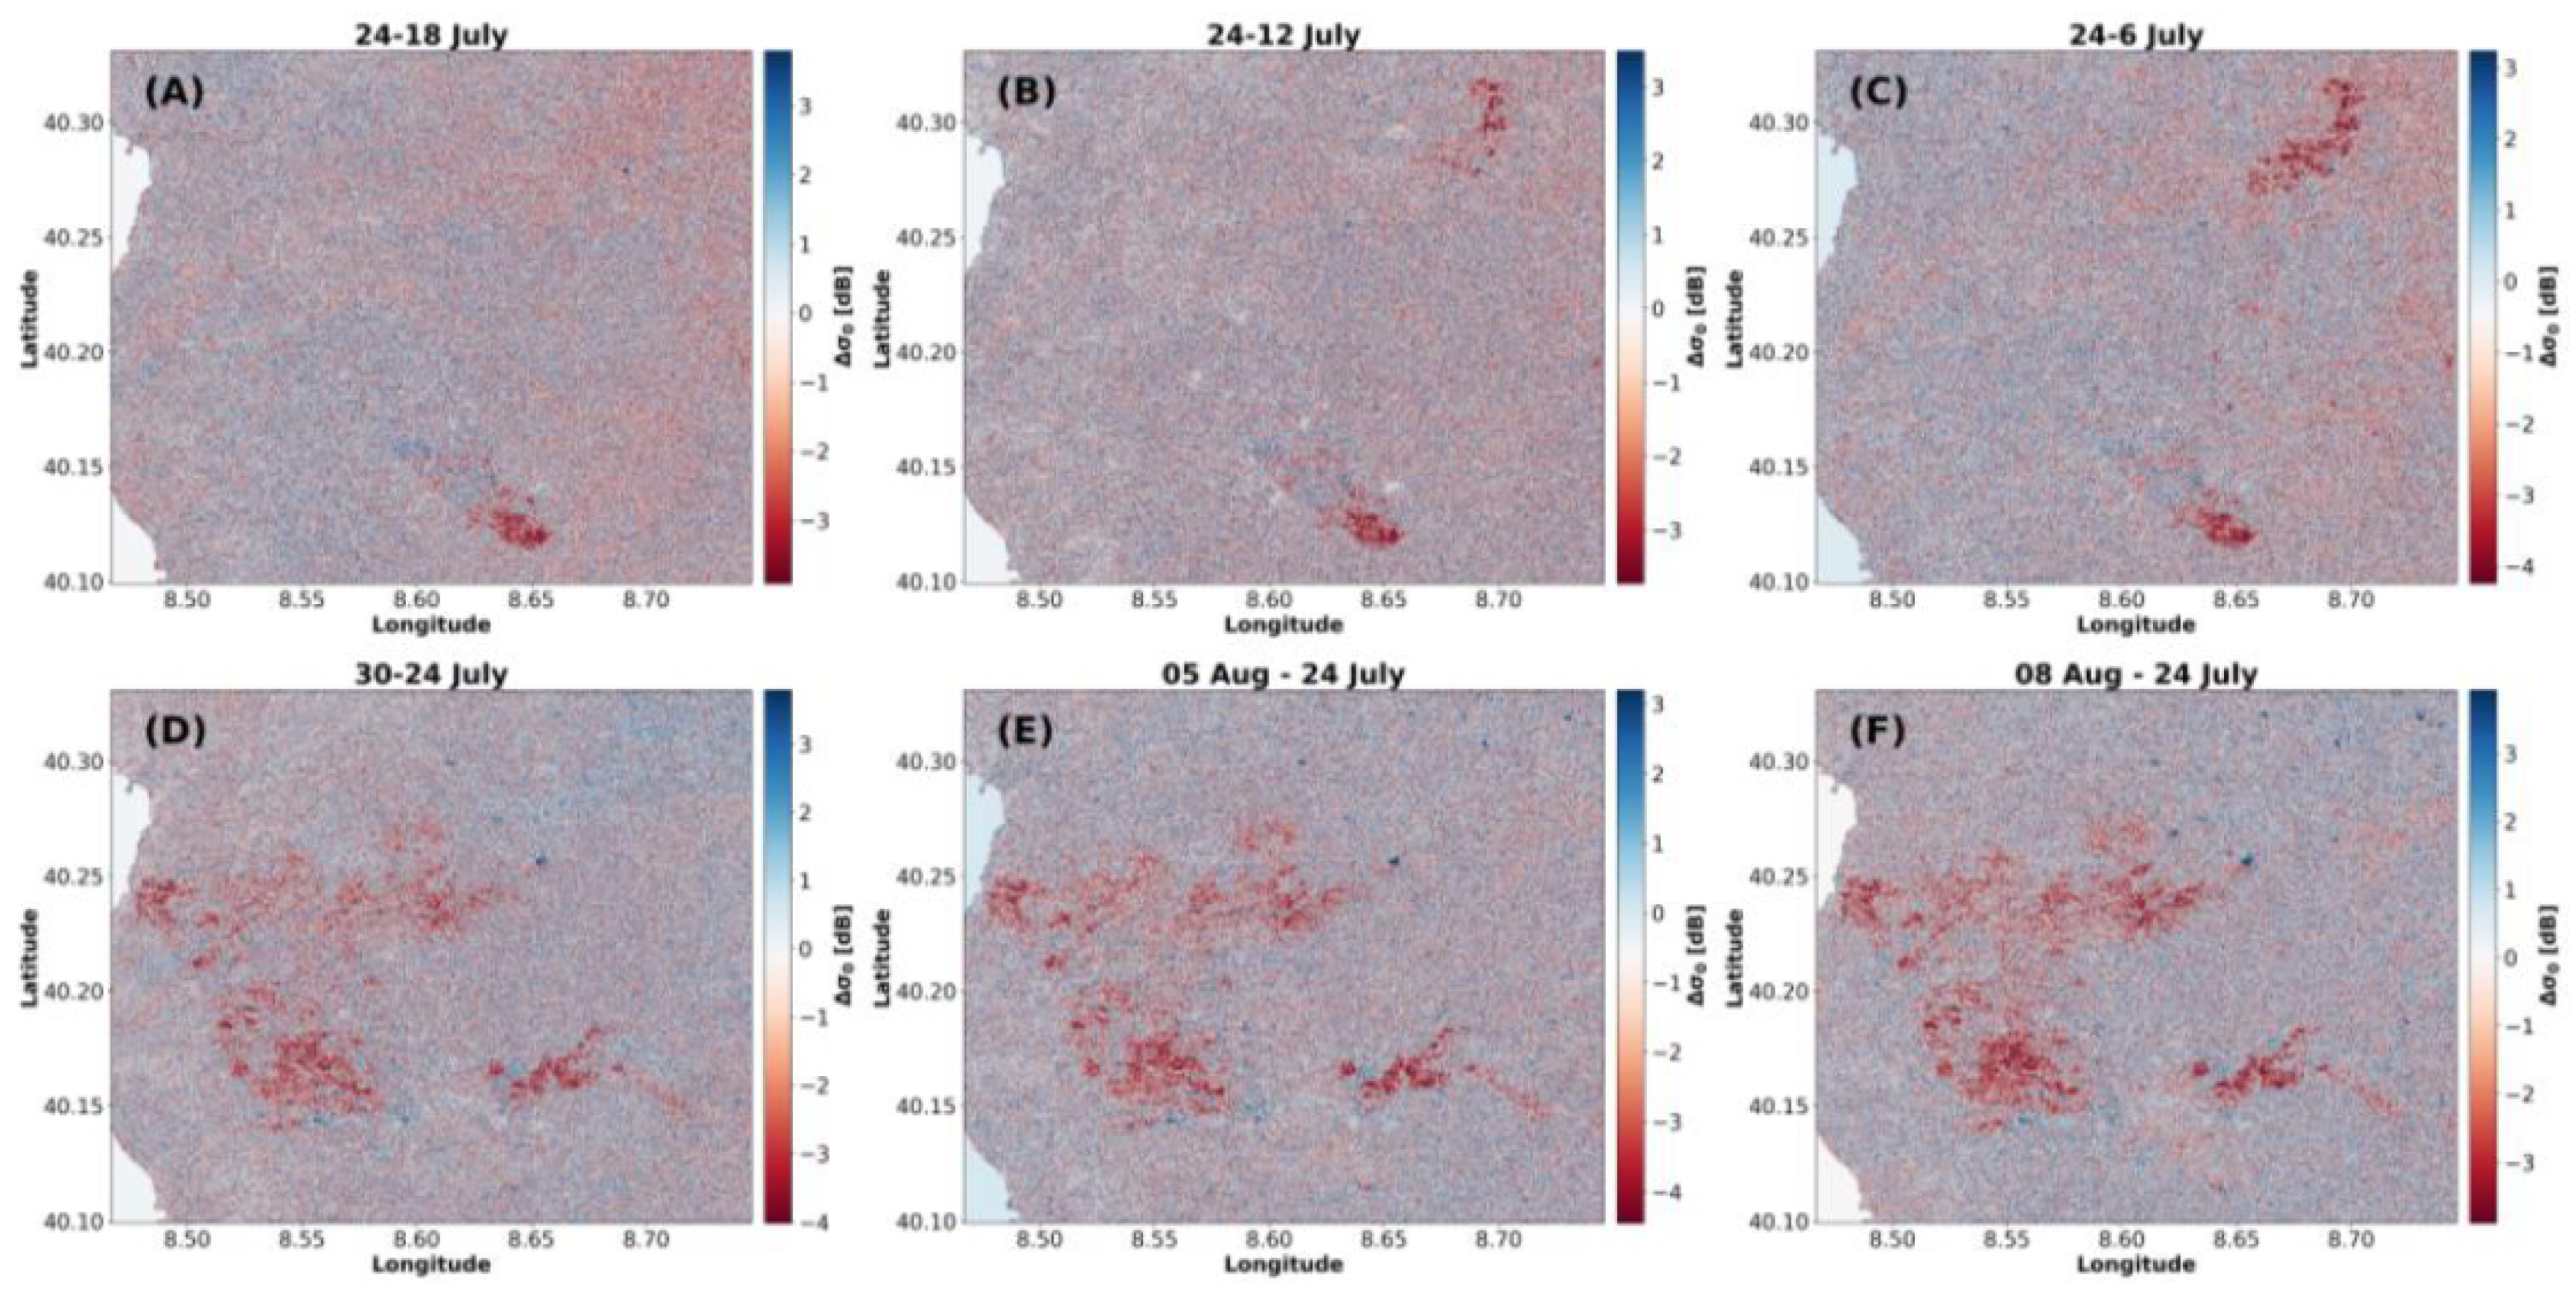
Figure 8.
Temporal multi-look maps of time-series for (A) VH and (B) VV polarization channels. Read Section 3.3 for more details.
Figure 8.
Temporal multi-look maps of time-series for (A) VH and (B) VV polarization channels. Read Section 3.3 for more details.
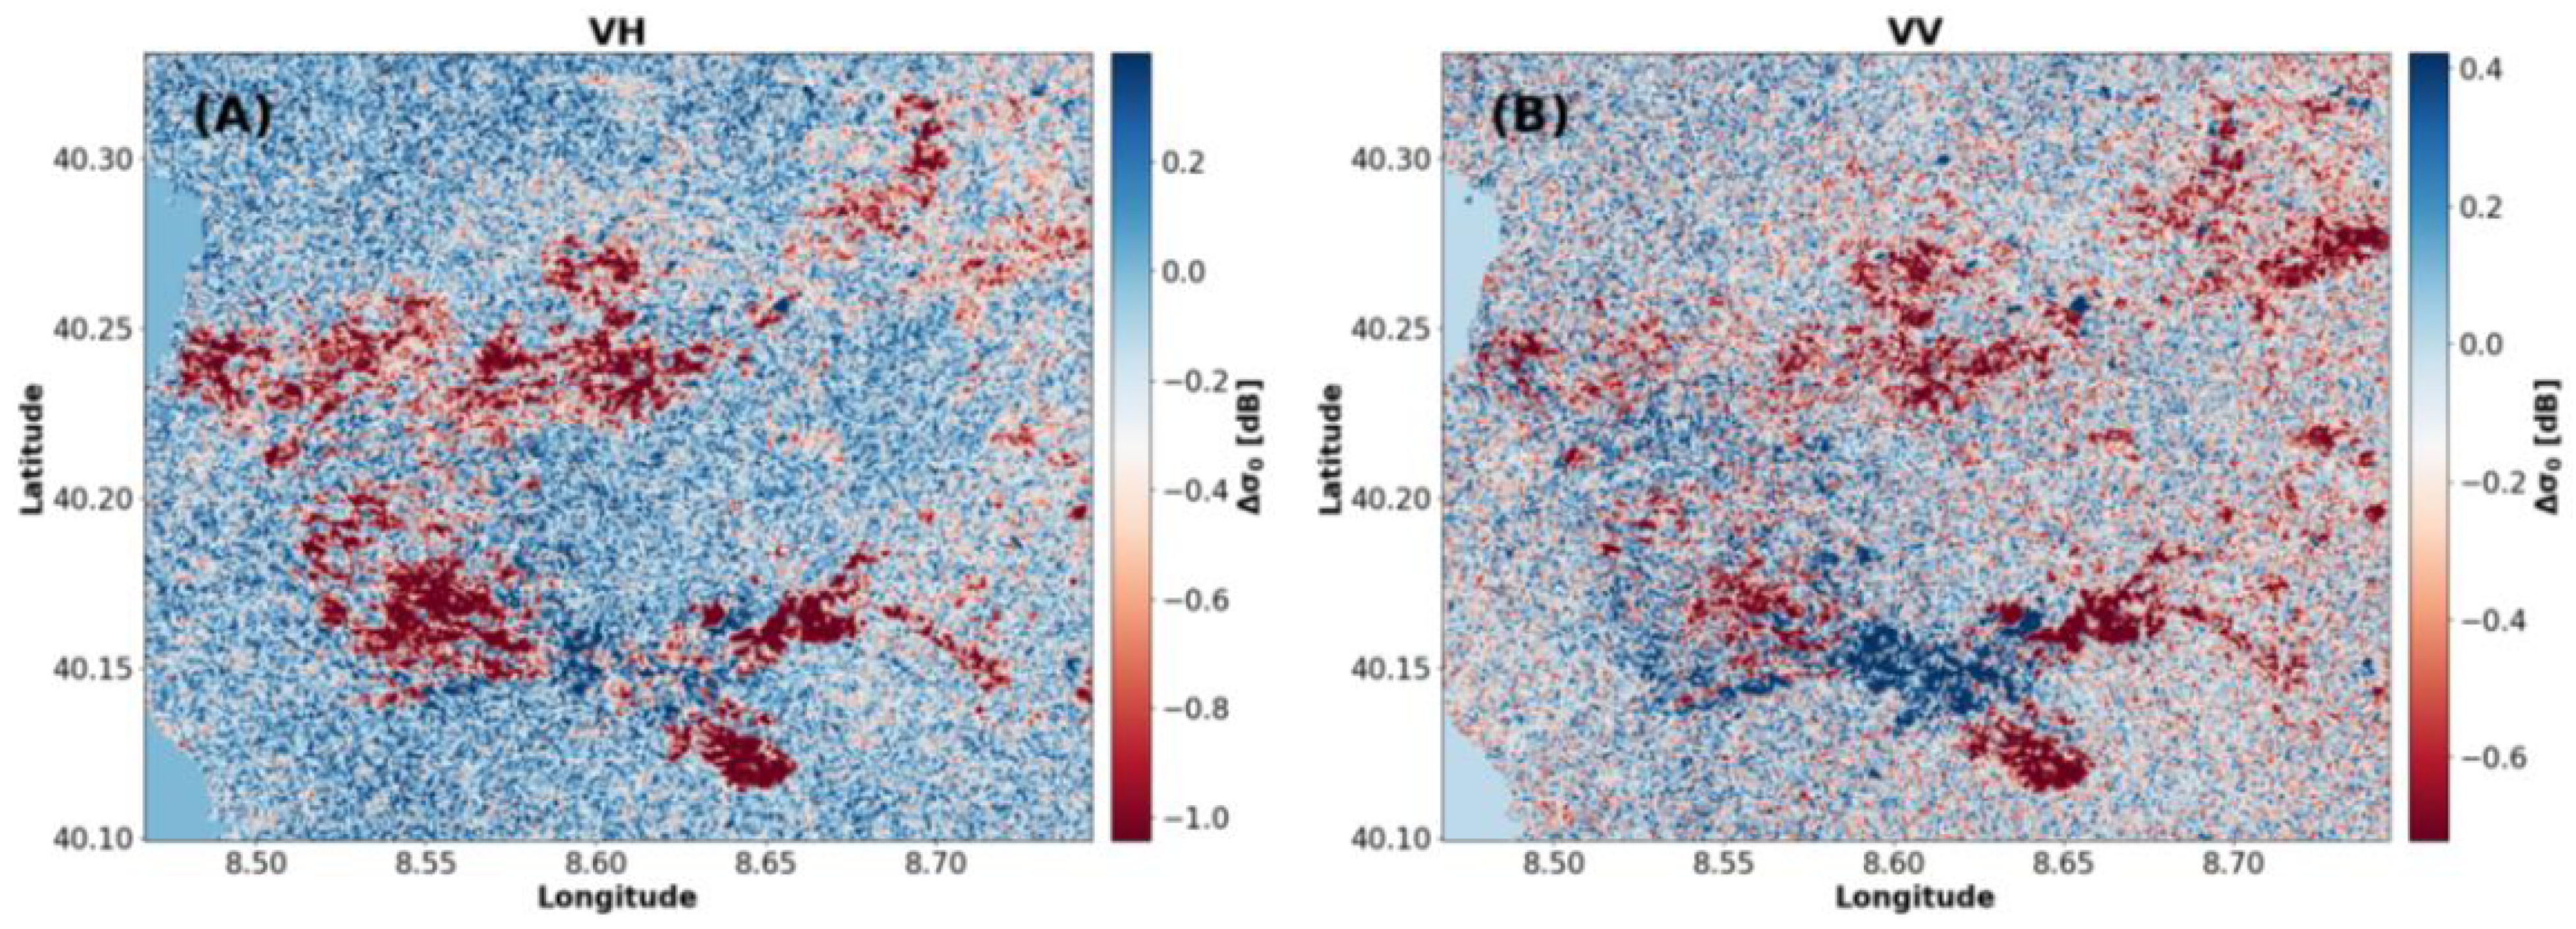
Figure 9.
(A) Sum VV+VH and (B) difference VV-VH of incoherent temporal multi-look maps at VV and VH polarization channels.
Figure 9.
(A) Sum VV+VH and (B) difference VV-VH of incoherent temporal multi-look maps at VV and VH polarization channels.
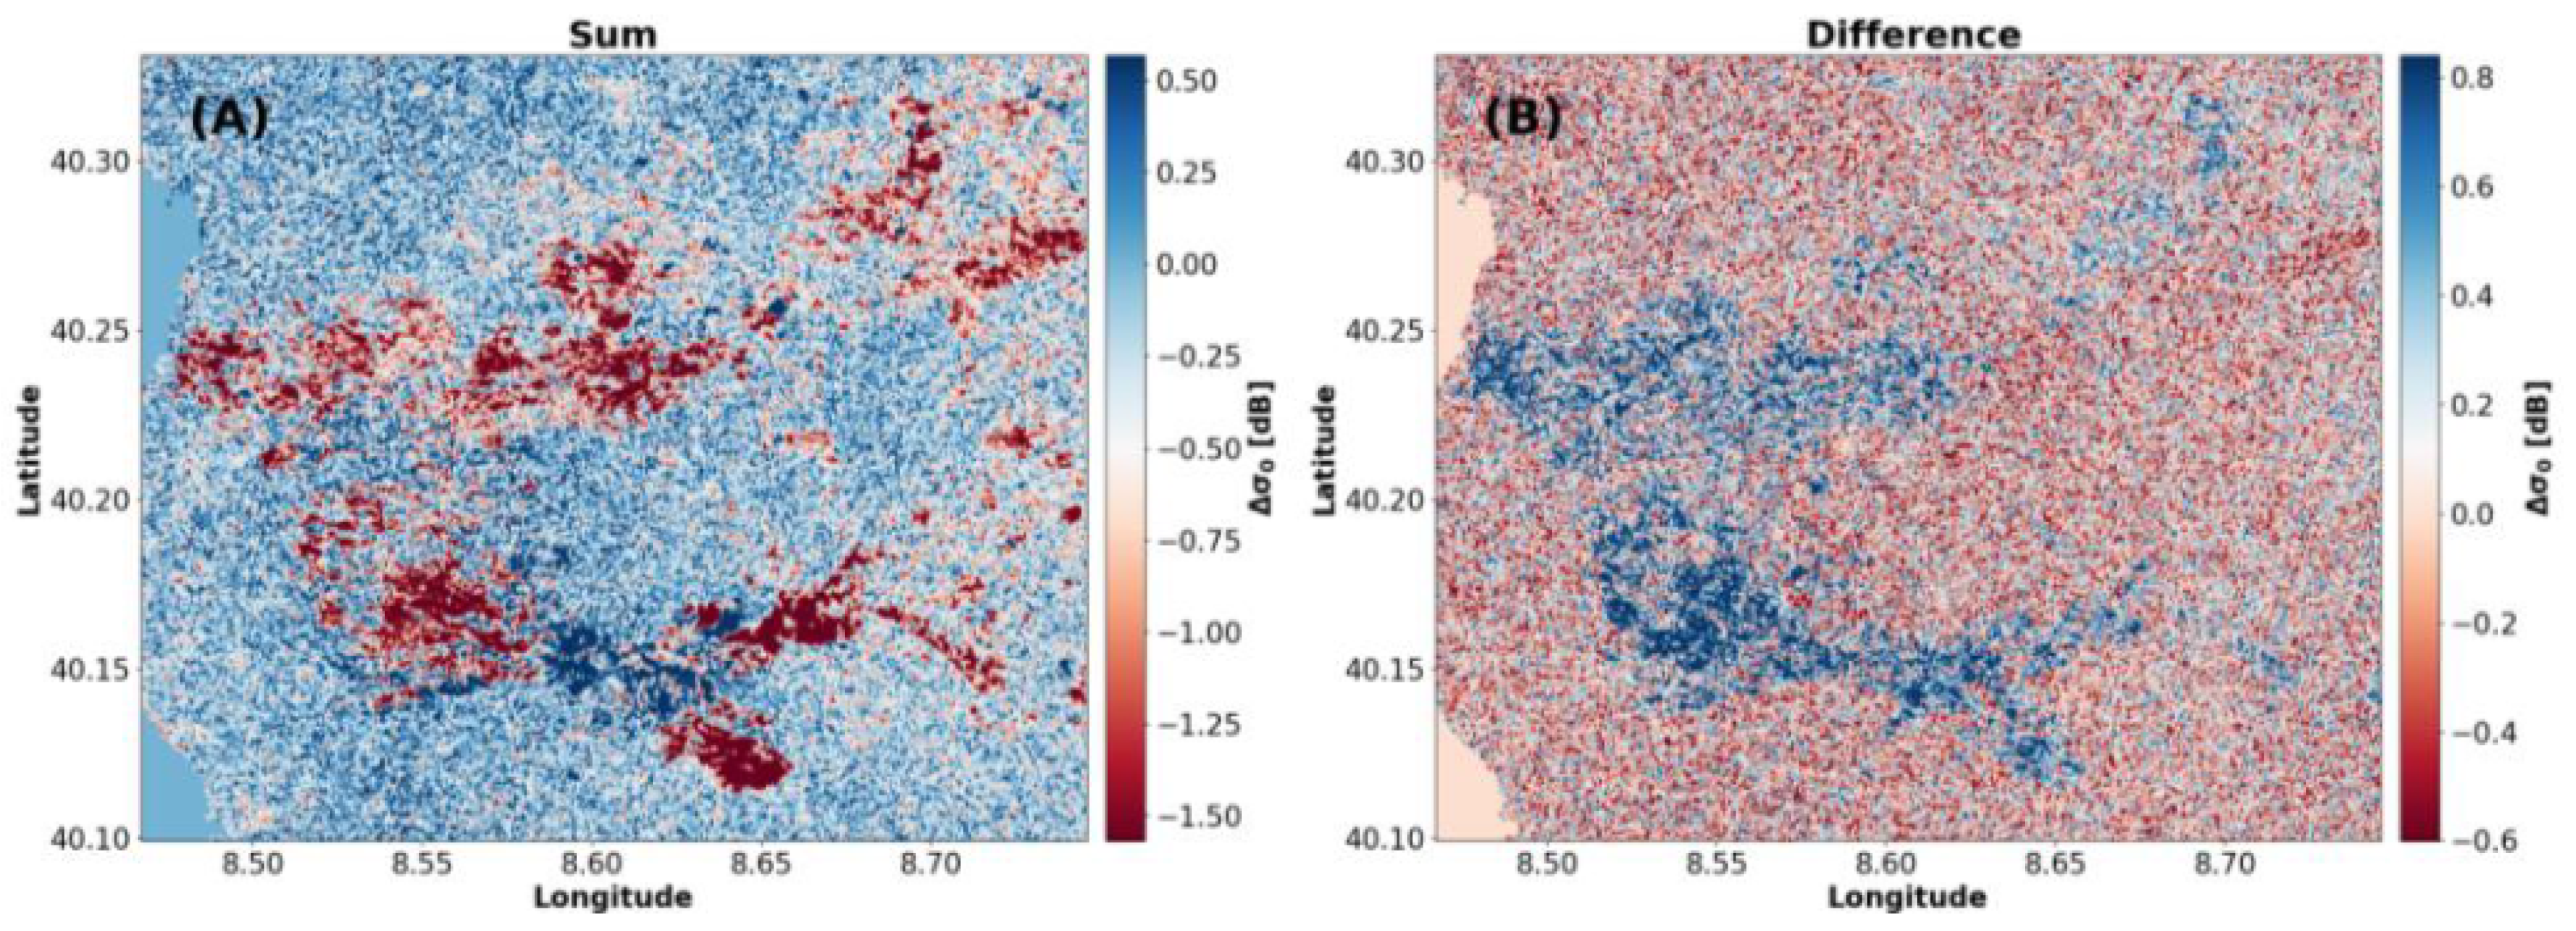
Figure 10.
(A,C) Normalized coherence difference, (B,D) coherence ratio for VH and VV polarization, respectively. The considered temporal baseline is equal to days (24–30 July and 18–24 July).
Figure 10.
(A,C) Normalized coherence difference, (B,D) coherence ratio for VH and VV polarization, respectively. The considered temporal baseline is equal to days (24–30 July and 18–24 July).
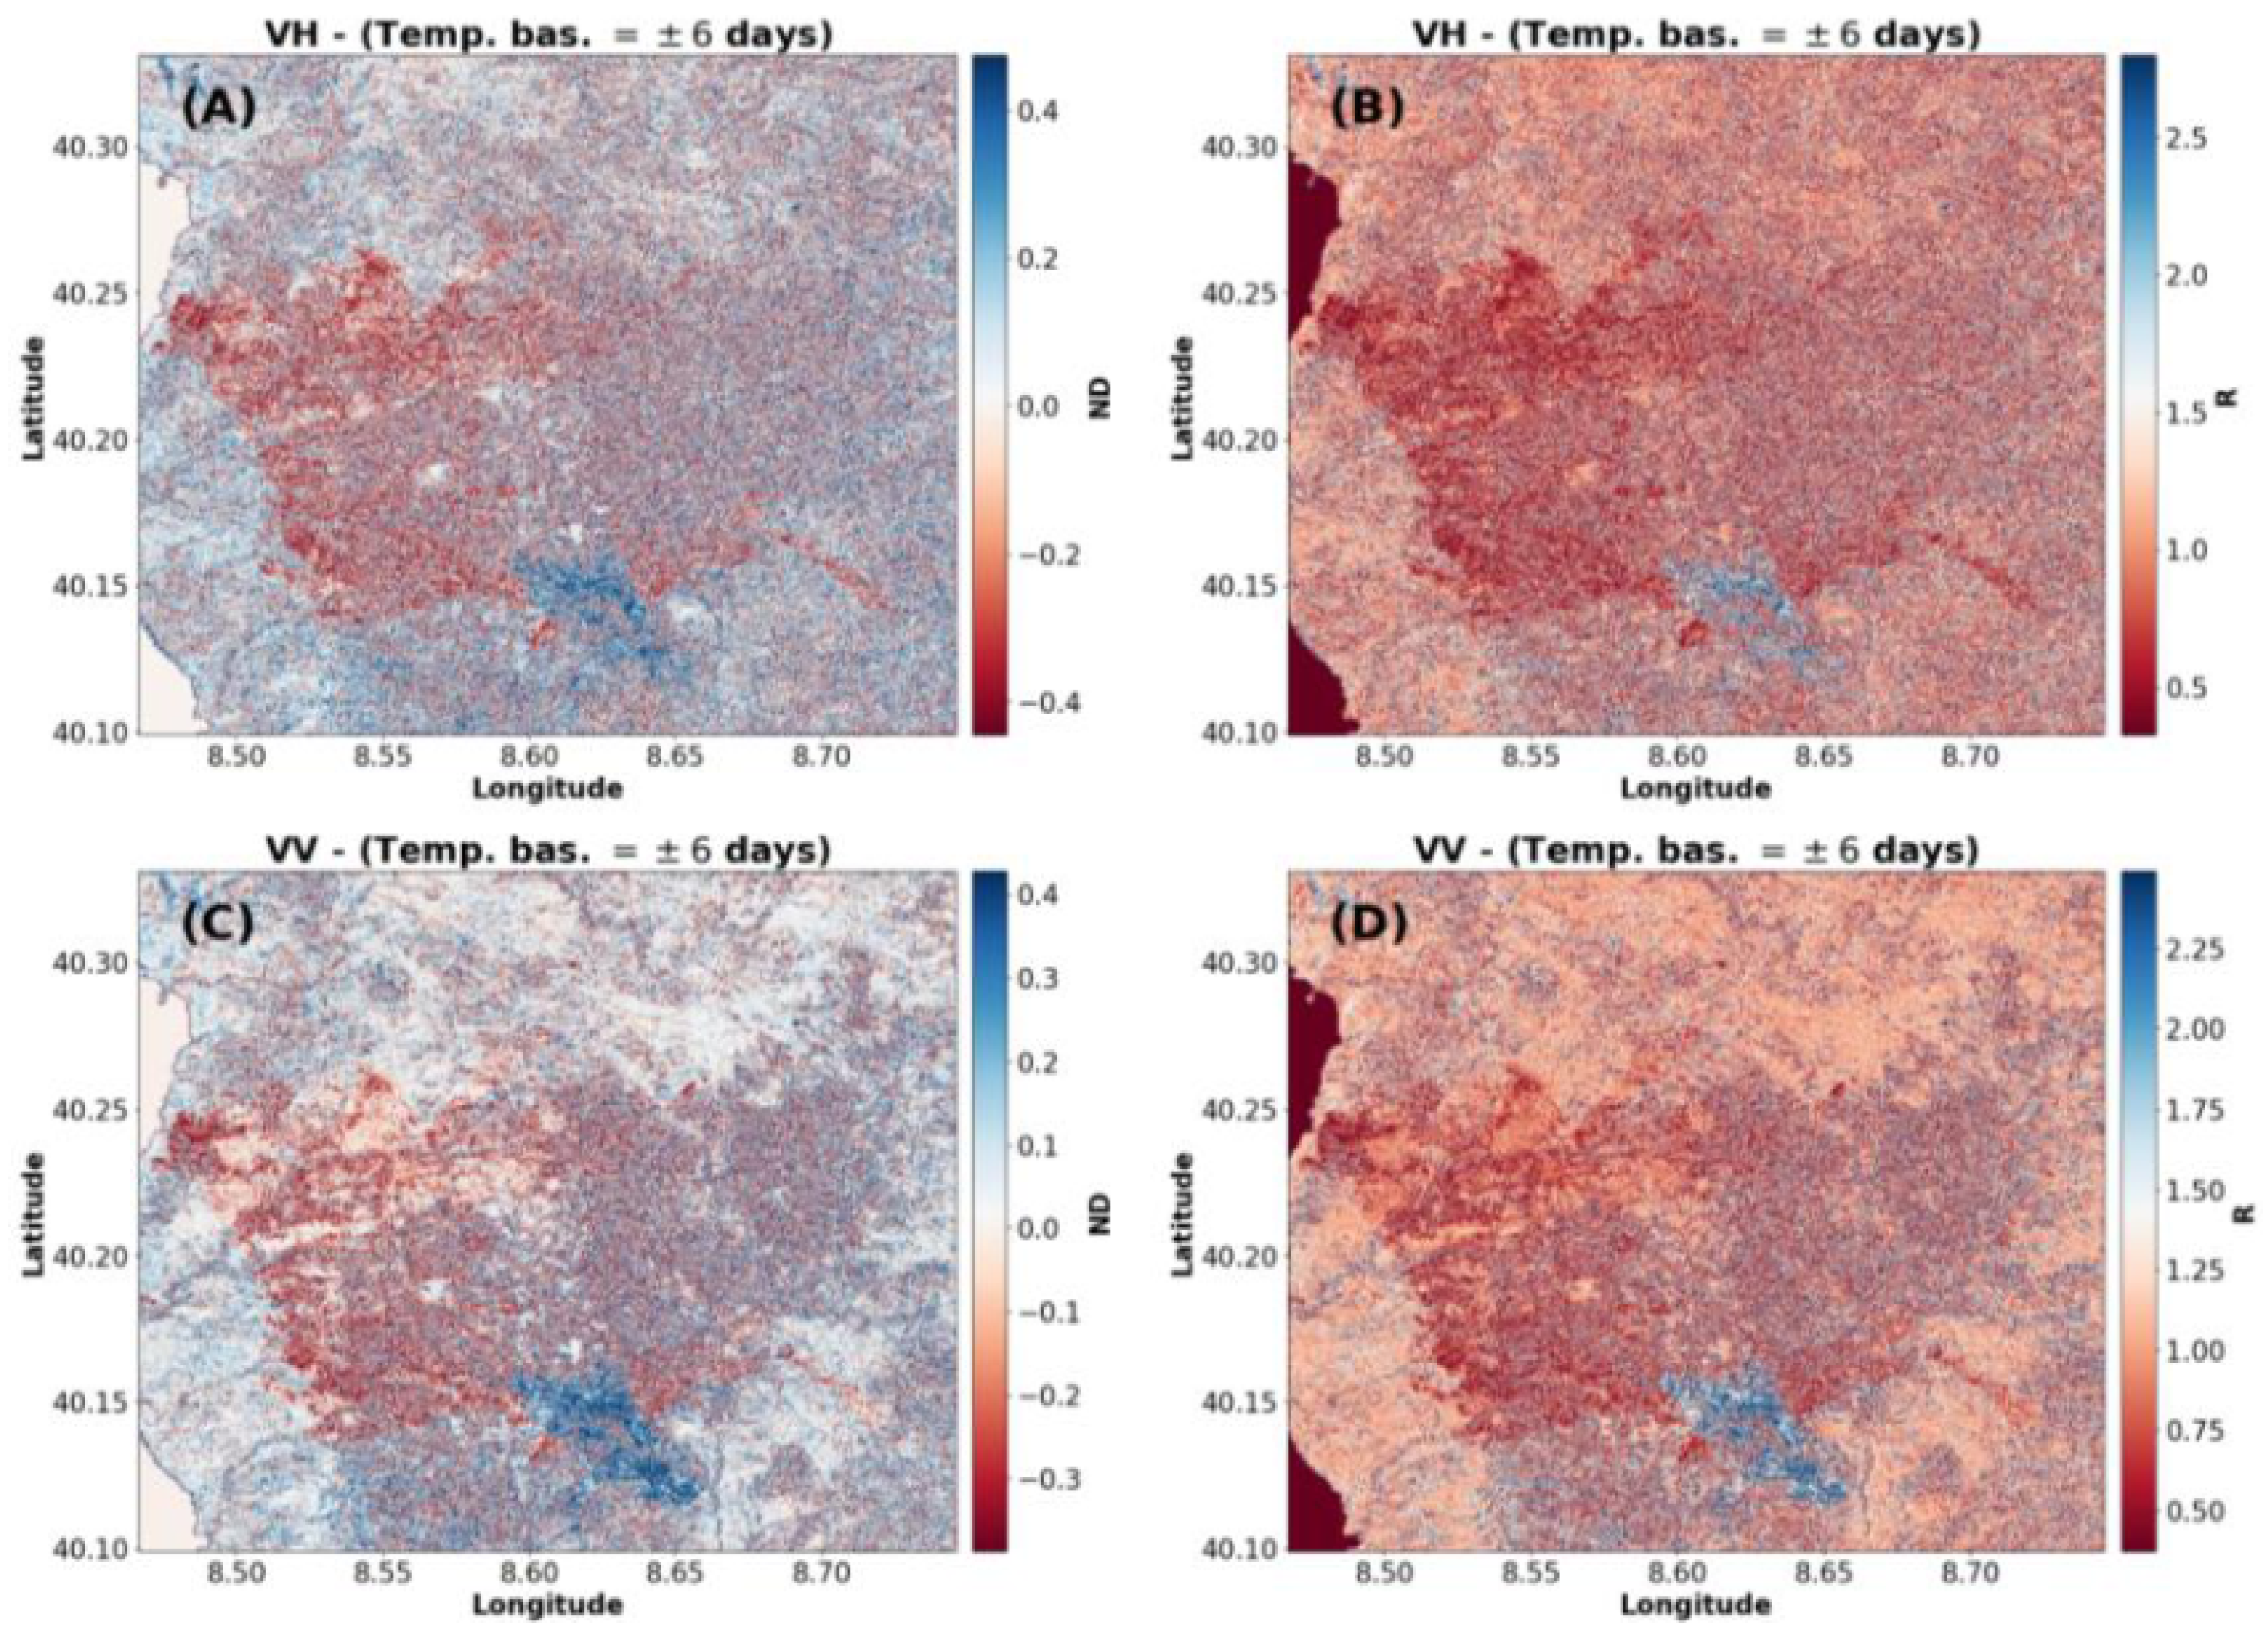
Figure 11.
Synthetic binary change masks of (A) Sardinia, (B) Sicily, and (C) Texas Galveston bay, respectively.
Figure 11.
Synthetic binary change masks of (A) Sardinia, (B) Sicily, and (C) Texas Galveston bay, respectively.

Figure 12.
Class imbalance before (A) and after random-oversampling and -undersampling techniques (B).
Figure 12.
Class imbalance before (A) and after random-oversampling and -undersampling techniques (B).
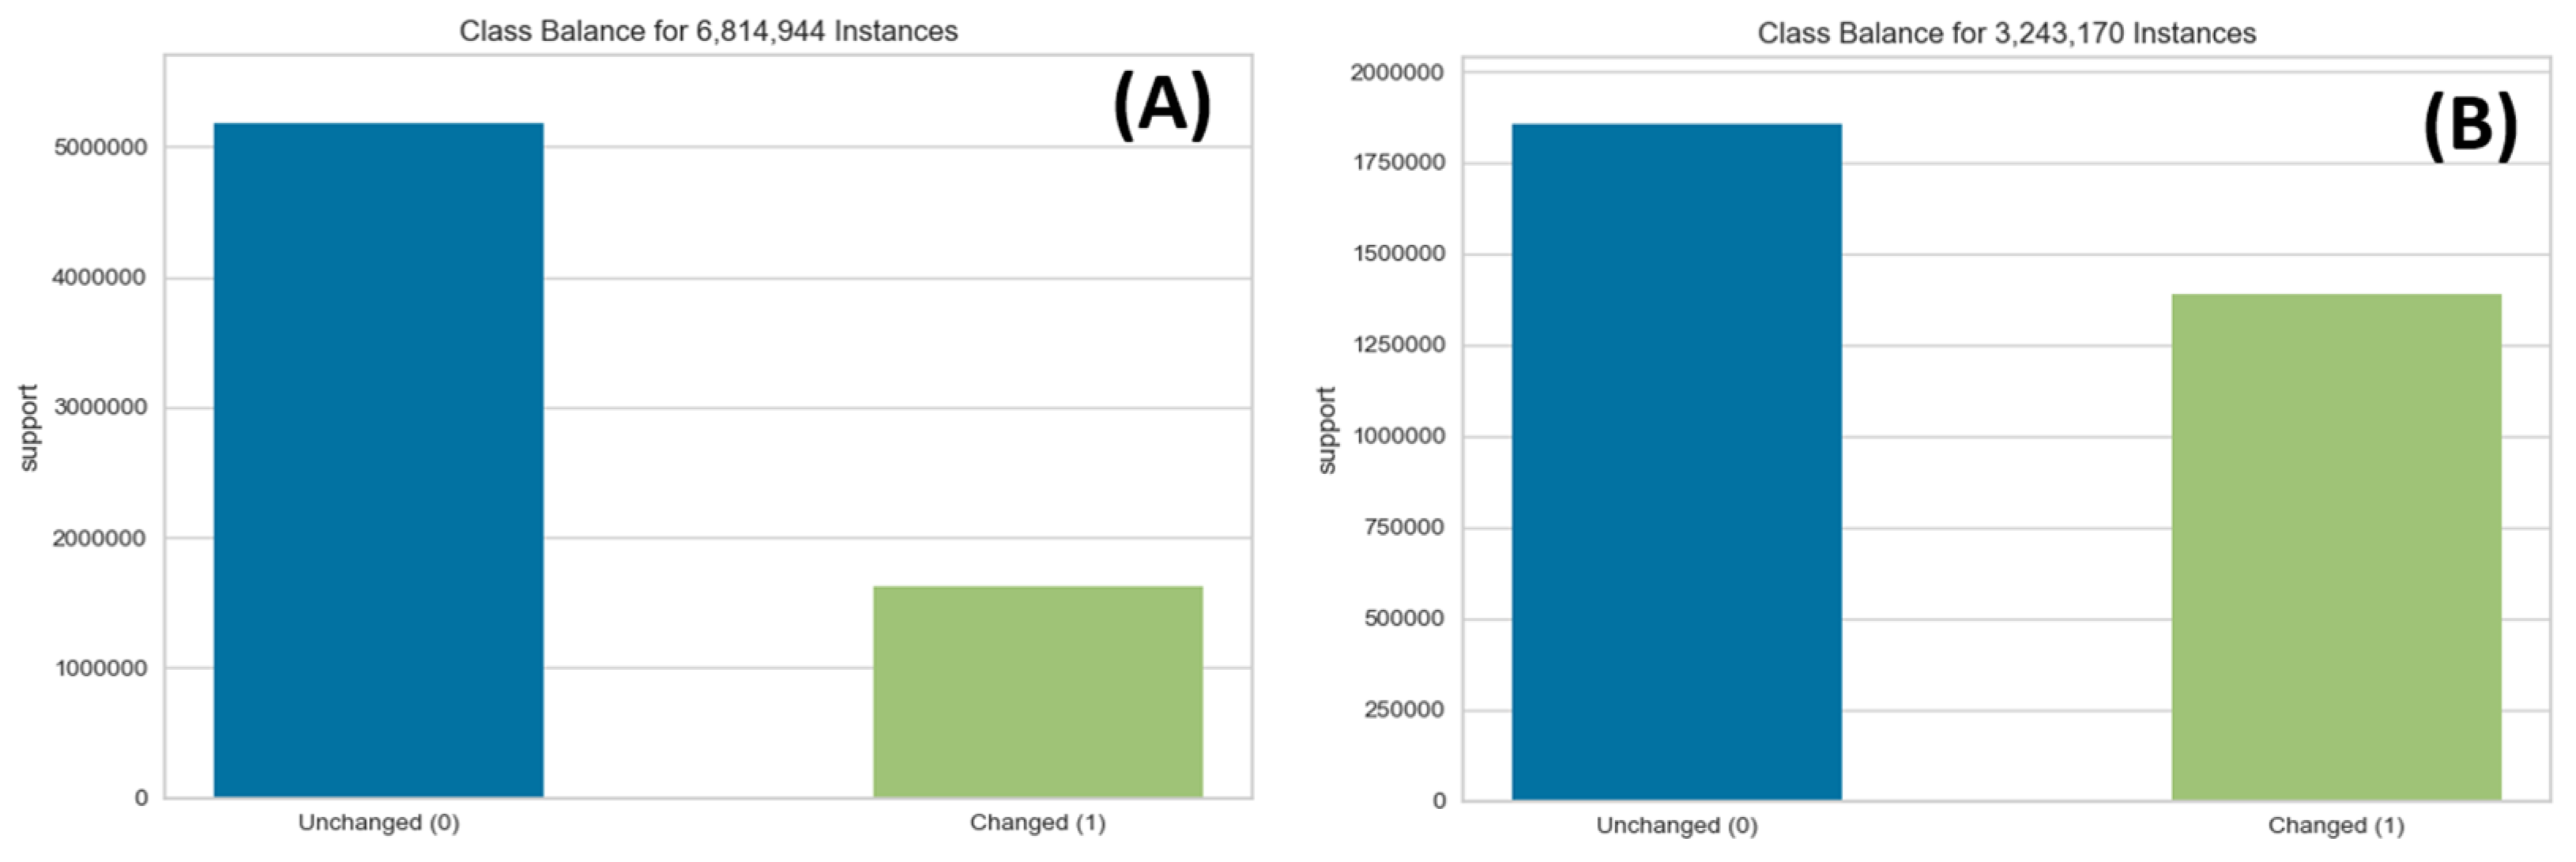
Figure 13.
RF predicted binary change masks (colored in red) of the (A) Sardinia, (B) Sicily, and (C) Texas, Galveston bay AOIs, respectively. Change masks are superimposed over SAR amplitude images of the areas.
Figure 13.
RF predicted binary change masks (colored in red) of the (A) Sardinia, (B) Sicily, and (C) Texas, Galveston bay AOIs, respectively. Change masks are superimposed over SAR amplitude images of the areas.

Figure 14.
Confusion matrices of the (A) Sardinia, (B) Sicily, and (C) Texas, Galveston Bay AOIs, respectively.
Figure 14.
Confusion matrices of the (A) Sardinia, (B) Sicily, and (C) Texas, Galveston Bay AOIs, respectively.
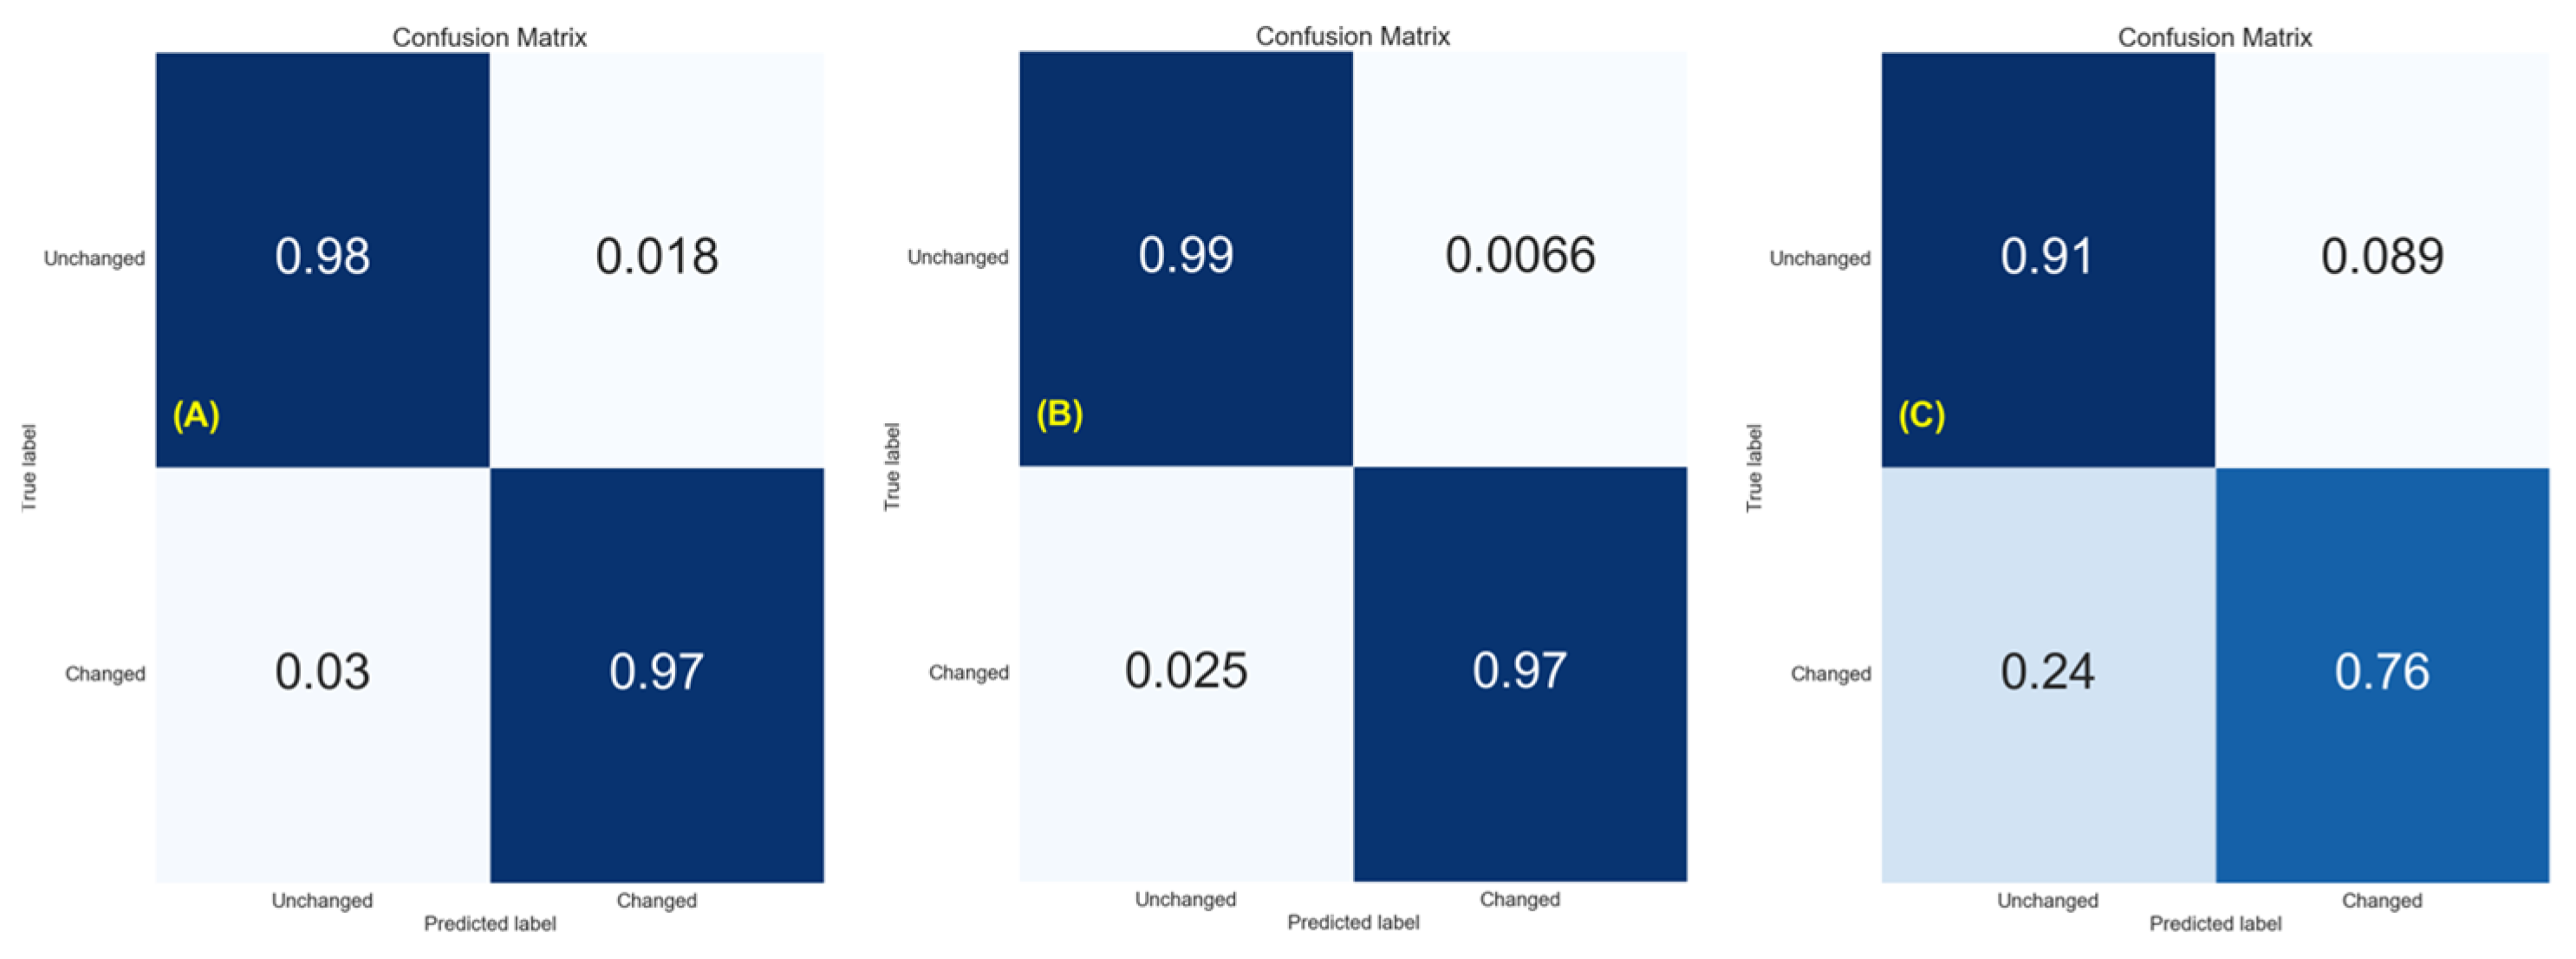
Figure 15.
Ranking of features essential for the proposed RF model calculated on Sardinia, Sicily, and Houston AOIs, respectively.
Figure 15.
Ranking of features essential for the proposed RF model calculated on Sardinia, Sicily, and Houston AOIs, respectively.


Table 1.
List of S-1 acquisitions for the Sardinia, Sicily, and Texas coastal areas. Dates are expressed in the year-month-day format.
Table 1.
List of S-1 acquisitions for the Sardinia, Sicily, and Texas coastal areas. Dates are expressed in the year-month-day format.
| Acquisition Dates | ||
|---|---|---|
| SARDINIA | SICILY | TEXAS |
| 2021-06-12 | 2021-06-27 | 2021-07-13 |
| 2021-06-18 | 2021-07-03 | 2021-07-19 |
| 2021-06-24 | 2021-07-06 | 2021-07-25 |
| 2021-07-06 | 2021-07-09 | 2021-07-31 |
| 2021-07-12 | 2021-07-21 | 2021-08-06 |
| 2021-07-18 | 2021-07-27 | 2021-08-12 |
| 2021-07-24 | 2021-08-02 | 2021-08-18 |
| 2021-07-30 | 2021-08-08 | 2021-08-24 |
| 2021-08-05 | 2021-08-14 | 2021-08-30 |
| 2021-08-11 | 2021-08-20 | 2021-09-05 |
| 2021-08-17 | 2021-08-26 | 2021-09-11 |
| 2021-08-23 | 2021-09-07 | 2021-09-17 |
| 2021-08-29 | 2021-09-13 | 2021-09-23 |
| 2021-09-04 | 2021-09-19 | 2021-09-29 |
Table 2.
RF classification scores report for the Sardinia, Sicily, and Texas AOIs.
| Sardinia | Sicily | Texas | ||||||||||
|---|---|---|---|---|---|---|---|---|---|---|---|---|
| # | Precision | Recall | F1 | # | Precision | Recall | F1 | # | Precision | Recall | F1 | |
| Unchanged (0) | 3,164,393 | 0.99 | 0.98 | 0.99 | 2,108,222 | 0.99 | 0.99 | 0.99 | 2,726,416 | 0.96 | 0.91 | 0.93 |
| Changed (1) | 955,933 | 0.94 | 0.97 | 0.96 | 672,808 | 0.98 | 0.97 | 0.98 | 439,280 | 0.58 | 0.76 | 0.65 |
| Weighted avg. | 4,120,326 | 0.98 | 0.98 | 0.98 | 2,781,030 | 0.99 | 0.99 | 0.99 | 3,165,696 | 0.91 | 0.89 | 0.90 |
Publisher’s Note: MDPI stays neutral with regard to jurisdictional claims in published maps and institutional affiliations. |
© 2022 by the authors. Licensee MDPI, Basel, Switzerland. This article is an open access article distributed under the terms and conditions of the Creative Commons Attribution (CC BY) license (https://creativecommons.org/licenses/by/4.0/).
Share and Cite
MDPI and ACS Style
Mastro, P.; Masiello, G.; Serio, C.; Pepe, A. Change Detection Techniques with Synthetic Aperture Radar Images: Experiments with Random Forests and Sentinel-1 Observations. Remote Sens. 2022, 14, 3323. https://doi.org/10.3390/rs14143323
AMA Style
Mastro P, Masiello G, Serio C, Pepe A. Change Detection Techniques with Synthetic Aperture Radar Images: Experiments with Random Forests and Sentinel-1 Observations. Remote Sensing. 2022; 14(14):3323. https://doi.org/10.3390/rs14143323
Chicago/Turabian StyleMastro, Pietro, Guido Masiello, Carmine Serio, and Antonio Pepe. 2022. "Change Detection Techniques with Synthetic Aperture Radar Images: Experiments with Random Forests and Sentinel-1 Observations" Remote Sensing 14, no. 14: 3323. https://doi.org/10.3390/rs14143323
Note that from the first issue of 2016, this journal uses article numbers instead of page numbers. See further details here.