
Quantifying the Impacts of the 2020 Flood on Crop Production and Food Security in the Middle Reaches of the Yangtze River, China


1
Department of Space Science and Engineering, National Central University, 300 Jhongda Road, Jhongli District, Taoyuan City 320317, Taiwan
2
Center for Space and Remote Sensing Research, National Central University, 300 Jhongda Road, Jhongli District, Taoyuan City 320317, Taiwan
3
The National Key Laboratory of River and Coastal Engineering, Vietnam Academy for Water Resources, 171 Tay Son Street, Dongda District, Hanoi 100000, Vietnam
*
Author to whom correspondence should be addressed.
Remote Sens. 2022, 14(13), 3140; https://doi.org/10.3390/rs14133140
Submission received: 14 June 2022
/
Revised: 20 June 2022
/
Accepted: 21 June 2022
/
Published: 30 June 2022
(This article belongs to the Special Issue New Developments in Remote Sensing for the Environment)
Abstract
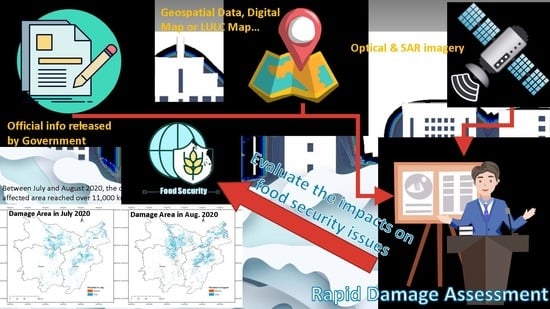
:This study uses satellite imagery and geospatial data to examine the impact of floods over the main planting areas for double-cropping rice and grain crops in the middle reaches of the Yangtze River. During summer 2020, a long-lasting 62-day heavy rainfall caused record-breaking floods over large areas of China, especially the Yangtze basin. Through close examination of Sentinel-1/2 satellite imagery and Copernicus Global Land Cover, between July and August 2020, the inundation area reached 21,941 and 23,063 km2, and the crop-affected area reached 11,649 and 11,346 km2, respectively. We estimated that approximately 4.66 million metric tons of grain crops were seriously affected in these two months. While the PRC government denied that food security existed, the number of Grains and Feeds imported from the U.S. between January to July 2021 increased by 316%. This study shows that with modern remote sensing techniques, stakeholders can obtain critical estimates of large-scale disaster events much earlier than other indicators, such as disaster field surveys or crop price statistics. Potential use could include but is not limited to monitoring floods and land use coverage changes.
1. Introduction
Food security is not only a domestic agriculture issue but also involves international trade, regional balance, etc., as it is a high-priority topic in modern times. When a significant climate event occurs, it is crucial for the nations directly impacted and all stakeholders in the international food trade to pay attention. However, governments of nations directly involved might not be willing to share all information. When a country faces large-scale natural disasters and poor agricultural harvests, people might lose confidence in the government to ensure security. This may even lead to political turmoil. The People’s Republic of China (PRC) is the most populous nation worldwide, with approximately 1.4 billion people. After the COVID-19 pandemic, natural disasters and regional uncertainty threatened the PRC’s food system; the PRC sought to manipulate different economic, trade, and political tools in domestic and international society to satisfy its food needs in the face of uncertainty. The PRC needs to stabilize food and crop production and expand grain crop output to ensure domestic society stabilization and economic growth.
Even though there was a stringent lockdown policy over the COVID-19 pandemic in rural and urban areas in the PRC from spring 2020, rare heavy rainfall and flood events occurred from June to August along the middle reaches of the Yangtze River. This region is also in the center of a double-cropping rice (early rice and late rice) area, and the rice production in this region accounts for 70% of the total national output [1,2]. However, the PRC government still claimed that no food security issues existed [3]. According to the official data released by the PRC National Bureau of Statistics and U.S. Census Bureau Trade Data, the nationwide Total Sown Areas of Farm Crops, Grain Crops, and Rice in 2020 increased. Furthermore, the Output of Grain Crops, Rice, and Early Rice in 2020 also increased unexpectedly. Meanwhile, the quantity of Grains and Feeds imported during the January–July 2021 period to the PRC from the U.S. increased significantly, by 316%. Under these factors and with doubts about increasing rice and grains output/productivity, some officials and scholars have offered so-called “reasonable” explanations. Nevertheless, it is not easy to explain or determine why the PRC imported a lot of corn, wheat, barley and soybean, rice, etc., from different countries in the first and second quarters of 2021 [4], especially without a significant growth in population. This event inspired us to determine a method to evaluate the disaster situation and the potential food security issues, through a rapid assessment using remote sensing techniques.
This research focuses on applying multiple satellite imagery techniques to study the impact of a climate disaster on food production, using the case of a record-breaking flood in China in the summer of 2020. Although the PRC government did not publish direct data, the results from this research align well with the PRC government’s remedial actions after the disaster several months later.
With the diversification of satellite imagery sources and the increasing abundance of resources, the temporal and geospatial scales of the research scope become wider. Current satellite imagery can quickly provide geospatial information across time to acquire large-scale agricultural disaster damage data (especially in areas that are not easily accessible by outsiders) [5,6,7]. Coupled with the integration of agricultural survey statistics that have been published over the years, near-real-time analytical information can be obtained, which is cost-effective for large-scale monitoring and rapid response missions.
However, analyses and calculation of imagery and geospatial data have increased dramatically. In response to this scientific research development trend and the challenge of extensive data analysis, Google has developed and made public a cloud computing platform called “Google Earth Engine (GEE)” to provide global-scale geospatial analysis services. Google’s substantial online computing power can effectively solve the need for a large area and long-term monitoring [8,9,10,11].
This research uses this internet resource to analyze Sentinel-1 SAR imagery and Sentinel-2 optical imagery. We composited time-series satellite imagery to produce maximum flooding maps (from Sentinel-1) and the best scenes with the lowest cloud coverage (from Sentinel-2). With this supervised classification and related processing procedures, this study aims to produce monthly flood coverage maps and land use/land cover (LULC) change maps to verify the feasibility of applying them to the rapid food security assessment in post-disaster regions.
Utilizing different RS techniques to extract cropland, paddy rice fields, and water bodies with multi-source imagery is very popular and advanced in the PRC [12,13,14,15]. Nevertheless, because food security issues are sensitive topics, it is difficult to find similar research to integrate these fields as we did in our study. That is also why we thought to fill the knowledge gap between remote sensing techniques, multi-source data, the GEE cloud computing platform, and rapid food security assessment for this case. The core and essential remote sensing (RS) technique we used in our research is to quantify LULC change with multiple data sources. A similar technique is beneficial in different application fields, such as environmental vulnerability [16,17], impact assessment [18,19], and natural disasters and hazards monitoring [20,21].
Based on our research results, between July and August 2020, the inundation area in our study region reached 21,941 and 23,063 km2, respectively, and the crop-affected area reached 11,649 and 11,346 km2, respectively (as shown in Table 2). Taking the PRC official data for reference, it is estimated that at least 4.66 million metric tons of grain crops were seriously affected in these two months; further, it is highly possible that there was no harvest in these areas.
2. Materials and Methods
2.1. Study Area
The PRC is the world’s largest rice producer, and its planting area accounts for approximately 18.5% of the world’s rice area, second only to India. The PRC’s total rice output ranks first globally, accounting for approximately 27.7%. The PRC’s rice output also ranks first on the national food list, and 65% of the PRC’s population feeds on rice as the main food. PRC rice can be divided into double-cropping rice (early rice and late rice) and single-cropping rice. Double-cropping rice is planted in a wide area, mainly distributed in Southeast Mainland China. Our research focuses on the middle reaches of the Yangtze River, located in the east part of mainland China and mainly downstream below the Three Gorges Dam with a total area of 618,177 km2. This area is also the main planting area for double-cropping rice and grain crops in the Hubei, Hunan, Jiangxi, and Anhui provinces, as shown in Figure 1. Most plains along the river are of low and flat terrain. The altitude is mostly below 50 m. Since old times, it has been known as the “Hometown of Fish and Rice”. It is also essential for rice and grain crops producing areas in the PRC. The rice planting area and total rice production have always been at the forefront of the country. The rice and grain crops-related industry is the critical foundation for the economic development of these four provinces. We chose this region as our study area to estimate how to build up the relationship between dynamic crop production situations and food security issues.
From early June to late August 2020, heavy rainfall of a long duration and broad impact caused by the regional rainy season led to floods severely affecting large middle and southern areas in China, including the whole Yangtze basin. The PRC government issued five rare flood warning alerts in a short period from 2 July to 17 August. According to the press conference hosted by the PRC’s Ministry of Emergency Management on 13 August 2020, rainfall during the year’s rainy season (62 consecutive days) in the middle reaches of the Yangtze River reached 759.2 mm, which is the highest level since 1961. The water level in both Dongting Lake and Poyang Lake exceeded the guaranteed water level, and the water level in the Chao Lake was the highest in history. The disaster affected 6.03 million hectares of crops, of which 1.14 million hectares had no harvest, mainly in the middle and lower reaches of the Yangtze River and surrounding area. In our study area, early rice is sown in late March and early April and harvested in mid- to late July; late rice is sown in mid- to late June and harvested in early and mid-October. According to the data announced by the PRC government from early June to late August, with daily rainfall conditions and reservoir regulation, the water level along the Yangtze River increased significantly, as shown in Table 1 [22] and Figure 2. In fact, some cropland in our study area experienced rain and flood for almost 2–3 months in 2020.
2.2. Data Sets
2.2.1. Sentinel-1A/B Data
In order to obtain a timely and accurate estimation of the paddy rice planting area and damaged cropland area, we choose to implement mapping methods based on the integration of optical and microwave remote sensing from Sentinel-1/2 data [23,24,25]. The Sentinel-1 mission comprises a constellation of two polar-orbiting satellites, launched in 2014 and 2016, operating day and night, performing C-band synthetic aperture radar imaging (SAR) at 5.405 GHz (C band), enabling them to acquire imagery regardless of the weather. The collection we analyzed in our research through GEE includes the S1 Ground Range Detected (GRD) scenes, processed using the Sentinel-1 Toolbox to generate a calibrated, ortho-corrected product. Each scene has one of 3 resolutions (10, 25, or 40 m), four band combinations (corresponding to scene polarization), and three instrument modes. Data products are available in single-polarization (VV or HH) for the Wave mode and dual-polarization (VV + VH or HH + HV) or single polarization (HH or VV) for other different modes [26,27]. In our research, 95 and 103 Sentinel-1 SAR GRD images were acquired between July and August 2020, as shown in Figure 3. The image resolution we choose is 10 m; it is good enough to detect the rice field and flooding area by different polarization products, with VH polarization for rice field detection and VH + VV dual-band cross-polarization for flooding area detection.
2.2.2. Sentinel-2 Data
The Sentinel-2 mission comprises a constellation of two polar-orbiting satellites placed in the same sun-synchronous orbit. They are phased at 180° to each other. Sentinel-2 is also a wide-swath, high-resolution, multispectral imaging mission supporting Copernicus Land Monitoring studies, including monitoring vegetation, soil, and water cover and observation of inland waterways and coastal areas. Sentinel-2’s wide swath width (290 km) and high revisit time (10 days at the equator with one satellite and five days with two satellites under cloud-free conditions, which results in 2–3-day resolution at mid-latitudes) make it easier to monitor variability in land surface conditions and support monitoring of Earth’s surface changes. Sentinel-2 carries an optical instrument payload that samples 13 spectral bands: four bands at 10 m, six bands at 20 m, and three bands at 60 m spatial resolution. The twins of Sentinel-2 provide continuity of SPOT and LANDSAT-type image data, contribute to ongoing multispectral observations and benefit Copernicus services and applications, such as land management, agriculture and forestry, disaster control, humanitarian relief operations, risk mapping, and security concerns [28,29,30]. There are 92 scenes covering our study area, as shown in Figure 4.
2.2.3. Copernicus Global Land Cover
In order to generate the LULC map before the flood in the study area, we took the Copernicus Global Land Cover map as reference data sets, as shown in Figure 5, rather than LULC data generated from different machine-learning algorithms [31,32,33,34]. The Dynamic Land Cover map at 100 m resolution is a new product in the Copernicus Global Land Service (CGLS). The map aims to deliver a yearly based global land cover map at 100 m spatial resolution. Land cover plays a significant role in the climate and biogeochemistry of the Earth system. The CGLS Land Cover product provides a primary land cover scheme, covering the 2015–2019 period at three classification levels with class definitions from the Land Cover Classification System (LCCS) scheme. Next to these discrete classes, the product also includes continuous field layers or “fraction maps” for all basic land cover classes that provide proportional estimates for vegetation/ground cover for the land cover types. This continuous classification scheme may depict heterogeneous land cover areas better than the standard classification scheme and can be tailored for application use (e.g., forest monitoring, rangeland management, crop monitoring, biodiversity and conservation, monitoring environment and security, and climate modeling) Even though this product is advantageous for monitoring forests, cropland, and environmental changes, there were limitations. Areas with fragmented cropland (tiny size, less < 0.5 ha or sparse cropland, and land cover areas) are challenging to map and display at a resolution of 100 m. This misclassification could possibly lead to an underestimation of croplands [35,36,37].
2.3. Methodology
Figure 6 presents a workflow chart of the methodology utilized in this study. Each step is described in the following sections.
2.3.1. LULC Map Extracted from Multi-Source Data
The application of machine-learning algorithms on RS imagery for LULC mapping has attracted considerable attention [38]. The algorithms have been divided into supervised and unsupervised techniques [39]. In our research, accurately quantifying surface water bodies in flooding events is critical to understanding their role in LULC and related imagery processing steps. Sentinel-1 data with high spatial resolution and cloud penetration are very attractive and helpful to water body monitoring and change extraction, especially during the rainy season and bad weather conditions [40]. We took the 92 scenes of Sentinel-2 imagery acquired in 2019 with the lowest cloud coverage and Copernicus Global Land Cover rice field detected from VH polarization of Sentinel-1 imagery (acquired in July and August 2020) as a reference to identify the water body and cropland before the flood in 2020. By choosing 172 red sample points for the water body and 172 green sample points for cropland evenly (as shown in Figure 7), it is easy to extract the extent of the permanent water body and flooding area from Sentinel-1 imagery through GEE (as shown in Figure 8) [41,42]. With this result, the training accuracy is 0.979, the training kappa is 0.959, the testing accuracy is 0.932, and the testing kappa is 0.865. In the same phase, we can also extract the cropland as a reference map for other following steps. The results show that using the GEE can not only perform fast and effective imagery processing procedures, but also produce large-area and reliable imagery classification maps. We also utilize remote sensing techniques to estimate the disaster losses in the rice field and yield in the study area by using a developed Rice field Identification and riCe yield Estimate (RICE) algorithm for analyzing the satellite images for comparison and data correction [43].
2.3.2. Monthly Composite Flooding Map
Because the study area is enormous and Sentinel-1imagery cannot cover such a large area every day, we try to generate the Monthly composite flooding map with the online Google Earth Engine to represent the actual flooding situation in this event [44]. As shown in Figure 9, VH and VV are single-polarization data of Sentinel-1. We compiled monthly composite flooding data from Sentinel-1, and there were 95 and 103 Sentinel-1 SAR GRD imagery acquired in July and August 2020. Even the Sentinel-1 SAR GRD imagery were not affected by rain and cloud, the data still had a high noise-to-signal ratio. That is why we took the Mean value of VH/VV polarization imagery to reduce the noise and stack them to generate the monthly composite flooding map. With the permanent water body extracted in Section 2.3.1, we can exclude the permanent water body and have a refined monthly flooding map. Based on this product, it is easier to identify which area is covered underwater during July and August 2020 (as shown in Figure 10). Finally, we can overlap and intersect the cropland and refined monthly flooding map layers to generate the “damaged cropland area map” in July and August 2020 (as shown in Figure 11). Therefore, we can assess and quantify the impacts of the 2020 flood on crop production in our study area listed in Section 2.1.
Monthly composite flooding map = max {mean (VH) + mean (VV)}
3. Results
3.1. Spatial and Temporal Variability of Flood Impact Area
Analyzing and quantifying the impacts of the 2020 flood on crop production encompass a scientific approach which can be used to set up situation awareness to determine the relationships between spatial and temporal variability of flood impact areas as early as possible. Following the whole procedure listed in Section 2.3, we can obtain the results of inundation areas and crop-affected areas in our study area (as shown in Table 2).
According to the official data released by the PRC National Bureau of Statistics [45], we extract the “output of grain crops harvested in summer per hectare” and average numbers based on previous output for these four provinces in our study area (as shown in Table 3).
As described in “Section 2.1”, rainfall during the year’s rainy season (62 consecutive days) in this area reached 759.2 mm, which is the highest level since 1961. Some cropland in our study area experienced rain and flood for almost 2–3 months in 2020, as long as the historical record. Multiply the “crop-affected area (km2) in August” for each province from Table 2 and the mean of “output of grain crops harvested in summer per hectare (kg/hectare)” for the same province from Table 3. The results show that approximately 4.66 million metric tons of grain crops were at least seriously affected in July and August 2020; further, it is highly possible that there was no harvest in these areas.
The satellite images have the advantages of multi-spatial and temporal availability and a large coverage area for LULC mapping [46]. Compared to field surveys [47], remote sensing techniques provide the opportunity for rapid acquisition of information on LULC at a much-reduced price with high efficiency.
3.2. Food Security
Based on the official data released by the PRC National Bureau of Statistics and U.S. Census Bureau Trade Data, as shown in Table 4, Table 5 and Table 6, some critical findings are listed below:
- (1)
- Compared to 2019, the total sown areas of farm crops, grain crops, and rice in 2020 increased by 0.94%, 0.61%, and 1.30%, respectively.
- (2)
- Compared to 2019, the output of grain crops, grain crops harvested in summer, grain crops harvested in autumn, rice, and early rice in 2020 increased by 0.85%, 0.89%, 0.68%, 1.07%, and 3.88%, respectively.
- (3)
- Until early May 2022, the PRC government released no detailed province-level agricultural data for 2020. It is likely that they will announce different rates and methods.
- (4)
- Compared to the January–July 2020 period, the quantity of Grains and Feeds imported during the January–July 2021 period to the PRC from the U.S. increased by 316%. The increases in corn, wheat, barley, and rice increased by 1691%, 153%, 503%, and 166%, respectively, in the same period.
The COVID-19 pandemic started in early 2020, and the PRC government announced the most strict lockdown policy in the globally from spring onwards. This unprecedented policy was executed in different cities and regions for a couple of months. Then, rare heavy rainfall and flood events occurred from June to August along the middle reaches of the Yangtze River. It is very difficult to believe that these known factors had no impact on food security issues in the PRC. If there were no such impacts, it is also difficult to understand why the PRC imported lots of corn, wheat, barley, soybean, rice, etc., from different countries in the first and second quarters of 2021 [4], even from its competitors (e.g., the U.S. and India) [48], especially without a significant growth in population.
Food security and related issues are always the PRC’s highest priority and are among the most sensitive of topics. Recently, several techniques have been developed to map cropland patterns and dynamics from RS observations, including traditional satellite-based LULC mapping and UAV imagery applications [49,50,51,52,53]. These studies focus on the damage assessment of high-value crops in smaller areas. Related technology can more accurately classify crop damage, but rely on a lot of support from the local government and are not applicable in the cross-country rapid assessment work model for this study. However, it is also not so easy to find similar food security research topics with situation awareness and rapid warning based on wide-area RS resources.
4. Discussion
4.1. Rapid Damage Assessment
Although the method used in this study is satisfactory, there are still some factors that we must clarify. First, we assume that the average productivity of the affected cropland is uniform, so that we can multiply the affected cropland area with the average productivity to estimate damage losses. Even though this is a simplification procedure, it is still prevalent in statistics. Using this method, we estimated that approximately 4.66 million metric tons of grain crops were seriously affected in these two months. The numbers are not high in accuracy, but scientists and stakeholders are able to assess the extent of the damage from these results. Before better solutions or more detailed information is released in near real time, conducting a rapid damage assessment of this type for such disaster events is still helpful at a practical level.
4.2. Remedial Actions after the Flood
We must clarify one more thing: food security is a sensitive topic and not only a domestic concern, so governments of nations directly involved in large-scale disasters might not be willing to share all the related information. For objective and realistic cropland damage assessment, it is almost impossible to find the necessary statistics from government official information or related channels in real time. Although we did not use PRC government-published direct data, there was no solid evidence to show the increased import of grain crops linked to the flood event. As we described, after the record-breaking flood and the COVID-19 pandemic, the PRC unusually imported huge amounts of grain crops without any food culture change or significant population growth. This may have been coincidental, or we can assume that the results from this research align well with the PRC government’s remedial actions several months after the disaster.
4.3. Apply the Research Results for Other Cases
In recent years, extreme climate events, geopolitical crises, and regional security issues have increased yearly, resulting in large-scale and regional agricultural and food crises worldwide. For example, Ukraine’s Minister of Agrarian Policy, Mr. Roman Leshchenko, claimed: “Ukraine can feed the world” in an ATLANTIC COUNCIL article published on 4 March 2021: the country’s active agricultural area is more extensive than Italy. Meanwhile, Ukraine is already among the top three grain exporters and a world leader in areas such as soybeans and sunflower oil [54]. However, this “breadbasket of Europe” is threatened by Russia’s “Special Military Operation,” which started in February 2022 and is disrupting the planting schedule of spring crops and the shipping arrangements of existing grain inventories. It is not just a conflict between two countries, but also impacts many other countries’ food security. Suppose that we can apply the method mentioned in our study to integrate multi-source RS data such as Sentinel-1/2 and MODIS, this would allow us to monitor this large-scale grain crop productivity situation and raise warning concerns as early as possible after natural or manufactured disasters.
5. Conclusions
This study took the two-month-long torrential rain and flood disaster in the middle reaches of the Yangtze River in 2020 as a case. We collected and integrated a variety of multi-source satellite imagery, LULC change maps, official agricultural surveys, agricultural food import data, etc. In addition to clarifying the application limitations of different satellite images [55], we also proposed constructing a feasible analysis to predict regional rice and crop shortage warning signs after disasters [56,57]. The government can use the research results to judge the potential shortage of rice and crops in neighboring countries after large-scale disasters. It is also possible to formulate a negotiation strategy for agricultural and grain import and export in advance and judge the possible impact on domestic political and social situations—further, the impact on national security or regional balance. Consequently, we can explore and expose potential and undercover urgent food security issues as early as possible through the developed method.
Author Contributions
Conceptualization, L.-C.W. and Y.-A.L.; methodology, L.-C.W. and D.V.H.; formal analysis, D.V.H. and L.-C.W.; writing—original draft preparation, L.-C.W.; conceptualization, funding acquisition, project administration, resources, writing—review and editing, Y.-A.L. All authors have read and agreed to the published version of the manuscript.
Funding
This research received no external funding.
Acknowledgments
The authors acknowledge support from the Ministry of Science and Technology (MOST) of Taiwan under the codes MOST 110-2111-M-008-008.
Conflicts of Interest
The authors declare no conflict of interest.
References
- Liu, Y.; Zhou, Q.; Yu, Q.; Wu, W. Analysis of spatial pattern and ecological service value changes of large-scale regional paddy fields based on remote sensing data. Smart Agric. 2020, 2, 43–57. [Google Scholar]
- Lü, X.; Zhou, G. A review on main meteorological disaster of double-cropping rice in China. J. Appl. Meteor. Sci. 2018, 29, 385–395. [Google Scholar] [CrossRef]
- The state council information office. P.R.C. The State Council Information Office Held a Press Conference on Flood Prevention and Disaster Relief Work. 13 August 2020. Available online: http://www.gov.cn./xinwen/2020-08/13/content_5534534.htm (accessed on 5 May 2022).
- The Foreign Agricultural Service (FAS). China: Grain and Feed Update. 2021. Available online: https://apps.fas.usda.gov/newgainapi/api/Report/DownloadReportByFileName?fileName=Grain%20and%20Feed%20Update_Beijing_China%20-%20People%27s%20Republic%20of_06-28-2021.pdf (accessed on 4 May 2022).
- Huo, Z.; Fan, Y.; Yang, J.; Shang, Y. Review on Agricultural Flood Disaster in China. J. Appl. Meteorol. Sci. 2017, 28, 641–653. [Google Scholar]
- Yin, H.; Li, C. Human impact on floods and flood disasters on the Yangtze River. Geomorphology 2001, 41, 105–109. [Google Scholar] [CrossRef]
- Liu, J.; Wang, S.; Li, D. The Analysis of the Impact of Land-Use Changes on Flood Exposure of Wuhan in Yangtze River Basin, China. Water Resour. Manag. 2014, 28, 2507–2522. [Google Scholar] [CrossRef]
- Mou, X.L.; Li, H.; Huang, C.; Liu, Q.; Liu, G. Application progress of Google Earth Engine in land use and land cover remote sensing information extraction. Remote Sens. Land Resour. 2021, 33, 1–10. Available online: https://www.cgsjournals.com/zgdzdcqkw-data/gtzyyg/2021/2/PDF/gtzyyg202102001.pdf (accessed on 18 June 2022).
- Pandey, A.C.; Kaushik, K.; Parida, B.R. Google Earth Engine for Large-Scale Flood Mapping Using SAR Data and Impact Assessment on Agriculture and Population of Ganga-Brahmaputra Basin. Sustainability 2022, 14, 4210. [Google Scholar] [CrossRef]
- Fatchurrachman; Rudiyanto; Soh, N.C.; Shah, R.M.; Giap, S.G.E.; Setiawan, B.I.; Minasny, B. High-Resolution Mapping of Paddy Rice Extent and Growth Stages across Peninsular Malaysia Using a Fusion of Sentinel-1 and 2 Time Series Data in Google Earth Engine. Remote Sens. 2022, 14, 1875. [Google Scholar] [CrossRef]
- Attia, W.; Ragab, D.; Abdel-Hamid, A.M.; Marghani, A.M.; Elfadaly, A.; Lasaponara, R. On the Use of Radar and Optical Satellite Imagery for the Monitoring of Flood Hazards on Heritage Sites in Southern Sinai, Egypt. Sustainability 2022, 14, 5500. [Google Scholar] [CrossRef]
- Huang, Z.; Wu, W.; Liu, H.; Zhang, W.; Hu, J. Identifying Dynamic Changes in Water Surface Using Sentinel-1 Data Based on Genetic Algorithm and Machine Learning Techniques. Remote Sens. 2021, 13, 3745. [Google Scholar] [CrossRef]
- Zhang, D.; Shi, X.; Xu, H.; Jing, Q.; Pan, X.; Liu, T.; Wang, H.; Hou, H. A GIS-Based Spatial Multi-Index Model for Flood Risk Assessment in the Yangtze River Basin, China. Environ. Impact Assess. Rev. 2020, 83, 106397. [Google Scholar] [CrossRef]
- Liu, S.; Zheng, Y.; Feng, L.; Chen, J.; Lakshmi, V.; Shi, H. Are Only Floods with Large Discharges Threatening? Flood Characteristics Evolution in the Yangtze River Basin. Geosci. Lett. 2021, 8, 32. [Google Scholar] [CrossRef]
- Yanan, Y.; Yang, K.; Xiao, F.; Yadong, C.; Hanwen, Z.; Hongming, Z. Edge extraction method of remote sensing UAV terrace image based on topographic feature. Smart Agric. 2019, 1, 50. [Google Scholar]
- Nguyen, A.K.; Liou, Y.A.; Li, M.H.; Tran, T.A. Zoning eco-environmental vulnerability for environmental management and protection. Ecol. Indic. 2016, 69, 100–117. [Google Scholar] [CrossRef]
- Liou, Y.A.; Nguyen, A.K.; Li, M.H. Assessing spatiotemporal eco-environmental vulnerability by Landsat data. Ecol. Indic. 2017, 80, 52–65. [Google Scholar] [CrossRef] [Green Version]
- Nguyen, K.A.; Liou, Y.A. Global mapping of eco-environmental vulnerability from human and nature disturbances. Sci. Total Environ. 2019, 664, 995–1004. [Google Scholar] [CrossRef]
- Liu, Y.; Zhou, Y. Spatiotemporal dynamics and gray forecast of ecosystem services value in the Yangtze River Economic Belt. Ecol. Econ. 2019, 35, 196–201. [Google Scholar]
- Dao, P.D.; Liou, Y.A. Object-based flood mapping and affected rice field estimation with Landsat 8 OLI and MODIS data. Remote Sens. 2015, 7, 5077–5097. [Google Scholar] [CrossRef] [Green Version]
- Li, G.F.; Xiang, X.Y.; Tong, Y.Y.; Wang, H.M. Impact assessment of urbanization on flood risk in the Yangtze River Delta. Stoch. Environ. Res. Risk Assess. 2013, 27, 1683–1693. [Google Scholar] [CrossRef]
- Report on Important Water and Rain Conditions in the Yangtze River Basin in 2020. Available online: http://www.cjh.com.cn/article_2313_237960.html (accessed on 4 May 2022).
- Zhao, R.; Li, Y.; Ma, M. Mapping Paddy Rice with Satellite Remote Sensing: A Review. Sustainability 2021, 13, 503. [Google Scholar] [CrossRef]
- Felegari, S.; Sharifi, A.; Moravej, K.; Amin, M.; Golchin, A.; Muzirafuti, A.; Tariq, A.; Zhao, N. Integration of Sentinel 1 and Sentinel 2 Satellite Images for Crop Mapping. Appl. Sci. 2021, 11, 10104. [Google Scholar] [CrossRef]
- Valero, S.; Arnaud, L.; Planells, M.; Ceschia, E. Synergy of Sentinel-1 and Sentinel-2 Imagery for Early Seasonal Agricultural Crop Mapping. Remote Sens. 2021, 13, 4891. [Google Scholar] [CrossRef]
- Sentinel-1, ESA. Available online: https://sentinel.esa.int/web/sentinel/missions/sentinel-1 (accessed on 5 May 2022).
- Sentinel-1 SAR GRD. Available online: https://developers.google.com/earth-engine/datasets/catalog/COPERNICUS_S1_GRD (accessed on 5 May 2022).
- Sentinel-2, ESA. Available online: https://sentinel.esa.int/web/sentinel/missions/sentinel-2 (accessed on 5 May 2022).
- Liu, Y.; Li, Y.; Wu, J. Study on extraction of paddy fields based on LSWI and time series NDV. Geogr. Geo-Inf. Sci. 2015, 31, 32–37. [Google Scholar]
- Xiao, X.; Boles, S.; Frolking, S.; Li, C.; Babu, J.Y.; Salas, W.; Moore, B. Mapping Paddy Rice Agriculture in South and Southeast Asia Using Multi-Temporal MODIS Images. Remote Sens. Environ. 2006, 100, 95–113. [Google Scholar] [CrossRef]
- Jamali, A. Evaluation and comparison of eight machine learning models in land use/land cover mapping using Landsat 8 OLI: A case study of the northern region of Iran. SN Appl. Sci. 2019, 1, 1448. [Google Scholar] [CrossRef] [Green Version]
- Carranza-García, M.; García-Gutiérrez, J.; Riquelme, J.C. A framework for evaluating land use and land cover classification using convolutional neural networks. Remote Sens. 2019, 11, 274. [Google Scholar] [CrossRef] [Green Version]
- Ma, L.; Li, M.; Ma, X.; Cheng, L.; Du, P.; Liu, Y. A review of supervised object-based land-cover image classification. ISPRS J. Photogramm. Remote Sens. 2017, 130, 277–293. [Google Scholar] [CrossRef]
- Talukdar, S.; Singha, P.; Mahato, S.; Shahfahad; Pal, S.; Liou, Y.-A.; Rahman, A. Land-Use Land-Cover Classification by Machine Learning Classifiers for Satellite Observations—A Review. Remote Sens. 2020, 12, 1135. [Google Scholar] [CrossRef] [Green Version]
- Copernicus Global Land Operations “Vegetation and Energy”. Available online: https://land.copernicus.eu/global/sites/cgls.vito.be/files/products/CGLOPS1_PUM_LC100m-V3_I3.4.pdf (accessed on 5 May 2022).
- Buchhorn, M.; Smets, B.; Bertels, L.; De Roo, B.; Lesiv, M.; Tsendbazar, N.-E.; Herold, M.; Fritz, S. Copernicus Global Land Service: Land Cover 100m: Collection 3: Epoch 2019: Globe 2020. Available online: https://zenodo.org/record/3939050#.YrVOxuxBxPY (accessed on 5 May 2022). [CrossRef]
- Buchhorn, M.; Lesiv, M.; Tsendbazar, N.-E.; Herold, M.; Bertels, L.; Smets, B. Copernicus Global Land Cover Layers—Collection 2. Remote Sens. 2020, 12, 1044. [Google Scholar] [CrossRef] [Green Version]
- Maxwell, A.E.; Warner, T.A.; Fang, F. Implementation of machine-learning classification in remote sensing: An applied review. Int. J. Remote Sens. 2018, 39, 2784–2817. [Google Scholar] [CrossRef] [Green Version]
- Halder, A.; Ghosh, A.; Ghosh, S. Supervised and unsupervised landuse map generation from remotely sensed images using ant based systems. Appl. Soft Comput. 2011, 11, 5770–5781. [Google Scholar] [CrossRef]
- Li, D.; Wu, B.; Chen, B.; Xue, Y.; Zhang, Y. Review of water body information extraction based on satellite remote sensing. J. Tsinghua Univ. Sci. Technol. 2020, 60, 147–161. [Google Scholar]
- Kang, J.; Yang, X.; Wang, Z.; Huang, C.; Wang, J. Collaborative Extraction of Paddy Planting Areas with Multi-Source Information Based on Google Earth Engine: A Case Study of Cambodia. Remote Sens. 2022, 14, 1823. [Google Scholar] [CrossRef]
- Htitiou, A.; Boudhar, A.; Chehbouni, A.; Benabdelouahab, T. National-Scale Cropland Mapping Based on Phenological Metrics, Environmental Covariates, and Machine Learning on Google Earth Engine. Remote Sens. 2021, 13, 4378. [Google Scholar] [CrossRef]
- Liou, Y.-A.; Sha, H.-C.; Chen, T.-M.; Wang, T.-S.; Li, Y.-T.; Lai, Y.-C.; Chiang, M.-H. Assessment of disaster losses in rice paddy field and yield after Tsunami induced by the 2011 great east Japan earthquake. J. Mar. Sci. Technol. 2012, 20, 2. [Google Scholar]
- Xing, L.; Niu, Z.; Jiao, C.; Zhang, J.; Han, S.; Cheng, G.; Wu, J. A Novel Workflow for Seasonal Wetland Identification Using Bi-Weekly Multiple Remote Sensing Data. Remote Sens. 2022, 14, 1037. [Google Scholar] [CrossRef]
- National Bureau of Statistics of China. Available online: https://data.stats.gov.cn/english/index.htm (accessed on 5 May 2022).
- Viana, C.M.; Girão, I.; Rocha, J. Long-Term Satellite Image Time-Series for Land Use/Land Cover Change Detection Using Refined Open Source Data in a Rural Region. Remote Sens. 2019, 11, 1104. [Google Scholar] [CrossRef] [Green Version]
- Chen, Z.; Wang, J. Land use and land cover change detection using satellite remote sensing techniques in the mountainous Three Gorges Area, China. Int. J. Remote Sens. 2010, 31, 1519–1542. [Google Scholar] [CrossRef]
- UPDATE 1-China Buys First Indian Rice in Decades amid Scarce Supply; Reuters: London, UK, 2020.
- Li, X.; Yuan, W.; Dong, W. A Machine Learning Method for Predicting Vegetation Indices in China. Remote Sens. 2021, 13, 1147. [Google Scholar] [CrossRef]
- Wang, Y.; Zhang, Z.; Zuo, L.; Wang, X.; Zhao, X.; Sun, F. Mapping Crop Distribution Patterns and Changes in China from 2000 to 2015 by Fusing Remote-Sensing, Statistics, and Knowledge-Based Crop Phenology. Remote Sens. 2022, 14, 1800. [Google Scholar] [CrossRef]
- Yan, H.; Du, W.; Zhou, Y.; Luo, L.; Niu, Z. Satellite-Based Evidences to Improve Cropland Productivity on the High-Standard Farmland Project Regions in Henan Province, China. Remote Sens. 2022, 14, 1724. [Google Scholar] [CrossRef]
- Zhao, R.; Li, Y.; Chen, J.; Ma, M.; Fan, L.; Lu, W. Mapping a Paddy Rice Area in a Cloudy and Rainy Region Using Spatiotemporal Data Fusion and a Phenology-Based Algorithm. Remote Sens. 2021, 13, 4400. [Google Scholar] [CrossRef]
- Bian, C.; Shi, H.; Wu, S.; Zhang, K.; Wei, M.; Zhao, Y.; Sun, Y.; Zhuang, H.; Zhang, X.; Chen, S. Prediction of Field-Scale Wheat Yield Using Machine Learning Method and Multi-Spectral UAV Data. Remote Sens. 2022, 14, 1474. [Google Scholar] [CrossRef]
- Roman, L. Ukraine Can Feed the World. UkraineAlert. Atlantic Council. 4 March 2021. Available online: https://www.atlanticcouncil.org/blogs/ukrainealert/ukraine-can-feed-the-world/ (accessed on 20 June 2022).
- Jha, M.K.; Chowdary, V.M. Challenges of Using Remote Sensing and GIS in Developing Nations. Hydrogeol. J. 2006, 15, 197–200. [Google Scholar] [CrossRef]
- Liu, L.-T.; Liu, X.-J.; Lun, F.; Wu, L.; Lu, C.-X.; Guo, J.-H.; Qu, T.-T.; Liu, G.; Shen, L.; Cheng, S.-K. Research on China’s food security under global climate change background. J. Nat. Resour. 2018, 33, 927–939. [Google Scholar]
- Cheng, S.-K.; Li, Y.-Y.; Liu, X.-J.; Wang, L.-E.; Wu, L.; Lu, C.-X.; Xie, G.-D.; Liu, A.-M. Thoughts on food security in China in the new period. J. Nat. Resour. 2018, 33, 911–926. [Google Scholar]
Figure 1.
Study area—locations of 4 provinces and 6 hydrological stations represented by stars.

Figure 2.
Water level, five flood alerts and rice sowing schedule for middle reaches of the Yangtze River.
Figure 2.
Water level, five flood alerts and rice sowing schedule for middle reaches of the Yangtze River.

Figure 3.
Study area covered by Sentinel-1 images.

Figure 4.
Study area covered by 92 Sentinel-2 scenes.

Figure 5.
Study area with Copernicus Global Land Cover; pink for cropland, green for forest, blue for water, and red for built-up area.
Figure 5.
Study area with Copernicus Global Land Cover; pink for cropland, green for forest, blue for water, and red for built-up area.

Figure 6.
Workflow chart.

Figure 7.
Training samples: 172 points for water body and 172 points for cropland.

Figure 8.
Exclude permanent water body.

Figure 9.
Monthly composite flooding maps.

Figure 10.
Monthly flooding map in July and August 2020.

Figure 11.
Damaged cropland area map in July and August 2020.


Table 1.
Water level for middle reaches of the Yangtze River (unit: meter).
| Station Name | 6/2 | 6/12 | 6/28 | 7/3 | 7/5 | 7/12 | 7/18 | 7/24 | 7/27 | 7/29 | 8/5 | 8/15 | 8/18 | 8/27 |
|---|---|---|---|---|---|---|---|---|---|---|---|---|---|---|
| Zhicheng, Hubei | 39.70 | 39.65 | 43.26 | 46.30 | 45.76 | 43.00 | 46.23 | 48.19 | 46.95 | 47.19 | 45.93 | 46.98 | 47.42 | 46.42 |
| Shishou, Hubei | 30.36 | 31.36 | 35.45 | 37.44 | 37.52 | 37.54 | 38.27 | 39.45 | 39.12 | 39.17 | 38.18 | 38.05 | 38.25 | 38.45 |
| Jianli, Hubei | 28.38 | 29.84 | 33.42 | 35.11 | 35.38 | 36.15 | 36.32 | 37.22 | 37.08 | 37.12 | 36.17 | 35.66 | 35.79 | 36.29 |
| Jiujing, Jingxi | 12.27 | 16.05 | 17.77 | 18.87 | 19.68 | 22.74 | 22.18 | 21.92 | 21.77 | 21.73 | 21.18 | 20.01 | 19.73 | 19.68 |
| Anqing, Anhui | 8.77 | 12.39 | 13.93 | 14.95 | 15.54 | 18.21 | 18.02 | 17.82 | 17.6 | 17.64 | 17.07 | 15.98 | 15.71 | 15.53 |
| Datong, Anhui | 7.25 | 10.67 | 12.17 | 13.14 | 13.61 | 16.03 | 15.98 | 15.77 | 15.57 | 15.61 | 15.02 | 13.97 | 13.74 | 13.53 |
| Data time: Daily 08:00 am; early June–late August 2020 | ||||||||||||||
Table 2.
Inundation area and crop-affected area (1 km2 = 100 hectare).
| Inundation Area (km2) | Crop-Affected Area (km2) | |||
|---|---|---|---|---|
| Province | July | August | July | August |
| Anhui | 3699 | 4168 | 2039 | 2347 |
| Hubei | 7797 | 7105 | 4146 | 3533 |
| Hunan | 3410 | 4287 | 1588 | 1965 |
| Jiangxi | 7035 | 7503 | 3876 | 3501 |
| Total | 21,941 | 23,063 | 11,649 | 11,346 |
Table 3.
Output of grain crops harvested in summer per hectare (kg/hectare).
| Province | 2019 | 2018 | 2017 | 2016 | Mean |
|---|---|---|---|---|---|
| Anhui | 5842 | 5589 | 5825 | 5663 | 5730 |
| Hubei | 3645 | 3539 | 3582 | 3700 | 3616 |
| Hunan | 4035 | 4154 | 3572 | 3509 | 3818 |
| Jiangxi | 3748 | 3789 | 3601 | 3596 | 3683 |
| Total | 17,270 | 17,071 | 16,580 | 16,468 | 16,847 |
Table 4.
Sown area changes.
| (1000 ha) | 2017 | 2018 | 2019 | 2020 | 2020/2019 Change % |
|---|---|---|---|---|---|
| Total Sown Areas of Farm Crops | 166,331.00 | 165,902.38 | 165,931.00 | 167,487.00 | 0.94 |
| Sown Area of Grain Crops | 117,989.00 | 117,038.21 | 116,064.00 | 116,768.00 | 0.61 |
| Sown Area of Rice | 30,747.00 | 30,189.45 | 29,693.52 | 30,080.00 | 1.30 |
Table 5.
Grain crops and rice output changes.
| (10,000 tons) | 2017 | 2018 | 2019 | 2020 | 2020/2019 Change % |
|---|---|---|---|---|---|
| Output of Grain Crops | 66,160.73 | 65,789.22 | 66,384.00 | 66,949.20 | 0.85 |
| Output of Grain Crops Harvested in Summer | 14,174.46 | 13,881.02 | 14,160.00 | 14,286.00 | 0.89 |
| Output of Grain Crops Harvested in Autumn | 48,999.10 | 49,049.18 | 49,597.00 | 49,934.00 | 0.68 |
| Output of Cereal | 61,520.54 | 61,003.58 | 61,370.00 | 61,674.00 | 0.50 |
| Output of Rice | 21,267.59 | 21,212.90 | 20,961.00 | 21,186.00 | 1.07 |
| Output of Early Rice | 2987.16 | 2859.02 | 2627.00 | 2729.00 | 3.88 |
Table 6.
U.S. export to the PRC Grains and Feeds.
| Unit: MT | 2017 | 2018 | 2019 | 2020 | January–July 2020 | January–July 2021 | 2021/2020 Change % |
|---|---|---|---|---|---|---|---|
| Grains and Feeds | 9,127,355.90 | 4,951,992.40 | 3,005,759.80 | 16,703,734.40 | 5,457,918.60 | 22,702,279.60 | 316.00 |
| Corn | 811,069.00 | 290,460.00 | 312,473.00 | 7,052,133.00 | 857,222.00 | 15,351,846.00 | 1691.00 |
| Grain Sorghum | 4,603,556.00 | 2,660,222.00 | 1,004,182.00 | 5,529,616.00 | 2,910,232.00 | 4,303,861.00 | 48.00 |
| Wheat | 1,514,399.00 | 396,987.00 | 236,062.00 | 2,252,067.00 | 691,835.00 | 1,750,758.00 | 153.00 |
| Feed, Ingrd and Fod | 2,128,023.20 | 1,530,842.50 | 1,399,988.60 | 1,821,838.80 | 970,588.90 | 1,271,562.80 | 31.00 |
| Barley | 0.00 | 0.00 | 0.00 | 89.00 | 39.00 | 235.00 | 503.00 |
| Barley Products | 12.30 | 59.60 | 18.40 | 59.00 | 39.90 | 53.90 | 35.00 |
| Rice | 739.20 | 122.00 | 73.70 | 54.20 | 19.10 | 50.60 | 166.00 |
Publisher’s Note: MDPI stays neutral with regard to jurisdictional claims in published maps and institutional affiliations. |
© 2022 by the authors. Licensee MDPI, Basel, Switzerland. This article is an open access article distributed under the terms and conditions of the Creative Commons Attribution (CC BY) license (https://creativecommons.org/licenses/by/4.0/).
Share and Cite
MDPI and ACS Style
Wang, L.-C.; Hoang, D.V.; Liou, Y.-A. Quantifying the Impacts of the 2020 Flood on Crop Production and Food Security in the Middle Reaches of the Yangtze River, China. Remote Sens. 2022, 14, 3140. https://doi.org/10.3390/rs14133140
AMA Style
Wang L-C, Hoang DV, Liou Y-A. Quantifying the Impacts of the 2020 Flood on Crop Production and Food Security in the Middle Reaches of the Yangtze River, China. Remote Sensing. 2022; 14(13):3140. https://doi.org/10.3390/rs14133140
Chicago/Turabian StyleWang, Liang-Chen, Duc Vinh Hoang, and Yuei-An Liou. 2022. "Quantifying the Impacts of the 2020 Flood on Crop Production and Food Security in the Middle Reaches of the Yangtze River, China" Remote Sensing 14, no. 13: 3140. https://doi.org/10.3390/rs14133140
Note that from the first issue of 2016, this journal uses article numbers instead of page numbers. See further details here.