
Evaluating Satellite Sounders for Monitoring the Tropical Cyclone Environment in Operational Forecasting
by
 ,
,
Rebekah Esmaili
1,* ,
,
Christopher Barnet
1,
Jason Dunion
2,3,
Michael Folmer
4 and
Jonathan Zawislak
2,3 1
Science and Technology Corporation, Columbia, MD 21046, USA
2
NOAA/Atlantic Oceanographic and Meteorological Laboratory, Hurricane Research Division, Miami, FL 33149, USA
3
Cooperative Institute for Marine and Atmospheric Studies, University of Miami, Miami, FL 33149, USA
4
NOAA/Ocean Prediction Center, College Park, MD 20740, USA
*
Author to whom correspondence should be addressed.
Remote Sens. 2022, 14(13), 3189; https://doi.org/10.3390/rs14133189
Submission received: 18 May 2022
/
Revised: 24 June 2022
/
Accepted: 27 June 2022
/
Published: 2 July 2022
(This article belongs to the Special Issue Satellite Data Application, Validation, and Calibration for Atmospheric Observation II)
Abstract
:Tropical cyclones can form over open ocean where in situ observations are limited, so forecasters rely on satellite observations to monitor their development and track. We explore the utility of an operational satellite sounding product for tropical forecasting by characterizing the products retrieval skill during research flights. Scientists from both the NOAA-Unique Combined Atmospheric Processing System (NUCAPS) research team and tropical cyclone communities collaborated to target relevant tropical cyclones during the campaign. This effort produced 130 dropsondes that are well-timed with satellite sounder overpasses over three different tropical cyclones and one Saharan Air Layer outbreak. For the combined infrared and microwave retrieval, the NUCAPS temperature has a root mean square error (RMSE) of 1.2 K near the surface (1000–600 mb) and 0.8 K in the mid-troposphere (600–300 mb), which is in line with global product requirements. The water vapor mixing ratio RMSE was 26% near the surface and 46% in the mid-troposphere. NUCAPS microwave-only retrievals can also be useful for cloudy scenes, with surface RMSE values of 4 K (temperature) and 23% (water vapor). Using information content analysis, we estimated that the vertical resolution near the surface was 1.7 km for the temperature retrievals and 2.2 km for the water vapor retrievals in this study. We discuss the feasibility of implementing NUCAPS in an operational forecasting setting, which requires rapid data delivery to forecaster software tools.
1. Introduction
Rawinsondes provide high-resolution in situ observations of temperature, water vapor, and winds for numerical weather prediction and for real-time monitoring of hazardous weather. In the United States, rawinsondes are typically released twice a day from 144 sites maintained by the National Weather Service (NWS) at 00 and 12 UTC, with additional rawinsonde launches in regions of enhanced risk. Since 2015, satellite sounding retrievals of temperature and water vapor from the NOAA Unique Combined Atmospheric Processing System (NUCAPS) were adopted by forecasters to monitor pre-convective weather over land [1]. NUCAPS has been useful because retrievals from a single low earth orbit satellite can provide up to 324,000 profiles a day in both clear and partly cloudy scenes and often occur between scheduled rawinsonde launch times. Furthermore, NUCAPS retrievals are independent of forecasting models, so both measurements can be synthesized to assess risk. Most importantly, NUCAPS is delivered to forecasters within 60 min of an overpass and thus meets forecaster short-term prediction latency requirements [2]. By partnering with forecasters, researchers were able to (i) ensure that NUCAPS accurately measures the pre-convective environment and (ii) it is distributed in a way that forecasters can easily incorporate the results into their analysis.
This paper assesses NUCAPS’ ability to complement in situ profiling instruments that are used to monitor the tropical cyclone environment. Tropical cyclones often form thousands of miles from land, so rawinsondes do not consistently measure the full life cycles of these storms. GPS dropsondes are therefore deployed from aircraft to measure profiles of temperature, water vapor, and wind in the tropical cyclone environment. Aircraft deployments are costly, only routinely operate in the western North Atlantic and eastern and central North Pacific, and typically only fly when a tropical cyclone threatens life and property. As such, most tropical cyclones that occur each year across the globe are unobserved by in situ observing platforms. As is the case for severe convection, satellite soundings can potentially provide forecasters with additional observations when dropsondes are not available. Forecasters presently use microwave soundings as part of a suite of meteorological satellites to monitor tropical cyclone intensity and track [3] but not temperature and water vapor retrievals. Until recently, NUCAPS was not displayable in the National Hurricane Center (NHC) software system, which is an Advanced Weather Interactive Processing System (AWIPS) built on legacy GEneral Meteorology PAcKage (GEMPAK) software libraries. For the NWS, NUCAPS is delivered via the Satellite Broadcast Network (SBN) and displayed in the newer AWIPS-II software package. However, NHC has recently migrated to AWIPS-II; thus, the use of NUCAPS is now operationally possible for monitoring tropical cyclones.
NUCAPS was globally validated to ensure that it meets NOAA operational requirements for accuracy and precision [4,5]. NUCAPS has shown promise for detecting a variety of significant weather events [6], but it has not yet been quantitatively evaluated for tropical cyclone monitoring. For a tailored evaluation, we partnered with NOAA’s Intensity Forecast Experiment (IFEX) [7], which operates annual research flights to collect observations across the tropical cyclone life cycle and environmental conditions. In 2021, the campaign evolved into the Advancing the Prediction of Hurricanes Experiment (APHEX) and broadened the research scope to include better forecasting and communication of all storm hazards [8]. By collaborating with tropical cyclone researchers, NUCAPS developers could target phenomena of interest and obtain a set of dropsondes that are well timed with the satellite overpass for validation. Direct demonstration and collaboration between developers, researchers, and forecasters has been successful in the past for transitioning products from research to operational use [1,9,10,11]. So, this study was designed to be a targeted evaluation of NUCAPS, where we perform both validation statistics for tropical cyclone scenes and to solicit user feedback.
This paper presents both a quantitative evaluation of the NUCAPS product in tropical cyclone scenarios and documents efforts to transition NUCAPS from a hypothetical use case to an operational tool. We will describe NUCAPS, the research flights, and our statistical methods in Section 2. Section 3 will show the quantitative evaluation of the results from the collaborative flights, including statistical assessments and estimates of vertical resolution in the tropical cyclone environment. We will then discuss these results and how the experiment was conducted in real time in Section 4.
2. Materials and Methods
2.1. NUCAPS
The NUCAPS environmental data record (EDR) is based on the Atmospheric Infrared Sounder (AIRS) algorithm version 5 [12]. NUCAPS retrieves the atmospheric geophysical state, surface properties, and cloud parameters using microwave (MW) and infrared (IR) satellite sounding observations. The NUCAPS Algorithm Theoretical Basis Document (ATBD) [13] contains a detailed description of the NUCAPS algorithm, but we discuss here parts that are relevant to this manuscript. NUCAPS utilizes a modified optimal-estimation technique [14], which uses prior information (first guess) to solve an inverse problem. For NUCAPS temperature and water vapor retrievals from the NOAA-20 satellite, the first guess is a global eigenvector regression [15] from cloud-cleared CrIS and ATMS radiances that are trained on the European Centre for Medium-Range Weather Forecasts (ECMWF) global model. Optimal-estimation techniques can also account for error propagation throughout the algorithm, such as instrument noise or other uncertainty in the employed techniques.
NUCAPS retrievals include vertical profiles of temperature, water vapor, ozone, carbon monoxide, methane, carbon dioxide, nitric acid, nitrous oxide, sulfur dioxide, several cloud properties such as cloud top height and fraction, and surface properties. Each of these variables is retrieved in sequential order, using the previously solved variables and error characteristics to improve estimates of downstream variables. Each variable is retrieved using an optimal subset of the IR and MW channels, which is a method called channel selection [12,16]. The channels are chosen so that (i) the variable being solved for has spectral sensitivity and (ii) other variables not being solved for have little or no sensitivity. Channel selection increases algorithm processing speed, which is imperative for time-sensitive operational distribution, and it reduces instrument noise in the final retrieval. While NUCAPS retrieves many variables, we will focus on the air temperature, water vapor, and cloud retrievals in this paper.
NUCAPS uses cloud cleared radiances [12], which are constructed from a 3 × 3 array of CrIS or AIRS or 2 × 2 array of IASI collocated to ATMS, or AMSU, or AMSU + MHS observations on the same satellite, respectively. Cloud clearing infers the scene radiance if all clouds were removed, which eliminates the need for a complex (and possibly computationally slow and ill-posed) scattering model. Using this technique, robust retrievals are possible over clear to partly cloudy scenes with up to 80% cloud cover, thereby increasing the yield of successful observations. Since cloud clearing aggregates multiple sounder fields of view, implementing it results in a horizontal footprint that spans 50 km at nadir to 150 km at the scan edge. However, observations on these scales remain useful for operational forecasting on mesoscales (2–2000 km) and are within the normal horizontal drift ranges of rawinsondes.
In addition to the combined MW and IR retrieval (hereon the IR + MW retrieval), NUCAPS retrieves temperature, water vapor, liquid water path, and surface emissivity using only MW channels. The MW-only retrieval has not been evaluated by forecasters but is part of the EDR file for research purposes. Unlike the IR + MW retrieval, the MW-only retrieval uses (i) all available MW channels, (ii) does not employ cloud clearing, (iii) solves for all variables simultaneously, and (iv) has a lower vertical resolution. Clouds have a much smaller effect on MW radiances, so MW-only estimates are possible when there are uniform clouds or fully cloudy scenes, whereas the IR + MW retrieval is degraded. MW-only retrievals are flagged as degraded over precipitating scenes, where NUCAPS-derived estimates of the liquid water amount are significant. This removes about 2–3% of MW-only retrievals a day. We evaluate the NUCAPS MW-only retrieval because it may be useful for increasing the yield of successful observations near tropical cyclones. For instance, both the IR + MW and MW-only retrievals were successfully used to examine the diurnal cycle of tropical storms [17].
Aside from the cloud products, both the IR + MW and MW-only NUCAPS products are reported on a fixed vertical grid. The fixed vertical grid consists of 100 pressure levels for temperature retrievals and 100 layers defined by the level boundaries for water vapor and other trace gases, which are retrieved as a column density. The NUCAPS layer pressure (PL′) is defined to be the midpoint of the pressure levels (PL) above and below, which varies logarithmically with height:
The fixed vertical grid was chosen to ensure the data are stored consistently in files for all scenes without introducing gridding errors. These conditions are satisfied by reporting NUCAPS on the atmospheric transmission parameterization levels and layers in Stand-alone AIRS Radiative Transfer Algorithm (SARTA) [18,19], which is the radiative transfer algorithm employed by the NUCAPS IR + MW retrievals. The MW-only radiative transfer algorithm uses a method derived and updated by [20,21,22], which is then gridded to the 100 levels for comparability. Even for successful retrievals, IR and MW measurements have varying signal-to-noise as a function of pressure and by scene. Thus, the IR + MW contribution to the final retrieval is determined by their information content [14]. The information content is scene-dependent and is highest where cloud clearing errors are small, background thermal vertical gradients are large, and over the ocean [23]. Diagnostic parameters within NUCAPS can determine the vertical resolution of the final retrieval.
NUCAPS was designed to be satellite agnostic and capable of processing sounder data from a variety of satellites, including the CrIS/ATMS instruments on the Suomi NPP and NOAA-20 satellites, IASI/AMSU on MetOp-A/-B/-C, and AIRS/AMSU on Aqua. Of these, NOAA operationally supports NOAA-20 but also archives NUCAPS retrievals produced from the MetOp series satellites for research purposes. NOAA previously processed NUCAPS from Suomi NPP operationally but since 2021 has discontinued support due to IR band failures. In addition to delivery via SBN to NWS weather forecast offices (WFOs), NUCAPS is publicly distributed via the NOAA Comprehensive Large Array-data Stewardship System (CLASS), which is a database of environmental data. In this study, we ran an offline version of NUCAPS to perform an information content analysis, because while these fields are produced within NUCAPS, they are not written to the operational EDR file. At present, the NOAA Center for Satellite Applications and Research (STAR) is adding the necessary data to the EDR file, which will become publicly available for the full record in 2023.
2.2. Research Flight Plan
Five NOAA Gulfstream IV SP (G-IV) research flights were conducted as part of IFEX/APHEX over the tropical Atlantic and took place on 20 September 2018 (targeting a Saharan Air Layer outbreak), 18 September 2019 (Hurricane Jerry), 27–28 September 2019 (Hurricane Lorenzo), and 7 September 2021 (Hurricane Larry). Dropsondes were released from the G-IV aircraft, which had a typical altitude of 41–45 k feet (12.5–13.7 km), which roughly corresponds to 175–200 hPa. Each flight released on average 30 dropsondes, one roughly every 20 min during a typical 5 h flight after excluding the transit time to the research target. For optimal comparability, the flights were planned to be coincident with the satellite overpass in mid-flight. We typically have some dropsondes in the troposphere within 6 min of an overpass. Coordinating the flight in this fashion also ensured that most dropsondes were within 3 h and 150 km of a NOAA-20 and/or Suomi NPP overpass over the entire flight to optimize validation utility [4,5]. The 2019 flights were especially cost-effective because both Suomi NPP and NOAA-20 were operational, and their overpasses were only separated by an hour. In 2018 and 2021, only Suomi NPP and NOAA-20 were respectively operational.
The aircraft released Vaisala-RD41 dropsondes, which contain similar instrumentation to balloon-deployed rawinsondes but are more rugged to account for fast aircraft speeds [24,25]. Dropsondes complete the profile measurement more rapidly than rawinsondes (<15 min versus up to 2 h). While both are useful for validation, satellite soundings are instantaneous column measurements, so rapid profile collection is more desirable for comparisons.
Rather than define specific targets at the onset of the experiment, we closely collaborated with APHEX scientists to identify tropical cyclones of interest to the hurricane community as they developed. This approach helped us understand what applications are important to operations and better define quality requirements. We could also test if new data delivery methods and visualizations were useful for situational awareness [11].
All dropsonde data collected from the flights are publicly available on the NOAA/Atlantic Oceanographic and Meteorological Laboratory (AOML)/Hurricane Research Division’s Hurricane Data Webpage, https://www.aoml.noaa.gov/data-products/#hurricanedata (accessed on 7 September 2021).
2.3. Statistical Metrics
NUCAPS has been validated in research literature and as an ongoing effort in operations [4,5,26]. Ref. [26] provides a thorough discussion on the metrics used and their philosophical rationale, which we employ in this study for comparability and briefly summarize below. For temperature, the root-mean-square error (RMSE) for each pressure level is given by:
where is the retrieved temperature in Kelvin, T is the dropsonde temperature in Kelvin, L is the level index, j is the field of regard index, and n is the total number of matched profiles.
The temperature bias () takes the form:
The bias is useful for assessing the accuracy of the retrieval with the observed value. The standard deviation () is a combination of the bias and the RMSE:
Water vapor is usually examined as a percent difference from the dropsonde value instead of using its absolute magnitude. This is because water vapor is retrieved as a layer abundance (also called column density) and can vary on exponential scales with height. The percent difference for each level is expressed as:
where is the retrieved water vapor column density converted to mixing ratio (g water/kg air) and q is the dropsonde water vapor (converted from relative humidity to column density). The water vapor RMSE and bias are then expressed as:
where is the weighting factor. Weighting factors are used to account for large differences in the observed and retrieved water vapor values in a very dry atmosphere [5]. We use for the RMSE calculation and for the bias calculation for consistency with past studies. It follows that the standard deviation for ∆q at level is then:
Dropsondes measure environmental parameters at 2 Hz (pressure, temperature, and humidity) and 4 Hz (wind speed and direction), leading to observations on thousands of pressure levels, which vary for each profile. The dropsonde water vapor data were natively measured as relative humidity, which we converted to mixing ratio. These dropsonde temperature and water vapor mixing ratios profiles were linearly interpolated to the NUCAPS 100-level fixed pressure levels. The NUCAPS water vapor fields are all reported on pressure layers (see Section 2.1). To ensure all data were on the same vertical grid, the NUCAPS water vapor values were converted from pressure layers to pressure levels for this study. Since the NUCAPS layer pressure is the midpoint between the two NUCAPS pressure levels, water vapor was also converted from layer L′ to level L using a simple two-point mean:
We chose to evaluate NUCAPS variables on the 100-level fixed pressure grid because that is how they are delivered to forecasters and research users. NUCAPS can be validated on either the 100-level fixed pressure grid (fine levels) or on reduced pressure levels (coarse levels), which are the theoretical best possible vertical resolution of the IR + MW retrieval for the variable. The coarse-level statistics can be interpreted as an estimate of performance if averaging kernels were applied. In validation, temperature and water vapor, respectively, have 24 and 12 coarse levels, corresponding to a vertical resolution of roughly 1 km and 2 km.
2.4. Operational Requirements
In addition to assessing the quantitative skill of the product, we wanted to evaluate how NUCAPS can be implemented into NHC and Ocean Prediction Center (OPC) operations. The NHC provides guidance for tropical cyclones across the entire North Atlantic. For remnants or pre-cursors of tropical cyclones, the Tropical Analysis and Forecast Branch (TAFB) of NHC provides guidance south of 31˚N while OPC provides guidance north of 31˚N. Both centers work closely to inform the public, other forecast offices, and management agencies using text and graphical guidance relating to tropical cyclones and disturbances. To introduce NUCAPS to the operational process, we consider the (i) accuracy for monitoring and forecasting, (ii) quality control, (iii) latency, (iv) spatial coverage, and (v) display within forecaster software systems. The methods in the preceding sections help assess (i) and (ii).
Product latency is defined as the time difference from when an observation is made to when it arrives in front of the forecaster. Latency is critical to forecasting, as the atmosphere can rapidly change and forecasters must quickly and accurately synthesize model, in situ, and satellite observations to disseminate watches and warnings to the public.
In operational forecasting, the MW and IR sounding data are downlinked at the command and data acquisition (CDA) sites in Svalbard and McMurdo. The MW and IR sounder data from NOAA-20 are then ingested by the NUCAPS algorithm, and the resulting retrieval products are delivered to forecasters within ≈60 min using the SBN. The direct broadcast data stream is an alternative data access route, where a ground receiver station can capture MW and IR sounder data within its line of sight [27,28]. Using direct broadcast, IR and MW sounding observations have a lower latency (≈20 min) but with regional coverage.
NHC and OPC display satellite data using the NCEP AWIPS (N-AWIPS) system, which was first deployed in 1994. Both centers are migrating to the newer AWIPS-II architecture. NUCAPS has been extensively evaluated for display in the AWIPS-II through the Hazardous Weather Testbed (HWT) [1,29]. However, because NUCAPS is not displayable in N-AWIPS, we evaluated alternative display options during the campaign.
NUCAPS was delivered as both a graphical skew-T and a gridded “plan view” format [29]. We chose to distribute the graphics using a web-based display because it is easily accessible and does not take up additional space on a crowded AWIPS display. Forecasters at times must work remotely, and web tools enable access outside of AWIPS. Display in the AWIPS-II remains important, as it allows for overlay and comparison with other products, but it was not assessed in this study.
3. Results
3.1. Hurricane Jerry (2019) Case Study
The authors collaborated on a total of five NOAA G-IV flights. For brevity, we focus on the 18 September 2019 flight around Hurricane Jerry, because this mission allowed us to evaluate both moist and dry air masses. Figure 1 shows the locations of coincident dropsondes and NUCAPS retrievals from NOAA-20 for the 18 September 2019 flight around Hurricane Jerry. The collocations are numbered in sequence, and the color-coded dots show where IR + MW retrieval succeeded (green), where the MW-only retrieval succeeded (yellow), and where both were rejected (red). The background airmass RGB image [30] was created from the GOES-16 advanced baseline imager (ABI) channels 8 (6.2 μm), 10 (7.3 μm), 12 (9.6 μm), and 13 (10.3 μm). The airmass RGB shows regions of dry low- to mid-level air (warmer hues) wrapping around Hurricane Jerry to the west and moist tropical [31] air masses (cooler hues) to the south. The dashed contour line is illustrative and drawn from the difference between 6.2 and 7.3 μm to help distinguish airmasses. This flight sampled a mixture of both regimes in the hurricane environment, with dropsonde numbers 0–4, 9–12, and 18–19 sampling the moist tropical air and dropsonde numbers 5–8, 13–17, and 20 sampling dryer air associated with a Saharan Air Layer outbreak and a mid-latitude dry air intrusion [31]. The remaining sondes (21–24) sampled the hurricane.
This flight sampled different airmass regimes, and Figure 2 shows the resulting profiles from the collocations. The color-coded squares on the x-axis show the same quality flags from Figure 1; all but the last four IR + MW retrievals were successful. The NUCAPS temperature and water vapor mixing ratio both show good agreement with the dropsonde when the IR + MW retrieval was successful. Temperature smoothly varies with space, so differences in the vertical resolution between the dropsonde and NUCAPS are less noticeable (Figure 2c). For water vapor, more structure is present in the dropsonde (Figure 2d) due to its higher vertical sampling and often narrower footprint than in NUCAPS (Figure 2e), resulting in larger differences between the two. Interestingly, the airmass RGB in Figure 1 shows that dropsonde numbers 13–16 are in a dryer region, but both NUCAPS and dropsondes cross-sections indicate this region is rather moist. While the magnitudes do not have perfect agreement (Figure 2f), NUCAPS captures the horizontal water vapor gradients and the vertical structure well compared to the dropsonde.
3.2. Retrieval Diagnostics
NUCAPS retrievals are color coded to help forecasters quickly assess the retrieval quality and are a function of numerous internal statistical checks. The diagnostic parameters are written to the NUCAPS-EDR file for researchers to understand why a particular retrieval was successful or rejected. The degrees of freedom (DOF; Figure 3a) are calculated from the trace of the averaging kernel matrix (AKM) and a measure of the retrieval information content. The DOF are interpreted as the number of fully independent levels in the retrieved profile, where higher values indicate greater measurement skill. Temperature can have up to 7 DOFs in the tropics [23], although more recent work showed typical temperature DOF values between 4 and 5 over the tropical Atlantic [32]. For the 8 September 2019 flight, the temperature DOFs were closer to 4. The bars in Figure 3 are again color coded using the same scheme as Figure 1 and Figure 2 to indicate retrieval quality. Note that there are fewer DOFs for temperature profiles when the IR + MW retrieval had a rejection flag (yellow or red). The water vapor DOFs (Figure 3b) range from 2.5 to 3.0, which are fewer than the average of 5 DOFs in past studies on the vertical resolution of satellite sounder retrievals [23].
The chi-squared of a variable is the residual from observed and estimated values normalized by the instrument and geophysical noise. Chi-squared values at or below 1.0 indicate high signal-to-noise. For this flight, successful IR + MW had a chi-squared temperature statistic of less than 1.0, and the rejected IR + MW temperature retrievals had a chi-squared value greater than 1.1 (Figure 3c). For water vapor, most of the successful IR + MW retrievals had a chi-squared value less than 1.0, although sondes 15–16 were less than 2.0 (Figure 3d). The rejected water vapor retrievals had chi-squared values greater than 3.0. NUCAPS automatically rejects retrievals when the chi-squared of temperature exceeds 4 or the chi-squared of water vapor exceeds 5, which are 2.0 and 2.2 more noise than signal, respectively.
Figure 3e,f show the total cloud fraction and the chi-squared of the cloud clearing. Cloud fraction and height are retrieved variables in NUCAPS and not diagnostic parameters, but they show where retrievals may have less skill in the column. The total cloud fraction in Figure 3e shows that the IR + MW retrieval was successful over partly cloudy scenes, while the MW-only retrieval was successful over cloudy conditions. Scenes where the retrieved total cloud fraction exceeds 80% are rejected. Figure 3f shows the chi-squared of the cloud clearing. Retrievals where this value exceeds 3.0 are automatically rejected, even if the total cloud fraction is below 80%. Examining the statistics above and rejection criteria, no single metric was the cause of failure. Instead, these retrievals were likely rejected due to a combination of smaller checks. This is apparent from visually inspecting the airmass RGB in Figure 1, but NUCAPS makes no a priori assumptions on the underlying cloud scenes. This demonstrates that the rejection criteria are performing as expected for this tropical cyclone case.
Given the number of diagnostics generated from NUCAPS, it is possible to tailor a new quality control scheme for tropical cyclone applications. However, our results here show that the existing method adequately flags unrealistic profiles, and at this point, we do not recommend a change.
3.3. Statistical Evaluation
Figure 4 examines the performance of all the flights combined for clear to partly cloudy scenes (quality flag green, Figure 4a,c) and cloudy but not precipitating scenes (quality flag yellow, Figure 4b,d) using the statistical metrics defined in Section 2.3. Each panel has a profile count (N) and a cloud fraction (CF%) in the upper right corner. The clear to partly cloudy scenes had an average cloud fraction of 27%, while cloudy scenes had an average of 83%. The IR + MW retrieval (blue lines) performed similarly to the MW-only retrieval (orange lines) in the mid-troposphere temperature retrievals (800–300 mb); however, the IR + MW has a lower RMSE and bias closer to the surface (<800 mb; Figure 4a). For scenes where the MW-only retrieval succeeded but the IR + MW was rejected (Figure 4b), the IR + MW retrieval has a larger RMSE than the MW-only retrieval above 800 mb, although the bias is somewhat lower. It is sensible to wonder why the IR + MW retrieval has a lower mean bias than the MW-only retrieval, even though cloud clearing (Section 2.1) likely failed. The reason for this is that the first guess of the NUCAPS uses all available channels, including MW. So, even if the information content of the IR measurements is low, it may perform similarly to the MW-only retrieval. When the IR + MW water vapor retrieval was successful (Figure 4c), it met or outperformed the MW-only retrieval. In cases where the IR + MW water vapor retrieval was rejected and the MW-only passed (Figure 4d), the RMSE value was again lower than the IR + MW retrieval, while the bias of both was similar.
Table 1 and Table 2 show the pressure layer average statistics. The Joint Polar Satellite System (JPSS) has established targeted performance statistics for NUCAPS. The performance requirements were established for global retrievals on coarse layers (defined in Section 2.3), so it is not expected that individual retrievals, 100-level statistics, and smaller studies exactly meet these thresholds. However, we make the comparison to the global requirements to provide context. The JPSS requirements for temperature are an RMSE at or below 1.6 K over clear to partly cloudy scenes and 2.5 K over cloudy scenes when averaged from the surface to 300 mb. The IR + MW retrieval temperature RMSE (1.04 K) meets the JPSS global threshold for clear to partly cloudy scenes. The MW-only temperature RMSE (2.7 K) almost meets cloudy scene requirements, although the RMSE is significantly higher below 600 mb than between 600 and 300 mb. The JPSS requirement for water vapor retrievals has a percent average requirement of 20% below 600 mb. The IR + MW retrieval for water vapor retrieval over clear to partly cloudy scenes is 26% near the surface for the IR + MW retrieval and 23% for the MW-only retrieval over cloudy scenes, so neither make this threshold. In mid-levels (600–300 mb), the RMSE is 46% and 43% for these same two combinations of scenes and retrievals, respectively. Again, these do not meet the JPSS percent average requirements. The lower-than-usual performance is likely due to the small sample size compared (130 profiles) with global validation studies (hundreds of thousands of profiles) and because we focused on the tropical cyclone environment, which are challenging retrieval scenes.
A caveat in this analysis is that we removed two instances of supersaturation, which is a documented problem where the NUCAPS algorithm produces unrealistic mixing ratios. The 2018 and 2019 flights used NUCAPS version 2, while the 2021 flight was processed using version 3, which corrected the problem. NOAA focuses on the continuous delivery of Earth observations and so rarely re-processes past data to a consistent version. Instead, data are archived in the version that was distributed at the time of the observation. We removed unrealistic values (mixing ratios > 60 g/kg) because these are unphysical, and the problem has already been addressed in production.
3.4. Estimating the Vertical Resolution of Temperature and Water Vapor Retrievals
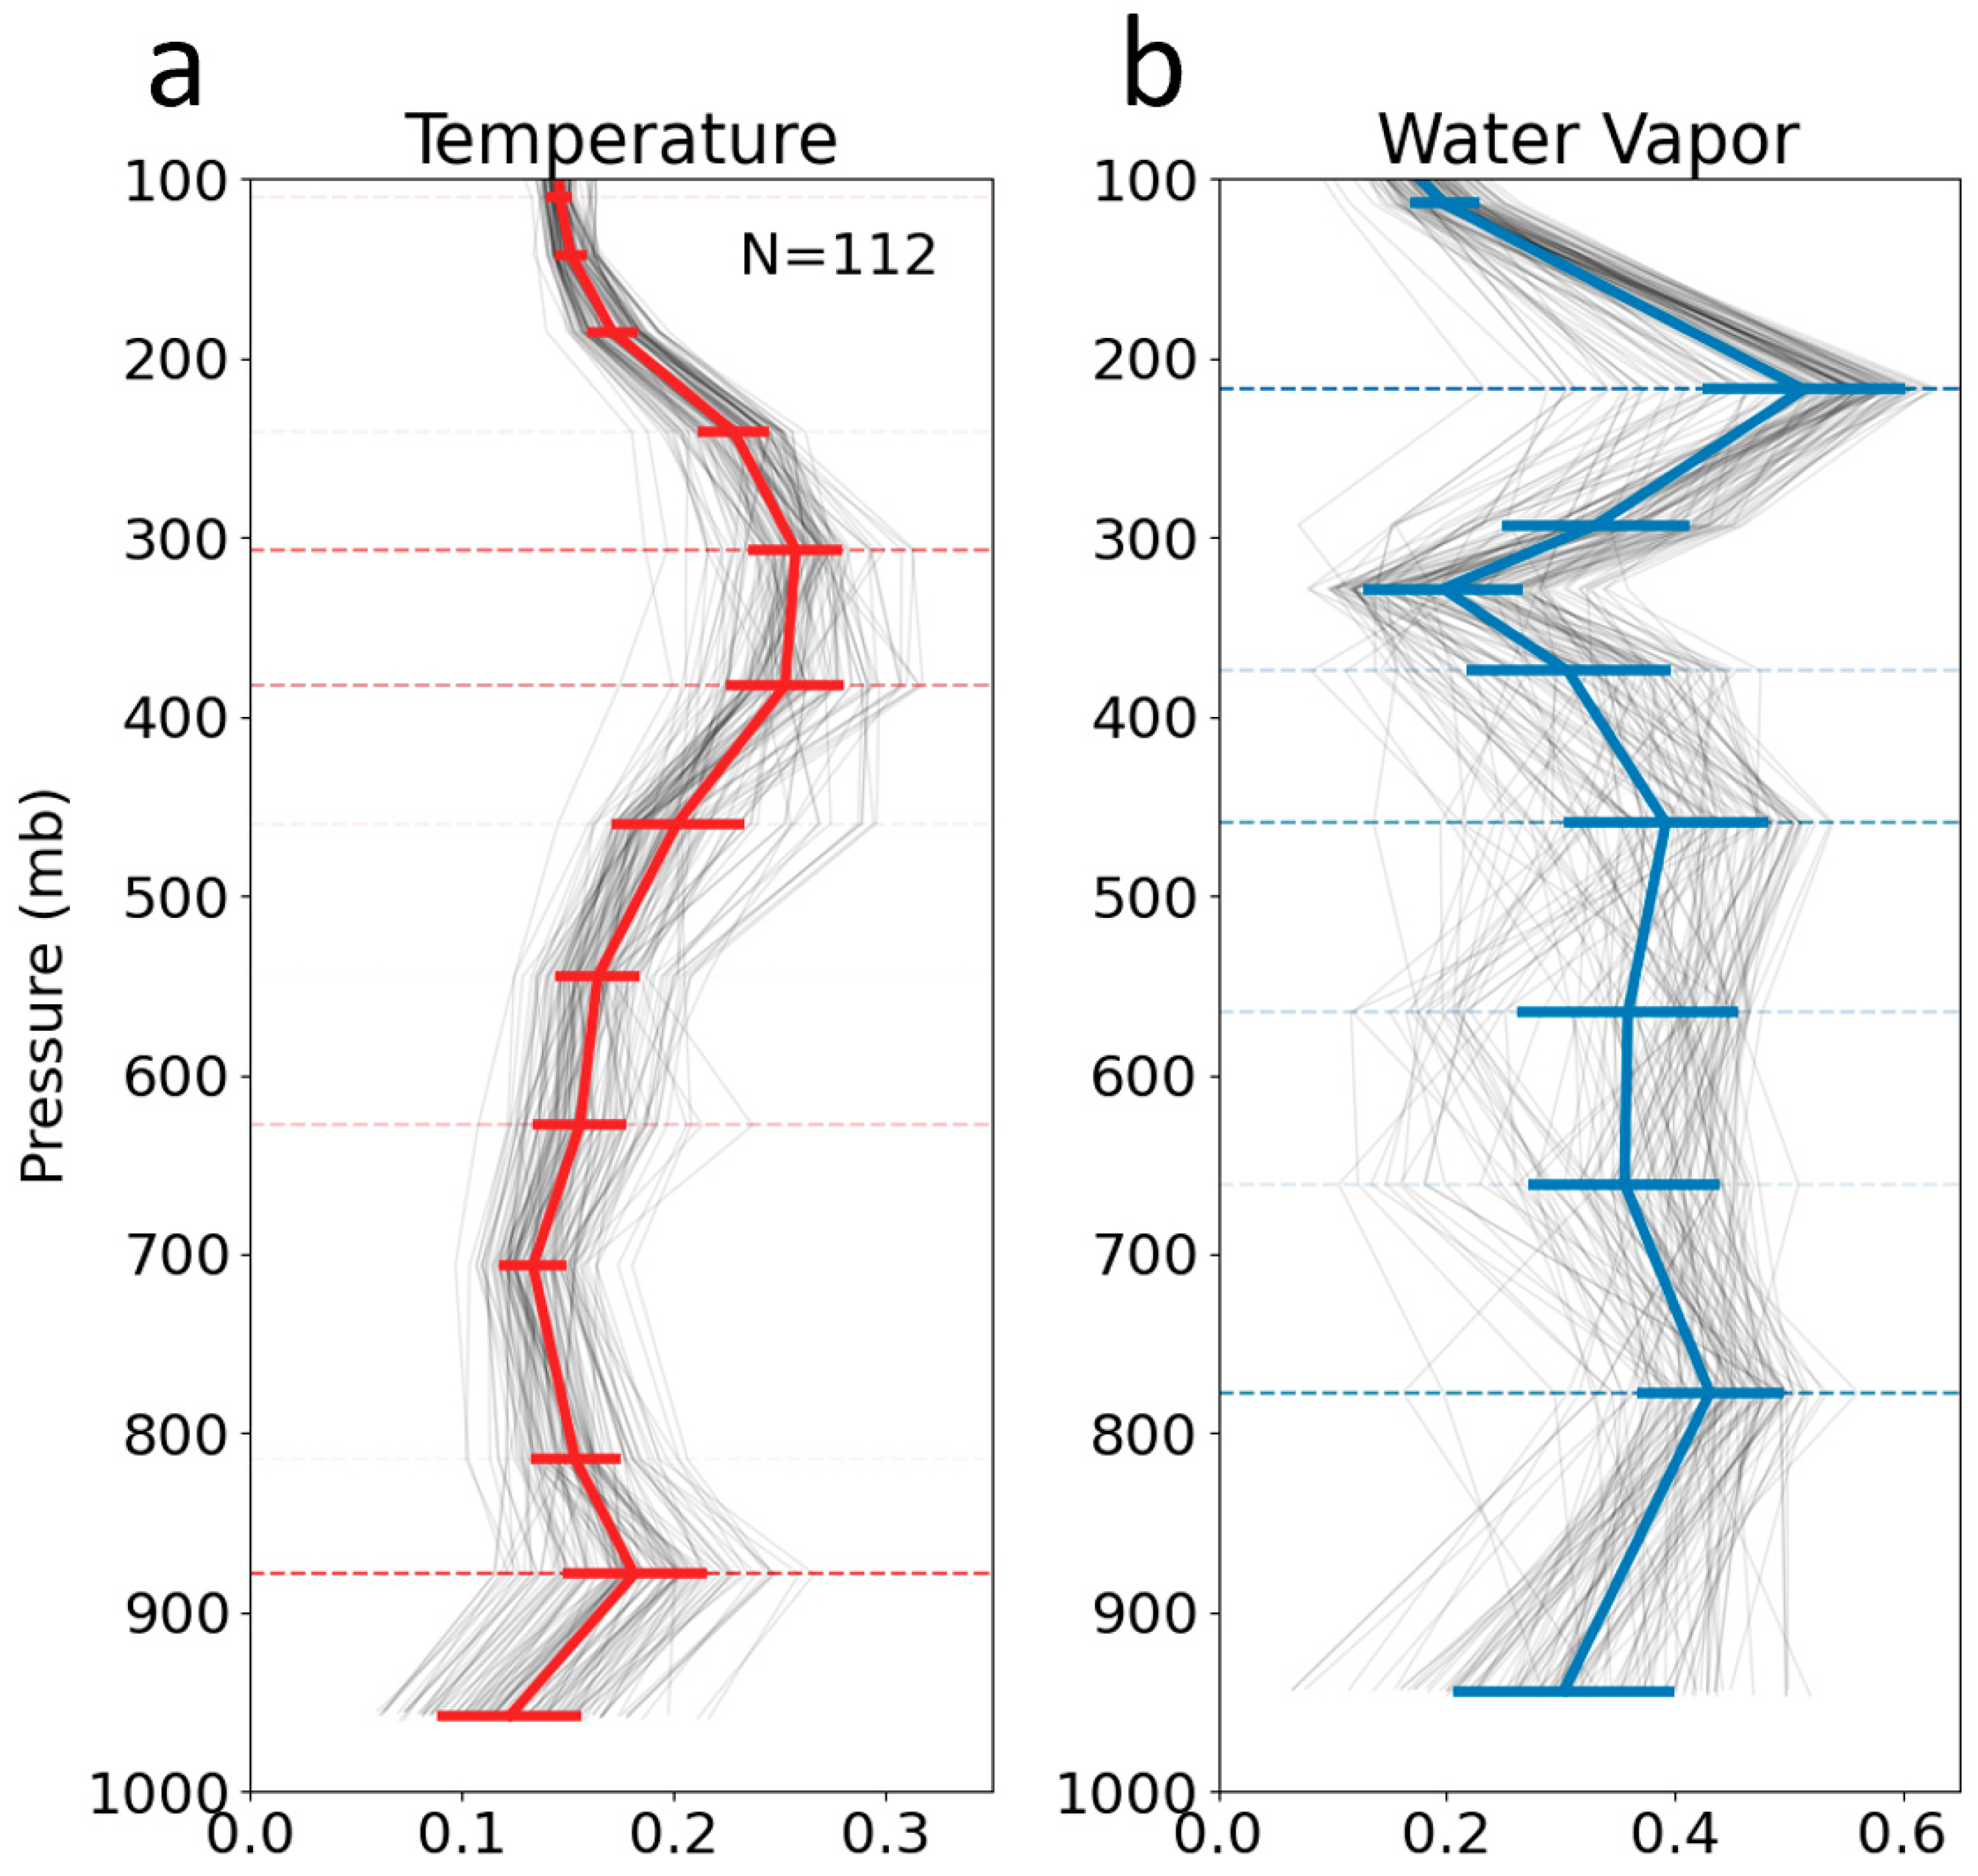
The averaging kernel matrix (AKM) of the scene shows the degree to which the IR + MW retrieval updated the first guess measurements. AKM values range from 0 to 1, where smaller values indicate that the final retrieval is primarily from the first guess, while the latter indicates that the first guess is replaced by the retrieved value. The typical values fall in the middle of this range. AKMs are calculated using the approach of [7]; these were developed for AIRSv5 [23] and inherited by NUCAPS [33]. Figure 5 shows the AKM of the NUCAPS coarse pressure levels for profiles where the IR + MW retrieval succeeded. Smaller lines show the AKMs of the individual profiles, while the thick colored lines show the average, and the thick horizontal lines show the standard deviation. The AKM values of retrievals collocated with the flight dropsondes range from 0 to 0.2 for temperature (Figure 5a) and between 0.25 and 5.0 for water vapor (Figure 5b), but the latter have greater variability from scene to scene. Note that the profile count of successful retrievals (N = 112) is inconsistent with the analysis in the previous section (N = 130) because the AKMs were generated offline using the science code, which differs from the NUCAPS-EDR. Furthermore, input data were downloaded using the direct broadcast network (Section 2.4) to lower data latency. Direct broadcast downlinks seven CrIS fields of regard instead of nine at the scan edge, which may impact cloud clearing.
The vertical resolution of the retrieval can be estimated from the local maxima (or peaks) in the AKMs. The peaks are indicated on the plots using horizontal dashed lines, which are darker where more profiles have the same peak location on the coarse pressure levels. We estimated the peaks by searching for values where the averaging kernel for a given pressure level was larger than its neighboring points. More complex methods, such as full width at half-maximum (FWHM), can also be employed when AKMs are heavily skewed. The distance between peaks was then converted from pressure to height (km) above the surface, assuming a standard atmosphere. The height values from AKM peaks were then subtracted to estimate the layer thickness (km).
The average vertical resolution of successful IR + MW retrievals of temperature and water vapor for all matched flights is summarized in Table 3. Near the surface, NUCAPS could retrieve temperature and water vapor with a 1.7 km resolution and 2.2 km, respectively, for all 181 profiles. These values agree with those in [28], which show that the global average resolution at 850 mb for NUCAPS temperature retrievals is 2–4 km, but it is closer to 1.6–3.0 km over the tropical Atlantic. The results in Table 3 are also consistent with [23], which estimate the vertical resolution of temperature and water vapor to be roughly 2.5 km and 2.8 km, respectively, over the Atmospheric Radiation Measurement (ARM) sites in the Southern Great Plains (36°N, 97°W) in the United States and Manus Island (2°S, 147°E) in the tropical western Pacific. Sounding retrievals are often more skillful over ocean than land, which is in part because the IR surface emissivity is more homogenous than over land.
3.5. Evaluating Data Latency, Coverage, and Display
Meeting latency, spatial coverage, and display requirements are challenges when introducing a new satellite product to the tropical cyclone forecasting workflow. To estimate the minimum possible NUCAPS latency, we delivered the data to campaign organizers in real time using direct broadcast receivers. We found that the direct broadcast pathway reduced the NUCAPS latency to ≈30 min in the Atlantic region using the Miami, Florida and Puerto Rico antenna sites. Of the five flights, all had at least one satellite overpass within the range of the receiver antennas. The NOAA-20 overpass on 29 September 2019 was not in direct broadcast range over Hurricane Lorenzo (22.9°N, 45.0°W), which was much further east than the other flights. In fact, Lorenzo became the strongest category 5 storm to form over the eastern Atlantic basin [34]. However, while NOAA-20 was too far to the east, the Suomi NPP overpass was further west and in range, so NUCAPS was still delivered in real time. While tropical cyclones in the eastern Atlantic can be out of range, we found that the rapid delivery of NUCAPS was consistently possible over the southwestern Atlantic and Caribbean.
We delivered NUCAPS to NOAA Hurricane Field Program organizers in a graphical Skew-T format and through web-based displays, which we customized for the campaign. For example, Skew-T plots included collocations with aircraft dropsondes, NUCAPS, and the NOAA Global Forecast System (GFS) to provide real-time validation to all team members. We delivered retrieval variables, such as cloud fraction and cloud top height, and profiles from multiple satellites, neither of which are available in operations due to SBN bandwidth limitations. The web display showed spatial maps of temperature and water vapor DOFs to visually assess the vertical resolution. These tools were a component of daily tropical weather map discussions presented by the NOAA/AOML/Hurricane Research Division.
Through the JPSS proving ground and risk reduction program (PGRR), ideas demonstrated in these display tools were synthesized into the NASA Short-term Prediction Research and Transition Center (SPoRT) web display tool [35]. This work also led to the integration of real-time NUCAPS into the Sounding and Hodograph Analysis and Research Program in Python (SHARPpy) [36], which is an open-source software that emulates how AWIPS displays sounding data. Hurricane forecasters thus have an assortment of tools to access NUCAPS to augment NUCAPS in AWIPS-II once the migration from N-AWIPS is complete.
4. Conclusions
In this paper, we evaluated NUCAPS satellite sounding retrievals of temperature and water vapor for monitoring tropical cyclones while taking into consideration operational needs. To do this, a team of NUCAPS developers and tropical cyclone researchers collaborated to deploy dropsondes from aircraft for tropical cyclone cases that were relevant to operations and where satellite soundings could be useful for monitoring. Using the coincident temperature and water vapor profiles from five flights, we found that the NUCAPS vertical resolution of ≈2 km in the tropical North Atlantic was sufficient for resolving the atmospheric structure of the tropical cyclone environment, including dry and moist conditions. NUCAPS can be used alongside other satellite imagery or model data since the retrievals are independent of both. Presently, the NWS currently only receives the IR + MW retrieval. However, we found that the MW-only temperature retrieval has a relatively low RMSE (≈1.33–1.62 K) above 600 mb when compared to scenes where a successful IR + MW retrieval is possible (≈0.83–1.21 K). The MW-only water vapor retrieval performed well through the entire column, with RMSE values 23% near the surface compared with the 26% when a successful IR + MW retrieval was possible. Utilizing successful MW-only retrievals can help increase the yield of profiles when the IR + MW retrievals are rejected, such as near the tropical cyclone edge, where there is significant cloud coverage but no precipitation.
More than a validation study, we viewed these flights as an opportunity to engage with end users, demonstrate how well NUCAPS can be provided in real time, and test new display tools. Although highly complex, NUCAPS was designed to be a fast, operational system, so we were able to perform collocations as soon as 20 min after the dropsonde release. Rapid processing was also possible because input MW and IR data were obtained immediately following the NOAA-20 and Suomi NPP overpasses from the Miami, Florida and Puerto Rico direct broadcast receivers. We also delivered gridded NUCAPS fields and diagnostics in real time during the flight using web-based tools. Hence, this study is also an operational evaluation, where we consider both the quantitative skill of NUCAPS and the operational feasibility. We encourage other satellite product developers to use this research to operations framework as they refine their operational products.
Author Contributions
Conceptualization, R.E., C.B. and M.F.; formal analysis, R.E. and C.B.; software, R.E. and C.B.; resources, J.D. and J.Z.; data curation, R.E., J.D. and J.Z.; writing—original draft preparation, R.E.; writing—review and editing, C.B., J.D., M.F. and J.Z.; visualization, R.E.; funding acquisition, C.B., M.F. and R.E. All authors have read and agreed to the published version of the manuscript.
Funding
This research was funded through the Joint Polar Satellite System (JPSS) Proving Ground and Risk Reduction Program (PGRR). The publication costs were paid for by Science and Technology Corp.
Data Availability Statement
NUCAPS data are available via NOAA CLASS www.class.noaa.gov (accessed on 9 September 2021) and dropsonde data are available from the Hurricane Research Divisions public archive, https://www.aoml.noaa.gov/data-products/#hurricanedata (accessed on 9 September 2021).
Acknowledgments
The authors thank the JPSS Proving Ground and Risk Reduction Program for fostering collaboration between product developers and data users to improve the research-to-operations feedback loop. Bonnie Reed made the initial connection between the authors’ common research interests, which grew into this fruitful project. JPSS funded the dropsondes used in this project, and the authors are appreciative of Lihang Zhou and Satya Kalluri for their ongoing support of this effort. We thank Science and Technology Corp for funding publication costs, thereby supporting open access to scientific research. We also thank the three anonymous reviewers for their feedback, which helped improve the quality and clarity of this manuscript.
Conflicts of Interest
The authors declare no conflict of interest.
References
- Esmaili, R.B.; Smith, N.; Berndt, E.B.; Dostalek, J.F.; Kahn, B.H.; White, K.; Barnet, C.D.; Sjoberg, W.; Goldberg, M.D. Adapting Satellite Soundings for Operational Forecasting within the Hazardous Weather Testbed. Remote. Sens. 2020, 12, 886. [Google Scholar] [CrossRef] [Green Version]
- Browning, K.A.; Collier, C.G. Nowcasting of precipitation systems. Rev. Geophys. 1989, 27, 345–370. [Google Scholar] [CrossRef]
- Velden, C.S.; Herndon, D. A Consensus Approach for Estimating Tropical Cyclone Intensity from Meteorological Satellites: SATCON. Weather Forecast. 2020, 35, 1645–1662. [Google Scholar] [CrossRef]
- Sun, B.; Reale, A.; Tilley, F.H.; Pettey, M.E.; Nalli, N.R.; Barnet, C.D. Assessment of NUCAPS S-NPP CrIS/ATMS Sounding Products Using Reference and Conventional Radiosonde Observations. IEEE J. Sel. Top. Appl. Earth Obs. Remote Sens. 2017, 10, 2499–2509. [Google Scholar] [CrossRef]
- Nalli, N.R.; Barnet, C.D.; Reale, A.; Tobin, D.; Gambacorta, A.; Maddy, E.S.; Joseph, E.; Sun, B.; Borg, L.; Mollner, A.K.; et al. Validation of satellite sounder environmental data records: Application to the Cross-track Infrared Microwave Sounder Suite. J. Geophys. Res. Atmos. 2013, 118, 13,628-13,643. [Google Scholar] [CrossRef]
- Kalluri, S.; Barnet, C.; Divakarla, M.; Esmaili, R.; Nalli, N.; Pryor, K.; Reale, T.; Smith, N.; Tan, C.; Wang, T.; et al. Validation and Utility of Satellite Retrievals of Atmospheric Profiles in Detecting and Monitoring Significant Weather Events. Bull. Am. Meteorol. Soc. 2022, 103, E570–E590. [Google Scholar] [CrossRef]
- Rogers, R.; Aberson, S.; Black, M.; Black, P.; Cione, J.; Dodge, P.; Dunion, J.; Gamache, J.; Kaplan, J.; Powell, M.; et al. The Intensity Forecasting Experiment: A NOAA Multiyear Field Program for Improving Tropical Cyclone Intensity Forecasts. Bull. Am. Meteorol. Soc. 2006, 87, 1523–1538. [Google Scholar] [CrossRef] [Green Version]
- Zawislak, J.; Rogers, R.F.; Aberson, S.D.; Alaka, G.J.; Alvey, G.R.; Aksoy, A.; Bucci, L.; Cione, J.; Dorst, N.; Dunion, J.; et al. Accomplishments of NOAA’s Airborne Hurricane Field Program and a Broader Future Approach to Forecast Improvement. Bull. Am. Meteorol. Soc. 2022, 103, E311–E338. [Google Scholar] [CrossRef]
- Ralph, F.M.; Intrieri, J.; Andra, D.; Atlas, R.; Boukabara, S.; Bright, D.; Davidson, P.; Entwistle, B.; Gaynor, J.; Goodman, S.; et al. The Emergence of Weather-Related Test Beds Linking Research and Forecasting Operations. Bull. Am. Meteorol. Soc. 2013, 94, 1187–1211. [Google Scholar] [CrossRef]
- Smith, N.; Shontz, K.; Barnet, C.D. What Is a Satellite Measurement? Communicating Abstract Satellite Science Concepts to the World; AMS: Austin, TX, USA, 2018. [Google Scholar]
- Esmaili, R.B.; Barnet, C.D. Campaign Situational Awareness from Satellite Data. In Field Measurements for Passive Environmental Remote Sensing; Elsevier: Amsterdam, The Netherlands, 2022; ISBN 978-0-12-823953-7. [Google Scholar]
- Susskind, J.; Barnet, C.D.; Blaisdell, J.M. Retrieval of atmospheric and surface parameters from AIRS/AMSU/HSB data in the presence of clouds. IEEE Trans. Geosci. Remote Sens. 2003, 41, 390–409. [Google Scholar] [CrossRef]
- Barnet, C.D.; Divakarla, M.G.; Gambacorta, A.; Iturbide-Sanchez, F.; Nalli, N.R.; Pryor, K.L.; Tan, C.; Wang, T.; Warner, J.; Zhang, K.; et al. The NOAA Unique Combined Atmospheric Processing System (NUCAPS) Algorithm Theoretical Basis Document (v3.1); National Oceanic and Atmospheric Administration: Washington, DC, USA, 2021.
- Rodgers, C.D. Inverse Methods for Atmospheric Sounding: Theory and Practice; Series on Atmospheric Oceanic and Planetary Physics; Reprinted; World Scientific: Singapore, 2004; ISBN 978-981-02-2740-1. [Google Scholar]
- Goldberg, M.D.; Qu, Y.; McMillin, L.M.; Wolf, W.; Zhou, L.; Divakarla, M. AIRS near-real-time products and algorithms in support of operational numerical weather prediction. IEEE Trans. Geosci. Remote Sens. 2003, 41, 379–389. [Google Scholar] [CrossRef]
- Gambacorta, A.; Barnet, C.D. Methodology and Information Content of the NOAA NESDIS Operational Channel Selection for the Cross-Track Infrared Sounder (CrIS). IEEE Trans. Geosci. Remote Sens. 2013, 51, 3207–3216. [Google Scholar] [CrossRef]
- Duran, E.L.; Berndt, E.B.; Duran, P. Observation of the Tropical Cyclone Diurnal Cycle Using Hyperspectral Infrared Satellite Sounding Retrievals. Mon. Weather Rev. 2021, 149, 3671–3690. [Google Scholar] [CrossRef]
- Strow, L.; Hannon, S.; De Souza-Machado, S.; Motteler, H.; Tobin, D. An overview of the AIRS radiative transfer model. IEEE Trans. Geosci. Remote Sens. 2003, 41, 303–313. [Google Scholar] [CrossRef] [Green Version]
- Strow, L.L.; Hannon, S.E.; De-Souza Machado, S.; Motteler, H.E.; Tobin, D.C. Validation of the Atmospheric Infrared Sounder radiative transfer algorithm. J. Geophys. Res. Atmos. 2006, 111, 1–24. [Google Scholar] [CrossRef]
- Rosenkranz, P.W. Rapid radiative transfer model for AMSU/HSB channels. IEEE Trans. Geosci. Remote Sens. 2003, 41, 362–368. [Google Scholar] [CrossRef]
- Rosenkranz, P.W.; Barnet, C.D. Microwave radiative transfer model validation. J. Geophys. Res. 2006, 111, D09S07. [Google Scholar] [CrossRef] [Green Version]
- Rosenkranz, P.W. Rapid Calculation of Microwave Opacity and Transmittance for Water-Vapor Atmospheric-Sounding Channels. IEEE Trans. Geosci. Remote Sens. 2022, 60, 1–4. [Google Scholar] [CrossRef]
- Maddy, E.; Barnet, C.D. Vertical Resolution Estimates in Version 5 of AIRS Operational Retrievals. IEEE Trans. Geosci. Remote Sens. 2008, 46, 2375–2384. [Google Scholar] [CrossRef]
- Vömel, H.; Dunion, J. Aircraft Dropsonde Campaigns. In Field Measurements for Passive Environmental Remote Sensing; Elsevier: Amsterdam, The Netherlands, 2022; ISBN 978-0-12-823953-7. [Google Scholar]
- Dropsonde RD41. Available online: https://www.vaisala.com/en/products/weather-environmental-sensors/dropsonde-rd41 (accessed on 6 April 2022).
- Nalli, N.R.; Gambacorta, A.; Liu, Q.; Barnet, C.D.; Tan, C.; Iturbide-Sanchez, F.; Reale, T.; Sun, B.; Wilson, M.; Borg, L.; et al. Validation of Atmospheric Profile Retrievals from the SNPP NOAA-Unique Combined Atmospheric Processing System. Part 1: Temperature and Moisture. IEEE Trans. Geosci. Remote Sens. 2018, 56, 180–190. [Google Scholar] [CrossRef]
- WMO. Guide to the Direct Broadcast Network for Near-Real-Time Relay of Low Earth Orbit Satellite Data: Attachment to the Guide to the WMO Information System; (WMO-No. 1061); WMO: Geneva, Switzerland, 2017. [Google Scholar]
- Gumley, L.; Goldberg, M.; Flynn, B.; Santek, D. NOAA Direct Broadcast Real-Time Network (DBRTN): Advanced Infrared and Microwave Sounder Data from Polar Orbiting Satellites for Numerical Weather Prediction (NWP) and Other Time-Sensitive Applications. In Proceedings of the Near-Real-Time/Low-Latency Data for Earth Science and Space Weather Applications I, Washington, DC, USA, 13 December 2018; Volume 2018, p. IN42B-07. [Google Scholar]
- Berndt, E.; Smith, N.; Burks, J.; White, K.; Esmaili, R.; Kuciauskas, A.; Duran, E.; Allen, R.; LaFontaine, F.; Szkodzinski, J. Gridded Satellite Sounding Retrievals in Operational Weather Forecasting: Product Description and Emerging Applications. Remote Sens. 2020, 12, 3311. [Google Scholar] [CrossRef]
- Berndt, E. Air Mass RGB Quick Guide. 2017. Available online: https://rammb.cira.colostate.edu/training/visit/quick_guides/QuickGuide_GOESR_AirMassRGB_final.pdf (accessed on 27 April 2022).
- Dunion, J. Rewriting the Climatology of the Tropical North Atlantic and Caribbean Sea Atmosphere. J. Clim. 2011, 24, 893–908. [Google Scholar] [CrossRef]
- Iturbide-Sanchez, F.; Liu, Q.; Gambacorta, A.; Barnet, C.; Nalli, N.R.; Tan, C.; Santos da Silva, S.R. Using Averaging Kernels to Study the Vertical Resolution of Nucaps Temperature and Water Vapor. In Proceedings of the 2017 IEEE International Geo-science and Remote Sensing Symposium (IGARSS), Fort Worth, TX, USA, 23–28 July 2017; pp. 33–35. [Google Scholar]
- Smith, N.; Barnet, C.D. Uncertainty Characterization and Propagation in the Community Long-Term Infrared Microwave Combined Atmospheric Product System (CLIMCAPS). Remote Sens. 2019, 11, 1227. [Google Scholar] [CrossRef] [Green Version]
- Zelinsky, D. National Hurricane Center Tropical Cyclone Report: Hurricane Lorenzo. Available online: https://www.nhc.noaa.gov/data/tcr/AL132019_Lorenzo.pdf (accessed on 1 March 2022).
- NASA Short-Term Prediction Research and Transition Center (SPoRT) Gridded NUCAPS Display. Available online: https://weather.msfc.nasa.gov/cgi-bin/sportPublishData.pl?dataset=griddednucaps (accessed on 18 May 2022).
- Blumberg, W.G.; Halbert, K.T.; Supinie, T.A.; Marsh, P.T.; Thompson, R.L.; Hart, J.A. SHARPpy: An Open-Source Sounding Analysis Toolkit for the Atmospheric Sciences. Bull. Am. Meteorol. Soc. 2017, 98, 1625–1636. [Google Scholar] [CrossRef]
Figure 1.
The G-IV flight path on 18 September 2019 between 14:00 and 19:00 UTC showing the dropsonde locations and the quality flag of the nearest match with the NUCAPS retrieval from NOAA-20 satellite. The background shows the GOES-16 Airmass RGB image at 16:00 UTC. The quality flag has three color values, which are green when the IR + MW retrieval passed (clear to partly cloudy scenes), yellow when the MW-only passed (cloudy scenes), and red when both were rejected (precipitating scenes). The dashed contour line is illustrative and drawn from the subtraction of ABI 6.2–7.3 μm channels.

Figure 2.
The top row shows the vertical pressure cross-sections (mb) for the (a) dropsonde temperature, (b) the NUCAPS temperature IR + MW retrieval from NOAA-20, and (c) the difference between (a,b). The bottom row shows (d) the dropsonde water vapor mixing ratio, (e) the NUCAPS water vapor IR + MW retrieval from NOAA-20, and (f) the difference between (d,e). Profiles shown are for the dropsonde collocations in Figure 1. The squares at the bottom of each plot represent the quality flag, as described in Figure 1.

Figure 3.
Select quality diagnostics for NUCAPS from NOAA-20 during the 18 September 2019 flight. The degrees of freedom (DOF) are shown for (a) temperature and (b) water vapor. The chi-squared residual errors are shown for (c) the temperature retrieval and (d) the water vapor retrieval. The cloud retrieval diagnostics are (e) the total cloud fraction and (f) the chi-squared residual error of cloud clearing. The bars are color coded by quality flag, as described in Figure 1.

Figure 4.
RMSE, bias, and standard deviation of IR + MW and MW-only retrievals for (a) temperature (K) over clear to partly cloudy scenes, (b) temperature (K) over cloudy scenes, (c) water vapor (%) over clear to partly cloudy scenes, and (d) water vapor (%) over cloudy scenes. Profile count (N) and cloud fraction (CF%) is indicated in the top right corner.
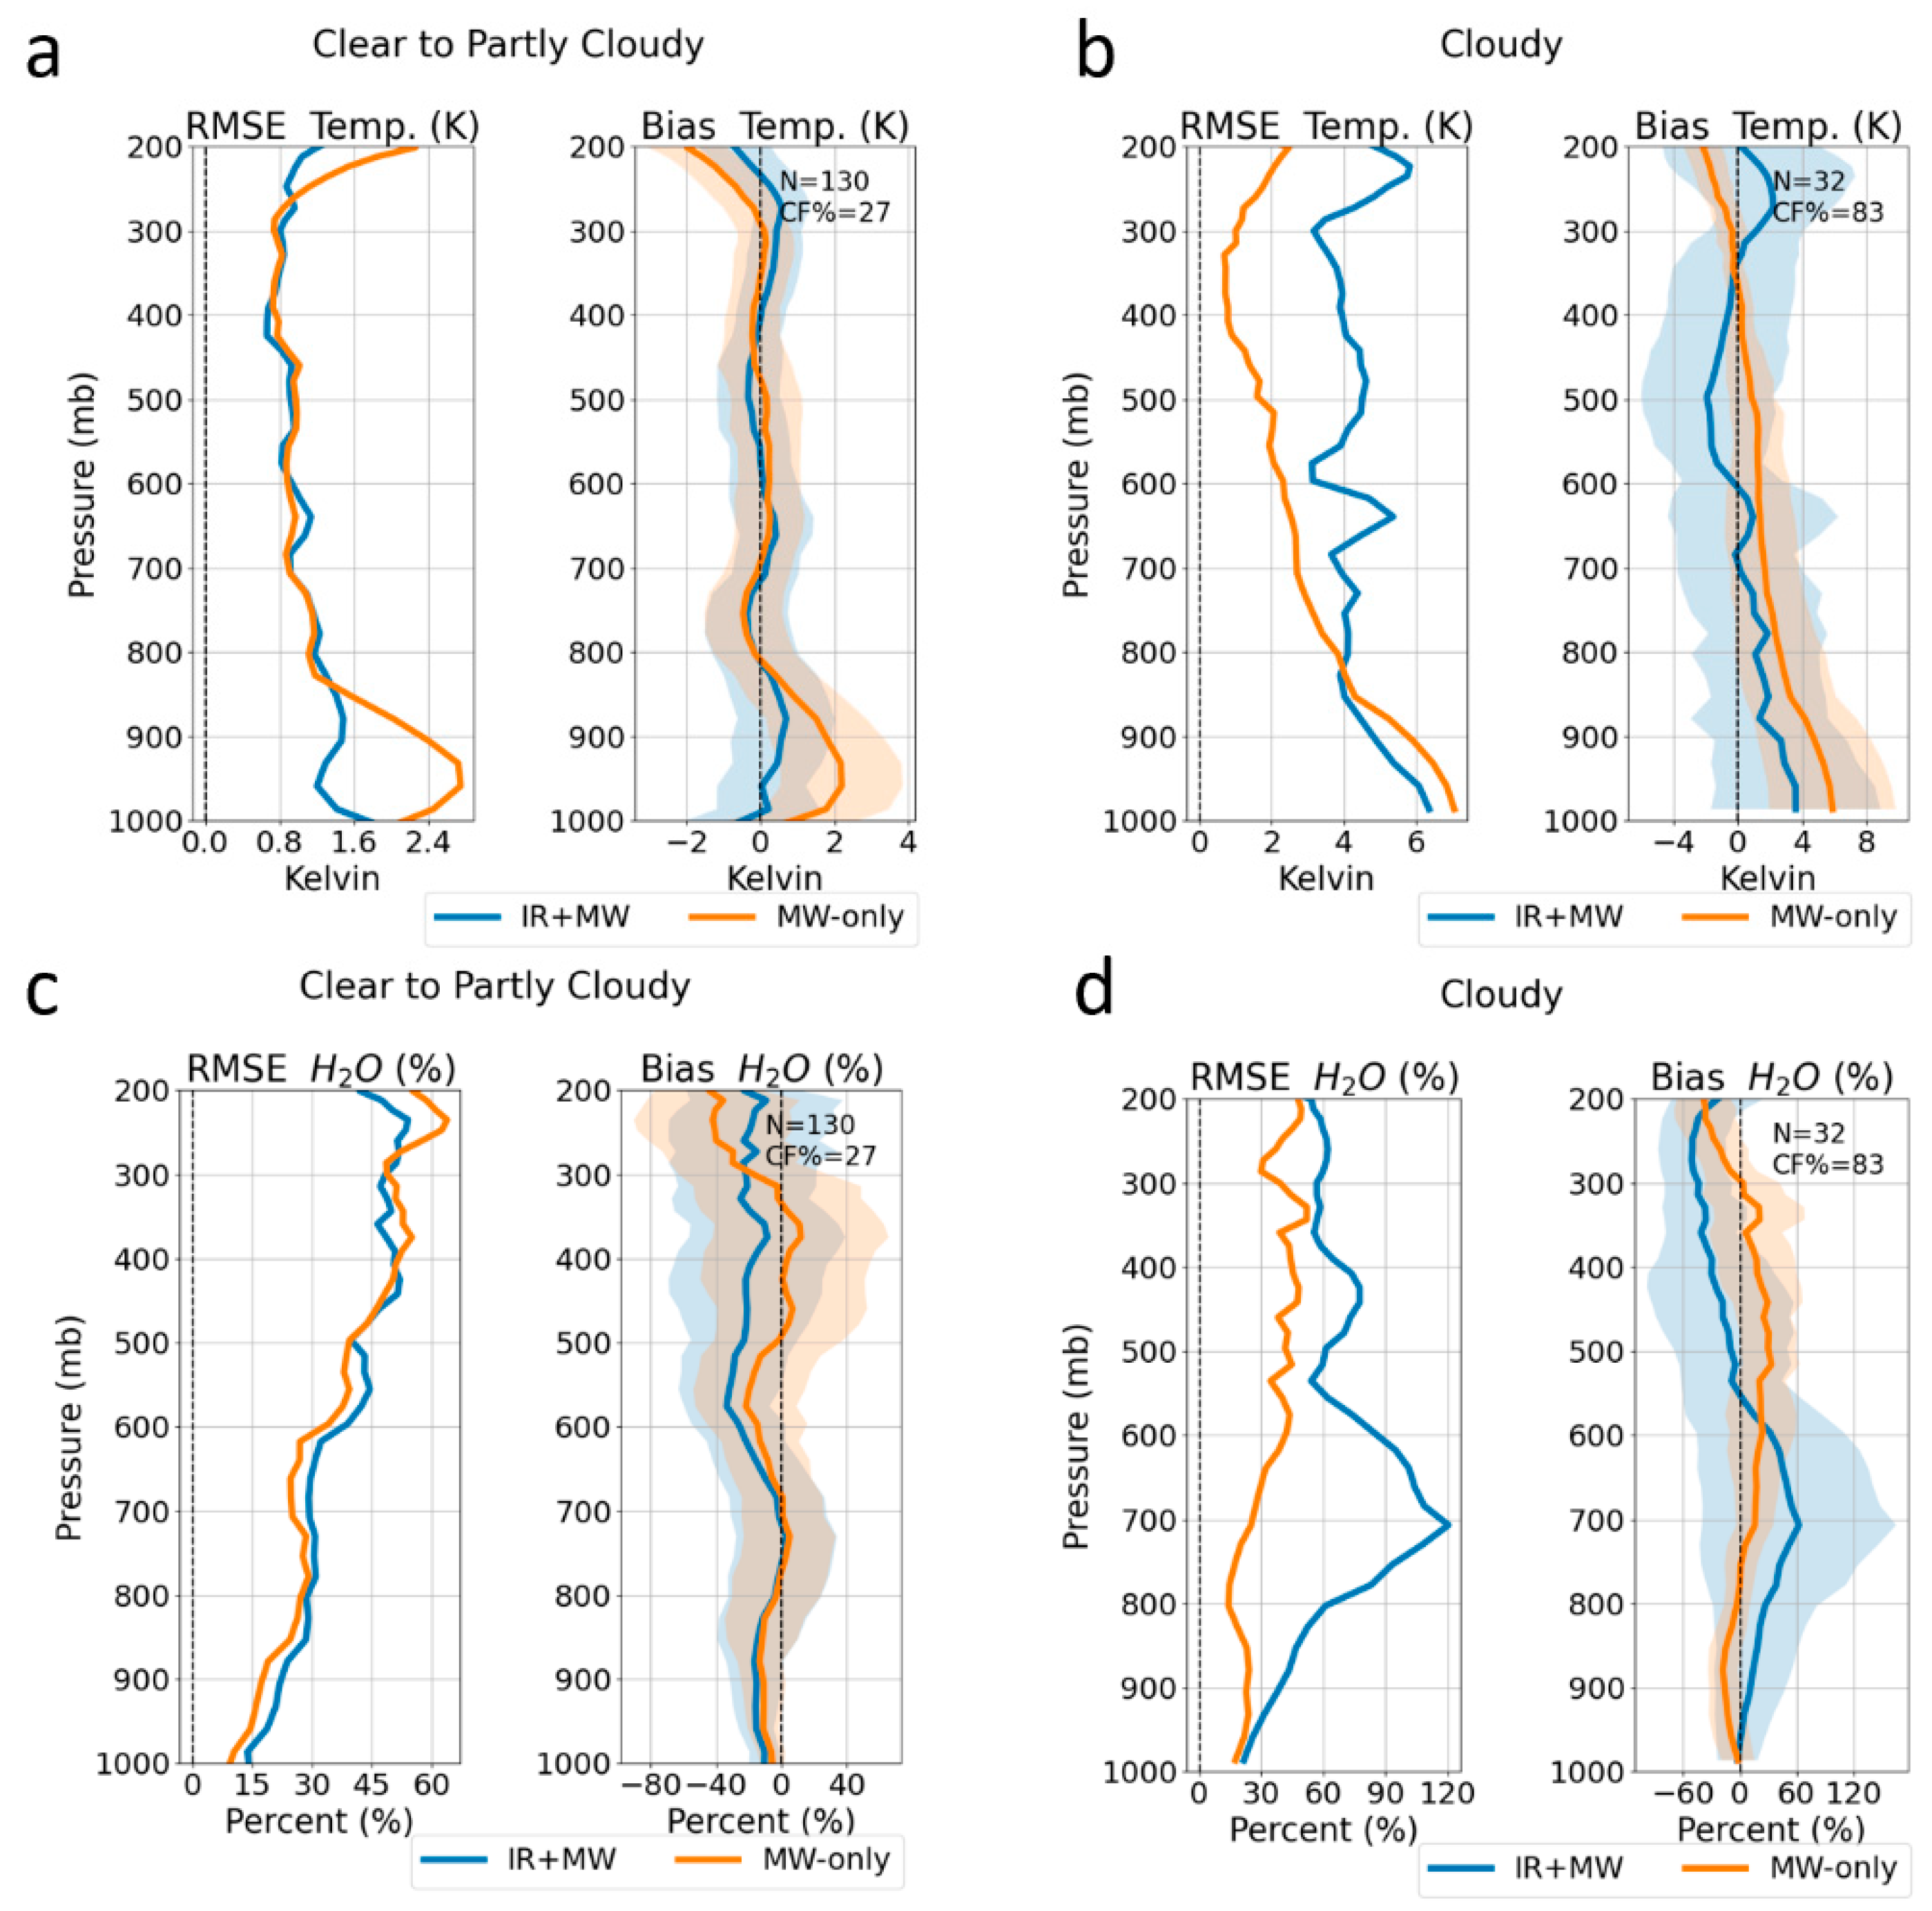
Figure 5.
Mean averaging kernel diagonals for (a) temperature and (b) water vapor retrievals where the IR + MW retrieval was successful (112 profiles). Thin black lines show the individual profiles, while thicker lines are the average. Solid horizontal lines are the standard deviation. Thinner dashed lines are local maxima or peaks of the individual profiles. Dashed lines are darker where more profiles peaked.

Table 1.
Average temperature (K) RMSE, bias (μ), and standard deviation (σ) for broad pressure layers. Calculations were made using Equations (2)–(5).
Table 1.
Average temperature (K) RMSE, bias (μ), and standard deviation (σ) for broad pressure layers. Calculations were made using Equations (2)–(5).
| Pressure Layers (mb) | Clear to Partly Cloudy | Cloudy Scenes | ||||||||||
|---|---|---|---|---|---|---|---|---|---|---|---|---|
| IR + MW | MW-Only | IR + MW | MW-Only | |||||||||
| RMSE | μ | σ | RMSE | μ | σ | RMSE | μ | σ | RMSE | μ | σ | |
| 300–0 | 1.21 | −0.34 | 0.20 | 1.37 | −0.81 | 0.20 | 4.59 | 0.78 | 0.90 | 1.62 | −1.08 | 0.22 |
| 600–300 | 0.83 | −0.001 | 0.79 | 0.86 | 0.02 | 0.84 | 3.96 | −0.90 | 3.80 | 1.33 | 0.50 | 1.16 |
| 1000–600 | 1.26 | 0.10 | 1.01 | 1.53 | 0.58 | 1.04 | 4.61 | 1.52 | 3.40 | 4.13 | 3.00 | 2.22 |
Table 2.
Average water vapor (%) RMSE, bias (μ), and standard deviation (σ) for broad pressure layers. Calculations were made using Equations (6)–(9).
Table 2.
Average water vapor (%) RMSE, bias (μ), and standard deviation (σ) for broad pressure layers. Calculations were made using Equations (6)–(9).
| Pressure Layers (mb) | Clear to Partly Cloudy | Cloudy Scenes | ||||||||||
|---|---|---|---|---|---|---|---|---|---|---|---|---|
| IR + MW | MW-Only | IR + MW | MW-Only | |||||||||
| RMSE | μ | σ | RMSE | μ | σ | RMSE | μ | σ | RMSE | μ | σ | |
| 300–0 | 49.63 | −19.41 | 7.19 | 56.96 | −36.42 | 6.84 | 57.26 | −40.87 | 6.07 | 41.50 | −24.69 | 4.98 |
| 600–300 | 46.35 | −22.07 | 39.72 | 46.00 | −2.45 | 44.52 | 65.83 | −17.93 | 59.25 | 43.74 | 21.10 | 37.24 |
| 1000–600 | 26.05 | −9.51 | 19.24 | 22.17 | −5.89 | 17.19 | 70.92 | 29.94 | 50.92 | 23.08 | 0.43 | 15.62 |
Table 3.
Mean vertical resolution (km) from successful IR + MW retrievals of temperature and water vapor for flight matches. Standard deviations are shown in parentheses. Statistics incorporate 112 NUCAPS profiles.
Table 3.
Mean vertical resolution (km) from successful IR + MW retrievals of temperature and water vapor for flight matches. Standard deviations are shown in parentheses. Statistics incorporate 112 NUCAPS profiles.
| Temperature (km) | Water Vapor (km) | |
|---|---|---|
| 0–300 mb | 7.5 (3.5) | 5.5 (1.5) |
| 300–600 mb | 5.9 (1.8) | 4.4 (1.2) |
| 600–1000 mb | 1.7 (0.2) | 2.2 (0.4) |
Publisher’s Note: MDPI stays neutral with regard to jurisdictional claims in published maps and institutional affiliations. |
© 2022 by the authors. Licensee MDPI, Basel, Switzerland. This article is an open access article distributed under the terms and conditions of the Creative Commons Attribution (CC BY) license (https://creativecommons.org/licenses/by/4.0/).
Share and Cite
MDPI and ACS Style
Esmaili, R.; Barnet, C.; Dunion, J.; Folmer, M.; Zawislak, J. Evaluating Satellite Sounders for Monitoring the Tropical Cyclone Environment in Operational Forecasting. Remote Sens. 2022, 14, 3189. https://doi.org/10.3390/rs14133189
AMA Style
Esmaili R, Barnet C, Dunion J, Folmer M, Zawislak J. Evaluating Satellite Sounders for Monitoring the Tropical Cyclone Environment in Operational Forecasting. Remote Sensing. 2022; 14(13):3189. https://doi.org/10.3390/rs14133189
Chicago/Turabian StyleEsmaili, Rebekah, Christopher Barnet, Jason Dunion, Michael Folmer, and Jonathan Zawislak. 2022. "Evaluating Satellite Sounders for Monitoring the Tropical Cyclone Environment in Operational Forecasting" Remote Sensing 14, no. 13: 3189. https://doi.org/10.3390/rs14133189
Note that from the first issue of 2016, this journal uses article numbers instead of page numbers. See further details here.