
A Lightweight Convolutional Neural Network Based on Hierarchical-Wise Convolution Fusion for Remote-Sensing Scene Image Classification


1
College of Communication and Electronic Engineering, Qiqihar University, Qiqihar 161000, China
2
College of Physical Education, Qiqihar University, Qiqihar 161000, China
3
College of Information and Communication Engineering, Dalian Nationalities University, Dalian 116000, China
*
Author to whom correspondence should be addressed.
Remote Sens. 2022, 14(13), 3184; https://doi.org/10.3390/rs14133184
Submission received: 31 May 2022
/
Revised: 22 June 2022
/
Accepted: 29 June 2022
/
Published: 2 July 2022
(This article belongs to the Special Issue Deep Neural Networks for Remote Sensing Scene Classification)
Abstract
:The large intra-class difference and inter-class similarity of scene images bring great challenges to the research of remote-sensing scene image classification. In recent years, many remote-sensing scene classification methods based on convolutional neural networks have been proposed. In order to improve the classification performance, many studies increase the width and depth of convolutional neural network to extract richer features, which increases the complexity of the model and reduces the running speed of the model. In order to solve this problem, a lightweight convolutional neural network based on hierarchical-wise convolution fusion (LCNN-HWCF) is proposed for remote-sensing scene image classification. Firstly, in the shallow layer of the neural network (groups 1–3), the proposed lightweight dimension-wise convolution (DWC) is utilized to extract the shallow features of remote-sensing images. Dimension-wise convolution is carried out in the three dimensions of width, depth and channel, and then, the convoluted features of the three dimensions are fused. Compared with traditional convolution, dimension-wise convolution has a lower number of parameters and computations. In the deep layer of the neural network (groups 4–7), the running speed of the network usually decreases due to the increase in the number of filters. Therefore, the hierarchical-wise convolution fusion module is designed to extract the deep features of remote-sensing images. Finally, the global average pooling layer, the fully connected layer and the Softmax function are used for classification. Using global average pooling before the fully connected layer can better preserve the spatial information of features. The proposed method achieves good classification results on UCM, RSSCN7, AID and NWPU datasets. The classification accuracy of the proposed LCNN-HWCF on the AID dataset (training:test = 2:8) and the NWPU dataset (training:test = 1:9), with great classification difficulty, reaches 95.76% and 94.53%, respectively. A series of experimental results show that compared with some state-of-the-art classification methods, the proposed method not only greatly reduces the number of network parameters but also ensures the classification accuracy and achieves a good trade-off between the model classification accuracy and running speed.

1. Introduction
Remote sensing is a technique that uses electromagnetic radiation sensors on objects, perceiving some features of objects and analyzing them. In recent years, with the continuous development of remote-sensing technology, the resolution of remote-sensing images obtained from remote-sensing satellites has been continuously improving. Fine-scale information can be obtained from high-resolution remote-sensing images, which makes remote-sensing images widely used in many fields [1,2,3,4,5,6].
As shown in Figure 1, compared with general images, remote-sensing scene images contain richer, more detailed and more complex ground objects. A remote-sensing image with a specific scene label usually contains multiple object scene labels. In Figure 1a, the scene label is ‘River’, and the object labels are ‘Forest’, ‘Residential’, etc. In Figure 1b, the scene label is ‘Overpass’, and the object labels are ‘Parking’, ‘Rivers’, ‘Buildings’, etc. Object labels can cause some confusion in the classification of scene labels, resulting in errors in the classification. In addition, as shown in Figure 2, the intra-class difference and inter-class similarity of remote-sensing images also bring great challenges to the correct classification of remote-sensing scene images. In Figure 2a, in the same ’airplane’ scene, the size, shape and background pattern of the airplane are different. In Figure 2b, the different scenes of ‘highway’, ‘railway’, ‘runway’ have similar texture features. These characteristics of remote-sensing scene images bring difficulties to the classification.
As a powerful image analysis tool, convolutional neural network has achieved great success in the field of image classification. For example, MobileNet [7], VGGNet [8], ResNet [9] and DenseNet [10] models have achieved impressive results in different visual tasks, such as image classification and target detection. Then, a series of remote-sensing scene classification methods based on convolutional neural network were proposed. Zeng et al. [11] proposed a new end-to-end convolutional neural network. It integrates global context features and local object features, which makes the proposed method more discriminative in scene classification. Wang et al. [12] proposed a multi-level feature fusion structure for remote-sensing scene classification based on global context information. In order to reduce the complexity of traditional convolutional neural networks, Shi et al. [13] proposed a lightweight convolutional neural network based on attention multi-branch feature fusion, which improves the classification performance of the network through the combination of attention mechanism and hybrid convolution. Liu et al. [14] proposed a two-stage deep feature fusion convolutional neural network, which can adaptively integrate the feature information of the middle layer and the fully connected layer in order to make full use of the abundant information in the shallow layer, which effectively improves the classification performance of the network.
In this paper, a lightweight convolutional neural network based on hierarchical-wise convolution fusion (LCNN-HWCF) is proposed. Firstly, a lightweight dimension-wise convolution is designed. Dimension-wise convolution is carried out in the three dimensions of width, length and channel, respectively, and then, the convoluted features of the three dimensions are fused. In the shallow layer of the network (groups 1–3), the combination of continuous dimension-wise convolution and max pooling is utilized to extract remote-sensing image features. With the deepening of the network, the size of the feature map decreases, and the number of filters increases. The increase in the number of filters brings a large number of parameters and calculations, resulting in the decrease in the running speed of the whole network. In order to further reduce the complexity of the network and improve the running speed of the network, we propose a hierarchical-wise convolution fusion module for the deep layer of the network (groups 4–7). In the classifier (groups 8), the features of the convolution output of the last layer are successively passed through the global average pooling layer, the fully connected layer and the Softmax classifier to generate the probability of each scene category. Using global averaging pooling before the fully connected layer can preserve the spatial information of the feature effectively.
The main contributions of this paper are as follows:
- (1)
- A new lightweight dimension-wise convolution is proposed. Dimension-wise convolution is carried out along the three dimensions of width, length and channel, respectively, and then, the convoluted features of the three dimensions are fused. Compared with traditional convolution, dimension-wise convolution significantly reduces the number of parameters and computations, and has stronger feature extraction ability.
- (2)
- A hierarchical-wise convolution fusion module is designed. The hierarchical-wise convolution fusion module first groups the input along the channel dimension and selects the first group of features to map to the next layer directly. The second group of features first uses the dimension-wise convolution for feature extraction and then divides the output features into two parts; one is mapped to the next layer, and the other is concatenated with the next group of features. The concatenated features are operated by dimension-wise convolution. Repeat the above operation several times until all groups are processed.
- (3)
- In the classification phase, a combination of global average pooling, fully connected layer and Softmax is adopted to convert the input features into the probability of each category. Global average pooling is used before the fully connected layer can preserve the spatial information of features as much as possible.
- (4)
- A lightweight convolutional neural network is constructed by using dimension-wise convolution, hierarchical-wise convolution fusion module and classifier. The superiority of the proposed method is proven by a series of experiments.
The rest of this paper is as follows. In Section 2, the related work of this paper is introduced. In Section 3, the dimension-wise convolution, hierarchical-wise convolution fusion module, classification module and LCNN-HWCF method are introduced in detail. In Section 4, the proposed LCNN-HWCF method is compared with some state-of-the-art methods. In Section 5, the proposed dimension-wise convolution and the traditional convolution are discussed using some ablation experiments. Section 6 gives the conclusions.
2. Related Work
Recently, for lightweight convolutional neural networks, the traditional convolution has been replaced by various variants of convolution and achieved great success. In this paper, the traditional three-dimensional convolution is split, and a dimension-wise convolution is proposed. The number of parameters and computations of this convolution are much lower than those of traditional convolution. In addition, in order to design a lightweight network, a hierarchical-wise convolution fusion module is proposed to extract the deep and complex features of the scene image. Hierarchical-wise convolution fusion module is an improved form of group convolution. Before that, we first review the related work, including the convolution variant structure and group convolution.
2.1. Convolution Variant Structure
Singh et al. [15] designed a heterogeneous convolution from the perspective of optimizing the convolution structure. In a heterogeneous convolution, some channels of input features used k × k convolution kernel; the remaining channels used 1 × 1 convolution kernel. In addition, the super parameter p was designed to control the proportion of k × k convolution kernel. Chen et al. [16] proposed dynamic convolution without increasing the depth and width of the network. Dynamic convolution dynamically aggregated multiple parallel small-size convolution kernels according to attention. These parallel small-size convolution kernels aggregate in a nonlinear way through attention, which has stronger feature representation ability and higher computational efficiency. Different from the traditional convolution, using small convolution kernel to fuse spatial and channel information, Liu et al. [17] proposed self-calibrated revolution, which can adaptively establish long-distance spatial and channel dependencies around each spatial location through self-calibrated operation, so as to generate more discriminative features and extract richer context information. Chen et al. [18] proposed octave convolution from the perspective of frequency. Octave convolution divided the input features into high-frequency features and low-frequency features along the channel dimension, and the ratio of high frequency and low frequency was controlled by the super parameter . In octave convolution, the spatial resolution of low-frequency features is reduced by half, which effectively reduces the number of parameters and calculations. Octave convolution effectively improves the representation ability of features and promotes the fusion of information through the interaction between high-frequency and low-frequency information. In the deep layer of the network, with the increase in the number of filters, it will not only bring a huge number of parameters and calculations but also produce a lot of redundant information. Han et al. [19] improved the redundant information generated by traditional convolution and proposed ghost convolution. Ghost convolution extracts rich feature information through traditional convolution operation and uses linear transformation to generate redundant information, which effectively reduces the computational complexity of the model. The convolution parameters of traditional convolution are shared by all samples. Once the convolution parameters are determined, no matter what samples are input for testing, the features are extracted using fixed convolution parameters. Yang et al. [20] proposed conditionally parameterized convolutions. Conditionally parameterized convolutions can obtain a customized convolution kernel for each input sample in each batch, which can improve the model capacity while maintaining efficient running speed. Cao et al. [21] combined depth-wise convolution with traditional convolution and proposed depth-wise over parameterized convolution. Depth-wise over parameterized convolution first uses depth-wise convolution for input features and finally uses traditional convolution for output intermediate results.
2.2. Group Convolution
AlexNet, proposed in 2012, adopts group convolution for the first time. Due to the limitation of hardware conditions at that time, Krizhevsky et al. [22] used multiple GPUs for training; each GPU completed part of the convolution and finally fused the convolution results of multiple GPUs. Xie et al. [23] improved ResNet by using the idea of group convolution and proposed ResNext. ShuffleNet, proposed by Zhang et al. [24], is another generalization of group convolution. ShuffleNet proposed the channel shuffling operation based on group convolution, which solves the problem of lack of information interaction between different groups caused by group convolution. Wu et al. [25] grouped the input along the channel dimension and then recalibrated each group of features using channel attention. The combination of channel attention and group convolution effectively improves the feature representation ability of the network. Liu [26] et al. proposed a lightweight hybrid group convolutional neural network. The hybrid group convolutional neural network adopted traditional convolution and dilated convolution in different groups. The information exchange of convolution-fused features was carried out through the channel shuffling operation to improve the performance of the network. Shen et al. [27] adopted group attention fusion strategy to improve network classification performance.
3. Methods
3.1. The Overall Structure of the Proposed LCNN-HWCF Method
The overall structure of the proposed LCNN-HWCF method is shown in Figure 3, which is composed of 8 parts (groups 1–8). Groups 1 to 3 are used to extract shallow features of remote-sensing images. These three groups are all composed of two continuous dimension-wise convolutions and max pooling. Dimension-wise convolution is designed to extract features from three dimensions: length, width and channel. Max pooling is utilized to downsample the convoluted features, reducing the number of parameters and computations, while preserving the main features and avoiding fitting. Groups 4 and 7 adopt four hierarchical-wise convolution fusion modules to extract the deep features of scene images, respectively. Groups 4 to 7 correspond to the hierarchical-wise convolution fusion module A to hierarchical-wise convolution fusion module D in Section 3.3, respectively. The structure of group 8 is shown in Figure 4.
Group 8 is composed of the global average pooling layer (GAP), the fully connected layer (FC) and the Softmax classifier, which is used to convert the feature information extracted by convolution into the probability of each scene. Because the features extracted by convolution contain spatial information, if these features are directly mapped into feature vectors through the fully connected layer, the spatial information of the features will be destroyed. Global average pooling will not destroy the spatial information of features. Therefore, global average pooling should be carried out first and then the fully connected layer. Suppose that the output of the last convolution layer is , represents the real number set, and , and represent the length, width and number of channels of the input data, respectively. If the output result of global average pooling is , the output of global average pooling to can be represented as
As can be seen from Formula (1), global average pooling can map the features of the last layer convolution output to each category more intuitively. Then, the weight matrix multiplies the global average pooling output vector to obtain the vector , which is called the fractional vector, where is the number of categories. Finally, the non-normalized K-dimensional fractional vector is mapped to the normalized K-dimensional probability vector using the Softmax function. The specific process is as follows:
In this paper, the cross-entropy loss is adopted as the loss function , which can be represented as
In Formula (3), represents the output result of the Softmax function, is the number of categories, and represents the coding result of the input sample label. is one hot vector. If the predicted category is the same as the category marked by the sample, it is 1; otherwise, it is 0. Therefore, the loss function can be further written as
3.2. Dimension-Wise Convolution
For convolutional neural networks, convolution is used to extract the features of the input image and generate some feature maps. With the deepening of the network, the size of the feature map gradually decreases, and the more representative features are extracted. It is necessary to increase the number of convolution kernels to extract more sufficient features from the previous layer. However, as the number of convolution kernels increases, the number of parameters and the amount of computation also gradually increase. In order to solve this problem, a dimension-wise convolution is proposed. The structure of the traditional convolution and the dimension-wise convolution is shown in Figure 5.
As shown in Figure 5b, the dimension-wise convolution adopts three different scale convolutions with dimension , dimension and dimension to convolute along the length, width and channel direction, respectively, and then integrates these features of three-dimensional convolution. Compared with traditional convolution, the proposed dimension-wise convolution has obvious advantages in the number of parameters and the amount of computation. The comparison of the number of parameters and computation amount between the traditional convolution and the proposed dimension-wise convolution is analyzed as follows.
First, the number of parameters is analyzed. Suppose , , and represent the length, width and number of channels of the input features, respectively. As shown in Figure 5a, the convolution kernels of traditional convolution are . Here, and represent the length and width of the convolution kernel, respectively, represents the number of input channels of the convolution kernel, and represents the number of convolution kernels or the number of output channels. The output feature is after convolution through the convolution kernel with step size 1. Then, the number of parameters of traditional convolution is .
The dimension-wise convolution convolutes along the length, width and channel direction, respectively, and then fuses the features along the three-dimensional convolution. The convolution kernel along the channel direction is , along the width direction is and along the length direction is . The number of parameters of the dimension-wise convolution can be calculated as follows.
The feature after channel-wise convolution is , and the number of parameters is ; the feature after width-wise convolution is , and the parameter quantity is ; the feature after length-wise convolution is , and the number of parameters is . The total number of parameters in the three dimensions is . Because the number of channels of the convolution kernel is much larger than the width and height of the convolution kernel, i.e., and , the total number of parameters of the dimension-wise convolution is about equal to , which is about times that of the ordinary convolution.
Following that, the computational complexity is analyzed. The computational complexity of traditional convolution is . The computational complexity of dimension-wise convolution is as follows.
The feature after channel-wise convolution is , and the computational complexity is . The feature after width-wise convolution is , and the computational complexity is . The feature after length-wise convolution is , and the computational complexity is . The total number of parameters of the three dimensions is . Dimension-wise convolution changes the computational complexity from to , which effectively reduces the computational complexity of convolution.
3.3. Hierarchical-Wise Convolution Fusion Module
With the deepening of the convolutional neural network, the number of filters increases gradually. Although the increase in filters helps extract more significant features, it also brings a lot of parameters and computation, resulting in the reduction in the running speed of the network. In order to solve this problem, a hierarchical-wise convolution fusion module is proposed to extract deeper features. Hierarchical-wise convolutions divide the input feature along the channel dimension into 4 groups: , , , . The number of channels in each group is . Each time one of the groups is directly mapped to the next layer, the remaining group extracts features by dimension-wise convolution. The output features are divided into two branches; one is mapped to the next layer, and the other is connected with the input features of the next group. Channel concatenation is utilized to fuse different features and enhance information interaction among different groups. After concatenation, the features are extracted by dimension-wise convolution. This process is repeated several times until the remaining input features are processed. The four hierarchical-wise fusion modules are shown in Figure 6, Figure 7, Figure 8 and Figure 9, respectively. The specific process is as follows.
In the hierarchical-wise convolution fusion module A, which is shown in Figure 6, only the first set of input features can be directly mapped to the next layer. The second group of input features first extracts the features by dimension-wise convolution (DWC) to obtain and then divides the output features into two routes; one is mapped to the next layer, the other and the third group of features to channel concatenation to obtain . After concatenation, the features are extracted by dimension-wise convolution. Then, the features are divided into two routes; one is mapped to the next layer, the other and the fourth group of features to channel concatenation to obtain . After concatenation, the features are extracted by dimension-wise convolution. Finally, the features are mapped to the next layer. The whole process can be represented as
In Formula (5), represents convolution operation, represents dimension-wise convolution, and represents channel concatenation operation. means , and operations are performed successively.
In the hierarchical-wise convolution fusion module B, which is shown in Figure 7, only the second set of input features can be mapped directly to the next layer. The first group of input features first extracts features by dimension-wise convolution (DWC) to obtain and then divides the output features into two routes; one is mapped to the next layer, the other and the third group of input features to channel concatenation to obtain . After concatenation, the features are extracted by dimension-wise convolution. Then, the features are divided into two routes; one is mapped to the next layer, the other and the fourth group of features to channel concatenation to obtain . After concatenation, the features are extracted by dimension-wise convolution. Finally, the features are mapped to the next layer. The whole process can be represented as
In Formula (6), represents convolution operation, represents dimension-wise convolution, and represents channel concatenation operation. means , and operations are performed successively.
In the hierarchical-wise convolution fusion module C, which is shown in Figure 8, only the third set of input features can be mapped directly to the next layer. The first group of input features first extracts features by dimension-wise convolution (DWC) to obtain and then divides the output features into two routes; one is mapped to the next layer, the other and the second group of input features to channel concatenation to obtain . After concatenation, the features are extracted by dimension-wise convolution. Then, the features are divided into two routes; one is mapped to the next layer, the other and the fourth group of features to channel concatenation to obtain . After concatenation, the features are extracted by dimension-wise convolution. Finally, the features are mapped to the next layer. The whole process can be represented as
In Formula (7), represents convolution operation, represents dimension-wise convolution, and represents channel concatenation operation. means , and operations are performed successively.
In the hierarchical-wise convolution fusion module D, which is shown in Figure 9, only the fourth set of input features can be mapped directly to the next layer. The first group of input features first extracts features by dimension-wise convolution (DWC) to obtain and then divides the output features into two routes; one is mapped to the next layer, the other and the second group of input features to channel concatenation to obtain . After concatenation, the features are extracted by dimension-wise convolution. Then, the features are divided into two routes; one is mapped to the next layer, the other and the fourth group of features to channel concatenation to obtain . After concatenation, the features are extracted by dimension-wise convolution. Finally, the features are mapped to the next layer. The whole process is
In Formula (8), represents convolution operation, represents dimension-wise convolution, and represents channel concatenation operation. means , and operations are performed successively.
4. Experiment
4.1. Dataset Settings
The remote-sensing image dataset AID was published by Xia et al. [28] of Wuhan University and Huazhong University of Science and Technology in 2017. The AID dataset has 10,000 images and 30 different scene categories, including ‘airport’, ‘bridge’ and ‘bareLand’, etc. There are 220 to 420 remote-sensing images in each scene category, and the size of each remote-sensing image is approximately 600 × 600. The spatial resolution of the AID dataset is 0.5 m to 8 m. The RSSCN7 dataset was published in 2015 by Zou et al. [29] of Wuhan University. Scene images from different seasons and weather pose a major challenge to their classification. The RSSCN7 dataset has 2800 images and seven different scene categories, including ‘grass’, ‘forest’, ‘field’, ‘parking’, ‘resident’, ‘industry’ and ‘riverlake’. Each scene category contains 400 scene images, with 400 × 400 pixels per scene image. The UCM dataset was published by Yang et al. [30] in 2010. The dataset has 2100 images and 21 different scene categories, including ‘agricultural’, ‘airplane’ and ‘forest’, etc. Each scene category contains 100 scene images, each with 256 × 256 pixels. The spatial resolution of the UCM dataset is 0.3 m. The NWPU45 dataset was published by Cheng et al. [31] of Northwest University of Technology in 2017. The NWPU45 dataset has 31,500 images and 45 different scene categories, including ‘airplane’, ‘airport’, ‘baseball’, etc. Each scene category contains 700 scene images, with 256 × 256 pixels per scene image. The spatial resolution of NWPU45 dataset is 0.2 m to 30 m.
4.2. Setting of the Experiments
Our experiments are based on the Keras framework and implemented on the NVIDIA GeForce RTX2060 GPU computer. To prevent memory overflow during training, the input image is clipped to 256 × 256 pixels during training. In the experiments, in order to make the network model converge more stably, the momentum optimizer is utilized for network training. The momentum factor is set to 0.9.
In the experiments, the size of the convolution kernel along the length () direction is , and the size of the convolution kernel along the width () direction is . With the deepening of the network, the size of the convolution kernel along the channel () direction also gradually increases. From group 1 to group 7, the size is , , , , , and , respectively.
According to the division proportion commonly used in previous studies, the datasets of this experiment are divided as follows: RSSCN7 (50%) dataset, training:test = 5:5, that is, 50% of the RSSCN7 dataset is divided as training dataset, the remaining 50% as test dataset. UCM21 (80%) dataset, training:test = 8:2, that is, 80% of the UCM21 datasets are divided for training datasets, and the remaining 20% are used as test datasets. AID (50%) and AID (20%) dataset, training:test = 5:5 and training:test = 2:8, that is, the AID dataset is divided into 50% (20%) as training dataset and the remaining 50% (80%) as testing dataset. NWPU (20%) and NWPU (10%) dataset, training:test = 2:8 and training:test = 1:9, that is, 20% (10%) of the NWPU dataset is divided as the training dataset and the remaining 80% (90%) as the test dataset. The results of each experiment are the average of 10 experiments.
4.3. Experimental Results
4.3.1. Performance of the Proposed LCNN-HWCF Method
The OA, AA, F1 and kappa coefficients of the proposed LCNN-HWCF method on four datasets under different training ratios are listed in Table 1. The overall accuracy (OA) is the ratio between the correct prediction and the overall quantity of all test sets, and the average accuracy (AA) is the ratio between the correct prediction of each type and the overall quantity of each type. F1 is the weighted average of accuracy and recall, which is used to measure the overall performance of the proposed method. Kappa coefficient is adopted to measure whether the predicted results are consistent with the real results. It can be seen from Table 1 that the proposed LCNN-HWCF method can achieve good performance on the four datasets with different training ratios.
4.3.2. Experimental Results on UCM Dataset
The comparison of experimental results between the proposed method and some state-of-the-art methods on the UCM dataset with a training ratio of 80% is shown in Table 2. When the training proportion is 80%, the overall accuracy of the lightweight method LCNN-BFF [32] is 99.29%, which is 0.24% higher than that of the Scale-Free CNN [33], Inceptionv3+CapsNet [34] and DDRL-AM [35] method but still 0.24% lower than that of our method, and the parameters of the proposed method are only 9.6% of the parameters of LCNN-BFF. This proves that the proposed method achieves a good trade-off between the accuracy of classification and the number of parameters.
The confusion matrix of the proposed method on the UCM dataset is shown in Figure 10. As we can see from Figure 10, the proposed method can correctly classify most scene images of the UCM dataset. Although there is confusion between the two scenarios of ’mediumresidential’ and ‘mobilehomepark’, the classification accuracy still reaches 95%, which fully verifies the validity of the proposed method.
4.3.3. Experimental Results on RSSCN7 Dataset
The comparison of experimental results between the proposed method and some advanced methods on the RSSCN dataset with a training ratio of 50% is listed in Table 3. Because the scene images in the RSSCN dataset come from different seasons and weather, the classification of this dataset is challenging. As shown in Table 3, when the training proportion is 50%, the classification accuracy of the proposed method is 97.65%, 2.44% higher than that of ADFF [38], 2.11% higher than that of Coutourlet CNN [52] and 2.94% higher than that of SE-MDPMNet [53]. Compared with some lightweight methods, i.e., LCNN-BFF Method [32] and SE-MDPMNet [53], the parameters of the proposed method are only 9.6% and 11.6% of them.
The confusion matrix of the proposed method on the RSSCN dataset is shown in Figure 11. From Figure 11, it can be seen that although the proposed method does not fully recognize any scene image in this dataset, the accuracy of all scene images is over 97%, and the proposed method still achieves good results.
4.3.4. Experimental Results on AID Dataset
The comparison of experimental results between the proposed method and some advanced methods on the AID datasets with the training ratio of 20% and 50% is shown in Table 4. When the training proportion is 20%, the overall classification accuracy of the proposed method is 95.76%, which is 4.1% and 4.66% higher than that of lightweight network LCNN-BFF [32] and Skip-Connected CNN [42], respectively, and 3.37% and 2.49% higher than that of ResNet50 [54] and Inception V3 [54], respectively. When the training proportion is 50%, the overall accuracy is further improved to 97.43%, which is higher than that of all the comparison methods. Compared with LCNN-BFF [32], VGG16 with MSCP [39], ResNet50 [54], Inception V3 [54], the increase is 2.79%, 3.01%, 2.74% and 2.36%, respectively. As far as the number of parameters is concerned, the parameters of the proposed method are 0.6 M, which is 9.6% and 10% of that of the lightweight methods LCNN-BFF [32] and Skip-Connected CNN [42]. Compared with LCNN-GWHA [55], although the number of parameters is slightly increased, the classification accuracy of the proposed method has obvious advantages under both training ratios.
The confusion matrix of the proposed method on the AID dataset with a training ratio of 50% is shown in Figure 12. From Figure 12, it can be seen that the method achieves the classification accuracy of more than 90% for all scenes in the AID dataset and 100% for ‘viaduct’ scenes. For the confusion matrix, the classification accuracy of ‘school’ scene is the lowest; the reason is that the proposed method confuses the ‘school’ and ‘industrial’ scenes, resulting in the classification accuracy of school scene of only 93%.
4.3.5. Experimental Results on NWPU Dataset
Compared with the UCM dataset, RSSCN dataset and AID dataset, the NWPU dataset has more remote-sensing scene images, which brings great challenges to classification in this dataset. The comparison of experimental results between the proposed method and some advanced methods on NWPU datasets with 10% and 20% training ratio is shown in Table 5. When the training proportion is 10%, the classification accuracy of the proposed method is 93.10%, which is 6.57%, 8.77%, 6.87% and 2.87% higher than that of LCNN-BFF [32], Skip-Connected CNN [42], ResNet50 [54] and LiG with RBF kernel [56], respectively. When the training proportion is 20%, the classification accuracy of the proposed method is 94.53%, which is 2.8%, 7.23% and 1.28% higher than that of the lightweight methods LCNN-BFF [32], Skip-Connected CNN [42], LiG with RBF kernel [56], respectively, and the number of parameters of the proposed method is only 9.6%, 10% and 28.9% of them. These further verify the validity of the proposed method.
The confusion matrix of the proposed method on the NWPU dataset with 20% training ratio is shown in Figure 13. As can be seen from Figure 13, the proposed method achieves a classification accuracy of more than 90% for all scenes in the NWPU dataset. For the most confusing scenarios, namely ‘palace’ and ‘church’ with similar building shapes, the classification accuracy of the proposed method is still 93% and 92%, respectively, which proves the robustness of the proposed method.
4.4. Model Complexity Analysis
To further verify the advantages of the proposed method, CaffeNet [51], VGG-VD-16 [51], GoogLeNet [51], MobileNetV2 [53], SE-MDPMNet [53], LCNN-BFF [32] and the proposed method are compared on the AID dataset with training:test = 5:5. FLOPs, OA and the number of parameters are adopted as the evaluation index, and the floating points of operations (FLOPs) are utilized to measure the complexity of the proposed method. The size of the FLOPs value is inversely proportional to the complexity of the model. The experimental results are shown in Table 6. It can be seen from Table 6 that on the AID dataset with training:test = 5:5, with the proposed dimension-wise convolution and hierarchical-wise convolution fusion module, the parameters and FLOPs values of the proposed method are only 0.6 M and 1.7 M, respectively, and the classification accuracy reaches 97.43%. Compared with the lightweight network MobileNetV2 [53] and SE-MDPMNet [53], the proposed method optimizes the complexity of the model while guaranteeing high classification accuracy, further proving the effectiveness of the method.
4.5. Model Running Speed Comparison
In order to verify the advantages of the proposed lightweight dimension-wise convolution in terms of running speed, some experiments on running time are conducted on the UCM dataset. In this experiment, the average training time (ATT) is used as the evaluation index, and ATT represents the average time required for the model to process an image. Gated Bidirectiona+global feature [40], Gated Bidirectiona [40], Siamese ResNet50 [48], Siamese AlexNet [48], Siamese VGG-16 [48], LCNN-BFF [32] are selected for experimental comparison. In the experiment, all the experimental settings are the same. The experimental results are shown in Table 7. It can be seen from Table 7 that the ATT of the proposed method is the smallest, only 0.015 s, which is 0.014 s smaller than that of the LCNN-BFF [32] method and 0.013 s smaller than that of the Siamese AlexNet [48] method. The experimental results show that the proposed method has faster running speed.
4.6. Visual Analysis
In order to more intuitively show the advantages of the proposed method, a variety of visualization methods are adopted to visually analyze the proposed method. Firstly, a gradient-weighted class activation map (Grad CAM) is utilized to visualize the proposed method. In order to prove that the proposed method can extract the significant features of remote-sensing images effectively, two methods, LCNN-BFF [32] and LCNN-GWHA [55], which have good classification performance, are chosen in the experiment for visual analysis on the UCM datasets. The visualization results are shown in Figure 14. The highlighted areas in the gradient-weighted class activation graph indicate how much attention is paid to the scene by the proposed method, while red highlighted areas indicate a higher degree of attention to the scene. From Figure 14, it can be seen that compared with LCNN-BFF [32] and LCNN-GWHA [55], the proposed method can extract scene features more effectively and have a better semantic coverage for the scene area.
Then, the T-distributed random neighborhood embedding (T-SNE) visualization method is adopted to visually analyze the proposed method on the RSSCN dataset and UC dataset, respectively. The visualization results are shown in Figure 15. In the T-SNE visualization, data points of different colors represent different scene categories, and data points of the same color will gather together to form different semantic clusters. As can be seen from Figure 15, the proposed method increases the distance between different semantic clusters, effectively reduces the semantic confusion between similar scenes and improves the classification performance.
Finally, some random image prediction experiments of the proposed method are carried out on the UC dataset. The experimental results are shown in Figure 16. As can be seen from Figure 16, the confidence of the proposed method for the predicted values and real label values of different scenes is more than 99%, which proves that the proposed method can effectively extract the features of remote-sensing scene images.
5. Discussion
In this section, the advantages of dimension-wise convolution are discussed through four ablation experiments. In ablation experiment 1, the dimension-wise convolution in the shallow layer of the network (Group 1–3) was replaced with the traditional convolution, and the other groups (Group 4–8) remained unchanged. In ablation experiment 2, the dimension-wise convolution in the hierarchical-wise convolution fusion module (Group 4–8) was replaced with the traditional convolution, and the other groups (Group 1–3) remained unchanged. In ablation experiment 3, the dimension-wise convolution in the whole network (Group 1–8) was replaced by traditional convolution. In ablation experiment 4, the entire network was maintained. In the four ablation experiments, each ablation experiment used the same experimental equipment and super parameter settings. The experimental results on the UC dataset with training:test = 8:2 are shown in Figure 17 and Figure 18. The experimental results on the RSSCN dataset with training:test = 5:5 are shown in Figure 19 and Figure 20.
As can be seen from Figure 17, Figure 18, Figure 19 and Figure 20, on the two datasets, after using the traditional convolution to replace the dimension-wise convolution, the classification performance of the network can be reduced. In particular, after replacing the dimension-wise convolution in the whole network with traditional convolution, the classification performance decreases most dramatically. As shown in Figure 17, compared with experiment 4, in experiment 3, the classification accuracy decreased by 1.28%, and the kappa value decreased by 1.40% on the UC dataset with a training ratio of 80%. As shown in Figure 19, compared with experiment 4, in experiment 3, the classification accuracy decreased by 1.18%, and the kappa value decreased by 1.24% on the RSSCN dataset with a training ratio of 50%. In addition, after using the traditional convolution, the number of parameters and FLOPs of the network increased to a certain extent. In particular, after replacing the dimension-wise convolution in the proposed network with traditional convolution, the parameter quantity and FLOPs value increased a lot. As shown in Figure 18 and Figure 20, on the two datasets, compared with experiment 4, the parameter amount in experiment 3 increased by about 0.86 M, and the FLOPs value increased by about 3.67 M. A series of experiments proved the superiority of the proposed dimension-wise convolution.
6. Conclusions
In this paper, a lightweight convolutional neural network based on hierarchical-wise convolution fusion (LCNN-HWCF) is proposed for remote-sensing scene image classification. In the shallow layer of the proposed network, the features are extracted in the length, width and channel directions, respectively, by using dimension-wise convolution. In the deep layer of the network, the hierarchical-wise convolution fusion module is designed to solve the problem of the network parameters becoming larger due to the deepening of the network. Finally, under the conditions of multiple training ratios of UCM21, RSSCN7, AID and NWPU, the proposed method and some advanced methods are compared by a variety of experiments, and the experimental results prove the superiority of LCNN-HWCF. Among them, the classification accuracy of the proposed LCNN-HWCF method on the UCM dataset (training:test = 8:2) reaches 99.53%, almost completely realizing the correct recognition of all scene images.
Author Contributions
Conceptualization, C.S.; Data curation, C.S., X.Z. and T.W.; Formal analysis, L.W.; Methodology, C.S. and X.Z.; Software, X.Z.; Validation, C.S., X.Z. and T.W.; Writing—original draft, X.Z.; Writing—review and editing, C.S. and L.W. All authors have read and agreed to the published version of the manuscript.
Funding
This research was funded in part by the National Natural Science Foundation of China (41701479, 62071084), in part by the Heilongjiang Science Foundation Project of China under Grant LH2021D022 and in part by the Fundamental Research Funds in Heilongjiang Provincial Universities of China under Grant 135509136.
Data Availability Statement
Data associated with this research are available online. The UC Merced dataset is available for download at http://weegee.vision.ucmerced.edu/datasets/landuse.html (accessed on 18 November 2021). RSCCN dataset is available for download at https://sites.google.com/site/qinzoucn/documents (accessed on 18 November 2021). NWPU dataset is available for download at http://www.escience.cn/people/JunweiHan/NWPU-RESISC45.html (accessed on 18 November 2021). AID dataset is available for download at https://captain-whu.github.io/AID/ (accessed on 18 November 2021).
Acknowledgments
We would like to thank the handling editor and the anonymous reviewers for their careful reading and helpful remarks.
Conflicts of Interest
The authors declare no conflict of interest.
References
- Gómez-Chova, L.; Tuia, D.; Moser, G.; Camps-Valls, G. Multimodal Classification of Remote Sensing Images: A Review and Future Directions. Proc. IE35EE 2015, 103, 1560–1584. [Google Scholar] [CrossRef]
- Longbotham, N.; Chaapel, C.; Bleiler, L.; Padwick, C.; Emery, W.; Pacifici, F. Very High Resolution Multiangle Urban Classification Analysis. IEEE Trans. Geosci. Remote Sens. 2011, 50, 1155–1170. [Google Scholar] [CrossRef]
- Zhang, T.; Huang, X. Monitoring of Urban Impervious Surfaces Using Time Series of High-Resolution Remote Sensing Images in Rapidly Urbanized Areas: A Case Study of Shenzhen. IEEE J. Sel. Top. Appl. Earth Obs. Remote Sens. 2018, 11, 2692–2708. [Google Scholar] [CrossRef]
- Cheng, G.; Han, J.; Zhou, P.; Guo, L. Multi-class geospatial object detection and geographic image classification based on collection of part detectors. ISPRS J. Photogramm. Remote Sens. 2014, 98, 119–132. [Google Scholar]
- Lowe, D.G. Distinctive Image Features from Scale-Invariant Keypoints. Int. J. Comput. Vis. 2004, 60, 91–110. [Google Scholar] [CrossRef]
- Dalal, N.; Triggs, B. Histograms of oriented gradients for human detection. In Proceedings of the IEEE Computer Society Conference on Computer Vision and Pattern Recognition (CVPR’05), San Diego, CA, USA, 20–25 June 2005; Volume 1, pp. 886–893. [Google Scholar] [CrossRef] [Green Version]
- Howard, A.G.; Zhu, M.; Chen, B.; Kalenichenko, D.; Wang, W.; Weyand, T.; Andreetto, M.; Adam, H. MobileNets: Effififificient convolutional neural networks for mobile vision applications. arXiv 2017, arXiv:1704.04861. [Google Scholar]
- Simonyan, K.; Zisserman, A. Very deep convolutional networks for large-scale image recognition. arXiv 2014, arXiv:1409.1556. [Google Scholar]
- He, K.; Zhang, X.; Ren, S.; Sun, J. Deep residual learning for image recognition. In Proceedings of the IEEE Conference on Computer Vision and Pattern Recognition, Las Vegas, NV, USA, 27–30 June 2016; pp. 770–778. [Google Scholar]
- Huang, G.; Liu, Z.; Van Der Maaten, L.; Weinberger, K.Q. Densely connected convolutional networks. In Proceedings of the IEEE Conference on Computer Vision and Pattern Recognition, Honolulu, HI, USA, 21–26 July 2017; pp. 4700–4708. [Google Scholar]
- Zeng, D.; Chen, S.; Chen, B.; Li, S. Improving Remote Sensing Scene Classification by Integrating Global-Context and Local-Object Features. Remote Sens. 2018, 10, 734. [Google Scholar] [CrossRef] [Green Version]
- Wang, X.; Duan, L.; Ning, C. Global Context-based Multi-level Feature Fusion Networks for Multi-label Remote Sensing Image Scene Classification. IEEE J. Sel. Top. Appl. Earth Obs. Remote Sens. 2021, 14, 11179–11196. [Google Scholar] [CrossRef]
- Shi, C.; Zhao, X.; Wang, L. A Multi-Branch Feature Fusion Strategy Based on an Attention Mechanism for Remote Sensing Image Scene Classification. Remote Sens. 2021, 13, 1950. [Google Scholar] [CrossRef]
- Liu, Y.; Liu, Y.; Ding, L. Scene Classification Based on Two-Stage Deep Feature Fusion. IEEE Geosci. Remote Sens. Lett. 2018, 15, 183–186. [Google Scholar] [CrossRef]
- Singh, P.; Verma, V.K.; Rai, P.; Namboodiri, V.P. HetConv: Heterogeneous Kernel-Based Convolutions for Deep CNNs. arXiv 2019, arXiv:1903.04120. [Google Scholar]
- Chen, Y.; Dai, X.; Liu, M.; Chen, D.; Yuan, L.; Liu, Z. Dynamic Convolution: Attention Over Convolution Kernels. In Proceedings of the IEEE/CVF Conference on Computer Vision and Pattern Recognition (CVPR), Seattle, WA, USA, 14–19 June 2020; pp. 11030–11039. [Google Scholar]
- Liu, J.J.; Hou, Q.; Cheng, M.M.; Wang, C.; Feng, J. Improving Convolutional Networks with Self-Calibrated Convolutions. In Proceedings of the IEEE/CVF Conference on Computer Vision and Pattern Recognition (CVPR), Seattle, WA, USA, 14–19 June 2020; pp. 10096–10105. [Google Scholar]
- Chen, Y.; Fan, H.; Xu, B.; Yan, Z.; Kalantidis, Y.; Rohrbach, M.; Yan, S.; Feng, J. Drop an Octave: Reducing Spatial Redundancy in Convolutional Neural Networks with Octave Convolution. arXiv 2019, arXiv:1904.05049. [Google Scholar]
- Han, K.; Wang, Y.; Tian, Q.; Guo, J.; Xu, C.; Xu, C. GhostNet: More Features from Cheap Operations. arXiv 2020, arXiv:1911.11907 [cs.CV]. [Google Scholar]
- Yang, B.; Bender, G.; Le, Q.V.; Ngiam, J. CondConv: Conditionally Parameterized Convolutions for Efficient Inference. arXiv 2019, arXiv:1904.04971 [cs.CV]. [Google Scholar]
- Cao, J.; Li, Y.; Sun, M.; Chen, Y.; Lischinski, D.; Cohen-Or, D.; Chen, B.; Tu, C. Depthwise Over-parameterized Convolution. arXiv 2020, arXiv:2006.12030 [cs.CV]. [Google Scholar]
- Krizhevsky, A.; Sutskever, I.; Hinton, G.E. ImageNet classification with deep convolutional neural networks. Commun. ACM 2017, 60, 84–90. [Google Scholar] [CrossRef]
- Xie, S.; Girshick, R.; Dollar, P.; Tu, Z.; He, K. Aggregated Residual Transformations for Deep Neural Networks. arXiv 2017, arXiv:1611.05431v2 [cs.CV]. [Google Scholar]
- Zhang, X.; Zhou, X.; Lin, M.; Sun, J. ShuffleNet: An Extremely Efficient Convolutional Neural Network for Mobile. arXiv 2017, arXiv:1707.01083v2 [cs.CV]. [Google Scholar]
- Wu, P.; Cui, Z.; Gan, Z.; Liu, F. Residual Group Channel and Space Attention Network for Hyperspectral Image Classification. Remote Sens. 2020, 12, 2035. [Google Scholar] [CrossRef]
- Liu, Y.; Gao, L.; Xiao, C.; Qu, Y.; Zheng, K.; Marinoni, A. Hyperspectral Image Classification Based on a Shuffled Group Convolutional Neural Network with Transfer Learning. Remote Sens. 2020, 12, 1780. [Google Scholar] [CrossRef]
- Shen, J.; Zhang, T.; Wang, Y.; Wang, R.; Wang, Q.; Qi, M. A Dual-Model Architecture with Grouping-Attention-Fusion for Remote Sensing Scene Classification. Remote Sens. 2021, 13, 433. [Google Scholar] [CrossRef]
- Xia, G.S.; Hu, J.; Hu, F.; Shi, B.; Bai, X.; Zhong, Y.; Zhang, L. AID: A benchmark data set for performance evaluation of aerial scene classifification. IEEE Trans. Geosci. Remote Sens. 2017, 55, 3965–3981. [Google Scholar] [CrossRef] [Green Version]
- Zou, Q.; Ni, L.; Zhang, T.; Wang, Q. Deep Learning Based Feature Selection for Remote Sensing Scene Classification. IEEE Geosci. Remote Sens. Lett. 2015, 12, 2321–2325. [Google Scholar] [CrossRef]
- Yang, Y.; Newsam, S. Bag-of-visual-words and spatial extensions for land-use classifification. In Proceedings of the 18th SIGSPA-TIAL International Conference on Advances in Geographic Information Systems, San Jose, CA, USA, 3–5 November 2010; p. 270. [Google Scholar]
- Cheng, G.; Han, J.; Lu, X. Remote Sensing Image Scene Classifification: Benchmark and State of the Art. Proc. IEEE 2017, 105, 1865–1883. [Google Scholar] [CrossRef] [Green Version]
- Shi, C.; Wang, T.; Wang, L. Branch Feature Fusion Convolution Network for Remote Sensing Scene Classification. IEEE J. Sel. Top. Appl. Earth Obs. Remote Sens. 2020, 13, 5194–5210. [Google Scholar] [CrossRef]
- Xie, J.; He, N.; Fang, L.; Plaza, A. Scale-free convolutional neural network for remote sensing scene classification. IEEE Trans. Geosci. Remote Sens. 2019, 57, 6916–6928. [Google Scholar] [CrossRef]
- Zhang, W.; Tang, P.; Zhao, L. Remote sensing image scene classification using CNN-CapsNet. Remote Sens. 2019, 11, 494. [Google Scholar] [CrossRef] [Green Version]
- He, N.; Fang, L.; Li, S.; Plaza, J.; Plaza, A. Skip-connected covariance network for remote sensing scene classification. IEEE Trans. Neural Netw. Learn. Syst. 2020, 31, 1461–1474. [Google Scholar] [CrossRef] [Green Version]
- Zhao, F.; Mu, X.; Yang, Z.; Yi, Z. A novel two-stage scene classification model based on Feature var iablesignificancein high-resolution remote sensing. Geocarto Int. 2020, 35, 1603–1614. [Google Scholar] [CrossRef]
- Liu, B.D.; Meng, J.; Xie, W.Y.; Shao, S.; Li, Y.; Wang, Y. Weighted spatial pyramid matching collaborative representation for remote-sensing-image scene classification. Remote Sens. 2019, 11, 518. [Google Scholar] [CrossRef] [Green Version]
- Li, B.; Su, W.; Wu, H.; Li, R.; Zhang, W.; Qin, W.; Zhang, S. Aggregated deep fisher feature for VHR remote sensing scene classification. IEEE J. Sel. Topics Appl. Earth Observ. Remote Sens. 2019, 12, 3508–3523. [Google Scholar] [CrossRef]
- He, N.; Fang, L.; Li, S.; Plaza, A.; Plaza, J. Remote sensing scene classification using multilayer stacked covariance pooling. IEEE Trans. Geosci. Remote Sens. 2018, 56, 6899–6910. [Google Scholar] [CrossRef]
- Sun, H.; Li, S.; Zheng, X.; Lu, X. Remote sensing scene classification by gated bidirectional network. IEEE Trans. Geosci. Remote Sens. 2020, 58, 82–96. [Google Scholar] [CrossRef]
- Lu, X.; Sun, H.; Zheng, X. A feature aggregation convolutional neural network for remote sensing scene classification. IEEE Trans. Geosci. Remote Sens. 2019, 57, 7894–7906. [Google Scholar] [CrossRef]
- Li, J.; Lin, D.; Wang, Y.; Xu, G.; Zhang, Y.; Ding, C.; Zhou, Y. Deep discriminative representation learning with attention map for scene classification. Remote Sens. 2020, 12, 1366. [Google Scholar] [CrossRef]
- Cheng, G.; Yang, C.; Yao, X.; Guo, L.; Han, J. When deep learning meets metric learning: Remote sensing image scene classification via learning discriminative CNNs. IEEE Trans. Geosci. Remote Sens. 2018, 56, 2811–2821. [Google Scholar] [CrossRef]
- Boualleg, Y.; Farah, M.; Farah, I.R. Remote sensing scene classification using convolutional features and deep forest classifier. IEEE Geosci. Remote Sens. Lett. 2019, 16, 1944–1948. [Google Scholar] [CrossRef]
- Yan, P.; He, F.; Yang, Y.; Hu, F. Semi-supervised representation learning for remote sensing image classification based on generative adversarial networks. IEEE Access 2020, 8, 54135–54144. [Google Scholar] [CrossRef]
- Wang, C.; Lin, W.; Tang, P. Multiple resolution block feature for remote-sensing scene classification. Int. J. Remote Sens. 2019, 40, 6884–6904. [Google Scholar] [CrossRef]
- Liu, X.; Zhou, Y.; Zhao, J.; Yao, R.; Liu, B.; Zheng, Y. Siamese convolutional neural networks for remote sensing scene classification. IEEE Geosci. Remote Sens. Lett. 2019, 16, 1200–1204. [Google Scholar] [CrossRef]
- Zhou, Y.; Liu, X.; Zhao, J.; Ma, D.; Yao, R.; Liu, B.; Zheng, Y. Remote sensing scene classification based on rotation-invariant feature learning and joint decision making. EURASIP J. Image Video Process. 2019, 2019, 3. [Google Scholar] [CrossRef] [Green Version]
- Lu, X.; Ji, W.; Li, X.; Zheng, X. Bidirectional adaptive feature fusion for remote sensing scene classification. Neurocomputing 2019, 328, 135–146. [Google Scholar] [CrossRef]
- Liu, Y.; Zhong, Y.; Qin, Q. Scene classification based on multiscale convolutional neural network. IEEE Trans. Geosci. Remote Sens. 2018, 56, 7109–7121. [Google Scholar] [CrossRef] [Green Version]
- Cao, R.; Fang, L.; Lu, T.; He, N. Self-attention-based deep feature fusion for remote sensing scene classification. IEEE Geosci. Remote Sens. Lett. 2020, 18, 43–47. [Google Scholar] [CrossRef]
- Liu, M.; Jiao, L.; Liu, X.; Li, L.; Liu, F.; Yang, S. C-CNN: Contourlet convolutional neural networks. IEEE Trans. Neural Netw. Learn. Syst. 2020, 32, 2636–2649. [Google Scholar] [CrossRef]
- Zhang, B.; Zhang, Y.; Wang, S. A lightweight and discriminative model for remote sensing scene classifification with multidilation pooling module. IEEE J. Sel. Topics Appl. Earth Observ. Remote Sens. 2019, 12, 2636–2653. [Google Scholar] [CrossRef]
- Li, W.; Wang, Z.; Wang, Y.; Wu, J.; Wang, J.; Jia, Y.; Gui, G. Classification of high-spatial-resolution remote sensing scenes method using transfer learning and deep convolutional neural network. IEEE J. Sel. Topics Appl. Earth Observ. Remote Sens. 2020, 13, 1986–1995. [Google Scholar] [CrossRef]
- Shi, C.; Zhang, X.; Sun, J.; Wang, L. A Lightweight Convolutional Neural Network Based on Group-Wise Hybrid Attention for Remote Sensing Scene Classifification. Remote Sens. 2022, 14, 161. [Google Scholar] [CrossRef]
- Xu, C.; Zhu, G.; Shu, J. A lightweight intrinsic mean for remote sensing classifification with lie group kernel function. IEEE Geosci. Remote Sens. Lett. 2021, 18, 1741–1745. [Google Scholar] [CrossRef]
Figure 1.
Scene labels (shown in green font) and object labels (shown in red font) for remote-sensing images. (a) Scene labels: River. Object labels: Field, Forest, Residential, Pavement. (b) Scene labels: Overpass. Object labels: Buildings, Grass, Parking, River.
Figure 1.
Scene labels (shown in green font) and object labels (shown in red font) for remote-sensing images. (a) Scene labels: River. Object labels: Field, Forest, Residential, Pavement. (b) Scene labels: Overpass. Object labels: Buildings, Grass, Parking, River.
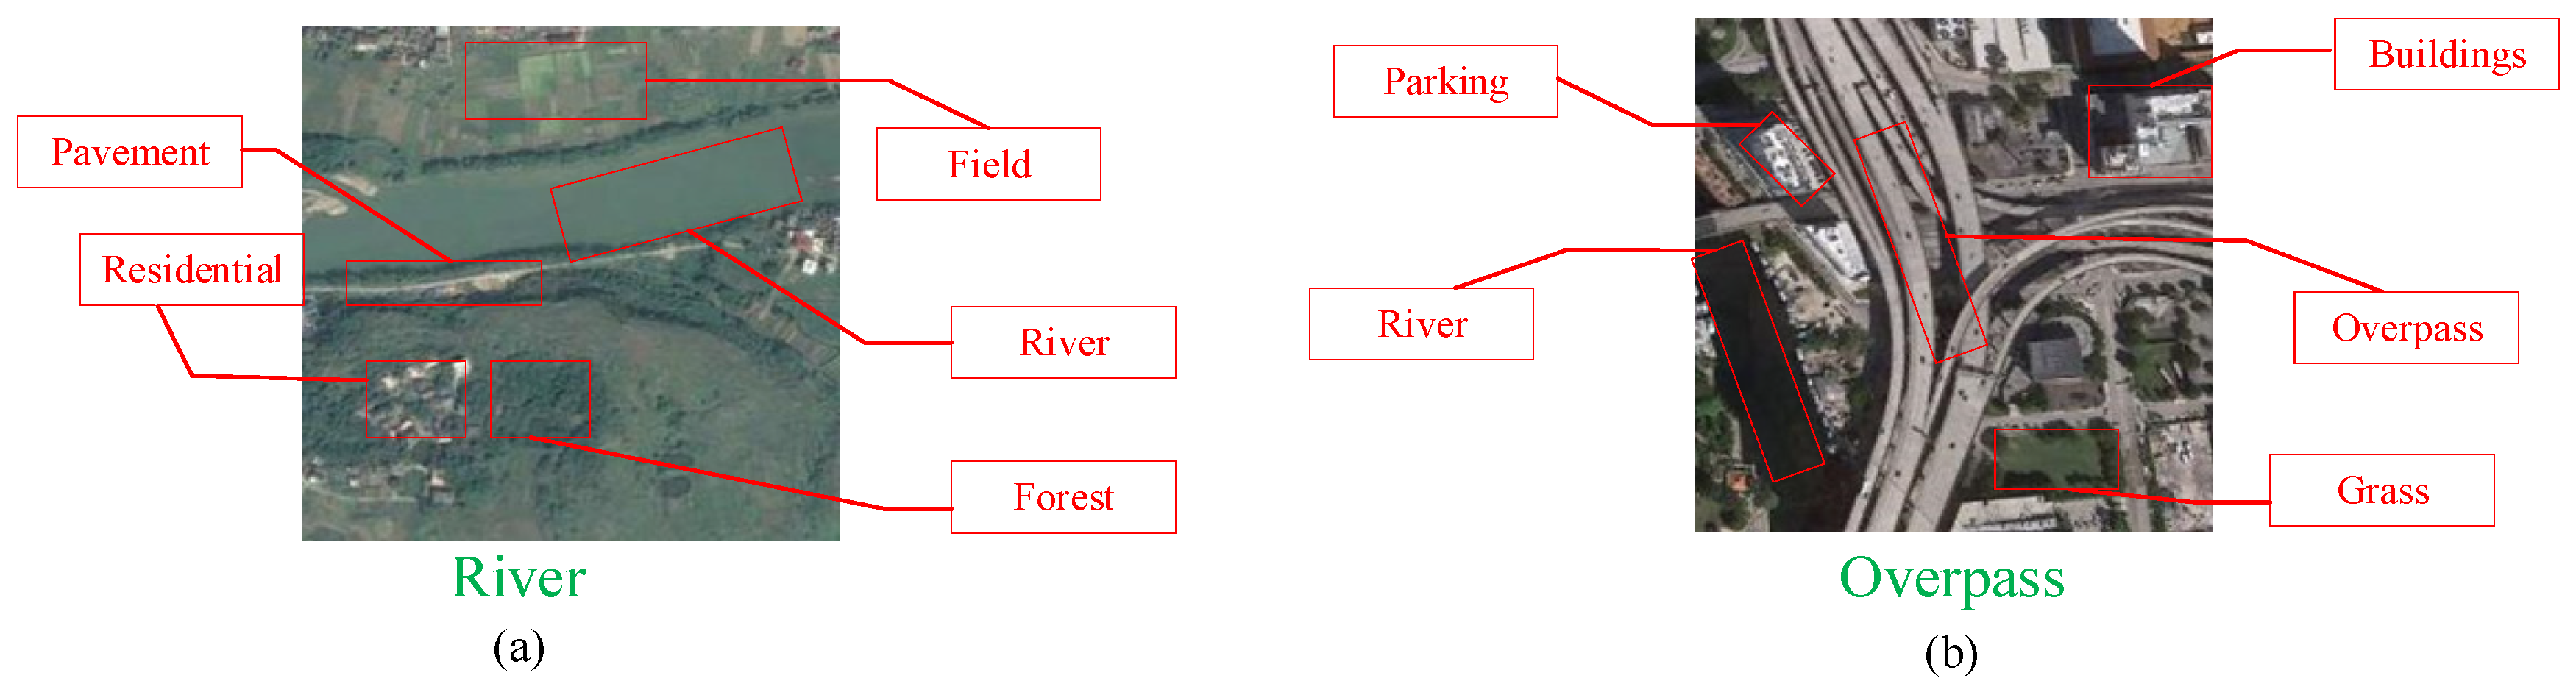
Figure 2.
Remote-sensing scene images. (a) High intra-class differences: airplane. (b) High inter-class similarities: highway, runway, railway.
Figure 2.
Remote-sensing scene images. (a) High intra-class differences: airplane. (b) High inter-class similarities: highway, runway, railway.

Figure 3.
The overall structure of the proposed LCNN-HWCF method.
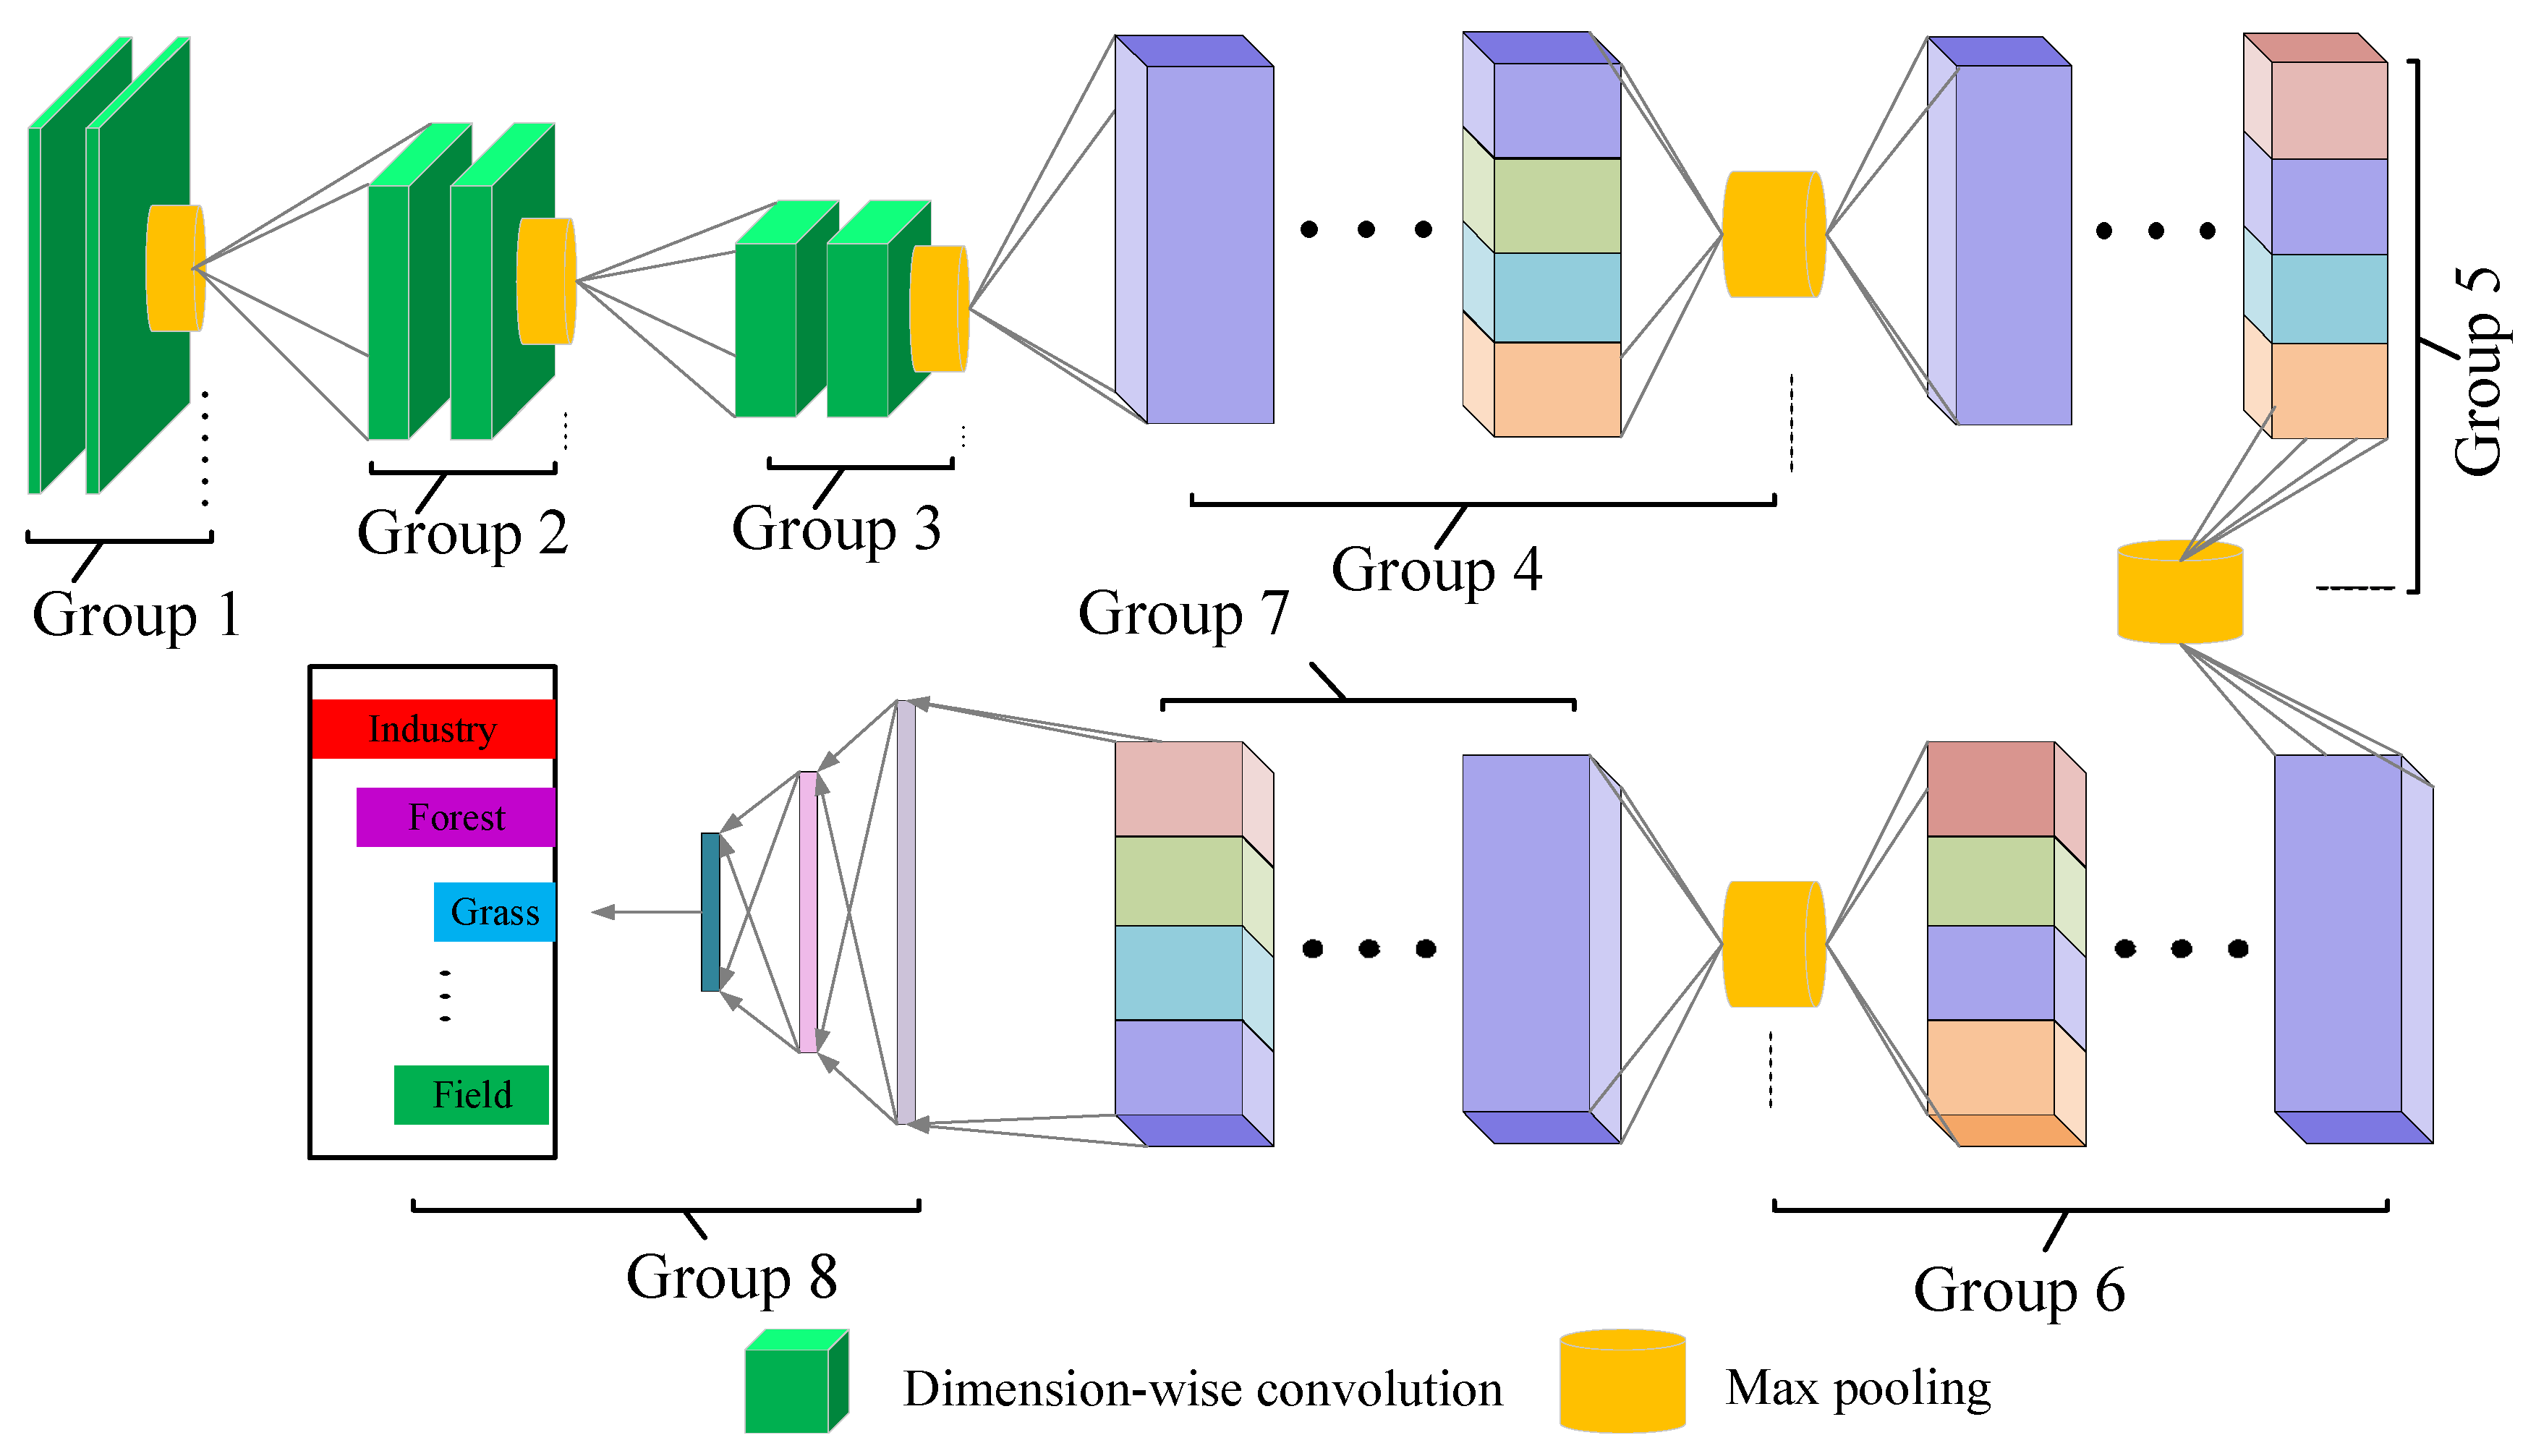
Figure 4.
The structure of group 8.

Figure 5.
The structure of the traditional convolution and the dimension-wise convolution. (a) Traditional convolution. (b) Dimension-wise convolution.
Figure 5.
The structure of the traditional convolution and the dimension-wise convolution. (a) Traditional convolution. (b) Dimension-wise convolution.

Figure 6.
Hierarchical-wise convolution fusion module A. (Group 1 maps directly to the next layer).
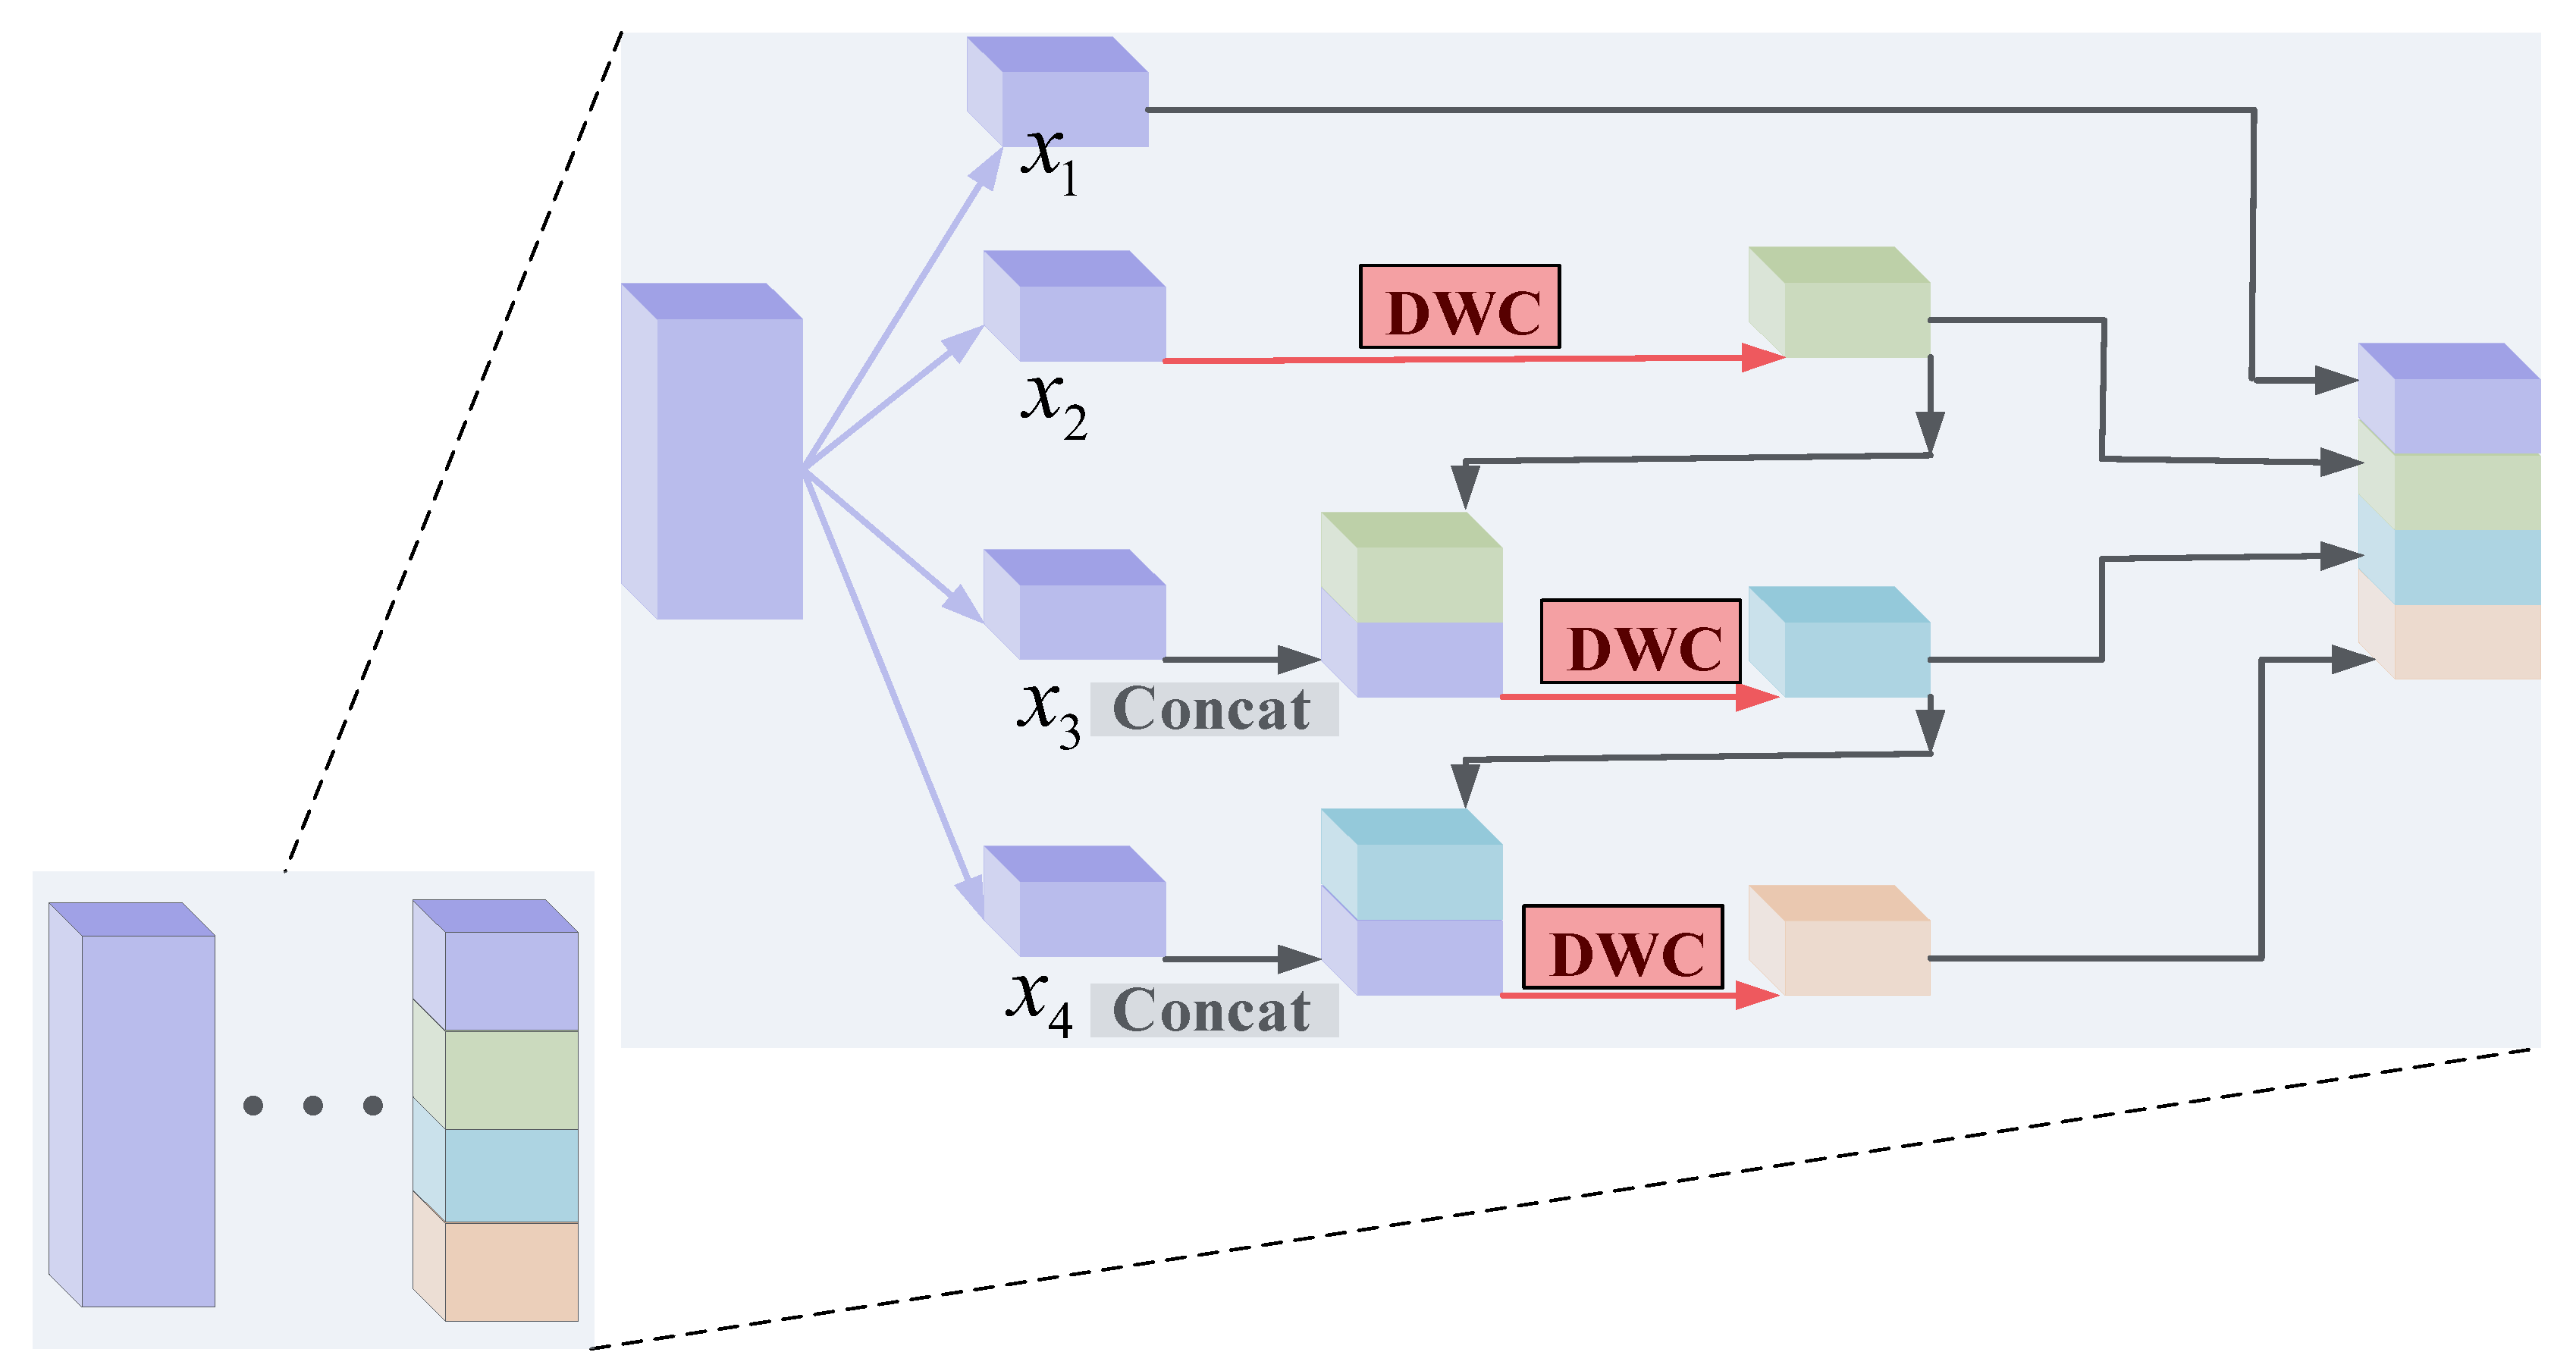
Figure 7.
Hierarchical-wise convolution fusion module B. (Group 2 maps directly to the next layer).

Figure 8.
Hierarchical-wise convolution fusion module C. (Group 3 maps directly to the next layer).
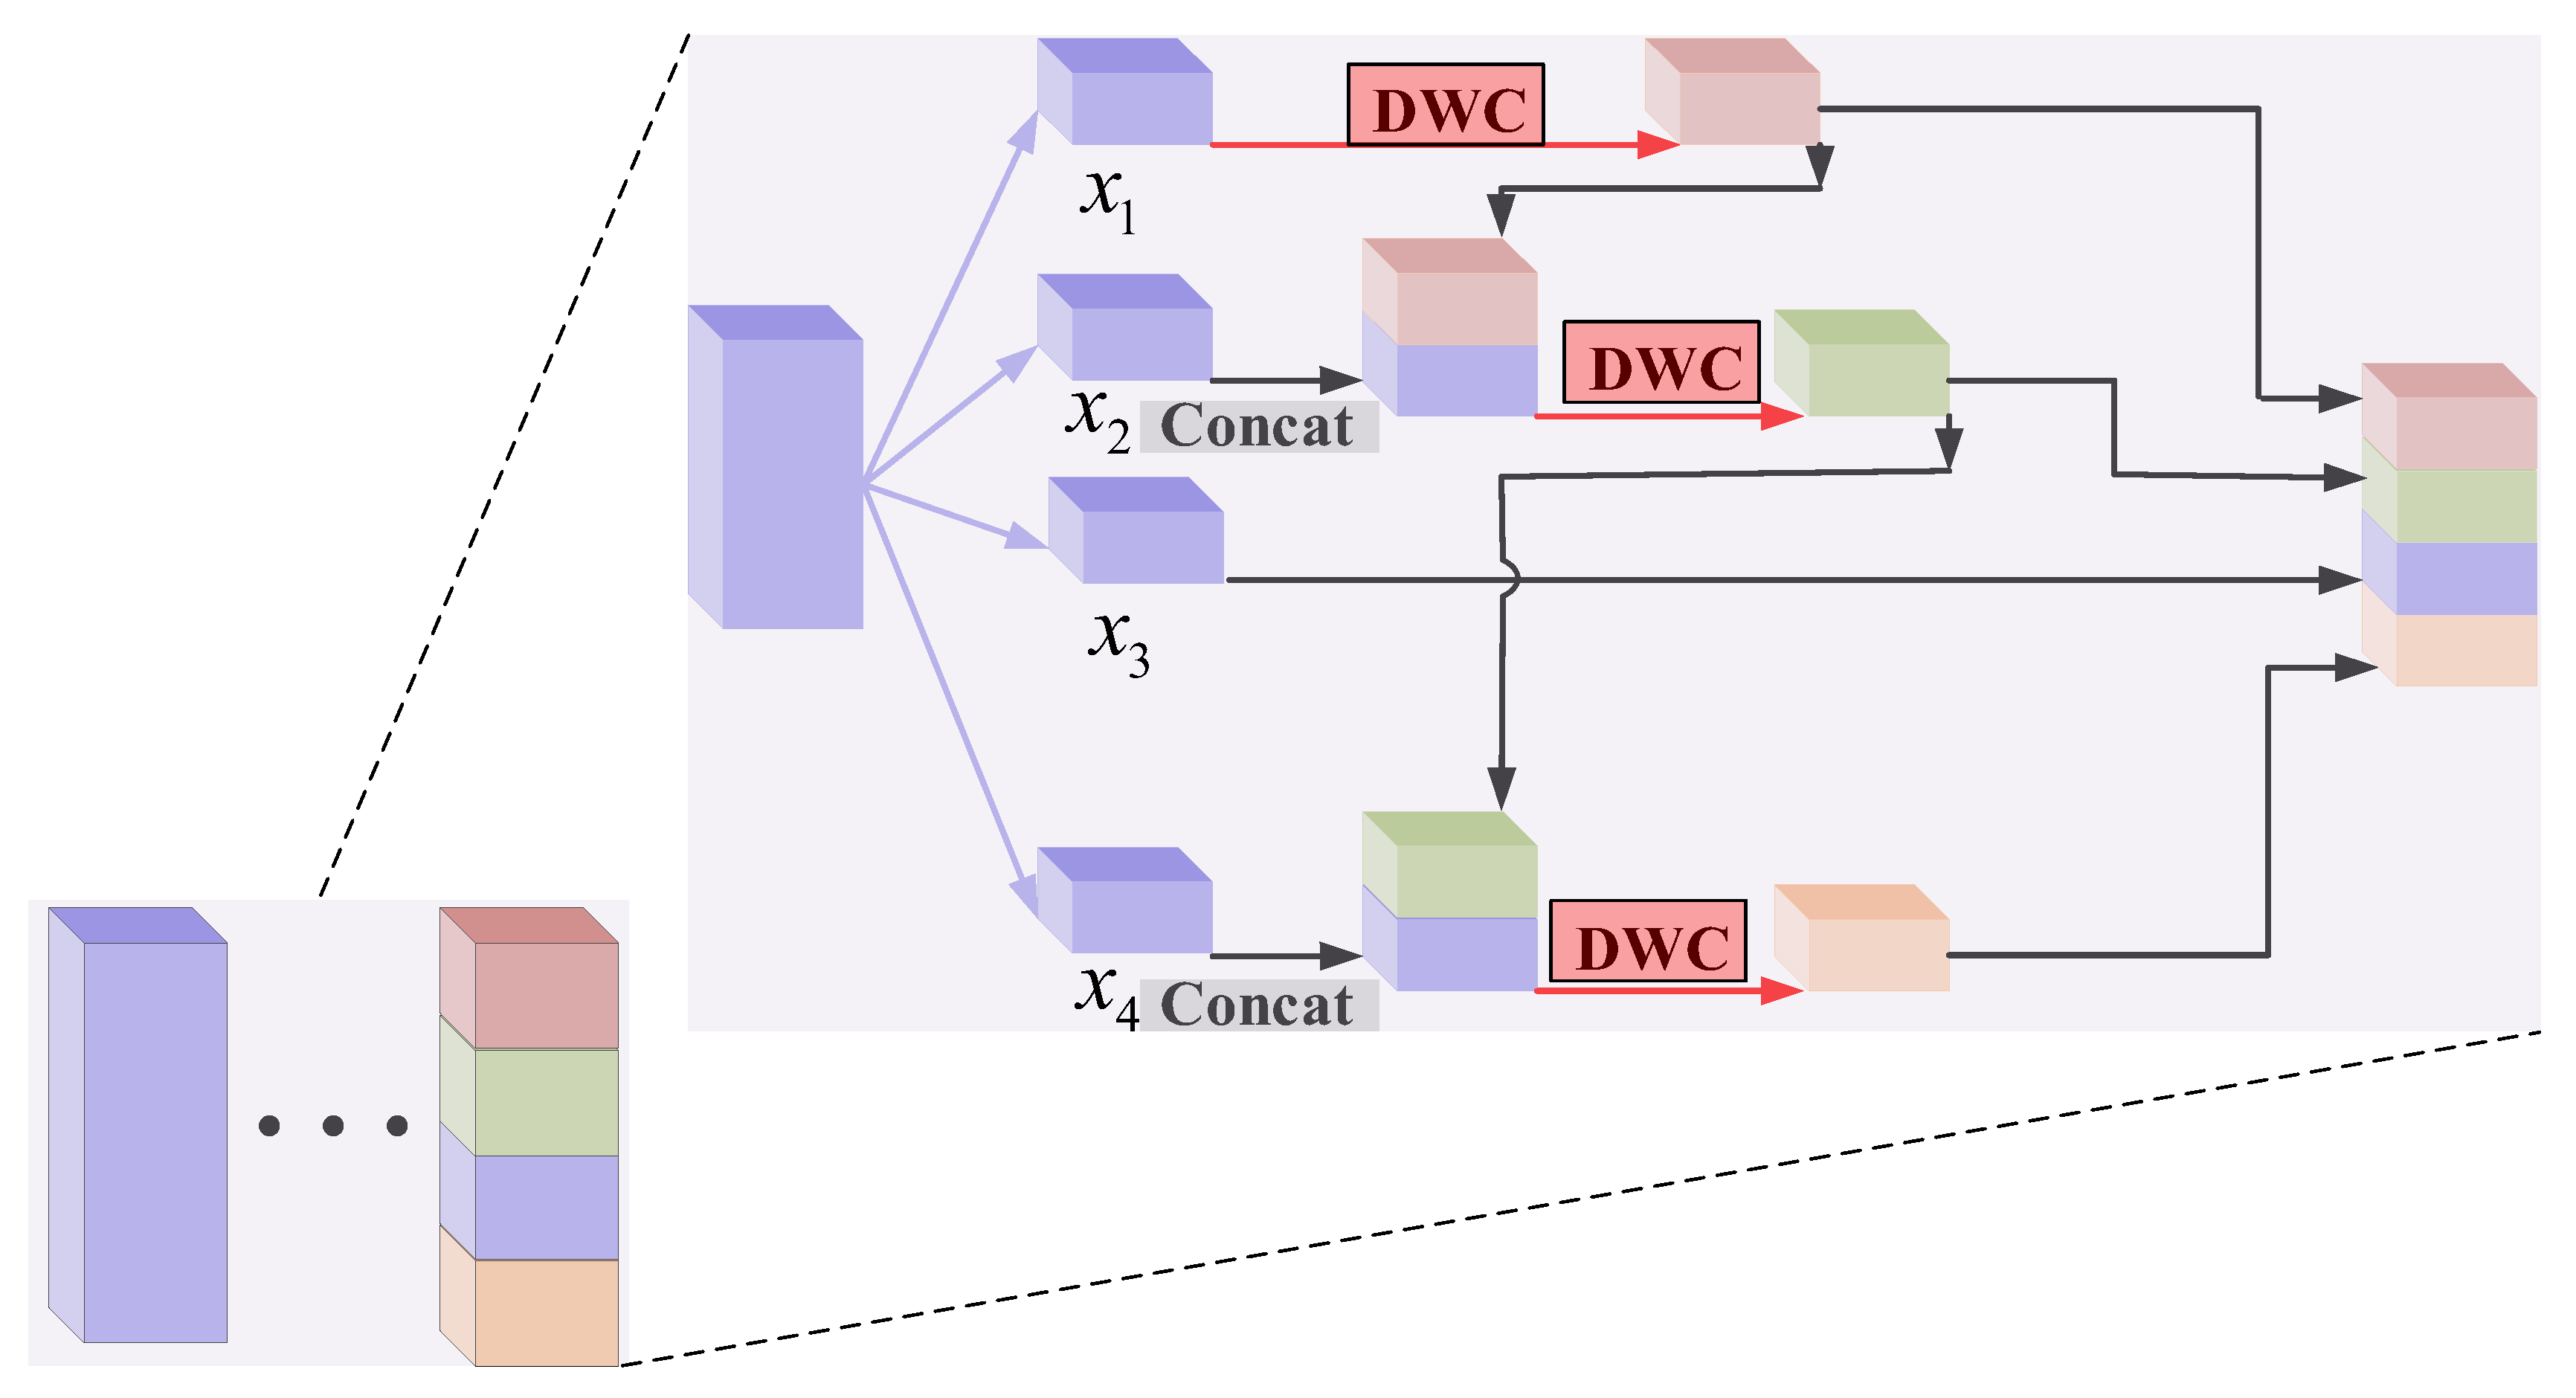
Figure 9.
Hierarchical-wise convolution fusion module D. (Group 4 maps directly to the next layer).
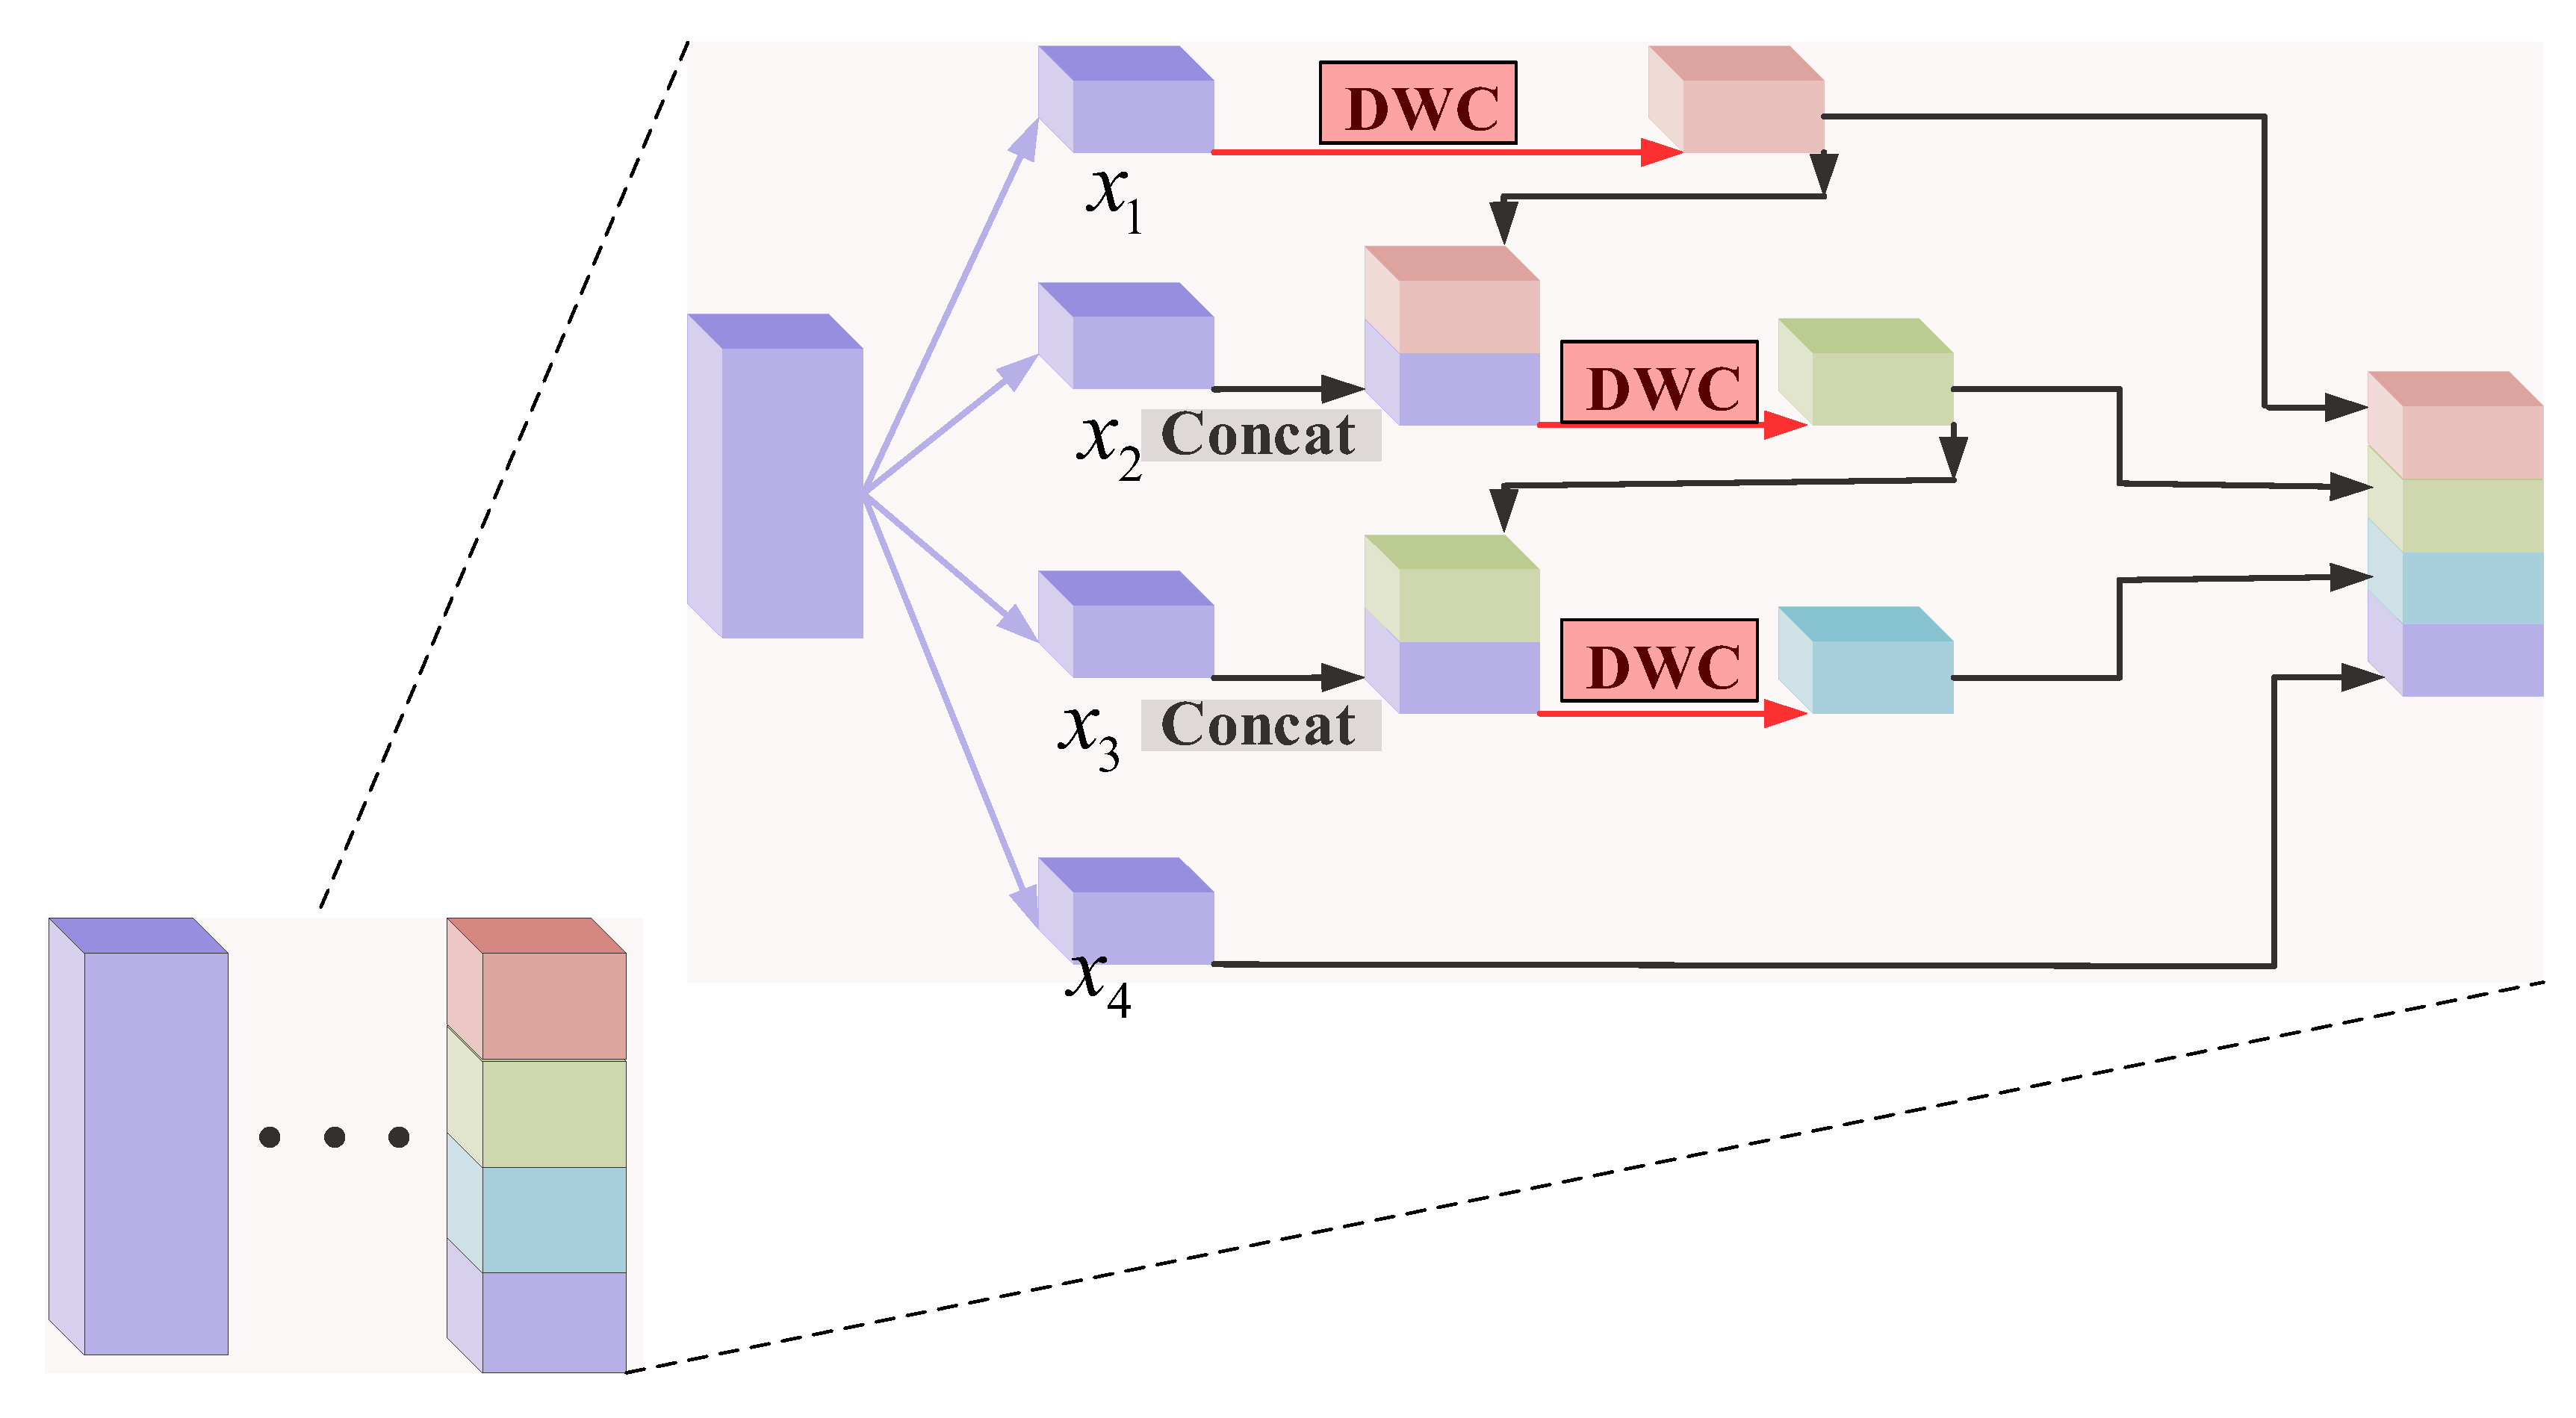
Figure 10.
Confusion matrix of the proposed method on UCM dataset with 80% training ratio.
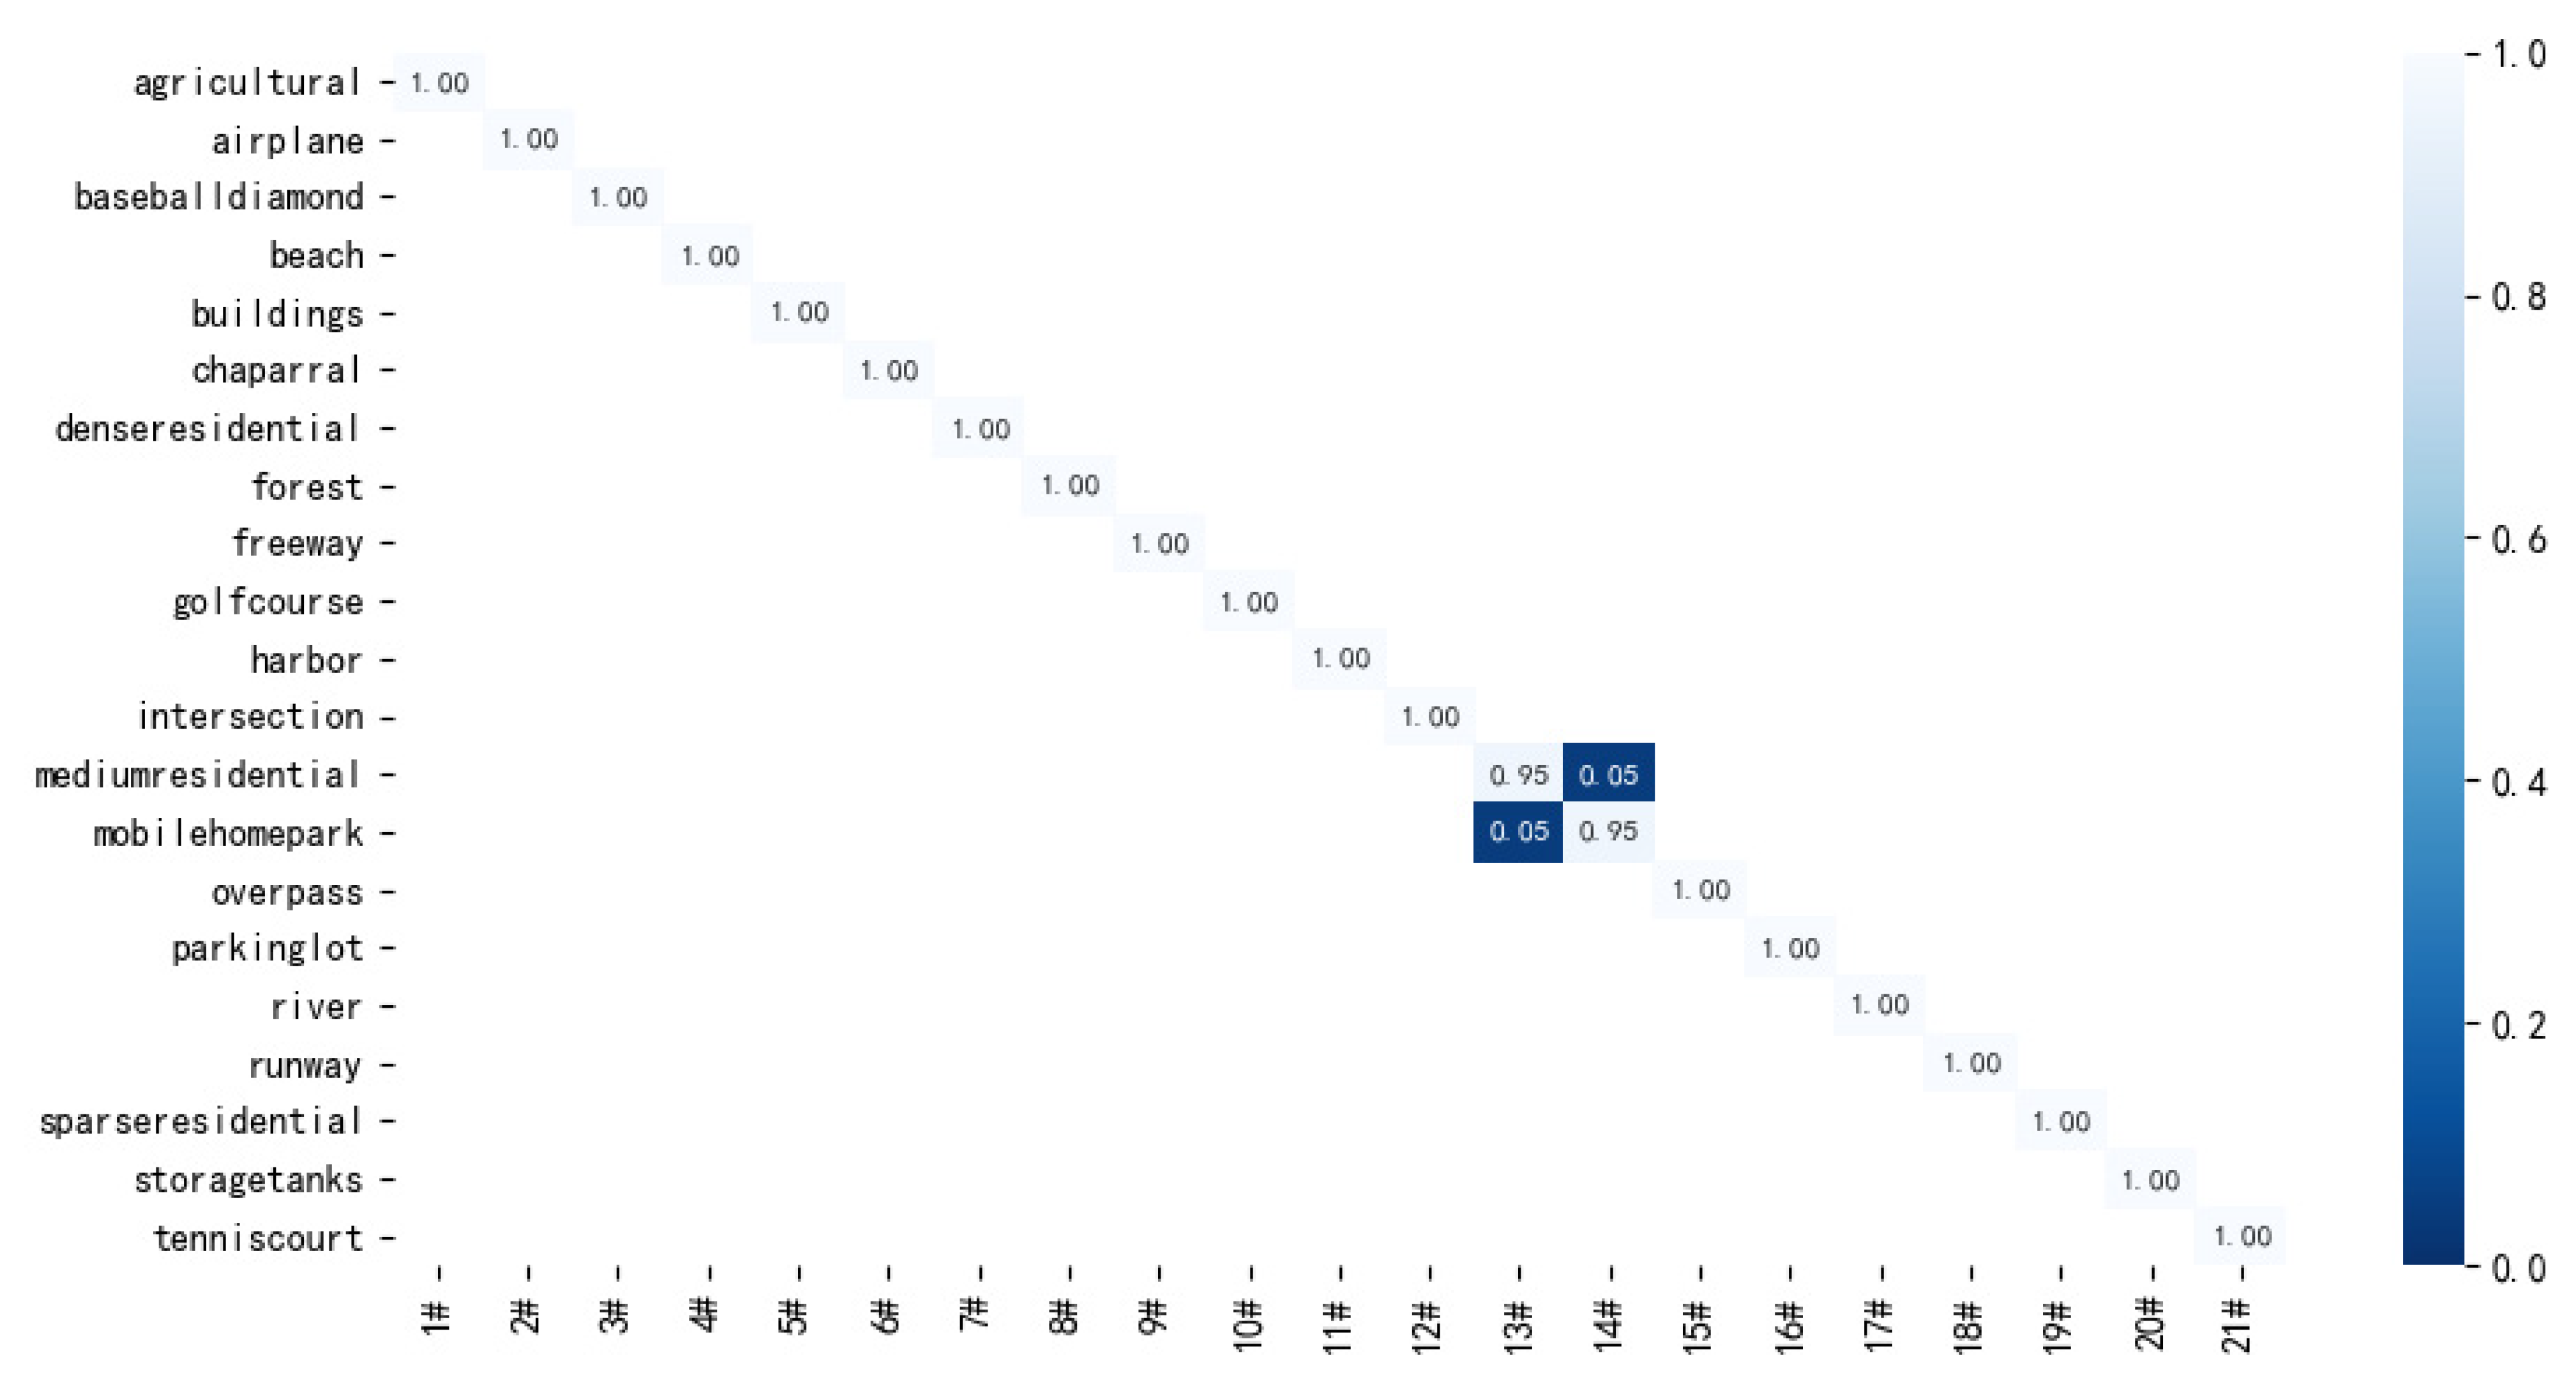
Figure 11.
Confusion matrix of the proposed method on RSSCN dataset with 50% training ratio.
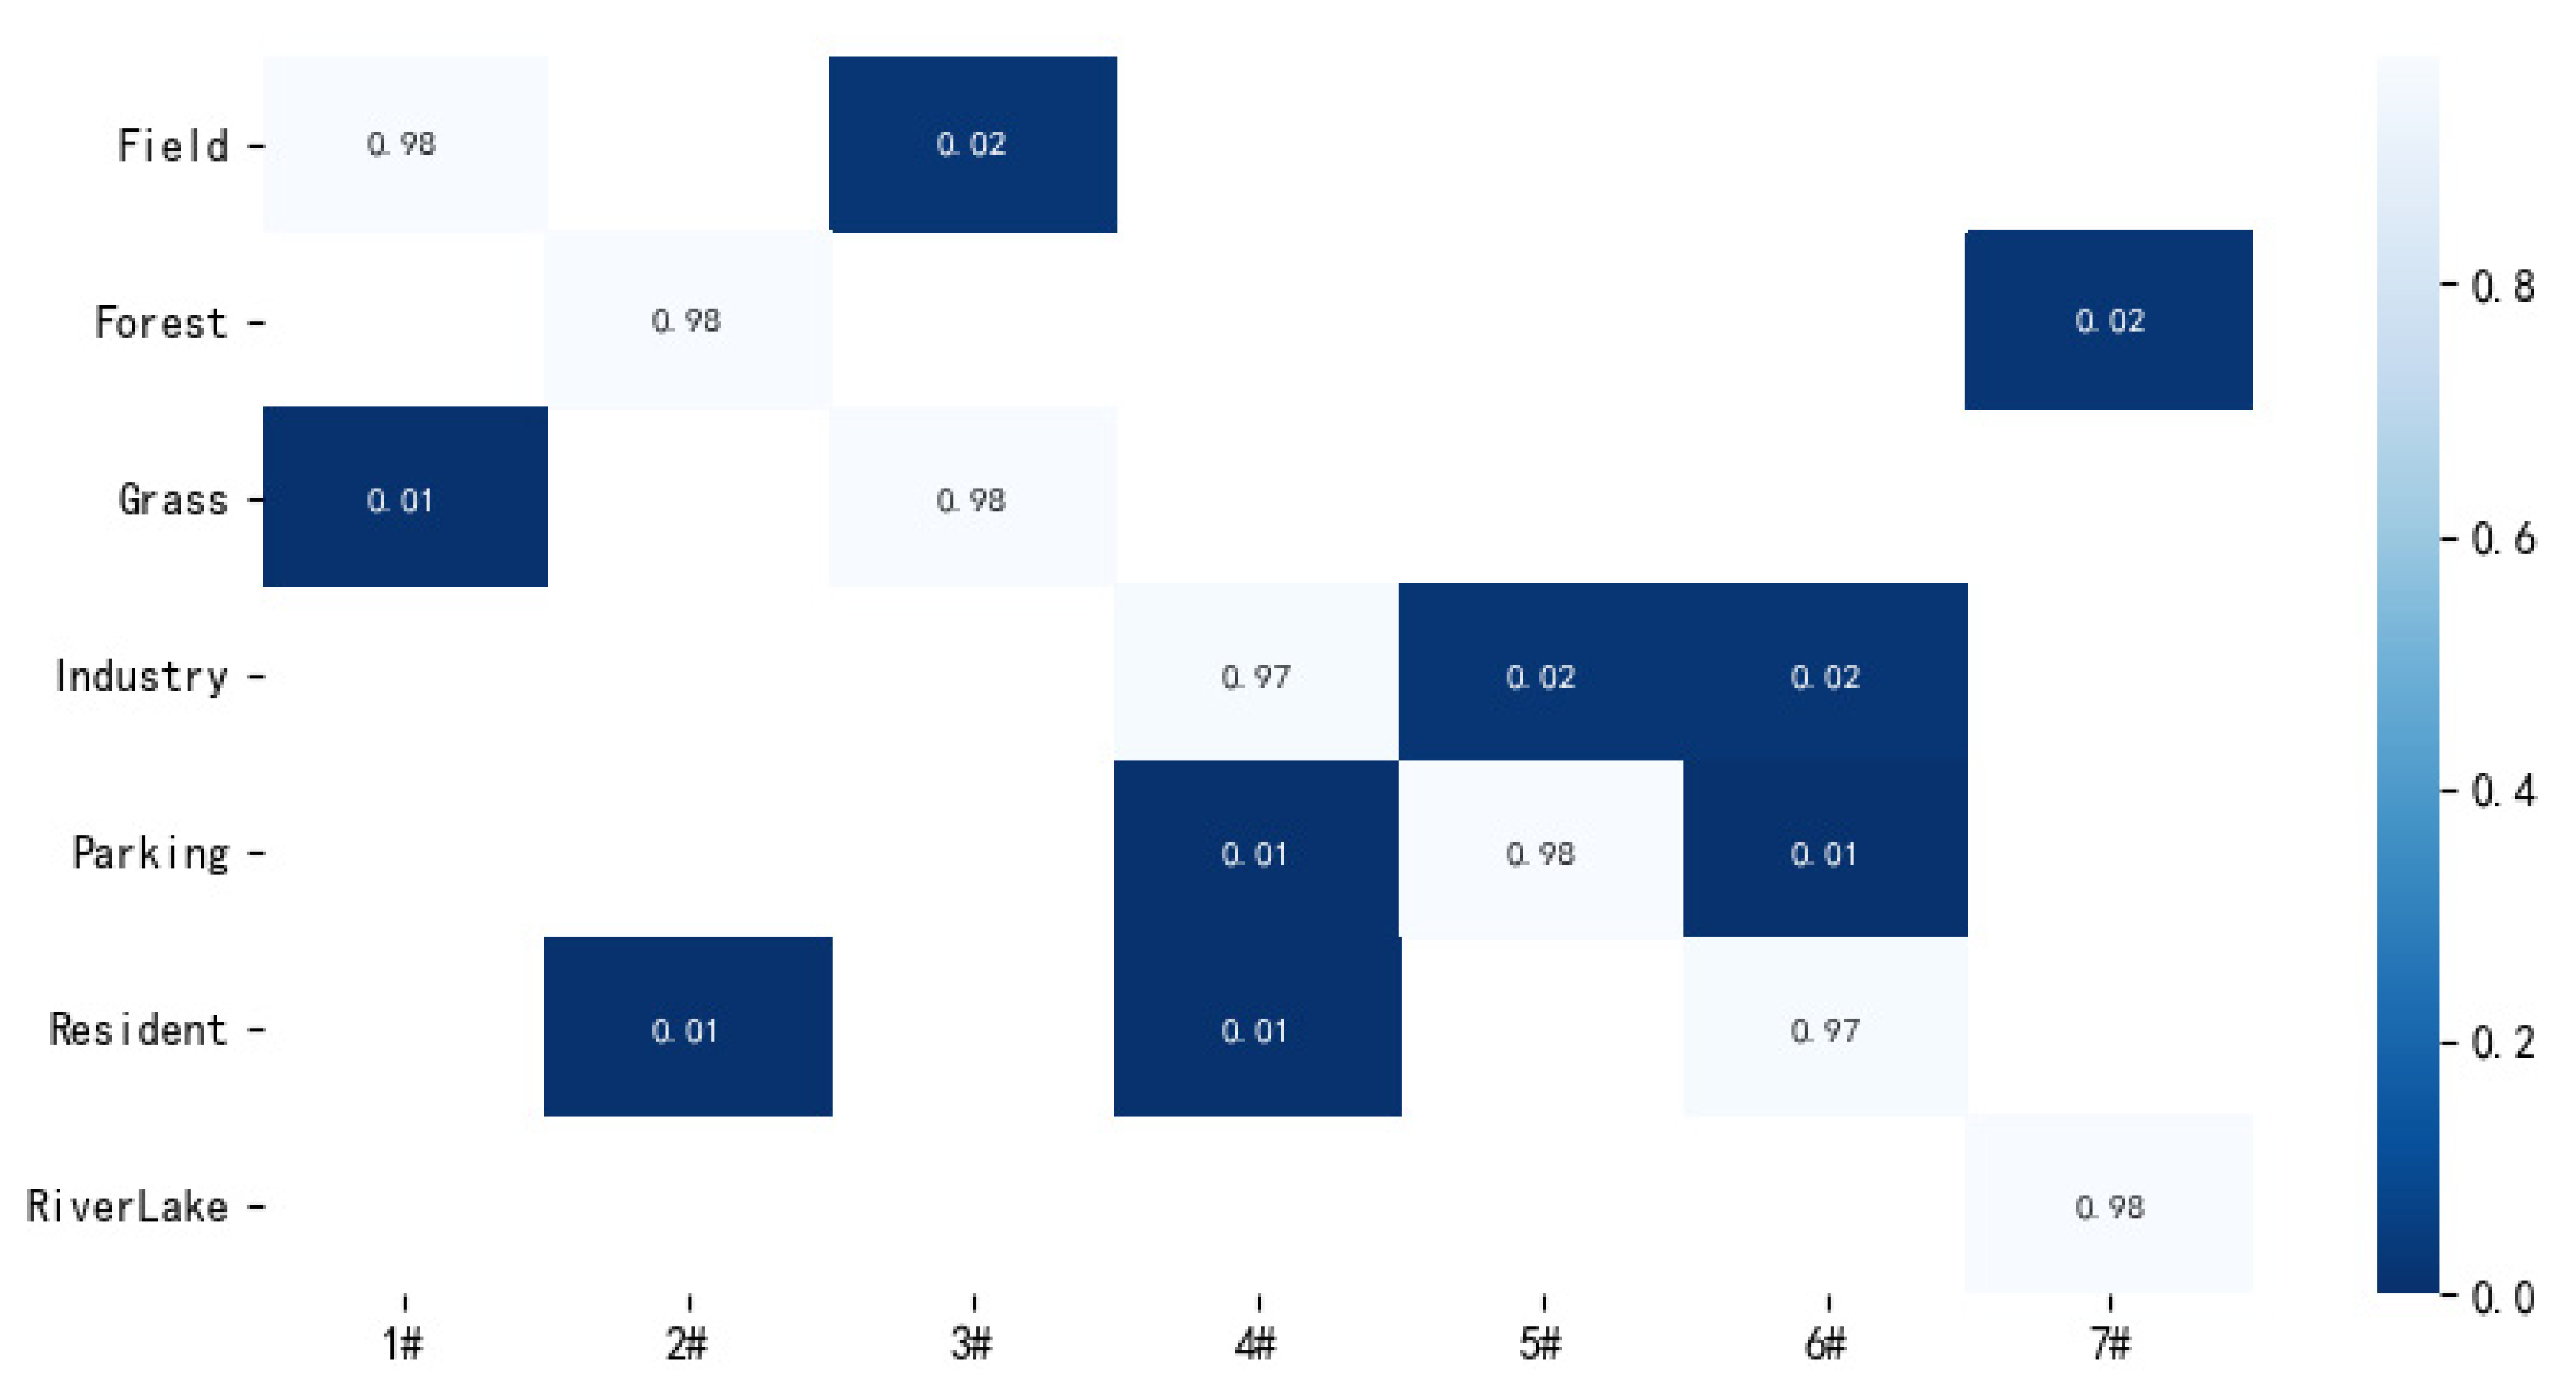
Figure 12.
Confusion matrix of the proposed method on the AID dataset with 50% training ratio.
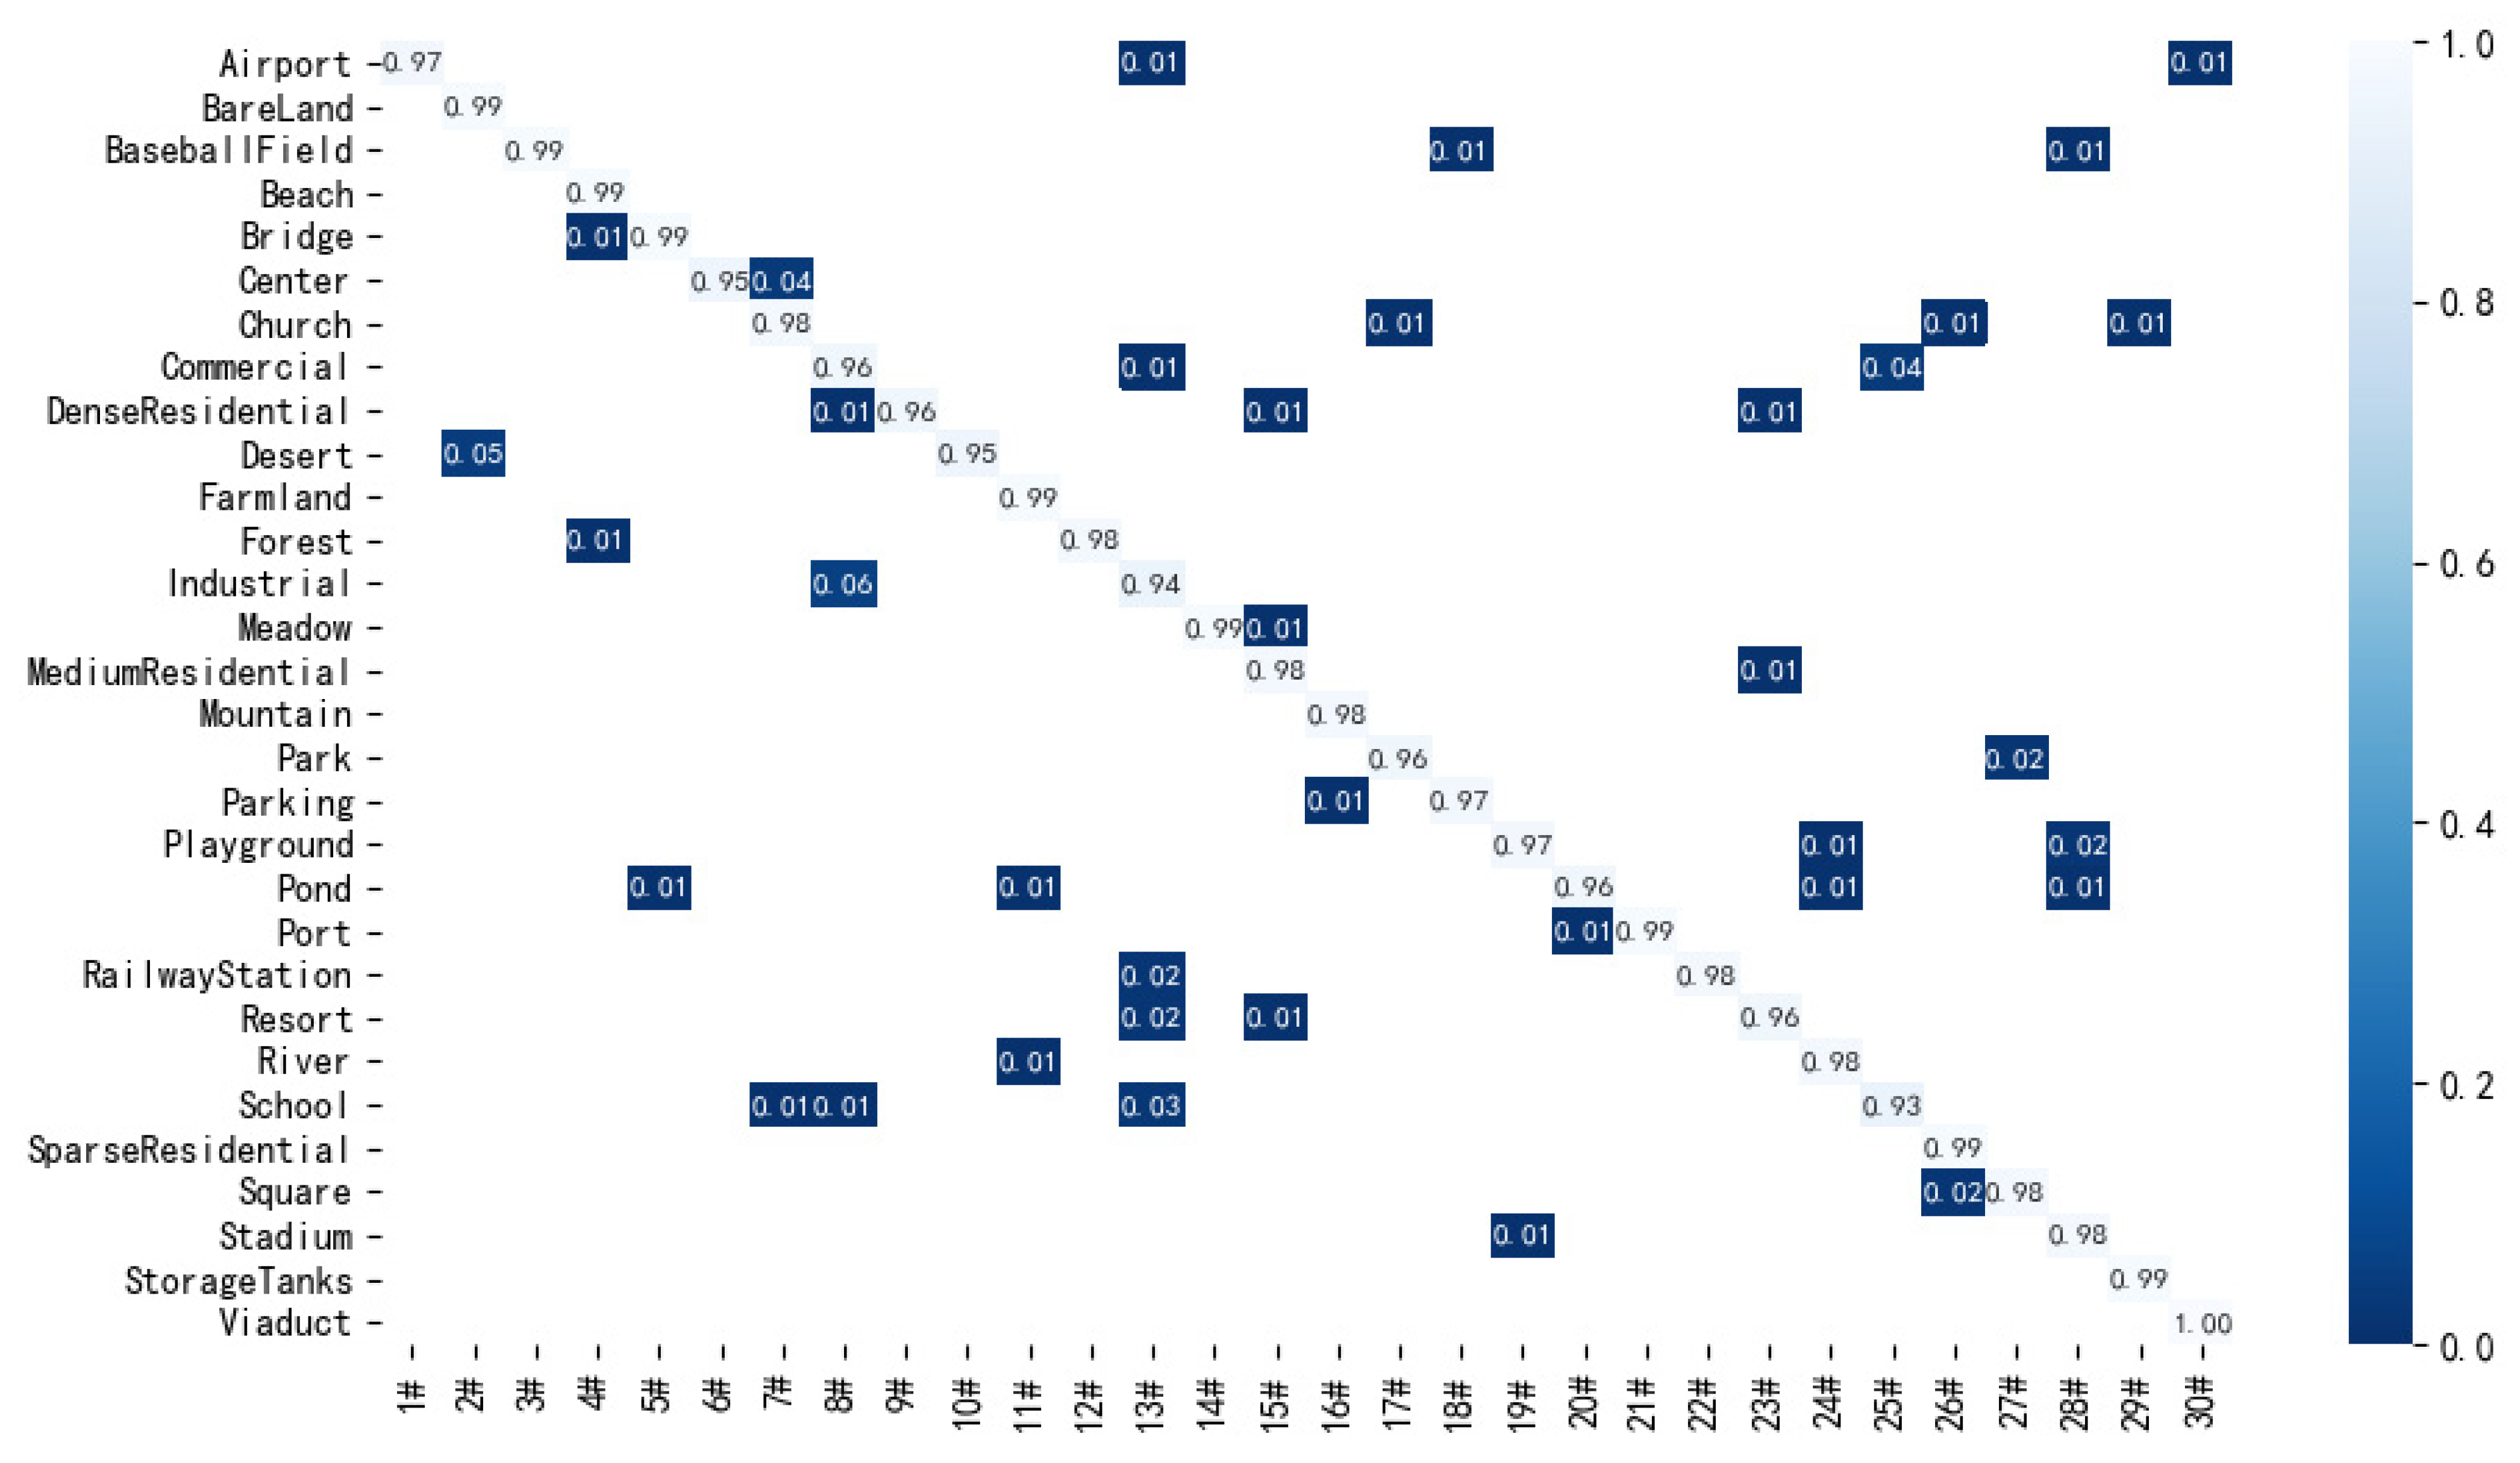
Figure 13.
Confusion matrix of the proposed method on the NWPU dataset with 20% training ratio.
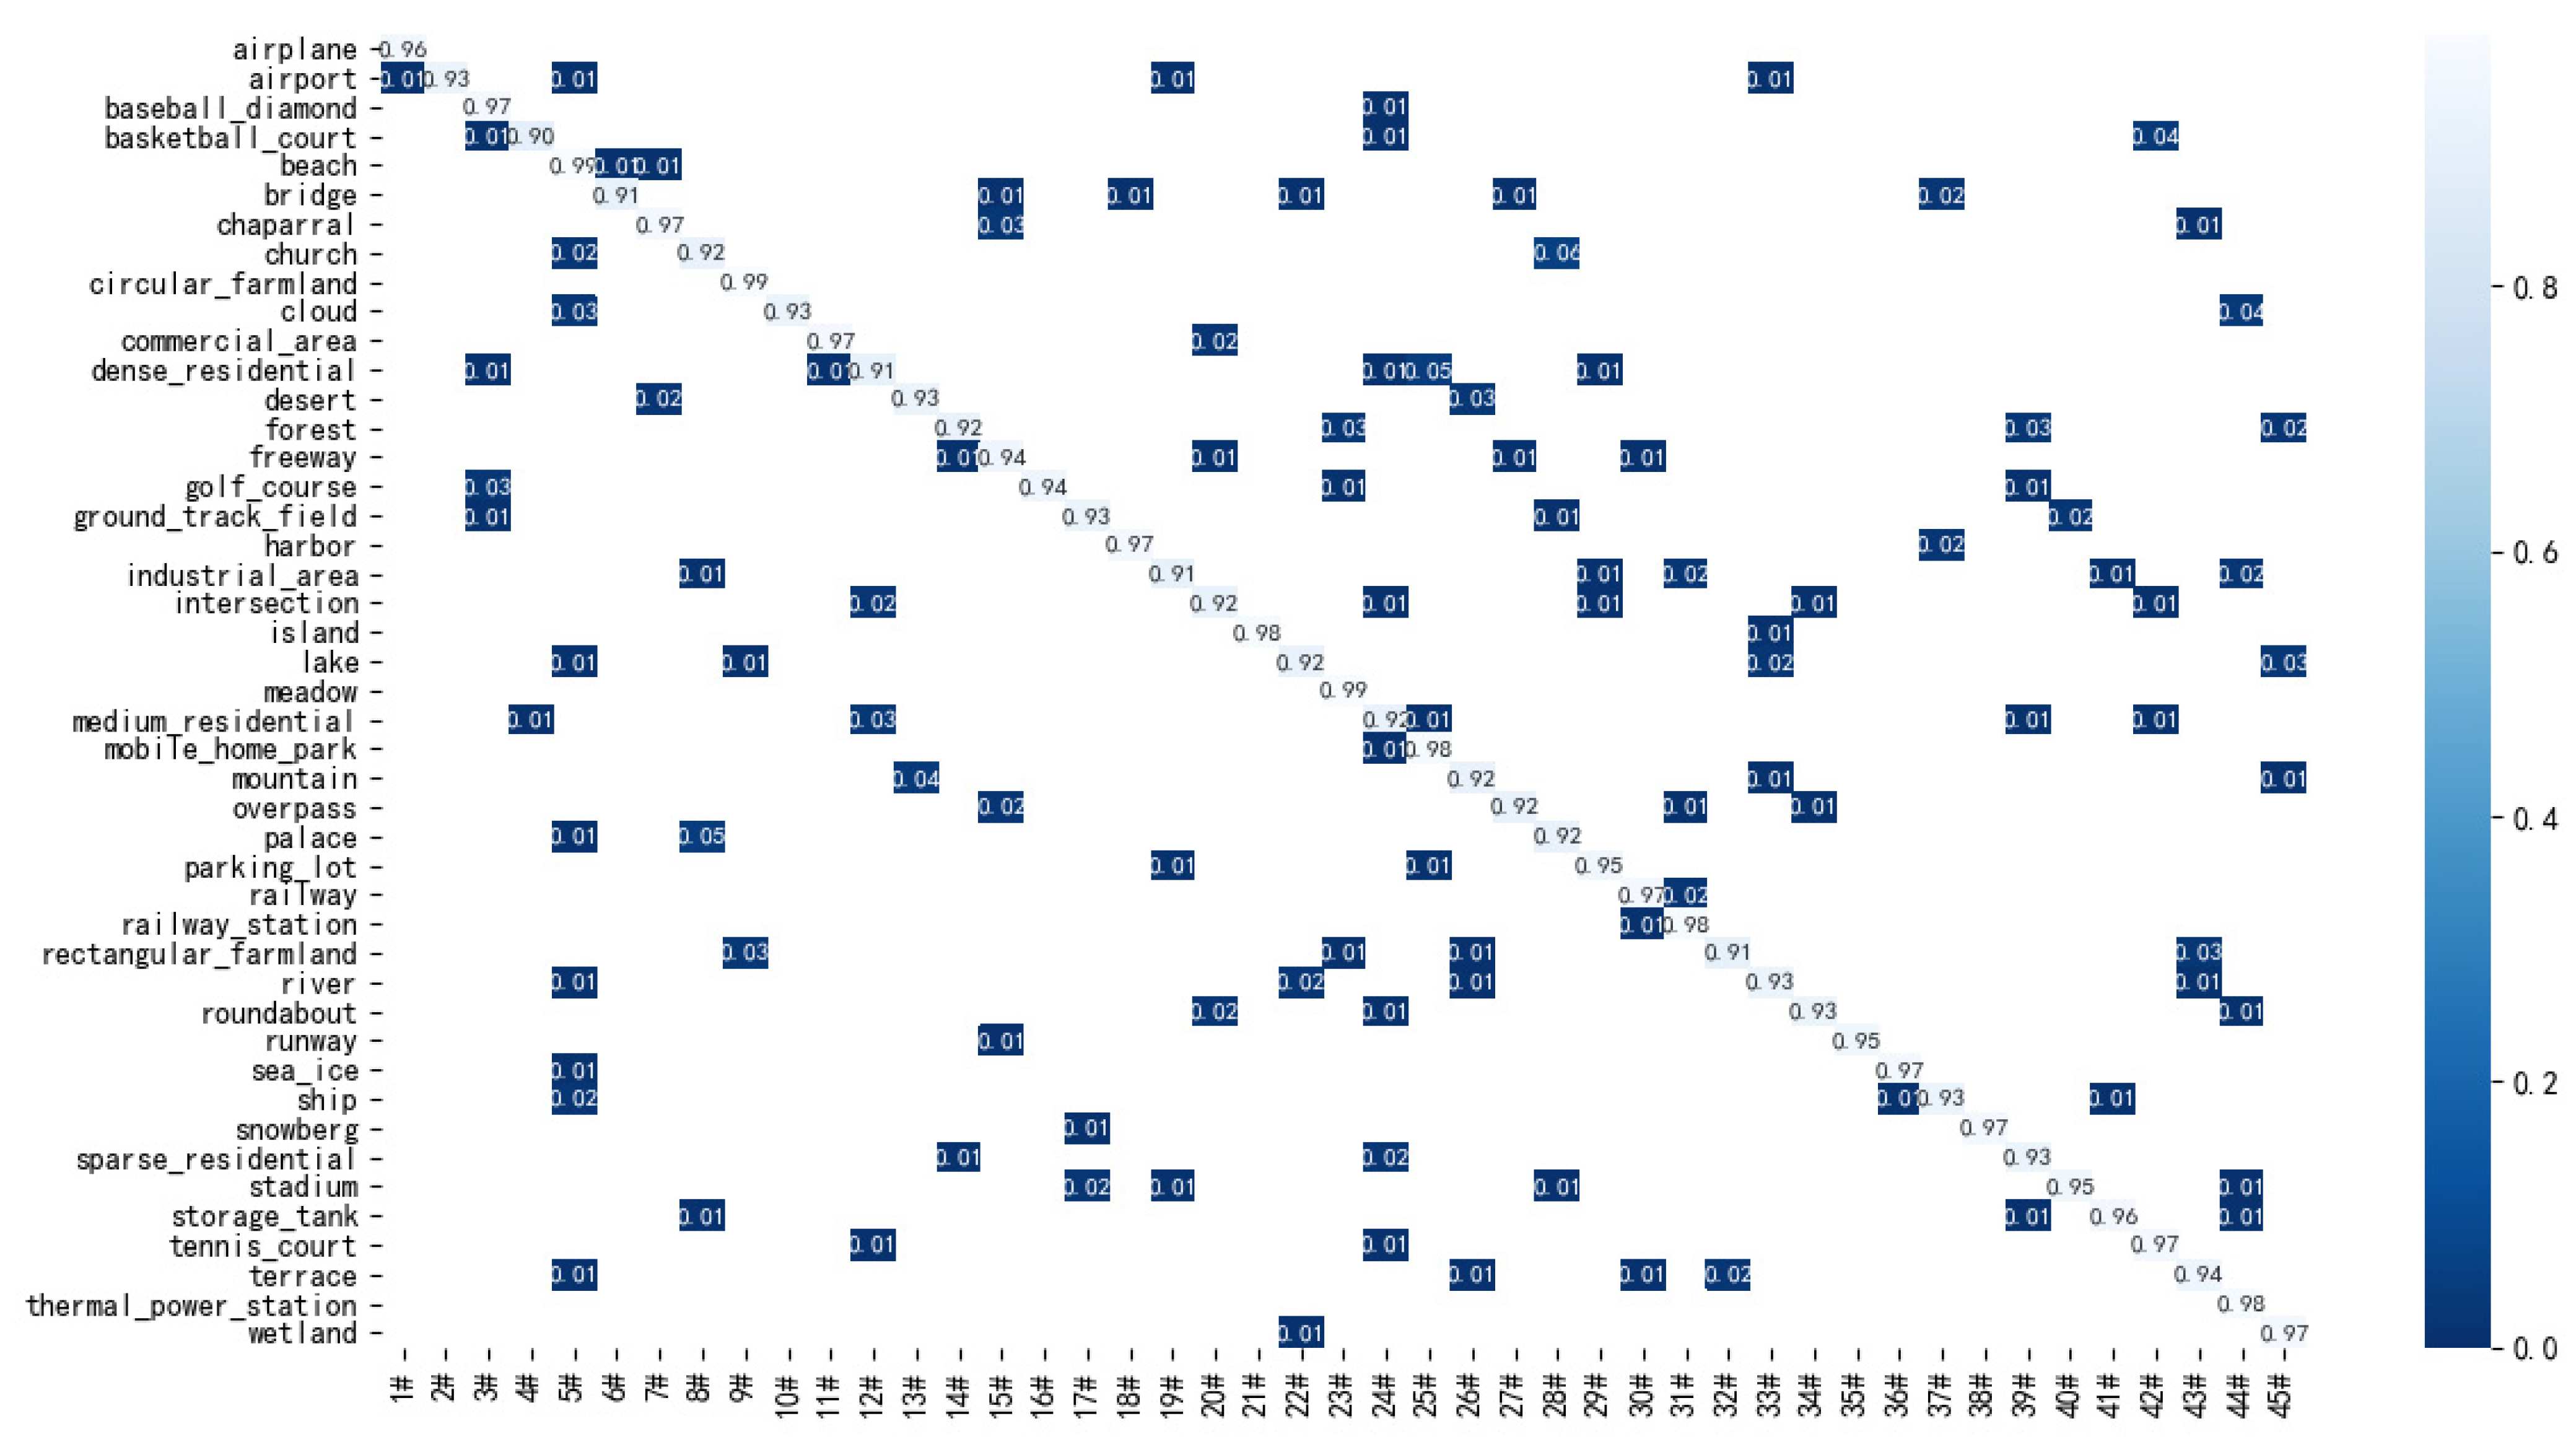
Figure 14.
Grad cam visualization results.
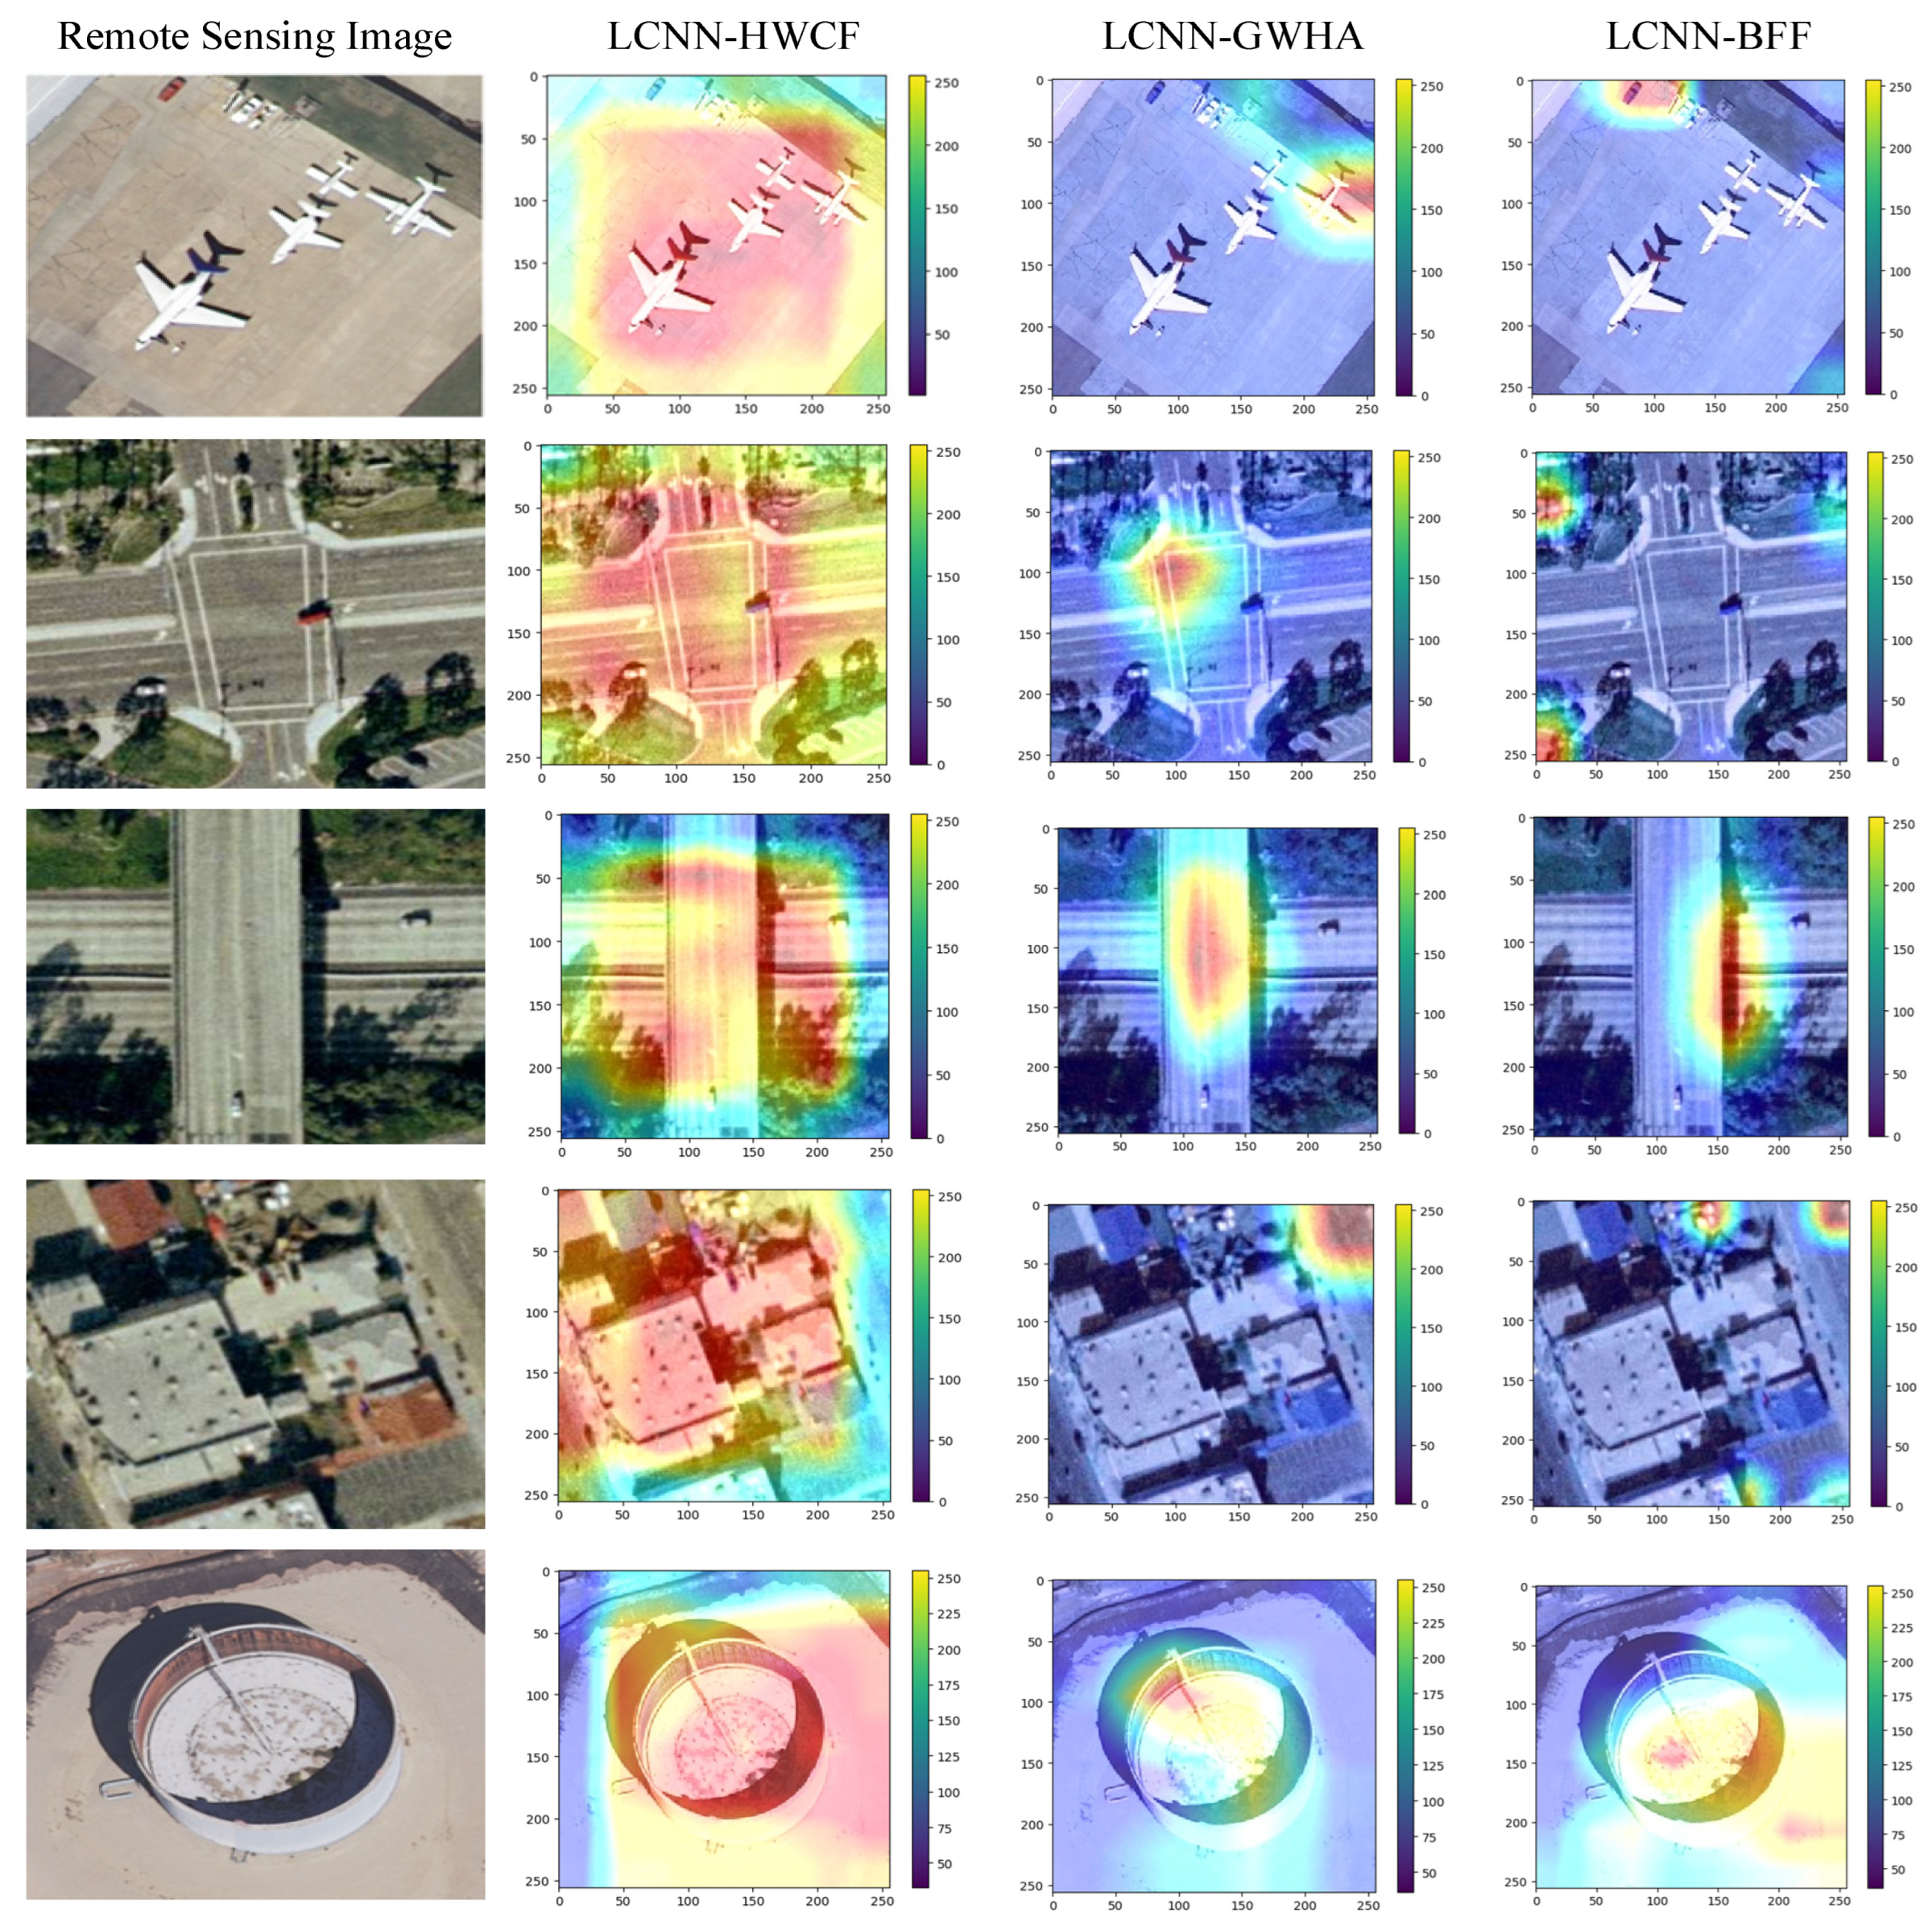
Figure 15.
T-SNE visualization results. (a) T-SNE visualization results on RSSCN datasets. (b) T-SNE visualization results on UC datasets.
Figure 15.
T-SNE visualization results. (a) T-SNE visualization results on RSSCN datasets. (b) T-SNE visualization results on UC datasets.
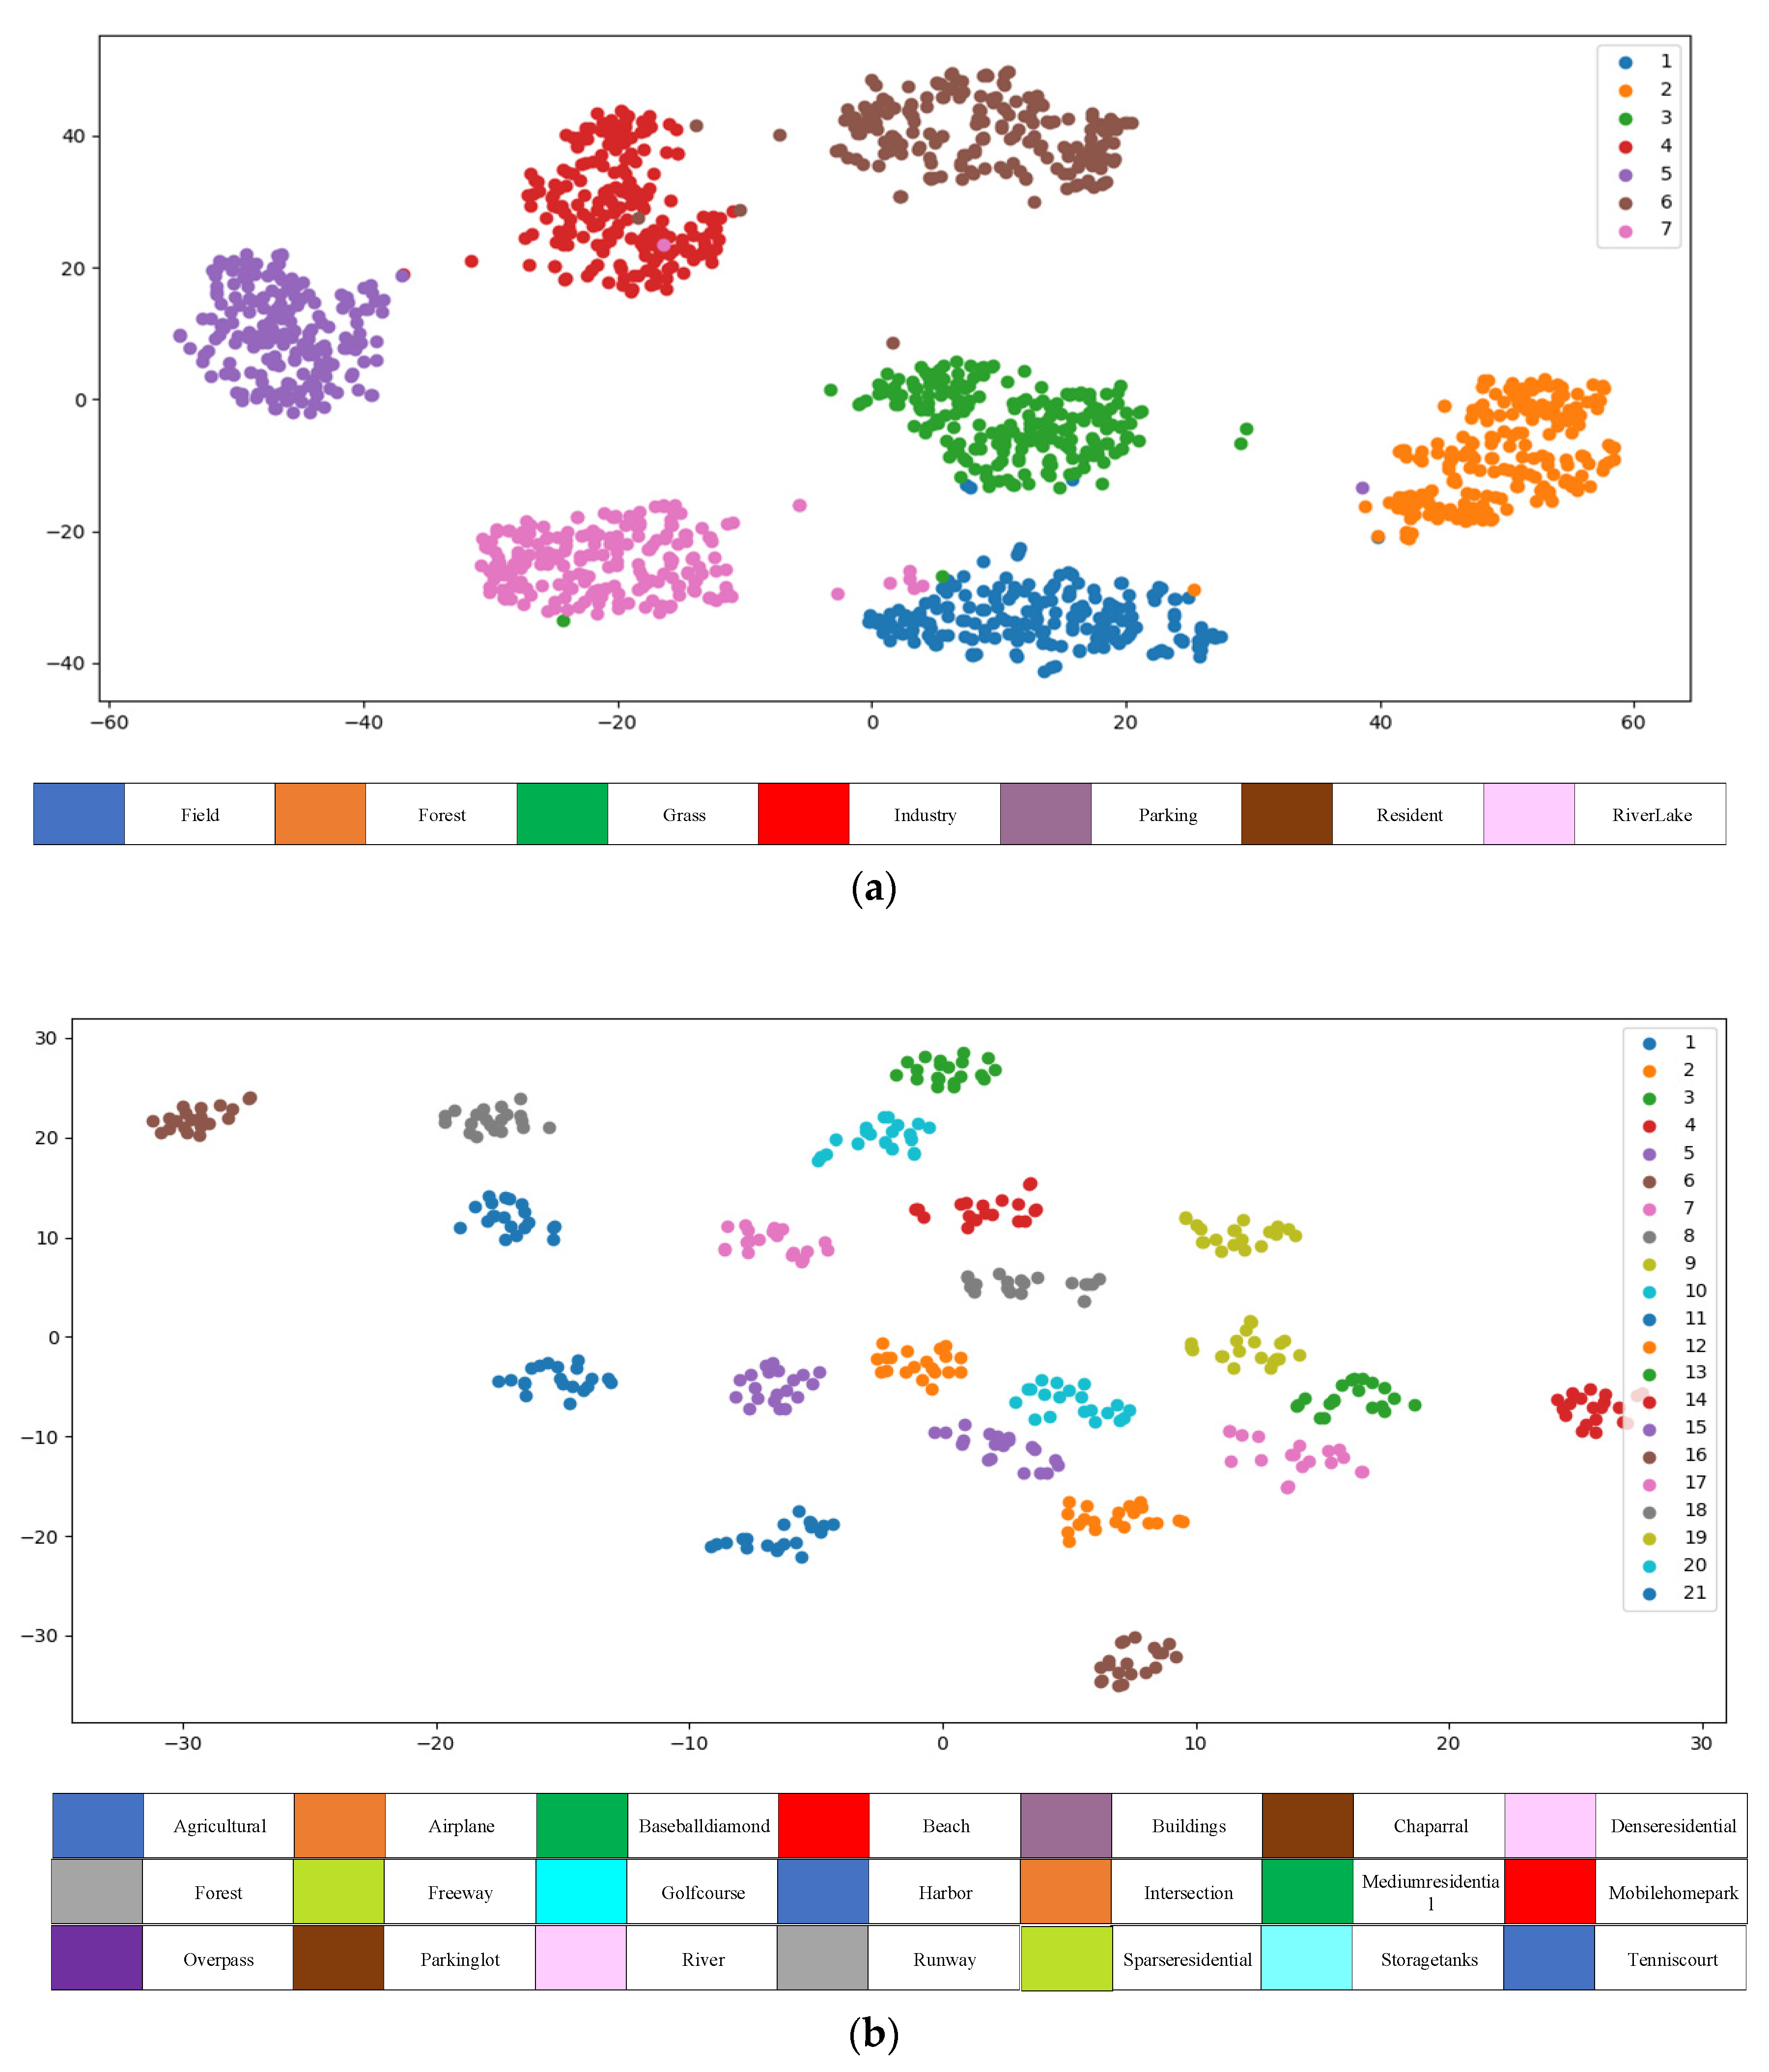
Figure 16.
Random image test results.
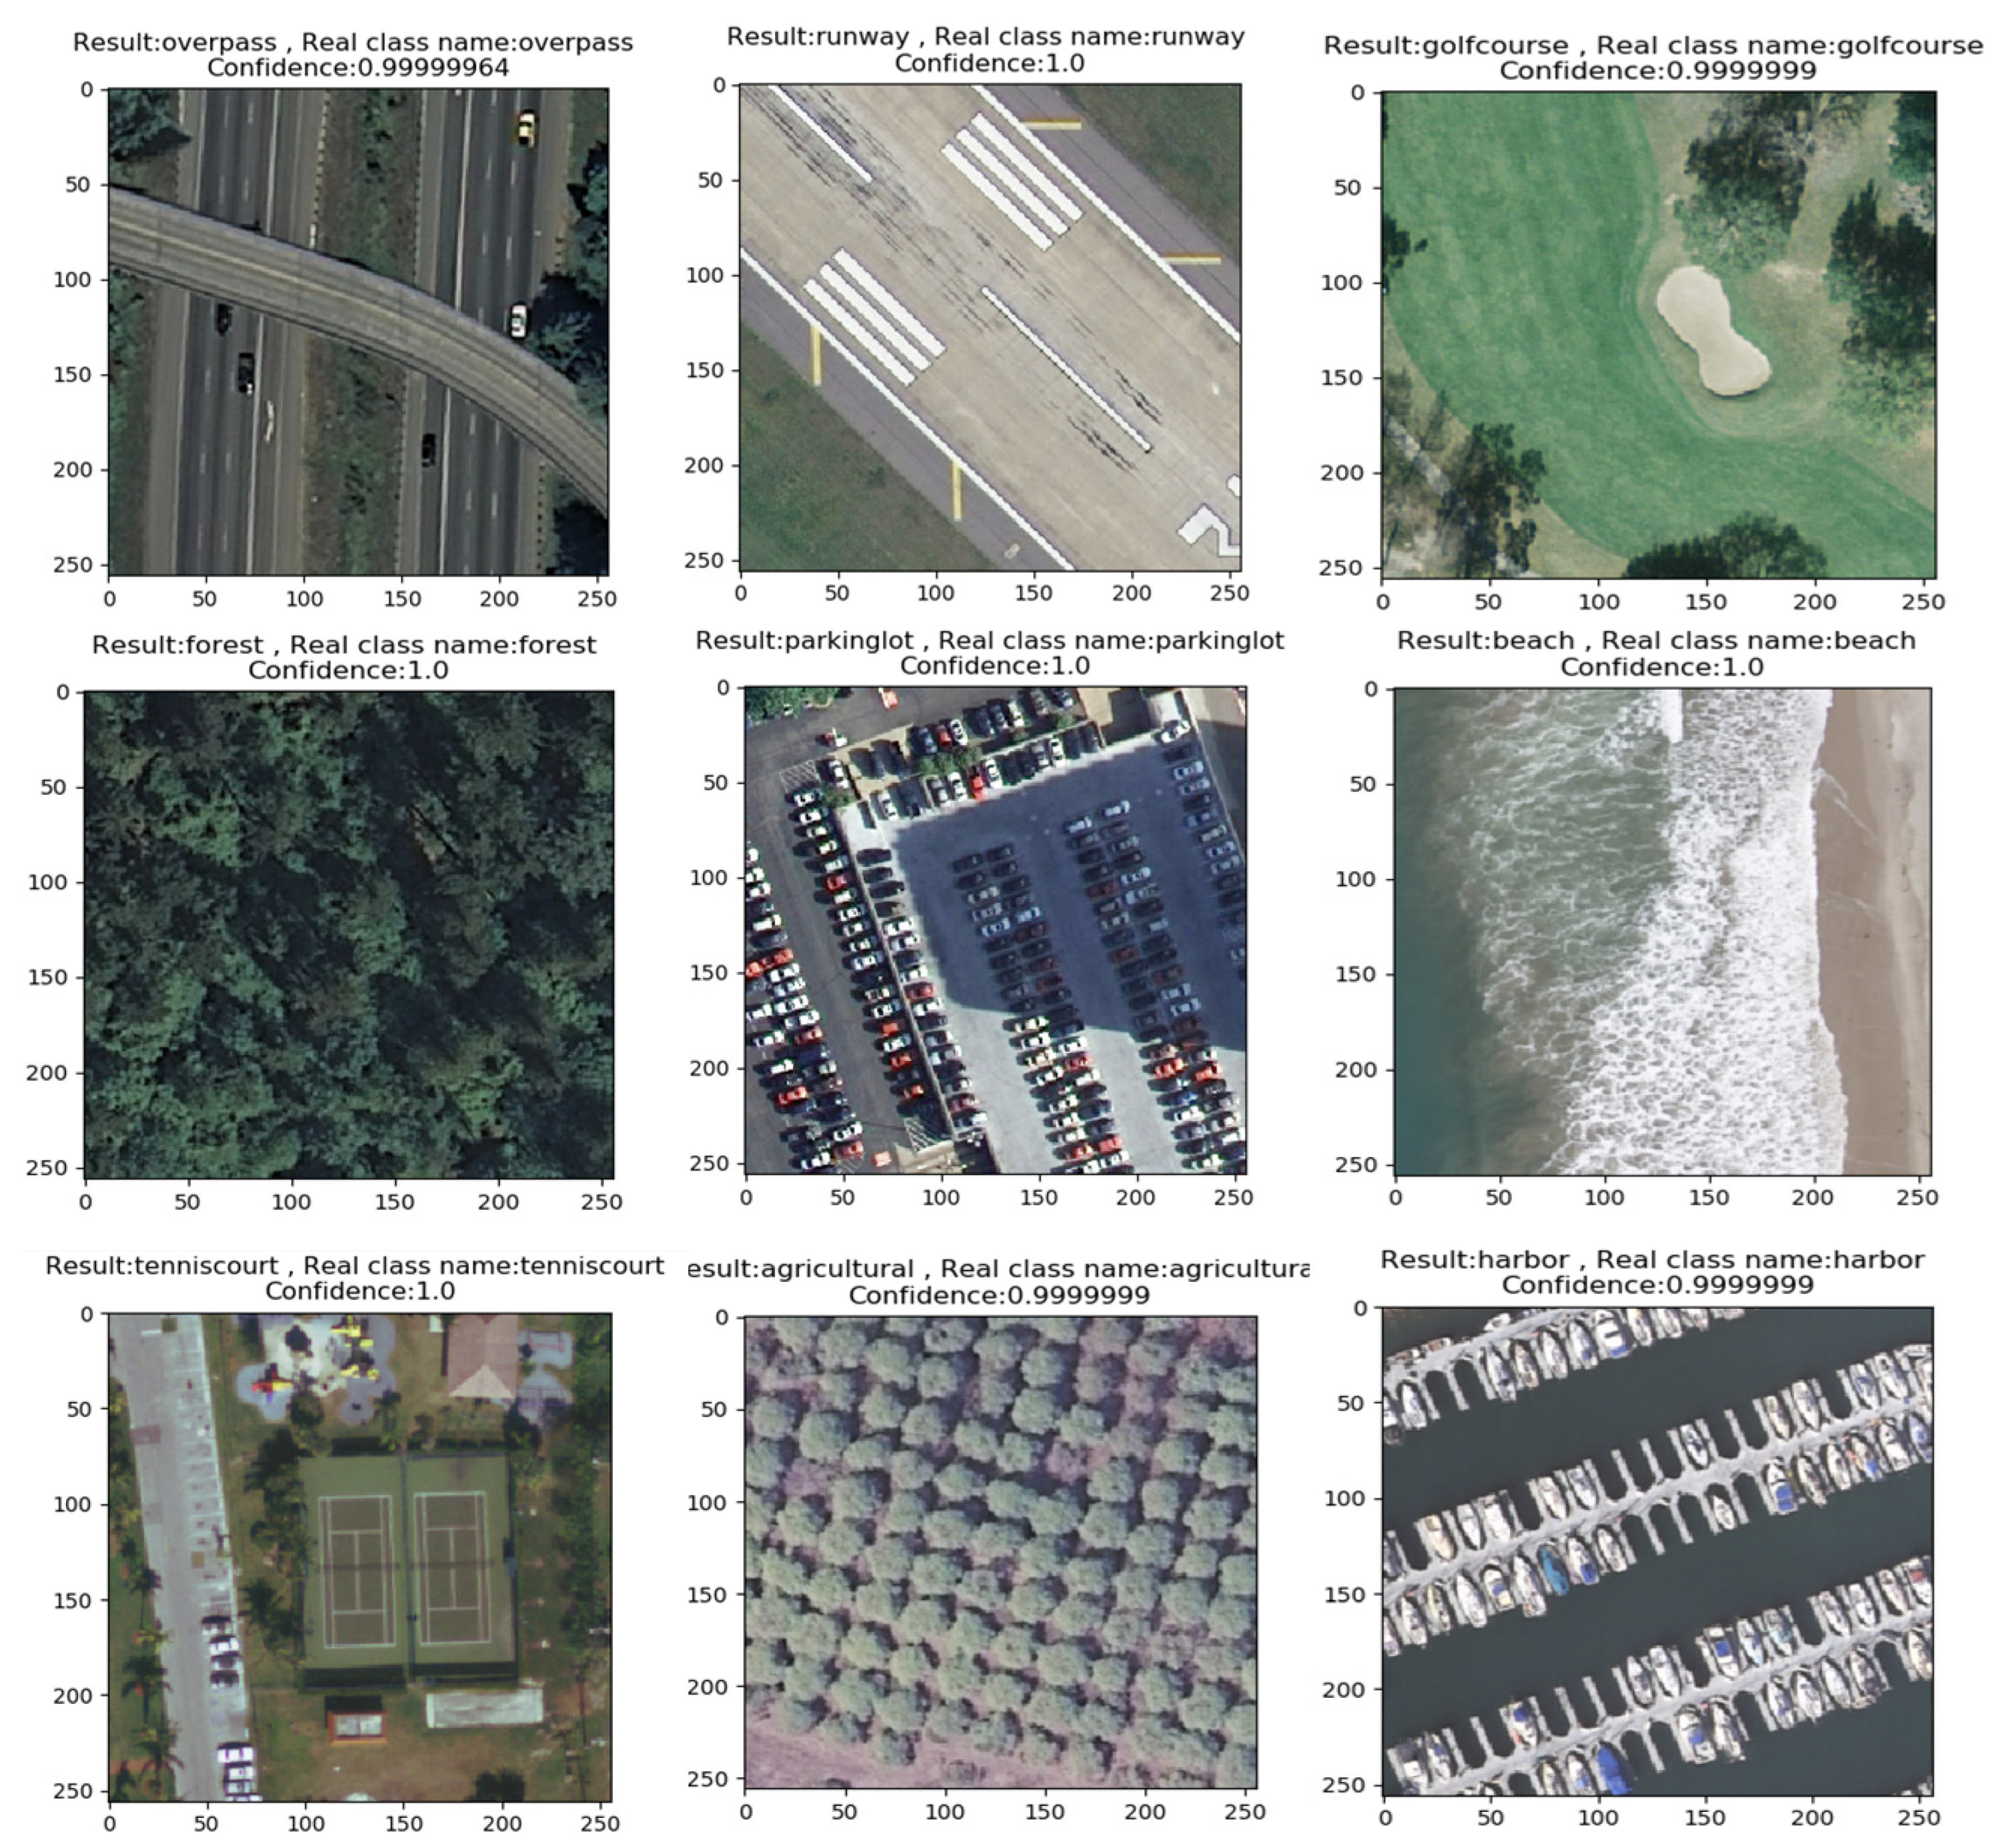
Figure 17.
Comparison of OA and kappa values between dimension-wise convolution and traditional convolution on UC dataset with training ratio of 80%.
Figure 17.
Comparison of OA and kappa values between dimension-wise convolution and traditional convolution on UC dataset with training ratio of 80%.
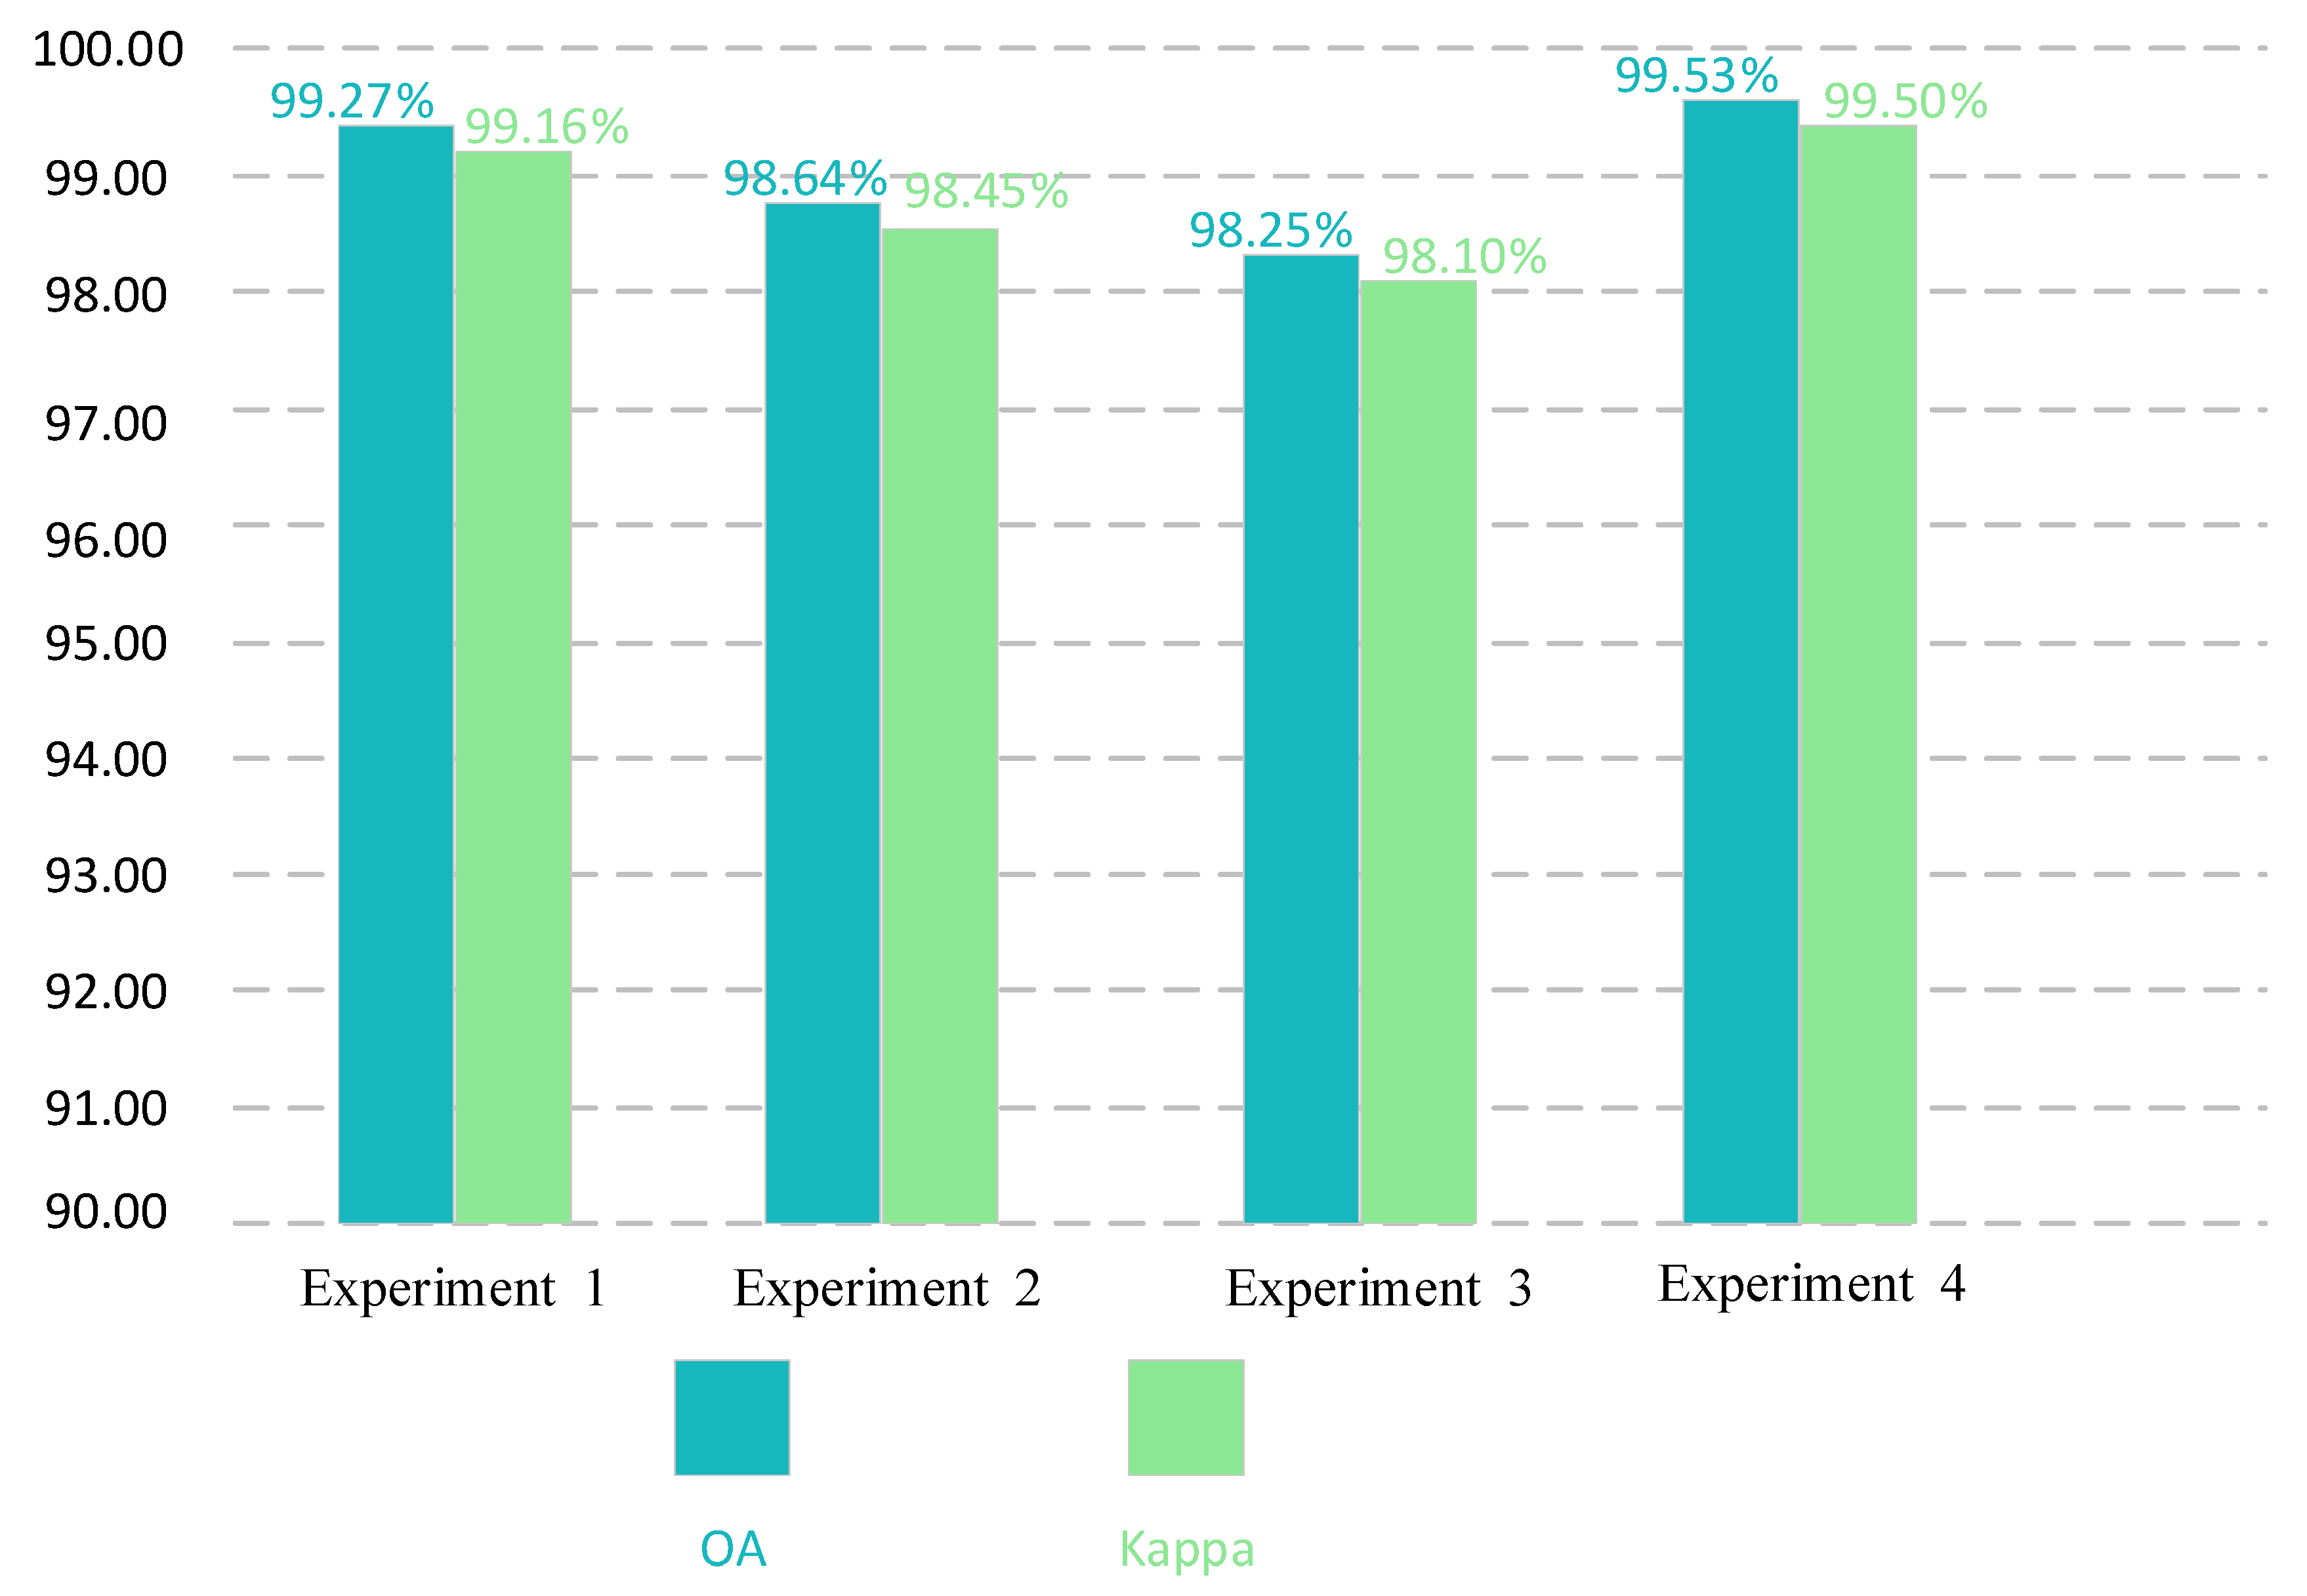
Figure 18.
Comparison of parameters and FLOPs values between dimension-wise convolution and traditional convolution on UC dataset with training ratio of 80%.
Figure 18.
Comparison of parameters and FLOPs values between dimension-wise convolution and traditional convolution on UC dataset with training ratio of 80%.
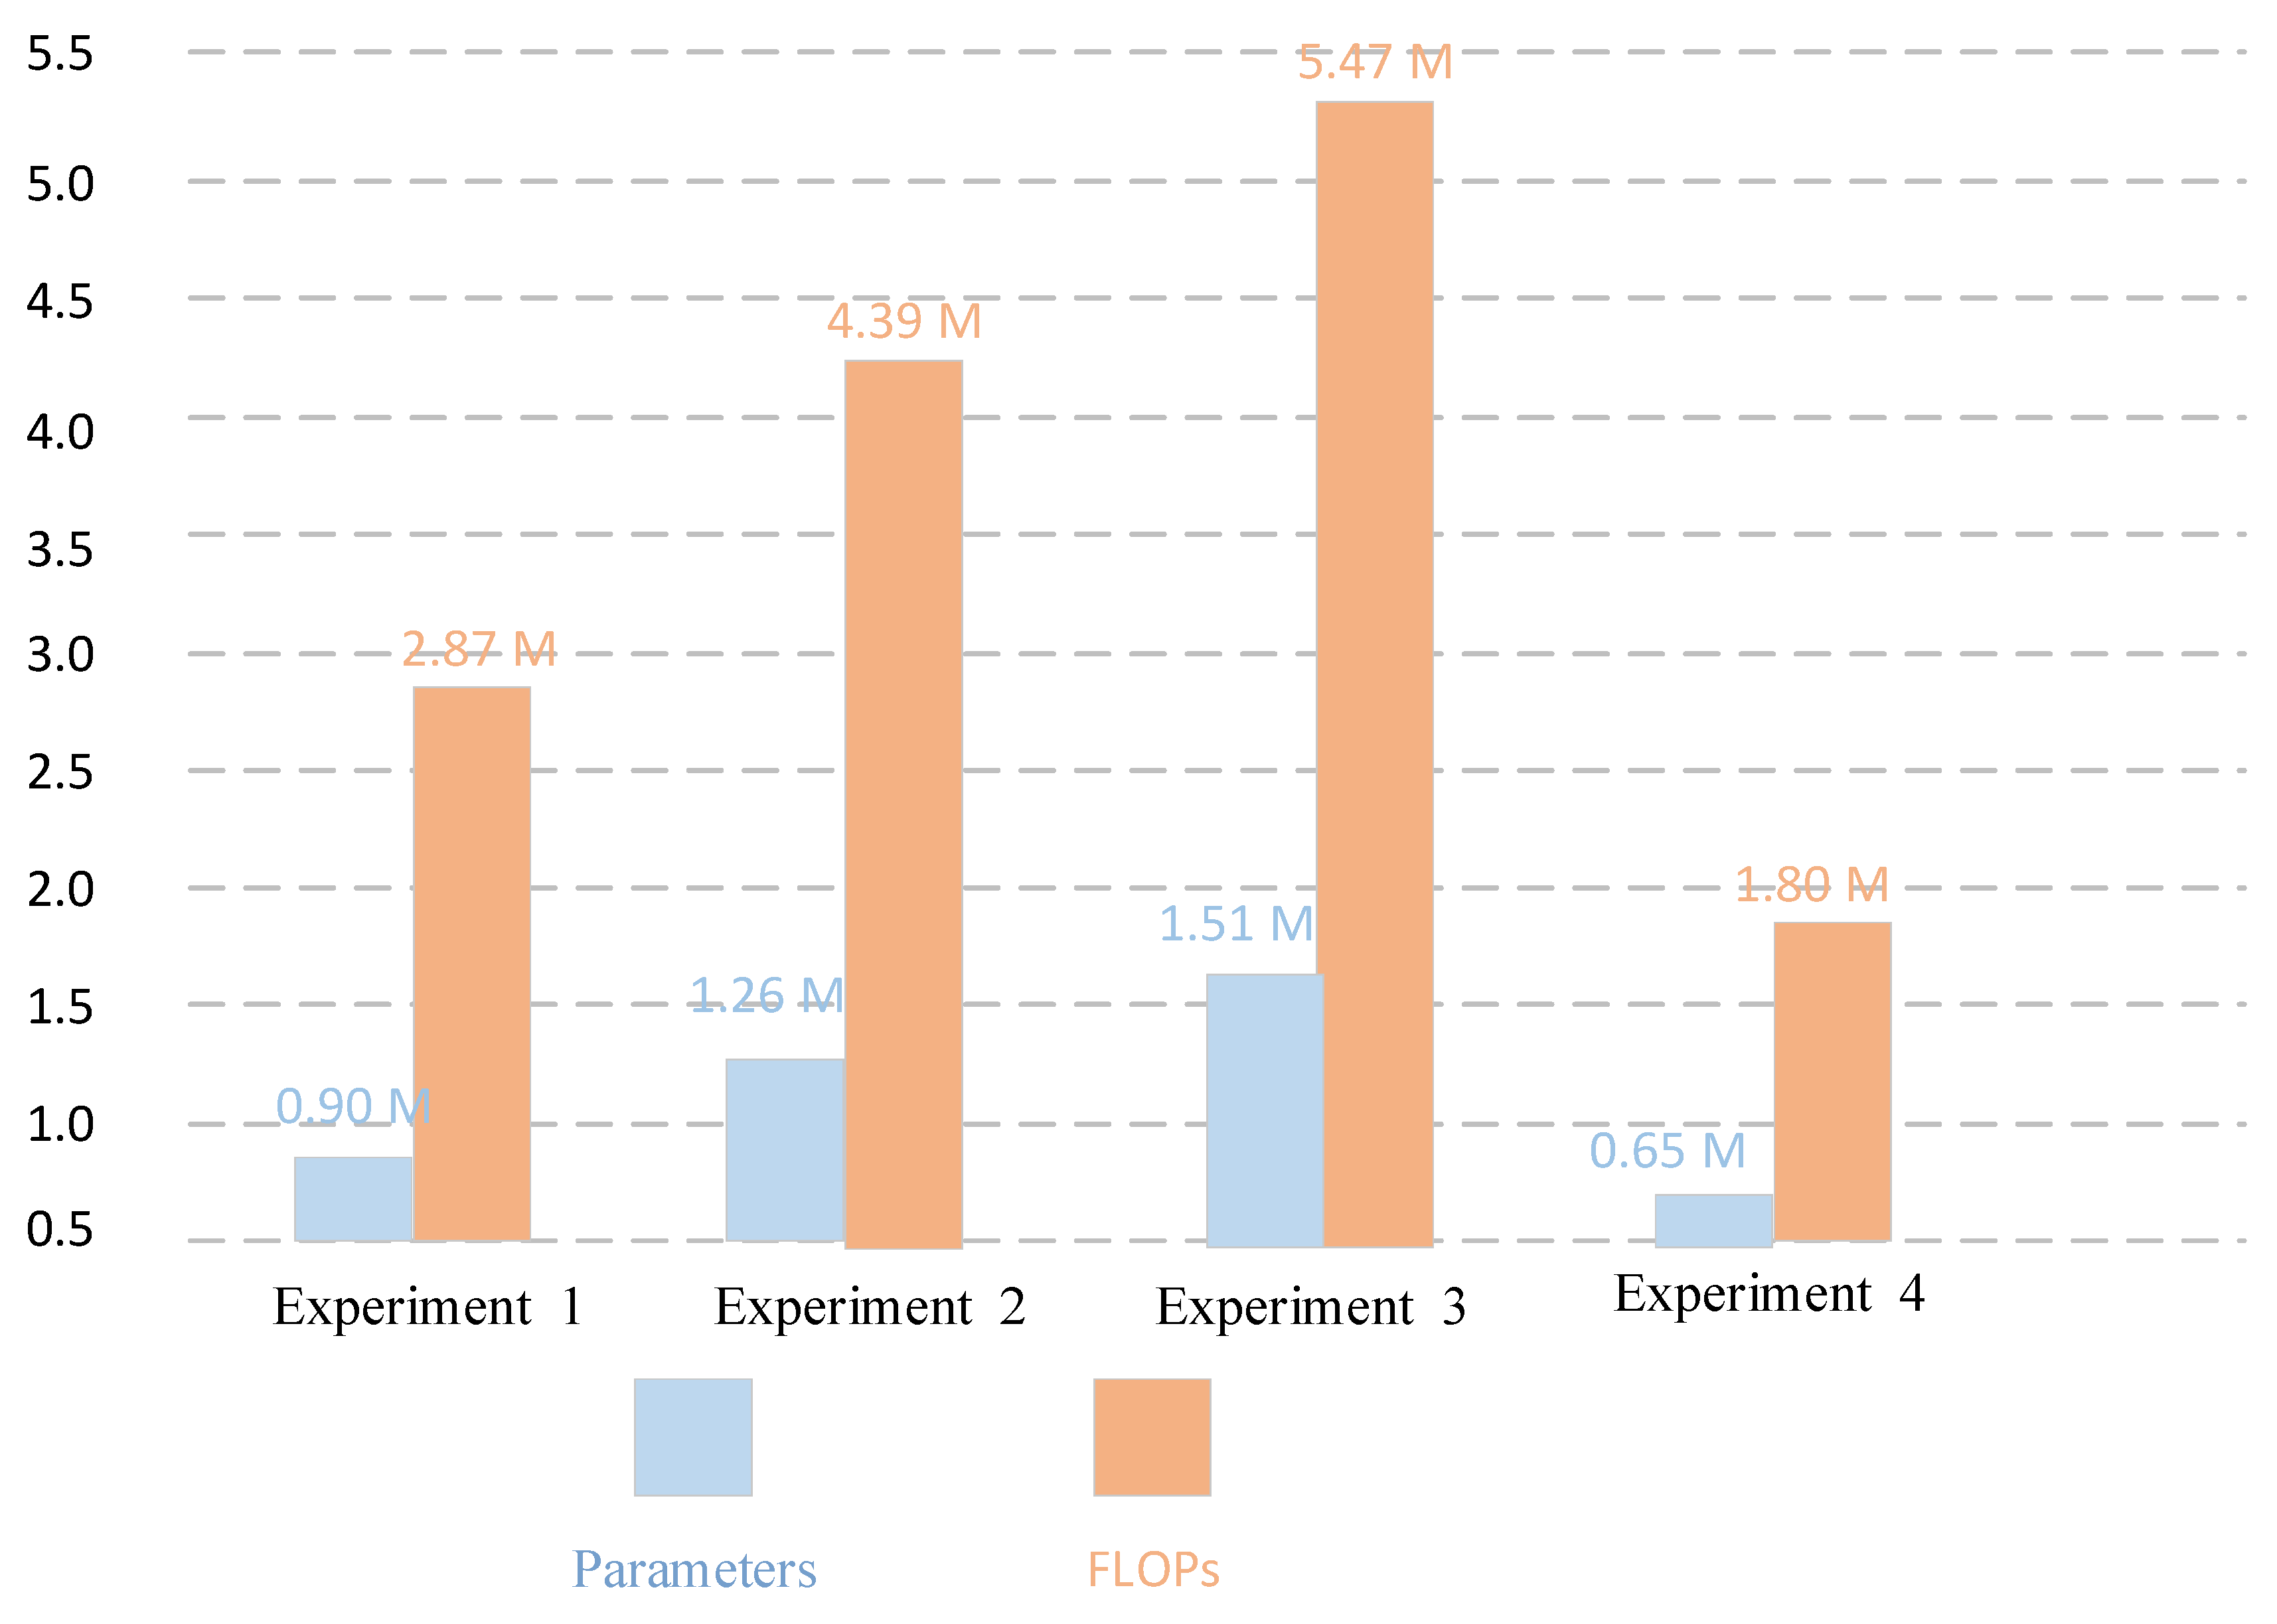
Figure 19.
Comparison of OA and kappa values between dimension-wise convolution and traditional convolution on RSSCN dataset with training ratio of 50%.
Figure 19.
Comparison of OA and kappa values between dimension-wise convolution and traditional convolution on RSSCN dataset with training ratio of 50%.
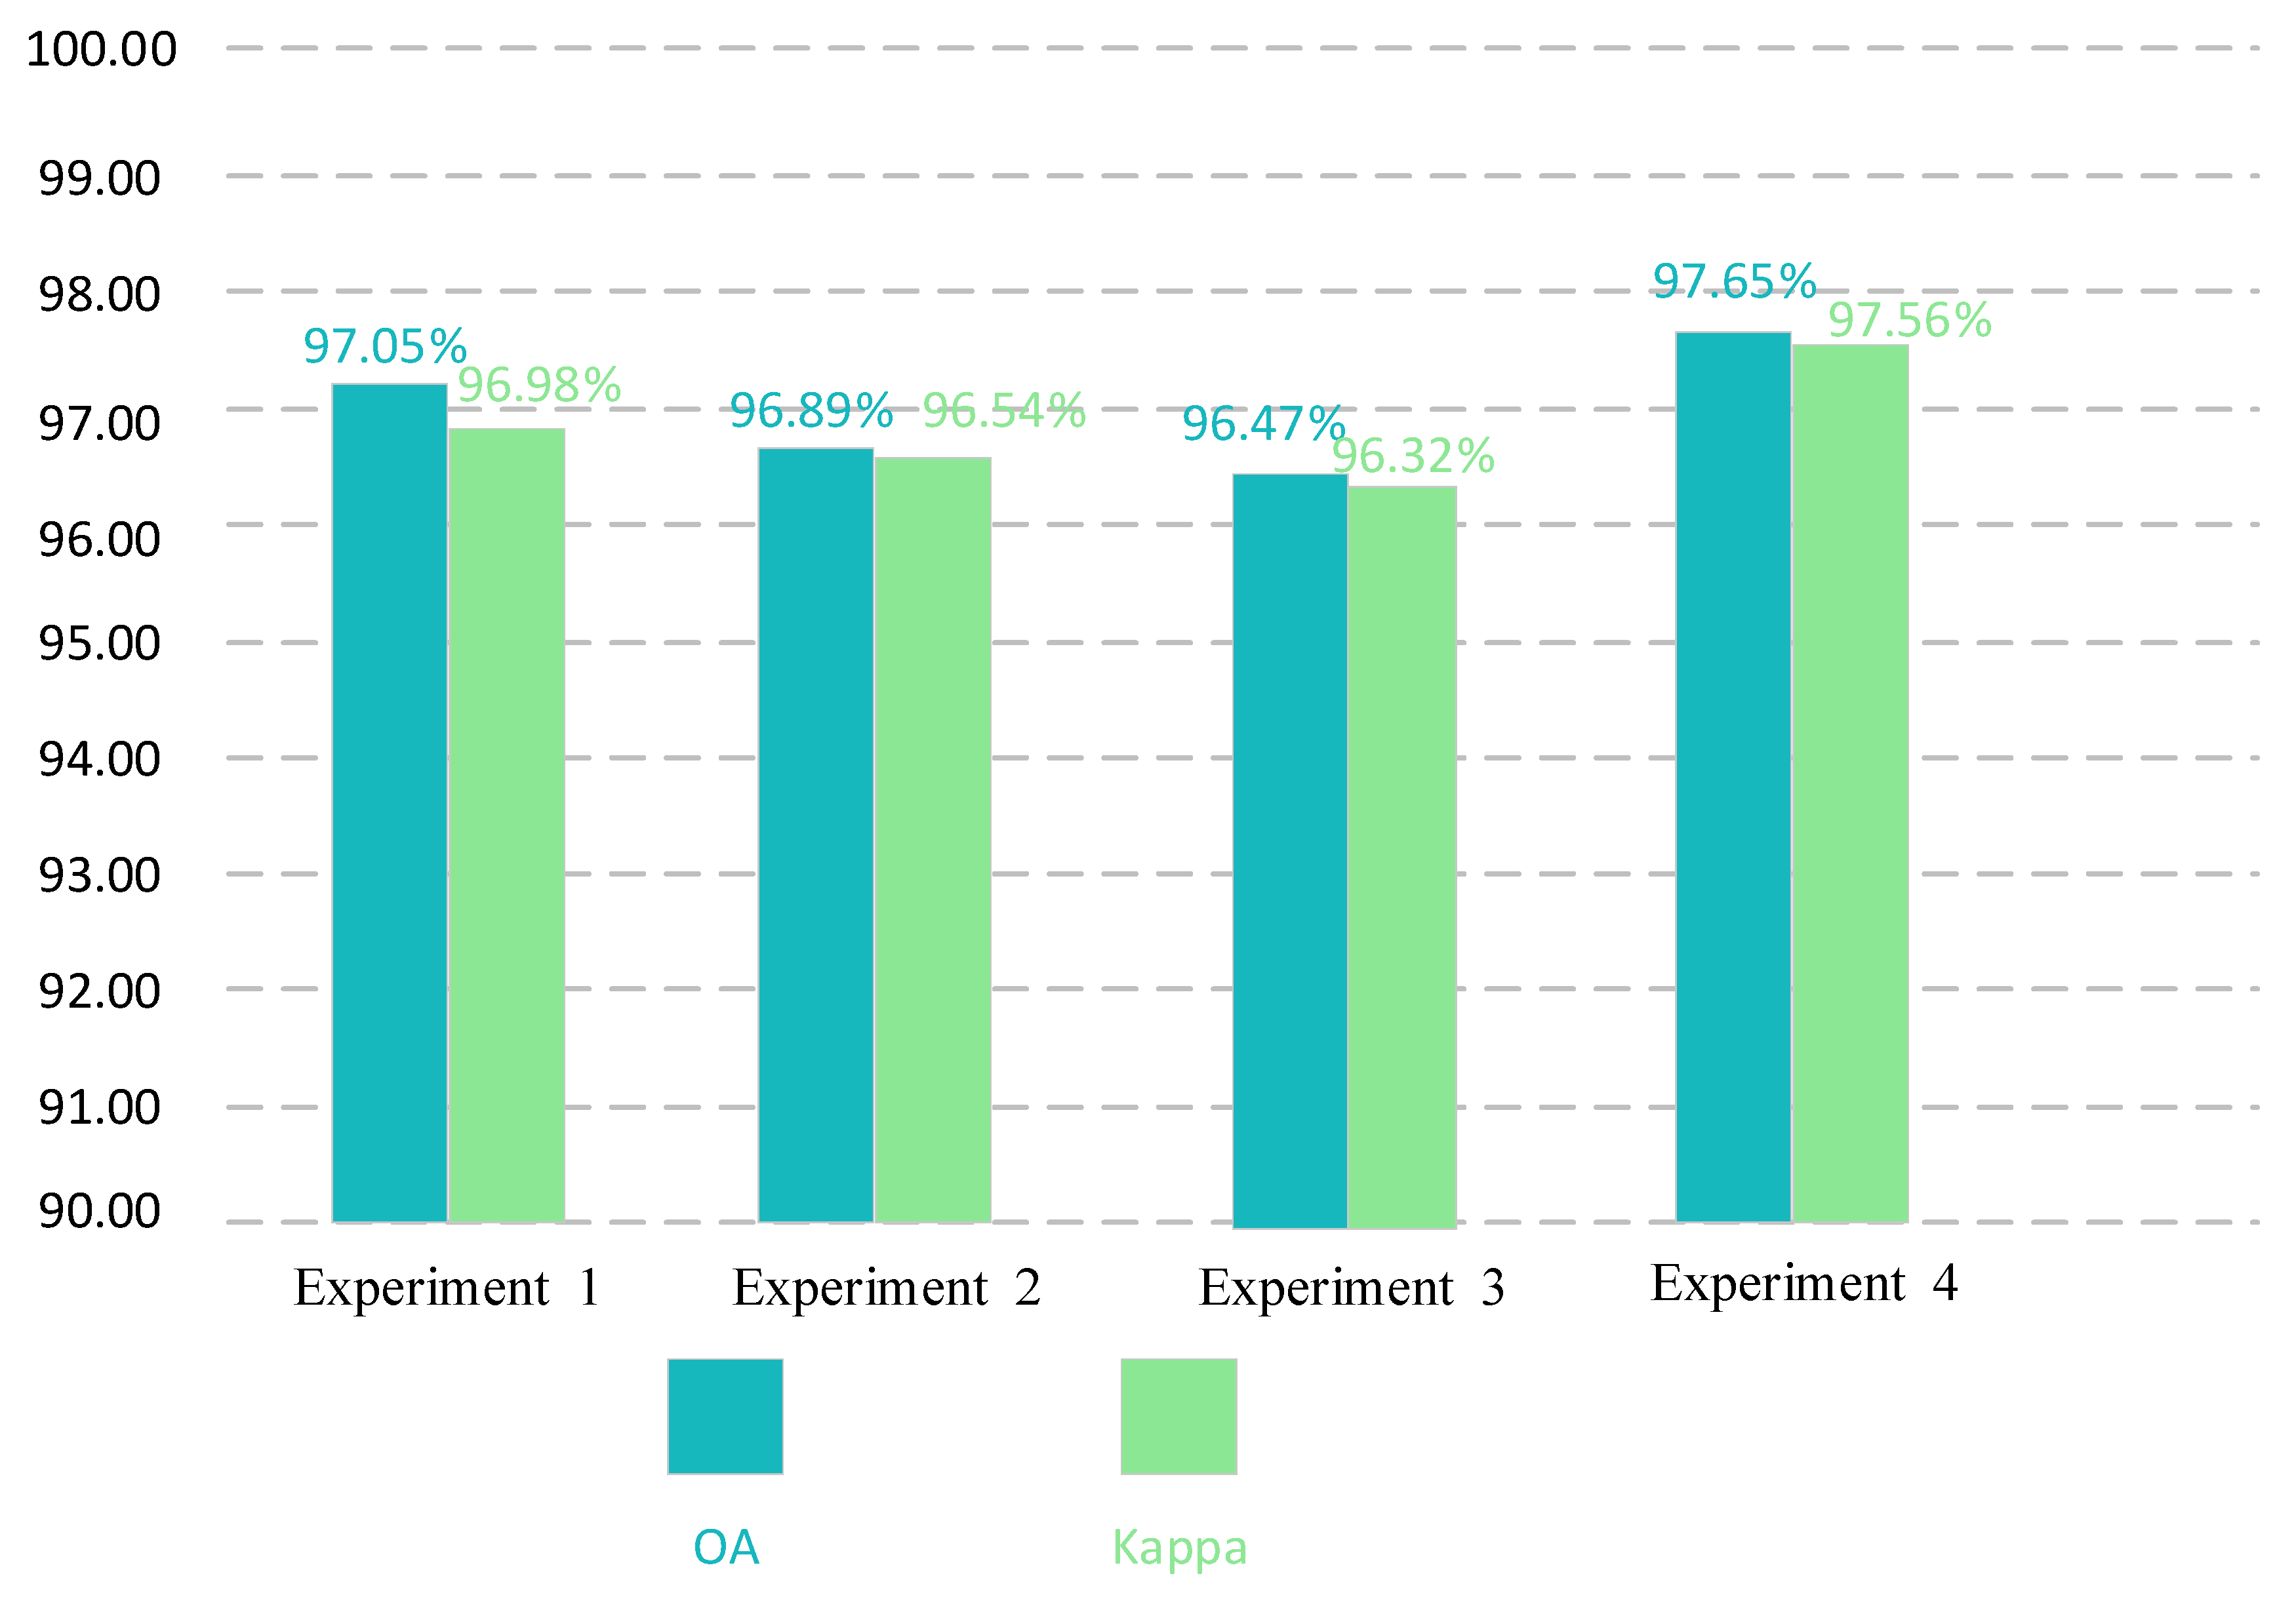
Figure 20.
Comparison of parameters and FLOPs values between dimension-wise convolution and traditional convolution on RSSCN dataset with training ratio of 50%.
Figure 20.
Comparison of parameters and FLOPs values between dimension-wise convolution and traditional convolution on RSSCN dataset with training ratio of 50%.


Table 1.
The OA, AA, F1 and Kappa results of the proposed LCNN-HWCF model on four datasets.
| Datasets | OA (%) | AA (%) | F1 (%) | Kappa (%) |
|---|---|---|---|---|
| UCM (80%) | 99.53 | 99.55 | 99.53 | 99.50 |
| RSSCN7 (50%) | 97.65 | 97.76 | 97.65 | 97.56 |
| AID (50%) | 97.43 | 97.35 | 97.16 | 97.05 |
| AID (20%) | 95.76 | 95.52 | 95.24 | 95.45 |
| NWPU (10%) | 93.10 | 93.12 | 92.98 | 93.02 |
| NWPU (20%) | 94.53 | 94.63 | 94.45 | 94.49 |
Table 2.
Comparison of OA and parameters between the proposed method and some advanced methods on the UCM dataset with 80% training ratio.
Table 2.
Comparison of OA and parameters between the proposed method and some advanced methods on the UCM dataset with 80% training ratio.
| Network Model | OA (%) | Number of Parameters |
|---|---|---|
| Variable-Weighted Multi-Fusion [36] | 97.79 | 32 M |
| ResNet+WSPM-CRC [37] | 97.95 | 23 M |
| ADFF [38] | 98.81 ± 0.51 | 23 M |
| LCNN-BFF [32] | 99.29 ± 0.24 | 6.2 M |
| VGG16 with MSCP [39] | 98.36 ± 0.58 | 15 M |
| Gated Bidirectiona+global feature [40] | 98.57 ± 0.48 | 138 M |
| Feature Aggregation CNN [41] | 98.81 ± 0.24 | 130 M |
| Skip-Connected CNN [42] | 98.04 ± 0.23 | 6 M |
| Discriminative CNN [43] | 98.93 ± 0.10 | 130 M |
| VGG16-DF [44] | 98.97 | 130 M |
| Scale-Free CNN [33] | 99.05 ± 0.27 | 130 M |
| Inceptionv3+CapsNet [34] | 99.05 ± 0.24 | 22 M |
| DDRL-AM [35] | 99.05 ± 0.08 | 30 M |
| Semi-Supervised Representation Learning [45] | 94.05 ± 0.96 | 210 M |
| Multiple Resolution BlockFeature [46] | 94.19 | 36 M |
| Siamese CNN [47] | 94.29 | 62 M |
| Siamese ResNet50 with R.D [48] | 94.76 | 20 M |
| Bidirectional Adaptive Feature Fusion [49] | 95.48 | 130 M |
| Multiscale CNN [50] | 96.66 ± 0.90 | 60 M |
| VGG_VD16 with SAFF [51] | 97.02 ± 0.78 | 15 M |
| Proposed | 99.53 ± 0.25 | 0.6 M |
Table 3.
Comparison of OA and parameters between the proposed method and some advanced methods on the RSSCN dataset with 50% training ratio.
Table 3.
Comparison of OA and parameters between the proposed method and some advanced methods on the RSSCN dataset with 50% training ratio.
| Network Model | OA (%) | Number of Parameters |
|---|---|---|
| VGG16+SVM Method [28] | 87.18 | 130 M |
| Variable-Weighted Multi-Fusion Method [36] | 89.1 | 32 M |
| TSDFF Method [14] | 92.37 ± 0.72 | 50 M |
| ResNet+SPM-CRC Method [37] | 93.86 | 23 M |
| ResNet+WSPM-CRC Method [37] | 93.9 | 23 M |
| LCNN-BFF Method [32] | 94.64 ± 0.21 | 6.2 M |
| ADFF [38] | 95.21 ± 0.50 | 23 M |
| Coutourlet CNN [52] | 95.54 ± 0.17 | 12.6 M |
| SE-MDPMNet [53] | 94.71 ± 0.15 | 5.17 M |
| Proposed | 97.65 ± 0.12 | 0.6 M |
Table 4.
Comparison of OA and parameters between the proposed method and some advanced methods on the AID dataset with 20% and 50% training ratio.
Table 4.
Comparison of OA and parameters between the proposed method and some advanced methods on the AID dataset with 20% and 50% training ratio.
| Network Model | OA (20/80%) | OA (50/50) | Number of Parameters |
|---|---|---|---|
| VGG16+CapsNet [34] | 91.63 ± 0.19 | 94.74 ± 0.17 | 130 M |
| VGG_VD16 with SAFF [51] | 90.25 ± 0.29 | 93.83 ± 0.28 | 15 M |
| Discriminative CNN [43] | 90.82 ± 0.16 | 96.89 ± 0.10 | 130 M |
| Fine-tuning [28] | 86.59 ± 0.29 | 89.64 ± 0.36 | 130 M |
| Skip-Connected CNN [42] | 91.10 ± 0.15 | 93.30 ± 0.13 | 6 M |
| LCNN-BFF [32] | 91.66 ± 0.48 | 94.64 ± 0.16 | 6.2 M |
| Gated Bidirectiona [40] | 90.16 ± 0.24 | 93.72 ± 0.34 | 18 M |
| Gated Bidirectiona+global feature [40] | 92.20 ± 0.23 | 95.48 ± 0.12 | 138 M |
| TSDFF [14] | 93.06 ± 0.20 | 91.8 | 50 M |
| AlexNet with MSCP [39] | 88.99 ± 0.38 | 92.36 ± 0.21 | 46.2 M |
| VGG16 with MSCP [39] | 91.52 ± 0.21 | 94.42 ± 0.17 | 15 M |
| ResNet50 [54] | 92.39 ± 0.15 | 94.69 ± 0.19 | 25.61 M |
| LCNN-GWHA [55] | 92.12 ± 0.35 | 95.63 ± 0.54 | 0.3 M |
| InceptionV3 [54] | 93.27 ± 0.17 | 95.07 ± 0.22 | 45.37 M |
| Proposed | 95.76 ± 0.16 | 97.43 ± 0.28 | 0.6 M |
Table 5.
Comparison of OA and parameters between the proposed method and some advanced methods on the AID dataset with 10% and 20% training ratio.
Table 5.
Comparison of OA and parameters between the proposed method and some advanced methods on the AID dataset with 10% and 20% training ratio.
| Network Model | OA (10/90) (%) | OA (20/80) (%) | Number of Parameters |
|---|---|---|---|
| Siamese ResNet50 with R.D [48] | 85.27 ± 0.31 | 91.03 | 20 M |
| AlexNet with MSCP [39] | 81.70 ± 0.23 | 85.58 ± 0.16 | 35 M |
| VGG16 with MSCP [39] | 85.33 ± 0.17 | 88.93 ± 0.14 | 60 M |
| VGG_VD16 with SAFF [51] | 84.38 ± 0.19 | 87.86 ± 0.14 | 15 M |
| Fine-tuning [28] | 87.15 ± 0.45 | 90.36 ± 0.18 | 130 M |
| Skip-Connected CNN [42] | 84.33 ± 0.19 | 87.30 ± 0.23 | 6 M |
| LCNN-BFF [32] | 86.53 ± 0.15 | 91.73 ± 0.17 | 6.2 M |
| VGG16+CapsNet [34] | 85.05 ± 0.13 | 89.18 ± 0.14 | 130 M |
| Discriminative with AlexNet [43] | 85.56 ± 0.20 | 87.24 ± 0.12 | 130 M |
| ResNet50 [54] | 86.23 ± 0.41 | 88.93 ± 0.12 | 25.61 M |
| InceptionV3 [54] | 85.46 ± 0.33 | 87.75 ± 0.43 | 45.37 M |
| Contourlet CNN [52] | 85.93 ± 0.51 | 89.57 ± 0.45 | 12.6 M |
| LiG with RBF kernel [56] | 90.23 ± 0.13 | 93.25 ± 0.12 | 2.07 M |
| Proposed | 93.10 ± 0.12 | 94.53 ± 0.25 | 0.6 M |
Table 6.
Comparison of OA, parameters and FLOPs between the proposed method and some advanced methods on the AID dataset with 50% training ratio.
Table 6.
Comparison of OA, parameters and FLOPs between the proposed method and some advanced methods on the AID dataset with 50% training ratio.
| Network Model | OA (%) | Number of Parameters | FLOPS |
|---|---|---|---|
| CaffeNet [51] | 89.53 | 60.97 M | 715 M |
| VGG-VD-16 [51] | 89.64 | 138.36 M | 15.5 G |
| GoogLeNet [51] | 86.39 | 7 M | 1.5 G |
| MobileNetV2 [53] | 95.96 | 3.5 M | 334 M |
| SE-MDPMNet [53] | 97.14 | 5.17 M | 3.27 G |
| LCNN-BFF [32] | 94.64 | 6.2 M | 2.4 G |
| Proposed | 97.43 | 0.6 M | 1.7 M |
Publisher’s Note: MDPI stays neutral with regard to jurisdictional claims in published maps and institutional affiliations. |
© 2022 by the authors. Licensee MDPI, Basel, Switzerland. This article is an open access article distributed under the terms and conditions of the Creative Commons Attribution (CC BY) license (https://creativecommons.org/licenses/by/4.0/).
Share and Cite
MDPI and ACS Style
Shi, C.; Zhang, X.; Wang, T.; Wang, L. A Lightweight Convolutional Neural Network Based on Hierarchical-Wise Convolution Fusion for Remote-Sensing Scene Image Classification. Remote Sens. 2022, 14, 3184. https://doi.org/10.3390/rs14133184
AMA Style
Shi C, Zhang X, Wang T, Wang L. A Lightweight Convolutional Neural Network Based on Hierarchical-Wise Convolution Fusion for Remote-Sensing Scene Image Classification. Remote Sensing. 2022; 14(13):3184. https://doi.org/10.3390/rs14133184
Chicago/Turabian StyleShi, Cuiping, Xinlei Zhang, Tianyi Wang, and Liguo Wang. 2022. "A Lightweight Convolutional Neural Network Based on Hierarchical-Wise Convolution Fusion for Remote-Sensing Scene Image Classification" Remote Sensing 14, no. 13: 3184. https://doi.org/10.3390/rs14133184
Note that from the first issue of 2016, this journal uses article numbers instead of page numbers. See further details here.