Article

A Dual Multi-Head Contextual Attention Network for Hyperspectral Image Classification

1
School of Information Engineering, Jiangxi University of Science and Technology, Ganzhou 341000, China
2
School of Telecommunication and Information Engineering, Xi’an University of Posts and Telecommunications, Xi’an 710121, China
3
Key Laboratory of Intelligent Perception and Image Understanding of Ministry of Education, School of Artificial Intelligence, Xidian University, Xi’an 710071, China
*
Author to whom correspondence should be addressed.
Remote Sens. 2022, 14(13), 3091; https://doi.org/10.3390/rs14133091
Submission received: 5 May 2022 / Revised: 22 June 2022 / Accepted: 24 June 2022 / Published: 27 June 2022
(This article belongs to the Special Issue Recent Advances in Hyperspectral Image Processing)

Abstract

:
To learn discriminative features, hyperspectral image (HSI), containing 3-D cube data, is a preferable means of capturing multi-head self-attention from both spatial and spectral domains if the burden in model optimization and computation is low. In this paper, we design a dual multi-head contextual self-attention (DMuCA) network for HSI classification with the fewest possible parameters and lower computation costs. To effectively capture rich contextual dependencies from both domains, we decouple the spatial and spectral contextual attention into two sub-blocks, SaMCA and SeMCA, where depth-wise convolution is employed to contextualize the input keys in the pure dimension. Thereafter, multi-head local attentions are implemented as group processing when the keys are alternately concatenated with the queries. In particular, in the SeMCA block, we group the spatial pixels by evenly sampling and create multi-head channel attention on each sampling set, to reduce the number of the training parameters and avoid the storage increase. In addition, the static contextual keys are fused with the dynamic attentional features in each block to strengthen the capacity of the model in data representation. Finally, the decoupled sub-blocks are weighted and summed together for 3-D attention perception of HSI. The DMuCA module is then plugged into a ResNet to perform HSI classification. Extensive experiments demonstrate that our proposed DMuCA achieves excellent results over several state-of-the-art attention mechanisms with the same backbone.

1. Introduction

Hyperspectral images (HSI) contain rich spectral information and spatial context, where the electromagnetic spectrum is approximately contiguous and covers the ultraviolet, visible, near-infrared, and even mid-to-long infrared regions. The abundant spectral-spatial information provides great opportunities for the fine identification of materials with subtle spectral discrepancies, and at the same time brings new challenges in discriminant feature learning, especially in mining the potential correlation of data with the high-dimensional nonlinear distribution.
Compared with the limitations of the shallow and handcrafted extractors in complex data representation, deep neural networks (DNNs) have proven to be more powerful in feature learning with their excellent power in layer-wise feedforward perception, and have become prevailing benchmarks in HSI classification tasks [1,2,3], including multilayer perceptron (MLP) [4], stacked autoencoders (SAEs) [5], deep belief networks (DBNs) [6], recurrent neural networks (RNNs) [7,8,9], convolutional neural networks (CNNs) [10,11,12], graph convolutional networks (GCNs) [13], generative adversarial networks (GANs) [14], and their variants. CNN has become populat popular due to its advantage in locally contextual perception and feature transformation with parameter sharing. To strengthen the contribution of the spectrum as spatial information dose in CNNs, multi-branch networks, 3-D-CNNs, and other more complex models are introduced to extract spectral-spatial features. Although they improve the model ability in feature representation, new issues will also arise, such as huge computing burdens, especially difficulty in model optimization. Thus, many lightweight deep models [15,16,17] were proposed for HSI classification. Meanwhile, shortcut connections [18] become an almost indispensable component to avoid model degradation.
CNN shares convolution kernels among different locations in each feature map and collects diverse information encoded in all of the channels. Although the kernel sharing and feature recombination enable CNN with great performance in translation equivalence and high-level feature learning, it passively focus attention on important regions, whether in spatial or in channel dimension, while this is just exactly common in human vision. Thus, the attention mechanism has raised much concern in remote sensing (RS) fields. This can be treated as a dynamic selection of features by adaptively weighting, while CNN is a static method. To focus more on significant channels for object recognition, a squeeze-and-excitation (SE) block in the SE network (SENet) [19] calibrates the channel weights by spatial squeeze and channel excitation. Subsequently, many of its variations were presented for feature learning of HSI. For example, Zhao et al. [20] replaced the excitation part with feature capture by two 1D convolution layers and aggregation by shortcut connections, namely CBW. Wang et al. [21] performed SE on spatial and spectral dimension in parallel (namely, SSSRN), then recalibrated features by weighted summation of the two attention matrices. Convolutional block attention module (CBAM) [22] refines the feature maps by two sub-modules, which squeeze respectively the spatial and channel information by global average pooling (GAP) and max pooling, and excites channel attention via a shared MLP and spatial attention by 2-D convolution. CBAM was then embedded into diverse deep networks for attention recalibration, such as double-branch 3-D convolution network (DBMA) [23].
CNN specializes in local perception and enlarges the receptive field by a deep stack of the convolutional layers, which is relatively weak and inefficient in long-range interaction. Transformers with self-attention, which has emerged as the dominant paradigm in natural language processing (NLP) [24], are thus designed to model long-range dependencies in computer vision fields [25,26]. For example, ViT [27] and BEiT [28] treat splitting patches in an image as words in one sentence, and perform non-local operations such as self-attention in a transformer [24]. In feature learning of HSI, spatial pixels or spectral bands are usually regarded as tokens of words for long-range attention perception. For example, He et al. [29] treated pixels in one input patch as tokens, and employed BRET [30] (namely HSI-BRET) to learn the global relationships between pixel sequences by multiple Transformer layers. Sun et al. [31] insert the spatial self-attention mechanism into a deep model with sequential spectral and spatial sub-modules (SSAN). To capture subtle discrepancies of the spectrum with sequence attributes, He et al. [32] performed spectral feature embedding by a pre-trained deep CNN. It regarded one spectral band as a word, and modeled sequential spectra relationships by a modified dense transformer. Hong et al. [33] instead applied band-wise self-attention with group-wise spectral embedding and proposed a SpectralFormer model. To capture semantic dependencies in both spatial and channel dimensions, dual attention network (DANet) [26] sets, two corresponding self-attention sub-modules were used, and the outputs were combined to perform 3-D attention perception and feature calibration. This 3-D attention is appropriate to spectral-spatial feature learning of HSI. Thus, Tang et al. [34] inserted a DANet like-wise attention block into a 3-D octave convolution network. Li et al. [35] embedded the sub-modules of DANet respectively into a double-branch 3-D dense convolutional network (DBDA).
HSI contains a wealth of information in both the spatial and spectral dimension; thus, data representation will prefer 3-D attention from multiple perspectives. However, the difficulty faced by 3-D multi-head attention is the increased burden in parameter optimization, computation, and storage. As a result, the existing self-attention-based methods in HSI classification mainly insert a one-head spectral-spatial attention into a 3-D deep model. Self-attention can be seen as non-local filter [25] that captures long-range dependencies by weighted aggregation of features at all positions, while Hu et al. [36] verified that constraining the aggregation scope to a local neighborhood will be more reasonable for feature learning in visual recognition with less computation. Thus, in this paper, we focus on building a 3-D multi-head attention with local interaction and with the fewer possible parameters and lower computation cost. Beyond that, previous designs mainly capture attention by independent pairwise query-key interaction but ignore the contextual information among neighbor keys. Li et al. [37] proposed a contextual transformer (CoT) that contextually encoded input keys and concatenated them with queries to learn dynamic attention, which is much more efficient at boosting visual representation. On this basis, we present a dual multi-head contextual attention mechanism (DMuCA) for multi-view spectral-spatial neighborhood perception.
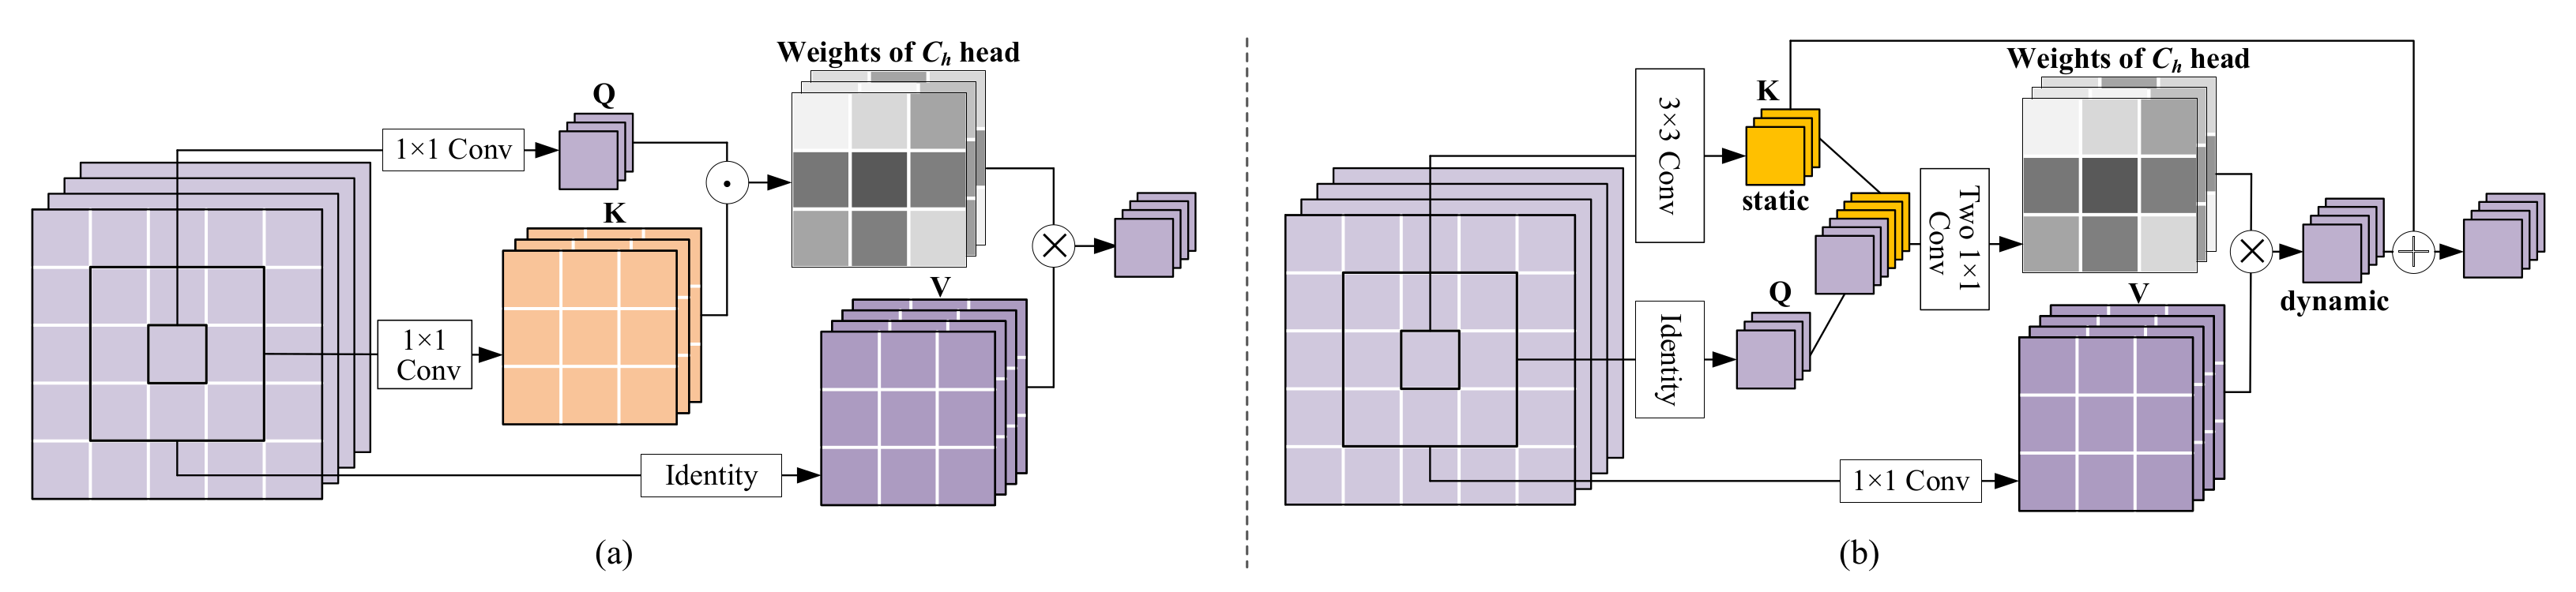
DMuCA decouples the spatial and spectral contextual attention into two sub-modules and builds multi-head attention on groups to control model complexity. In the spatial attention module (SaMCA), we treat pixels in the input as tokens and employ depth-wise convolution to contextualize the input keys in the pure spatial domain. Then, the keys are alternately concatenated with the queries and grouped to learn multiple neighborhood relationships. The learned multi-head local attention matrices are then broadcast across group channels to aggregate the neighborhood inputs. CoT [37] can be seen as a special case of SaMCA when the number of groups is equal to 1. As for spectral attention (SeMCA), which treats each channel as a token, the feature representation of one channel involves a bidirectional dimension. Consequently, the parameters and computation for multi-head attention matrices will increase exponentially, especially when it is exposed to inputs with enlarged spatial resolution. With the neighborhood consistency assumption, we therefore group the spatial pixels by equal-interval sampling and create multi-head attention on each neighbor block, to reduce the number of the parameter and avoid the computation burden. The main contributions of this paper are summarized as follows.
  • By decoupling 3-D self-attention perception into two sub-modules, SaMCA and SeMCA, we build a dual contextual self-attention mechanism, DMuCA, for dynamic spatial and spectral attention calibration.
  • To avoid parameter and computation increase, we group the representation of each token by evenly sampling, and capture multi-head self-attention with an alternate concatenation of the queries and keys on each group.
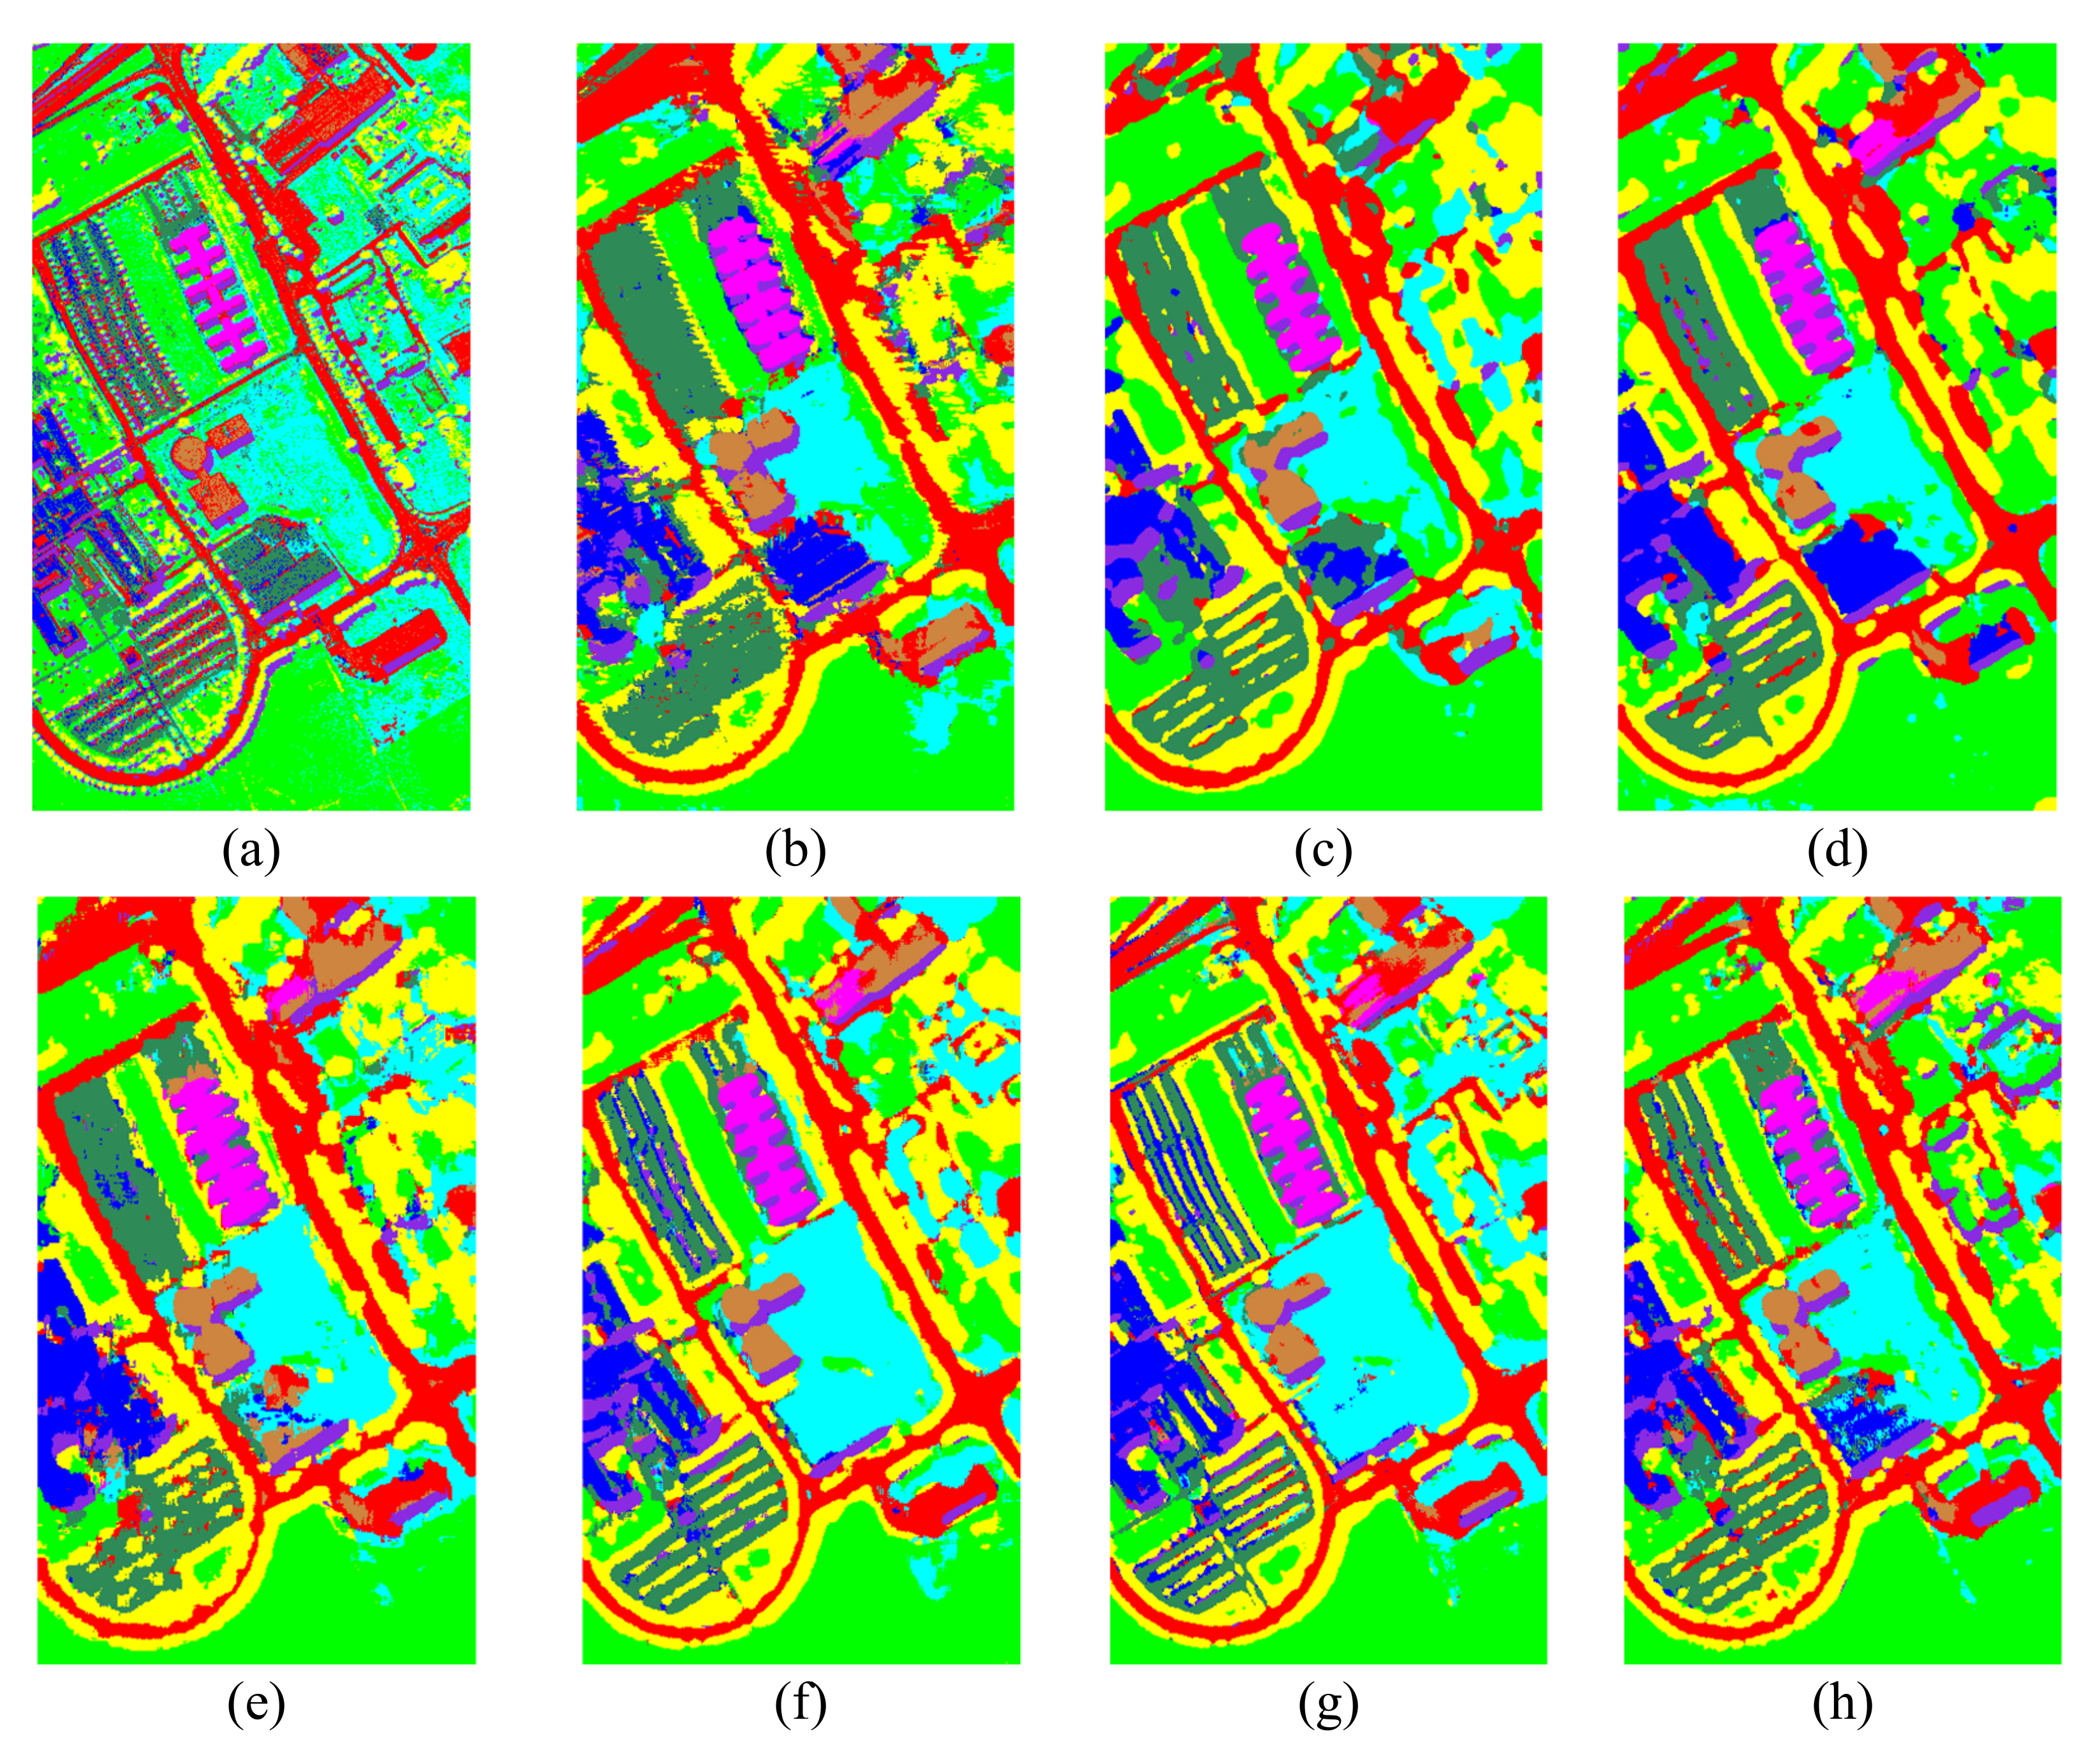
  • Extensive experiments on three public HSIs demonstrate that our proposed DMuCA achieves excellent results over several state-of-the-art attention mechanisms with the same backbone.
The remainder of the paper is organized as follows. Section 2 reviews the general form of self-attention mechanisms. Section 3 details the proposed DMuCA with two well-designed sub-modules SaMCA and SeMCA for HSI classification. Extensive contrast and ablation experiments are conducted and discussed in Section 4. Section 5 draws conclusions and presents a brief outlook on future work.

2. Preliminaries

Humans can focus rapidly on regions of interest to perceive an image [38]. The attention mechanism simulates human vision and guides the system to ignore irrelevant content and focus on the important regions. In this section, we will review the general architecture of attention mechanisms and their multi-head patterns.

2.1. Attention Mechanism

The attentional mechanism contains two main aspects: determine the important parts of the input and allocate limited data processing resources to the regions [38]. Given an input X , this process can be formulated as,
Z = f g X , X ,
where g X generates attention weights which are generally measured by neighborhood relationships. The resulting weights are then allocated to X by function f g X , X . Z is the output of the attention layer. For the local self-attention [36], a transformation layer first maps input X to Query ( Q ), Key ( K ), and Value ( V ). The self-attention weights are then calculated by dot-product between the Q and K ,
g X = Softmax Q K T d k ,
where a scaling factor d k and softmax operation are employed to normalize the weights. Finally, the attention weights are assigned to the corresponding elements of the value to yield the output.
The above method captures self-attention through pairwise query-key interaction in isolation, ignoring neighborhood keys’ rich contextual information. CoT [37] contextualizes the keys by performing local convolution and concatenates them with queries to learn attention weights (see Figure 1b), which can be defined as,
g X = Conv σ Conv Q , K , W 1 , W 2 ,
where σ is a activation function (eg., ReLU). The keys here are obtained by a 2-D convolution and the query-key interaction is achieved through two consecutive 1 × 1 convolutions. The output of the attention layer is then given by
Z = g X V ,
where ⊗ denotes local matrix multiplication.

2.2. Multi-Head Self-Attention

A single self-attention is coarse in mining complex relationships among neighbors in visual data. The multi-head self-attention mechanism (MHSA) [24] produces attention blocks from multiple feature subspaces to enrich the relationships. Each i-th subspace owns its Q i , K i , and V i projected by the corresponding learnable parameters W q i , W k i , and W v i . The obtained attention matrices are then concatenated together to aggregate the neighborhood elements in a weighted manner. For the local multi-head self-attention [36], depth-wise local dependency measurement and group weight sharing are used to perform multi-head attention with relatively fewer parameters and FLOPs (see Figure 1a). The process can be written as,
Q = Conv Q X , K = Conv K X , V = Identity X ,
where one channel in Q and K are exploited for generating one head of attention. All of the C h aggregation weights for X i j with k × k scope can be performed as below, if dot-product is used here for composability measurement,
g X i j = DepthConv K k N x i j , Q i j ,
where N x i j denotes the k × k neighbors of the spatial pixel x i j . The kernel of depth-wise convolution here comes from Q i j , and g X i j R k × k × C h . Finally, the C h multi-head attention weights that shared by C / C h channels are allocated to the neighbors of X i j for information aggregation. To enhance the contextual representation of keys, CoT generates multi-head attention weights by two consecutive 1 × 1 convolution layers, which can be written as,
g X i j = Conv σ Conv Q i j , K i j , W 1 , W 2 .
Figure 1b shows the reshaped multi-head attention weights g X i j of x i j that is in size of k × k × C h .
Self-attention performs feature filtering and aggregation with dynamic kernels generated by neighborhood interactions. Cordonnier et al. [39] empirically confirms that the attention layer with enough heads can express any convolutional layer as a special case. HSI recodes spatial samples as a spectral sequence with extremely high resolution, which is significantly superior at identifying ground objects with a subtle distinction or variation. Meanwhile, however, data structures become complex as the information increases. For feature learning of HSI as a 3-D cube data, it is preferable to capture multi-head self-attention from both spatial and spectral domains with contextual key interaction, if there is not much increase in the number of parameters and computation cost. Encoding spectral and spatial neighbors in a dynamic and decoupling fashion can be practical and effective at perceiving regions of interest and extracting discriminative features. Accordingly, we propose a dual multi-head contextual self-attention network (DMuCA) for HSI classification.

3. Proposed Method

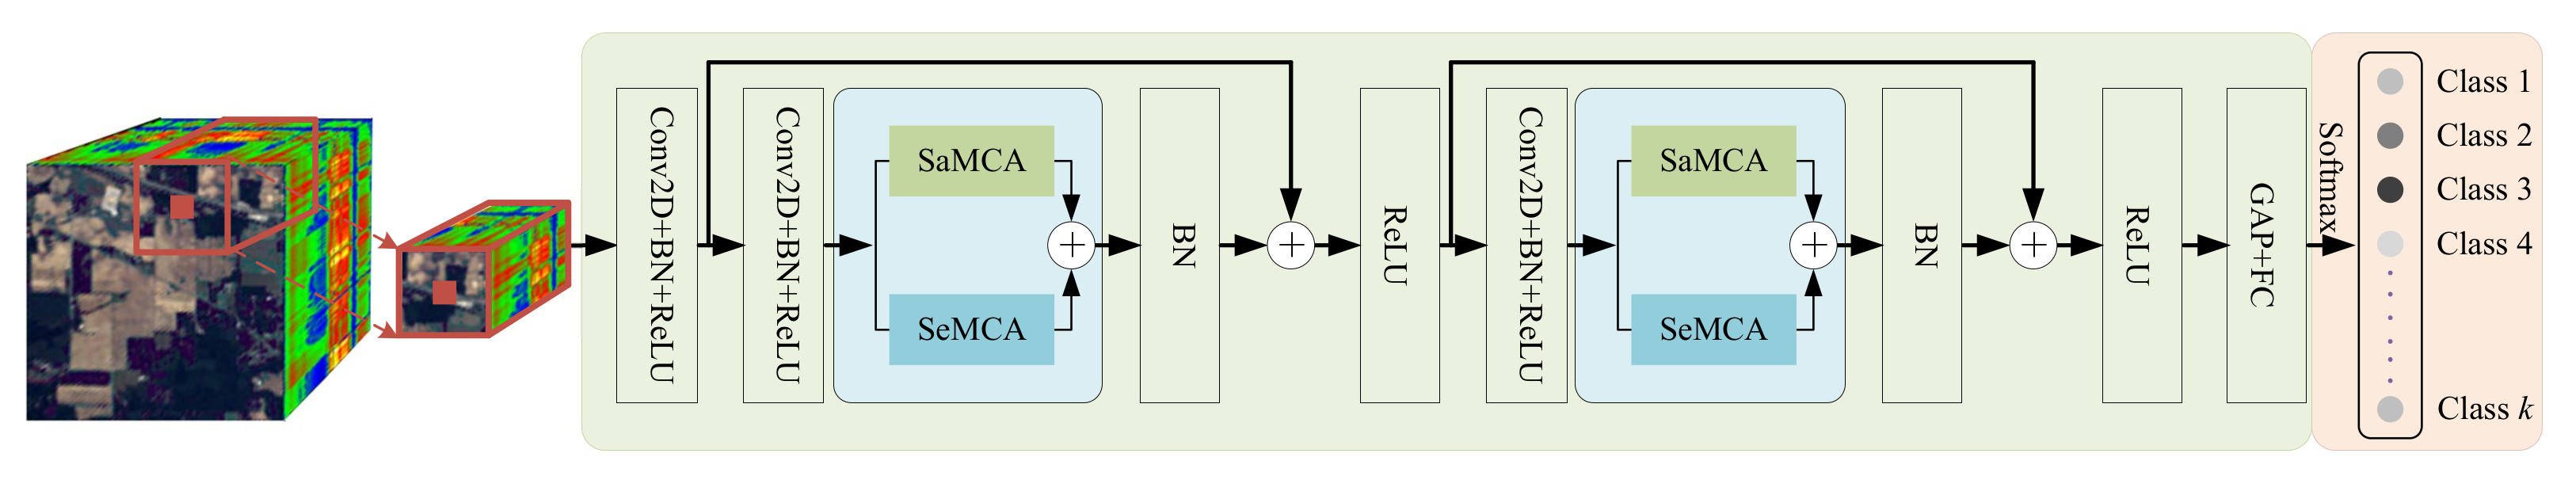
The proposed framework of DMuCA network is illustrated in 
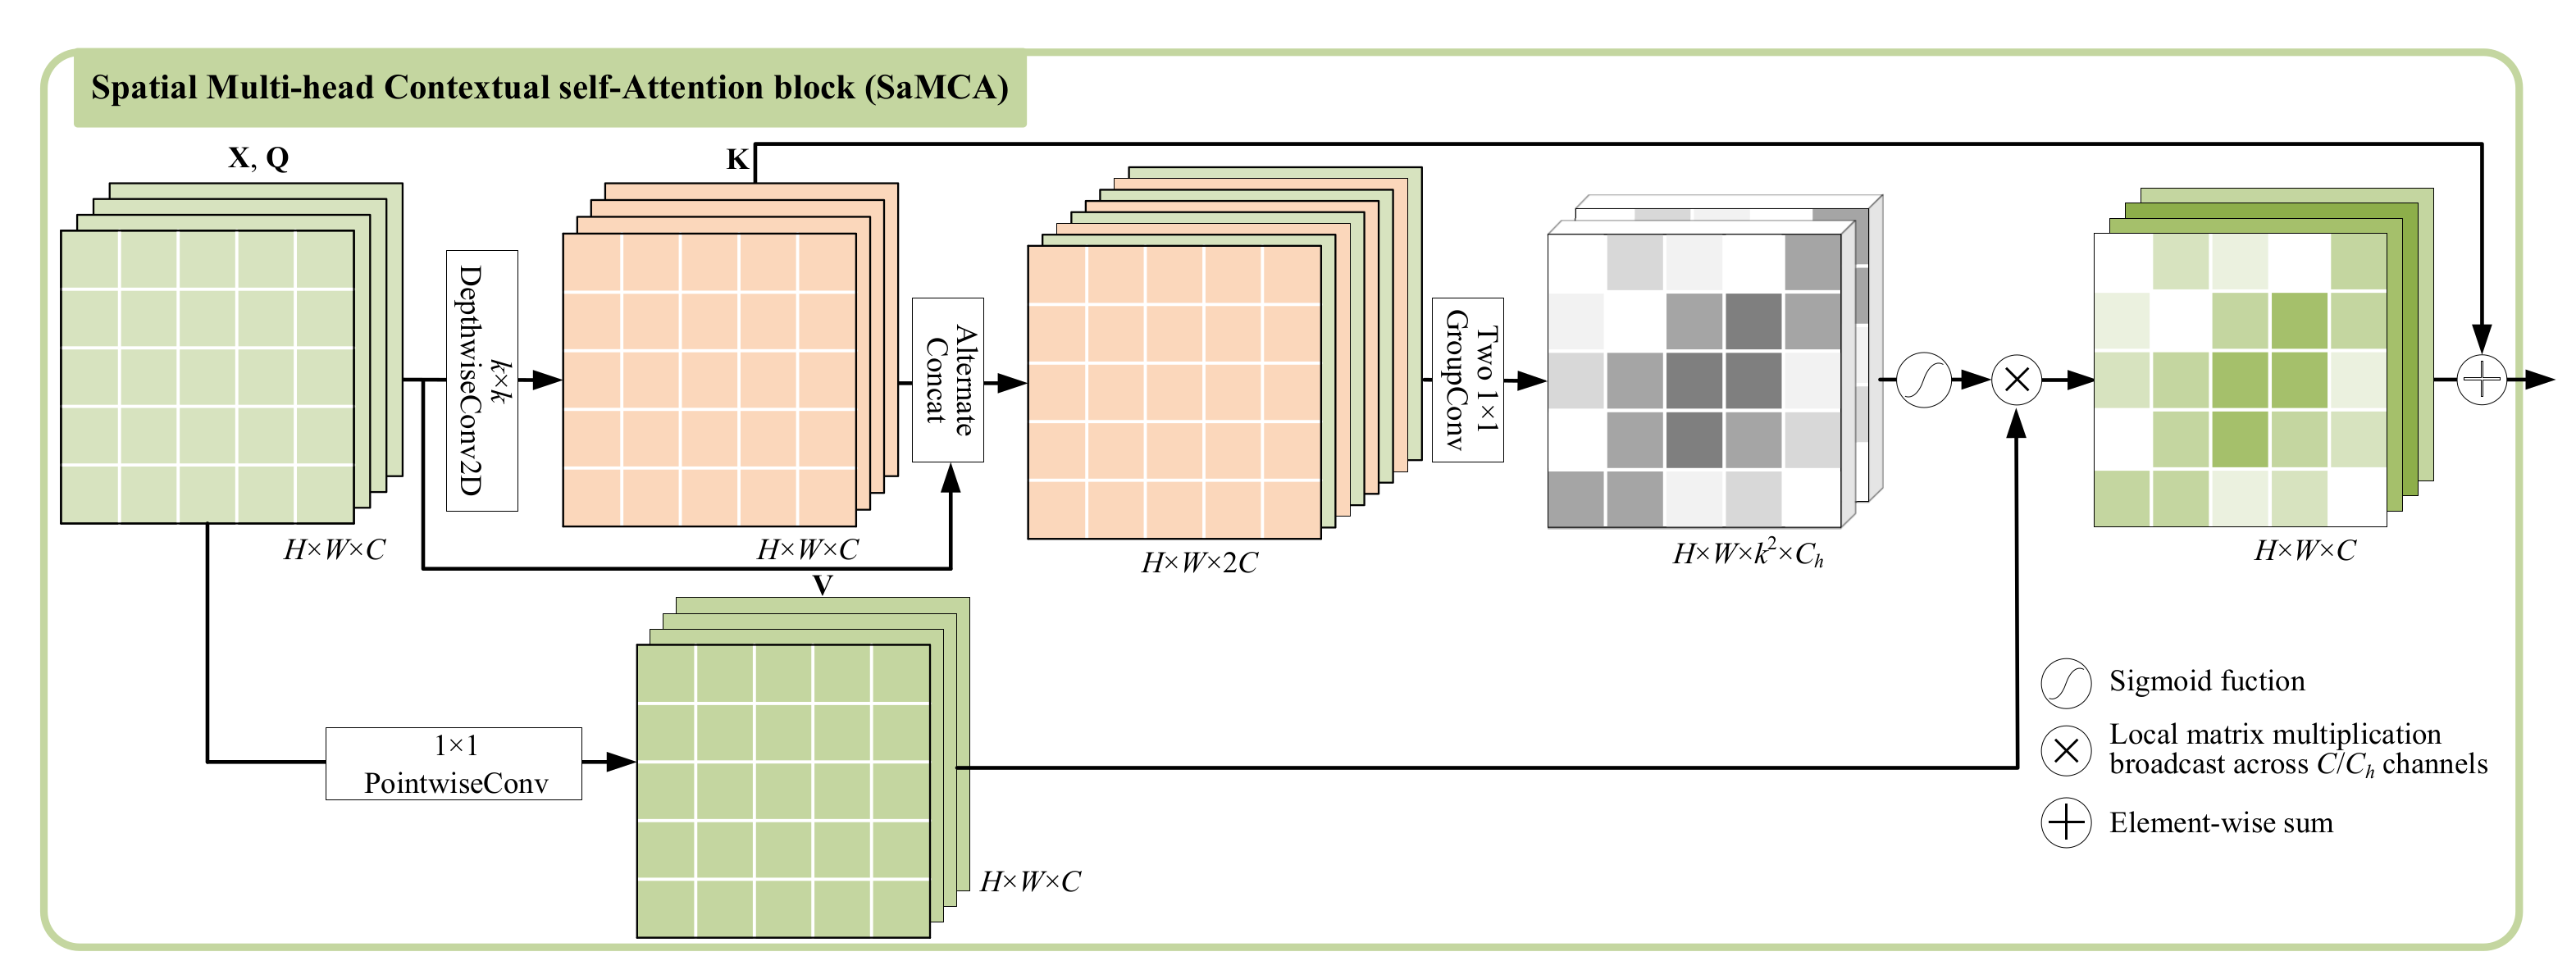
Figure 2. We build a plug-and-play 3-D attention block to guide a deep convolutional network focusing on spectral-spatial regions of interest. CoT [37] integrates both neighborhood-enriched contextual information and self-attention to enhance feature learning with dynamic local perception. We inherit the advantage of CoT and decouple the spatial and spectral neighborhood interaction into two separate blocks, SaMCA (see Figure 3) and SeMCA (see Figure 4). The former allocates more attention to important spatial regions, while the latter acts as a weighted aggregation of neighborhood spectral bands or attention-based feature recombination. To take full advantage of the two contextual information from different dimensions, we place the two blocks parallel to one another, and fuse their results by element-wise weighting summation. Thus, the output of DMuCA can be defined as,
F = β F spe + ( 1 β ) F spa ,
where F spe and F spa are the output of SeMCA and SaMCA, respectively. β [ 0 , 1 ] is a weighting factor that can be learned when model training, with an initial value set as 0.5.
The integrated DMuCA can alternate any standard convolution filter. For HSI classification, we replace some convolutional layers in a ResNet backbone with our proposed DMuCA module, to strengthen the model with spectral-spatial contextual interdependencies and attention perception. As illustrated in Figure 2, the backbone contains two residual blocks, and one of the convolution layers in each block is replaced by a DMuCA module. All of the other convolution layers are followed by batch normalization and ReLU activation layer. A global average pooling (GAP) and FC layer are performed to integrate the global spatial information and to project the learned feature into label space for probability prediction of classification. 
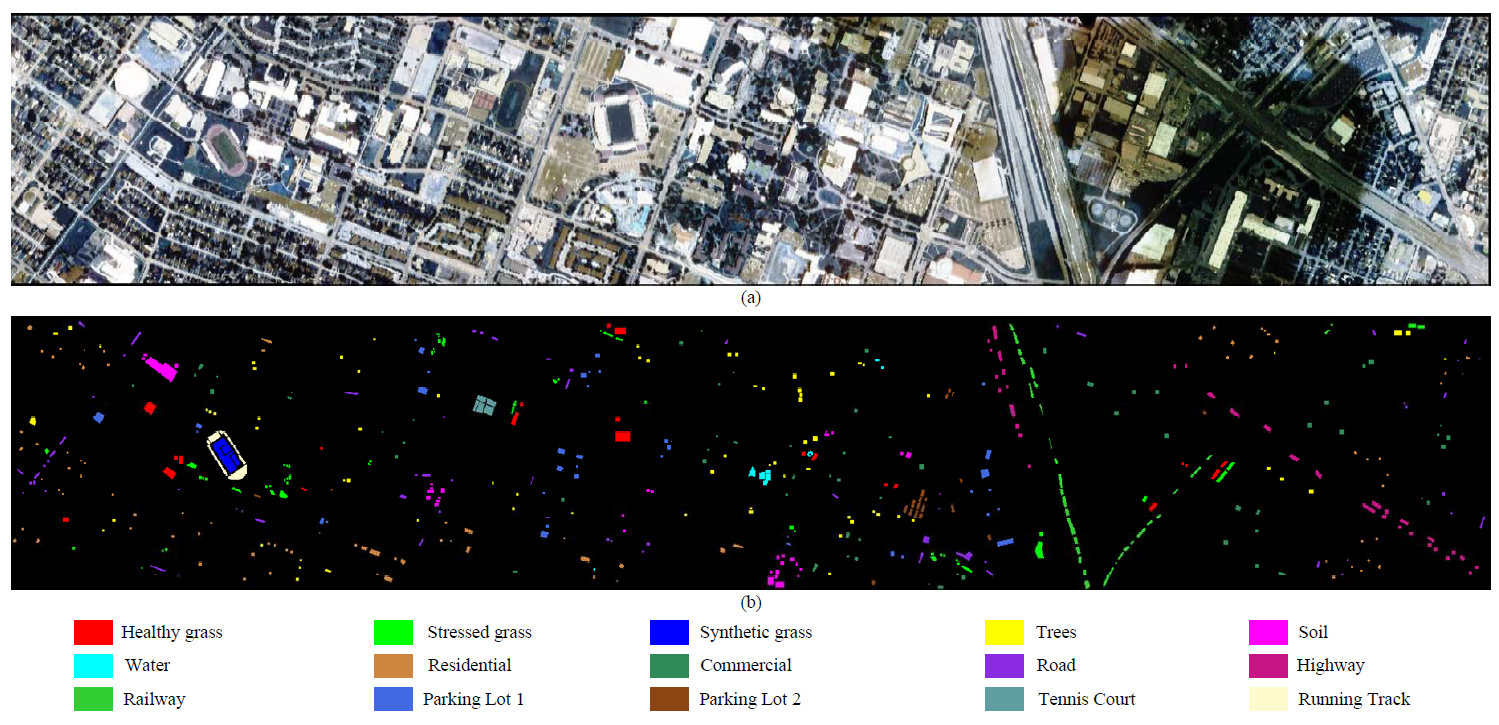
Table 1 shows the detailed model structure of the DMuCA network, taking the IN dataset as an example.

3.1. Spatial Multi-Head Contextual Self-Attention

The SaMCA block aims to assign appropriate weights to the spatial neighborhood pixels and aggregates them for presentation of the central pixel. Formally, given the input X R S × S × C , where S × S denotes the spatial dimension and C is the channel number. We treat each pixel as an independent token and transform X into queries Q = Identity X and values V spa = PointConv ( X , W v ) with kernel W v of size 1 × 1 . For absolute mining of spatial relation with relatively few parameters, we transform X into keys by depth-wise convolution with kernel W k of size k × k , defined as K spa = DepthConv ( X , W k ) .
In HSI, neighbor bands contain similar spatial distribution but certain noise interference. So in order to avoid weight allocation suffering from noise interference, we alternately concatenate the queries and keys, and then group them to capture the local relationships for multi-head attention. This processing can be defined as
g ˜ spa X = GConv σ GConv Alter Q , K spa , W 1 , W 2 ,
where Alter · and GConv · denote the alternate concatenation and group convolution operation for short, respectively. Two consecutive group convolutions with kernel of size 1 × 1 and group number of C h are set here to generate multi-head attention weights. Then, the spatial weights are normalized by Softmax function as
g spa X i j t , : , : = Softmax g ˜ spa X i j t , : , : .
g spa X i j t , : , : R k × k represents the attention weight of the t-th head ( t [ 1 , C h ] ) for X i j with neighbor scope of k × k . The normalized attention weights g spa X R H × W × k 2 C h are then allocated to the corresponding elements of V spa R S × S × C in a C / C h channel-sharing manner, and get the output feature map Z spa R H × W × C with dynamic weighted aggregation
Z spa = g spa X V spa ,
where ⊗ denotes local matrix multiplication broadcasting across C / C h channels. The channel sharing here can reduce the number of model parameters and facilitate memory scheduling on the GPU for efficiency.
The keys K spa generated by depth-wise convolution, which shares weights in the spatial domain, can be seen as a static context, while pixel-wise self-attention is in a dynamic fashion. The former is adept at spatial translation invariance while the latter can adaptively capture aggregation weights. To combine both of the advantages, we fuse the static context from K spa into the dynamic contextual representation Z spa and get the final output F spa of SaMCA, which focus more on rich spatial information,
F spa = Z spa + K spa .

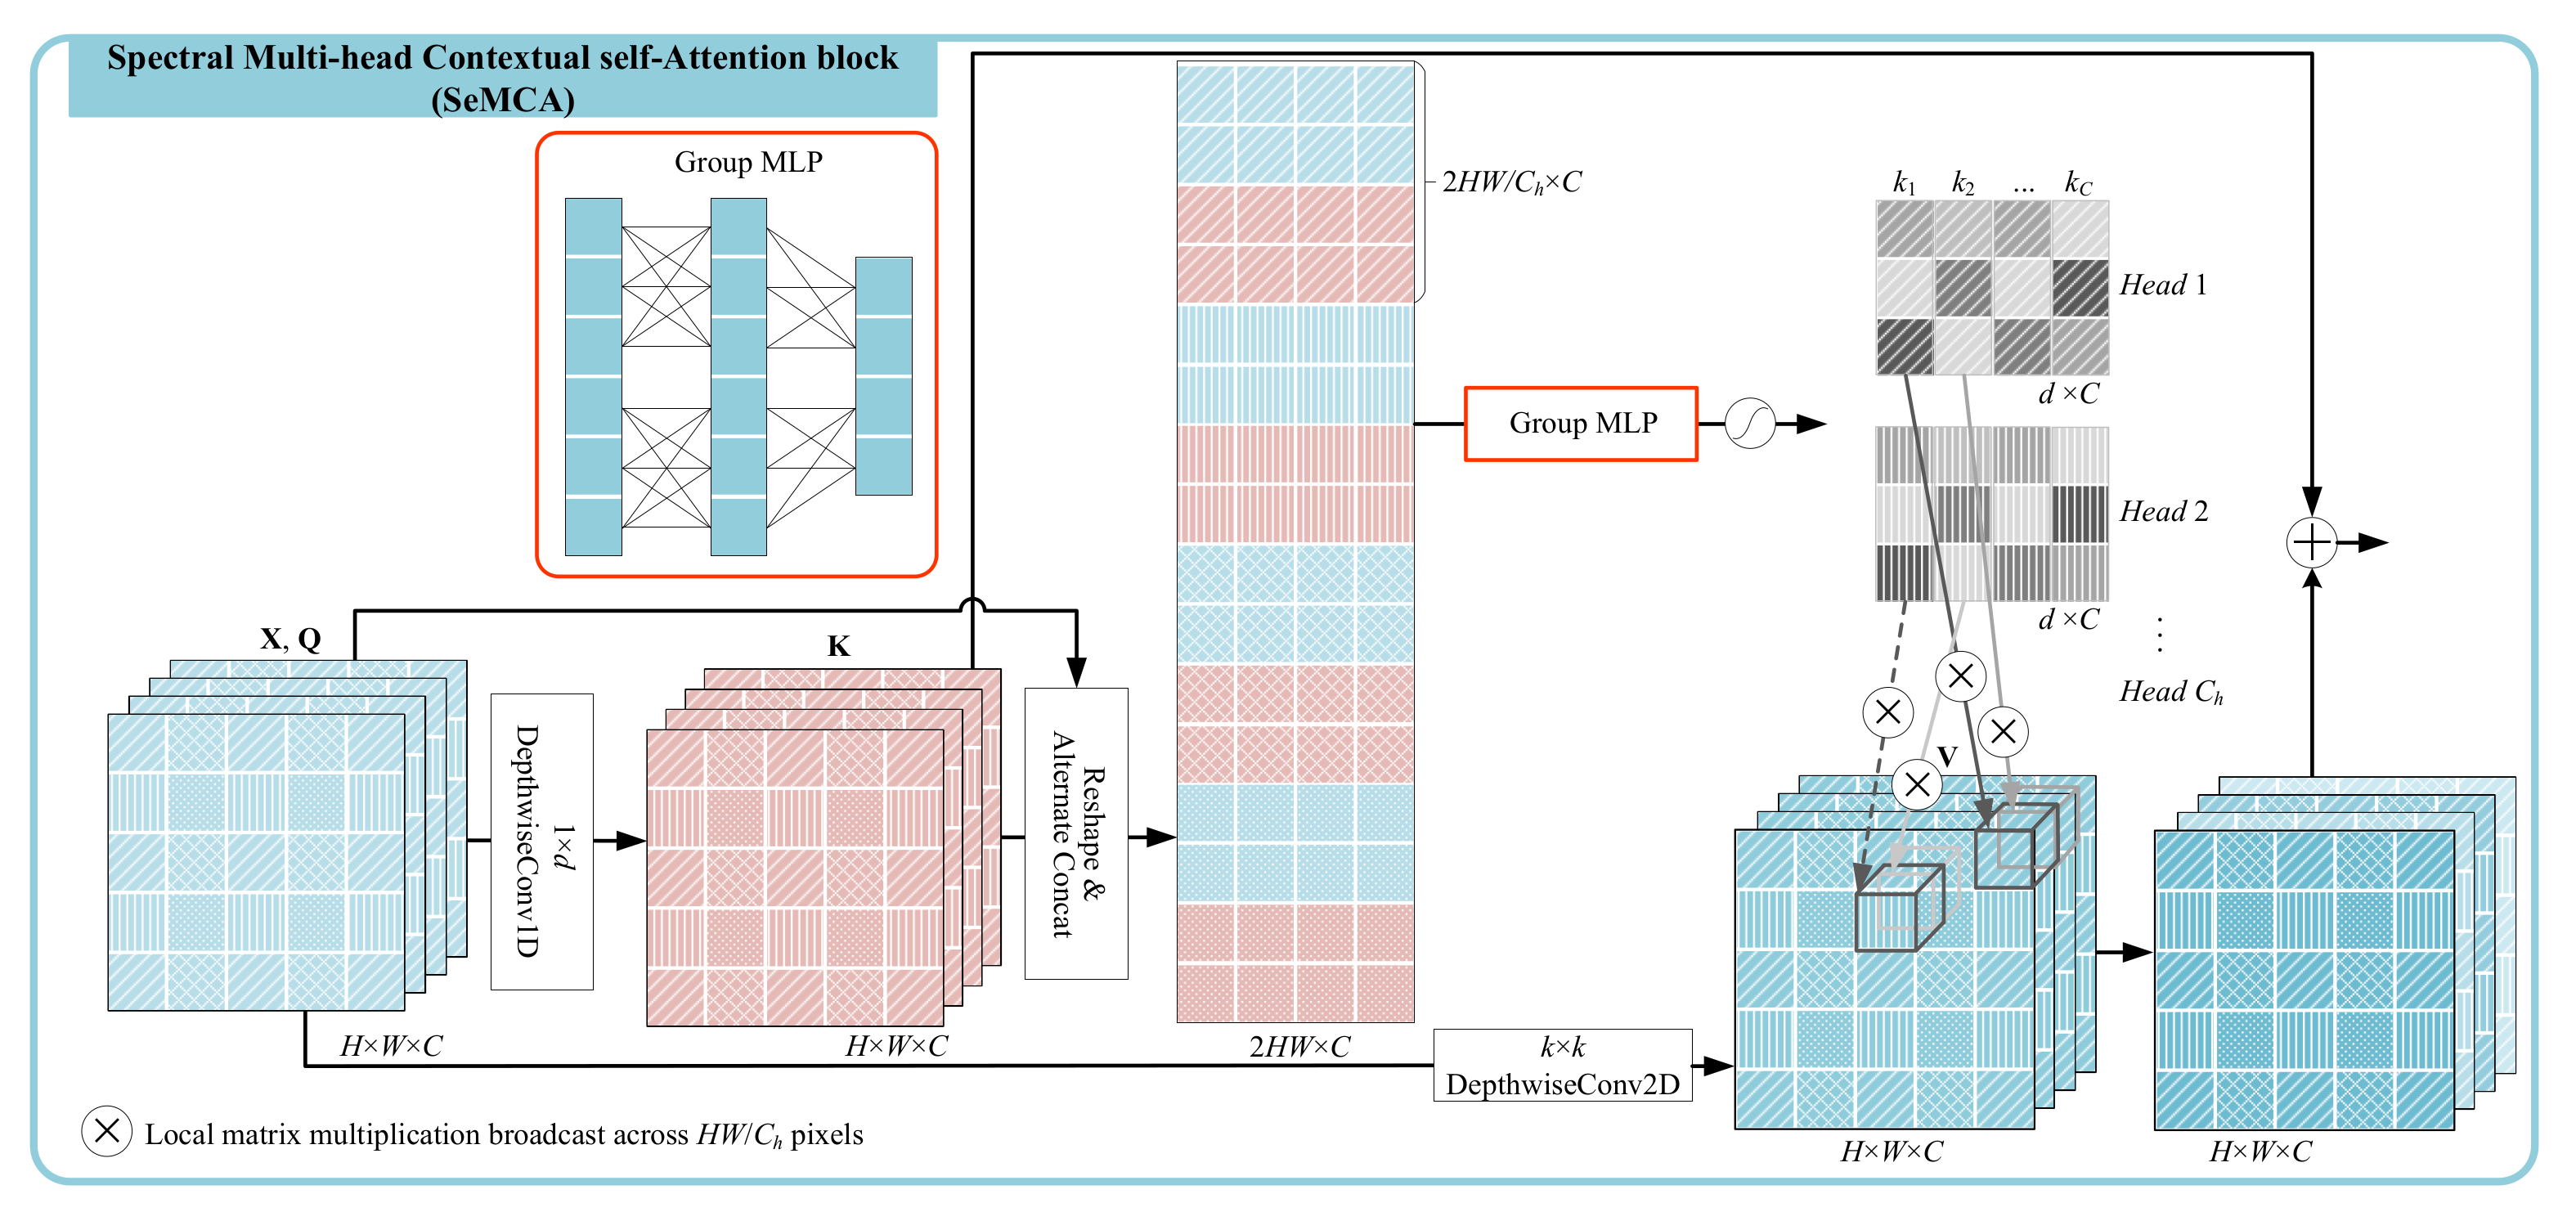
3.2. Spectral Multi-Head Contextual Self-Attention

The far abundant spectral information of pixels in HSI, compared with the color (RGB) dataset, brings a greater challenge to finer spectral neighborhood perception. Therefore, we design a SeMCA block (see Figure 4) to mine spectral neighborhood information from multiple perspectives. Similarly, given the input feature map X R S × S × C as the same in SaMCA block, we treat each channel or band as a token. The queries ( Q ), keys ( K spe ), and values ( V spe ) are defined respectively as
Q = Identity X , K spe = DepthConv 1 D X , W k , V spe = DepthConv 2 D X , W v .
Specifically, 1-D depth-wise convolution with the kernel of size 1 × d is introduced here to contextualize the keys. This means each pixel owns its convolution kernel, which helps prevent interference between groups of samples and provides diversity to the followed multi-head self-attention. X is projected to values V spe by a spatial transformation layer, a 2-D depth-wise convolution layer with a kernel of size k × k .
In spectral attention, each token is featured from one two-dimensional feature map, which will sharply consume the memory if generating multi-head attention matrices by a regular convolution. Meanwhile, the parameters and computation cost will exponentially increase with the increase in spatial resolution. Fortunately, there is a fairly strong neighborhood consistency in the spatial domain. Thus, we evenly sample multiple groups of data (filled with different textures in Figure 4) to represent each channel and generate multi-head attention on the sampling groups. More specifically, pixels sampled from both queries Q and keys V spe in the same location are concatenated together to learn one head of attention weights by an MLP, which can be written as
g ˜ spe ( X ) t = FC σ FC Q Δ t , : , K Δ t , : spe , W 1 , W 2 ,
where Δ t Z 2 ( t [ 1 , 2 , , C h ] ) refers to the t-th set of sampling offsets. MLP with two fully connected (FC) layers are employed for relevance learning of neighborhood channels. W 1 R 2 H W / C h × H W / C h and W 2 R H W / C h × d represent the corresponding embedding matrices of FC layers, where d is the neighbor scope for channel aggregation. The final multi-head spectral attention weights g spe X R d C h × C for all the channels can be defined as
g spe ( X ) = Softmax GMLP Alter Q Δ , : , K Δ , : spe , W ,
where Δ denotes all of the sampling offsets stored in groups. GMLP denotes a grouped MLP where the group number equals C h , the head number in self-attention. Note that the aggregation weights in each head are per channel normalized by the Softmax function.
In order to capture the spectral information from multiple perspectives without an increase in storage, we share the attention matrix in one head only to the corresponding spatial sampling set. This means that each head of attention weighted aggregate a specific set of neighborhood pixels. Thus, weighted aggregation of the neighbors of the i-th channel on the sub-sampling set Δ t can be formulated as
Z Δ t , i = Conv V Δ t , N c i spe , g spe X t 1 d + 1 : t d , i ,
where N c i i d / 2 : i + d / 2 refers to a set which saved d offsets of neighbors around the i-th channel, i = 1 , 2 , , C . Spatial samples in Δ t share the same filter kernel g spe X t 1 d + 1 : t d , i . The multi-head attention calibration in the spectral domain can be implemented on diverse sub-sampling sets, which are staggered in local space as different texture marks in Figure 4.
Similar to the SaMCA block, we fuse the static spectral context K spe with the dynamic contextual representation Z spe , and obtain the final spectral local perception F spe ,
F spe = Z spe + K spe .

4. Experiments

In this section, we conduct a comprehensive set of experiments to verify the effectiveness of DMuCA, including ablation studies for the major modules, sensitivity analysis of the hyperparameters, and comparison with some state-of-the-art classification models.

4.1. Datasets and Experimental Setup

To verify the stability of our model, we conduct experiments on three real datasets that come from different sensors and have diverse spatial resolutions.
The Indian Pines (IP) dataset, collected by the AVIRIS sensor over northwest Indiana, consists of 145 × 145 pixels with a spatial resolution of 20 m per pixel, and 200 spectral bands after 20 noisy ones are removed due to atmospheric absorption or low SNR. The available ground truth contains 16 classes. Figure 5a,b shows its false-color image and the ground-truth map, respectively.
The University of Pavia (UP) dataset was collected by the ROSIS-03 sensor over the University of Pavia. It consists of 610 × 340 pixels with a spatial resolution of 1.3m per pixel, and 103 spectral bands after removing 12 noisy bands. The available ground reference contains 9 classes of interest. Figure 5c,d shows its false-color image and the ground-truth map, respectively.
The University of Houston (UH) dataset was acquired by the ITRES CASI-1500 sensor over the University of Houston campus and the neighboring urban area. The data consist of 349 × 1905 pixels with a spatial resolution of 2.5 m and 144 bands with a wavelength ranging from 364 nm to 1046 nm. The corresponding ground truth map consists of 15 types of land cover. Figure 6 shows its false-color image and the ground-truth map.
For the experiments that do not concern the effect of training sample size on model performance, we all select randomly 10%, 3%, 3% of samples per class from the ground-reference data for model training on IP, UP, and UH datasets, respectively, and the remaining samples are exploited for model testing. Before feature learning, the original HSI data is firstly normalized to [0, 1] for dimensionless transformation and acceleration of model optimization. The average accuracy (OA), overall accuracy (AA), and kappa statistic ( κ ) are adopted to evaluate the classification efficiency, and we provide OA results as a function of the parameters to be analyzed. All of our results are reported as the mean of ten runs. For model training, the cross-entropy loss function is used to supervise the model prediction. Stochastic gradient descent (SGD) is adopted as the optimizer to update the model parameters with the momentum of 0.9 and the weight decay of 1 × 10⁻⁴. Furthermore, we train models on the dataset with a batch size of 32 for 100 epochs and set the learning rate to 0.005. All of the experiments are implemented on the PyTorch platform using a workstation with i9-10900K CPU and an NVIDIA GeForce RTX 3090 graphics card. The code of our model is available at: https://github.com/mrpokere/DMuCA (accessed on 23 December 2021).

4.2. Model Analysis

In this part, we first verify the effect of the proposed components in our proposed DMuCA network by ablation study, and then analyze the model robustness at different parameter settings.

4.2.1. Ablation Study

In DMuCA, three main components are designed for discriminative feature learning, including grouping representation of tokens, contextual self-attention from spatial and spectral dimension, and fusion of features from static and dynamic perception. This part discusses the importance of different components in DMuCA through several sets of ablation studies. In addition, we try to verify the effectiveness of DMuCA in key bands perception.
Table 2 shows the model performance as the number of spatial attention heads ranging from 1 to 64, where “1” means single self-attention with no channel grouping and “64” means each channel generates an attention matrix. It can be seen that single self-attention produced over all the input is 1.3% worse than the best setting for the UH dataset, and is also slightly worse for IN and UP datasets. Meanwhile, the parameters and FLOPs decrease gradually as the group number increases. We finally set 16, 32, and 32 spatial self-attention heads for IN, UP, and UH datasets, respectively. As the same way in Table 3, we vary the number of spectral attention heads, where “1” means single self-attention with no pixel grouping or sampling and “Pixel-wise” means each pixel produces its own attention matrix. It shows a similar trend in both accuracy and computation cost. We choose the best setting, 25, 49, and 25 spectral self-attention heads, for IN, UP, and UH datasets, respectively.
Table 4 demonstrates the influence of the two self-attention sub-blocks on the classification accuracy when two convolutional layers in ResNet backbone (Base Model) are replaced respectively by just SaMCA, SeMCA, and by the final DMuCA block. The results show that the OAs are improved when we replace the convolutional layers by either SaMCA or SeMCA block, except for a slightly lower result when inserting only SeMCA for classification of the IN dataset. This is mostly due to its lower spatial resolution that exists with many mixed pixels, while SeMCA may amplify the spectral noise. However, it is worth noting that DMuCA achieves significant performance gains with a combination of the spatial and spectral self-attention blocks, illustrating the effectiveness of DMuCA in feature learning.
Table 5 reports the performances of utilizing the static and dynamic contextual information in the DMuCA network. Here, the solely static context means each of the two convolutional layers in ResNet backbone is replaced by a set of parallel 2-D and 1-D depth-wise convolution, while the dynamic context means no skip connections are set between the static Keys and the calibrated dynamic features. The results indicate that our model with static or dynamic context alone achieves higher performance than the baseline on the three datasets, while static and dynamic contexts complement each other and their fusion can further enhance the classification accuracy.
To reveal DMuCA in key bands perception, we further perform HSI classification by DMuCA with full or selected bands (reference the results from [40,41]) as the input, and compare it with the ResNet base (Base). The results in Table 6 show that DMuCA achieves a significant increase over the base when performing classification with the full spectral bands, and a slight increase with the selected bands. This illustrates that DMuCA can effectively focus on important bands, and band selection limits its advantages, even with a slight increase. Besides, band selection will result in some loss of information, while DMuCA can try to maximize all the information and achieve a 1% increase.

4.2.2. Parameter Analysis

In our proposed DMuCA network, the main parameters that affect the model performance are the input patch size for neighborhood information assistance and the number of DMuCA modules for spectral-spatial contextual attention-based feature extraction.
As a pixel-wise classification task, the input patch size determines how many spatial neighborhoods are used to assist feature extraction. We verify the model performance when the patch size ranges from 7 to 19. The results in Table 7 show that a larger input patch size is beneficial to capture contextual information and thus significantly improve the recognition performance. However, the statement ’the larger the better’ is not true in this case. The best scale should provide sufficient spatial texture, while also avoiding much noise interference. It can be found that the more noise interfered with the dataset, the less suitable it was for a larger patch size. Finally, we set IN, UP, and UH datasets with input sizes of 11, 15, and 13, respectively.
To improve the high-level contextual perception, more residual blocks are usually stacked to deepen the model. We further explore our DMuCA network with an increasing number of residual blocks and compare it with the ResNet backbone (Base Model). As shown in Table 8, only one residual block, or too shallow a network, has limited capability in high-level feature learning. However, this does not mean `the deeper the better’, particularly for HSI datasets with much obscure high-level semantic information but detailed shallow texture. UP and UH have more distinct spatial context information than the IN dataset; thus, they benefit more from deeper backbone networks, while four residual blocks cause the OA result of IN dataset to decrease. Our DMuCA network achieves the best results by a network with just two residual blocks, presenting a more significant advantage in shallow information mining.

4.3. Comparison with the State-of-the-Art Methods

The key motivation of our proposed method is to construct an efficient spectral-spatial attention mechanism for discriminative feature learning. For fair performance evaluation, we create 10 groups of training sets by randomly sampling on ground truth without replacement and the resting samples from each set for cross-validation. We firstly compare our proposed DMuCA module with some classical attention mechanisms, such as squeeze-and-excitation (SE) [19], dual attention network (DANet) [26], and convolutional block attention module (CBAM) [22]. All of the attention modules are embedded respectively into the same ResNet base model for HSI classification. Table 9 shows the mean OAs and the standard deviations of the 10 set runs with the percentage of training samples per class ranging from 3% to 20%. We can see that our DMuCA achieves the best results all the time, with either limited or more training samples. These results assure that our model has good generalization ability in feature extraction.
We further compare our proposed DMuCA network with the traditional SVM method and some of the best deep learning-based methods, such as the DRNN model with LSTM [7] that see the patch block as a sequence, the spectral-spatial residual network (SSRN) with 3-D convolution [10], the deep feature fusion network (DFFN) with spectral-spatial fusion [11], the residual spectral-spatial attention network (RSSAN) [42] that insert CBAM into a residual network, the compact band weighting-based attention network (CBW) [20], the spectral-spatial attention network (SSAN) [31] that inserts the self-attention block into a 3-D convolution network, and the ResNet backbone (Base). To be fair, we set all the state-of-the-art frameworks with the same input patch size, while the other parameters involved in the competitors are set as provided in the corresponding references.
The mean accuracy and the standard deviation of the 10 set runs are reported in Table 10, Table 11 and Table 12, including the accuracy of each class and overall quantification from our proposed model and the competitors on the IN, UP, and UH datasets, respectively. Table 13 counts the computational FLOPs, parameters, and the running time of the corresponding experiments. The results indicate that the 3-D convolution-based SSRN and the attention-based models all present comparable results. Our DMuCA network outperforms all of them in classification accuracy, especially with comparatively small variance volatility. Besides, our method shows an outstanding performance of AAs, about a 2% increase over the ResNet base, and is encouragingly competitive on the classification of the UH dataset (a 3% significant increase over the base). RSSAN has a similar backbone to ours, and the information squeeze in CBAM is indeed a lightweight means of attention perception, containing the fewest training parameters and FLOPs. However, this comes somewhat at the expense of classification accuracy. Our method is not advantageous in computation cost, with about three times the running time over the ResNet base as reported in Table 13, but the increase is acceptable relative to improving classification accuracy, especially compared with other competitors.
Figure 7, Figure 8 and Figure 9 visualize the best classification maps from all the competitors on IN, UP, and UH datasets, respectively. Although SVM produces a noisy map, it keeps clear contour information. RNN, SSRN, DFFN, and RSSAN all overly smooth the boundaries, particularly apparent in the region of "Self-Blocking Bricks" on the UP dataset. CBW and SSAN do better in boundaries, which will benefit greatly from the special spectral attention in CBW and the self-attention-based feature calibration in SSAN. Our DMuCA module decouples the 3-D self-attention into two parallel blocks, and perceives key region of spectral and spatial feature from multiple perspectives. This structure performs well in capturing local relationships, and generate more accurate boundary location, achieving the expected effect.

5. Conclusions

In this paper, we presented a dual multi-head contextual self-attention (DMuCA) network, which decouples the spectral-spatial contextual attention into SaMCA and SeMCA sub-modules, for contextual dependencies learning of HSI with fewer possible parameters and lower computation costs. The former serves to filter and aggregate the local information, while the latter leads to weighted aggregates of the neighborhood channels. Grouping tokens by channels or pixel sampling, and performing multi-head attention on each group effectively prevents the increase of parameters and computation burden, with no accuracy drop. A careful study of those proposed components demonstrates the effectiveness of discriminant feature learning and accurate classification.
Some questions still exist, such as why DMuCA achieves a noticeable improvement on ground object recognition of the UH dataset, but with a large deviation. Adaptive boundary perceptual location and neighborhood smoothing may possibly ameliorate the situation. Thus, we would like to build multi-scale attention on different semantic layers in the future, with the purpose of refining region perceptions and reducing noise interference.

Author Contributions

Conceptualization, M.L. and X.Y.; methodology, M.L., Q.H. and H.W.; software, Q.H.; validation, Q.H. and H.W.; data curation, Z.M.; writing—original draft preparation, Q.H.; writing—review and editing, M.L. and X.Y.; visualization, Q.H.; supervision, L.J. All authors have read and agreed to the published version of the manuscript.

Funding

This research was funded by the National Natural Science Foundation of China (Nos. 61901198, 61862031, 62066018); the Natural Science Basic Research Plan in Shaanxi Province of China (No. 2022JQ-704); and the Program of Qingjiang Excellent Young Talents, Jiangxi University of Science and Technology (No. JXUSTQJYX2020019).

Data Availability Statement

The IN and UP datasets are available at: http://www.ehu.eus/ccwintco/index.php?title=Hyperspectral_Remote_Sensing_Scenes. The UH dataset is available at: https://hyperspectral.ee.uh.edu/. All these links last accessed on 23 June 2022.

Conflicts of Interest

The authors declare no conflict of interest.

References

  1. Li, S.; Song, W.; Fang, L.; Chen, Y.; Ghamisi, P.; Benediktsson, J.A. Deep learning for hyperspectral image classification: An overview. IEEE Trans. Geosci. Remote Sens. 2019, 57, 6690–6709. [Google Scholar] [CrossRef] [Green Version]
  2. Rasti, B.; Hong, D.; Hang, R.; Ghamisi, P.; Kang, X.; Chanussot, J.; Benediktsson, J.A. Feature extraction for hyperspectral imagery: The evolution from shallow to deep: Overview and toolbox. IEEE Geosci. Remote Sens. Mag. 2020, 8, 60–88. [Google Scholar] [CrossRef]
  3. Ghamisi, P.; Yokoya, N.; Li, J.; Liao, W.; Liu, S.; Plaza, J.; Rasti, B.; Plaza, A. Advances in hyperspectral image and signal processing: A comprehensive overview of the state of the art. IEEE Geosci. Remote Sens. Mag. 2017, 5, 37–78. [Google Scholar] [CrossRef] [Green Version]
  4. Lokman, G.; Çelik, H.H.; Topuz, V. Hyperspectral Image Classification Based on Multilayer Perceptron Trained with Eigenvalue Decay. Can. J. Remote Sens. 2020, 46, 253–271. [Google Scholar] [CrossRef]
  5. Zhou, P.; Han, J.; Cheng, G.; Zhang, B. Learning compact and discriminative stacked autoencoder for hyperspectral image classification. IEEE Trans. Geosci. Remote Sens. 2019, 57, 4823–4833. [Google Scholar] [CrossRef]
  6. Chen, Y.; Zhao, X.; Jia, X. Spectral–spatial classification of hyperspectral data based on deep belief network. IEEE J. Sel. Top. Appl. Earth Obs. Remote Sens. 2015, 8, 2381–2392. [Google Scholar] [CrossRef]
  7. Mou, L.; Ghamisi, P.; Zhu, X.X. Deep recurrent neural networks for hyperspectral image classification. IEEE Trans. Geosci. Remote Sens. 2017, 55, 3639–3655. [Google Scholar] [CrossRef] [Green Version]
  8. Shi, C.; Pun, C.M. Multiscale superpixel-based hyperspectral image classification using recurrent neural networks with stacked autoencoders. IEEE Trans. Multimed. 2019, 22, 487–501. [Google Scholar] [CrossRef]
  9. Zhou, W.; Kamata, S.i.; Luo, Z.; Wang, H. Multiscanning Strategy-Based Recurrent Neural Network for Hyperspectral Image Classification. IEEE Trans. Geosci. Remote Sens. 2022, 60, 5521018. [Google Scholar] [CrossRef]
  10. Zhong, Z.; Li, J.; Luo, Z.; Chapman, M. Spectral–spatial residual network for hyperspectral image classification: A 3-D deep learning framework. IEEE Trans. Geosci. Remote Sens. 2017, 56, 847–858. [Google Scholar] [CrossRef]
  11. Song, W.; Li, S.; Fang, L.; Lu, T. Hyperspectral image classification with deep feature fusion network. IEEE Trans. Geosci. Remote Sens. 2018, 56, 3173–3184. [Google Scholar] [CrossRef]
  12. Wang, W.; Dou, S.; Jiang, Z.; Sun, L. A Fast Dense Spectral–Spatial Convolution Network Framework for Hyperspectral Images Classification. Remote Sens. 2018, 10, 1068. [Google Scholar] [CrossRef] [Green Version]
  13. Zhang, X.; Chen, S.; Zhu, P.; Tang, X.; Feng, J.; Jiao, L. Spatial Pooling Graph Convolutional Network for Hyperspectral Image Classification. IEEE Trans. Geosci. Remote Sens. 2022, 60, 5521315. [Google Scholar] [CrossRef]
  14. Zhu, L.; Chen, Y.; Ghamisi, P.; Benediktsson, J.A. Generative adversarial networks for hyperspectral image classification. IEEE Trans. Geosci. Remote Sens. 2018, 56, 5046–5063. [Google Scholar] [CrossRef]
  15. Cui, B.; Dong, X.M.; Zhan, Q.; Peng, J.; Sun, W. LiteDepthwiseNet: A Lightweight Network for Hyperspectral Image Classification. IEEE Trans. Geosci. Remote Sens. 2021, 60, 5502915. [Google Scholar] [CrossRef]
  16. Wang, J.; Huang, R.; Guo, S.; Li, L.; Zhu, M.; Yang, S.; Jiao, L. NAS-guided lightweight multiscale attention fusion network for hyperspectral image classification. IEEE Trans. Geosci. Remote Sens. 2021, 59, 8754–8767. [Google Scholar] [CrossRef]
  17. Liang, M.; Wang, H.; Yu, X.; Meng, Z.; Yi, J.; Jiao, L. Lightweight Multilevel Feature Fusion Network for Hyperspectral Image Classification. Remote Sens. 2021, 14, 79. [Google Scholar] [CrossRef]
  18. He, K.; Zhang, X.; Ren, S.; Sun, J. Deep residual learning for image recognition. In Proceedings of the IEEE Conference on Computer Vision and Pattern Recognition, Las Vegas, NV, USA, 26 June –1 July 2016; pp. 770–778. [Google Scholar]
  19. Hu, J.; Shen, L.; Sun, G. Squeeze-and-excitation networks. In Proceedings of the IEEE Conference on Computer Vision and Pattern Recognition, Salt Lake City, UT, USA, 18–23 June 2018; pp. 7132–7141. [Google Scholar]
  20. Zhao, L.; Yi, J.; Li, X.; Hu, W.; Wu, J.; Zhang, G. Compact Band Weighting Module Based on Attention-Driven for Hyperspectral Image Classification. IEEE Trans. Geosci. Remote Sens. 2021, 59, 9540–9552. [Google Scholar] [CrossRef]
  21. Wang, L.; Peng, J.; Sun, W. Spatial–spectral squeeze-and-excitation residual network for hyperspectral image classification. Remote Sens. 2019, 11, 884. [Google Scholar] [CrossRef] [Green Version]
  22. Woo, S.; Park, J.; Lee, J.Y.; Kweon, I.S. CBAM: Convolutional block attention module. In Proceedings of the European Conference on Computer Vision (ECCV), Munich, Germany, 8–14 September 2018; pp. 3–19. [Google Scholar]
  23. Ma, W.; Yang, Q.; Wu, Y.; Zhao, W.; Zhang, X. Double-branch multi-attention mechanism network for hyperspectral image classification. Remote Sens. 2019, 11, 1307. [Google Scholar] [CrossRef] [Green Version]
  24. Vaswani, A.; Shazeer, N.; Parmar, N.; Uszkoreit, J.; Jones, L.; Gomez, A.N.; Kaiser, Ł.; Polosukhin, I. Attention is all you need. In Advances in Neural Information Processing Systems; MIT Press: Cambridge, MA, USA, 2017; pp. 5998–6008. [Google Scholar]
  25. Wang, X.; Girshick, R.; Gupta, A.; He, K. Non-local neural networks. In Proceedings of the IEEE Conference on Computer Vision and Pattern Recognition, Salt Lake City, UT, USA, 18–23 June 2018; pp. 7794–7803. [Google Scholar]
  26. Fu, J.; Liu, J.; Tian, H.; Li, Y.; Bao, Y.; Fang, Z.; Lu, H. Dual attention network for scene segmentation. In Proceedings of the IEEE/CVF Conference on Computer Vision and Pattern Recognition, Long Beach, CA, USA, 15–20 June 2019; pp. 3146–3154. [Google Scholar]
  27. Dosovitskiy, A.; Beyer, L.; Kolesnikov, A.; Weissenborn, D.; Zhai, X.; Unterthiner, T.; Dehghani, M.; Minderer, M.; Heigold, G.; Gelly, S.; et al. An image is worth 16x16 words: Transformers for image recognition at scale. arXiv 2020, arXiv:2010.11929. [Google Scholar]
  28. Bao, H.; Dong, L.; Wei, F. BEiT: Bert pre-training of image transformers. arXiv 2021, arXiv:2106.08254. [Google Scholar]
  29. He, J.; Zhao, L.; Yang, H.; Zhang, M.; Li, W. HSI-BERT: Hyperspectral Image Classification Using the Bidirectional Encoder Representation From Transformers. IEEE Trans. Geosci. Remote Sens. 2020, 58, 165–178. [Google Scholar] [CrossRef]
  30. Devlin, J.; Chang, M.W.; Lee, K.; Toutanova, K. BERT: Pre-training of deep bidirectional transformers for language understanding. arXiv 2018, arXiv:1810.04805. [Google Scholar]
  31. Sun, H.; Zheng, X.; Lu, X.; Wu, S. Spectral–spatial attention network for hyperspectral image classification. IEEE Trans. Geosci. Remote Sens. 2019, 58, 3232–3245. [Google Scholar] [CrossRef]
  32. He, X.; Chen, Y.; Lin, Z. Spatial-Spectral Transformer for Hyperspectral Image Classification. Remote Sens. 2021, 13, 498. [Google Scholar] [CrossRef]
  33. Hong, D.; Han, Z.; Yao, J.; Gao, L.; Zhang, B.; Plaza, A.; Chanussot, J. SpectralFormer: Rethinking Hyperspectral Image Classification with Transformers. IEEE Trans. Geosci. Remote Sens. 2022, 60, 5518615. [Google Scholar] [CrossRef]
  34. Tang, X.; Meng, F.; Zhang, X.; Cheung, Y.M.; Jiao, L. Hyperspectral Image Classification Based on 3-D Octave Convolution With Spatial-Spectral Attention Network. IEEE Trans. Geosci. Remote Sens. 2020, 59, 2430–2447. [Google Scholar] [CrossRef]
  35. Li, R.; Zheng, S.; Duan, C.; Yang, Y.; Wang, X. Classification of hyperspectral image based on double-branch dual-attention mechanism network. Remote Sens. 2020, 12, 582. [Google Scholar] [CrossRef] [Green Version]
  36. Hu, H.; Zhang, Z.; Xie, Z.; Lin, S. Local relation networks for image recognition. In Proceedings of the IEEE/CVF International Conference on Computer Vision, Long Beach, CA, USA, 15–20 June 2019; pp. 3464–3473. [Google Scholar]
  37. Li, Y.; Yao, T.; Pan, Y.; Mei, T. Contextual transformer networks for visual recognition. arXiv 2021, arXiv:2107.12292. [Google Scholar] [CrossRef]
  38. Guo, M.H.; Xu, T.X.; Liu, J.J.; Liu, Z.N.; Jiang, P.T.; Mu, T.J.; Zhang, S.H.; Martin, R.R.; Cheng, M.M.; Hu, S.M. Attention Mechanisms in Computer Vision: A Survey. arXiv 2021, arXiv:2111.07624. [Google Scholar] [CrossRef]
  39. Cordonnier, J.B.; Loukas, A.; Jaggi, M. On the relationship between self-attention and convolutional layers. arXiv 2019, arXiv:1911.03584. [Google Scholar]
  40. Li, T.; Cai, Y.; Cai, Z.; Liu, X.; Hu, Q. Nonlocal band attention network for hyperspectral image band selection. IEEE J. Sel. Top. Appl. Earth Obs. Remote Sens. 2021, 14, 3462–3474. [Google Scholar] [CrossRef]
  41. Yu, C.; Zhou, S.; Song, M.; Chang, C.I. Semisupervised hyperspectral band selection based on dual-constrained low-rank representation. IEEE Geosci. Remote Sens. Lett. 2021, 19, 5503005. [Google Scholar] [CrossRef]
  42. Zhu, M.; Jiao, L.; Liu, F.; Yang, S.; Wang, J. Residual spectral–spatial attention network for hyperspectral image classification. IEEE Trans. Geosci. Remote Sens. 2020, 59, 449–462. [Google Scholar] [CrossRef]
Figure 1. The multi-head structures of (a) local relation self-attention block and (b) CoT block. ⊙ denotes dot product, ⊗ denotes local matrix multiplication with channel sharing, and ⊕ denotes element-wise sum.
Remotesensing 14 03091 g001
Figure 2. The overall architecture of the proposed DMuCA network, where SaMCA and SeMCA are plugged parallel into a ResNet with two residual blocks.
Remotesensing 14 03091 g002
Figure 3. Architecture of the spatial multi-head contextual self-attention (SaMCA).
Remotesensing 14 03091 g003
Figure 4. Architecture of the spectral multi-head contextual self-attention (SeMCA).
Remotesensing 14 03091 g004
Figure 5. The false-color image (a) and the ground truth (b) for the IN dataset; The false-color image (c) and the ground truth (d) for the UP dataset.
Remotesensing 14 03091 g005
Figure 6. The false-color image (a) and the ground truth (b) for the UH dataset.
Remotesensing 14 03091 g006
Figure 7. Classification maps of the IN data set obtained by: (a) SVM, (b) RNN, (c) SSRN, (d) DFFN, (e) RSSAN, (f) CBW, (g) SSAN, (h) DMuCA.
Remotesensing 14 03091 g007
Figure 8. Classification maps of the UP data set obtained by: (a) SVM, (b) RNN, (c) SSRN, (d) DFFN, (e) RSSAN, (f) CBW, (g) SSAN, (h) DMuCA.
Remotesensing 14 03091 g008
Figure 9. Classification maps of the UH data set obtained by: (a) SVM, (b) RNN, (c) SSRN, (d) DFFN, (e) RSSAN, (f) CBW, (g) SSAN, (h) DMuCA.
Remotesensing 14 03091 g009
Table 1. The detailed construction of our DMuCA network, a case on IN dataset.
Layer/BlockKernel TypeKernel SizeInput SizesOutput Sizes
Conv1Conv2D 3 × 3 ( 200 , 11 , 11 )( 64 , 11 , 11 )
Res_Block1Conv2D 3 × 3 ( 64 , 11 , 11 )( 64 , 11 , 11 )
DMuCA k = 5 , d = 9 ( 64 , 11 , 11 )( 64 , 11 , 11 )
Res_Block2Conv2D 3 × 3 ( 64 , 11 , 11 )( 64 , 11 , 11 )
DMuCA k = 5 , d = 9 ( 64 , 11 , 11 )( 64 , 11 , 11 )
GAP&FC--( 64 , 11 , 11 )( 1 , 16 )
Table 2. Ablation study with different numbers of channel grouping and corresponding spatial attention heads. The best results are highlighted in bold font.
Heads1248163264
OA (%)97.3797.3997.4297.6297.7997.6597.51
INParam (M)1.3781.3621.3531.3491.3471.3461.346
FLOPs (M)28.1427.1526.6626.4126.2926.2326.21
OA (%)99.0499.0699.0699.0799.1099.1899.16
UPParam (M)3.6553.6383.6303.6263.6243.6233.623
FLOPs (M)39.8838.0337.1136.6536.4336.3236.27
OA (%)92.1292.4992.7892.9193.3793.4993.14
UHParam (M)2.2392.2232.2142.2102.2082.2072.207
FLOPs (M)33.5132.1331.4431.0930.9230.8430.81
Table 3. Ablation study with different numbers of pixel grouping and corresponding spectral attention heads. The best results are highlighted in bold font.
Heads19254981Pixel-Wise
OA (%)96.5597.5797.7997.6797.6697.63
INParam (M)1.4431.3451.3471.3371.3481.331
FLOPs (M)29.3326.2226.2925.9526.3225.75
OA (%)99.0999.0999.1199.1899.1199.10
UPParam (M)3.9853.6253.5973.6233.5983.590
FLOPs (M)47.8736.3635.4636.3235.4935.23
OA (%)90.7492.9593.4992.6092.5992.53
UHParam (M)2.4162.2362.2072.1972.2082.195
FLOPs (M)37.5231.7430.8430.5130.8730.45
Table 4. Effect of spatial and spectral attention in DMuCA (OA%). denotes the corresponding attention block present in DMuCA. The best results are highlighted in bold font.
SpatialSpectralINUPUH
97.6299.0692.95
97.1398.7892.38
97 . 79 99 . 18 93 . 49
Base Model97.1998.0090.23
Table 5. Effects of different methods on contextual information exploration (OA%). The best results are highlighted in bold font.
Feature TypeINUPUH
Static Context97.3799.1093.02
Dynamic Context97.6899.0492.86
DMuCA 97 . 79 99 . 18 93 . 49
Base Model97.1998.0090.23
Table 6. Classification performance of DMuCA with full or selected bands as the input (OA%). The best results are highlighted in bold font.
MethodsBands (#)IN (15)UP (14)UH (22)
BaseFull bands97.1998.0090.23
Selected bands95.6898.1192.25
DMuCAFull bands97.7999.1893.49
Selected bands95.8798.6492.36
Table 7. OAs (%) of DMuCA network with different size of input patches. The best results are highlighted in bold font.
Patch Size791113151719
IN96.6097.27 97 . 79 97.6996.3195.3694.35
UP98.1998.7899.1599.12 99 . 18 99.0398.92
UH90.6692.2993.15 93 . 49 92.6792.1791.31
Table 8. Comparison of our proposed DMuCA network and the ResNet backbone with increasing number of residual blocks (OA%). The best results are highlighted in bold font.
Block NumberDMuCABase Model
INUPUHINUPUH
196.9998.8792.2196.5697.4386.41
297.7999.1893.4997.1998.0090.23
397.6899.0793.2697.7098.1191.74
497.3998.9792.5497.5398.3292.04
Table 9. Comparison of the DMuCA module with some classical attention mechanisms (OA%). The best results are highlighted in bold font.
DatasetTraining Set (#%)SECBAMDANetDMuCA
386.23 ± 1.1186.43 ± 0.7786.47 ± 1.4086.73 ± 1.71
592.13 ± 0.7991.85 ± 1.0592.63 ± 1.1292.82 ± 0.79
IN1096.91 ± 0.5596.75 ± 0.6096.63 ± 0.4696.95 ± 0.44
1597.54 ± 0.4197.68 ± 0.3597.64 ± 0.4397.83 ± 0.37
2098.28 ± 0.2798.32 ± 0.2498.09 ± 0.3898.36 ± 0.26
398.91 ± 0.1798.71 ± 0.2998.67 ± 0.2098.95 ± 0.27
599.30 ± 0.1399.26 ± 0.1099.24 ± 0.0999.57 ± 0.06
UP1099.63 ± 0.0799.58 ± 0.0599.60 ± 0.0799.80 ± 0.07
1599.75 ± 0.0699.74 ± 0.0599.75 ± 0.0699.92 ± 0.03
2099.79 ± 0.0299.78 ± 0.0499.79 ± 0.0699.94 ± 0.02
390.61 ± 3.0991.28 ± 1.0291.65 ± 1.2392.60 ± 0.68
594.68 ± 1.2694.98 ± 0.6095.13 ± 0.5595.43 ± 1.17
UH1097.89 ± 0.5497.96 ± 0.4998.00 ± 0.5898.07 ± 0.41
1598.85 ± 0.1998.89 ± 0.2798.86 ± 0.3198.93 ± 0.18
2099.34 ± 0.2999.02 ± 0.9199.37 ± 0.2499.41 ± 0.20
Table 10. Testing results over IN dataset with 10% samples per class for model training. The best results are highlighted in bold font.
ClassSVMRNNSSRNDFFNRSSANCBWSSANDMuCABase
159.67 ± 12.6669.91 ± 9.2196.72 ± 2.8094.34 ± 2.2785.29 ± 14.1394.48 ± 3.5986.99 ± 10.1594.59 ± 6.0695.16 ± 4.59
273.35 ± 1.4283.30 ± 5.2494.91 ± 2.3592.66 ± 1.3096.29 ± 0.5495.07 ± 0.9895.34 ± 1.4997.85 ± 1.1696.87 ± 1.33
365.47 ± 1.9877.40 ± 6.5191.81 ± 5.2192.90 ± 2.2894.37 ± 2.1492.72 ± 3.3595.31 ± 1.6297.32 ± 0.8496.81 ± 1.63
453.78 ± 7.4788.10 ± 2.8792.40 ± 4.1492.78 ± 1.3391.41 ± 3.9895.78 ± 2.2292.93 ± 3.6196.41 ± 1.6197.18 ± 1.57
586.83 ± 1.4183.27 ± 2.1496.57 ± 1.4797.40 ± 1.1596.14 ± 1.0897.39 ± 1.2997.78 ± 0.9198.07 ± 1.0697.04 ± 2.38
691.31 ± 1.0293.98 ± 2.0898.18 ± 0.7895.98 ± 0.6897.99 ± 1.5796.57 ± 1.0098.28 ± 0.9897.33 ± 1.4897.44 ± 1.18
770.25 ± 13.6774.60 ± 11.2991.66 ± 10.4091.68 ± 5.4287.53 ± 11.0191.56 ± 5.8981.29 ± 12.4296.65 ± 5.4991.67 ± 11.60
896.09 ± 0.9897.53 ± 1.0399.51 ± 0.7299.63 ± 0.3799.21 ± 0.7399.48 ± 0.4699.21 ± 0.4899.80 ± 0.3699.71 ± 0.31
933.05 ± 17.6464.53 ± 8.6484.83 ± 13.1778.98 ± 17.3884.27 ± 17.0587.25 ± 9.5778.03 ± 14.7496.20 ± 4.3281.4 ± 13.72
1069.98 ± 1.7284.97 ± 4.2593.18 ± 2.6492.10 ± 2.3394.21 ± 1.1093.52 ± 1.6394.36 ± 2.0496.59 ± 1.5895.17 ± 1.22
1175.72 ± 0.9891.30 ± 3.0395.23 ± 1.9694.68 ± 0.4097.33 ± 1.1496.92 ± 0.7497.27 ± 0.8398.28 ± 0.7397.46 ± 0.59
1271.75 ± 2.7379.28 ± 3.0589.40 ± 4.5792.50 ± 1.9491.75 ± 2.1188.01 ± 4.2592.66 ± 2.1095.12 ± 2.0592.36 ± 2.45
1393.30 ± 1.5394.52 ± 2.2099.01 ± 0.7799.19 ± 0.4997.32 ± 3.0399.52 ± 0.5098.43 ± 2.8799.38 ± 0.6699.19 ± 1.10
1491.89 ± 1.1593.35 ± 1.1997.41 ± 1.1996.46 ± 0.9095.94 ± 1.4098.70 ± 0.9096.22 ± 1.0096.46 ± 0.6896.41 ± 0.62
1557.48 ± 4.6378.05 ± 6.3892.02 ± 3.8281.67 ± 4.1381.70 ± 7.0377.48 ± 4.4982.05 ± 5.0482.13 ± 3.2784.00 ± 4.20
1694.01 ± 2.9478.78 ± 4.9891.93 ± 6.1491.11 ± 3.3489.89 ± 3.1390.57 ± 4.1491.12 ± 5.8293.80 ± 2.6291.32 ± 2.76
OA (%)77.64 ± 0.5687.45 ± 2.3995.02 ± 1.4594.10 ± 0.5595.41 ± 0.7196.28 ± 0.7295.91 ± 0.5396.95 ± 0.4496.26 ± 0.55
AA (%)74.00 ± 1.6783.30 ± 1.4494.06 ± 2.4892.75 ± 1.1192.54 ± 1.4994.65 ± 1.0092.66 ± 2.0096.00 ± 0.7994.33 ± 1.66
Kappa (%)74.52 ± 0.6585.67 ± 2.7294.30 ± 1.6693.27 ± 0.6394.76 ± 0.8195.00 ± 0.8495.37 ± 0.9596.52 ± 0.5995.73 ± 0.63
Table 11. Testing results over UP dataset with 3% samples per class for model training. The best results are highlighted in bold font.
ClassSVMRNNSSRNDFFNRSSANCBWSSANDMuCABase
190.83 ± 0.6595.72 ± 1.5697.42 ± 0.4699.03 ± 0.6298.06 ± 0.8399.05 ± 0.3499.21 ± 0.2299.26 ± 0.3697.13 ± 0.71
294.22 ± 0.3897.97 ± 0.5399.12 ± 0.5099.17 ± 0.2399.46 ± 0.2999.72 ± 0.1599.43 ± 0.0399.61 ± 0.2199.67 ± 0.11
372.14 ± 1.6282.48 ± 4.4693.66 ± 1.4996.64 ± 1.5695.26 ± 1.5792.17 ± 7.0693.98 ± 1.6296.86 ± 1.6792.71 ± 2.63
491.41 ± 0.8195.51 ± 0.6696.39 ± 0.7496.86 ± 0.6093.98 ± 1.5697.76 ± 0.9598.93 ± 0.2797.49 ± 1.2095.64 ± 0.66
598.20 ± 0.7498.43 ± 1.0099.35 ± 0.2498.75 ± 0.1897.77 ± 1.0999.62 ± 0.1899.24 ± 0.0599.65 ± 0.1198.69 ± 0.68
682.28 ± 1.3593.48 ± 1.9097.14 ± 1.6197.32 ± 0.8598.96 ± 0.6299.23 ± 0.899.83 ± 0.0799.87 ± 0.3599.47 ± 0.21
775.85 ± 3.5889.57 ± 1.2899.17 ± 0.2698.48 ± 1.1097.61 ± 2.4799.04 ± 0.7399.29 ± 0.3799.35 ± 0.8492.72 ± 2.20
880.39 ± 0.9791.57 ± 1.6592.89 ± 1.0297.68 ± 1.0796.23 ± 1.2195.22 ± 2.2996.10 ± 0.9097.43 ± 0.8096.76 ± 0.84
999.83 ± 0.0592.63 ± 3.4497.99 ± 0.7497.27 ± 0.6891.47 ± 2.5597.60 ± 1.0298.96 ± 0.8598.10 ± 0.6293.11 ± 1.33
OA (%)89.53 ± 0.4995.20 ± 1.1797.64 ± 0.3698.01 ± 0.4598.32 ± 0.5098.61 ± 0.4798.82 ± 0.2598.95 ± 0.2797.98 ± 0.36
AA (%)87.24 ± 0.6493.04 ± 1.5497.11 ± 0.3098.13 ± 0.5996.91 ± 0.7997.73 ± 1.0697.51 ± 0.3798.50 ± 0.4796.21 ± 0.65
Kappa (%)86.11 ± 0.6493.66 ± 1.5396.86 ± 0.4798.04 ± 0.6097.85 ± 0.6698.16 ± 0.6297.83 ± 0.2698.61 ± 0.3697.33 ± 0.48
Table 12. Testing results over UH dataset with 3% samples per class for model training. The best results are highlighted in bold font.
ClassSVMRNNSSRNDFFNRSSANCBWSSANDMuCABase
190.10 ± 3.6490.38 ± 1.5994.25 ± 2.4982.68 ± 10.2689.79 ± 2.3793.13 ± 2.4793.79 ± 2.5494.48 ± 3.9691.79 ± 2.23
295.82 ± 1.9789.26 ± 3.7596.04 ± 2.2790.74 ± 7.6894.50 ± 2.3397.08 ± 1.5197.57 ± 1.1798.28 ± 1.2590.38 ± 3.11
398.91 ± 0.3695.00 ± 2.7299.06 ± 1.1398.17 ± 1.1897.24 ± 3.0498.81 ± 1.3399.48 ± 0.5797.22 ± 1.9596.48 ± 2.55
492.43 ± 2.8389.21 ± 2.1596.29 ± 1.5286.00 ± 8.3889.05 ± 2.7695.35 ± 2.9296.49 ± 0.7793.51 ± 2.8491.55 ± 2.37
593.53 ± 1.2094.12 ± 2.0897.74 ± 0.9098.34 ± 0.9196.22 ± 1.2997.42 ± 1.0398.47 ± 1.1798.18 ± 1.3795.34 ± 1.12
689.46 ± 2.0186.05 ± 4.5593.60 ± 3.6086.91 ± 4.6883.00 ± 7.0584.94 ± 5.3989.52 ± 3.7683.22 ± 5.7589.59 ± 2.84
782.34 ± 2.0185.94 ± 3.6390.38 ± 2.1389.37 ± 3.6690.17 ± 1.8593.32 ± 1.8990.14 ± 2.3892.79 ± 1.8289.67 ± 2.43
867.09 ± 4.8378.31 ± 6.0686.30 ± 3.3683.46 ± 4.8986.26 ± 3.7590.78 ± 2.9889.88 ± 2.2291.45 ± 1.9879.34 ± 3.01
970.65 ± 2.8581.84 ± 2.5188.92 ± 5.3083.44 ± 5.5185.12 ± 3.1588.69 ± 1.9984.68 ± 3.4289.34 ± 2.3386.15 ± 1.65
1077.13 ± 2.2678.88 ± 3.8085.65 ± 3.0885.55 ± 2.7987.82 ± 2.5687.51 ± 3.0389.20 ± 2.5189.41 ± 2.6186.39 ± 2.90
1176.85 ± 3.0283.53 ± 5.6187.73 ± 3.3788.76 ± 3.7491.79 ± 0.9895.03 ± 1.7593.03 ± 2.8495.19 ± 2.1392.87 ± 1.78
1266.43 ± 2.1678.68 ± 4.3176.70 ± 9.8378.77 ± 4.7285.84 ± 3.1689.63 ± 2.2887.25 ± 3.1688.08 ± 3.4787.47 ± 1.81
1333.19 ± 7.7580.58 ± 6.4981.40 ± 8.6384.70 ± 6.4586.84 ± 3.8894.49 ± 1.6673.95 ± 4.1395.86 ± 3.5087.97 ± 3.18
1493.93 ± 3.1586.55 ± 5.9099.18 ± 1.2398.48 ± 0.9497.72 ± 1.3597.99 ± 0.0497.84 ± 1.6099.31 ± 0.4896.58 ± 2.08
1597.87 ± 0.3589.92 ± 4.1397.91 ± 1.4496.79 ± 1.4995.01 ± 3.0996.96 ± 0.5797.34 ± 0.6094.10 ± 3.0192.59 ± 2.26
OA (%)82.21 ± 0.6285.65 ± 2.8191.09 ± 1.8388.05 ± 2.4591.20 ± 1.2692.32 ± 1.8592.12 ± 0.9992.60 ± 0.6889.82 ± 1.13
AA (%)81.71 ± 0.6985.88 ± 2.7191.56 ± 1.9288.88 ± 2.0390.42 ± 0.9892.18 ± 0.8792.01 ± 1.0492.29 ± 1.5090.28 ± 0.99
Kappa (%)80.76 ± 0.6784.49 ± 3.0490.36 ± 1.9987.09 ± 2.6589.41 ± 1.3791.97 ± 0.8691.39 ± 1.0791.70 ± 1.6589.00 ± 1.22
Table 13. The number of training parameters, computational FLOPs, and the running time of the corresponding experiments from the deep frameworks. The best results are highlighted in bold font.
DatasetEvaluationsRNNSSRNDFFNRSSANCBWSSANDMuCABase
INParameters (M)0.230.340.380.102.762.101.321.29
FLOPs (M)27.54235.5445.439.4911.4159.9625.5223.45
Training time (S)54.94104.8166.7847.7934.1246.3464.1723.77
Testing time (S)2.963.473.541.951.121.492.820.89
UPParameters (M)0.190.190.380.062.753.783.583.53
FLOPs (M)42.83225.8384.4811.2816.1262.7634.8131.03
Training time (S)88.94187.8689.2452.5375.6457.6271.9124.04
Testing time (S)49.3331.1242.9319.0810.5215.9928.048.37
UHParameters (M)0.210.250.380.082.762.882.182.15
FLOPs (M)34.83236.0163.4810.4912.4062.3930.0727.30
Training time (S)22.0173.6524.1920.3129.0118.8921.227.35
Testing time (S)125.76106.75112.2761.9535.7349.8387.6028.43
Publisher’s Note: MDPI stays neutral with regard to jurisdictional claims in published maps and institutional affiliations.

