
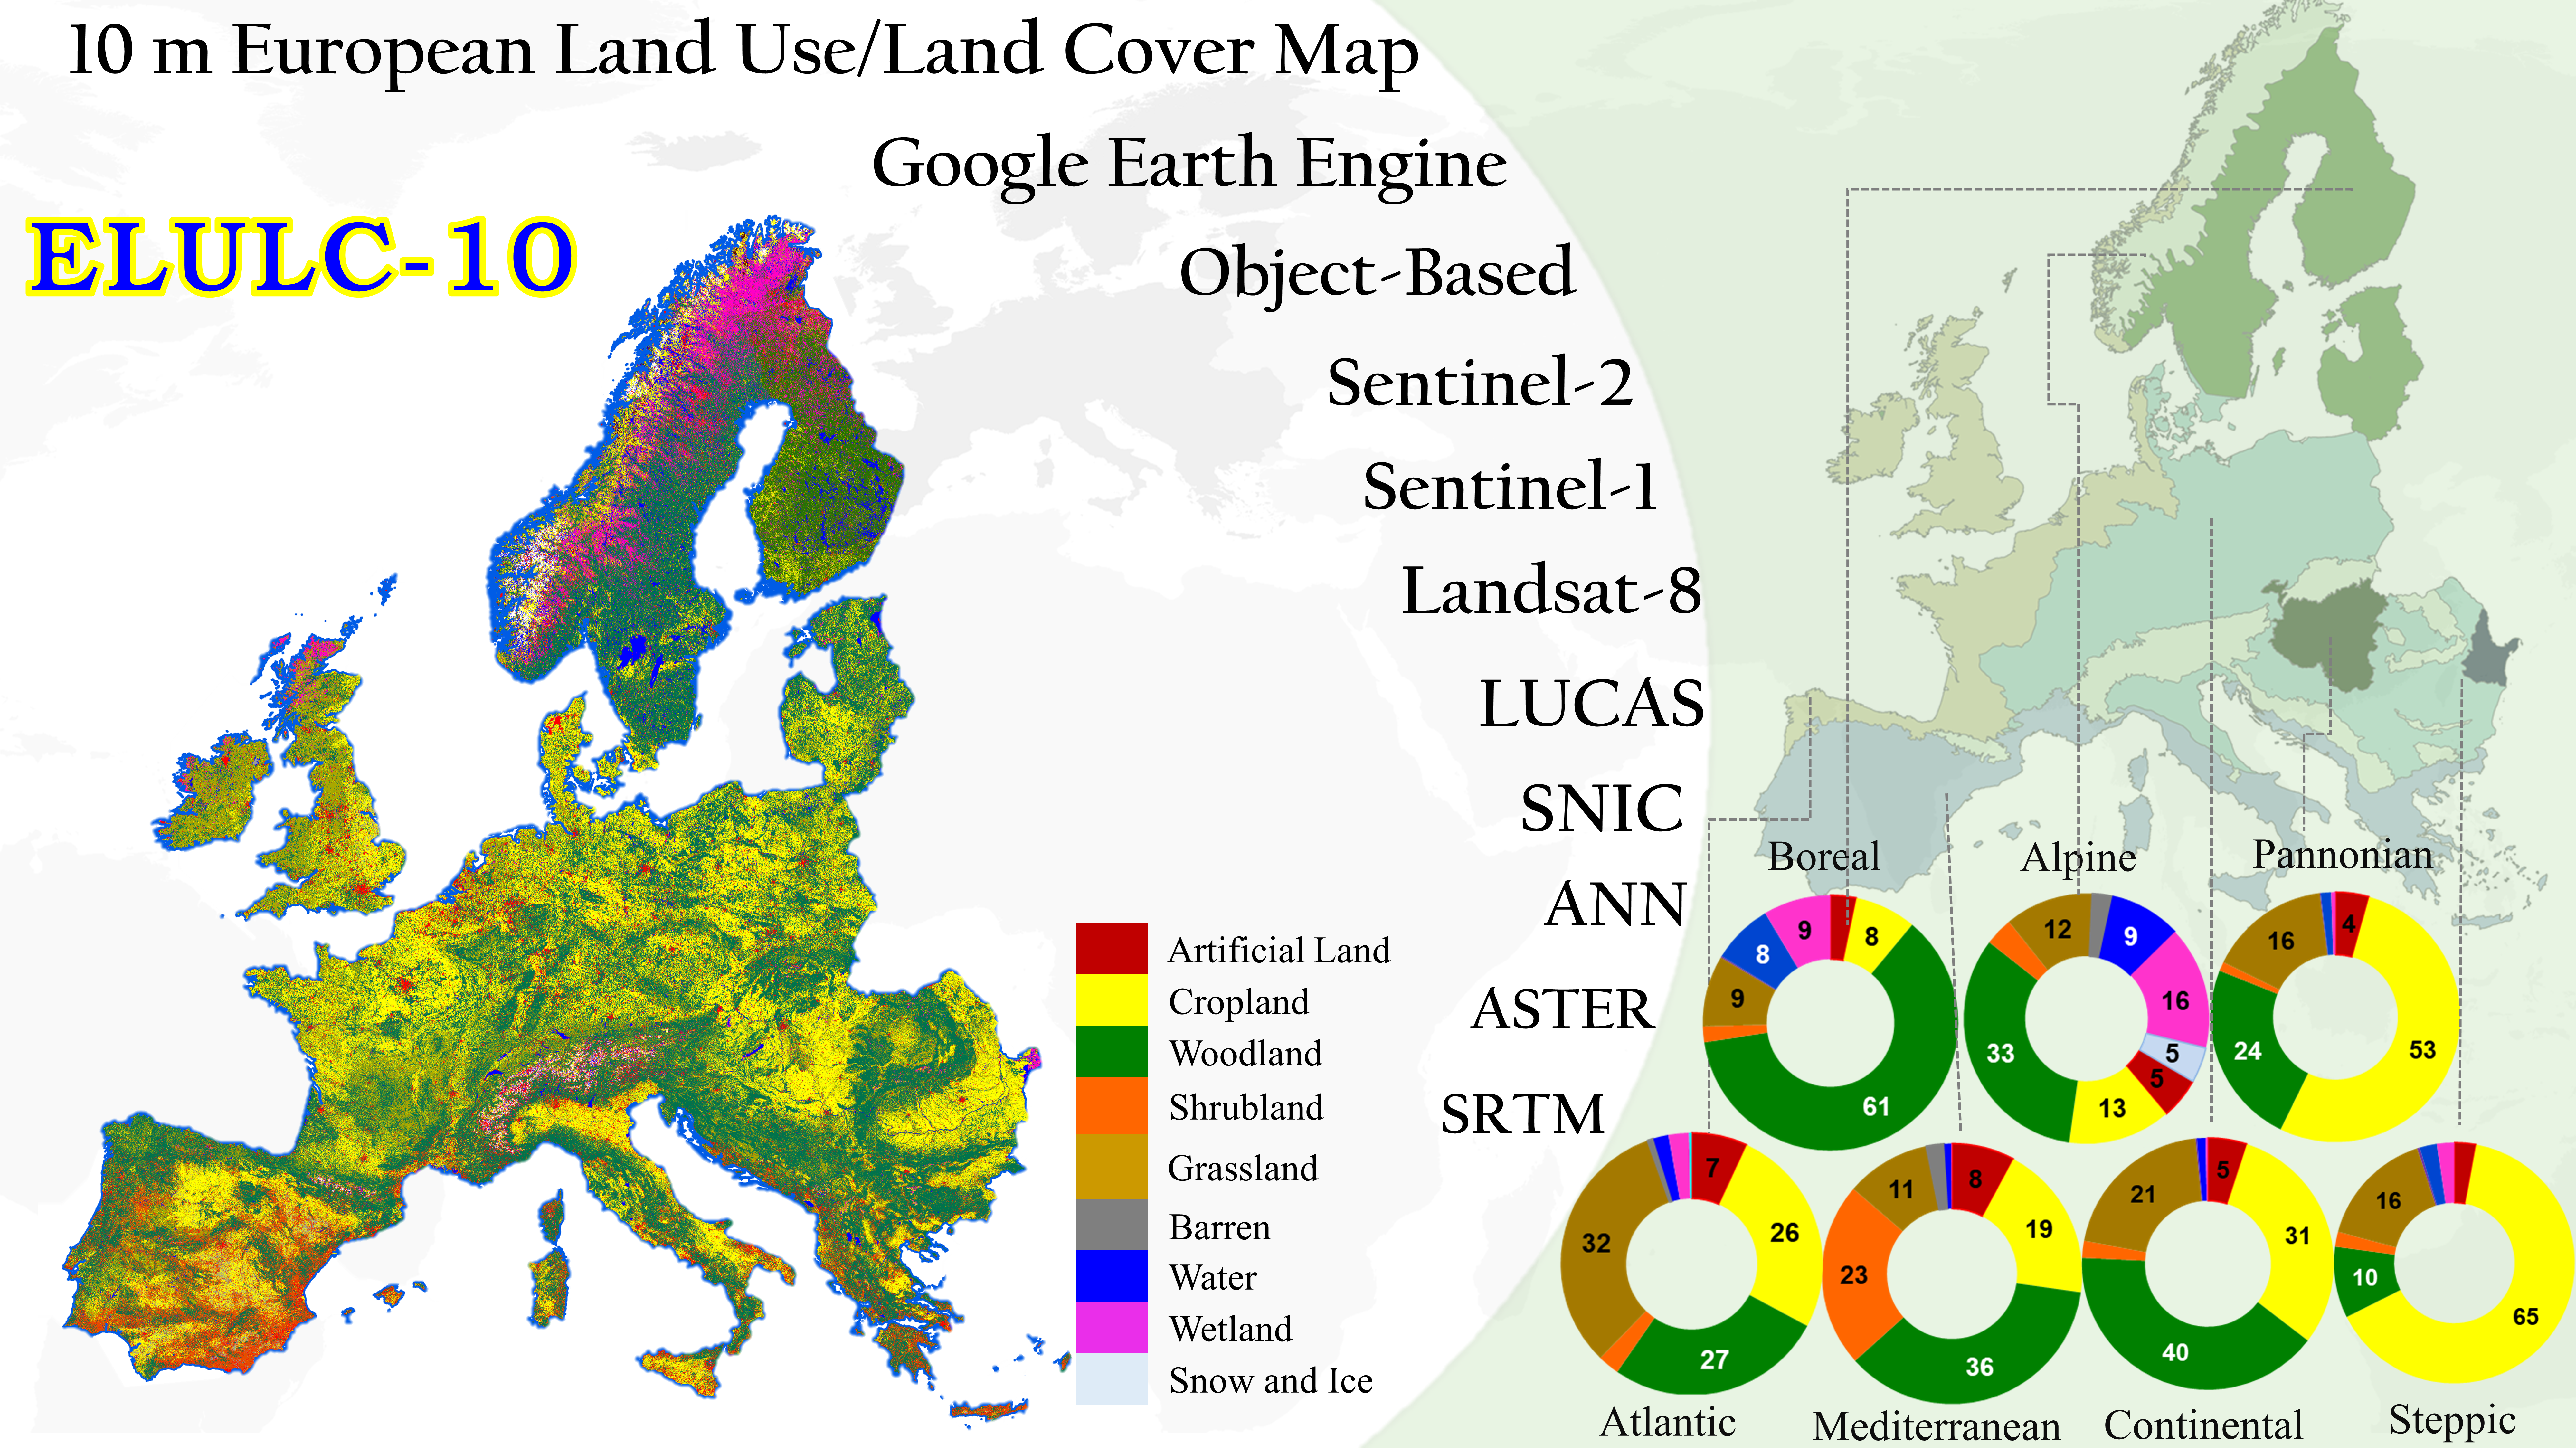
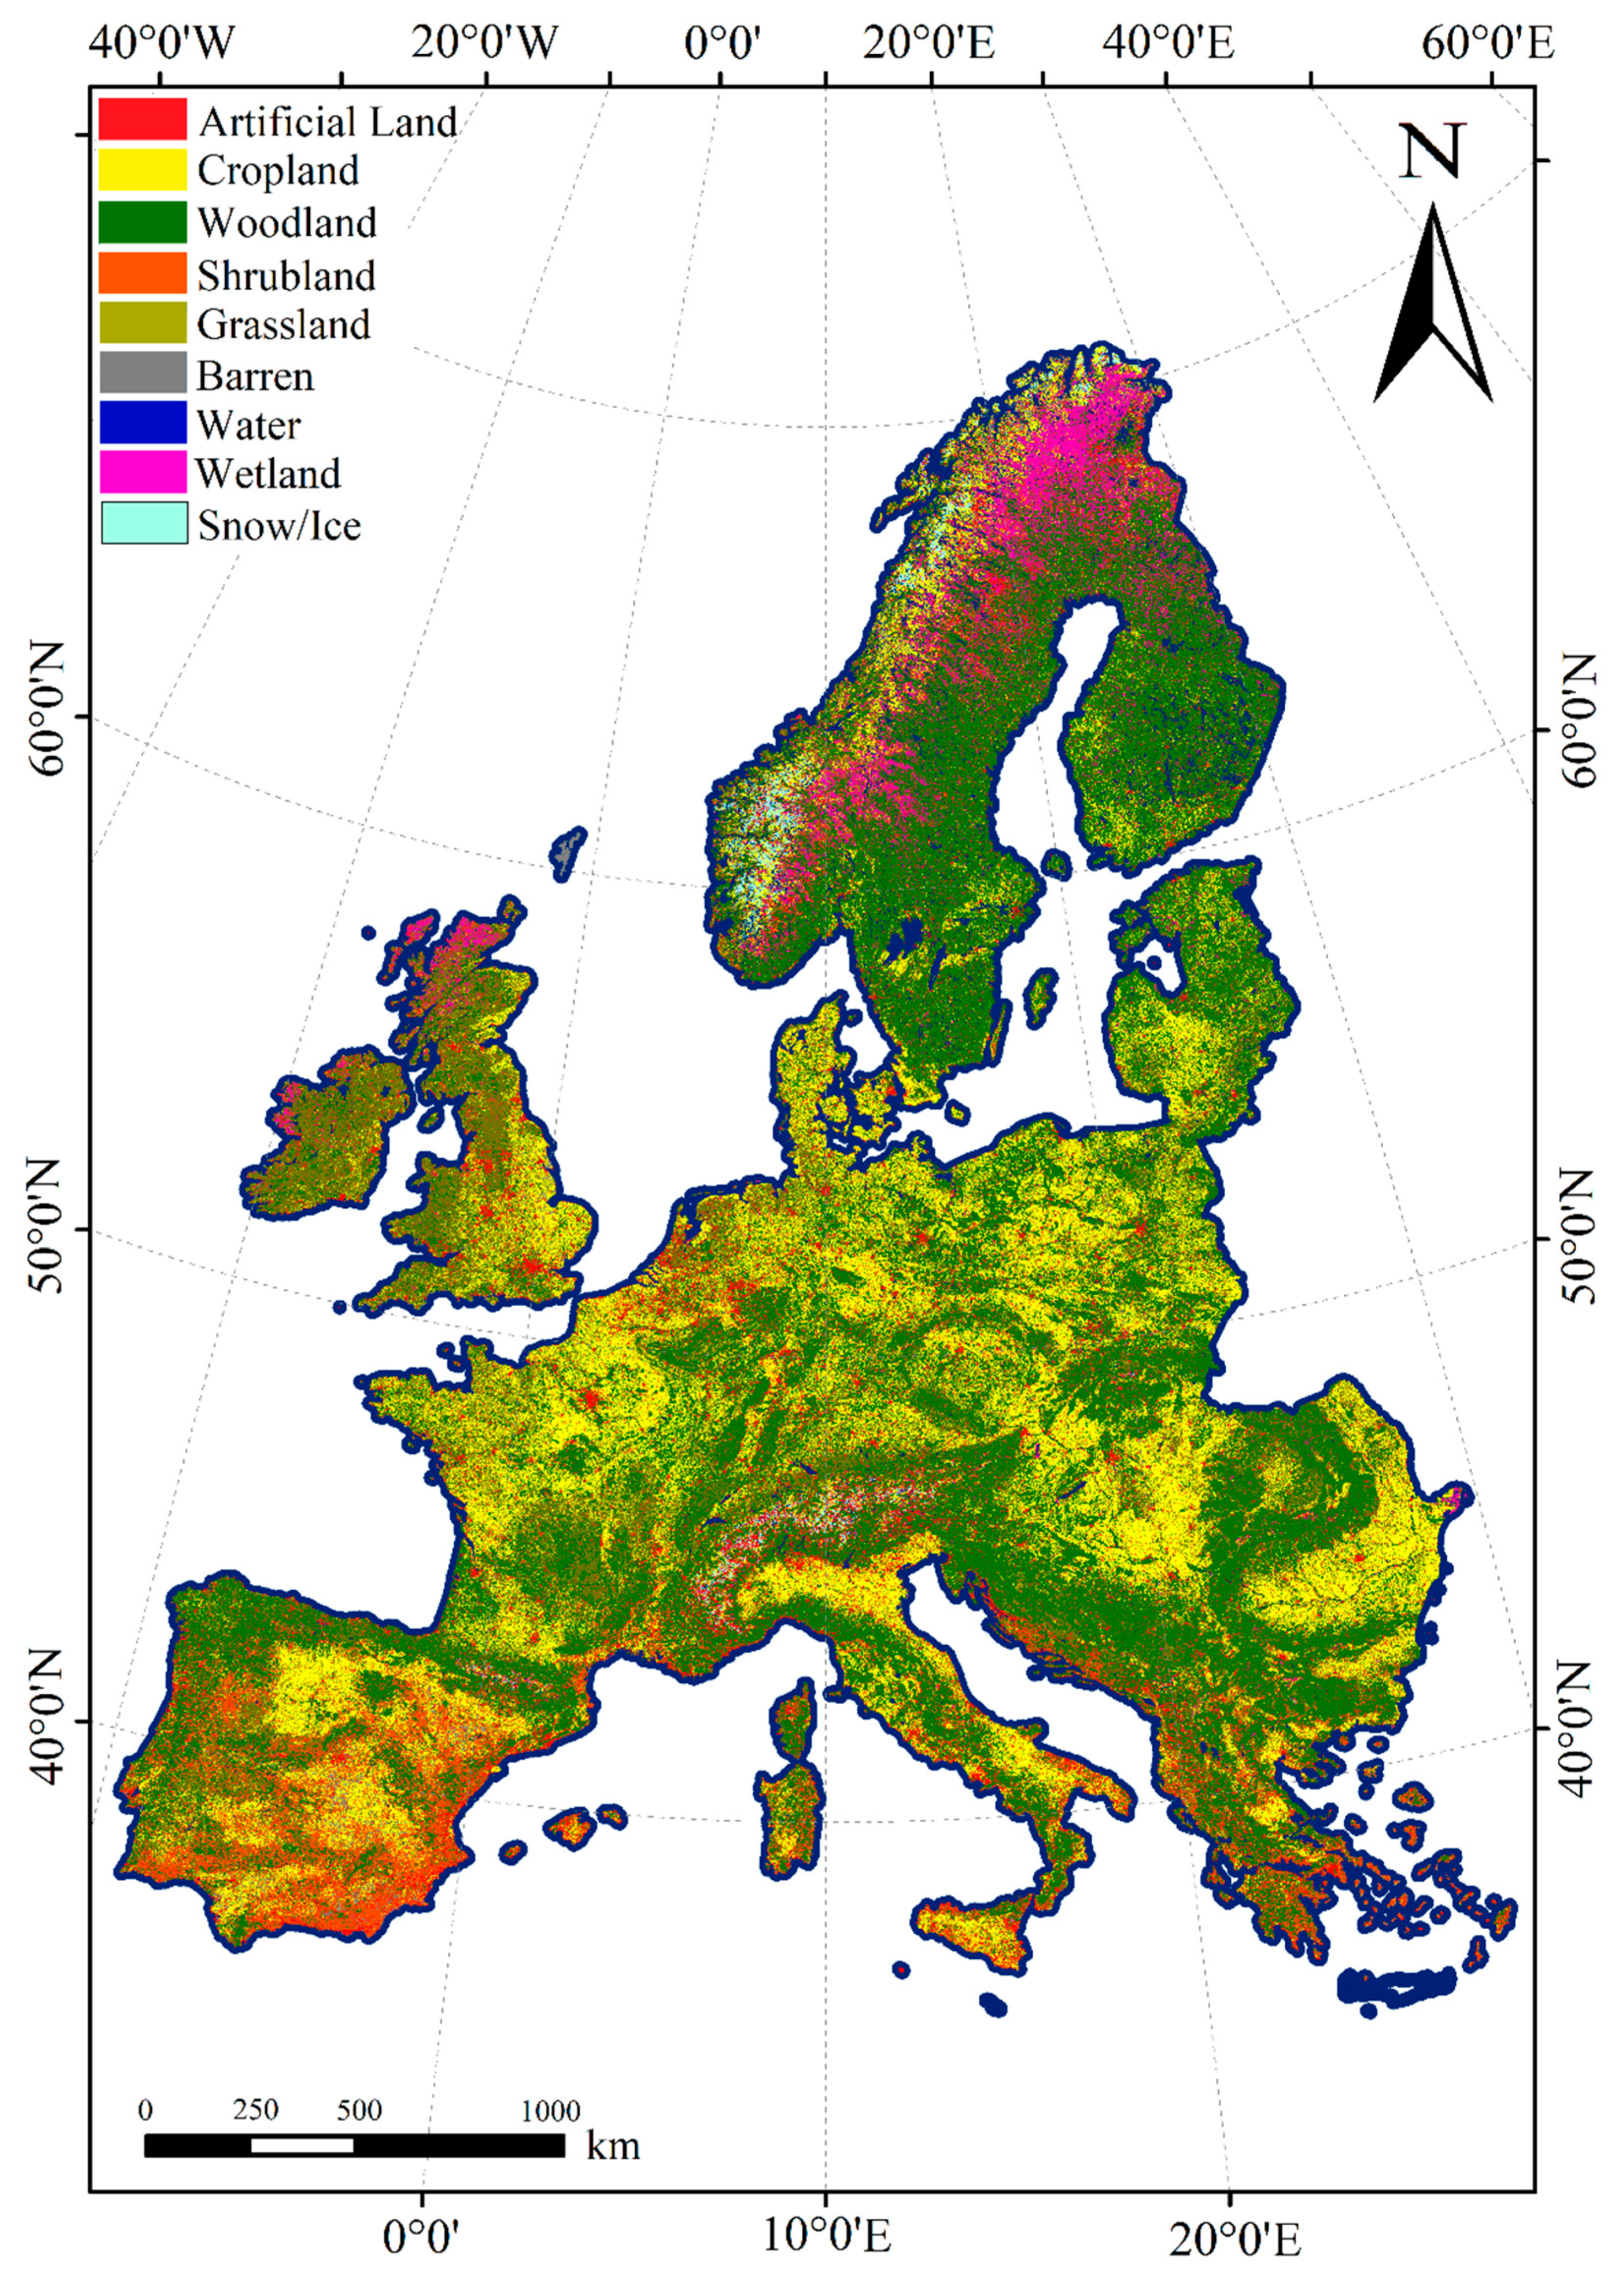
ELULC-10, a 10 m European Land Use and Land Cover Map Using Sentinel and Landsat Data in Google Earth Engine

 ,
,  ,
,  ,
,  ,
,  ,
,
Abstract
:
1. Introduction
- We integrated all Sentinel-1/2 and Landsat-8 images since 2016 to highly leverage spectral information and backscattering signals for generating a rich training model. Additionally, a data preparation procedure for the LUCAS dataset was proposed to avoid uncertainties and misclassifications in the final map. The repository also contained the provider raw data and previous studies’ refined LUCAS data to exploit available reference samples thoroughly.
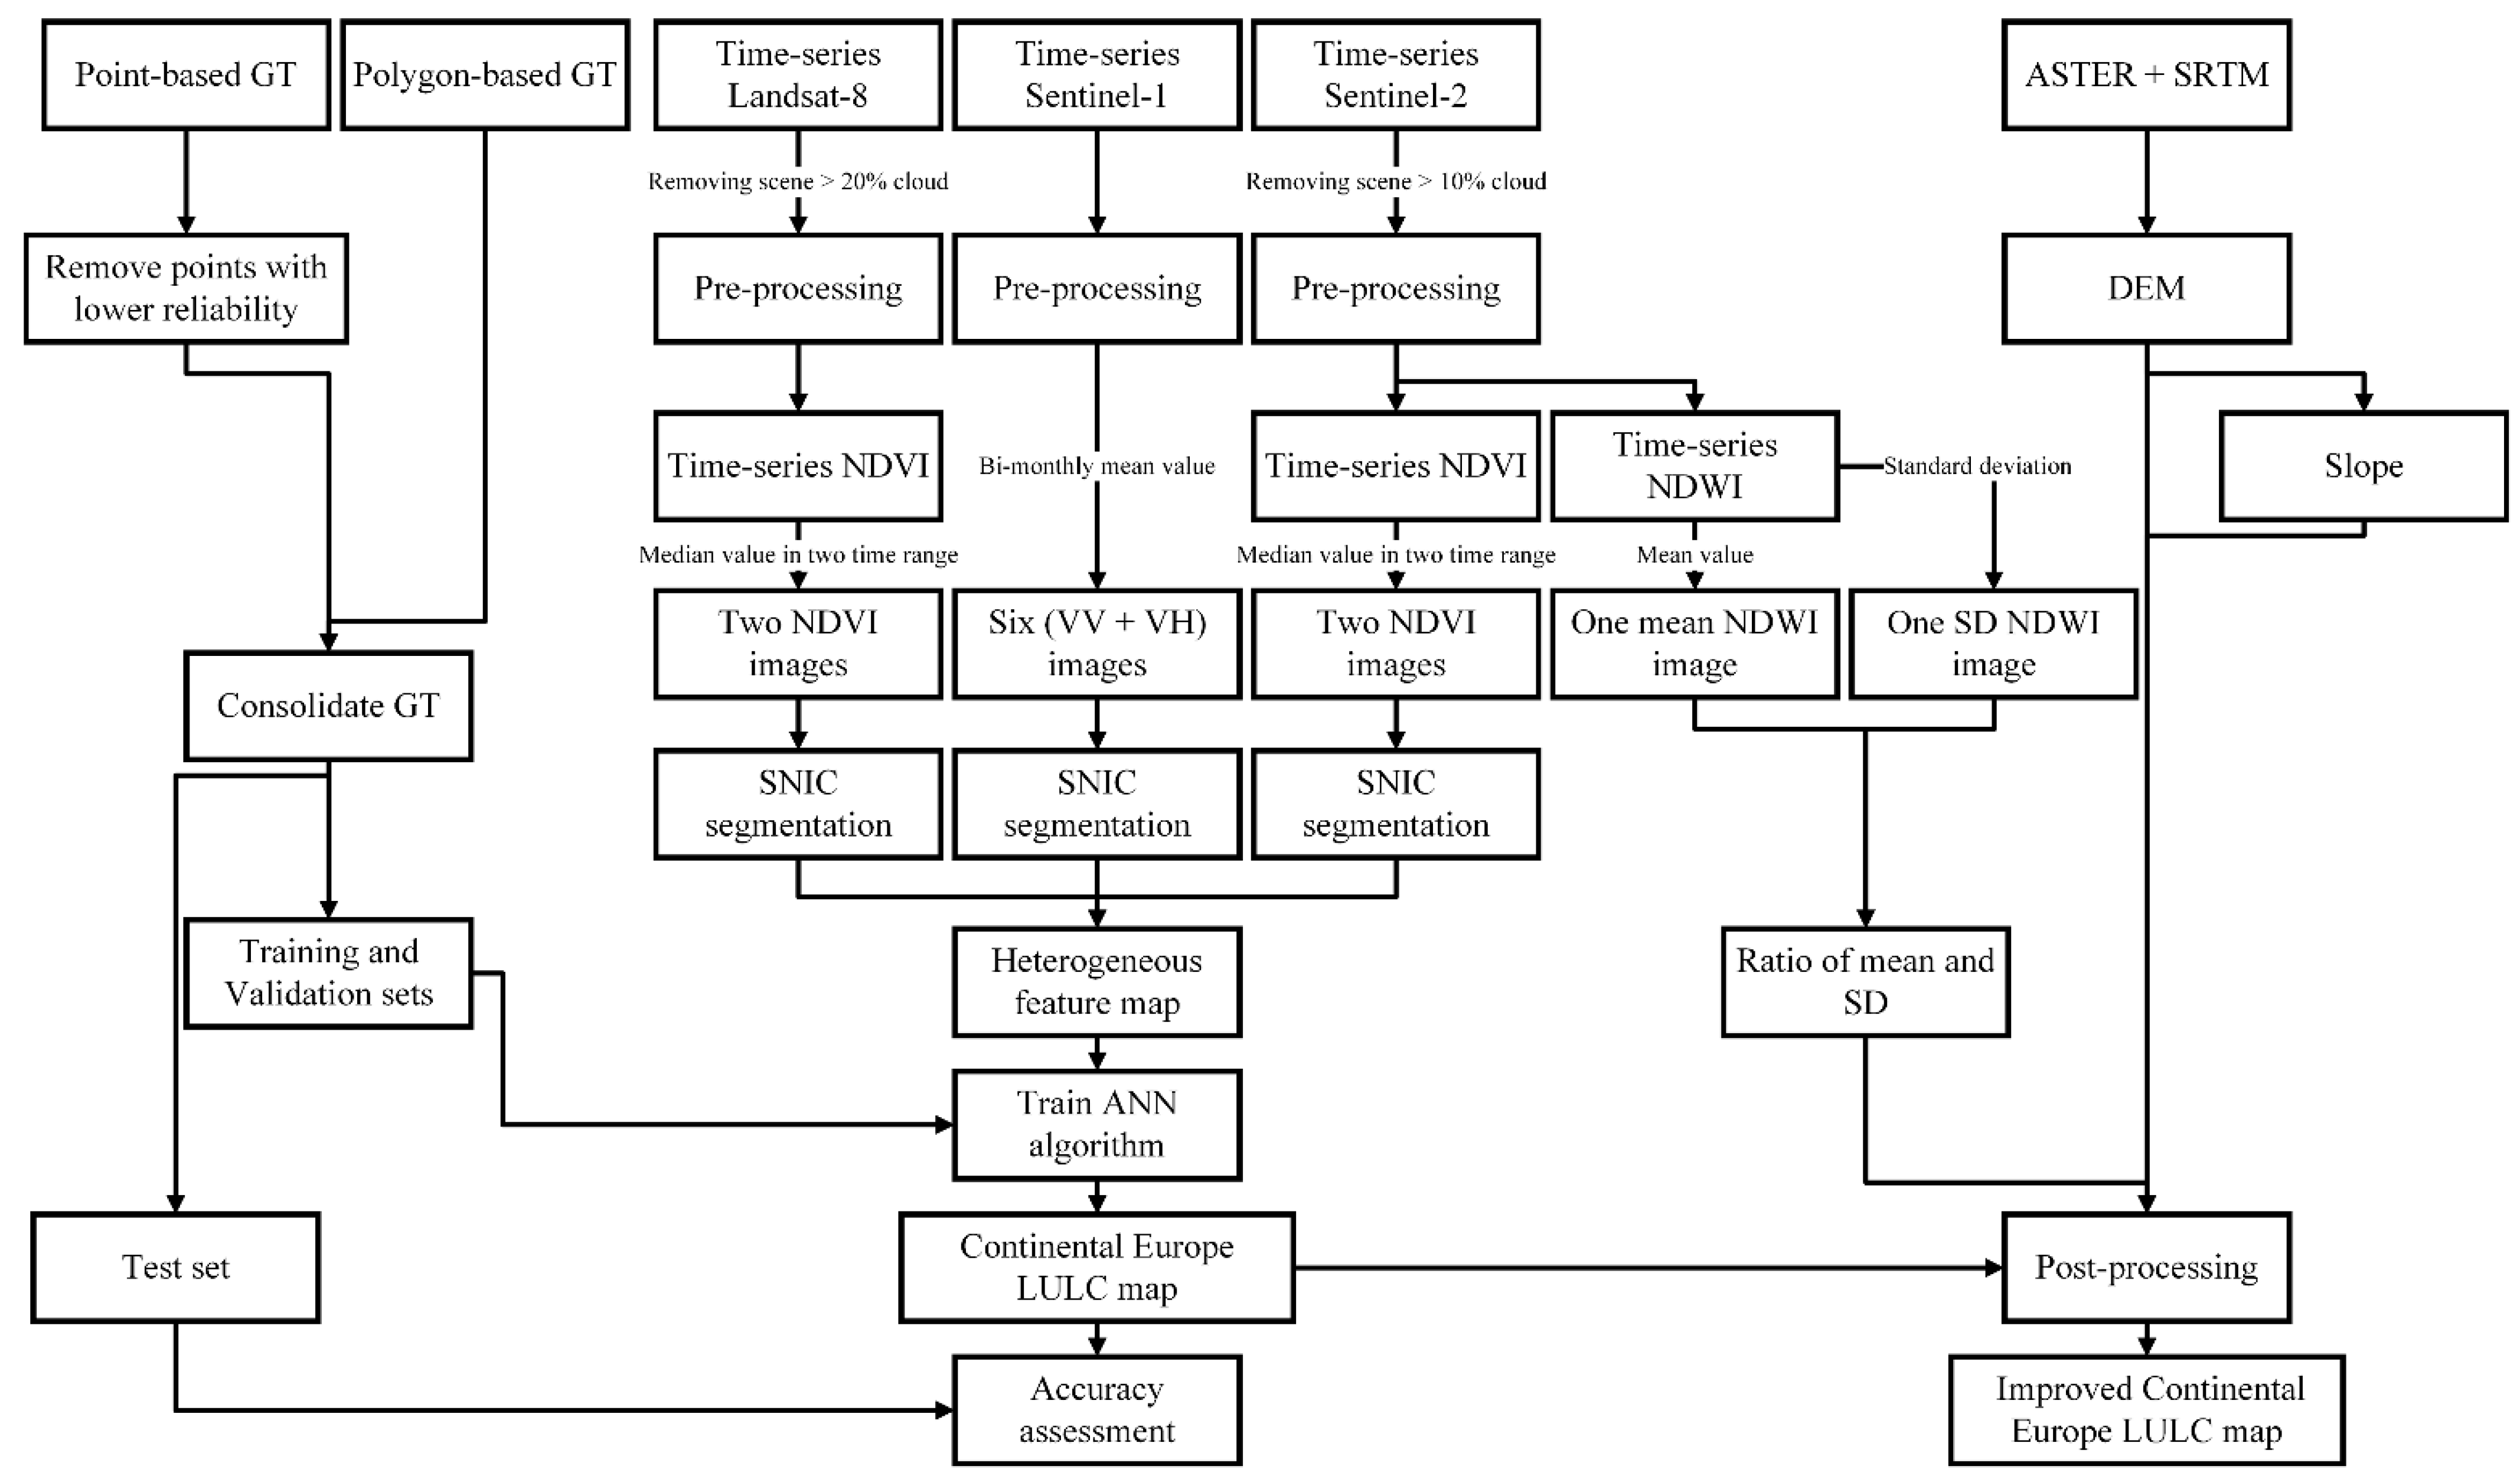
- A heterogenous feature map was generated from three segmented images extracted from Sentinel-1/2 and Landsat-8 features using the SNIC algorithm to reduce the usual LULC mapping noises and enhance the reliability of the final LULC map. The heterogeneous feature map was created using an NDVI time series of Sentinel-2 and Landsat-8 images and bi-monthly VV/VH images of Sentinel-1 after the preprocessing of images.
- We tailored an object-based ANN model in a fully connected architecture to learn 16 input features of the heterogeneous feature map and training/validation datasets within the Google Colab. Afterwards, we implemented rule-based post-processing using the slope and water index to reduce the associated uncertainty and increase the accuracy of several classes through knowledge-based criteria.
2. Study Area and Data
2.1. Study Area
2.2. Datasets
2.2.1. Sentinel-1
2.2.2. Sentinel-2
2.2.3. Landsat-8
2.2.4. ASTER and SRTM
2.2.5. LUCAS Reference Data Repository
3. Methodology
3.1. Data Preparation
3.1.1. Satellite Data Preprocessing
3.1.2. Reference Samples Preparation
3.2. Segmentation
3.3. Classification
3.4. Post-Processing
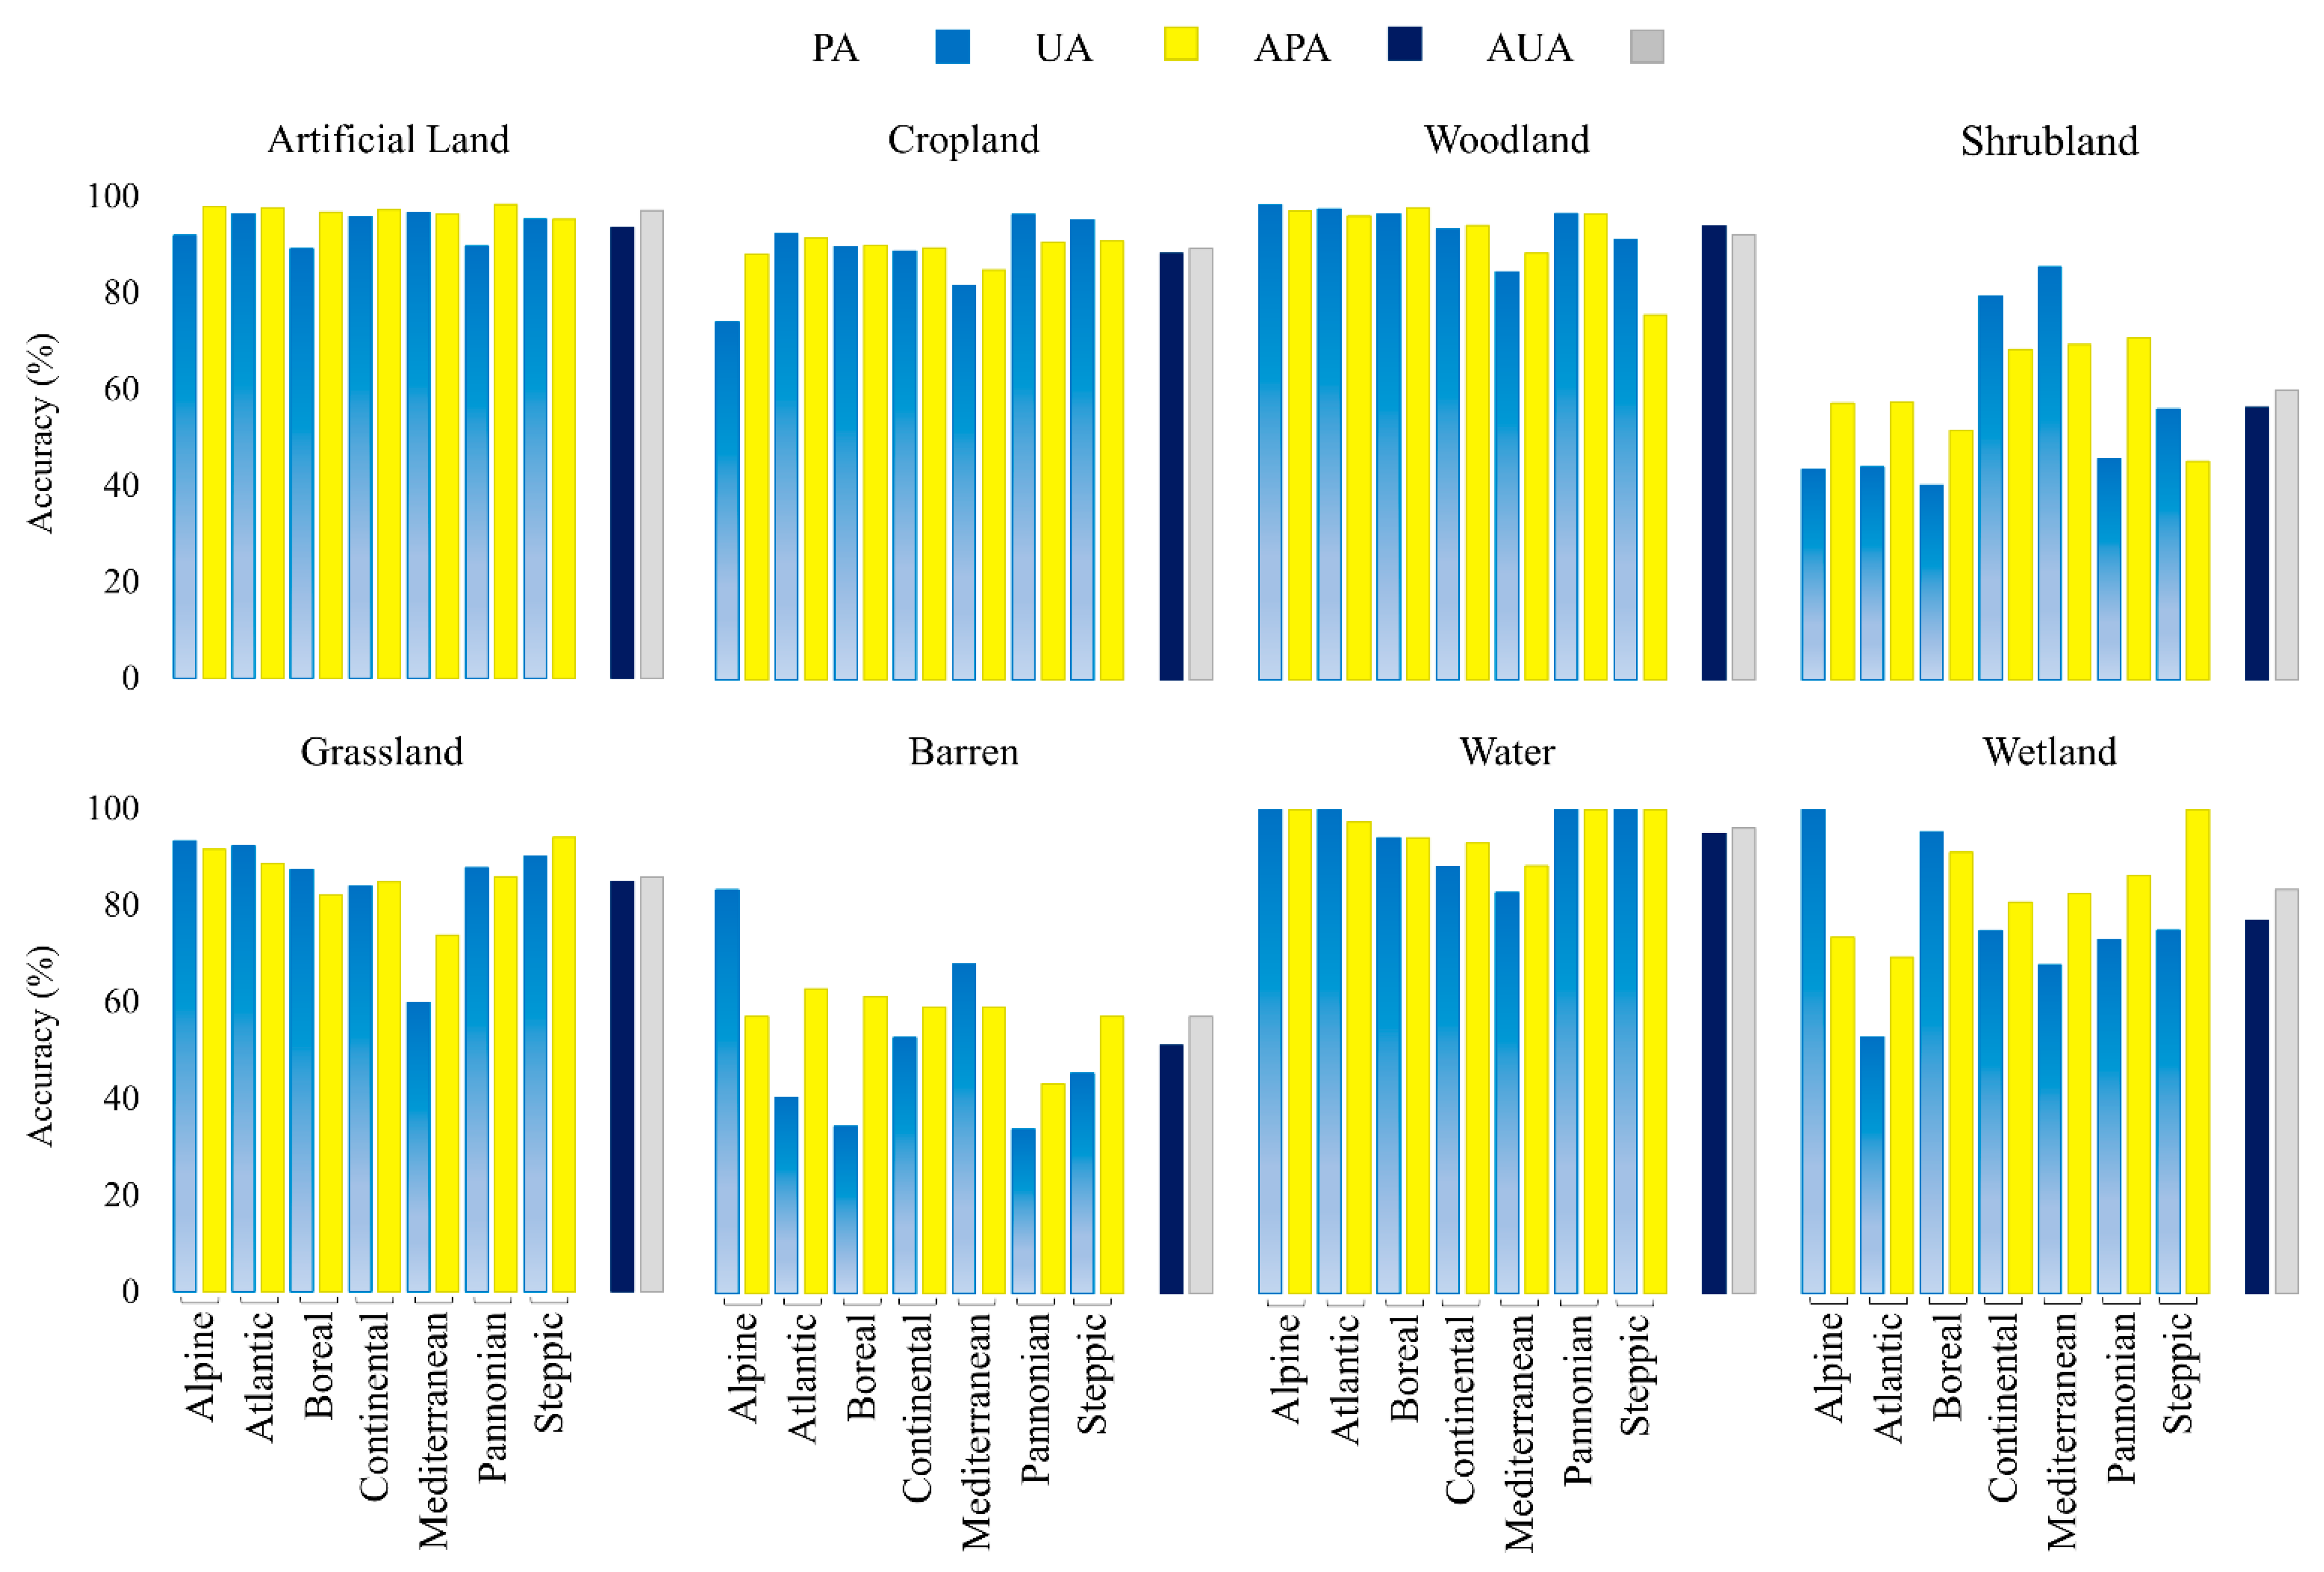
3.5. Accuracy Assessment
4. Results
5. Discussion
6. Conclusions
Author Contributions
Funding
Data Availability Statement
Conflicts of Interest
Appendix A

| ELULC-10 | ELC10 | GLC10 | Esri | ESA | S2GLC |
|---|---|---|---|---|---|
| Artificial land | Artificial land | Impervious | Built Area | Built-up | Artificial surfaces |
| Cropland | Cropland | Cropland | Crops | Cropland | - Cultivated areas - Vineyards |
| Woodland | Woodland | Forest | Trees | Tree cover | - Broadleaf tree cover - Coniferous tree cover |
| Shrubland | Shrubland | Shrubland | Scrub/shrub | Shrubland | Sclerophyllous vegetation |
| Grassland | Grassland | - Grassland - Tundra | Grass | Grassland | - Herbaceous vegetation - Moors and heathland |
| Barren | Bare land | Barren | Bare ground | - Bare/sparse vegetation - Moss and lichen | Natural material surfaces |
| Water | Water | Water | Water | Permanent water bodies | Water bodies |
| Wetlands | Wetland | Wetland | Flooded vegetation | - Herbaceous wetland - Mangroves | - Marshes - Peatbogs |
| Snow/Ice | Water | Snow/ice | Snow/Ice | Snow and ice | Permanent snow cover |
| Clouds | Surfaces permanently covered by cloud |
References
- Pham, H.M.; Yamaguchi, Y.; Bui, T.Q. A case study on the relation between city planning and urban growth using remote sensing and spatial metrics. Landsc. Urban Plan. 2011, 100, 223–230. [Google Scholar] [CrossRef]
- Coutts, A.M.; Harris, R.J.; Phan, T.; Livesley, S.J.; Williams, N.S.G.; Tapper, N.J. Thermal infrared remote sensing of urban heat: Hotspots, vegetation, and an assessment of techniques for use in urban planning. Remote Sens. Environ. 2016, 186, 637–651. [Google Scholar] [CrossRef]
- Wellmann, T.; Lausch, A.; Andersson, E.; Knapp, S.; Cortinovis, C.; Jache, J.; Scheuer, S.; Kremer, P.; Mascarenhas, A.; Kraemer, R.; et al. Remote sensing in urban planning: Contributions towards ecologically sound policies? Landsc. Urban Plan. 2020, 204, 103921. [Google Scholar] [CrossRef]
- Cavalli, R.M.; Laneve, G.; Fusilli, L.; Pignatti, S.; Santini, F. Remote sensing water observation for supporting Lake Victoria weed management. J. Environ. Manag. 2009, 90, 2199–2211. [Google Scholar] [CrossRef]
- Muzirafuti, A.; Boualoul, M.; Barreca, G.; Allaoui, A.; Bouikbane, H.; Lanza, S.; Crupi, A.; Randazzo, G. Fusion of remote sensing and applied geophysics for sinkholes identification in Tabular Middle Atlas of Morocco (the Causse of El Hajeb): Impact on the protection of water resource. Resources 2020, 9, 51. [Google Scholar] [CrossRef]
- Bock, M.; Rossner, G.; Wissen, M.; Remm, K.; Langanke, T.; Lang, S.; Klug, H.; Blaschke, T.; Vrščaj, B. Spatial indicators for nature conservation from European to local scale. Ecol. Indic. 2005, 5, 322–338. [Google Scholar] [CrossRef]
- Díaz-Delgado, R.; Hurford, C.; Lucas, R. Introducing the Book “The Roles of Remote Sensing in Nature Conservation.”. In The Roles of Remote Sensing in Nature Conservation; Springer International Publishing: Berlin/Heidelberg, Germany, 2017; pp. 3–10. [Google Scholar]
- Winkler, K.; Fuchs, R.; Rounsevell, M.; Herold, M. Global land use changes are four times greater than previously estimated. Nat. Commun. 2021, 12, 2501. [Google Scholar] [CrossRef]
- Colwell, R.N. Remote sensing of natural resources. Sci. Am. JSTOR 1968, 218, 54–71. [Google Scholar] [CrossRef]
- Morales-Barquero, L.; Lyons, M.B.; Phinn, S.R.; Roelfsema, C.M. Trends in remote sensing accuracy assessment approaches in the context of natural resources. Remote Sens. 2019, 11, 2305. [Google Scholar] [CrossRef] [Green Version]
- Camalan, S.; Cui, K.; Pauca, V.P.; Alqahtani, S.; Silman, M.; Chan, R.; Plemmons, R.J.; Dethier, E.N.; Fernandez, L.E.; Lutz, D.A. Change Detection of Amazonian Alluvial Gold Mining Using Deep Learning and Sentinel-2 Imagery. Remote Sens. 2022, 14, 1746. [Google Scholar] [CrossRef]
- Nagendra, H. Using remote sensing to assess biodiversity. Int. J. Remote Sens. 2001, 22, 2377–2400. [Google Scholar] [CrossRef]
- Vogeler, J.C.; Yang, Z.; Cohen, W.B. Mapping post-fire habitat characteristics through the fusion of remote sensing tools. Remote Sens. Environ. 2016, 173, 294–303. [Google Scholar] [CrossRef]
- Mikula, K.; Šibíková, M.; Ambroz, M.; Kollár, M.; Ožvat, A.A.; Urbán, J.; Jarolímek, I.; Šibík, J. Naturasat—a software tool for identification, monitoring and evaluation of habitats by remote sensing techniques. Remote Sens. 2021, 13, 3381. [Google Scholar] [CrossRef]
- Pinter, P.J.; Hatfield, J.L.; Schepers, J.S.; Barnes, E.M.; Moran, M.S.; Daughtry, C.S.T.; Upchurch, D.R. Remote Sensing for Crop Management. Photogramm. Eng. Remote Sens. 2003, 69, 647–664. [Google Scholar] [CrossRef] [Green Version]
- Bégué, A.; Arvor, D.; Bellon, B.; Betbeder, J.; de Abelleyra, D.; Ferraz, R.P.D.; Lebourgeois, V.; Lelong, C.; Simões, M.; Verón, S.R. Remote sensing and cropping practices: A review. Remote Sens. 2018, 10, 99. [Google Scholar] [CrossRef] [Green Version]
- d’Andrimont, R.; Verhegghen, A.; Lemoine, G.; Kempeneers, P.; Meroni, M.; van der Velde, M. From parcel to continental —A first European crop type map based on Sentinel-1 and LUCAS Copernicus in-situ observations. Remote Sens. Environ. 2021, 266, 112708. [Google Scholar] [CrossRef]
- Pflugmacher, D.; Rabe, A.; Peters, M.; Hostert, P. Mapping pan-European land cover using Landsat spectral-temporal metrics and the European LUCAS survey. Remote Sens. Environ. 2019, 221, 583–595. [Google Scholar] [CrossRef]
- Malinowski, R.; Lewiński, S.; Rybicki, M.; Gromny, E.; Jenerowicz, M.; Krupiński, M.; Nowakowski, A.; Wojtkowski, C.; Krupiński, M.; Krätzschmar, E.; et al. Automated production of a land cover/use map of europe based on sentinel-2 imagery. Remote Sens. 2020, 12, 3523. [Google Scholar] [CrossRef]
- Gong, P.; Liu, H.; Zhang, M.; Li, C.; Wang, J.; Huang, H.; Clinton, N.; Ji, L.; Li, W.; Bai, Y.; et al. Stable classification with limited sample: Transferring a 30-m resolution sample set collected in 2015 to mapping 10-m resolution global land cover in 2017. Sci. Bull. 2019, 64, 370–373. [Google Scholar] [CrossRef] [Green Version]
- Immitzer, M.; Vuolo, F.; Atzberger, C. First experience with Sentinel-2 data for crop and tree species classifications in central Europe. Remote Sens. 2016, 8, 166. [Google Scholar] [CrossRef]
- Clerici, N.; Valbuena Calderón, C.A.; Posada, J.M. Fusion of sentinel-1a and sentinel-2A data for land cover mapping: A case study in the lower Magdalena region, Colombia. J. Maps 2017, 13, 718–726. [Google Scholar] [CrossRef] [Green Version]
- Abdi, A.M. Land cover and land use classification performance of machine learning algorithms in a boreal landscape using Sentinel-2 data. GIScience Remote Sens. 2020, 57, 1–20. [Google Scholar] [CrossRef] [Green Version]
- Tsendbazar, N.; Herold, M.; Li, L.; Tarko, A.; de Bruin, S.; Masiliunas, D.; Lesiv, M.; Fritz, S.; Buchhorn, M.; Smets, B.; et al. Towards operational validation of annual global land cover maps. Remote Sens. Environ. 2021, 266, 112686. [Google Scholar] [CrossRef]
- Venter, Z.S.; Sydenham, M.A.K. Continental-scale land cover mapping at 10 m resolution over europe (Elc10). Remote Sens. 2021, 13, 2301. [Google Scholar] [CrossRef]
- Karra, K.; Kontgis, C.; Statman-Weil, Z.; Mazzariello, J.C.; Mathis, M.; Brumby, S.P. Global land use/land cover with Sentinel 2 and deep learning. In Proceedings of the 2021 IEEE International Geoscience and Remote Sensing Symposium IGARSS, Brussels, Belgium, 11–16 July 2021; pp. 4704–4707. [Google Scholar]
- Fuller, R.M.; Groom, G.B.; Jones, A.R. The land cover map of Great Britain: An automated classification of Landsat thematic mapper data. Photogramm. Eng. Remote Sens. 1994, 60, 553–562. [Google Scholar]
- Hansen, M.C.; Loveland, T.R. A review of large area monitoring of land cover change using Landsat data. Remote Sens. Environ. 2012, 122, 66–74. [Google Scholar] [CrossRef]
- Potapov, P.; Hansen, M.C.; Kommareddy, I.; Kommareddy, A.; Turubanova, S.; Pickens, A.; Adusei, B.; Tyukavina, A.; Ying, Q. Landsat analysis ready data for global land cover and land cover change mapping. Remote Sens. 2020, 12, 426. [Google Scholar] [CrossRef] [Green Version]
- Gong, P.; Wang, J.; Yu, L.; Zhao, Y.; Zhao, Y.; Liang, L.; Niu, Z.; Huang, X.; Fu, H.; Liu, S.; et al. Finer resolution observation and monitoring of global land cover: First mapping results with Landsat TM and ETM+ data. Int. J. Remote Sens. 2013, 34, 2607–2654. [Google Scholar] [CrossRef] [Green Version]
- Andres, L.; Salas, W.A.; Skole, D. Fourier analysis of multi-temporal AVHRR data applied to a land cover classification. Int. J. Remote Sens. 1994, 15, 1115–1121. [Google Scholar] [CrossRef]
- Ali, S.; Henchiri, M.; Sha, Z.; Wilson, K.; Yun, B.; Yao, F.; Zhang, J. A time series of land cover maps of South Asia from 2001 to 2015 generated using AVHRR GIMMS NDVI3g data. Environ. Sci. Pollut. Res. 2020, 27, 20309–20320. [Google Scholar] [CrossRef]
- Thenkabail, P.S.; GangadharaRao, P.; Biggs, T.W.; Krishna, M.; Turral, H. Spectral matching techniques to determine historical Land-use/Land-cover (LULC) and irrigated areas using time-series 0.1-degree AVHRR pathfinder datasets. Photogramm. Eng. Remote Sens. 2007, 73, 1029–1040. [Google Scholar]
- Strahler, A.; Muchoney, D.; Jordan, B.; Friedl, M.; Gopal, S.; Lambin, E.; Moody, A. MODIS Land Cover Product Algorithm Theoretical Basis Document (ATBD) MODIS Land Cover and Land-Cover Change. MODIS Doc. 1999, 42, 47. [Google Scholar]
- Friedl, M.A.; McIver, D.K.; Hodges, J.C.F.; Zhang, X.Y.; Muchoney, D.; Strahler, A.H.; Woodcock, C.E.; Gopal, S.; Schneider, A.; Cooper, A.; et al. Global land cover mapping from MODIS: Algorithms and early results. Remote Sens. Environ. 2002, 83, 287–302. [Google Scholar] [CrossRef]
- Sulla-Menashe, D.; Gray, J.M.; Abercrombie, S.P.; Friedl, M.A. Hierarchical mapping of annual global land cover 2001 to present: The MODIS Collection 6 Land Cover product. Remote Sens. Environ. 2019, 222, 183–194. [Google Scholar] [CrossRef]
- Amani, M.; Brisco, B.; Afshar, M.; Mirmazloumi, S.M.; Mahdavi, S.; Mirzadeh, S.M.J.; Huang, W.; Granger, J. A generalized supervised classification scheme to produce provincial wetland inventory maps: An application of Google Earth Engine for big geo data processing. Big Earth Data 2019, 3, 378–394. [Google Scholar] [CrossRef]
- Gorelick, N.; Hancher, M.; Dixon, M.; Ilyushchenko, S.; Thau, D.; Moore, R. Google Earth Engine: Planetary-scale geospatial analysis for everyone. Remote Sens. Environ. 2017, 202, 18–27. [Google Scholar] [CrossRef]
- Amani, M.; Ghorbanian, A.; Ahmadi, S.A.; Kakooei, M.; Moghimi, A.; Mirmazloumi, S.M.; Moghaddam, S.H.A.; Mahdavi, S.; Ghahremanloo, M.; Parsian, S.; et al. Google Earth Engine Cloud Computing Platform for Remote Sensing Big Data Applications: A Comprehensive Review. IEEE J. Sel. Top. Appl. Earth Obs. Remote Sens. 2020, 13, 5326–5350. [Google Scholar] [CrossRef]
- Kumar, L.; Mutanga, O. Google Earth Engine applications since inception: Usage, trends, and potential. Remote Sens. 2018, 10, 1509. [Google Scholar] [CrossRef] [Green Version]
- Tamiminia, H.; Salehi, B.; Mahdianpari, M.; Quackenbush, L.; Adeli, S.; Brisco, B. Google Earth Engine for geo-big data applications: A meta-analysis and systematic review. ISPRS J. Photogramm. Remote Sens. 2020, 164, 152–170. [Google Scholar] [CrossRef]
- Li, Q.; Qiu, C.; Ma, L.; Schmitt, M.; Zhu, X.X. Mapping the land cover of africa at 10 m resolution from multi-source remote sensing data with google earth engine. Remote Sens. 2020, 12, 602. [Google Scholar] [CrossRef] [Green Version]
- Ghorbanian, A.; Kakooei, M.; Amani, M.; Mahdavi, S.; Mohammadzadeh, A.; Hasanlou, M. Improved land cover map of Iran using Sentinel imagery within Google Earth Engine and a novel automatic workflow for land cover classification using migrated training samples. ISPRS J. Photogramm. Remote Sens. 2020, 167, 276–288. [Google Scholar] [CrossRef]
- Land-cover maps of Europe from the Cloud. Available online: https://www.esa.int/Applications/Observing_the_Earth/Copernicus/Sentinel-2/Land-cover_maps_of_Europe_from_the_Cloud#.YLIADWazCxU.link (accessed on 30 May 2022).
- In Proceedings of the ESA 2017 WorldCover Conference, Frascati, Italy, 14–16 March 2017. Available online: http://worldcover2017.esa.int/ (accessed on 30 May 2022).
- Zanaga, D.; Van De Kerchove, R.; De Keersmaecker, W.; Souverijns, N.; Brockmann, C.; Quast, R.; Wevers, J.; Grosu, A.; Paccini, A.; Vergnaud, S.; et al. ESA WorldCover 10 m 2020 v100. Zenodo. 2021. Available online: https://zenodo.org/record/5571936#.YrV38HZByUk (accessed on 30 May 2022).
- Buchhorn, M.; Bertels, L.; Smets, B.; De Roo, B.; Lesiv, M.; Tsendbazar, N.E.; Masiliunas, D.; Li, L. Copernicus Global Land Service: Land Cover 100m: Version 3 Globe 2015-2019: Algorithm Theoretical Basis Document; ESA: Paris, France, 2020. [Google Scholar]
- Verde, N.; Kokkoris, I.P.; Georgiadis, C.; Kaimaris, D.; Dimopoulos, P.; Mitsopoulos, I.; Mallinis, G. National scale land cover classification for ecosystem services mapping and assessment, using multitemporal copernicus EO data and google earth engine. Remote Sens. 2020, 12, 3303. [Google Scholar] [CrossRef]
- Gounaridis, D.; Apostolou, A.; Koukoulas, S. Land cover of Greece, 2010: A semi-automated classification using random forests. J. Maps 2016, 12, 1055–1062. [Google Scholar] [CrossRef]
- Inglada, J.; Vincent, A.; Arias, M.; Tardy, B.; Morin, D.; Rodes, I. Operational High Resolution Land Cover Map Production at the Country Scale Using Satellite Image Time Series. Remote Sens. 2017, 9, 95. [Google Scholar] [CrossRef] [Green Version]
- Mack, B.; Leinenkugel, P.; Kuenzer, C.; Dech, S. A semi-automated approach for the generation of a new land use and land cover product for Germany based on Landsat time-series and Lucas in-situ data. Remote Sens. Lett. 2017, 8, 244–253. [Google Scholar] [CrossRef]
- Congedo, L.; Sallustio, L.; Munafò, M.; Ottaviano, M.; Tonti, D.; Marchetti, M. Copernicus high-resolution layers for land cover classification in Italy. J. Maps 2016, 12, 1195–1205. [Google Scholar] [CrossRef] [Green Version]
- De Fioravante, P.; Strollo, A.; Assennato, F.; Marinosci, I.; Congedo, L.; Munafò, M. High resolution land cover integrating copernicus products: A 2012–2020 map of Italy. Land 2022, 11, 35. [Google Scholar] [CrossRef]
- Van Tricht, K.; Gobin, A.; Gilliams, S.; Piccard, I. Synergistic use of radar sentinel-1 and optical sentinel-2 imagery for crop mapping: A case study for Belgium. Remote Sens. 2018, 10, 1642. [Google Scholar] [CrossRef] [Green Version]
- Fritz, S.; See, L.; Mccallum, I.; You, L.; Bun, A.; Moltchanova, E.; Duerauer, M.; Albrecht, F.; Schill, C.; Perger, C.; et al. Mapping global cropland and field size. Glob. Chang. Biol. 2015, 21, 1980–1992. [Google Scholar] [CrossRef]
- Cao, X.; Chen, X.H.; Zhang, W.W.; Liao, A.P.; Chen, L.J.; Chen, Z.G.; Chen, J. Global cultivated land mapping at 30 m spatial resolution. Sci. China Earth Sci. 2016, 59, 2275–2284. [Google Scholar] [CrossRef]
- Chen, J.; Chen, J.; Liao, A.; Cao, X.; Chen, L.; Chen, X.; He, C.; Han, G.; Peng, S.; Lu, M.; et al. Global land cover mapping at 30 m resolution: A POK-based operational approach. ISPRS J. Photogramm. Remote Sens. 2015, 103, 7–27. [Google Scholar] [CrossRef] [Green Version]
- Qu, L.; Chen, Z.; Li, M.; Zhi, J.; Wang, H. Accuracy improvements to pixel-based and object-based LULC classification with auxiliary datasets from google earth engine. Remote Sens. 2021, 13, 453. [Google Scholar] [CrossRef]
- Feizizadeh, B.; Omarzadeh, D.; Kazemi Garajeh, M.; Lakes, T.; Blaschke, T. Machine learning data-driven approaches for land use/cover mapping and trend analysis using Google Earth Engine. J. Environ. Plan. Manag. 2021. [Google Scholar] [CrossRef]
- Stromann, O.; Nascetti, A.; Yousif, O.; Ban, Y. Dimensionality Reduction and Feature Selection for Object-Based Land Cover Classification based on Sentinel-1 and Sentinel-2 Time Series Using Google Earth Engine. Remote Sens. 2020, 12, 76. [Google Scholar] [CrossRef] [Green Version]
- Tassi, A.; Vizzari, M. Object-oriented lulc classification in google earth engine combining snic, glcm, and machine learning algorithms. Remote Sens. 2020, 12, 3776. [Google Scholar] [CrossRef]
- Shafizadeh-Moghadam, H.; Khazaei, M.; Alavipanah, S.K.; Weng, Q. Google Earth Engine for large-scale land use and land cover mapping: An object-based classification approach using spectral, textural and topographical factors. GIScience Remote Sens. 2021, 58, 914–928. [Google Scholar] [CrossRef]
- EEA Land cover country fact sheets 2000–2018. Available online: https://www.eea.europa.eu/ds_resolveuid/03ba369bb3064fd1a77c8361ab4b0eed (accessed on 30 May 2022).
- Google Earth Engine Sentinel-1 Algorithms. Available online: https://developers.google.com/earth-engine/guides/sentinel1 (accessed on 30 May 2022).
- Abrams, M.; Crippen, R.; Fujisada, H. ASTER Global Digital Elevation Model (GDEM) and ASTER Global Water Body Dataset (ASTWBD). Remote Sens. 2020, 12, 1156. [Google Scholar] [CrossRef] [Green Version]
- Nikolakopoulos, K.G.; Kamaratakis, E.K.; Chrysoulakis, N. SRTM vs ASTER elevation products. Comparison for two regions in Crete, Greece. Int. J. Remote Sens. 2006, 27, 4819–4838. [Google Scholar] [CrossRef]
- Gallego, J. Fine scale profile of CORINE Land Cover classes with LUCAS data. In Building Agri-Environmental Indicators: Focussing on the European Area Frame Survey LUCAS; Institute for Environment and Sustainability JRC: Ispra, Italy, 2002; pp. 121–136. ISBN 92-894-4633-1. [Google Scholar]
- Büttner, G.; Maucha, G. The Thematic Accuracy of Corine Land Cover 2000. Assessment Using LUCAS (Land Use/Cover Area Frame Statistical Survey); European Environmental Agency: Copenhagen, Denmark, 2006. [Google Scholar]
- Gallego, J.; Bamps, C. Using CORINE land cover and the point survey LUCAS for area estimation. Int. J. Appl. Earth Obs. Geoinf. 2008, 10, 467–475. [Google Scholar] [CrossRef]
- Gallego, F.J. Validation of GIS layers in the EU: Getting adapted to available reference data. Int. J. Digit. Earth 2011, 4, 42–57. [Google Scholar] [CrossRef]
- Karydas, C.G.; Gitas, I.Z.; Kuntz, S.; Minakou, C. Use of LUCAS LC point database for validating country-scale land cover maps. Remote Sens. 2015, 7, 5012–5041. [Google Scholar] [CrossRef] [Green Version]
- Esch, T.; Metz, A.; Marconcini, M.; Keil, M. Combined use of multi-seasonal high and medium resolution satellite imagery for parcel-related mapping of cropland and grassland. Int. J. Appl. Earth Obs. Geoinf. 2014, 28, 230–237. [Google Scholar] [CrossRef]
- Leinenkugel, P.; Deck, R.; Huth, J.; Ottinger, M.; Mack, B. The potential of open geodata for automated large-scale land use and land cover classification. Remote Sens. 2019, 11, 2249. [Google Scholar] [CrossRef] [Green Version]
- E4.LUCAS (ESTAT). LUCAS 2018 (Land Use/Cover Area Frame Survey). 2018. Available online: https://ec.europa.eu/eurostat/web/lucas/data/primary-data/2018 (accessed on 30 May 2022).
- d’Andrimont, R.; Yordanov, M.; Martinez-Sanchez, L.; Eiselt, B.; Palmieri, A.; Dominici, P.; Gallego, J.; Reuter, H.I.; Joebges, C.; Lemoine, G.; et al. Harmonised LUCAS in-situ land cover and use database for field surveys from 2006 to 2018 in the European Union. Sci. Data 2020, 7, 352. [Google Scholar] [CrossRef]
- Ghorbanian, A.; Zaghian, S.; Asiyabi, R.M.; Amani, M.; Mohammadzadeh, A.; Jamali, S. Mangrove ecosystem mapping using sentinel-1 and sentinel-2 satellite images and random forest algorithm in google earth engine. Remote Sens. 2021, 13, 2565. [Google Scholar] [CrossRef]
- Li, H.; Zhang, C.; Zhang, S.; Atkinson, P.M. Crop classification from full-year fully-polarimetric L-band UAVSAR time-series using the Random Forest algorithm. Int. J. Appl. Earth Obs. Geoinf. 2020, 87, 102032. [Google Scholar] [CrossRef]
- Hu, Y.; Tian, B.; Yuan, L.; Li, X.; Huang, Y.; Shi, R.; Jiang, X.; Wang, L.; Sun, C. Mapping coastal salt marshes in China using time series of Sentinel-1 SAR. ISPRS J. Photogramm. Remote Sens. 2021, 173, 122–134. [Google Scholar] [CrossRef]
- Main-Knorn, M.; Pflug, B.; Louis, J.; Debaecker, V.; Müller-Wilm, U.; Gascon, F. Sen2Cor for Sentinel-2. In Proceedings of the Image and Signal Processing for Remote Sensing XXIII, Warsaw, Poland, 11–13 September 2017; p. 3. [Google Scholar]
- Amani, M.; Mahdavi, S.; Afshar, M.; Brisco, B.; Huang, W.; Mirzadeh, S.M.J.; White, L.; Banks, S.; Montgomery, J.; Hopkinson, C. Canadian wetland inventory using Google Earth Engine: The first map and preliminary results. Remote Sens. 2019, 11, 842. [Google Scholar] [CrossRef] [Green Version]
- Vermote, E.; Roger, J.C.; Franch, B.; Skakun, S. LASRC (Land Surface Reflectance Code): Overview, application and validation using MODIS, VIIRS, LANDSAT and Sentinel 2 data’s. In Proceedings of the International Geoscience and Remote Sensing Symposium (IGARSS), Valencia, Spain, 22–27 July 2018; Volume 2018, pp. 8173–8176. [Google Scholar]
- Vermote, E.; Justice, C.; Claverie, M.; Franch, B. Preliminary analysis of the performance of the Landsat 8/OLI land surface reflectance product. Remote Sens. Environ. 2016, 185, 46–56. [Google Scholar] [CrossRef]
- Mohammadi Asiyabi, R.; Sahebi, M.R.; Ghorbanian, A. Segment-based bag of visual words model for urban land cover mapping using polarimetric SAR data. Adv. Space Res. 2021, in press. [Google Scholar] [CrossRef]
- Ai, J.; Zhang, C.; Chen, L.; Li, D. Mapping annual land use and land cover changes in the Yangtze Estuary Region using an object-based classification framework and landsat time series data. Sustainability 2020, 12, 659. [Google Scholar] [CrossRef] [Green Version]
- Belgiu, M.; Csillik, O. Sentinel-2 cropland mapping using pixel-based and object-based time-weighted dynamic time warping analysis. Remote Sens. Environ. 2018, 204, 509–523. [Google Scholar] [CrossRef]
- Amani, M.; Mahdavi, S.; Kakooei, M.; Ghorbanian, A.; Brisco, B.; Delancey, E.; Toure, S.; Reyes, E.L. Wetland Change Analysis in Alberta, Canada Using Four Decades of Landsat Imagery. IEEE J. Sel. Top. Appl. Earth Obs. Remote Sens. 2021, 14, 10314–10335. [Google Scholar] [CrossRef]
- Mahdavi, S.; Salehi, B.; Amani, M.; Granger, J.E.; Brisco, B.; Huang, W.; Hanson, A. Object-Based Classification of Wetlands in Newfoundland and Labrador Using Multi-Temporal PolSAR Data. Can. J. Remote Sens. 2017, 43, 432–450. [Google Scholar] [CrossRef]
- Achanta, R.; Süsstrunk, S. Superpixels and polygons using simple non-iterative clustering. In Proceedings of the 30th IEEE Conference on Computer Vision and Pattern Recognition, CVPR 2017, Honolulu, HI, USA, 21–26 July 2017; Volume 2017, pp. 4895–4904. [Google Scholar]
- Google Earth Engine SNIC (Simple Non-Iterative Clustering). Available online: https://developers.google.com/earth-engine/apidocs/ee-algorithms-image-segmentation-snic (accessed on 30 May 2022).
- Kakooei, M.; Mining, Y.B.-J. VHR Semantic Labeling by Random Forest Classification and Fusion of Spectral and Spatial Features on Google Earth Engine. J. AI Data Min. 2020, 8, 357–370. [Google Scholar] [CrossRef]
- Wang, X.; Xu, M.; Xiong, X.; Ning, C. Remote Sensing Scene Classification Using Heterogeneous Feature Extraction and Multi-Level Fusion. IEEE Access 2020, 8, 217628–217641. [Google Scholar] [CrossRef]
- Amani, M.; Kakooei, M.; Moghimi, A.; Ghorbanian, A.; Ranjgar, B.; Mahdavi, S.; Davidson, A.; Fisette, T.; Rollin, P.; Brisco, B.; et al. Application of google earth engine cloud computing platform, sentinel imagery, and neural networks for crop mapping in Canada. Remote Sens. 2020, 12, 3561. [Google Scholar] [CrossRef]
- Ahooei Nezhad, S.S.; Valadan Zoej, M.J.; Ghorbanian, A. A fast non-iterative method for the object to image space best scanline determination of spaceborne linear array pushbroom images. Adv. Space Res. 2021, 68, 3584–3593. [Google Scholar] [CrossRef]
- Sun, C.; Bian, Y.; Zhou, T.; Pan, J. Using of multi-source and multi-temporal remote sensing data improves crop-type mapping in the subtropical agriculture region. Sensors 2019, 19, 2401. [Google Scholar] [CrossRef] [Green Version]
- Jamali, A. Improving land use land cover mapping of a neural network with three optimizers of multi-verse optimizer, genetic algorithm, and derivative-free function. Egypt. J. Remote Sens. Sp. Sci. 2021, 24, 373–390. [Google Scholar] [CrossRef]
- Chermprayong, P.; Hongkarnjanakul, N.; Rouquette, D.; Schwob, C.; Mezeix, L. Convolutional Neural Network for Thailand’s Eastern Economic Corridor (EEC) land cover classification using overlapping process on satellite images. Remote Sens. Appl. Soc. Environ. 2021, 23, 100543. [Google Scholar] [CrossRef]
- Erinjery, J.J.; Singh, M.; Kent, R. Mapping and assessment of vegetation types in the tropical rainforests of the Western Ghats using multispectral Sentinel-2 and SAR Sentinel-1 satellite imagery. Remote Sens. Environ. 2018, 216, 345–354. [Google Scholar] [CrossRef]
- Emparanza, P.R.; Hongkarnjanakul, N.; Rouquette, D.; Schwob, C.; Mezeix, L. Land cover classification in Thailand’s Eastern Economic Corridor (EEC) using convolutional neural network on satellite images. Remote Sens. Appl. Soc. Environ. 2020, 20, 100394. [Google Scholar] [CrossRef]
- Kingma, D.P.; Ba, J.L. Adam: A method for stochastic optimization. In Proceedings of the 3rd International Conference on Learning Representations, ICLR 2015—Conference Track Proceedings, San Diego, CA, USA, 7–9 May 2015. [Google Scholar]
- Olofsson, P.; Foody, G.M.; Stehman, S.V.; Woodcock, C.E. Making better use of accuracy data in land change studies: Estimating accuracy and area and quantifying uncertainty using stratified estimation. Remote Sens. Environ. 2013, 129, 122–131. [Google Scholar] [CrossRef]
- Olofsson, P.; Foody, G.M.; Herold, M.; Stehman, S.V.; Woodcock, C.E.; Wulder, M.A. Good practices for estimating area and assessing accuracy of land change. Remote Sens. Environ. 2014, 148, 42–57. [Google Scholar] [CrossRef]
- Liu, Y.; Gong, W.; Hu, X.; Gong, J. Forest type identification with random forest using Sentinel-1A, Sentinel-2A, multi-temporal Landsat-8 and DEM data. Remote Sens. 2018, 10, 946. [Google Scholar] [CrossRef] [Green Version]
- Waser, L.T.; Rüetschi, M.; Psomas, A.; Small, D.; Rehush, N. Mapping dominant leaf type based on combined Sentinel-1/-2 data—Challenges for mountainous countries. ISPRS J. Photogramm. Remote Sens. 2021, 180, 209–226. [Google Scholar] [CrossRef]
| Name | Year | # Classes | Algorithm | Overall Accuracy | RS Data |
|---|---|---|---|---|---|
| FROM-GLC10 [20] | 2017 | 10 | RF | 72% | Landsat-8, Sentinel-2 |
| S2GLC [19] | 2017 | 14 | RF | 86% | Sentinel-2 |
| ELC10 [25] | 2018 | 8 | RF | 90% | Sentinel-1, 2 |
| Esri 2020 [26] | 2020 | 10 | CNN | 85% | Sentinel-2 |
| WorldCover 10 m [24,46] | 2020 | 11 | CatBoost | 74% | Sentinel-1, 2 |
| Propagation | LULC Class | LUCAS Description | # Sub Classes | # Samples (%) |
|---|---|---|---|---|
 | Artificial Land | Areas characterized by an artificial and often-impervious cover of constructions and pavement (A00). | 5 | 6447 (3.13) |
 | Cropland | Areas where crops are planted and cultivated (B00). | 137 | 74,963 (36.36) |
 | Woodland | Areas covered by trees with a canopy of at least 10%. In addition, woody hedges and palm trees are included in this class (C00). | 21 | 62,651 (30.39) |
 | Shrubland | Areas dominated (at least 10% of the surface) by shrubs and low woody plants that are normally not able to reach more than 5 m in height. It may include sparsely occurring trees with a canopy below 10% (D00). | 2 | 9789 (4.75) |
 | Grassland | Land predominantly covered by communities of grassland, grass-like plants and forbs. This class includes permanent grassland and permanent pasture that is not part of a crop rotation (normally for 5 years or more), which can be used to grow grasses and other herbaceous forage naturally (self-seeded) or through cultivation (sown). It may include sparsely-occurring trees within a limit of a canopy below 10% and shrubs within a total limit of cover (including trees) of 20%. These can, themselves, also be grazed, provided that grasses and other herbaceous forage remain predominant as well (E00). | 3 | 46,795 (22.70) |
 | Barren | Areas with no dominant vegetation cover on at least 90% of the area or areas covered by lichens/moss (F00). | 4 | 4487 (2.18) |
 | Water | Inland or coastal areas without vegetation and covered by water and flooded surfaces, or likely to be so over a large part of the year. If temporarily dry, the outlines of the water areas have to be clearly visible on the orthophotos. Temporarily submerged islands and sandbanks are to be assigned in FXX classes, with a remark “temporarily flooded” (G00). In this study, 23 samples of Glaciers, Permanent Snow (G50) were moved to Sea/Ice class. | 7 | 207 (0.10) |
 | Wetland | Wetlands are areas that fall between land and water. These are areas that are wet for long enough periods that the plants and animals living in or near them are adapted to, and often dependent on, wet conditions for at least part of their life cycle (H00). Wetlands are defined as land that is: (a) Inundated with water on a temporary or permanent basis, (b) Inundated with water that is usually slow moving or stationary, (c) Inundated with water that is shallow, or (d) Inundated with water that may be fresh, brackish or saline. | 5 | 785 (0.38) |
 | Snow/Ice | “Glaciers, Permanent Snow” (G50) is a sub class of Water. These areas are covered by glaciers (generally measured at the time of their greatest expansion in the season) or permanent snow. | 0 | 23 (0.01) |
| Month | Satellite Datasets | ||||||
|---|---|---|---|---|---|---|---|
| Sentinel-1 | Sentinel-2 | Landsat-8 | |||||
| Features | # Image | Features | # Image | Features | # Image | ||
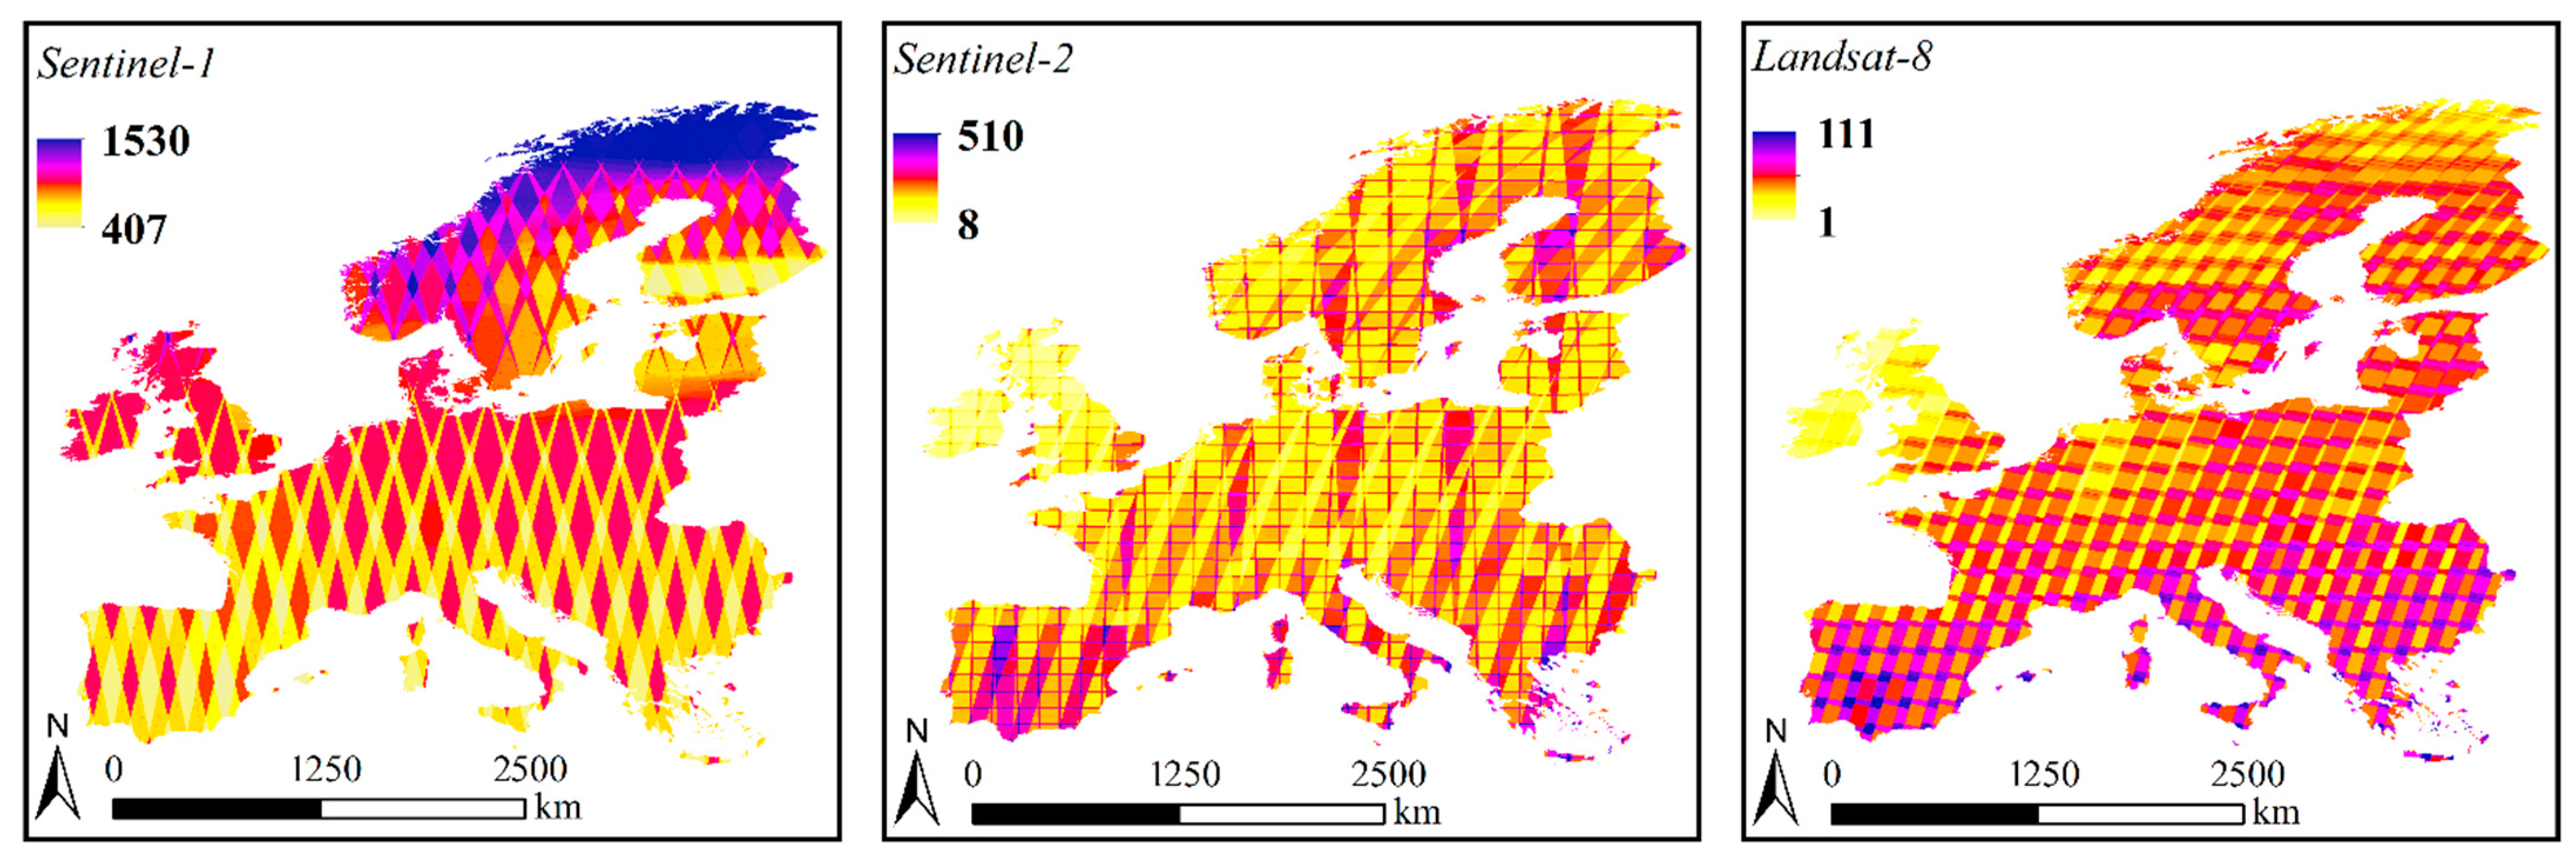
| 1 | January | VV-1, VH-1 | 30,709 | × | × | × | × |
| 2 | February | × | × | × | × | ||
| 3 | March | VV-2, VH-2 | 31,871 | × | × | × | × |
| 4 | April | NDVI-1 | 55,388 | NDVI-1 | 3987 | ||
| 5 | May | VV-3, VH-3 | 24,579 | ||||
| 6 | Jun | ||||||
| 7 | July | VV-4, VH-4 | 34,159 | NDVI-2 | 83,053 | NDVI-2 | 5344 |
| 8 | August | ||||||
| 9 | September | VV-5, VH-5 | 34,530 | ||||
| 10 | October | ||||||
| 11 | November | VV-6, VH-6 | 31,555 | × | × | × | × |
| 12 | December | × | × | × | × | ||
| Total | 6 VV, 6 VH | 2 NDVI | 2 NDVI | ||||
| Classes | Predicted Samples | |||||||||||
|---|---|---|---|---|---|---|---|---|---|---|---|---|
| 1 | 2 | 3 | 4 | 5 | 6 | 7 | 8 | 9 | PA (%) | |||
| Reference data | 1 | Artificial Land | 6389 | 40 | 19 | 16 | 26 | 13 | 0 | 0 | 0 | 98.25 |
| 2 | Cropland | 49 | 71,938 | 487 | 464 | 1965 | 368 | 2 | 8 | 0 | 95.56 | |
| 3 | Woodland | 18 | 202 | 61,174 | 852 | 487 | 152 | 3 | 24 | 0 | 97.24 | |
| 4 | Shrubland | 3 | 61 | 496 | 8854 | 350 | 80 | 1 | 19 | 0 | 89.76 | |
| 5 | Grassland | 26 | 1078 | 375 | 361 | 45,012 | 125 | 3 | 35 | 0 | 95.74 | |
| 6 | Barren | 33 | 1237 | 38 | 50 | 43 | 3097 | 7 | 0 | 1 | 68.73 | |
| 7 | Water | 0 | 0 | 1 | 2 | 1 | 1 | 205 | 0 | 0 | 97.62 | |
| 8 | Wetland | 0 | 4 | 3 | 5 | 37 | 49 | 1 | 720 | 0 | 87.91 | |
| 9 | Snow/Ice | 0 | 0 | 0 | 0 | 0 | 1 | 0 | 0 | 22 | 95.65 | |
| UA (%) | 98.03 | 96.48 | 97.73 | 83.50 | 93.93 | 79.70 | 92.34 | 89.33 | 95.65 | |||
| Alpine | Atlantic | Boreal | Continental | Mediterranean | Pannonian | Steppic | Europe | |||||
| OA | 97.21 | 95.85 | 96.09 | 93.98 | 90.20 | 96.46 | 96.09 | 95.38 | ||||
| KC | 0.95 | 0.93 | 0.94 | 0.91 | 0.87 | 0.93 | 0.92 | 0.94 | ||||
Publisher’s Note: MDPI stays neutral with regard to jurisdictional claims in published maps and institutional affiliations. |
© 2022 by the authors. Licensee MDPI, Basel, Switzerland. This article is an open access article distributed under the terms and conditions of the Creative Commons Attribution (CC BY) license (https://creativecommons.org/licenses/by/4.0/).
Share and Cite
Mirmazloumi, S.M.; Kakooei, M.; Mohseni, F.; Ghorbanian, A.; Amani, M.; Crosetto, M.; Monserrat, O. ELULC-10, a 10 m European Land Use and Land Cover Map Using Sentinel and Landsat Data in Google Earth Engine. Remote Sens. 2022, 14, 3041. https://doi.org/10.3390/rs14133041
Mirmazloumi SM, Kakooei M, Mohseni F, Ghorbanian A, Amani M, Crosetto M, Monserrat O. ELULC-10, a 10 m European Land Use and Land Cover Map Using Sentinel and Landsat Data in Google Earth Engine. Remote Sensing. 2022; 14(13):3041. https://doi.org/10.3390/rs14133041
Chicago/Turabian StyleMirmazloumi, S. Mohammad, Mohammad Kakooei, Farzane Mohseni, Arsalan Ghorbanian, Meisam Amani, Michele Crosetto, and Oriol Monserrat. 2022. "ELULC-10, a 10 m European Land Use and Land Cover Map Using Sentinel and Landsat Data in Google Earth Engine" Remote Sensing 14, no. 13: 3041. https://doi.org/10.3390/rs14133041