
Accuracy, Efficiency, and Transferability of a Deep Learning Model for Mapping Retrogressive Thaw Slumps across the Canadian Arctic

 , ,
, ,
Abstract
:
1. Introduction
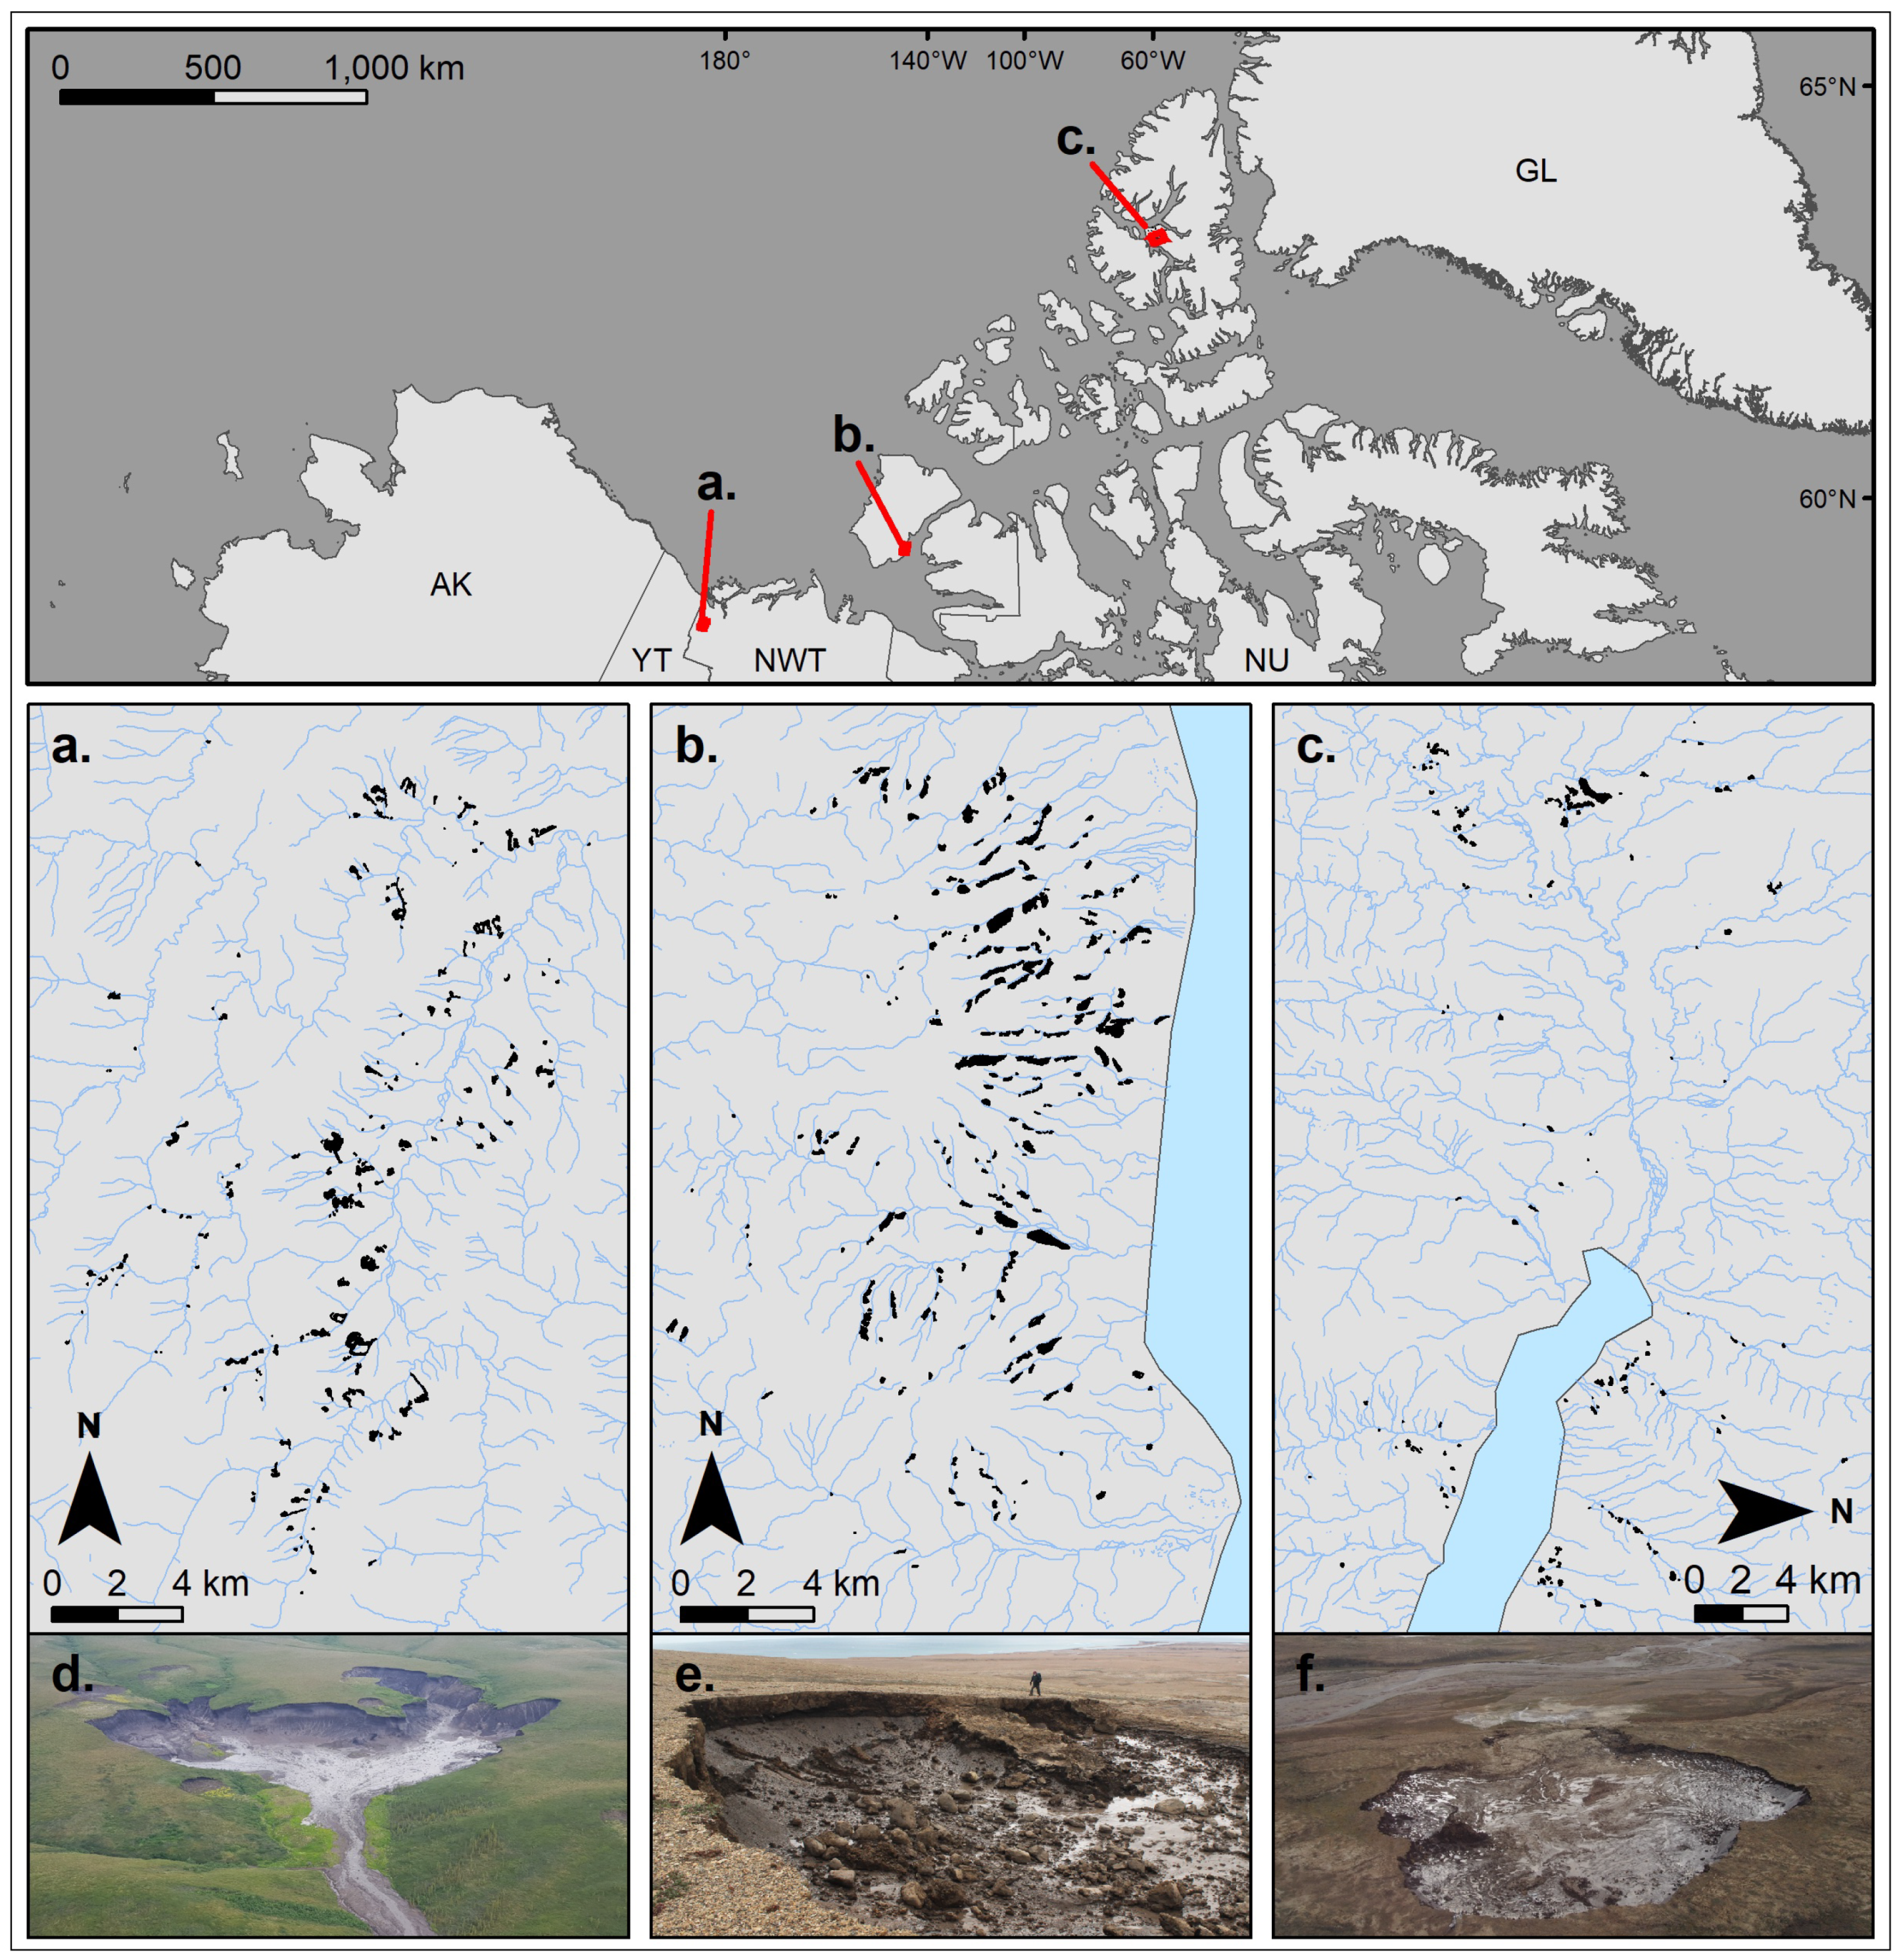
2. Study Areas
3. Data and Methods
3.1. Satellite Images and Training Data
3.2. Deep Learning Model
3.3. Demonstrating the Capability of DeepLabv3+
3.4. Accessing the Accuracy and Efficiency of the Model
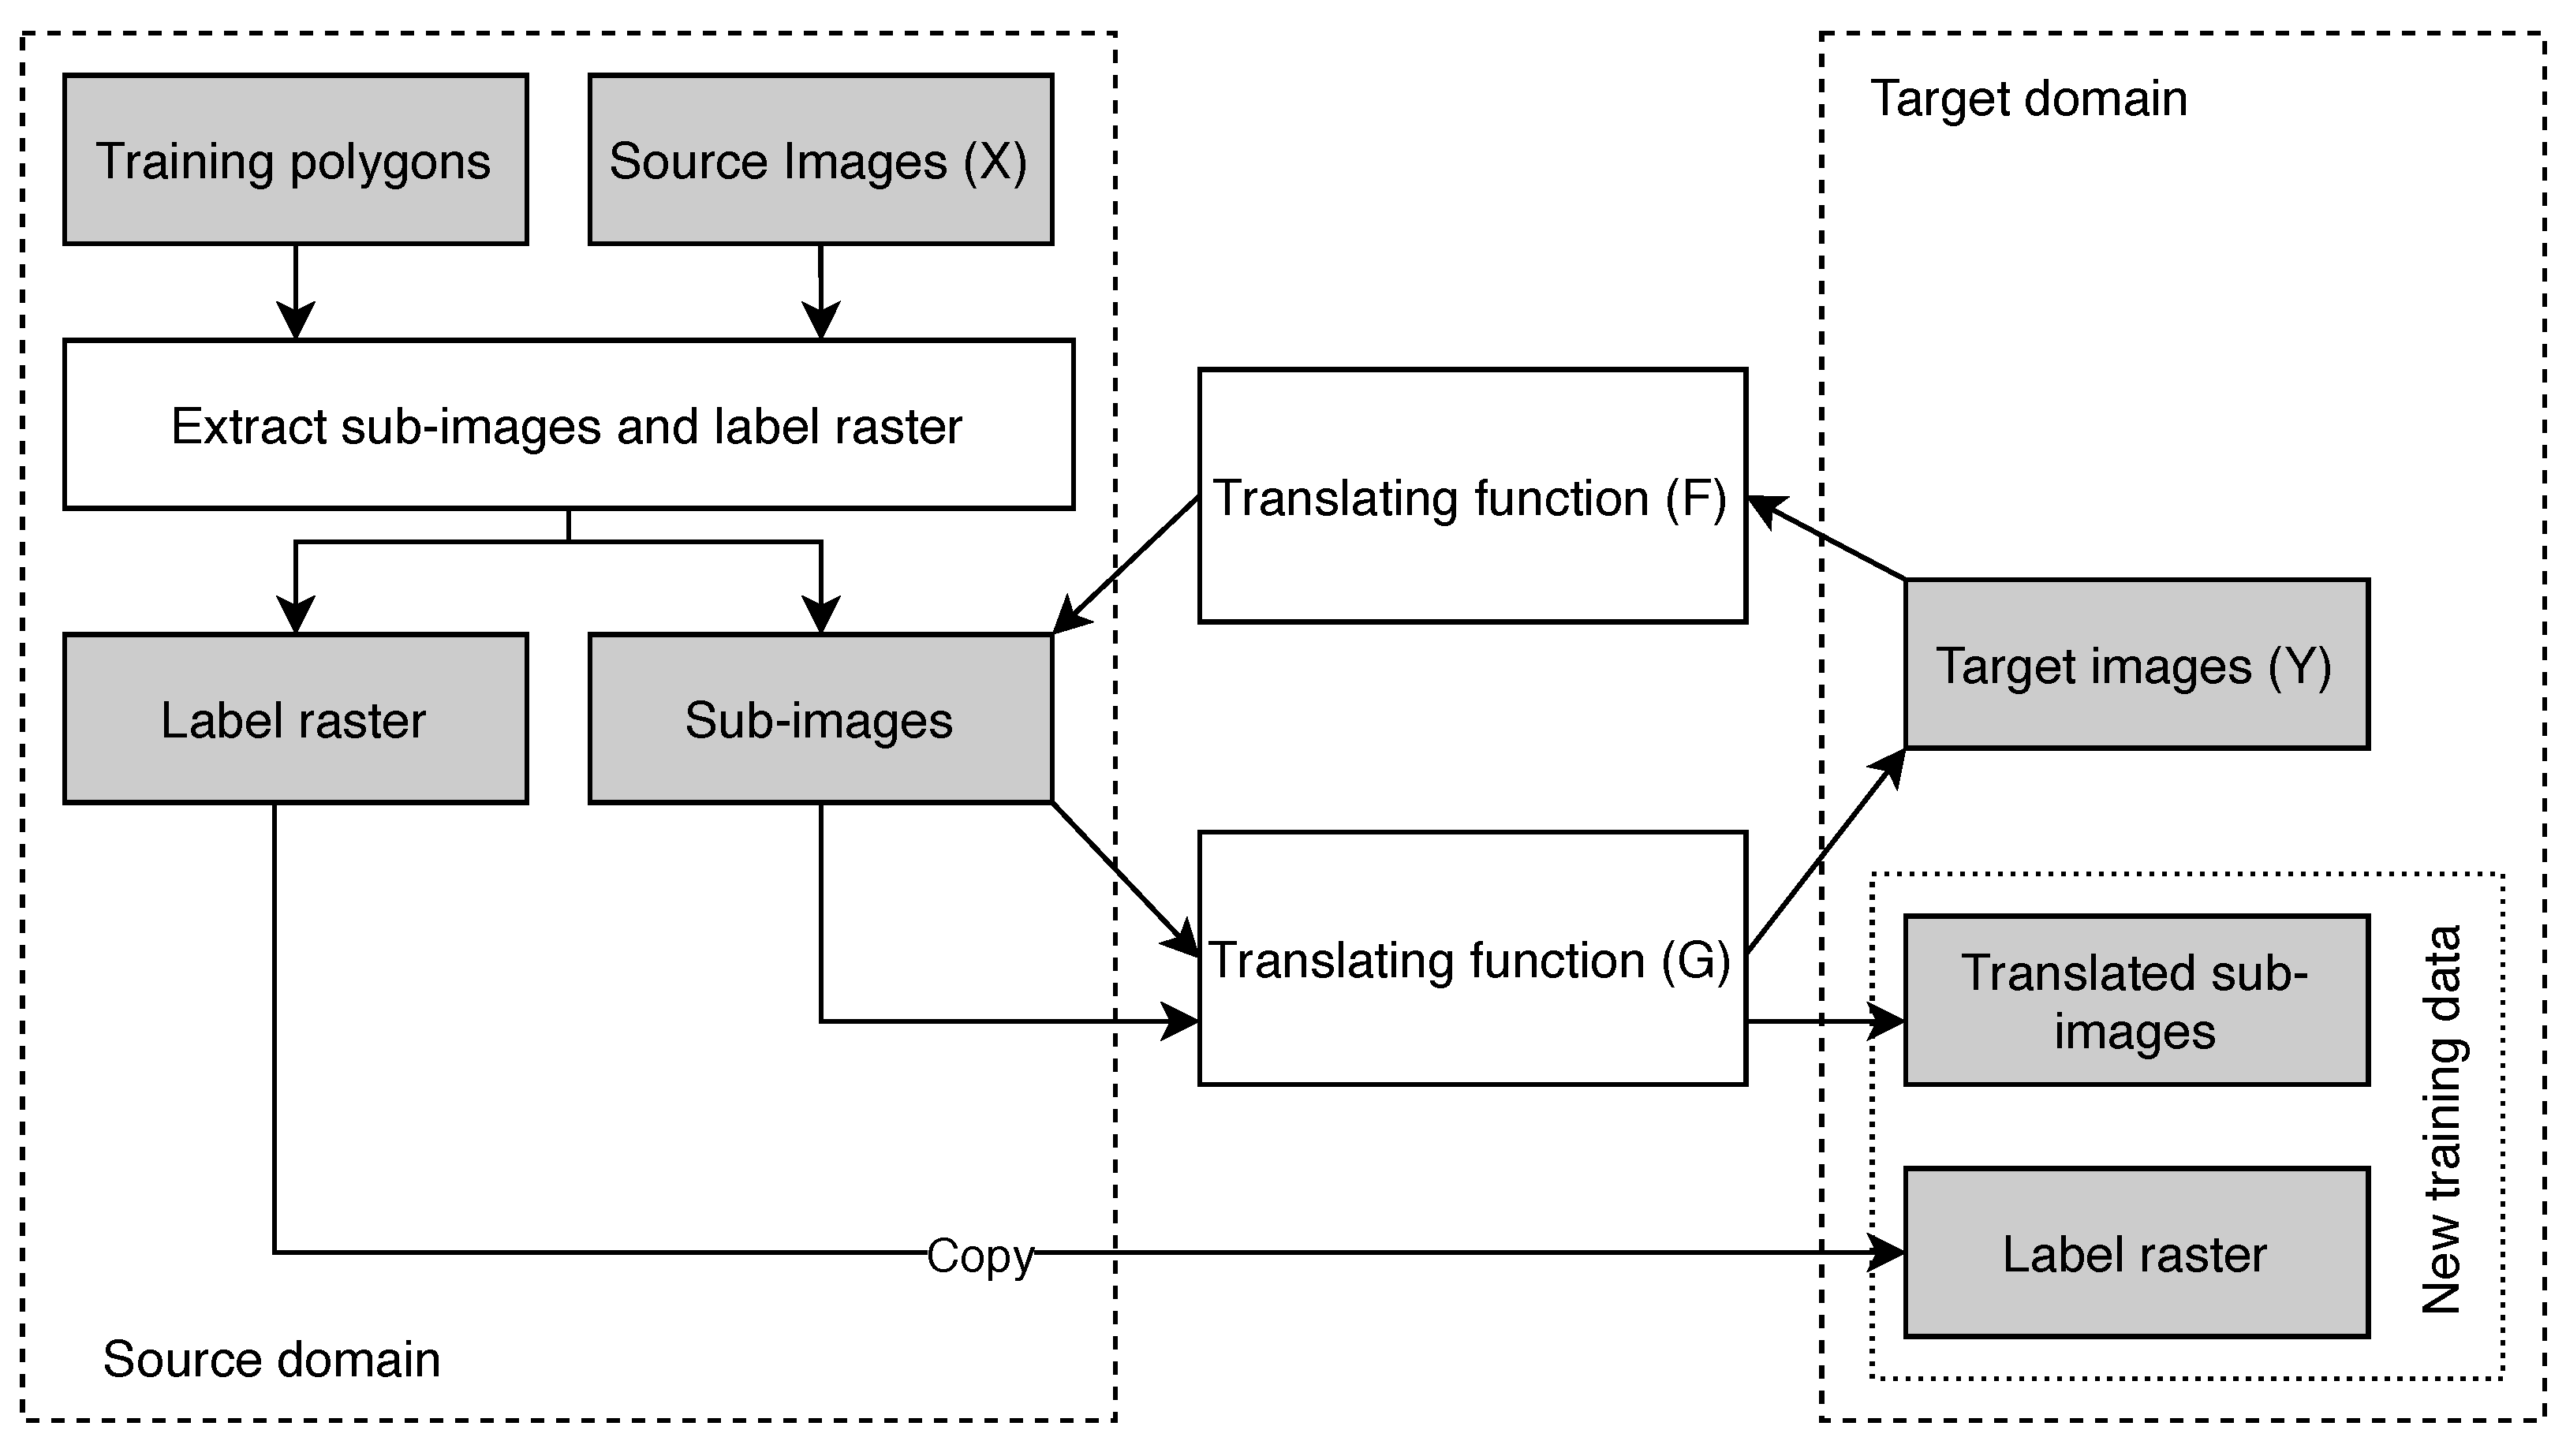
3.5. Using Domain Adaptation to Improving Transferability
4. Results
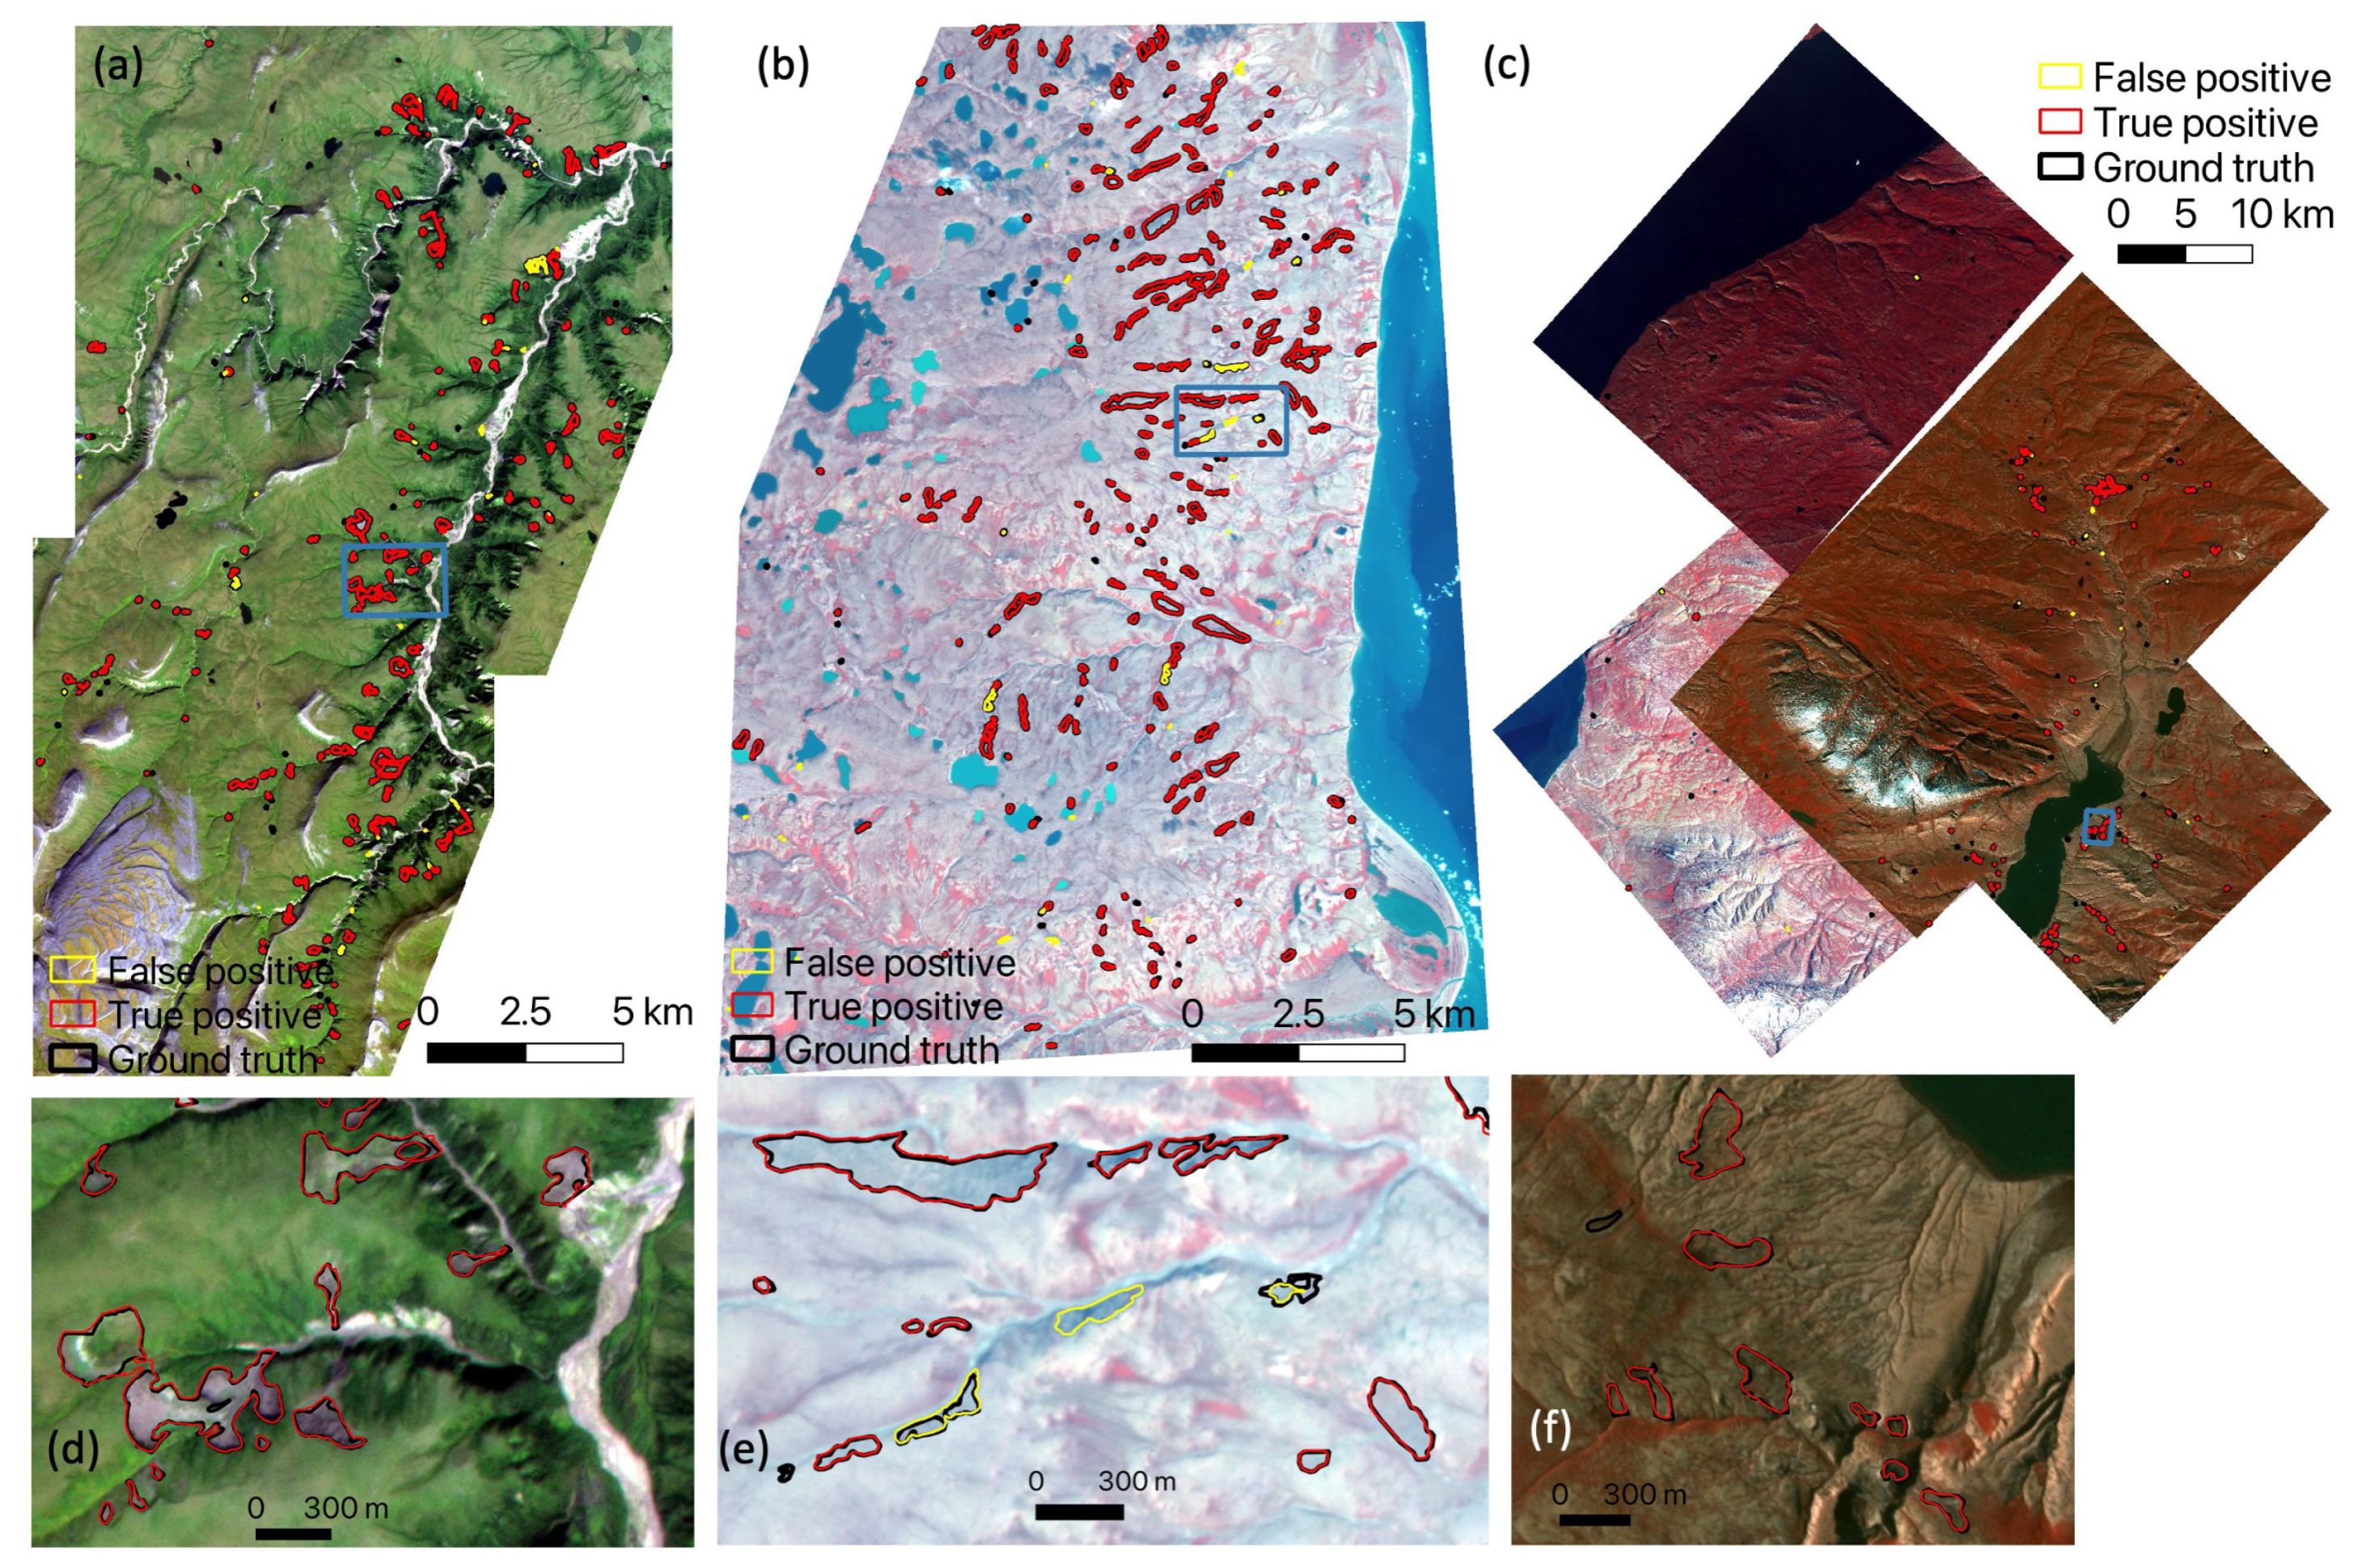
4.1. Mapped Polygons of Thaw Slumps
4.2. Effectiveness of Different Data Augmentation Options
4.3. Accuracy and Efficiency When Using Different Hyper-Parameters
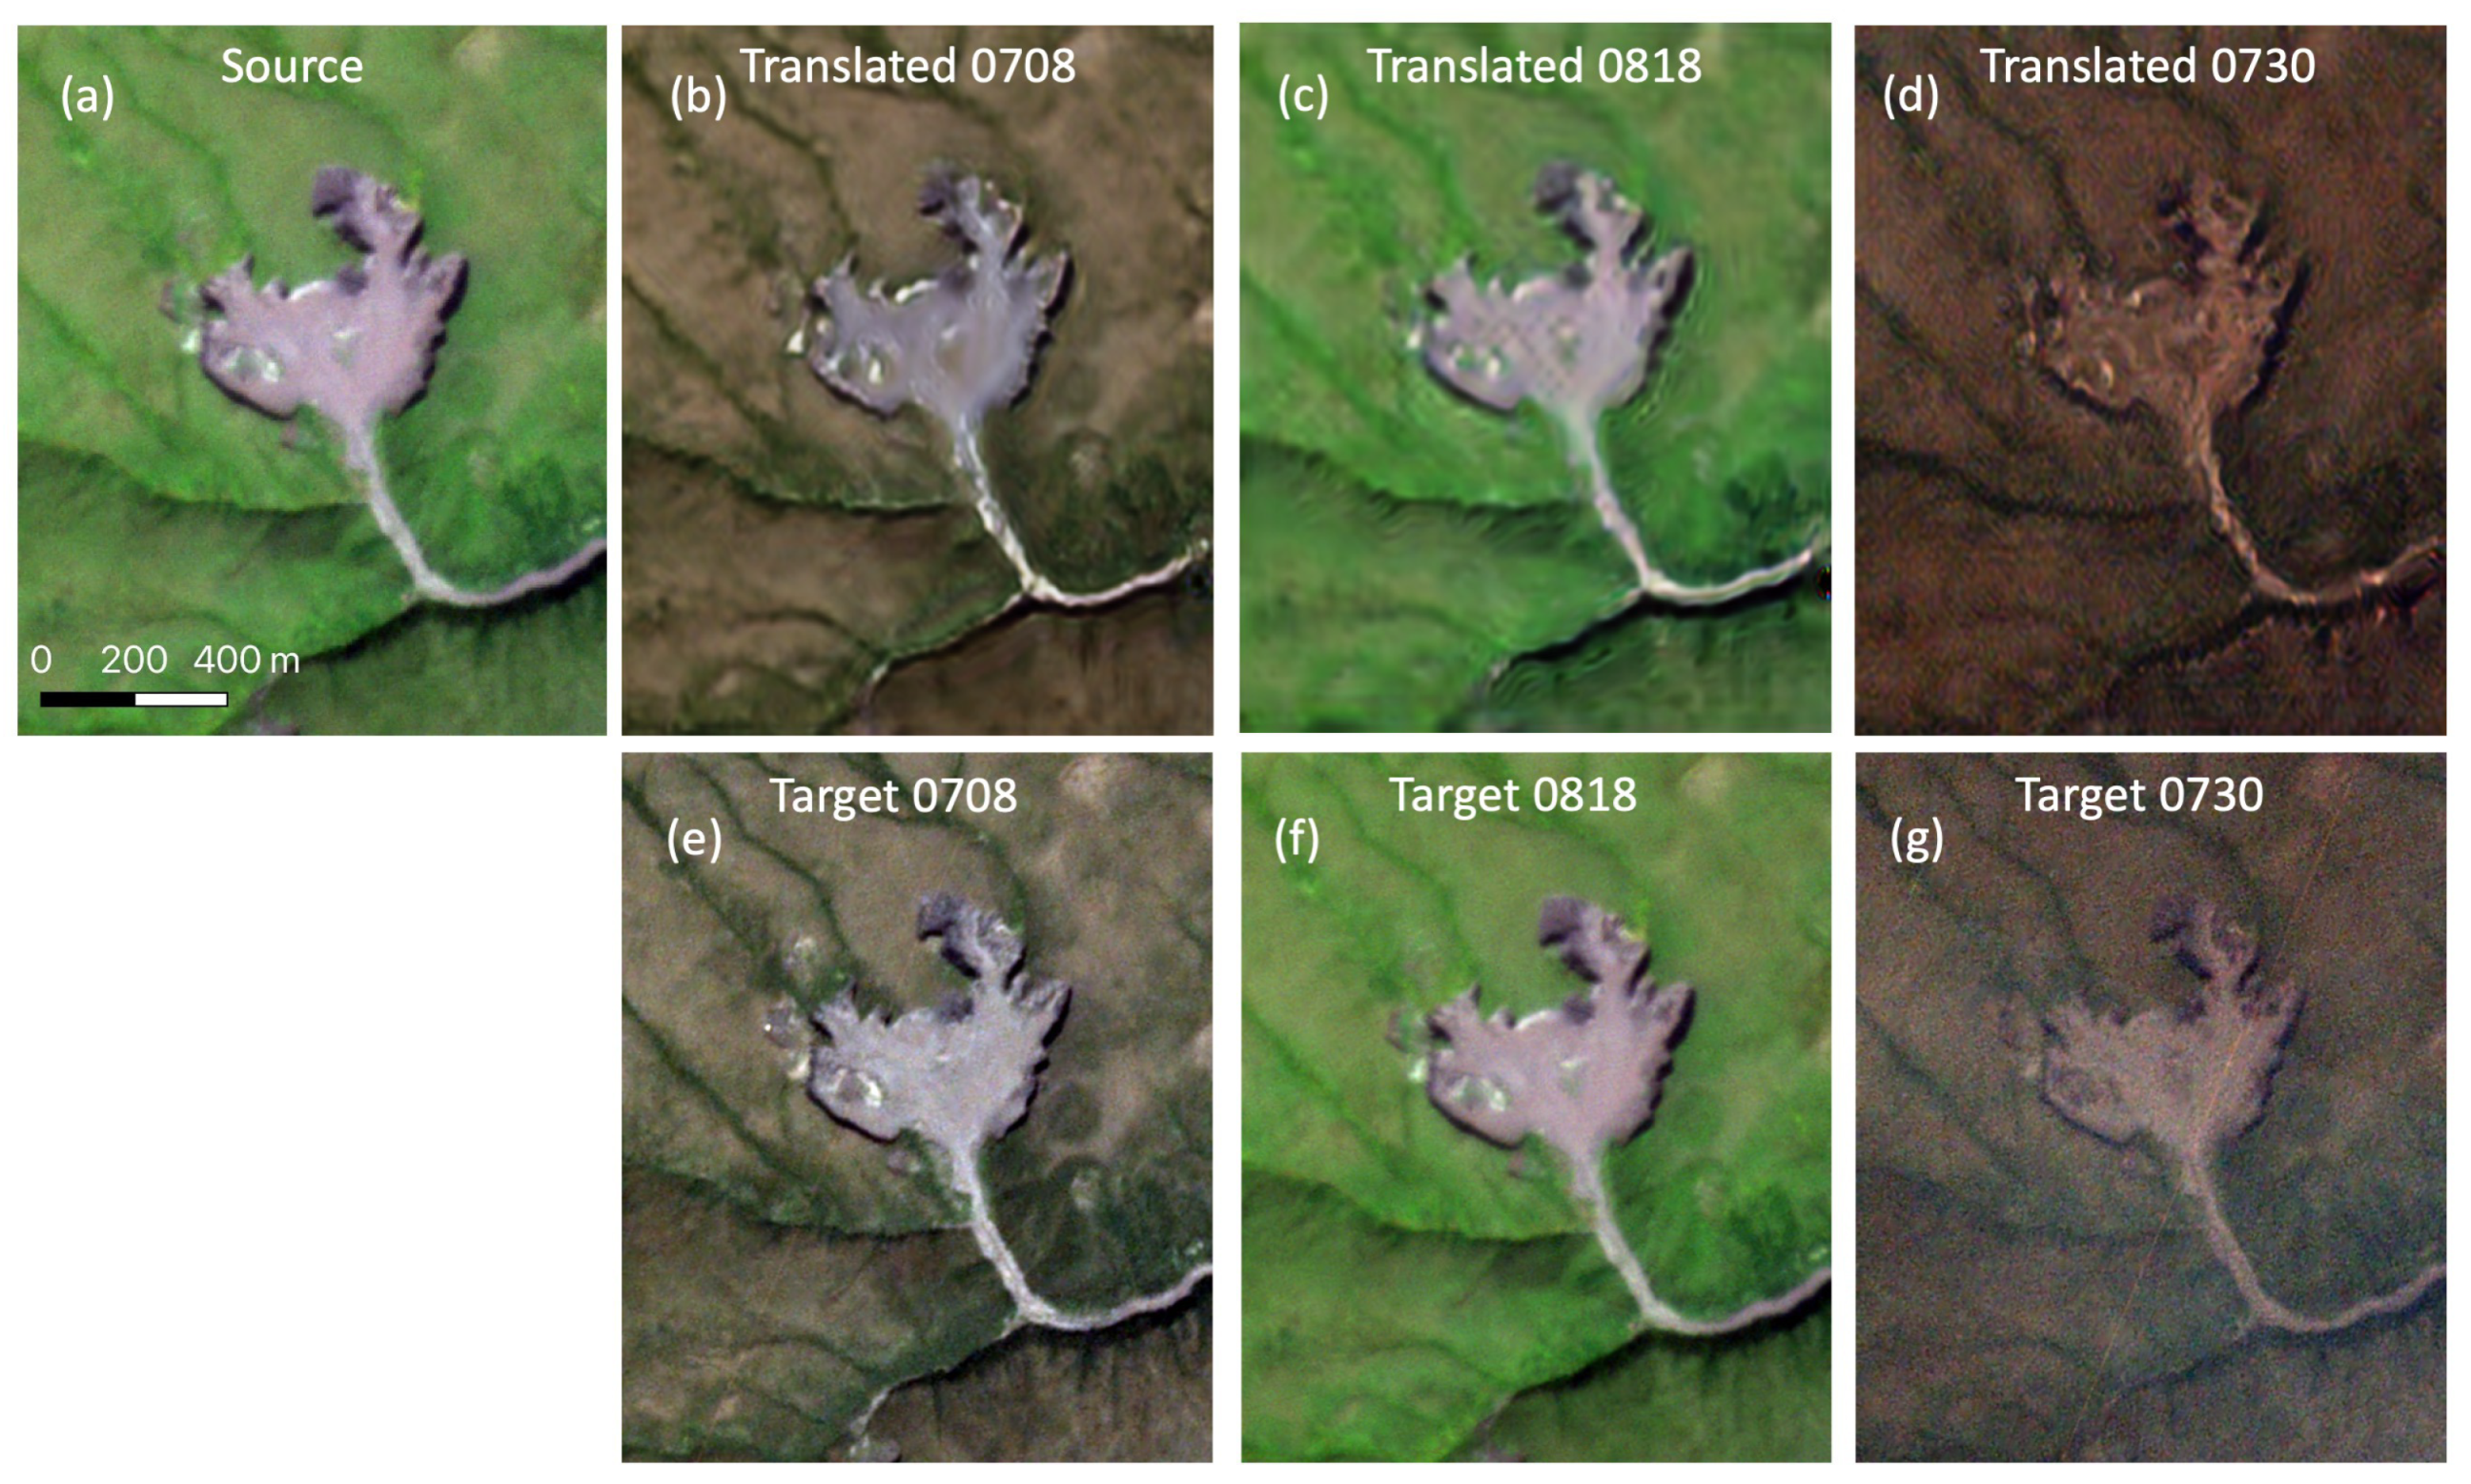
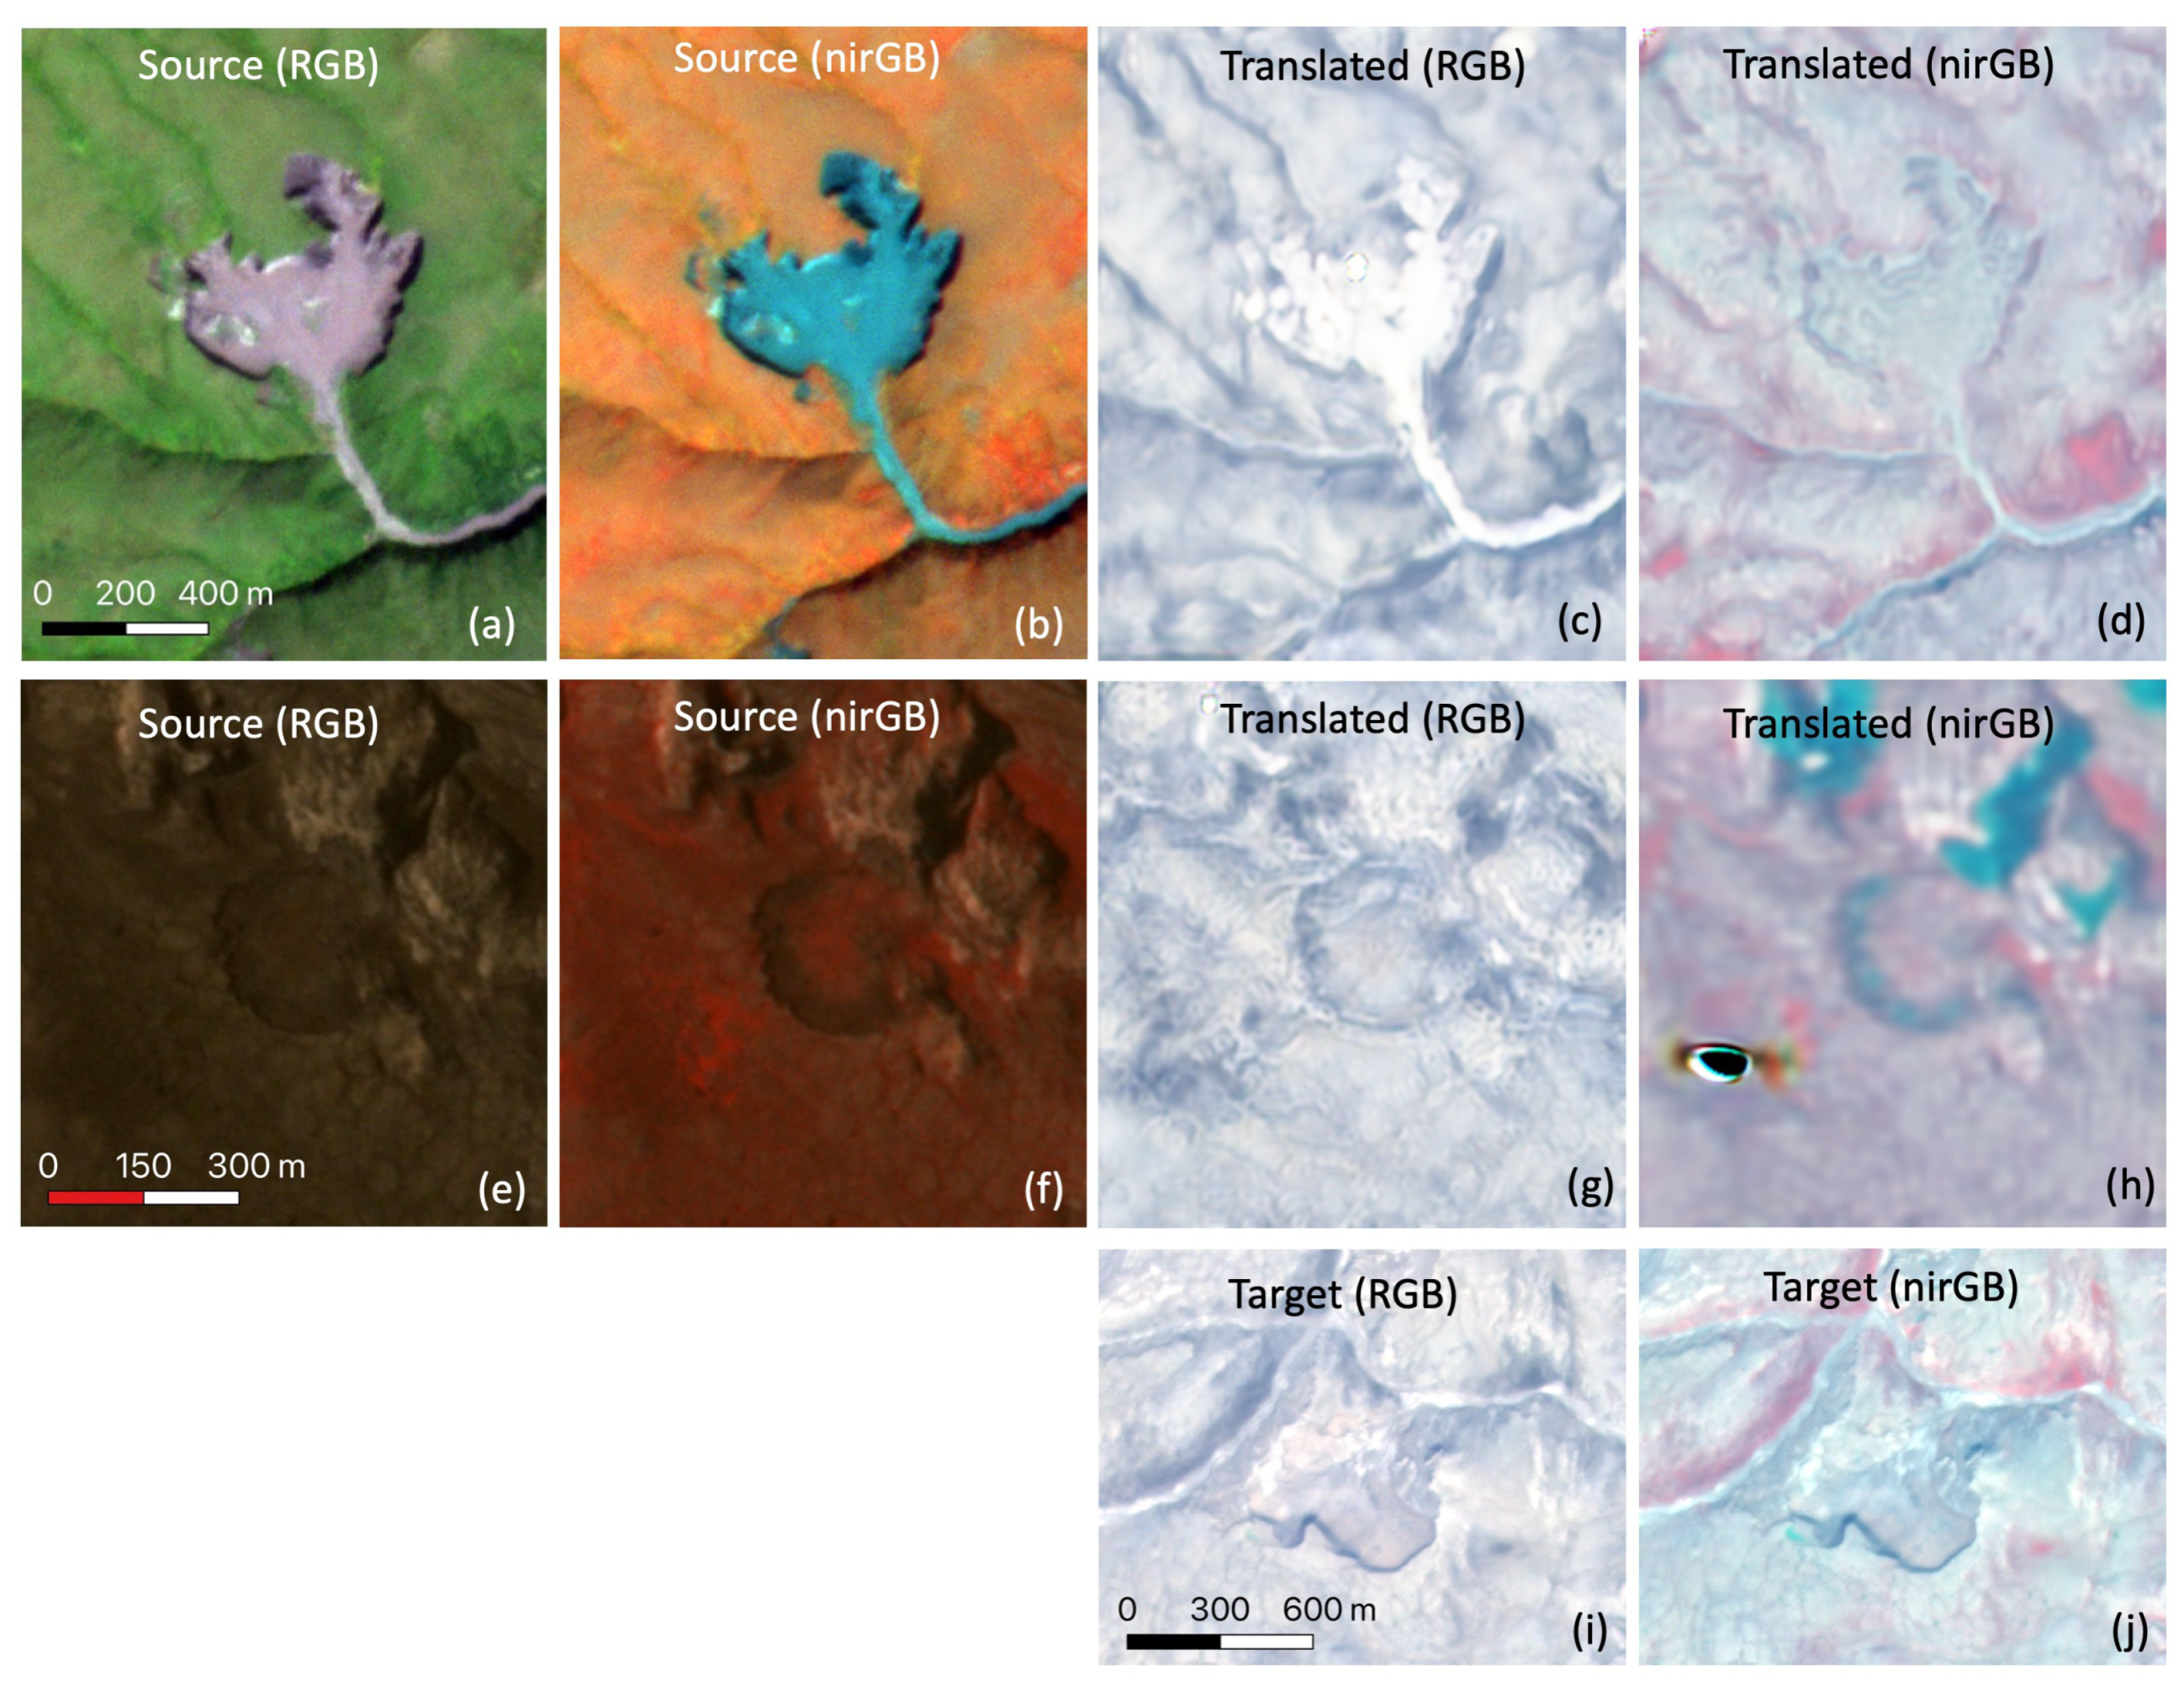
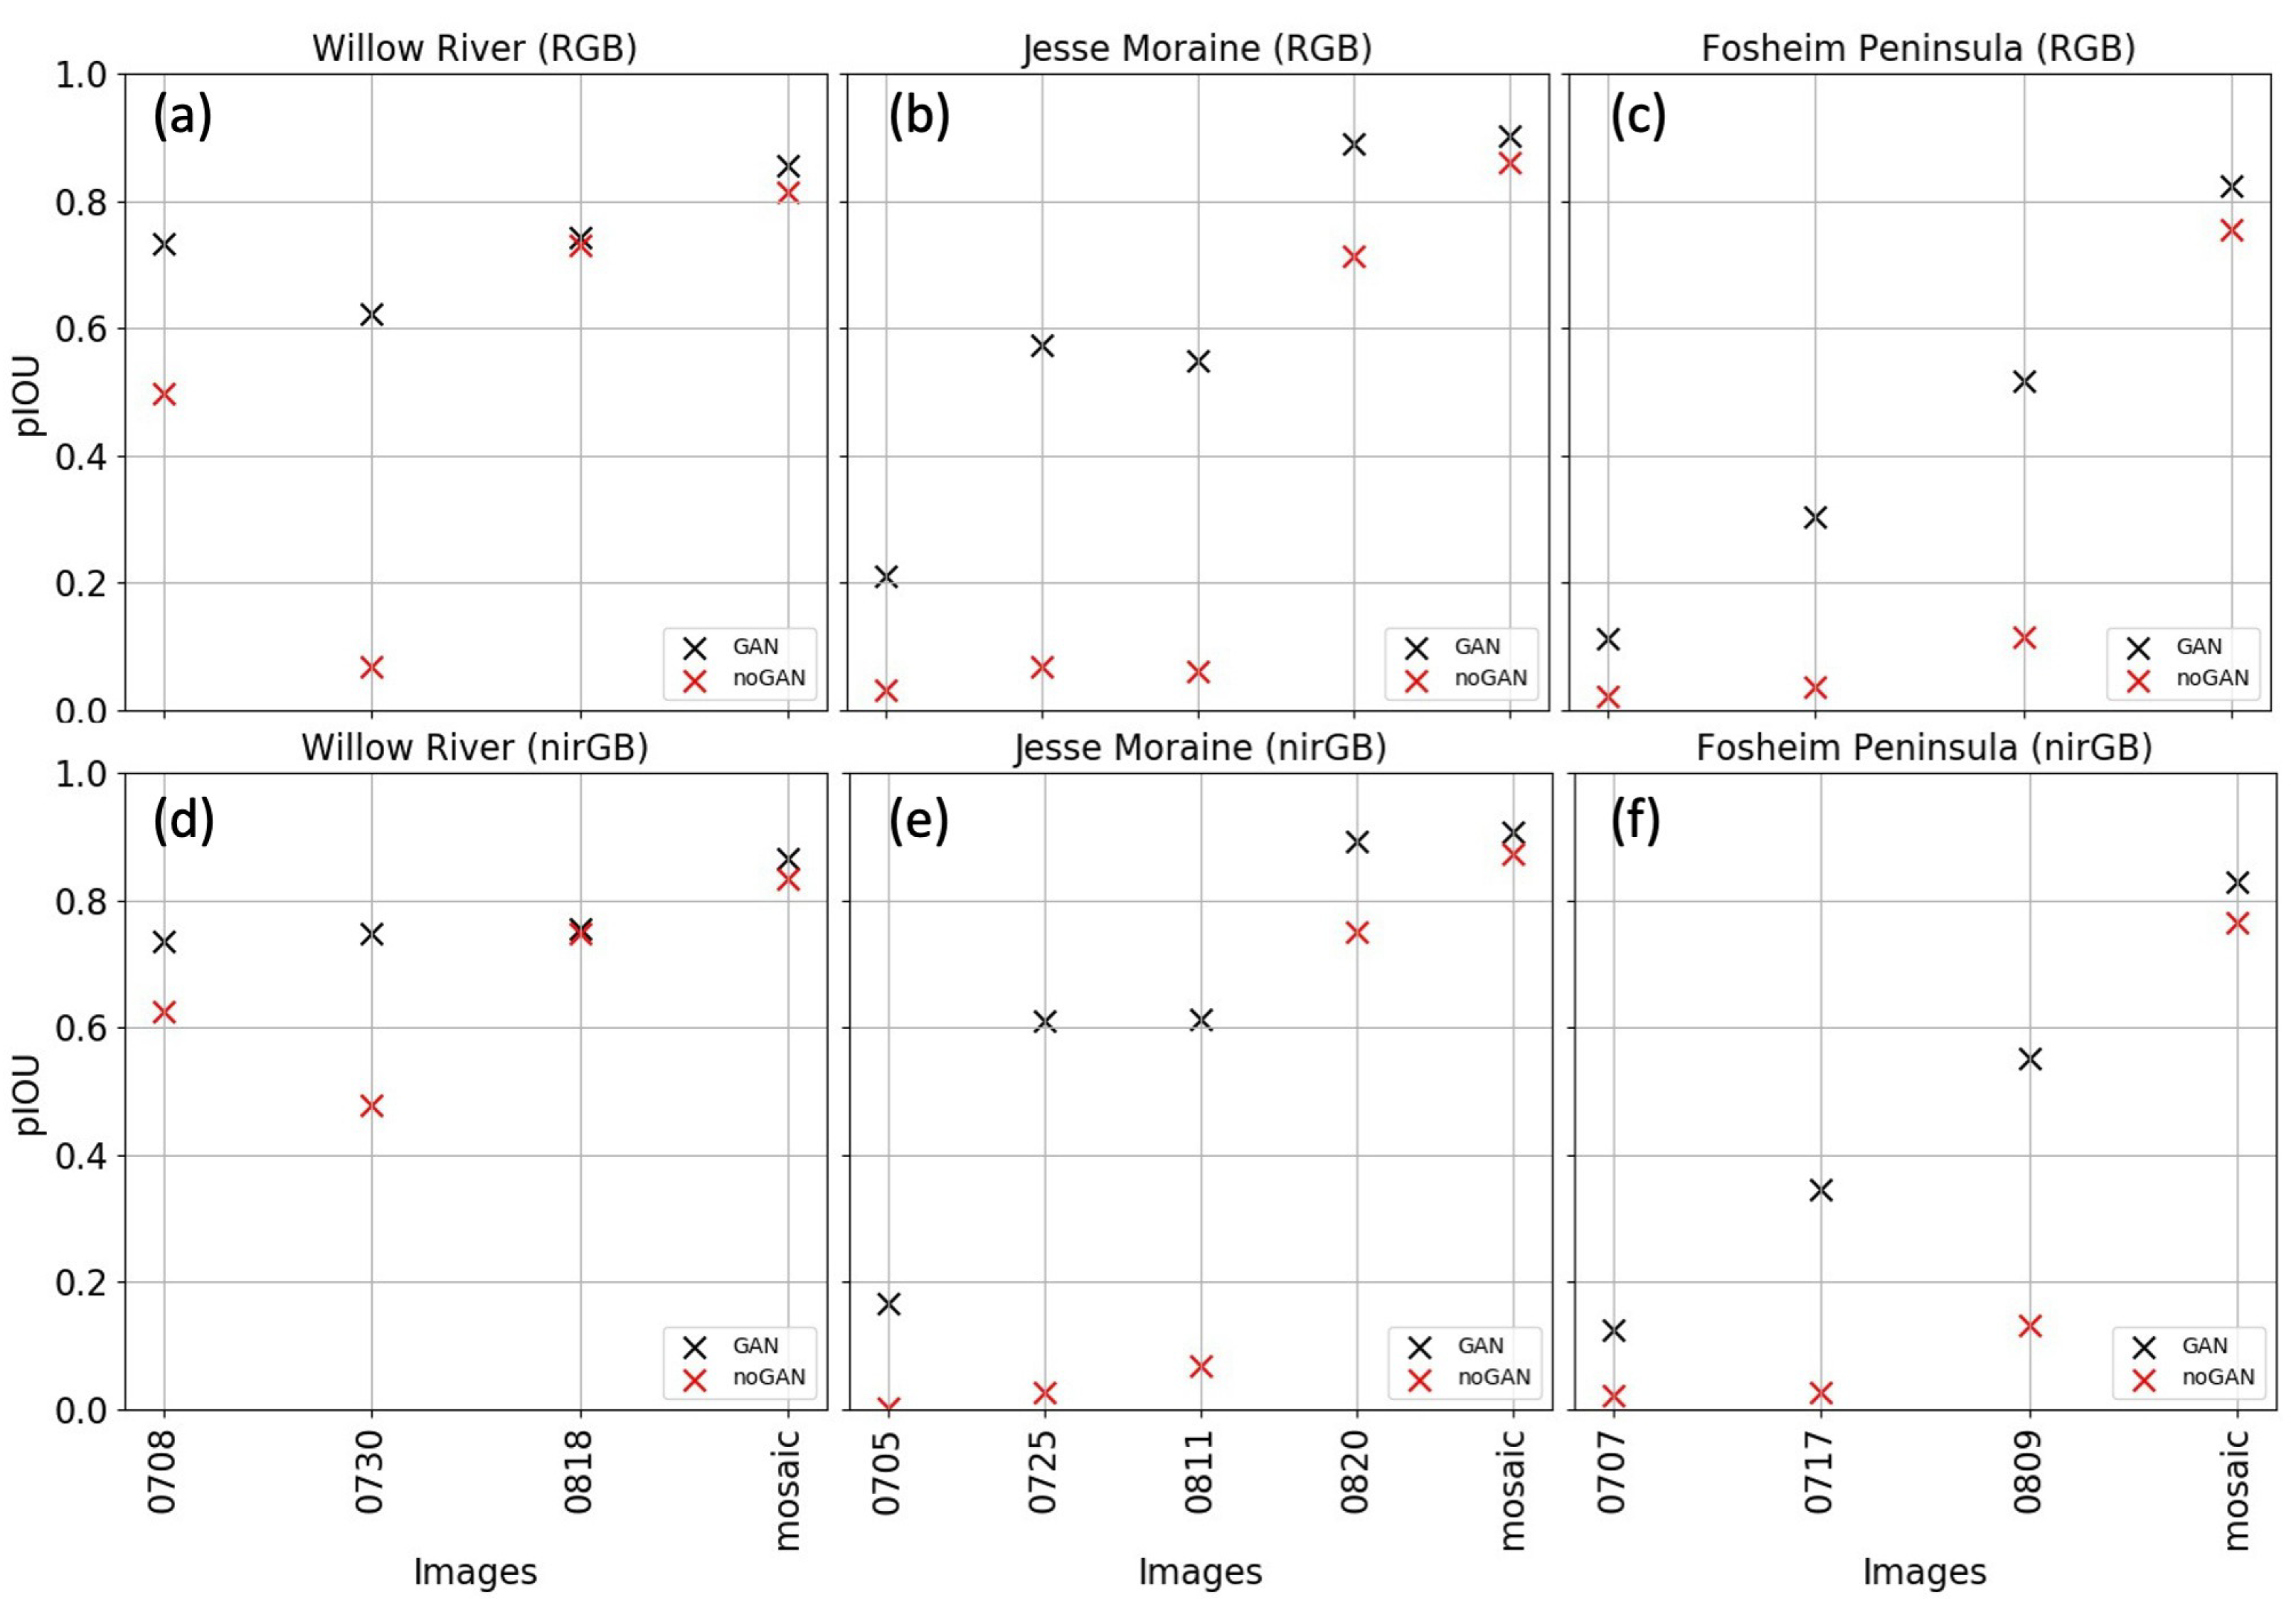
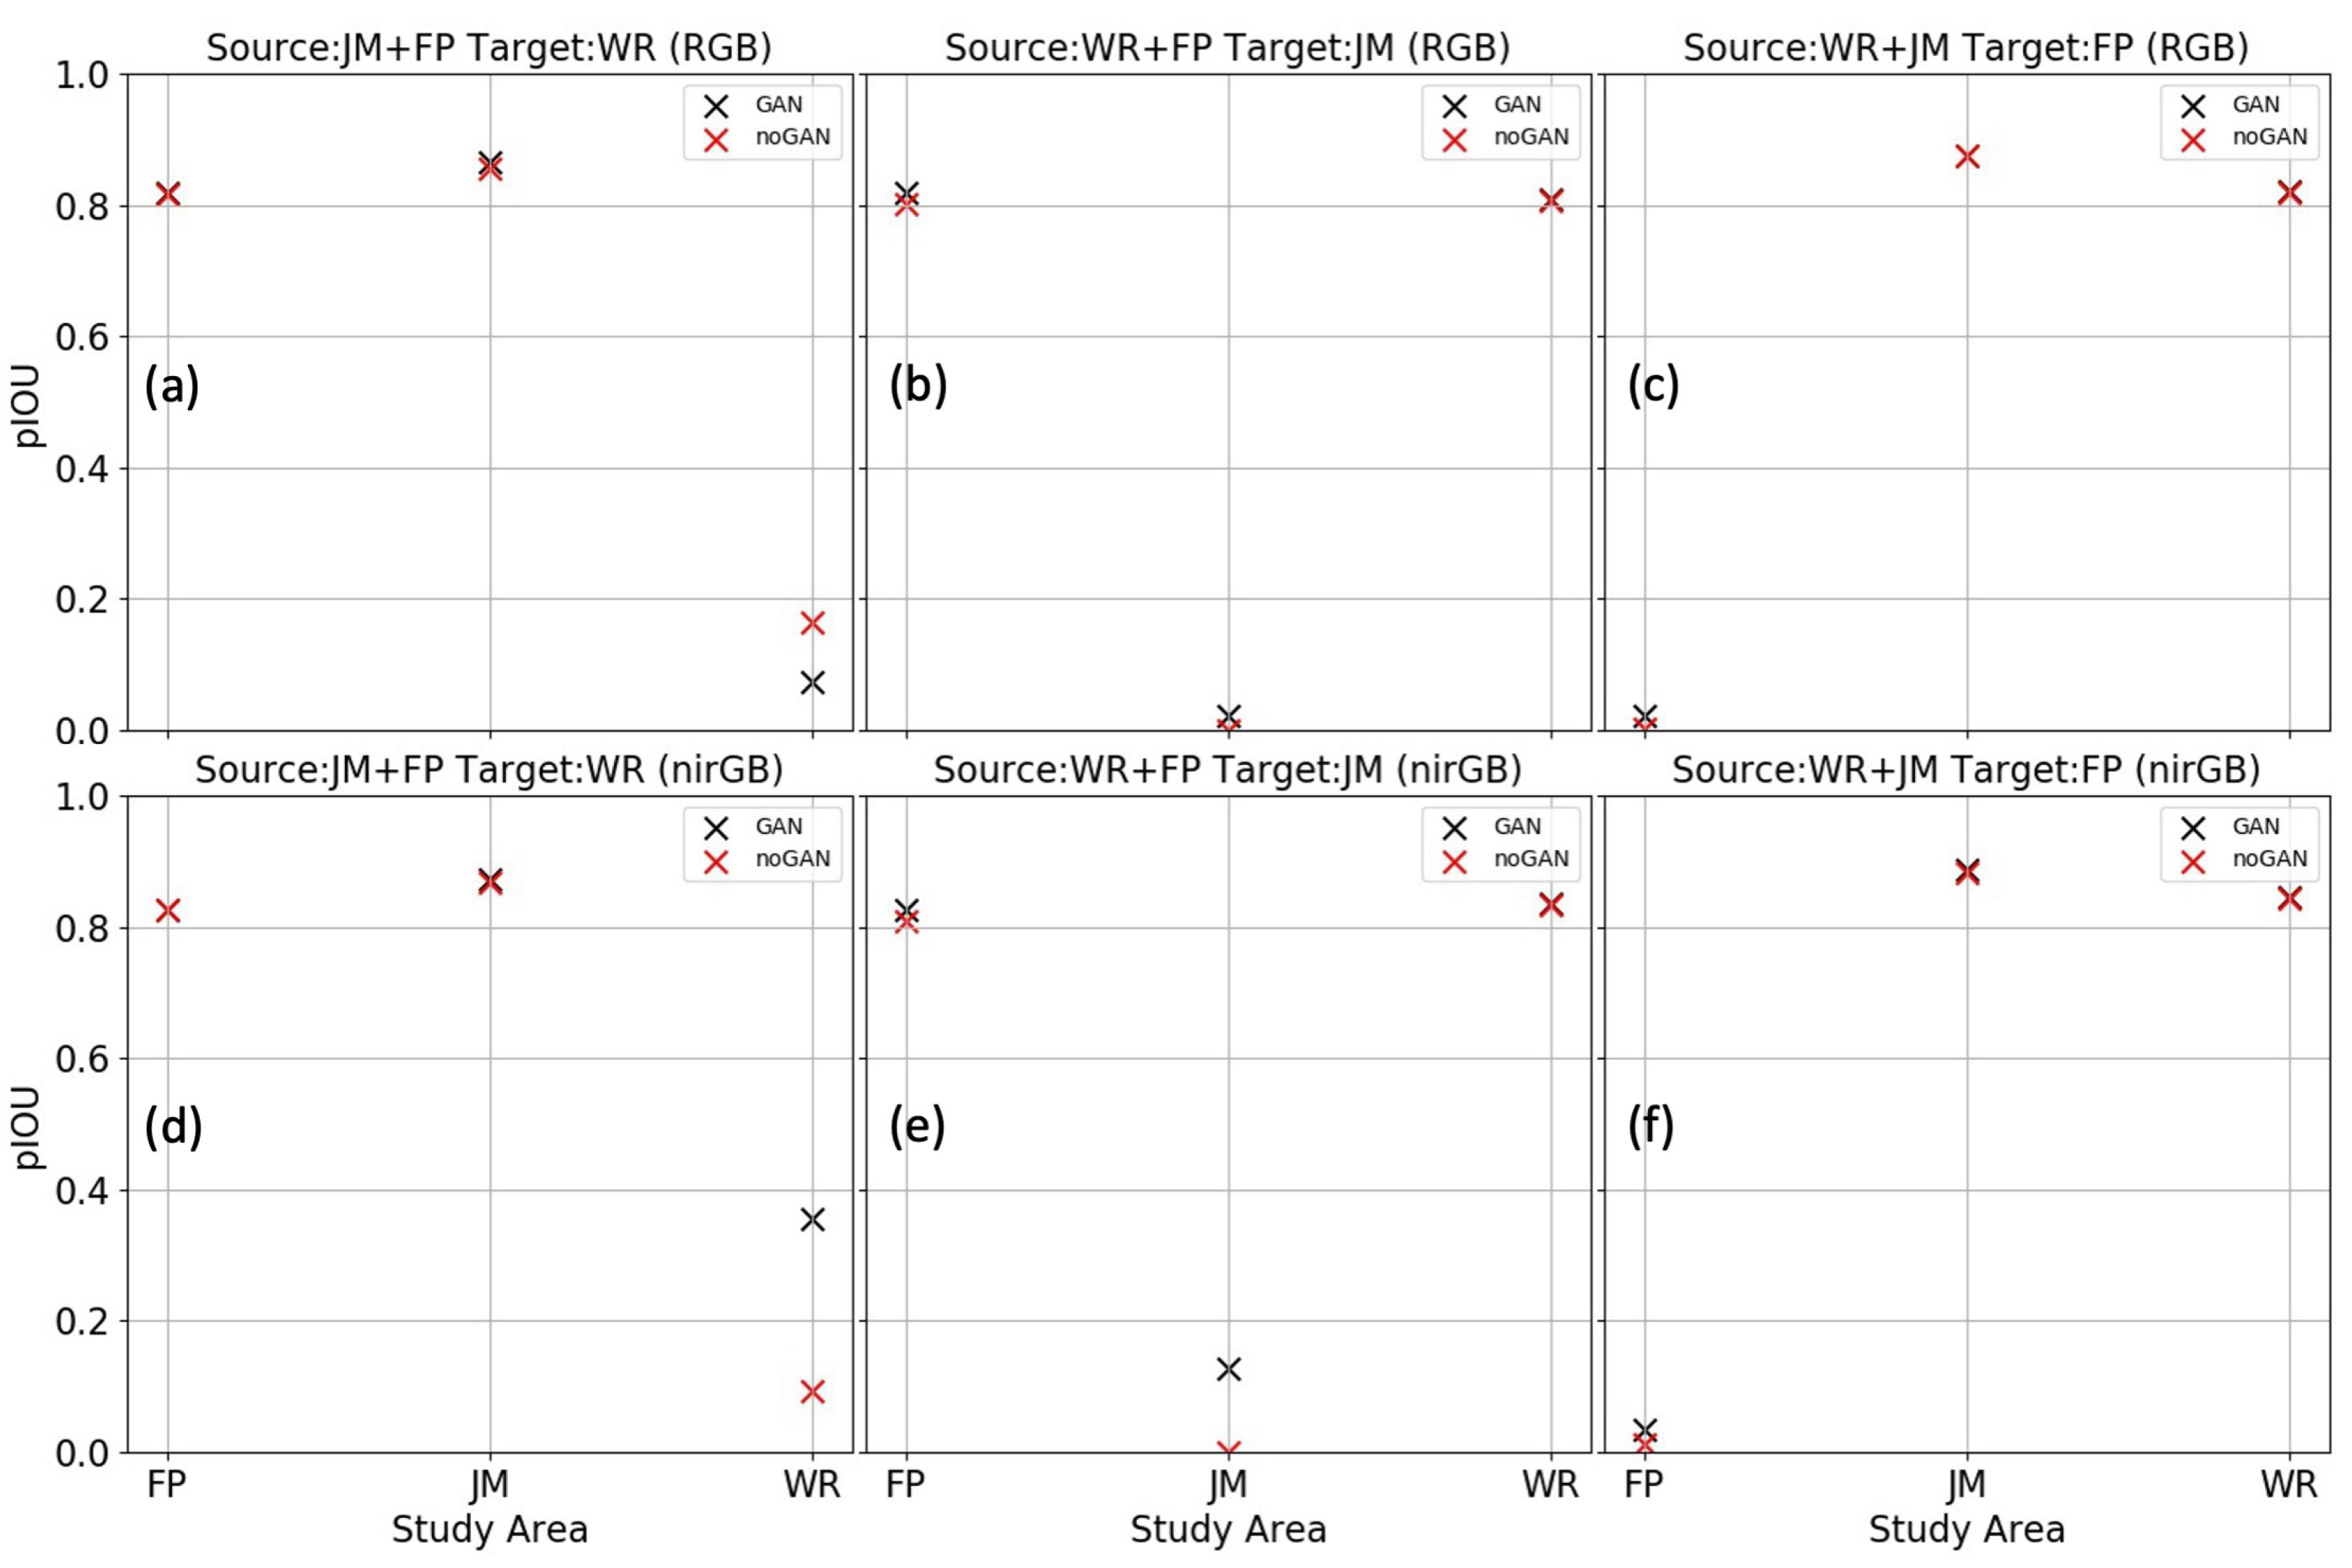
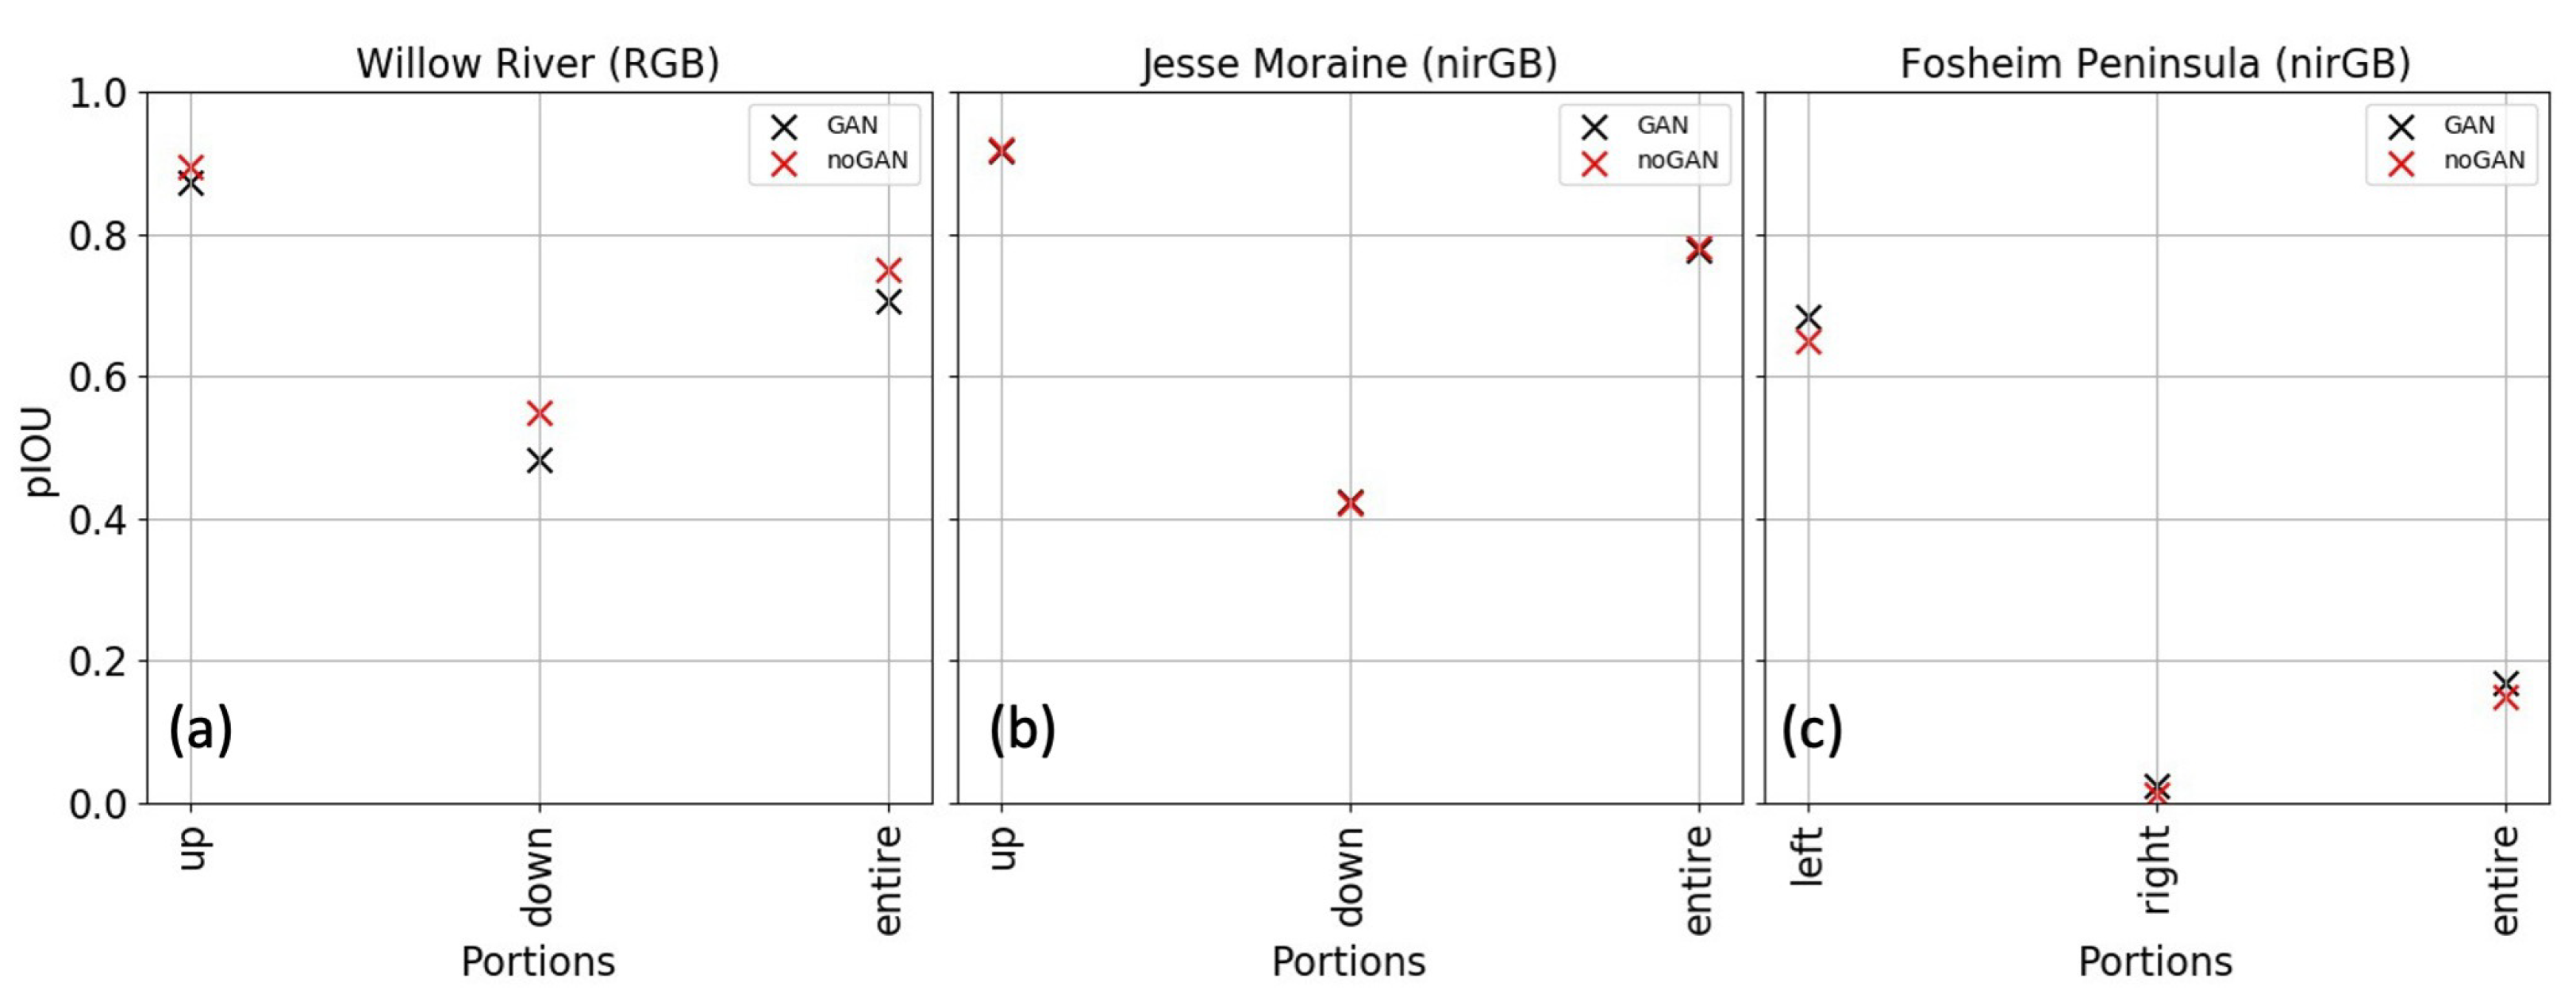
4.4. Translated Images and Improvement Due to Domain Adaptation
5. Discussion
5.1. The Performance of the Deep Learning Model
5.2. Strategies for Improving Transferability
5.3. Mapping Practice with Deep Learning
6. Conclusions
Author Contributions
Funding
Data Availability Statement
Acknowledgments
Conflicts of Interest
References
- Åkerman, H.J.; Johansson, M. Thawing Permafrost and Thicker Active Layers in Sub-Arctic Sweden. Permafr. Periglac. Process. 2008, 19, 279–292. [Google Scholar] [CrossRef]
- Biskaborn, B.K.; Smith, S.L.; Noetzli, J.; Matthes, H.; Vieira, G.; Streletskiy, D.A.; Schoeneich, P.; Romanovsky, V.E.; Lewkowicz, A.G.; Abramov, A.; et al. Permafrost Is Warming at a Global Scale. Nat. Commun. 2019, 10, 264. [Google Scholar] [CrossRef] [PubMed] [Green Version]
- Lewkowicz, A.G.; Way, R.G. Extremes of Summer Climate Trigger Thousands of Thermokarst Landslides in a High Arctic Environment. Nat. Commun. 2019, 10, 1329. [Google Scholar] [CrossRef] [PubMed] [Green Version]
- Smith, S.L.; O’Neill, H.B.; Isaksen, K.; Noetzli, J.; Romanovsky, V.E. The Changing Thermal State of Permafrost. Nat. Rev. Earth Environ. 2022, 3, 10–23. [Google Scholar] [CrossRef]
- Hjort, J.; Streletskiy, D.; Doré, G.; Wu, Q.; Bjella, K.; Luoto, M. Impacts of Permafrost Degradation on Infrastructure. Nat. Rev. Earth Environ. 2022, 3, 24–38. [Google Scholar] [CrossRef]
- Teufel, B.; Sushama, L. Abrupt Changes Across the Arctic Permafrost Region Endanger Northern Development. Nat. Clim. Chang. 2019, 9, 858–862. [Google Scholar] [CrossRef]
- Miner, K.R.; D’Andrilli, J.; Mackelprang, R.; Edwards, A.; Malaska, M.J.; Waldrop, M.P.; Miller, C.E. Emergent Biogeochemical Risks From Arctic Permafrost Degradation. Nat. Clim. Chang. 2021, 11, 809–819. [Google Scholar] [CrossRef]
- Hjort, J.; Karjalainen, O.; Aalto, J.; Westermann, S.; Romanovsky, V.E.; Nelson, F.E.; Etzelmüller, B.; Luoto, M. Degrading Permafrost Puts Arctic Infrastructure at Risk by Mid-Century. Nat. Commun. 2018, 9, 5147. [Google Scholar] [CrossRef]
- Turetsky, M.R.; Abbott, B.W.; Jones, M.C.; Walter Anthony, K.; Olefeldt, D.; Schuur, E.A.; Koven, C.; McGuire, A.D.; Grosse, G.; Kuhry, P.; et al. Permafrost Collapse Is Accelerating Carbon Release. Nature 2019, 569, 32–34. [Google Scholar] [CrossRef] [Green Version]
- Schaefer, K.; Elshorbany, Y.; Jafarov, E.; Schuster, P.F.; Striegl, R.G.; Wickland, K.P.; Sunderland, E.M. Potential Impacts of Mercury Released From Thawing Permafrost. Nat. Commun. 2020, 11, 1–6. [Google Scholar] [CrossRef]
- Miner, K.R.; Turetsky, M.R.; Malina, E.; Bartsch, A.; Tamminen, J.; McGuire, A.D.; Fix, A.; Sweeney, C.; Elder, C.D.; Miller, C.E. Permafrost Carbon Emissions in a Changing Arctic. Nat. Rev. Earth Environ. 2022, 3, 55–67. [Google Scholar] [CrossRef]
- Fraser, R.H.; Kokelj, S.V.; Lantz, T.C.; McFarlane-Winchester, M.; Olthof, I.; Lacelle, D. Climate Sensitivity of High Arctic Permafrost Terrain Demonstrated by Widespread Ice-Wedge Thermokarst on Banks Island. Remote Sens. 2018, 10, 954. [Google Scholar] [CrossRef] [Green Version]
- Farquharson, L.M.; Romanovsky, V.E.; Cable, W.L.; Walker, D.A.; Kokelj, S.V.; Nicolsky, D. Climate Change Drives Widespread and Rapid Thermokarst Development in Very Cold Permafrost in the Canadian High Arctic. Geophys. Res. Lett. 2019, 46, 6681–6689. [Google Scholar] [CrossRef] [Green Version]
- Nitze, I.; Cooley, S.W.; Duguay, C.R.; Jones, B.M.; Grosse, G. The Catastrophic Thermokarst Lake Drainage Events of 2018 in Northwestern Alaska: Fast-Forward Into the Future. Cryosphere 2020, 14, 4279–4297. [Google Scholar] [CrossRef]
- Swanson, D.K. Thermokarst and Precipitation Drive Changes in the Area of Lakes and Ponds in the National Parks of Northwestern Alaska, 1984–2018. Arctic Antarct. Alp. Res. 2019, 51, 265–279. [Google Scholar] [CrossRef] [Green Version]
- Lantz, T.; Turner, K. Changes in Lake Area in Response to Thermokarst Processes and Climate in Old Crow Flats, Yukon. J. Geophys. Res. Biogeosci. 2015, 120, 513–524. [Google Scholar] [CrossRef]
- Segal, R.A.; Lantz, T.C.; Kokelj, S.V. Acceleration of Thaw Slump Activity in Glaciated Landscapes of the Western Canadian Arctic. Environ. Res. Lett. 2016, 11, 034025. [Google Scholar] [CrossRef]
- Kokelj, S.; Tunnicliffe, J.; Lacelle, D.; Lantz, T.; Chin, K.; Fraser, R. Increased Precipitation Drives Mega Slump Development and Destabilization of Ice-Rich Permafrost Terrain, Northwestern Canada. Glob. Planet. Chang. 2015, 129, 56–68. [Google Scholar] [CrossRef] [Green Version]
- Ward Jones, M.K.; Pollard, W.H.; Jones, B.M. Rapid Initialization of Retrogressive Thaw Slumps in the Canadian High Arctic and Their Response to Climate and Terrain Factors. Environ. Res. Lett. 2019, 14, 055006. [Google Scholar] [CrossRef]
- Andrews, T.D.; Kokelj, S.V.; MacKay, G.; Buysse, J.; Kritsch, I.; Andre, A.; Lantz, T. Permafrost Thaw and Aboriginal Cultural Landscapes in the Gwich’in Region, Canada. APT Bull. J. Preserv. Technol. 2016, 47, 15–22. [Google Scholar]
- Proverbs, T.A.; Lantz, T.C. Cumulative Environmental Impacts in the Gwich’in Cultural Landscape. Sustainability 2020, 12, 4667. [Google Scholar] [CrossRef]
- Cassidy, A.E.; Christen, A.; Henry, G.H. Impacts of Active Retrogressive Thaw Slumps on Vegetation, Soil, and Net Ecosystem Exchange of Carbon Dioxide in the Canadian High Arctic. Arct. Sci. 2017, 3, 179–202. [Google Scholar] [CrossRef] [Green Version]
- Littlefair, C.A.; Tank, S.E.; Kokelj, S.V. Retrogressive Thaw Slumps Temper Dissolved Organic Carbon Delivery to Streams of the Peel Plateau, Nwt, Canada. Biogeosciences 2017, 14, 5487–5505. [Google Scholar] [CrossRef] [Green Version]
- Shakil, S.; Tank, S.; Kokelj, S.; Vonk, J.; Zolkos, S. Particulate Dominance of Organic Carbon Mobilization From Thaw Slumps on the Peel Plateau, NT: Quantification and Implications for Stream Systems and Permafrost Carbon Release. Environ. Res. Lett. 2020, 15, 114019. [Google Scholar] [CrossRef]
- Zolkos, S.; Tank, S.E.; Striegl, R.G.; Kokelj, S.V. Thermokarst Effects on Carbon Dioxide and Methane Fluxes in Streams on the Peel Plateau (NWT, Canada). J. Geophys. Res. Biogeosci. 2019, 124, 1781–1798. [Google Scholar] [CrossRef]
- Voigt, C.; Marushchak, M.E.; Abbott, B.W.; Biasi, C.; Elberling, B.; Siciliano, S.D.; Sonnentag, O.; Stewart, K.J.; Yang, Y.; Martikainen, P.J. Nitrous Oxide Emissions From Permafrost-Affected Soils. Nat. Rev. Earth Environ. 2020, 1, 420–434. [Google Scholar] [CrossRef]
- Pierre, K.A.S.; Zolkos, S.; Shakil, S.; Tank, S.E.; St. Louis, V.L.; Kokelj, S.V. Unprecedented Increases in Total and Methyl Mercury Concentrations Downstream of Retrogressive Thaw Slumps in the Western Canadian Arctic. Environ. Sci. Technol. 2018, 52, 14099–14109. [Google Scholar] [CrossRef]
- Van der Sluijs, J.; Kokelj, S.V.; Fraser, R.H.; Tunnicliffe, J.; Lacelle, D. Permafrost Terrain Dynamics and Infrastructure Impacts Revealed by UAV Photogrammetry and Thermal Imaging. Remote Sens. 2018, 10, 1734. [Google Scholar] [CrossRef] [Green Version]
- Crate, S.; Ulrich, M.; Habeck, J.O.; Desyatkin, A.R.; Desyatkin, R.V.; Fedorov, A.N.; Hiyama, T.; Iijima, Y.; Ksenofontov, S.; Mészáros, C.; et al. Permafrost Livelihoods: A Transdisciplinary Review and Analysis of Thermokarst-Based Systems of Indigenous Land Use. Anthropocene 2017, 18, 89–104. [Google Scholar] [CrossRef]
- Nicu, I.C.; Lombardo, L.; Rubensdotter, L. Preliminary Assessment of Thaw Slump Hazard to Arctic Cultural Heritage in Nordenskiöld Land, Svalbard. Landslides 2021, 18, 2935–2947. [Google Scholar] [CrossRef]
- Brooker, A.; Fraser, R.H.; Olthof, I.; Kokelj, S.V.; Lacelle, D. Mapping the Activity and Evolution of Retrogressive Thaw Slumps by Tasselled Cap Trend Analysis of a Landsat Satellite Image Stack. Permafr. Periglac. Process. 2014, 25, 243–256. [Google Scholar] [CrossRef]
- Nitze, I.; Grosse, G.; Jones, B.M.; Romanovsky, V.E.; Boike, J. Remote Sensing Quantifies Widespread Abundance of Permafrost Region Disturbances Across the Arctic and Subarctic. Nat. Commun. 2018, 9, 5423. [Google Scholar] [CrossRef] [PubMed]
- Lara, M.J.; Chipman, M.L.; Hu, F.S. Automated Detection of Thermoerosion in Permafrost Ecosystems Using Temporally Dense Landsat Image Stacks. Remote Sens. Environ. 2019, 221, 462–473. [Google Scholar] [CrossRef]
- Rudy, A.C.; Lamoureux, S.F.; Treitz, P.; Collingwood, A. Identifying Permafrost Slope Disturbance Using Multi-Temporal Optical Satellite Images and Change Detection Techniques. Cold Reg. Sci. Technol. 2013, 88, 37–49. [Google Scholar] [CrossRef]
- LeCun, Y.; Bengio, Y.; Hinton, G. Deep Learning. Nature 2015, 521, 436–444. [Google Scholar] [CrossRef]
- Huang, L.; Luo, J.; Lin, Z.; Niu, F.; Liu, L. Using Deep Learning to Map Retrogressive Thaw Slumps in the Beiluhe Region (Tibetan Plateau) from CubeSat Images. Remote Sens. Environ. 2020, 237, 111534. [Google Scholar] [CrossRef]
- Nitze, I.; Heidler, K.; Barth, S.; Grosse, G. Developing and Testing a Deep Learning Approach for Mapping Retrogressive Thaw Slumps. Remote Sens. 2021, 13, 4294. [Google Scholar] [CrossRef]
- Zhang, W.; Witharana, C.; Liljedahl, A.; Kanevskiy, M. Deep Convolutional Neural Networks for Automated Characterization of Arctic Ice-Wedge Polygons in Very High Spatial Resolution Aerial Imagery. Remote Sens. 2018, 10, 1487. [Google Scholar] [CrossRef] [Green Version]
- Abolt, C.J.; Young, M.H.; Atchley, A.L.; Wilson, C.J. Brief Communication: Rapid Machine-Learning-Based Extraction and Measurement of Ice Wedge Polygons in High-Resolution Digital Elevation Models. Cryosphere 2019, 13, 237–245. [Google Scholar] [CrossRef] [Green Version]
- Ecosystem Classification Group. Ecological Regions of the Northwest Territories–Southern Arctic; Department of Environment and Natural Resources, Government of the Northwest Territories: Yellowknife, NT, Canada, 2012; pp. 170 + insert map. [Google Scholar]
- Ecosystem Classification Group. Ecological Regions of the Northwest Territories–Northern Arctic; Department of Environment and Natural Resources, Government of the Northwest Territories: Yellowknife, NT, Canada, 2013; pp. 157 + insert map. [Google Scholar]
- Edlund, S.; Alt, B.; Young, K. Interaction of Climate, Vegetation, and Soil Hydrology at Hot Weather Creek, Fosheim Peninsula, Ellesmere Island, Northwest Territories. Curr. Res. Part D Geol. Surv. Can. Pap. 1989, 89, 125–133. [Google Scholar]
- Ecosystem Classification Group. Ecological Regions of the Northwest Territories–Cordillera; Department of Environment and Natural Resources, Government of the Northwest Territories: Yellowknife, NT, Canada, 2010; pp. 245 + insert map. [Google Scholar]
- Lacelle, D.; Bjornson, J.; Lauriol, B. Climatic and Geomorphic Factors Affecting Contemporary (1950–2004) Activity of Retrogressive Thaw Slumps on the Aklavik Plateau, Richardson Mountains, NWT, Canada. Permafr. Periglac. Process. 2010, 21, 1–15. [Google Scholar] [CrossRef]
- Rudy, A.; Lamoureux, S.; Kokelj, S.; Smith, I.; England, J. Accelerating Thermokarst Transforms Ice-Cored Terrain Triggering a Downstream Cascade to the Ocean. Geophys. Res. Lett. 2017, 44, 11–80. [Google Scholar] [CrossRef]
- Kokelj, S.V.; Lantz, T.C.; Tunnicliffe, J.; Segal, R.; Lacelle, D. Climate-Driven Thaw of Permafrost Preserved Glacial Landscapes, Northwestern Canada. Geology 2017, 45, 371–374. [Google Scholar] [CrossRef] [Green Version]
- Huang, L.; Liu, L.; Jiang, L.; Zhang, T. Automatic Mapping of Thermokarst Landforms From Remote Sensing Images Using Deep Learning: A Case Study in the Northeastern Tibetan Plateau. Remote Sens. 2018, 10, 2067. [Google Scholar] [CrossRef] [Green Version]
- Chen, L.C.; Zhu, Y.; Papandreou, G.; Schroff, F.; Adam, H. Encoder-Decoder with Atrous Separable Convolution for Semantic Image Segmentation. In Proceedings of the European Conference on Computer Vision (ECCV), Munich, Germany, 8–14 September 2018; pp. 801–818. [Google Scholar]
- Everingham, M.; Eslami, S.A.; Gool, L.V.; Williams, C.K.; Winn, J.; Zisserman, A. The Pascal Visual Object Classes Challenge: A Retrospective. Int. J. Comput. Vis. 2015, 111, 98–136. [Google Scholar] [CrossRef]
- Chollet, F. Xception: Deep Learning With Depthwise Separable Convolutions. In Proceedings of the 2017 IEEE Conference on Computer Vision and Pattern Recognition (CVPR), Honolulu, HI, USA, 21–26 July 2017; pp. 1800–1807. [Google Scholar]
- Sandler, M.; Howard, A.; Zhu, M.; Zhmoginov, A.; Chen, L.C. MobileNetV2: Inverted Residuals and Linear Bottlenecks. In Proceedings of the IEEE Conference on Computer Vision and Pattern Recognition, Salt Lake City, UT, USA, 18–22 June 2018; pp. 4510–4520. [Google Scholar]
- Howard, A.; Sandler, M.; Chu, G.; Chen, L.C.; Chen, B.; Tan, M.; Wang, W.; Zhu, Y.; Pang, R.; Vasudevan, V.; et al. Searching for MobileNetV3. In Proceedings of the IEEE/CVF International Conference on Computer Vision, Seoul, Korea, 27 October–2 November 2019; pp. 1314–1324. [Google Scholar]
- He, K.; Zhang, X.; Ren, S.; Sun, J. Deep Residual Learning for Image Recognition. In Proceedings of the IEEE Conference on Computer Vision and Pattern Recognition, Las Vegas, NV, USA, 27–30 June 2016; pp. 770–778. [Google Scholar]
- Porter, C.; Morin, P.; Howat, I.; Noh, M.J.; Bates, B.; Peterman, K.; Keesey, S.; Schlenk, M.; Gardiner, J.; Tomko, K.; et al. ArcticDEM 2018. Available online: https://www.pgc.umn.edu/data/arcticdem/ (accessed on 15 December 2021). [CrossRef]
- Liu, C.; Chen, L.C.; Schroff, F.; Adam, H.; Hua, W.; Yuille, A.L.; Fei-Fei, L. Auto-Deeplab: Hierarchical Neural Architecture Search for Semantic Image Segmentation. In Proceedings of the IEEE/CVF Conference on Computer Vision and Pattern Recognition, Long Beach, CA, USA, 15–20 June 2019; pp. 82–92. [Google Scholar]
- Liaw, R.; Liang, E.; Nishihara, R.; Moritz, P.; Gonzalez, J.E.; Stoica, I. Tune: A Research Platform for Distributed Model Selection and Training. arXiv 2018, arXiv:1807.05118. [Google Scholar]
- Wang, M.; Deng, W. Deep Visual Domain Adaptation: A Survey. Neurocomputing 2018, 312, 135–153. [Google Scholar] [CrossRef] [Green Version]
- Ben-David, S.; Blitzer, J.; Crammer, K.; Kulesza, A.; Pereira, F.; Vaughan, J.W. A Theory of Learning From Different Domains. Mach. Learn. 2010, 79, 151–175. [Google Scholar] [CrossRef] [Green Version]
- Huang, L.; Liu, L.; Luo, J.; Lin, Z.; Niu, F. Automatically Quantifying Evolution of Retrogressive Thaw Slumps in Beiluhe (Tibetan Plateau) From Multi-Temporal Cubesat Images. Int. J. Appl. Earth Obs. Geoinf. 2021, 102, 102399. [Google Scholar] [CrossRef]
- Goodfellow, I.; Pouget-Abadie, J.; Mirza, M.; Xu, B.; Warde-Farley, D.; Ozair, S.; Courville, A.; Bengio, Y. Generative Adversarial Nets. Adv. Neural Inf. Process. Syst. 2014, 27, 1–9. [Google Scholar]
- Zhu, J.Y.; Park, T.; Isola, P.; Efros, A.A. Unpaired Image-To-Image Translation Using Cycle-Consistent Adversarial Networks. In Proceedings of the IEEE International Conference on Computer Vision, Venice, Italy, 22–29 October 2017; pp. 2223–2232. [Google Scholar]
- Cubuk, E.D.; Zoph, B.; Mane, D.; Vasudevan, V.; Le, Q.V. Autoaugment: Learning Augmentation Strategies From Data. In Proceedings of the IEEE/CVF Conference on Computer Vision and Pattern Recognition, Long Beach, CA, USA, 16–17 June 2019; pp. 113–123. [Google Scholar]
- Xia, Z.; Huang, L.; Fan, C.; Jia, S.; Lin, Z.; Liu, L.; Luo, J.; Niu, F.; Zhang, T. Retrogressive Thaw Slumps Along the Qinghai-Tibet Engineering Corridor: A Comprehensive Inventory and Their Distribution Characteristics. Earth Syst. Sci. Data Discuss. 2022, 1–19. [Google Scholar] [CrossRef]


| Regions | Image Type | Acquisition Dates in 2020 |
|---|---|---|
| Willow River (WR) | Mosaic | 18 August |
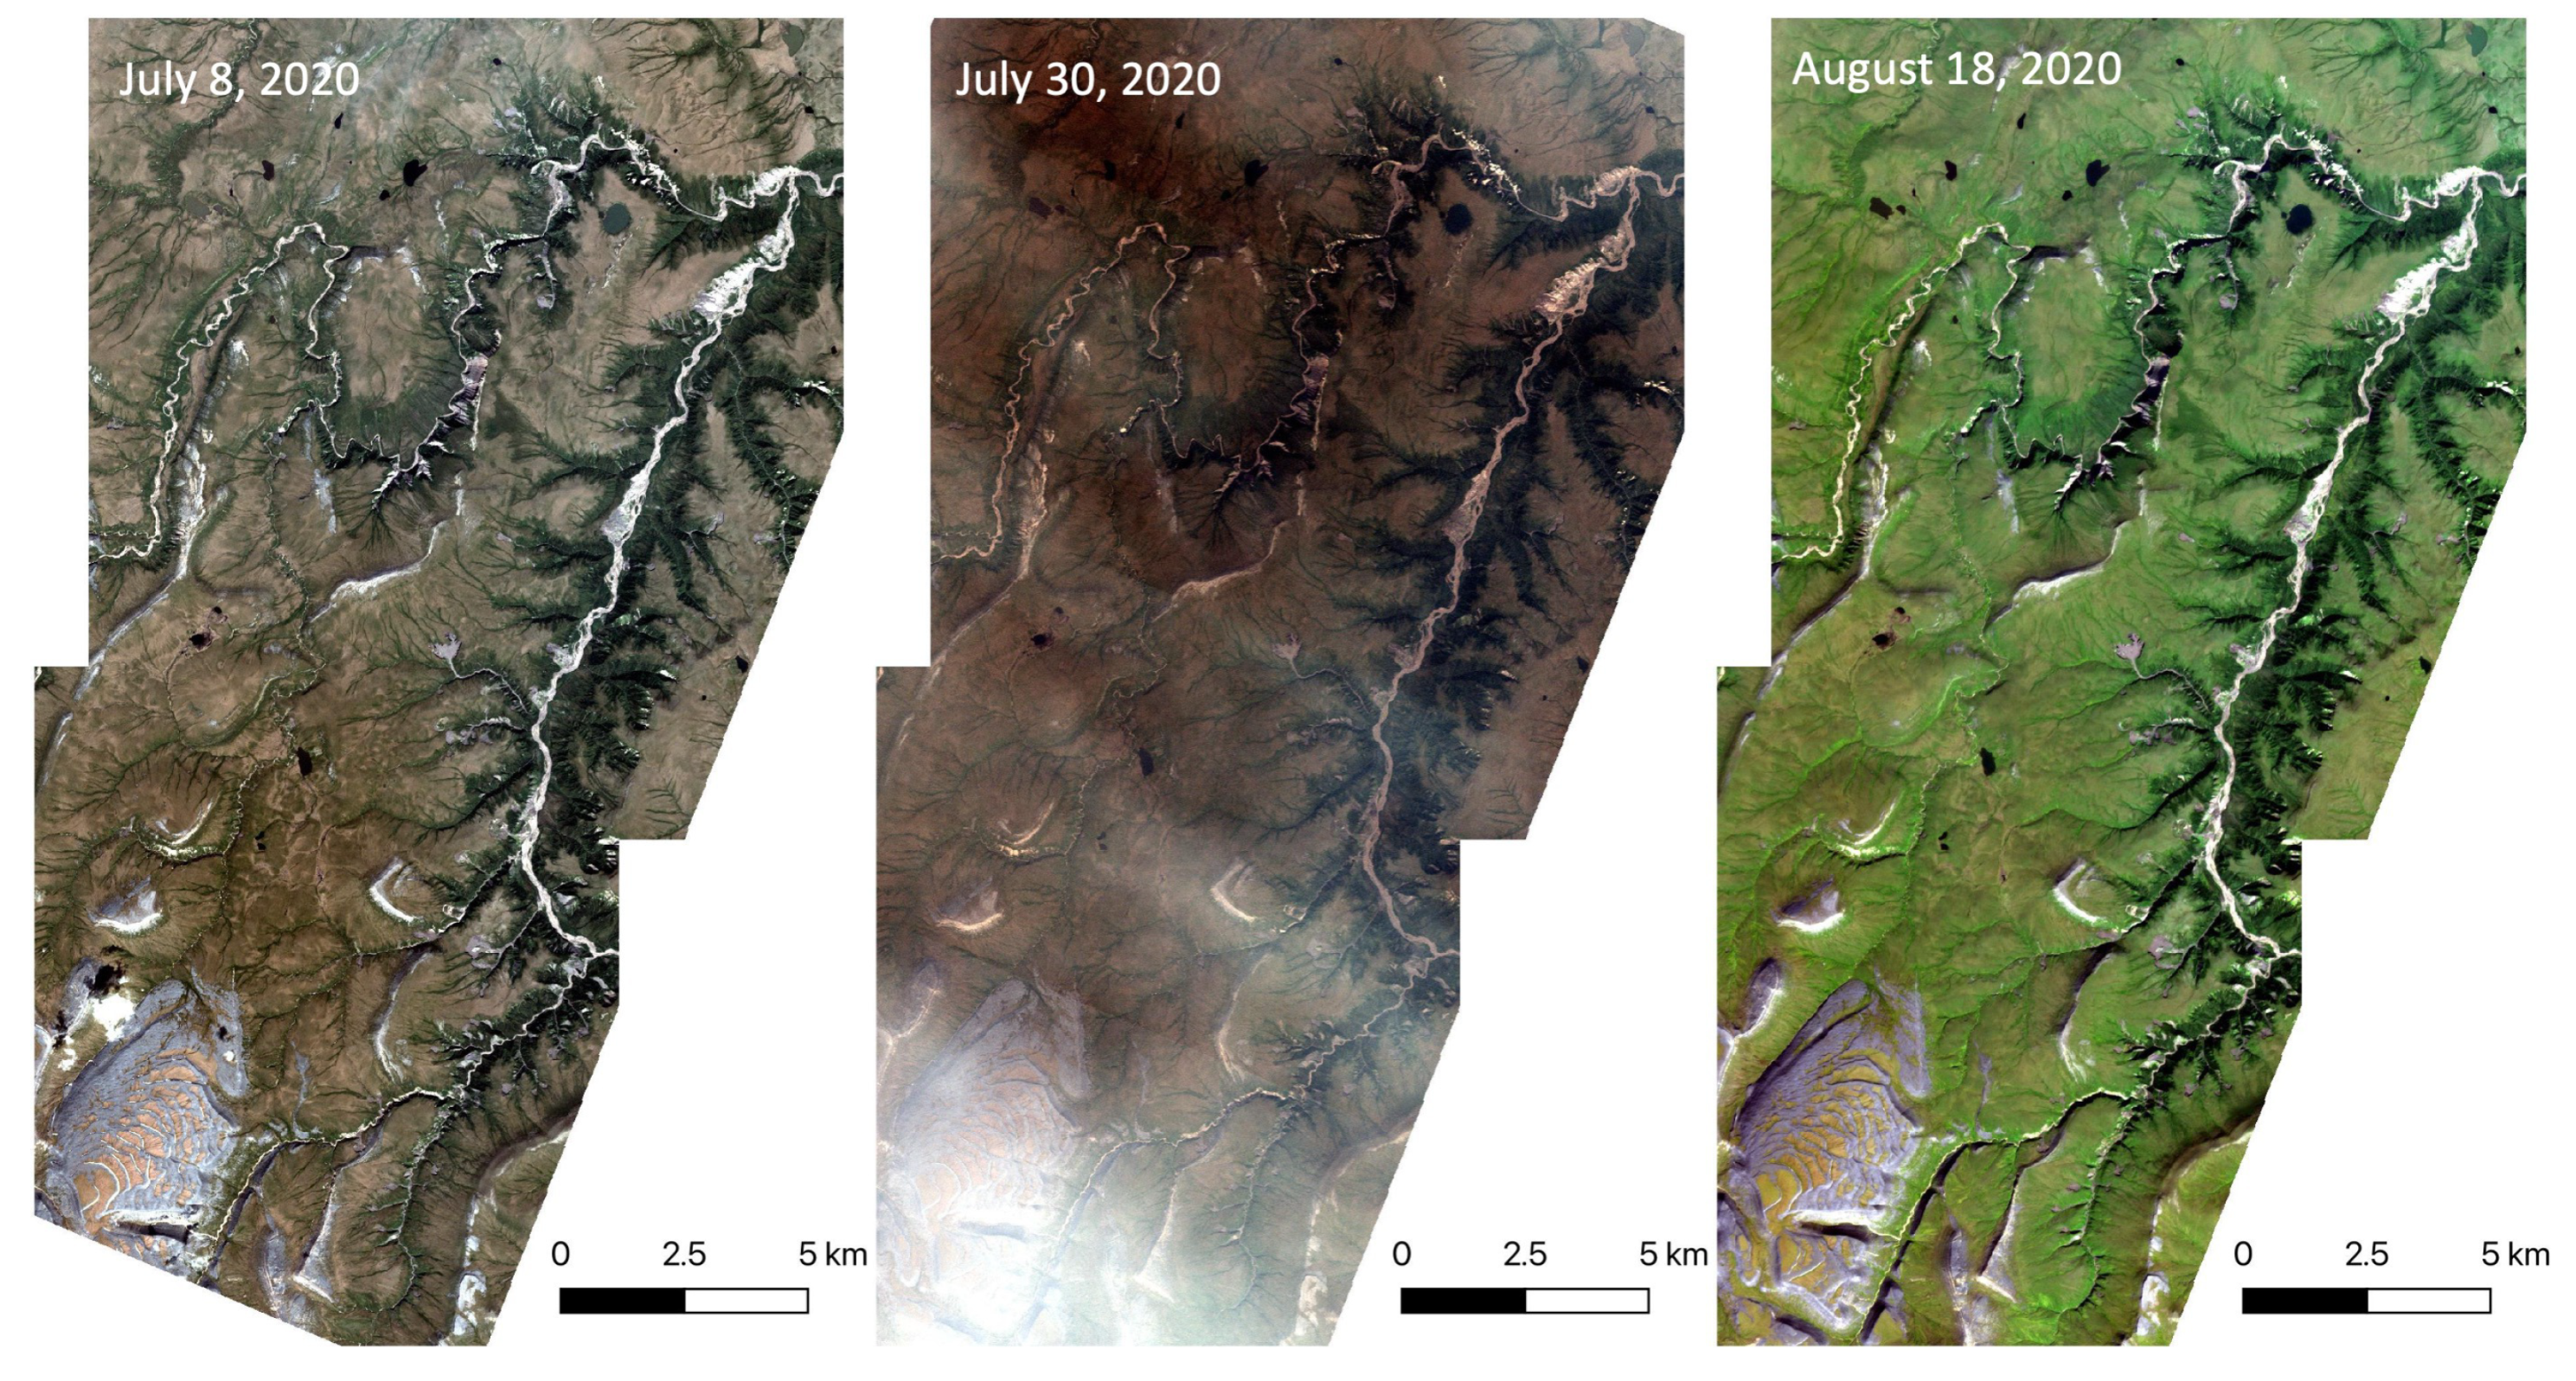
| Daily | 7, 8, 11, 13, 23, 70, 31 July; 18, 19, 24, 28, 29 August | |
| Jesse Moraine (JM) | Mosaic | 20 August |
| Daily | 5, 25 July; 11, 20 August | |
| Fosheim Peninsula (FP) | Mosaic | 7 and 8 August |
| Daily | 7, 17 July; 9 August |
| Region (Image) | True Positive | False Positive | False Negative | Precision | Recall | F1-Score |
|---|---|---|---|---|---|---|
| Jesse Moraine (nirGB) | 219 | 35 | 43 | 0.862 | 0.836 | 0.849 |
| Jesse Moraine (RGB) | 206 | 46 | 56 | 0.817 | 0.786 | 0.802 |
| Fosheim Peninsula (nirGB) | 108 | 19 | 54 | 0.850 | 0.667 | 0.747 |
| Fosheim Peninsula (RGB) | 97 | 28 | 65 | 0.776 | 0.599 | 0.676 |
| Willow River (nirGB) | 154 | 29 | 43 | 0.842 | 0.782 | 0.811 |
| Willow River (RGB) | 148 | 28 | 49 | 0.841 | 0.751 | 0.794 |
| Augmentation Option | Accuracy Statistics | ||
|---|---|---|---|
| Mean pIOU | Max pIOU | Min pIOU | |
| flip | 0.8263 | 0.845 | 0.7987 |
| blur | 0.8295 | 0.8499 | 0.8074 |
| crop | 0.8307 | 0.8499 | 0.8088 |
| scale | 0.8291 | 0.8486 | 0.7987 |
| rotate | 0.8222 | 0.8481 | 0.7984 |
| bright | 0.8282 | 0.8499 | 0.8074 |
| contrast | 0.8288 | 0.8499 | 0.7987 |
| noise | 0.8273 | 0.8499 | 0.7987 |
| # | Image Dates | 3-Band | Mean pIOU | Max pIOU | Options Used (Max pIOU) |
|---|---|---|---|---|---|
| 1 | 0707 | nirGB | 0.4260 | 0.5018 | flip, blur, scale, bright, contrast, noise |
| 2 | RGB | 0.1112 | 0.2685 | crop, contrast, noise | |
| 3 | 0708 | nirGB | 0.5864 | 0.6741 | blur, crop, bright, contrast, noise |
| 4 | RGB | 0.5746 | 0.6493 | blur, crop, scale, bright, noise | |
| 5 | 0711 | nirGB | 0.5598 | 0.6100 | blur, crop, scale, bright, contrast, noise |
| 6 | RGB | 0.5054 | 0.5677 | flip, blur, crop, bright | |
| 7 | 0713 | nirGB | 0.4704 | 0.5382 | blur, scale, bright, contrast, noise |
| 8 | RGB | 0.3214 | 0.4481 | crop, bright, noise | |
| 9 | 0723 | nirGB | 0.6746 | 0.7232 | blur, crop, scale, contrast, noise |
| 10 | RGB | 0.5630 | 0.6656 | crop, contrast, noise | |
| 11 | 0730 | nirGB | 0.5669 | 0.6462 | blur, scale, bright, contrast, noise |
| 12 | RGB | 0.1966 | 0.3542 | crop, contrast, noise | |
| 13 | 0731 | nirGB | 0.5354 | 0.6010 | blur, rotate, bright, contrast, noise |
| 14 | RGB | 0.0622 | 0.1980 | blur, crop, rotate, bright, noise | |
| 15 | 0818 | nirGB | 0.7812 | 0.7927 | flip, blur, crop, scale, rotate, contrast |
| 16 | RGB | 0.7759 | 0.7891 | flip, scale, contrast | |
| 17 | 0819 | nirGB | 0.1740 | 0.3474 | flip, crop, rotate, bright, contrast, noise |
| 18 | 0824 | nirGB | 0.1169 | 0.2984 | crop |
| 19 | RGB | 0.1301 | 0.2375 | flip, scale, bright, contrast, noise | |
| 20 | 0828 | nirGB | 0.4578 | 0.5452 | crop, bright, contrast, noise |
| 21 | RGB | 0.1773 | 0.2774 | crop, contrast, noise | |
| 22 | 0829 | nirGB | 0.4875 | 0.5999 | crop, bright, contrast, noise |
| 23 | RGB | 0.2636 | 0.3725 | crop, contrast, noise |
| # | Backbone | Prediction Time (hours) |
|---|---|---|
| 1 | Xception41 | 6.78 |
| 2 | Xception65 | 9.29 |
| 3 | Xception71 | 9.79 |
| 4 | Resnet_v1_101 | 5.83 |
| 5 | Resnet_v1_50 | 3.82 |
| 6 | Mobilenetv2 | 1.79 |
| 7 | Mobilenetv3_large | 0.64 |
| 8 | Mobilenetv3_small | 0.52 |
Publisher’s Note: MDPI stays neutral with regard to jurisdictional claims in published maps and institutional affiliations. |
© 2022 by the authors. Licensee MDPI, Basel, Switzerland. This article is an open access article distributed under the terms and conditions of the Creative Commons Attribution (CC BY) license (https://creativecommons.org/licenses/by/4.0/).
Share and Cite
Huang, L.; Lantz, T.C.; Fraser, R.H.; Tiampo, K.F.; Willis, M.J.; Schaefer, K. Accuracy, Efficiency, and Transferability of a Deep Learning Model for Mapping Retrogressive Thaw Slumps across the Canadian Arctic. Remote Sens. 2022, 14, 2747. https://doi.org/10.3390/rs14122747
Huang L, Lantz TC, Fraser RH, Tiampo KF, Willis MJ, Schaefer K. Accuracy, Efficiency, and Transferability of a Deep Learning Model for Mapping Retrogressive Thaw Slumps across the Canadian Arctic. Remote Sensing. 2022; 14(12):2747. https://doi.org/10.3390/rs14122747
Chicago/Turabian StyleHuang, Lingcao, Trevor C. Lantz, Robert H. Fraser, Kristy F. Tiampo, Michael J. Willis, and Kevin Schaefer. 2022. "Accuracy, Efficiency, and Transferability of a Deep Learning Model for Mapping Retrogressive Thaw Slumps across the Canadian Arctic" Remote Sensing 14, no. 12: 2747. https://doi.org/10.3390/rs14122747