
Fast Bayesian Compressed Sensing Algorithm via Relevance Vector Machine for LASAR 3D Imaging


School of Information and Communication Engineering, University of Electronic Science and Technology of China, Chengdu 611731, China
*
Author to whom correspondence should be addressed.
Remote Sens. 2021, 13(9), 1751; https://doi.org/10.3390/rs13091751
Submission received: 19 March 2021
/
Revised: 27 April 2021
/
Accepted: 28 April 2021
/
Published: 30 April 2021
(This article belongs to the Special Issue 2nd Edition Radar and Sonar Imaging and Processing)
Abstract
:Because of the three-dimensional (3D) imaging scene’s sparsity, compressed sensing (CS) algorithms can be used for linear array synthetic aperture radar (LASAR) 3D sparse imaging. CS algorithms usually achieve high-quality sparse imaging at the expense of computational efficiency. To solve this problem, a fast Bayesian compressed sensing algorithm via relevance vector machine (FBCS–RVM) is proposed in this paper. The proposed method calculates the maximum marginal likelihood function under the framework of the RVM to obtain the optimal hyper-parameters; the scattering units corresponding to the non-zero optimal hyper-parameters are extracted as the target-areas in the imaging scene. Then, based on the target-areas, we simplify the measurement matrix and conduct sparse imaging. In addition, under low signal to noise ratio (SNR), low sampling rate, or high sparsity, the target-areas cannot always be extracted accurately, which probably contain several elements whose scattering coefficients are too small and closer to 0 compared to other elements. Those elements probably make the diagonal matrix singular and irreversible; the scattering coefficients cannot be estimated correctly. To solve this problem, the inverse matrix of the singular matrix is replaced with the generalized inverse matrix obtained by the truncated singular value decomposition (TSVD) algorithm to estimate the scattering coefficients correctly. Based on the rank of the singular matrix, those elements with small scattering coefficients are extracted and eliminated to obtain more accurate target-areas. Both simulation and experimental results show that the proposed method can improve the computational efficiency and imaging quality of LASAR 3D imaging compared with the state-of-the-art CS-based methods.

1. Introduction
Synthetic aperture radar (SAR) is a radar imaging technology and has been applied in different fields such as ocean surface monitoring [1], target identification and classification [2,3], resource exploration [4], and natural calamity monitoring [5] successfully because of its all-day and all-weather working capabilities. Traditional SAR images only reflect the two-dimensional (2D) information of targets while usually lose targets’ information in the height direction; they cannot reflect the three-dimensional (3D) structure of targets. This disadvantage limits the application of SAR seriously, and how to obtain targets’ 3D imaging results is an important research area in SAR imaging fields.
In recent years, scholars have obtained targets’ 3D information successfully under different SAR modes such as the tomography SAR (TomoSAR) [6], curvilinear SAR (CurSAR) [7], and linear array SAR (LASAR) [8,9]. The TomoSAR obtains the third-dimension imaging resolution by synthesizing the parallel baselines into a virtual aperture along the elevation direction [6]. The CurSAR usually synthesizes a curved array by controlling the moving trajectory of a single antenna; it combines the pulse compression technology to obtain the 3D imaging resolution [7]. The moving trajectories of both TomoSAR and CurSAR are strictly limited to achieve high-quality imaging, which limits their applications seriously [8]. In addition, the LASAR synthesizes the 2D equivalent array by the moving of linear array; it obtains the 3D imaging results of the imaging scene by combining the pulse compression technology. Compared with both TomoSAR and CurSAR, the LASAR has a better antenna phase center (APC) control accuracy and a flexible moving trajectory [8,9]. Therefore, the LASAR is studied for 3D imaging in this paper.
When performing the LASAR 3D imaging by the matched filter (MF) [10] algorithms, the array imaging resolution of LASAR is limited by the length of the linear array [11]. To realize high-quality imaging, the LASAR must satisfy the following two requirements:
- The spacing between adjacent elements in the linear array must satisfy the Nyquist sampling theorem to avoid the grating lobes [12].
- The echo signals of the whole linear array must be adopted to avoid the sidelobes interference as much as possible.
The above two requirements make the number of elements in the linear array very huge; the realization of the LASAR in the real hardware system is very complex and costly.
Compressed sensing (CS) algorithms [13,14,15,16] can recover the original sparse signals by using random sampling signals; they have been introduced into LASAR imaging successfully according to the sparsity of the LASAR imaging scene. When performing LASAR sparse imaging by different CS algorithms (e.g., the orthogonal matching pursuit (OMP) [17], the Bayesian compressed sensing (BCS) [18], the sparsity Bayesian recovery via iterative minimum (SBRIM) [19], and the iterative shrinkage thresholding (ISTA) [20] algorithm); those algorithms improve the array imaging resolution of LASAR. The linear array is usually replaced with the random sampling array to reduce the array elements used for sparse imaging.
Those CS algorithms must set several parameters (e.g., the sparsity of the imaging scene, the hyper-parameters in the BCS algorithms, the iteration stepsize in the ISTA algorithm) manually before conducting sparse imaging. Once the preset parameters are set inappropriately; CS algorithms probably suffer from the sidelobe interferences seriously and even cannot estimate the scattering coefficients correctly. Their computational complexity probably increase significantly. Those preset parameters cannot always meet the requirement of high-quality sparse imaging under different LASAR data; they need to be debugged repeatedly. Since the preset parameters usually do not need to be re-debugged under different LASAR data, the SBRIM algorithm obtains imaging results with relatively high quality among CS algorithms. However, its computational complexity is very huge because of the high-dimensional matrix operations (e.g., the matrix-inversion); the hardware system must have very strong computational power to complete the high-dimensional matrix operations. This disadvantage limits the applications of the SBRIM algorithm in 3D sparse imaging seriously. Therefore, we need to study how to improve the computational efficiency of the SBRIM algorithm under the premise of ensuring imaging quality.
Due to the strong sparsity of the 3D imaging scene, the target-areas usually only occupy a small part of the whole imaging scene. The measurement matrix in sparse imaging usually contains a large number of elements which are not related to the targets. Therefore, the computational efficiency of sparse imaging can be improved effectively by simplifying the measurement matrix. In our previous research, the fast sparse recovery algorithm via resolution approximation (FSRARA) [21] improves the computational efficiency of sparse imaging successfully through simplifying the measurement matrix according to the target-areas in the imaging scene. However, once the 3D preliminary imaging results are not obtained correctly, the FSRARA cannot extract the target-areas accurately and estimate the scattering coefficients correctly. Its imaging quality and computational efficiency decrease significantly. Therefore, we need to study a new fast CS algorithm for LASAR 3D imaging.
In this paper, we propose a fast Bayesian compressed sensing (FBCS–RVM) algorithm via relevance vector machine to achieve LASAR 3D sparse imaging with high efficiency and quality. Under the framework of the relevance vector machine (RVM) [22], every scattering unit in the imaging scene is given an independent hyper-parameter to measure its scattering coefficient’s estimation accuracy. The optimal hyper-parameters are obtained successfully by calculating the maximum marginal likelihood function, and the scattering units corresponding to the non-zero elements in the optimal hyper-parameters are extracted as the target-areas. Then, the target-areas are used as the prior information to simplify the measurement matrix and conduct sparse imaging. Under several imaging conditions (e.g., low signal to noise ratio (SNR) [23], low sampling rate, or high sparsity of the imaging scene), the target-areas cannot be always extracted accurately. They probably contain several elements whose scattering coefficients are too small or closer to 0 compared to other elements. Those elements make the diagonal matrix (which is calculated by the measurement matrix and the preliminary estimation values of the scattering coefficients; it is used to obtain the optimal scattering coefficients) singular and irreversible; the scattering coefficients cannot be estimated correctly. To solve this problem, the inverse matrix of the singular matrix is replaced with the generalized inverse matrix obtained by the truncated singular value decomposition (TSVD) [24] algorithm to correctly estimate the scattering coefficients. These elements with small scattering coefficients are extracted and eliminated to obtain more accurate target-areas. The main contributions of this paper are summarized as the following content:
- 1.
- The FBCS–RVM algorithm is proposed to achieve LASAR 3D sparse imaging with high imaging quality and computational efficiency.
- 2.
- The FBCS–RVM algorithm extracts scattering units corresponding to the non-zero optimal hyper-parameters in the RVM as the target-areas in the imaging scene.
- 3.
- The FBCS–RVM algorithm correctly estimates the scattering coefficients and obtains more accurate target-areas through eliminating the elements with small scattering coefficients in the target-areas by the TSVD algorithm.
The remaining sections are arranged as: the sparse imaging model of LASAR is given in Section 2. The basic principles of the FBCS–RVM algorithm are introduced in Section 3. Section 4 conducts the simulation and experimental results to illustrate the effectiveness and evaluate the performance of the FBCS–RVM algorithm. Section 5 and Section 6 give the discussions and conclusions of this paper, respectively.
2. The Sparse Imaging Model of LASAR
According to Figure 1, the linear array is located in the CT direction. LASAR obtains a 2D equivalent array by moving along the AT direction under a constant speed, and it obtains the 3D imaging results after combining the range compression technology. When conducting LASAR 3D imaging, the 3D imaging scene is usually considered as composed of discrete scattering units. After performing range compression on the original echo signals, according to the range information of the sampling points in the range domain, the 3D imaging scene is divided into equidistant planar 2D imaging scene along the range direction. Every equidistant planar 2D imaging scene is divided into M discrete scattering units with uniform spacing, where is the number of sampling points in the range domain.
Set the LASAR to transmit the linear frequency modulation (LFM) signal [25]. After range compression, the lth APC’s echo signal in the nth equidistant plane is:
where , , and . denotes the total number of APCs in the 2D equivalent array. represents the range domain. represents the wave-number of LASAR. is the distance between and . is the 3D coordinate of the lth APC in the 2D equivalent array. and represent the scattering coefficient and 3D coordinate of the mth scattering unit in the nth equidistant plane. represents the ambiguity function in the range direction.
Set to represent the delay phase between and ; the echo signal can be decomposed as:
where . . . is the vectorized symbol. is the nth equidistant planar scattering coefficients.
When considering all APCs in the 2D equivalent array, the linear representation model of the nth equidistant planar echo signal is defined as:
where represents the echo signal of the nth equidistant plane after range compression. represents the measurement matrix corresponding to and is composed of the phase delay between the APCs in the 2D array and the scattering units in the imaging scene. is the signal noise in .
Therefore, based on the CS theory, sparse imaging on the nth equidistant planar imaging scene is translated into getting the optimal value of the scattering coefficients by solving the norm optimization problem in Equation (4). In addition, the 3D imaging results are obtained by combining all equidistant planar 2D imaging results according to their information in the range direction:
where is the termination threshold of the signal noise.
However, when performing LASAR sparse imaging by CS algorithms, the parameters (e.g., the termination threshold or the sparsity of the imaging scene) should be debugged carefully and repeatably in most cases; this usually produces extensive computational complexity. In addition, the high-dimensional matrix operations in the several CS algorithms (e.g., the BCS and SBRIM algorithm) make their computational complexity huge. The huge computational complexity requires very strong computational power on the hardware system. Since the measurement matrix in Equation (3) is corresponding to all scattering units in the imaging scene, usually contains lots of elements that are not related to the targets because of the sparsity of the imaging scene. Therefore, we propose the FBCS–RVM algorithm to improve the computational efficiency of sparse imaging, which can extract the target-areas in the imaging scene and simplify the measurement matrix and its corresponding matrix operations.
3. FBCS–RVM
In this section, the FBCS–RVM algorithm is proposed to achieve sparse imaging with high quality and efficiency, which mainly includes two parts: extracting the target-areas and sparse imaging on the target-areas. Firstly, based on the sparsity of the 3D imaging scene, we treat extracting the target-areas as the classification of targets and background in the imaging scene. Inspired by the relevance vector machine (RVM) [22], we obtain the target-areas successfully by calculating the maximum marginal likelihood function in the RVM to classify the scattering units. Secondly, we use the target-areas as the prior information to simplify the measurement matrix and achieve sparse imaging with high efficiency. However, when the target-areas contain several elements whose scattering coefficients are too small or closer to zero compared to other elements, the diagonal matrix in sparse imaging becomes singular and the scattering coefficients cannot be correctly estimated. Then, we introduce the truncated singular value decomposition (TSVD) algorithm [24] to correctly estimate scattering coefficients and eliminate the elements with too small scattering coefficients in the target-areas.
According to Section 2, the 3D sparse imaging has been translated into 2D sparse imaging on every equidistant planar 2D imaging scene. We choose 2D sparse imaging on the nth equidistant planar 2D imaging scene as an example to introduce the basic steps of the FBCS–RVM algorithm in the following section. In addition, its flowchart is shown in Figure 2.
3.1. Extract the Target-Areas in the Imaging Scene
In this subsection, we classify the scattering units to extract the target-areas by calculating the maximum marginal likelihood function in the RVM. In addition, the maximum marginal likelihood function is obtained by calculating its maximum value corresponding to every scattering unit to improve the computational efficiency. The basic steps of extracting the target-areas are introduced in the following content.
Step 1: Obtain the real-valued echo signal and measurement matrix.
Since the RVM only can deal with real-valued data and both the echo signal and measurement matrix are complex-valued data, both and are represented equivalently by their real and imaginary parts before classifying the scattering units. The real-valued echo signal and scattering coefficients are obtained by Equation (5):
where and . and are the real and imaginary parts of the complex-valued data, respectively. Based on the equivalent representation of complex-valued echo signal and scattering coefficients in Equation (5), the echo signals’ linear representation model in Equation (3) is equivalently represented as:
where is the signal noise in . is the real-valued measurement matrix and shown in Equation (7):
Step 2: Initialize the basic parameters: the nth equidistant planar scattering coefficients and their corresponding hyper-parameters .
Based on Equation (6) and the matched filter (MF) algorithm, the initial scattering coefficients of the nth equidistant planar imaging scene are obtained by Equation (8):
where is the mth column vector in . M is the total number of the scattering units in the nth equidistant plane. Then, the independent hyper-parameters are introduced to evaluate the estimation accuracy and initialized by .
Step 3: Select the maximum element in as the initial target-areas.
To ensure the extraction of the scattering unit where targets as the initial target-areas exist, the scattering unit corresponding to the maximum element in is considered as the initial target-areas , which is the global maximum element and unique in the nth equidistant planar 2D imaging scene; it is also the local maximum value in the 3D imaging scene. Its serial number in the imaging scene is . Its hyper-parameter is calculated by Equation (9) to avoid full-zero hyper-parameters :
where . is the variance of the signal noise in .
Step 4: Calculate the optimal hyper-parameters to extract the target-areas.
We calculate the maximum marginal likelihood function in the RVM [26] after several iterations to obtain the optimal hyper-parameters; the scattering units corresponding to the non-zero optimal hyper-parameters are extracted as the target-areas. In the tth iteration, the marginal likelihood function is shown in Equation (10) and related to the echo signal, measurement matrix, and hyper-parameter’ estimation value:
where . is the identity matrix. is the variance of signal noise in . and are the diagonal matrix and vector of the hyper-parameters in the tth iteration, respectively.
If we calculate the maximum directly, the computational complexity is huge because of the matrix operations on . To solve this problem, is decomposed into two parts corresponding to one and other hyper-parameters, respectively. The maximum can be obtained by calculating its maximum value corresponding to every hyper-parameter. For example, when only considering the ith hyper-parameter , is decomposed as:
where is the marginal likelihood function corresponding to and shown in Equation (12) (its detailed derivation is shown in Appendix A). is the marginal likelihood function corresponding to other hyper-parameters. The maximum value of is obtained by calculating its derivative with Equation (13) to estimate :
where and are calculated by Equation (14) (Their derivation is shown in Appendix B):
where and ; is the estimation value of the ith hyper-parameter after iterations.
When and satisfy , increases gradually, and a maximum value corresponding to does not exist. Under this case, is set as 0, its corresponding scattering unit does not belong to the target-areas. Otherwise, has a maximum value when ; the estimation value of is ; its corresponding scattering unit is classified into the target-areas. Similarly, the hyper-parameters and their marginal likelihood function’s increase are updated by Equation (15):
If satisfies , the marginal likelihood function reaches the preset estimation accuracy. is considered as the optimal hyper-parameters, where is the iteration termination threshold. Under this case, the iteration will be terminated, and the final target-areas are obtained and recorded as . Otherwise, the scattering unit corresponding to the maximum element in is extracted and recorded as . Based on the hyper-parameter , and , the scattering unit is judged whether it belongs to the target-areas.
When , the marginal likelihood function corresponding to the scattering unit has a maximum value; the scattering unit is added into the target-areas. Otherwise, when and , the scattering unit is divided into the target-areas in the previous iterations; its corresponding marginal likelihood function does not have a maximum value after the current iteration. The scattering unit must be deleted from the target-areas. Therefore, the target-areas are updated by Equation (16). Meanwhile, the calculation formula of is shown in Equation (16):
where ∪ and / are the add element and delete element operation, respectively. In addition, and are updated by Equation (17); we continue iterations to obtain the optimal hyper-parameters:
where represents the column vectors corresponding to . is the estimation variance of the scattering coefficients.
Step 5: Calculate the complex-valued target-areas by Equation (18).
Since the target-areas are corresponding to the real-valued scattering coefficients , cannot be used as the prior information to simplify the measurement matrix and conduct sparse imaging. Because one element in the complex-valued scattering coefficients is related to two adjacent elements in (e.g., the and element in are the real and imaginary part of the m element in , respectively); the target-areas corresponding to are obtained by Equation (18):
where is the total number of elements in the target-areas , and is the serial number of the rth element in the target-areas in the imaging scene.
In addition, the main steps of obtaining are summarized in Algorithm 1.
| Algorithm 1 Extract the target-areas. |
|
3.2. Sparse Imaging According to the Target-Areas
To achieve sparse imaging with high-efficiency, the key is to avoid or simplify the high-dimensional matrix-operations corresponding to the measurement matrix. In this subsection, we use the target-areas as the prior information to simplify the measurement matrix and scattering coefficients firstly. Then, we estimate the target-areas’ scattering coefficients with the simplified measurement matrix to obtain imaging results with high quality and efficiency.
However, when the target-areas probably contain several elements whose scattering coefficients are too small compared to other elements. Those elements with too small scattering coefficients probably lead to the diagonal matrix become singular and irreversible; the scattering coefficients cannot be estimated correctly because of the singular matrix. To solve this problem, the truncated singular value decomposition (TSVD) [24] algorithm is introduced to eliminate the elements with too small scattering coefficients and estimate the scattering coefficients correctly. The detailed steps of sparse imaging on the target-areas are introduced as the following content.
Step 1: Simplify the scattering coefficients and measurement matrix.
Since the target-areas contain part scattering units and the column vectors in the measurement matrix are corresponding to the scattering units one to one (e.g., the mth column vector is corresponding to the mth scattering unit), we extract the scattering coefficients and measurement matrix’s column vectors corresponding to based on the serial numbers of the scattering units in . The target-areas’ scattering coefficients and measurement matrix are shown in:
where is the column vector in related to the r element in the target-areas . denotes the total number of APCs in the 2D array.
The linear representation model of the nth equidistant planar echo signal is translated into , where is the signal noise in and obeys the Gaussian distribution. Therefore, sparse imaging on the target-areas is translated into getting the optimal estimation value of . In addition, is initialized by to eliminate the false targets or sidelobes caused by the signal noise preliminarily.
Step 2: Estimate the target-areas’ scattering coefficients.
Since the target-areas’ measurement matrix and scattering coefficients are simplified effectively, the optimal target-areas’ scattering coefficients are obtained by calculating the minimum cost function in the SBRIM algorithm [19] after several iterations. In the tth iteration, the cost function is shown in Equation (20):
where . . . is the total number of elements in the target-areas .
The estimation values of and are obtained by calculating the partial derivative of the cost function with respect to and respectively. As a result, and are updated by Equation (21):
where is the diagonal matrix in the tth iteration and defined as:
where is the rth column vector in . is the rth element in the estimation value of after iterations.
However, when conducting sparse imaging under low sampling rate, low SNR, or high sparsity, several false targets in the initial scattering coefficients usually exist, which correspond to the hyper-parameters and their corresponding estimation errors according to Equations (14)∼(17). Those false targets probably are classified into the target-areas erroneously or lead to the iterations in extracting the target-areas terminating earlier. Those two cases above will result in the target-areas losing partial targets’ information or suffering due to the false targets.
Once the target-areas have several elements whose scattering coefficients are too small or closer to zero compared to the other elements, the diagonal matrix is singular and irreversible because of the elements with scattering coefficients that are too small; we cannot estimate correctly by Equation (21). To eliminate the elements with a scattering coefficient that is too small in , the truncated singular value decomposition (TSVD) algorithm is introduced in this subsection.
Firstly, the singular matrix is decomposed as Equation (23) by the singular value decomposition (SVD) [27] method:
where and are formed by the singular vectors of . ; is the ith singular value of and satisfies .
Once is singular and irreversible, contains elements which are too small compared to other elements, where is the rank of [28]. To eliminate the small singular values, the generalized inverse matrix is obtained by . Then, the inverse matrix of is replaced with the generalized inverse matrix to estimate the correctly:
Since the elements with the small scattering coefficients still exist in the target-areas , we extract the elements in corresponding to the largest K elements in as the new target-areas by Equation (25) to eliminate those elements:
where is the largest element in .
Step 3: Determine whether to continue iteration.
If and current iteration t satisfy and . This indicates that does not meet the preset estimation accuracy; the current iteration is smaller than the preset maximum iterations; then, continue the iteration, where represents the iteration termination threshold; and represents the total number of iterations. Otherwise, the iterations will be ended; is considered as the optimal target-areas scattering coefficients.
The nth equidistant planar 2D imaging results are obtained by Equation (26). The main steps of sparse imaging on the target-areas are shown in Algorithm 2. In addition, the 3D imaging results are obtained by combining all equidistant planar imaging results:
where M is the total number of scattering units in the imaging scene.
| Algorithm 2 Sparse imaging on the target-areas. |
|
3.3. Computational Complexity of the FBCS–RVM Algorithm
In this subsection, we analyze the computational complexity of the FBCS–RVM algorithm. According to Section 3.1 and Section 3.2, the computational complexity of the FBCS–RVM algorithm is mainly generated by two parts: extracting the target-areas and sparse imaging on the target-areas.
- (1):
- The computational complexity of extracting the target-areas is , which is mainly generated by Equation (17); where is the unit computational complexity; is the total number of iterations in extracting the target-areas; represents the total number of APCs in the 2D equivalent array; M is the total number of the scattering units in the 2D imaging scene.
- (2):
Hence, the total computational complexity of LASAR 3D imaging by the FBCS–RVM algorithm is .
According to the Introduction, CS algorithms must set several parameters manually before conducting sparse imaging. Most CS algorithms (e.g., the OMP and BCS algorithms) are influenced by the preset parameters greatly; their computational complexity significantly increases once the preset parameters are set inaccurately. However, the computational complexity of both SBRIM and FBCS–RVM algorithm are not affected by the preset parameters. Therefore, we only give the comparison results of the computational complexity between the SBRIM and FBCS–RVM algorithm in Table 1.
Since the target-areas usually occupy a small part of the imaging scene, M, , and satisfy . The computational complexities of the SBRIM and FBCS–RVM algorithm satisfy . The FBCS–RVM algorithm improves the computational efficiency effectively compared to the SBRIM algorithm.
4. Results on Simulation and Experimental Data
To verify the effectiveness of the FBCS–RVM algorithm, the simulation results are used to quantitatively analyze the imaging quality and estimation accuracy of the FBCS–RVM algorithm under known targets’ information (such as the scattering coefficients and geometric distribution) firstly. Secondly, the experimental results are used to certify the effectiveness of the FBCS–RVM algorithm in the real LASAR data.
In addition, the OMP [17], fast marginalized sparse Bayesian learning (FMSBL) [29,30], and SBRIM [21] algorithms are used as the comparison algorithms to evaluate the performance of the FBCS–RVM algorithm better. The normalized mean square error (NMSE) [31,32] measures the scattering coefficients’ estimation accuracy; the smaller NMSE indicates that the estimation results of the scattering coefficients are more accurate. The target background contrast (TBR) [33] and image entropy (ENT) [34] are used to quantitatively evaluate the imaging quality. TBR reflects the targets’ characteristics in the imaging results; targets can be identified from the imaging results more easily under larger TBR. ENT quantifies the focus quality of the imaging results; targets are focused better under smaller ENT. Therefore, the larger TBR and smaller ENT indicate higher imaging quality. The running time speed-up ratio (RTSR) [21] and execution time (ExT) are used to evaluate the computational efficiency. The higher RTSR indicates that the improvement of the computational efficiency is larger between the FBCS–RVM and the comparison algorithm. Both simulation and experimental experiments are carried out on the computer with Intel Core i9 10,900K CPU at 3.70 GHz, Nvidia GeForce RTX 2060 Super with 8 GB memory, and 32 GB computer memory space.
4.1. Compared with the Comparison Algorithms
4.1.1. Results on the 2D Point-Target Simulation Data
Since the 3D sparse imaging has been translated into the sparse imaging on every equidistant planar 2D imaging scene, the point-target simulations on one equidistant planar 2D imaging scene are conducted firstly to illustrate the effectiveness of the FBCS–RVM algorithm quickly and evaluate its performance accurately. The main parameters and the original scene of the point-target simulations are shown in Table 2 and Figure 3a, respectively. After getting the appropriate preset parameters, the imaging results of the OMP, FMSBL, SBRIM, and FBCS–RVM algorithms are shown in Figure 3b–e.
According to Figure 3b–e, the same as the comparison methods under correct preset parameters, the FBCS–RVM algorithm can estimate the scattering coefficients accurately and obtain high-quality imaging results. To evaluate the performance of the above four algorithms in more detail, we have conducted point-target simulations under different sampling rates and SNR [23]. The Monte Carlo experiments of the above algorithms are all set hundreds of times to evaluate their performance more accurately. Table 3 and Table 4 give the evaluation results under different sampling rates and SNR, respectively.
From Table 3, we can get the following conclusions:
- The NMSE of the FBCS–RVM algorithm is the minimum among those four algorithms; it is smaller than 0.01 under the 20% sampling rate. This shows that the FBCS–RVM algorithm achieves high-quality sparse imaging; its scattering coefficients’ estimation accuracy is higher than the other three algorithms.
- The FBCS–RVM algorithm obtains the maximum TBR and minimum ENT among the above four algorithms. This indicates that the FBCS–RVM algorithm obtains imaging results with the strongest and best-focused targets; it improves the imaging quality compared to the other three algorithms.
- The execution time of the FBCS–RVM algorithm belongs to 0.8∼1.2 s, and it achieves high-efficiency sparse imaging. Its computational efficiency is improved by two orders of magnitude compared to the SBRIM algorithm at most, and it is the same level as the OMP and the FMSBL algorithms.
According to Table 4, we can get the following conclusions:
- The NMSE of the FBCS–RVM algorithm is the minimum among those four algorithms. This proves that the FBCS–RVM algorithm estimates the scattering coefficients more accurately than the other three algorithms.
- The FBCS–RVM algorithm obtains the maximum TBR and minimum ENT among the above four algorithms. Except when the SNR is 0 dB, both the OMP and FMSBL algorithms obtain slightly larger TBR because of the strong false targets. Therefore, the FBCS–RVM algorithm suppresses the signal noise better and improves the imaging quality compared to the other three algorithms.
- The execution time of the FBCS–RVM algorithm belongs to 1∼4 s and is the minimum among those four algorithms. Except for the two cases, the OMP and FMSBL algorithms obtain slightly smaller execution time under the 0 dB and 40 dB SNR, respectively. The computational efficiency of the FBCS–RVM algorithm is improved 27∼84 times compared to the SBRIM algorithm; it achieves sparse imaging with high efficiency.
4.1.2. Results on the 2D Complex-Target Simulation Data
To evaluate the performance of the FBCS–RVM algorithm under the complex imaging scene, the 2D complex-target simulations are conducted in this subsection. The main parameters and the original scene of the 2D complex-target simulation are shown in Table 5 and Figure 4, respectively.
Figure 4 shows four complex-targets with different sparsity and density. Figure 5 gives the imaging results of Figure 4c obtained by the OMP, FMSBL, SBRIM, and FBCS–RVM algorithms under different sampling rates (e.g., 20%, 35%, and 50%).
According to Figure 5, those four algorithms cannot estimate the scattering coefficients correctly under the 20% sampling rate. They lose the targets’ information and suffer from the false targets seriously. The OMP algorithm still suffers from some false targets under the 35% and 50% sampling rate because of its preset sparsity. Meanwhile, the other three algorithms can eliminate the false targets better; they obtain higher imaging quality. To quantitatively evaluate the performance of the above four algorithms, the evaluation results under different sampling rates are shown in Table 6.
From Table 6, we can get the conclusions as follows:
- The NMSE of the FBCS–RVM algorithm is the minimum among those four algorithms under different sampling rates. This indicates that its scattering coefficients’ estimation accuracy is higher than the other three algorithms.
- The FBCS–RVM algorithm obtains the minimum ENT and the maximum TBR among the above four algorithms—except, under the 35% sampling rate, the FMSBL algorithm obtains the slightly higher TBR. Therefore, the FBCS–RVM algorithm improves the imaging quality compared to the other three algorithms.
- The execution time of the FBCS–RVM algorithm is the minimum among the above four algorithms under all sampling rates; its computational efficiency is higher than the other three algorithms.
To evaluate the performance of the FBCS–RVM algorithm under different sparsity, we have conducted sparse imaging on the four targets in Figure 4 in this subsection. Moreover, the imaging results of the complex-target in Figure 4a,b,d under 50% sampling rate are shown in Figure 6.
According to Figure 6, the imaging results of the OMP algorithm contain several false targets and lose partial targets’ information, while the FMSBL, SBRIM, and FBCS–RVM algorithms eliminate the false targets better and obtain imaging results with higher imaging quality. Table 7 shows the evaluation results under different sparsity to evaluate the performance of the above four algorithms better.
According to Table 7, we can obtain the following conclusions:
- The NMSE of the FBCS–RVM algorithm is smaller than 0.05 and is the minimum among the above four algorithms. This shows that the FBCS–RVM estimates the scattering coefficients more accurately than the other three algorithms, which achieves high-quality sparse imaging.
- The FBCS–RVM algorithm obtains the maximum TBR and minimum ENT among those four algorithms. Except under the 677 sparsity, the FMSBL algorithm obtains the maximum TBR. Therefore, the FBCS–RVM algorithm obtains the imaging results with the strongest and best-focused targets, and its imaging quality is higher than the other three algorithms.
- The FBCS–RVM algorithm obtains the minimum execution time among those four algorithms; its computational efficiency is higher than the other three algorithms.
4.1.3. Results on the 3D Simulation Data
Since the 3D sparse imaging results are obtained by conducting 2D sparse imaging on every equidistant plane with the fixed preset parameters, we conduct 3D sparse imaging to analyze the stability of the FBCS–RVM algorithm under different imaging scenes with the fixed preset parameters better. The main parameters of the 3D simulations are shown in Table 8. The original scene of the 3D simulations is shown in Figure 7 and Figure 8a, respectively.
Firstly, the airplane model in Figure 7a is used for 3D sparse imaging to certify the effectiveness of the FBCS–RVM algorithm under the 3D imaging scene; the 3D imaging results of the airplane model obtained by the OMP, FMSBL, SBRIM, and FBCS–RVM algorithms are given in Figure 7b–e.
According to Figure 7, because the preset sparsity in the OMP algorithm cannot meet the requirement of every equidistant planar high-quality sparse imaging, the OMP algorithm suffers from sidelobes and loses the partial targets’ information. Its imaging quality is lower than the other three algorithms. Similarly, both FMSBL and SBRIM algorithms suffer from sidelobes to some extent because of their fixed preset parameters and measurement matrices corresponding to the whole imaging scene. The FBCS–RVM algorithm uses the target-areas as the prior information to simplify the measurement matrix and conduct sparse imaging; its measurement matrix indicates the targets’ characteristics better. As a result, the FBCS–RVM algorithm eliminates the sidelobes better and improves the imaging quality compared to the other three algorithms.
To analyze the performance of the FBCS–RVM algorithm under larger imaging scenes, we conduct 3D sparse imaging on the mountain model shown in Figure 8a. The 3D imaging results obtained by the OMP, FMSBL, SBRIM, and FBCS–RVM algorithms are shown in Figure 8b–e.
According to Figure 8, because of the fixed preset parameters and the measurement matrix corresponding to the whole imaging scene, the OMP, FMSBL, and SBRIM algorithms suffer from the sidelobe interferences to some extent. The FBCS–RVM algorithm suppresses the sidelobes better than the other three algorithms by using the target-areas as the prior information to simplify the measurement matrix and conduct sparse imaging. Since both airplane and mountain models are composed of several discrete scattering points, which are not accurately located in the 3D scattering units, their 3D original scattering coefficients are hardly predefined accurately. The NMSE is not used as the evaluation standard of the 3D imaging results. Table 9 gives the evaluation results of Figure 7 and Figure 8 to evaluate their performance of the above four algorithms in 3D sparse imaging quantitatively.
According to Table 9, we can know that the FBCS–RVM algorithm obtains the 3D imaging results with the minimum ENT, execution time, and maximum TBR among the above four algorithms. Therefore, the computational efficiency and imaging quality of the FBCS–RVM algorithm are higher than the other three algorithms.
Therefore, according to the 2D and 3D simulation results, the FBCS–RVM algorithm achieves sparse imaging with high-quality and efficiency. It improves the imaging quality, stability, and computational efficiency compared to the OMP, SBRIM, and FMSBL algorithms successfully.
4.1.4. Results on Experimental Data
To fully certify the effectiveness of the FBCS–RVM algorithm in the real data, the experimental data obtained by two ground equivalent LASAR (GDLASAR) [32,35] systems with different aperture lengths and moving trajectories are used for 3D sparse imaging in this subsection. The main parameters of the two GDLASAR systems are listed in Table 10. The above two systems and their experimental scene are shown in Figure 9.
To improve the computational efficiency of 3D sparse imaging on the experimental data, the targets’ echo signals are extracted firstly by their locations in the experimental scene. Moreover, the 3D imaging results of the OMP, FMSBL, SBRIM, and FBCS–RVM algorithms are shown in Figure 10.
According to Figure 10, the above four algorithms can achieve 3D sparse imaging on both experimental data. Because of the inevitable signal noise in the experimental data, the OMP, FMSBL, and SBRIM algorithms suffer from the sidelobe interferences to some extent. Since the FBCS–RVM algorithm uses the target-areas to simplify the measurement matrix and conduct sparse imaging, it eliminates the sidelobe interferences more effectively and improves imaging quality compared to the other three algorithms. To evaluate the performance of those four algorithms on the experimental data, Table 11 and Table 12 show the evaluation results under different sampling rates.
- In both pieces of experimental data, the FBCS–RVM algorithm obtains imaging results with the maximum TBR, minimum ENT, and execution time among those four algorithms. Therefore, its imaging quality and computational efficiency are higher than the other three algorithms.
- The RTSR between the FBCS–RVM algorithm and the other three algorithms in the two balls experiment is larger than the wall experiment. This indicates that the computational efficiency’s improvement of the FBCS–RVM algorithm is higher when the sparsity of the imaging scene is smaller.
4.2. Ablation Study
According to Section 3.1 and Section 3.2, the FBCS–RVM algorithm contains two key steps: extracting the target-areas under the framework of RVM and eliminating the elements with small scattering coefficients in the target-areas by the TSVD algorithm. Therefore, we verify the effectiveness of the above two steps in the following subsections.
4.2.1. Ablation Study on Extracting the Target-Areas under the Framework of RVM
To verify the effectiveness of extracting the target-areas under the framework of RVM, both fuzzy c-means (FCM) [36] and k-means algorithms [37] are used to extract the target-areas while the other steps of the FBCS–RVM algorithm remain unchanged. Figure 11 lists the imaging results of the complex-targets in Figure 4c obtained by the FCM, K-means, and the FBCS–RVM algorithm. Table 13 gives the evaluation results of the above three algorithms to evaluate their performance more clearly and accurately.
- Both FCM and K-Means algorithms cannot extract the target-areas accurately and lose partial targets’ information, and we cannot achieve high-quality sparse imaging with the above two algorithms.
- The FBCS–RVM algorithm obtains the minimum NMSE, maximum TBR, and execution time among those three algorithms; its NMSE is smaller than 0.01. This indicates that the FBCS–RVM algorithm extracts the target-areas more accurately than the FCM and K-Means algorithm; it achieves high-quality sparse imaging.
4.2.2. Ablation Study on the TSVD Algorithm
In the subsection, when the diagonal matrix is singular due to the elements with too small scattering coefficients in the target-areas, we obtain two comparative imaging results to verify the effectiveness of the TSVD algorithm in eliminating those elements. Figure 12 lists the imaging results of the FBCS–RVM algorithm and without the TSVD algorithm. Table 14 gives the evaluation results of the above two imaging results to certify the effectiveness of the TSVD algorithm better.
- Without the TSVD algorithm, the scattering coefficients cannot be estimated correctly under the singular diagonal matrix, and the imaging results lose too much of the targets’ effective information. After eliminating the elements with the small scattering coefficients by the TSVD algorithm, we can obtain the correct imaging results.
- The execution time of the FBCS–RVM algorithm is slightly larger than without the TSVD algorithm. This indicates that the computational efficiency of the FBCS–RVM algorithm decreases slightly due to the TSVD algorithm.
5. Discussion
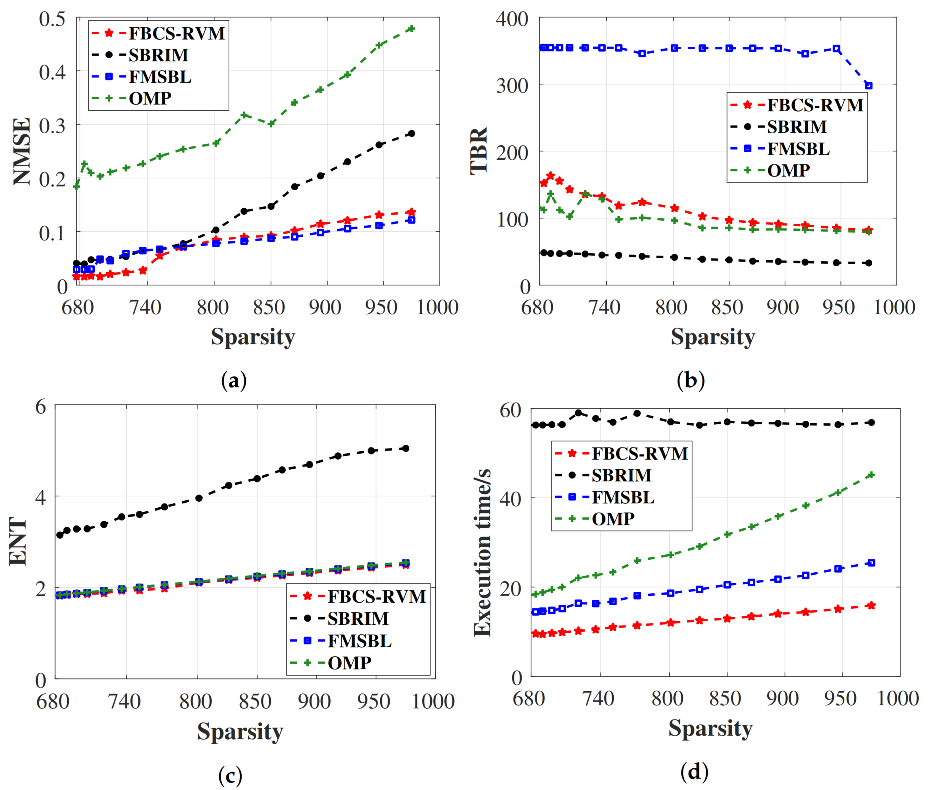
In this section, we use the complex-targets in Figure 4d as the initial target-areas and increase the sparsity of imaging scene gradually to analyze the application scenes of the FBCS–RVM algorithm; the total number of scattering units in the whole imaging scene is fixed and set as 4096. The evaluation results of the OMP, FMSBL, SBRIM, and FBCS–RVM algorithms under increasing sparsity with fixed total scattering units are shown in Figure 13.
According to Figure 13, we can get the following conclusions:
- Computational efficiency: The FBCS–RVM algorithm obtains the minimum execution time among the above four algorithms; its computational efficiency is higher than the other three algorithms.
- Imaging quality: When the sparsity is smaller than 800, the FBCS–RVM algorithm obtains the minimum NMSE among the above four algorithms; its imaging quality is higher than the other three algorithms. Otherwise, its NMSE is slightly smaller than the FMSBL algorithm when the sparsity is higher than 800, which indicates that targets occupy more than 20% of the whole imaging scene. Its imaging quality is slightly lower than the FMSBL algorithm.
In addition, similarly to most CS algorithms, when conducting 3D sparse imaging with large scale remote sensing data by the FBCS–RVM algorithm, the measurement matrix usually becomes huge because of the large imaging scene. The huge measurement matrix and its matrix operations lead to the FBCS–RVM algorithm hardly achieving 3D sparse imaging with high-efficiency on the large scale remote sensing data. Therefore, the main limitations of the FBCS–RVM algorithm are summarized as the following content:
- The FBCS–RVM algorithm probably loses partial targets’ information under high sparsity; it cannot achieve high-quality sparse imaging.
- The FBCS–RVM algorithm cannot always achieve high-efficiency 3D sparse imaging under large scale remote sensing data.
6. Conclusions
In this paper, we propose the FBCS–RVM algorithm to achieve LASAR 3D sparse imaging with high quality and efficiency. Firstly, after calculating the maximum marginal likelihood function under the framework of the relevance vector machine (RVM), the scattering units corresponding to the non-zero optimal hyper-parameters are extracted as the target-areas in the imaging scene. Then, we use the target-areas as the prior information to simplify the measurement matrix and conduct sparse imaging. In addition, when the target-areas contain several elements whose scattering coefficients are too small or closer to 0 compared to other elements, the diagonal matrix becomes singular and irreversible. Its inverse matrix is replaced with the generalized inverse matrix obtained by the TSVD algorithm to estimate the scattering coefficients correctly; the elements with small scattering coefficients are extracted and deleted from the target-areas successfully according to the rank of the singular diagonal matrix. By taking the target-areas as the prior information for sparse imaging, the FBCS–RVM simplifies the matrix operations corresponding to the measurement matrix successfully. As a result, it improves the computational efficiency and decreases the requirements from the hardware system effectively. Both simulation and experimental results illustrate that the FBCS–RVM algorithm achieves sparse imaging with high quality and efficiency successfully. It improves the computational efficiency and imaging quality compared to the other three comparison algorithms (the OMP, FMSBL, and SBRIM algorithms). Especially in the computational efficiency, the FBCS–RVM algorithm can be 100 times higher than the SBRIM algorithm, 10 times higher than the FMSBL algorithm, and 4 times higher than the OMP algorithm.
Since CS algorithms can obtain higher imaging quality under under-sampling than traditional remote sensing imaging algorithms and the FBCS–RVM algorithm improves the computational efficiency compared to most CS algorithms, the FBCS–RVM algorithm has great application prospects in 3D digital elevation models and urban area imaging.
Our future work is as follows:
- Study the target-areas extraction methods based on the convolution neural network for the high sparsity imaging scene with higher accuracy and efficiency.
- Achieve 3D sparse imaging in the large scale remote sensing applications by simplifying the measurement matrix by dividing the original imaging scene into several smaller imaging scenes.
Author Contributions
All the authors contributed extensively to the preparation of this manuscript. B.T. conceived of the work, designed the algorithms, and wrote the manuscript. X.Z. and B.T. conceived of the work and designed the experiments. B.T. and L.L. analyzed the experimental results. B.T., L.P. (Ling Pu), and L.P. (Liming Pu) conceived of the work and made suggestions. J.S. and S.W. commented on the manuscript and offered suggestions on revision. All authors have read and agreed to the published version of the manuscript.
Funding
This work was supported in part by the National Key R&D Program of China under Grant 2017YFB0502700 and in part by the National Natural Science Foundation of China under Grants 61571099, 61501098, and 61671113.
Data Availability Statement
The data presented in this paper are available after contacting the corresponding author.
Acknowledgments
We thank anonymous reviewers for their comments towards improving this manuscript.
Conflicts of Interest
The authors declare no conflict of interest.
Appendix A
Since the elements in the hyper-parameters are independent from each other, the covariance matrix can be decomposed as , where is the covariance matrix after removing the column vector from the measurement matrix ; is the ith column vector in the . Based on the Woodbury identities [38], and satisfy:
Similarly, the marginal likelihood function can be decomposed as:
where and .
Appendix B
Based on Equation (A1), when the ith scattering unit does not belong to the target-areas , this indicates that its corresponding marginal likelihood function does not have the maximum value in the previous iterations; its corresponding hyper-parameter is 0. and are set as and .
Otherwise, when just considering , the other hyper-parameters in are considered unchanged in the tth iteration; can be decomposed as . Therefore, is calculated by Equation (A3); is updated by . Similarly, is calculated by .
References
- Wei, X.; Chong, J.; Zhao, Y.; Li, Y.; Yao, X. Airborne SAR Imaging Algorithm for Ocean Waves Based on Optimum Focus Setting. Remote Sens. 2019, 11, 564. [Google Scholar] [CrossRef] [Green Version]
- Zhang, T.; Zhang, X.; Shi, J.; Wei, S. Depthwise Separable Convolution Neural Network for High-Speed SAR Ship Detection. Remote Sens. 2019, 11, 2483. [Google Scholar] [CrossRef] [Green Version]
- Tang, X.; Zhang, X.; Shi, J.; Wei, S.; Tian, B. Ground Moving Target 2D Velocity Estimation and Refocusing for Multichannel Maneuvering SAR with Fixed Acceleration. Sensors 2019, 19, 3695. [Google Scholar] [CrossRef] [PubMed] [Green Version]
- Nemoto, Y.; Nishino, H.; Ono, M.; Mizutamari, H.; Nishikawa, K.; Tanaka, K. Japanese Earth Resources Satellite-1 synthetic aperture radar. Proc. IEEE 1991, 79, 800–809. [Google Scholar] [CrossRef]
- Matsuoka, M.; Yamazaki, F. Use of Satellite SAR Intensity Imagery for Detecting Building Areas Damaged Due to Earthquakes. Earthq. Spectra Earthq Spectra 2004, 20. [Google Scholar] [CrossRef]
- Liang, L.; Guo, H.; Li, X. Three-Dimensional Structural Parameter Inversion of Buildings by Distributed Compressive Sensing-Based Polarimetric SAR Tomography Using a Small Number of Baselines. IEEE J. Sel. Top. Appl. Earth Obs. Remote Sens. 2014, 7, 4218–4230. [Google Scholar]
- Su, Z.; Peng, Y.; Wang, X. Feature-Independent Aperture Evaluator for the Curvilinear SAR. IEEE Geosci. Remote Sens. Lett. 2007, 4, 191–195. [Google Scholar] [CrossRef]
- Jun, S.; Zuoyong, P.; Congyue, R.; Ling, F.; Xiaoling, Z. DEM Estimation for LASAR Based on Variational Model. IEEE Trans. Geosci. Remote Sens. 2017, 55, 978–995. [Google Scholar] [CrossRef]
- Jun, S.; Xiaoling, Z.; Jianyu, Y.; Chen, W. APC Trajectory Design for “One-Active” Linear-Array Three-Dimensional Imaging SAR. IEEE Trans. Geosci. Remote Sens. 2010, 48, 1470–1486. [Google Scholar] [CrossRef]
- Chen, V.; Ling, H. Time-Frequency Transforms for Radar Imaging and Signal Analysis; Artech House: Boston, MA, USA, 2002; pp. 93–104. [Google Scholar]
- Zhang, S.; Zhu, Y.; Dong, G.; Kuang, G. Truncated SVD-Based Compressive Sensing for Downward-Looking Three-Dimensional SAR Imaging With Uniform/Nonuniform Linear Array. IEEE Geosci. Remote Sens. Lett. 2015, 12, 1853–1857. [Google Scholar] [CrossRef]
- Kanatsoulis, C.I.; Fu, X.; Sidiropoulos, N.D.; Akçakaya, M. Tensor Completion From Regular Sub-Nyquist Samples. IEEE Trans. Signal Process. 2020, 68, 1–16. [Google Scholar] [CrossRef] [Green Version]
- Patel, V.M.; Easley, G.R.; Healy, D.M., Jr.; Chellappa, R. Compressed Synthetic Aperture Radar. IEEE J. Sel. Top. Signal Process. 2010, 4, 244–254. [Google Scholar] [CrossRef]
- Donoho, Y.T.D.L. Extensions of compressed sensing. Signal Process. 2006, 549–571. [Google Scholar] [CrossRef]
- Candes, E.J.; Tao, T. Near-Optimal Signal Recovery From Random Projections: Universal Encoding Strategies? IEEE Trans. Inf. Theory 2006, 52, 5406–5425. [Google Scholar] [CrossRef] [Green Version]
- Donoho, D.L. Compressed sensing. IEEE Trans. Inf. Theory 2006, 52, 1289–1306. [Google Scholar] [CrossRef]
- Shi, S.J.W.X.L.Z.J. Sparse array microwave 3D imaging: Compressed sensing recovery and experimental study. Prog. Electromagn. Res. 2013, 161–181. [Google Scholar] [CrossRef] [Green Version]
- Ji, S.; Xue, Y.; Carin, L. Bayesian Compressive Sensing. IEEE Trans. Signal Process. 2008, 56, 2346–2356. [Google Scholar] [CrossRef]
- Min, Y.; Shunjun, W.; Bokun, T.; Xiaoling, Z.; Jun, S. LASAR High-resolution 3D Imaging Algorithm Based on Sparse Bayesian Regularization. J. Radars 2018, 7. [Google Scholar] [CrossRef]
- Li, W.; Niu, M.; Zhang, Y.; Huang, Y.; Yang, J. Forward-Looking Scanning Radar Superresolution Imaging Based on Second-Order Accelerated Iterative Shrinkage-Thresholding Algorithm. IEEE J. Sel. Top. Appl. Earth Obs. Remote Sens. 2020, 13, 620–631. [Google Scholar] [CrossRef]
- Tian, B.; Zhang, X.; Wei, S.; Ming, J.; Shi, J.; Li, L.; Tang, X. A Fast Sparse Recovery Algorithm via Resolution Approximation for LASAR 3D Imaging. IEEE Access 2019, 7, 178710–178725. [Google Scholar] [CrossRef]
- Tipping, M.E. Sparse Bayesian Learning and the Relevance Vector Machine. J. Mach. Learn. Res. 2001, 1, 211–244. [Google Scholar] [CrossRef] [Green Version]
- Jihua, T.; Jinping, S.; Yuxi, Z.; Ahmad, N.; Xiaoyang, S. The effects of input signal-to-noise ratio on compressive sensing SAR imaging. In Proceedings of the 2010 2nd International Conference on Signal Processing Systems, Dalian, China, 5–7 July 2010; Volume 3, pp. 533–537. [Google Scholar]
- Migliaccio, M.; Gambardella, A. Microwave radiometer spatial resolution enhancement. IEEE Trans. Geosci. Remote Sens. 2005, 43, 1159–1169. [Google Scholar] [CrossRef]
- Chen, J.; Liang, X.; He, C.; Cao, A.; Bai, L.; Zhu, W.; Geng, J.; Jin, R. Direction Finding of Linear Frequency Modulation Signal With Time-Modulated Array. IEEE Trans. Antennas Propag. 2019, 67, 2841–2846. [Google Scholar] [CrossRef]
- Michael, E.; Tipping and Anita Faul. Fast Marginal Likelihood Maximisation for Sparse Bayesian Models. In Proceedings of the Ninth International Workshop on Artificial Intelligence and Statistics, Key West, FL, USA, 3–6 January 2003. [Google Scholar]
- Ren, W.; Song, J.; Tian, S.; Zhang, X. Estimation of the Equivalent Number of Looks in SAR Images Based on Singular Value Decomposition. IEEE Geosci. Remote Sens. Lett. 2015, 12, 2208–2212. [Google Scholar] [CrossRef]
- Guan, D.; Xiang, D.; Tang, X.; Kuang, G. SAR Image Despeckling Based on Nonlocal Low-Rank Regularization. IEEE Trans. Geosci. Remote Sens. 2019, 57, 3472–3489. [Google Scholar] [CrossRef]
- Babacan, S.D.; Molina, R.; Katsaggelos, A.K. Bayesian Compressive Sensing Using Laplace Priors. IEEE Trans. Image Process. 2010, 19, 53–63. [Google Scholar] [CrossRef]
- Wu, Y.; Zhang, S.; Kang, H.; Yeo, T.S. Fast Marginalized Sparse Bayesian Learning for 3D Interferometric ISAR Image Formation Via Super-Resolution ISAR Imaging. IEEE J. Sel. Top. Appl. Earth Obs. Remote Sens. 2015, 8, 4942–4951. [Google Scholar] [CrossRef]
- Wei, S.; Liang, J.; Wang, M.; Zeng, X.; Shi, J.; Zhang, X. CIST: An Improved ISAR Imaging Method Using Convolution Neural Network. Remote Sens. 2020, 12, 2641. [Google Scholar] [CrossRef]
- Wang, M.; Wei, S.; Shi, J.; Wu, Y.; Qu, Q.; Zhou, Y.; Zeng, X.; Tian, B. CSR-Net: A Novel Complex-Valued Network for Fast and Precise 3D Microwave Sparse Reconstruction. IEEE J. Sel. Top. Appl. Earth Obs. Remote Sens. 2020, 13, 4476–4492. [Google Scholar] [CrossRef]
- Wang, M.; Wei, S.; Liang, J.; Zeng, X.; Wang, C.; Shi, J.; Zhang, X. RMIST-Net: Joint Range Migration and Sparse Reconstruction Network for 3D mmW Imaging. IEEE Trans. Geosci. Remote Sens. 2021, 1–17. [Google Scholar] [CrossRef]
- Werness, S.A.S.; Carrara, W.G.; Joyce, L.S.; Franczak, D.B. Moving target imaging algorithm for SAR data. IEEE Trans. Aerosp. Electron. Syst. 1990, 26, 57–67. [Google Scholar] [CrossRef]
- Wei, S.J.; Zhang, X.L.; JUN, S. Linear array SAR imaging via compressed sensing. Prog. Electromagn. Res. 2011, 117. [Google Scholar] [CrossRef] [Green Version]
- Wan, L.; Zhang, T.; Xiang, Y.; You, H. A Robust Fuzzy C-Means Algorithm Based on Bayesian Nonlocal Spatial Information for SAR Image Segmentation. IEEE J. Sel. Top. Appl. Earth Obs. Remote Sens. 2018, 11, 896–906. [Google Scholar] [CrossRef]
- Sinaga, K.P.; Yang, M. Unsupervised K-Means Clustering Algorithm. IEEE Access 2020, 8, 80716–80727. [Google Scholar] [CrossRef]
- White, D.A. Using the Sherman-Morrison-Woodbury Formula for Coupling External Circuits With FEM for Simulation of Eddy Current Problems. IEEE Trans. Magn. 2009, 45, 3915–3918. [Google Scholar] [CrossRef]
Figure 1.
The geometric model of LASAR. The x, y, and z-axes represent the along-track (AT), cross-track (CT) direction, and height direction, respectively.
Figure 1.
The geometric model of LASAR. The x, y, and z-axes represent the along-track (AT), cross-track (CT) direction, and height direction, respectively.
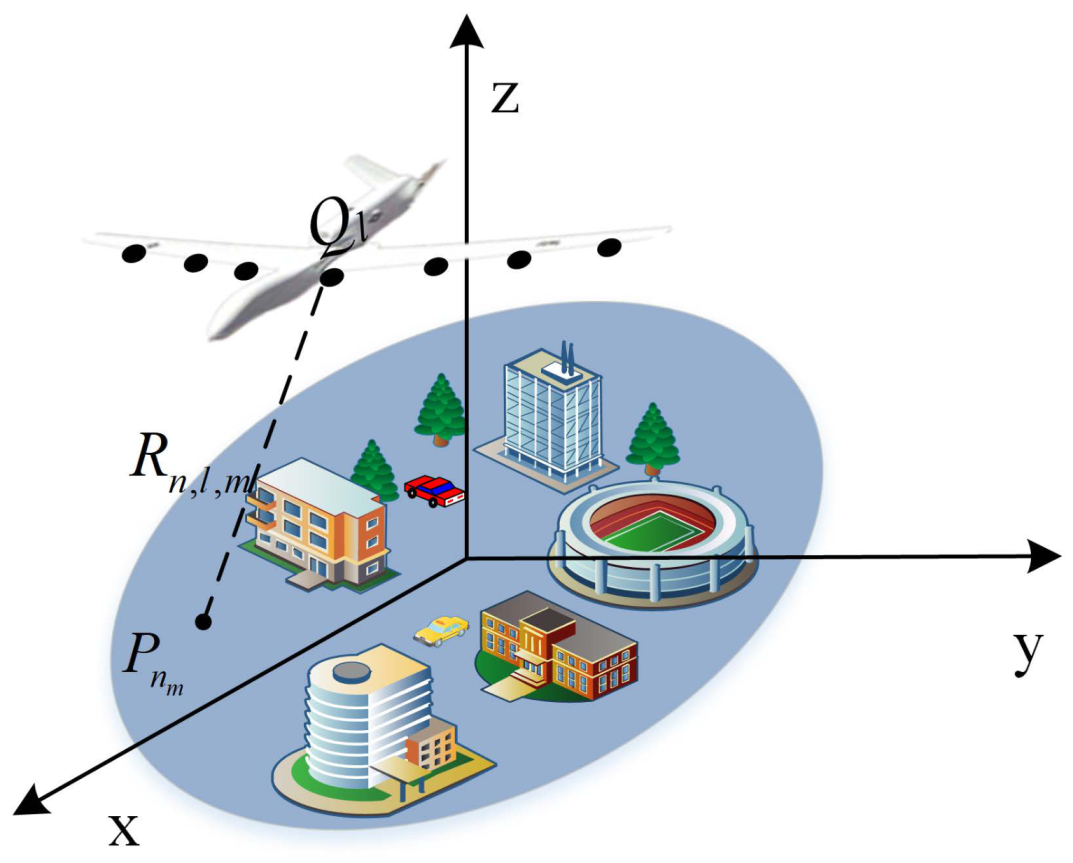
Figure 2.
The flowchart of the FBCS–RVM algorithm.
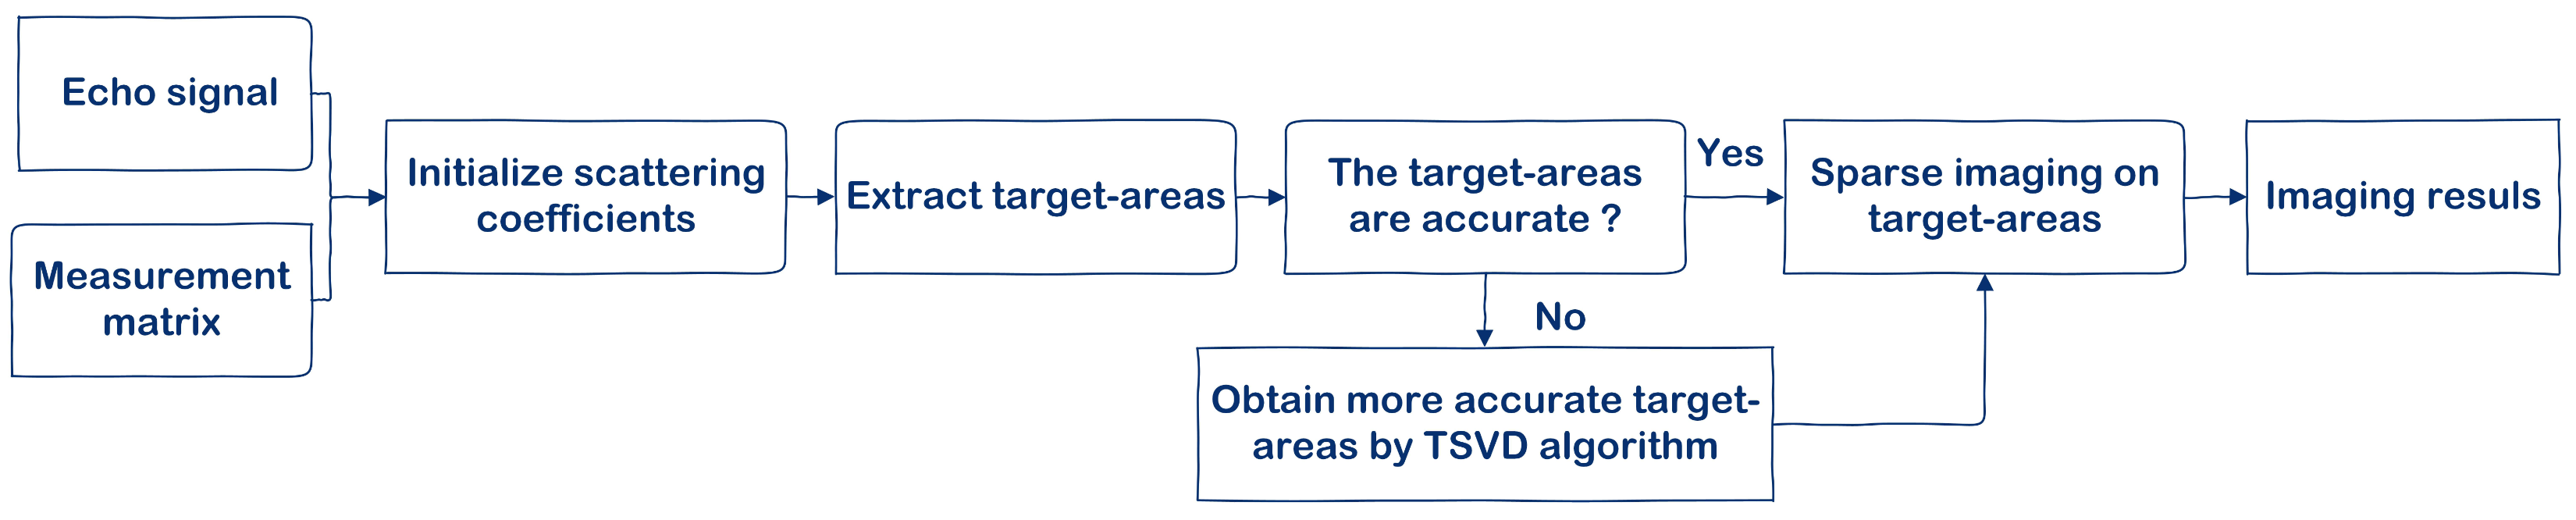
Figure 3.
The original scene and imaging results of point–target simulations. (a) Original scene; (b) OMP; (c) FMSBL; (d) SBRIM; (e) FBCS–RVM.
Figure 3.
The original scene and imaging results of point–target simulations. (a) Original scene; (b) OMP; (c) FMSBL; (d) SBRIM; (e) FBCS–RVM.
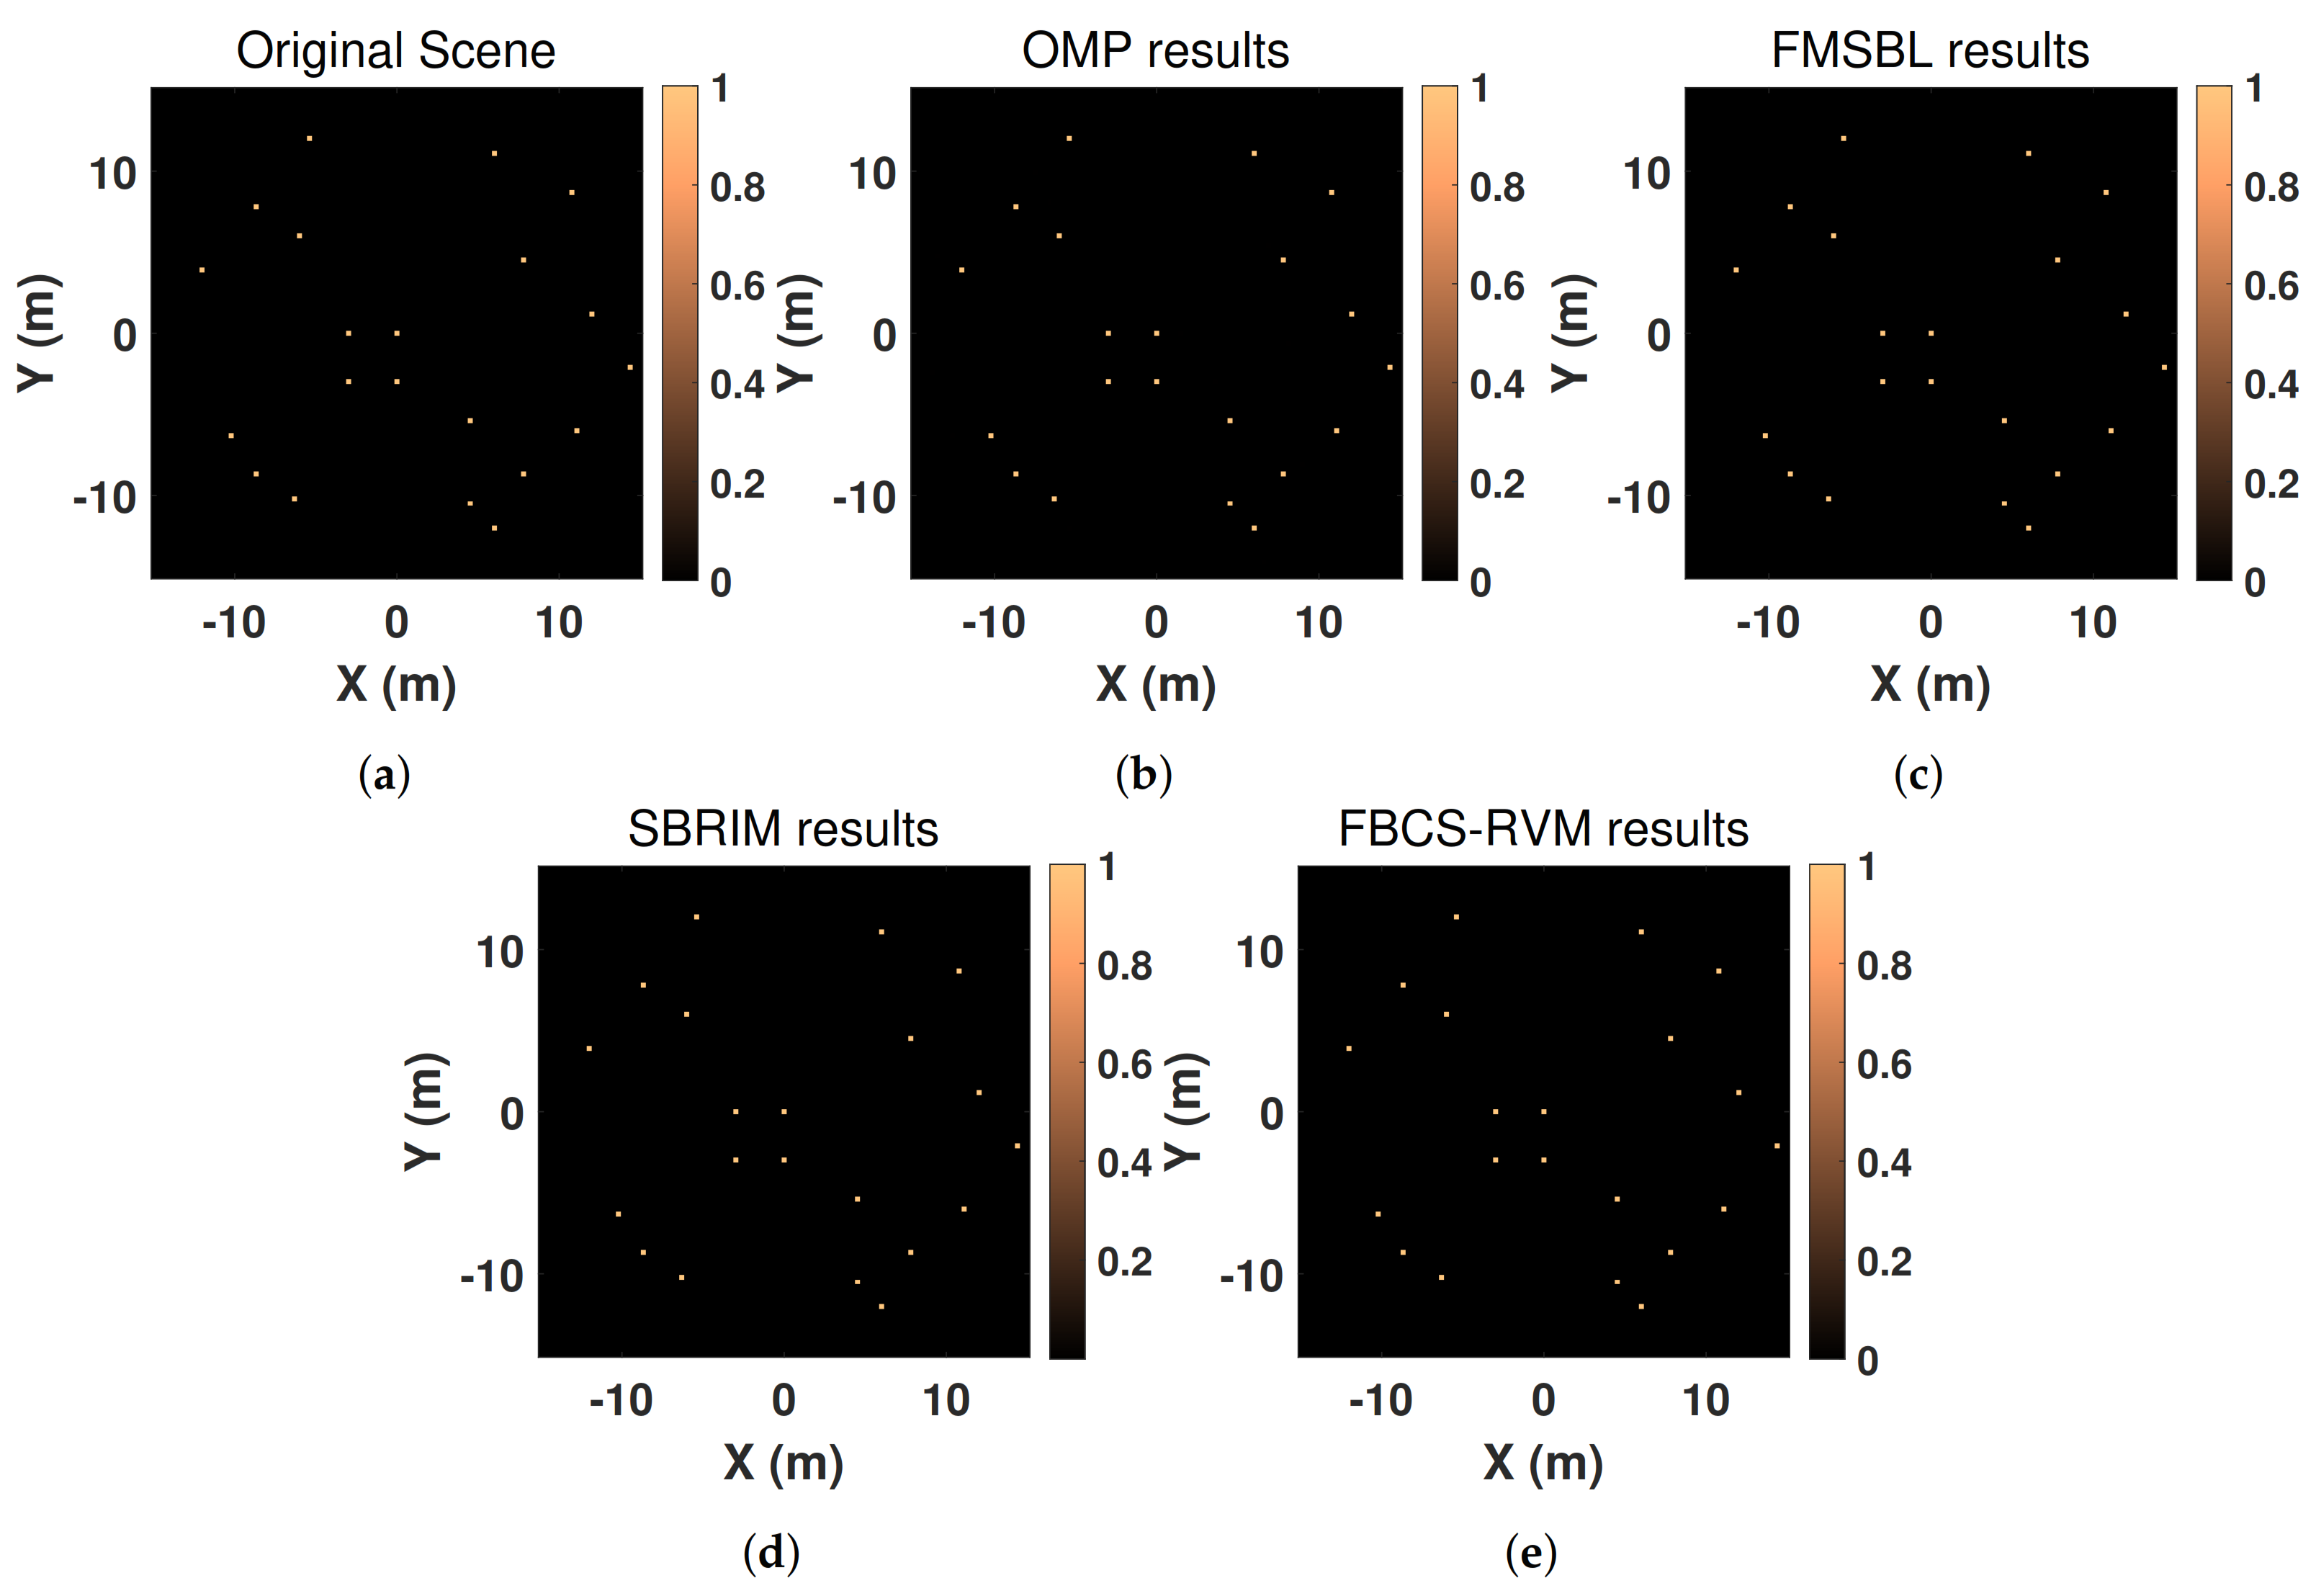
Figure 4.
The original scene of the complex–target simulations. (a) airplane model under 210 sparsity; (b) ship model under 495 sparsity; (c) ship model under 515 sparsity; (d) complex–target model under 677 sparsity.
Figure 4.
The original scene of the complex–target simulations. (a) airplane model under 210 sparsity; (b) ship model under 495 sparsity; (c) ship model under 515 sparsity; (d) complex–target model under 677 sparsity.
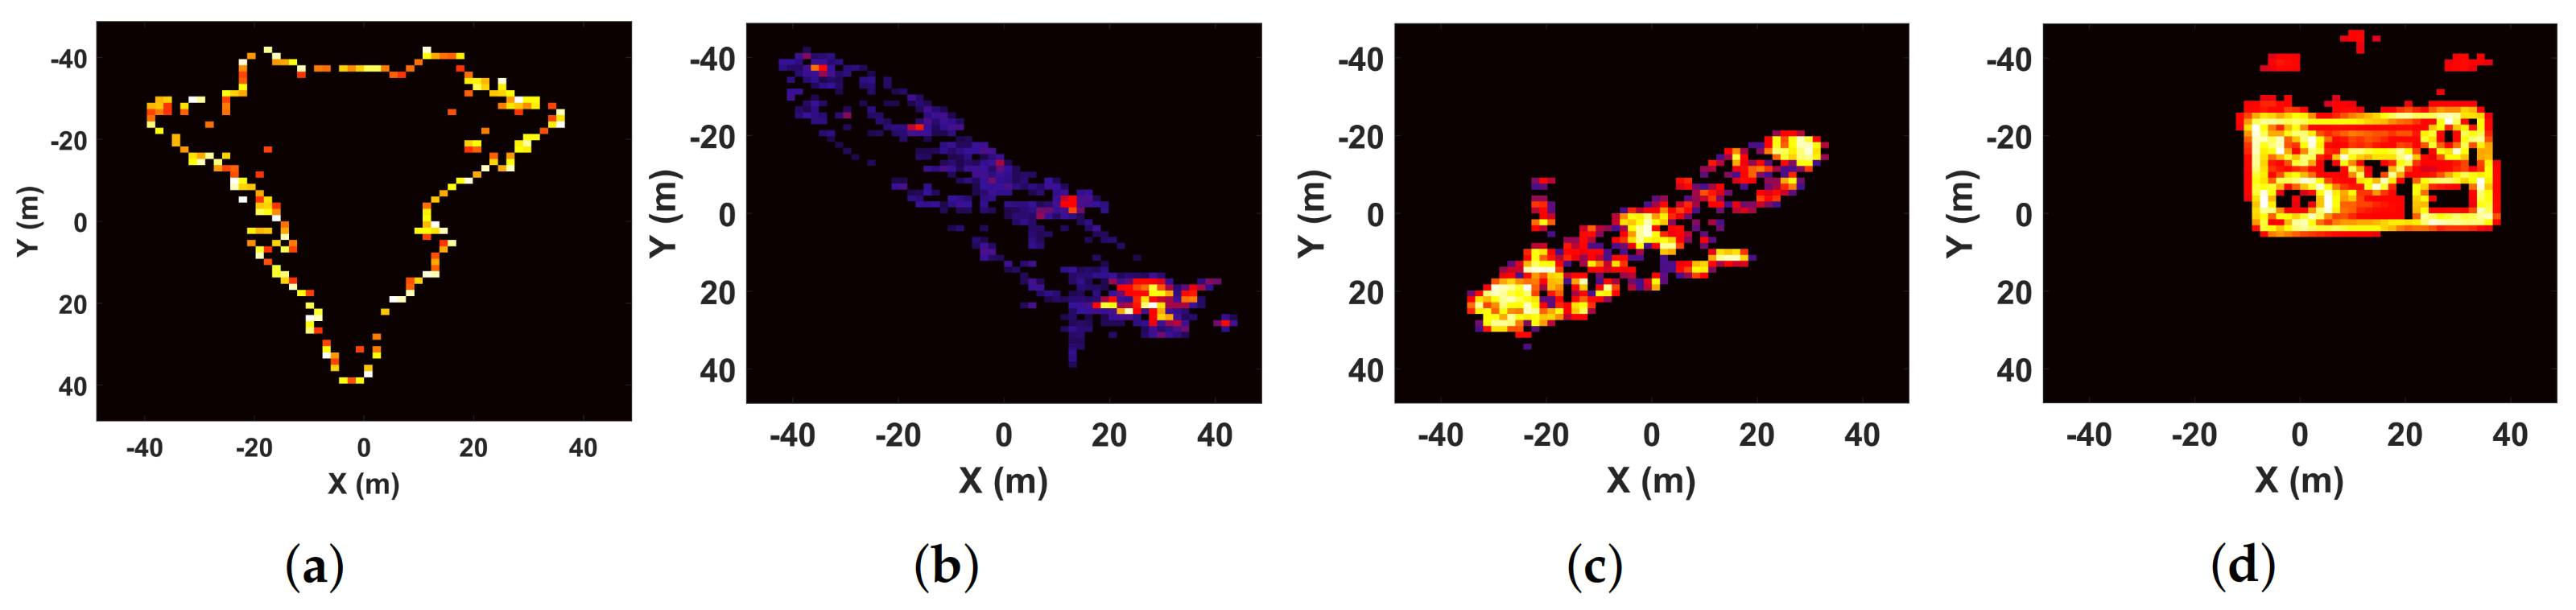
Figure 5.
The imaging results of targets in Figure 4c under different sampling rates; first row: 20% sampling rate, second row: 35% sampling rate, third row: 50% sampling rate.
Figure 5.
The imaging results of targets in Figure 4c under different sampling rates; first row: 20% sampling rate, second row: 35% sampling rate, third row: 50% sampling rate.
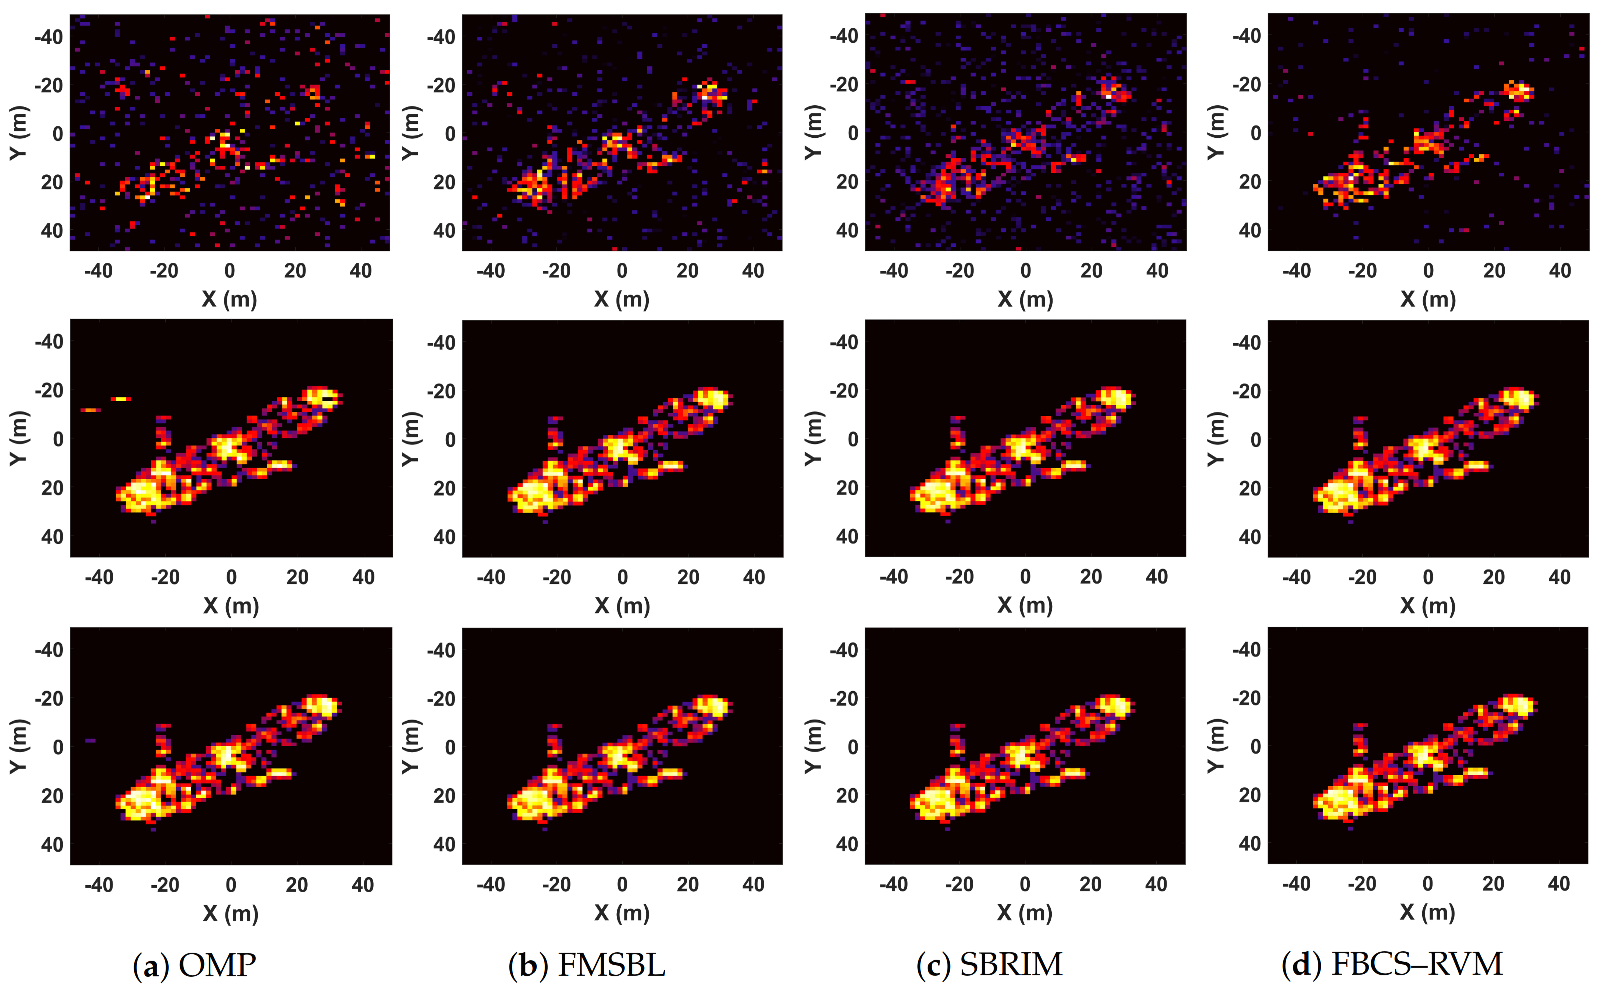
Figure 6.
The imaging results of targets in Figure 4a,b,d. first row: Figure 4a, second row: Figure 4b, third row: Figure 4d.
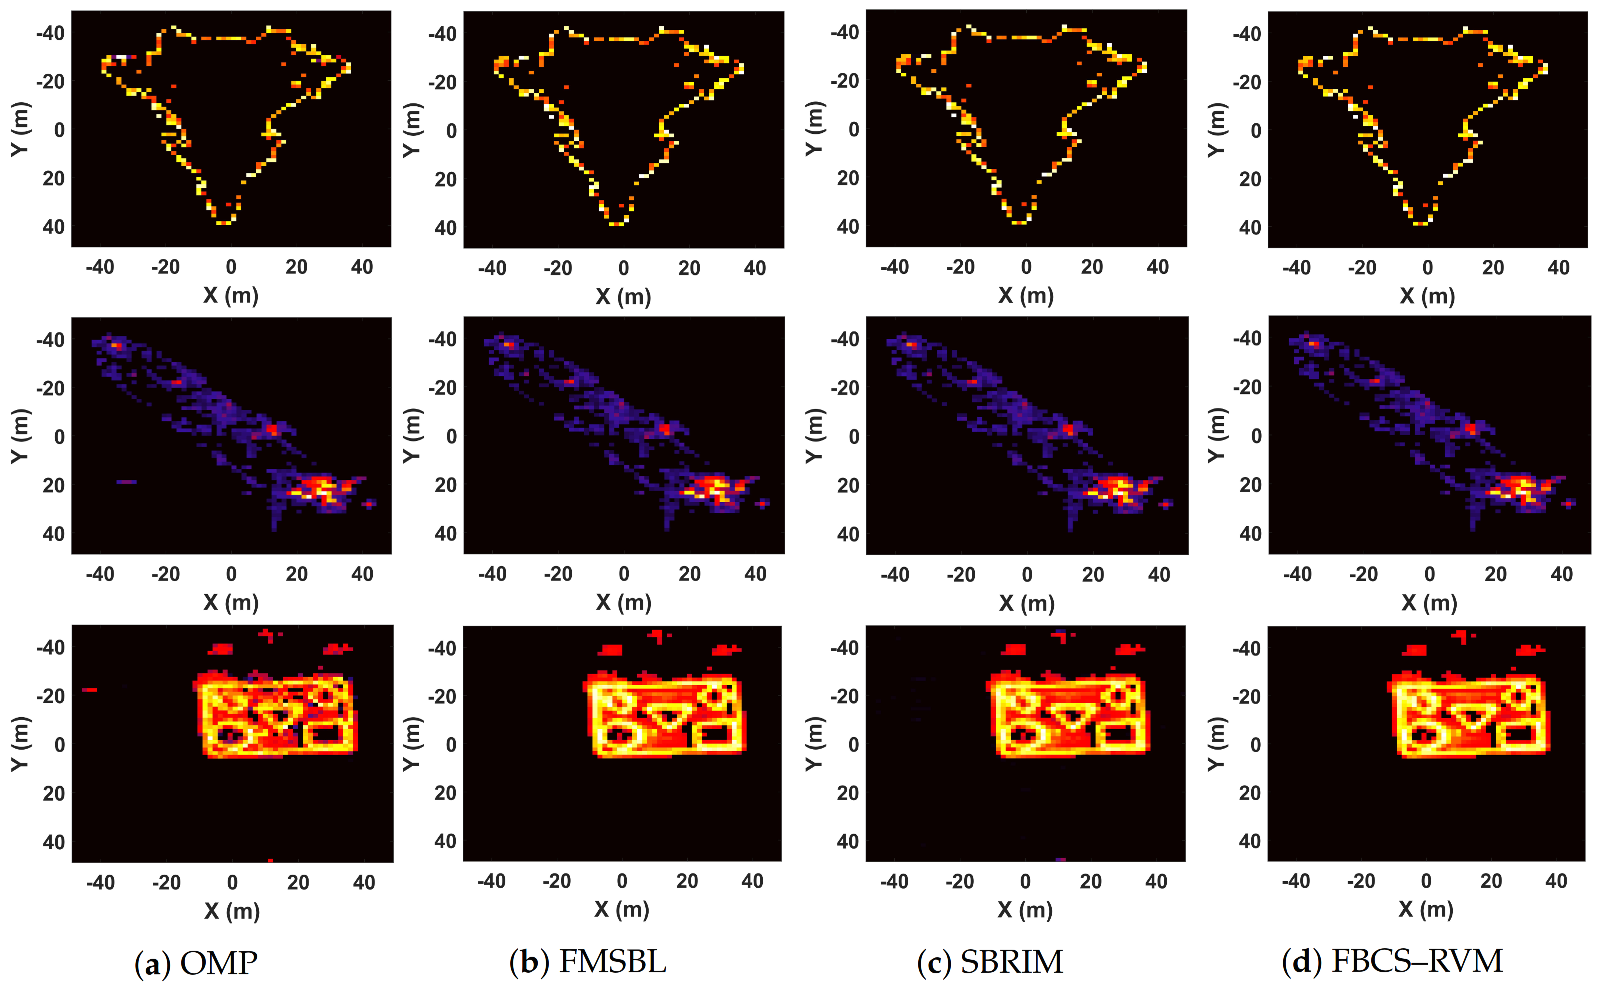
Figure 7.
The original scene and 3D imaging results of the airplane model; (a) original scene; (b) OMP; (c) FMSBL; (d) SBRIM; (e) FBCS–RVM;
Figure 7.
The original scene and 3D imaging results of the airplane model; (a) original scene; (b) OMP; (c) FMSBL; (d) SBRIM; (e) FBCS–RVM;
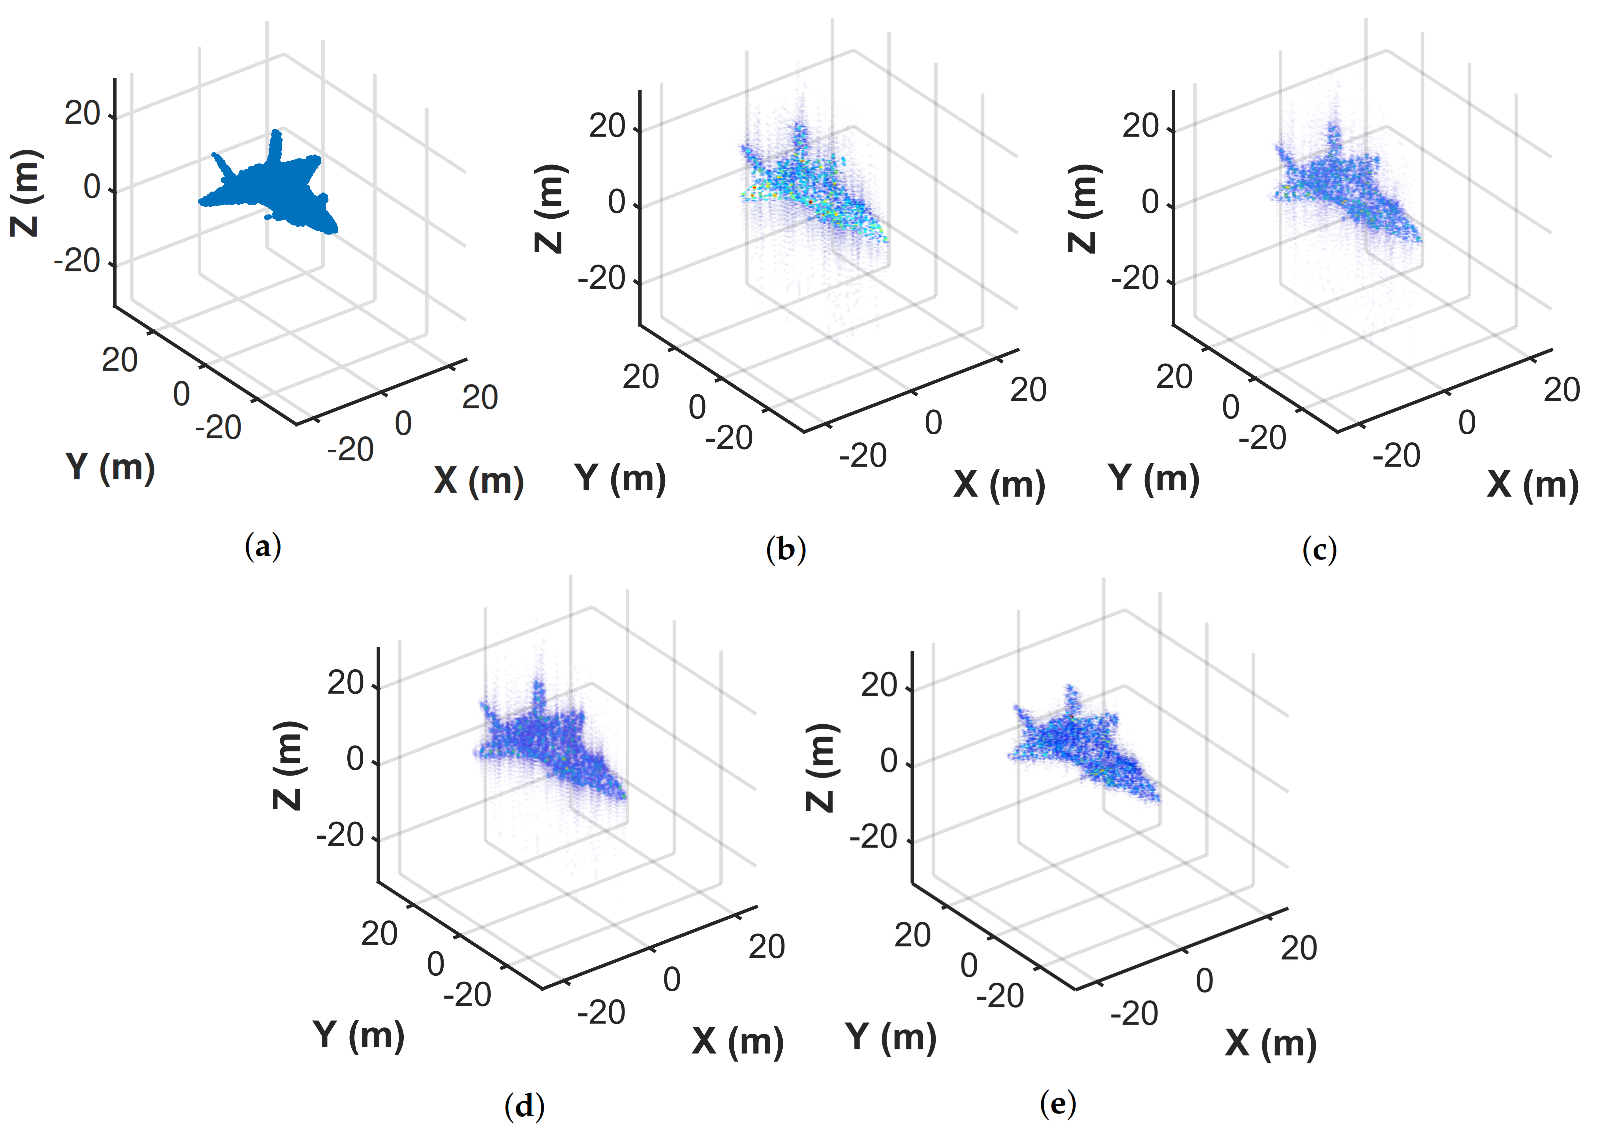
Figure 8.
The original scene and imaging results of the mountain model. (a) original scene; (b) OMP; (c) FMSBL; (d) SBRIM; (e) FBCS–RVM.
Figure 8.
The original scene and imaging results of the mountain model. (a) original scene; (b) OMP; (c) FMSBL; (d) SBRIM; (e) FBCS–RVM.
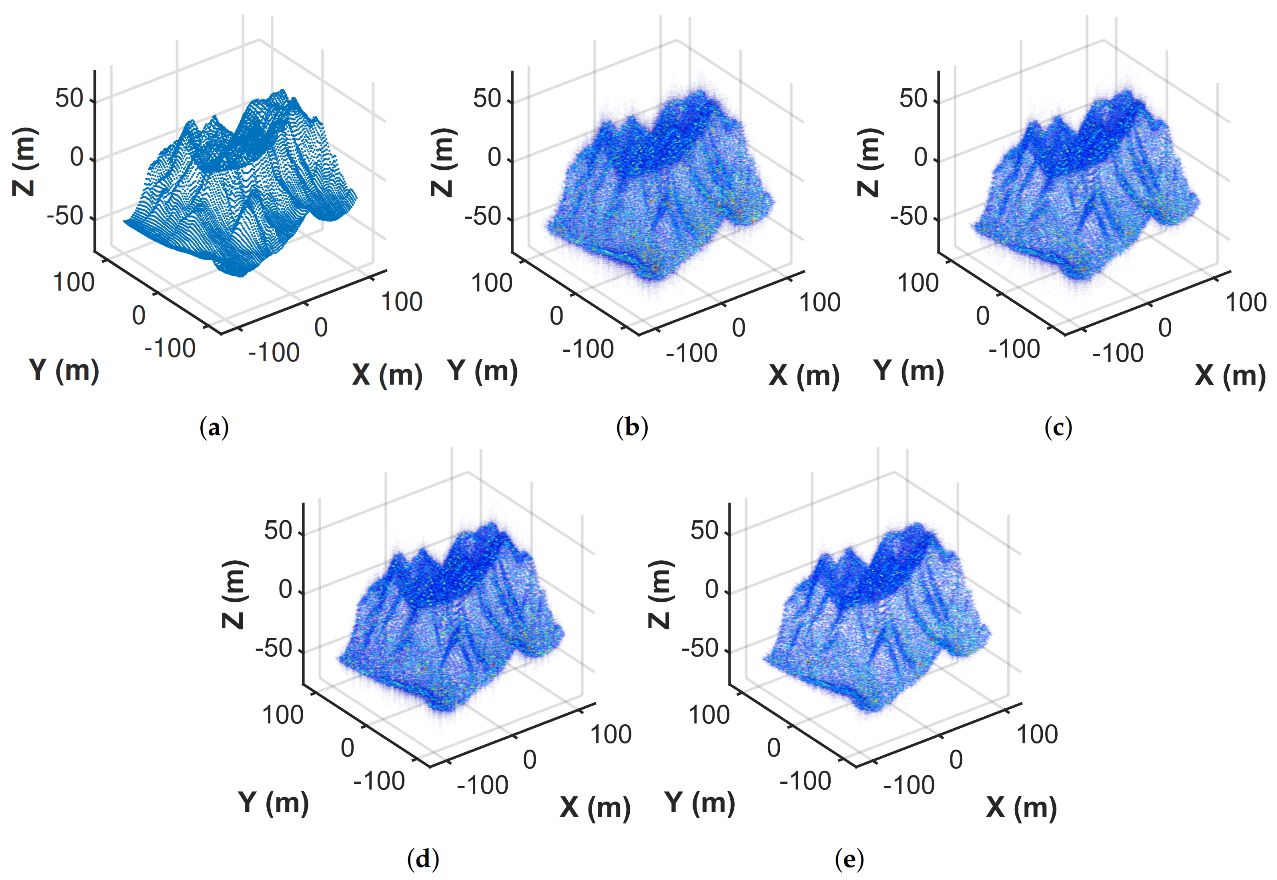
Figure 9.
(a) System; (b) experimental scene; first row: wall experiment, second row: Two balls experiment.
Figure 9.
(a) System; (b) experimental scene; first row: wall experiment, second row: Two balls experiment.
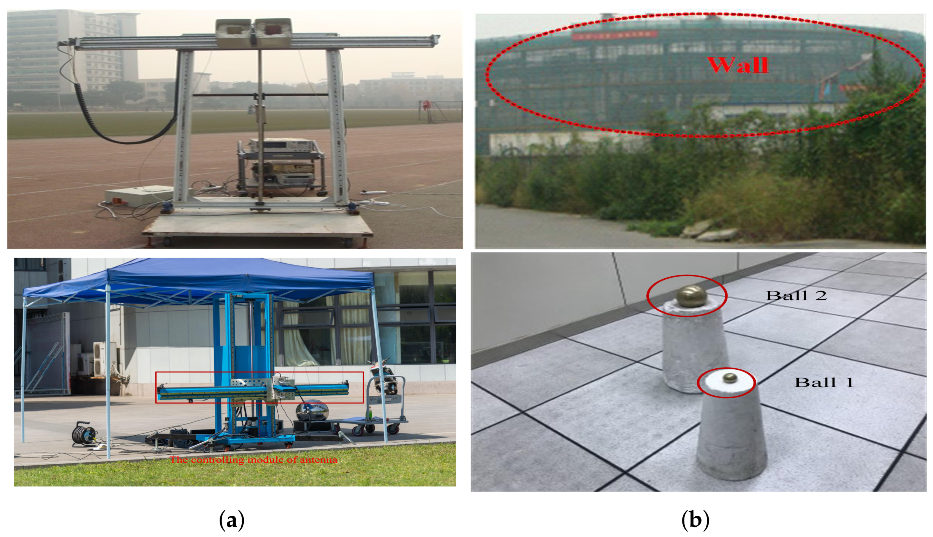
Figure 10.
The 3D imaging results by the OMP, FMSBL, SBRIM, and FBCS–RVM algorithms. first row: wall experiment, second row: two balls experiment.
Figure 10.
The 3D imaging results by the OMP, FMSBL, SBRIM, and FBCS–RVM algorithms. first row: wall experiment, second row: two balls experiment.
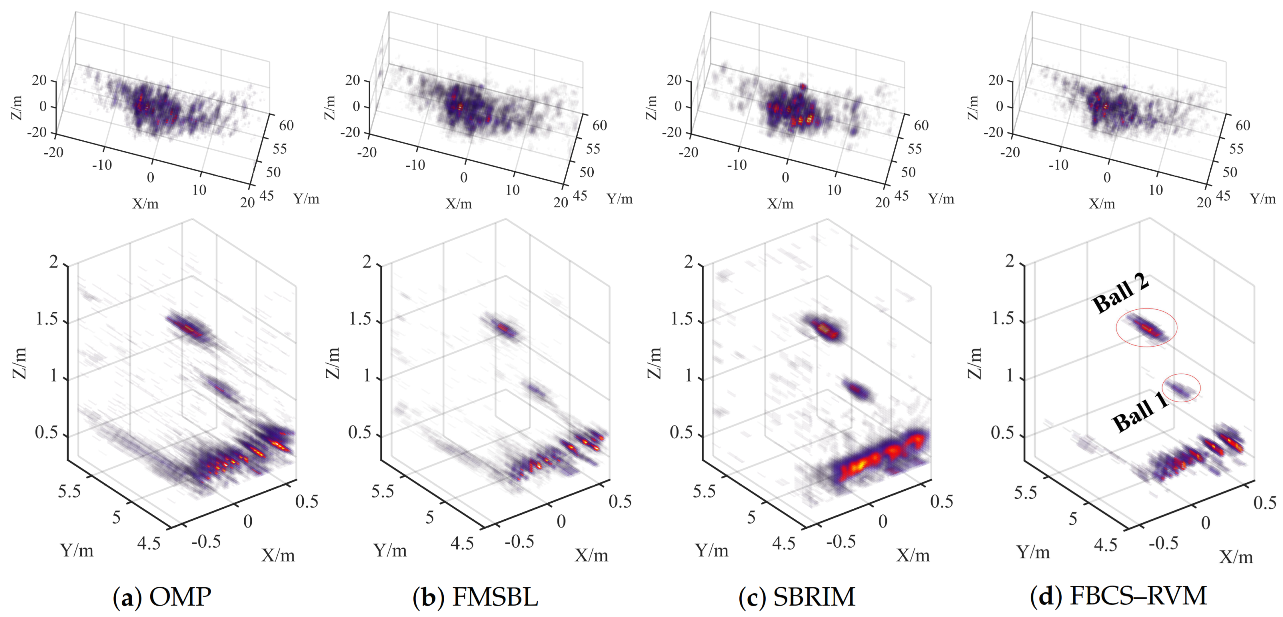
Figure 11.
The original scene and imaging results of Figure 4c. (a) original scene; (b) the imaging results corresponding to the FCM algorithm; (c) the imaging results corresponding to the K–Means algorithm; (d) the imaging results of the FBCS–RVM algorithm.
Figure 11.
The original scene and imaging results of Figure 4c. (a) original scene; (b) the imaging results corresponding to the FCM algorithm; (c) the imaging results corresponding to the K–Means algorithm; (d) the imaging results of the FBCS–RVM algorithm.
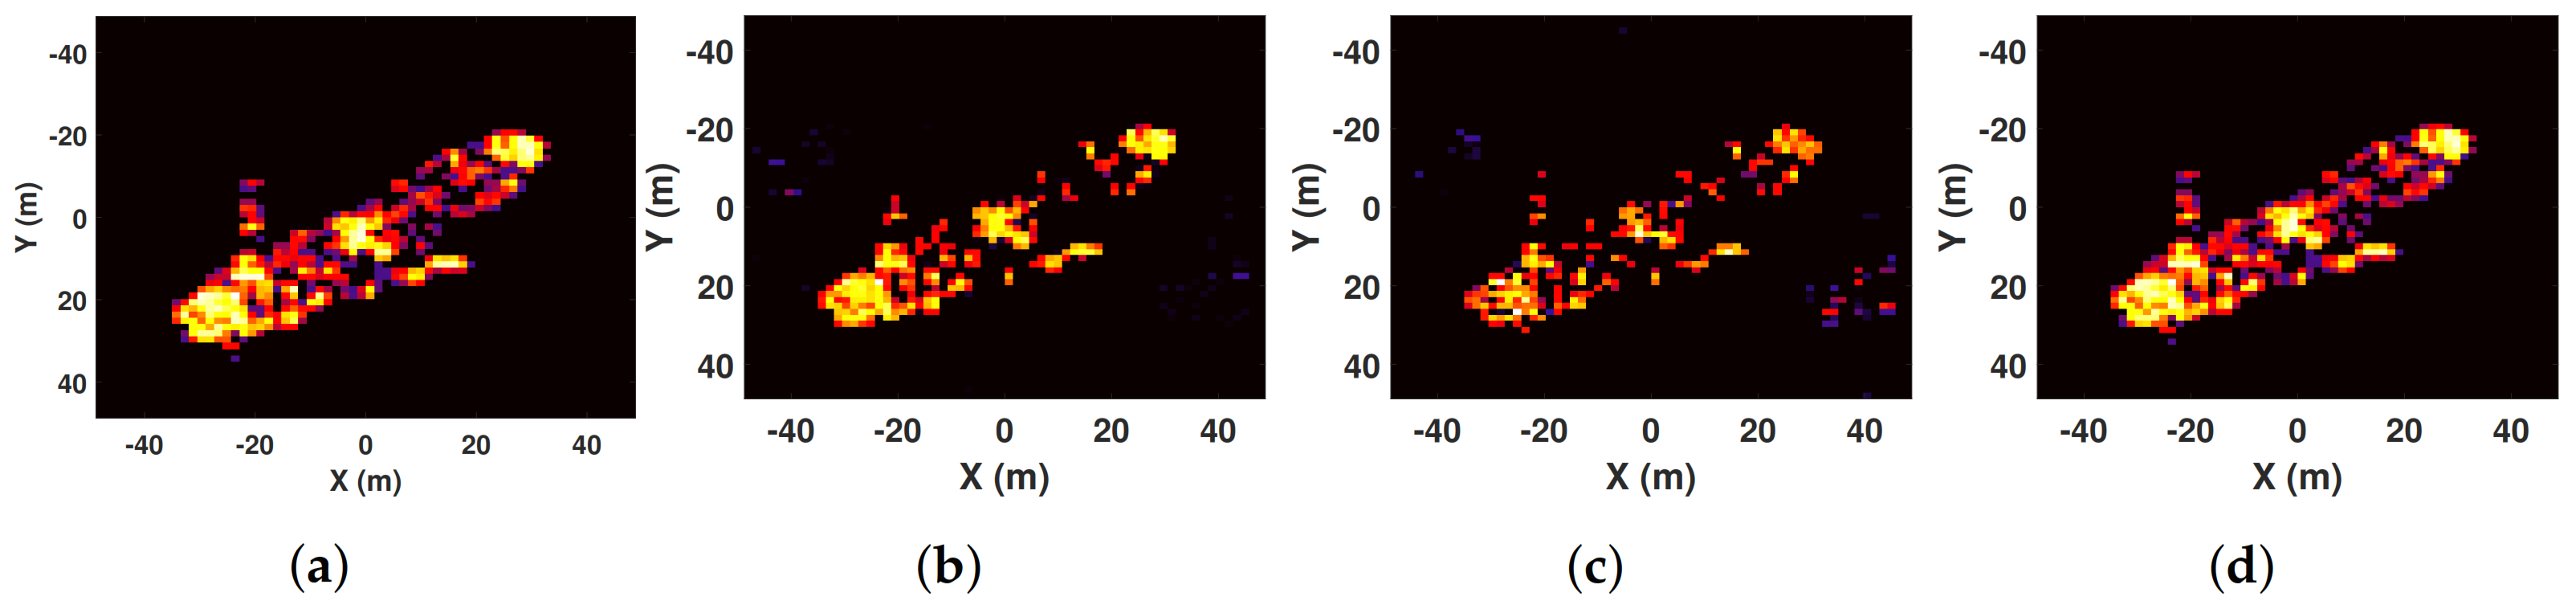
Figure 12.
The imaging results of the complex–target in Figure 4. First row: imaging results without the TSVD algorithm, second row: imaging results of the FBCS–RVM algorithm.
Figure 12.
The imaging results of the complex–target in Figure 4. First row: imaging results without the TSVD algorithm, second row: imaging results of the FBCS–RVM algorithm.
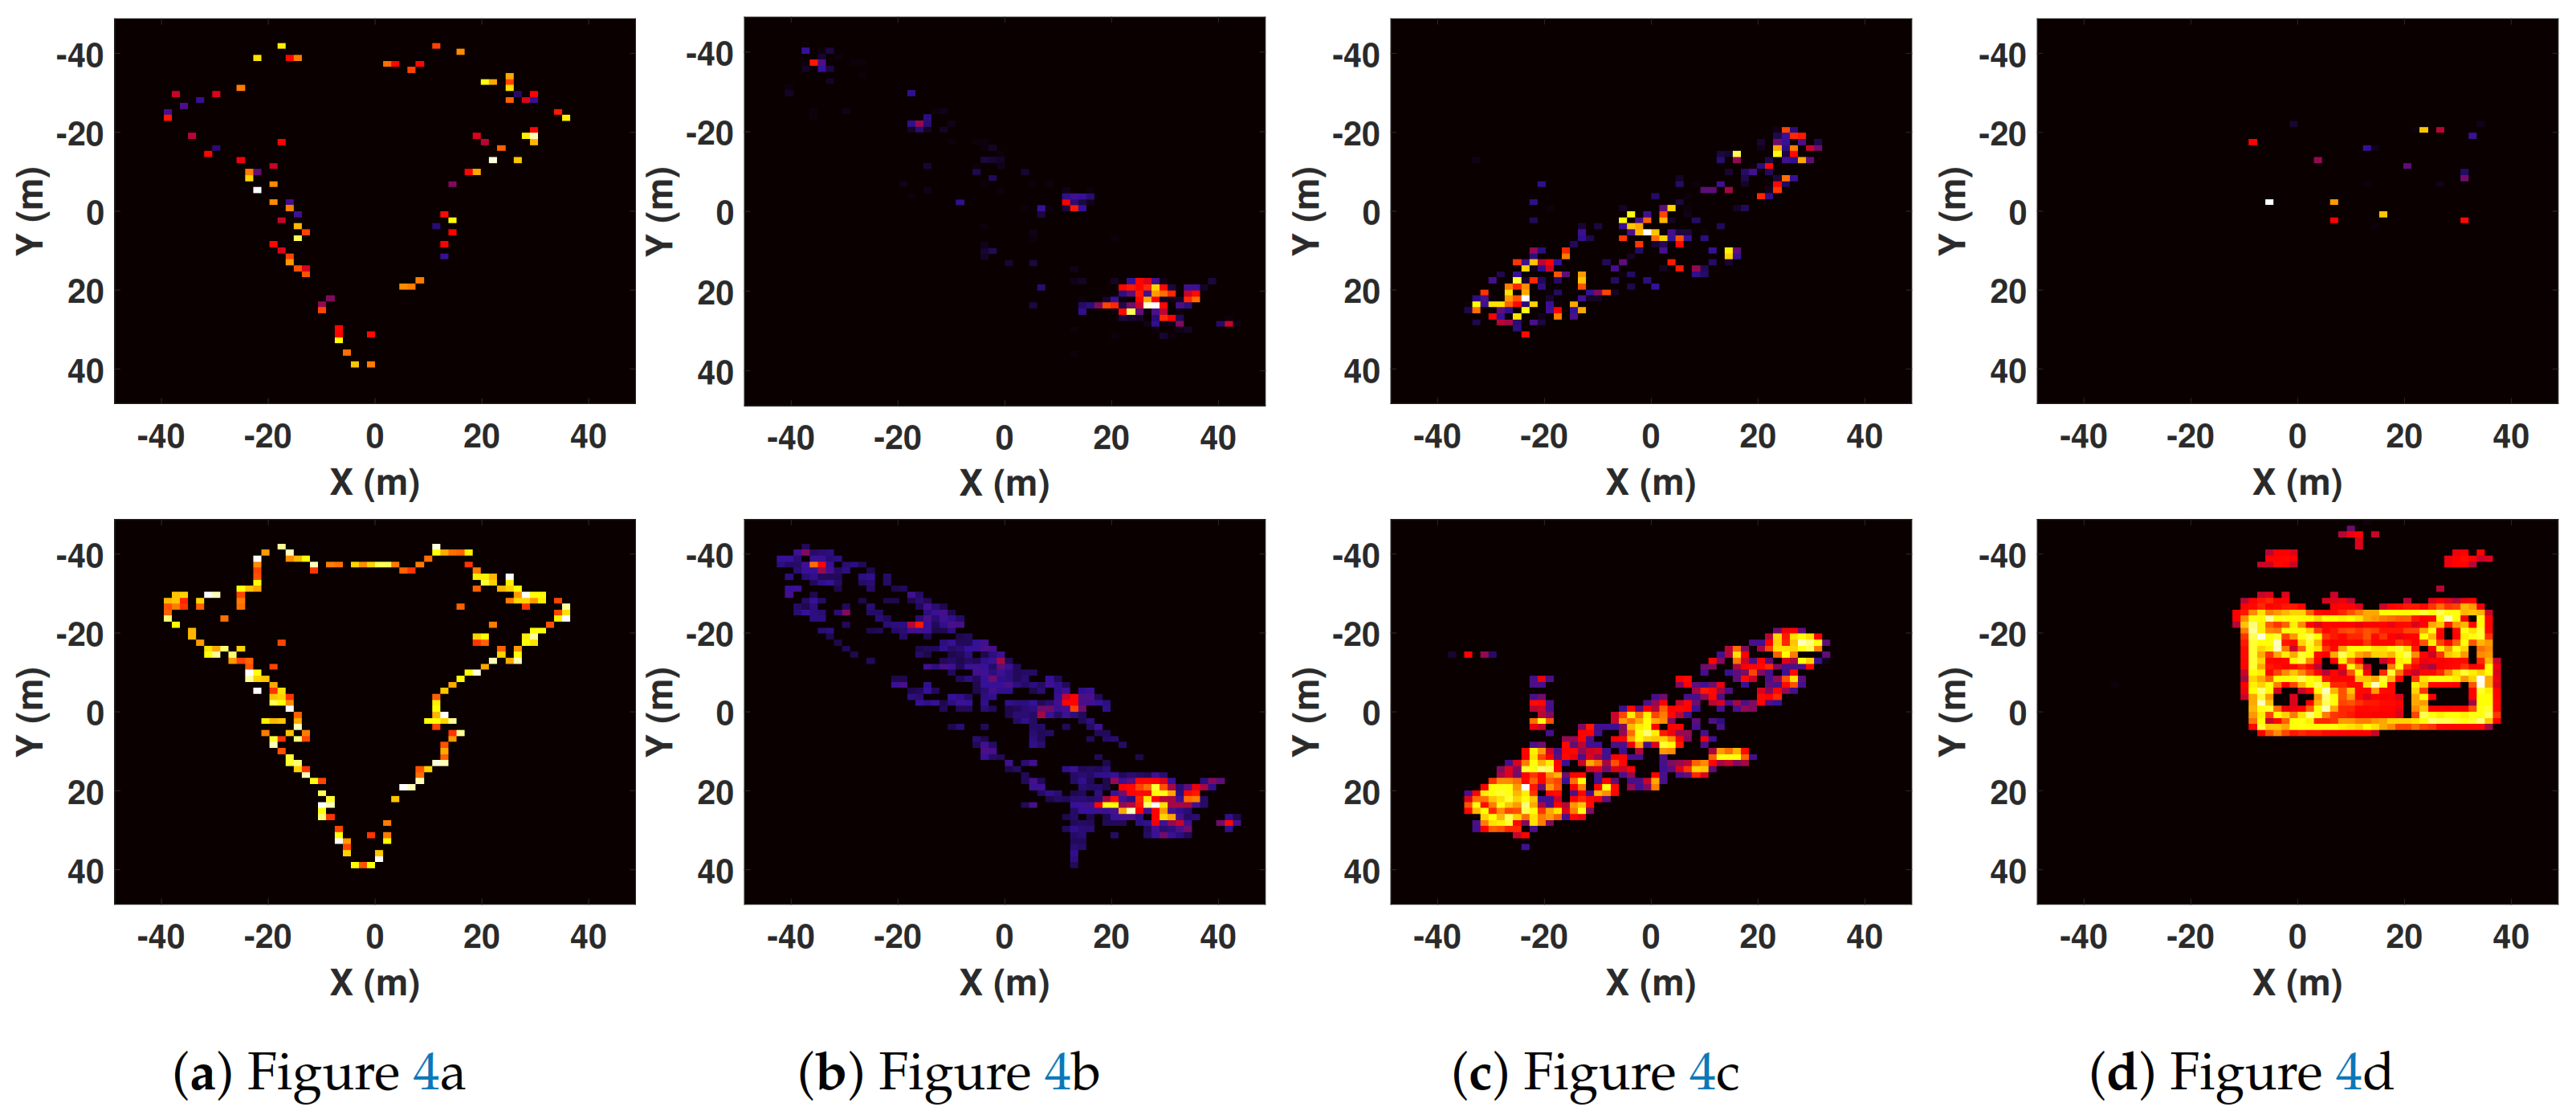
Figure 13.
The evaluation results under increasing sparsity with fixed total scattering units. (a) NMSE; (b) TBR; (c) ENT; (d) execution time.
Figure 13.
The evaluation results under increasing sparsity with fixed total scattering units. (a) NMSE; (b) TBR; (c) ENT; (d) execution time.

Table 1.
The computational complexity of the SBRIM and FBCS–RVM algorithm.
| Algorithm | Computational Complexity |
|---|---|
| SBRIM | |
| FBCS–RVM |
Table 2.
The basic parameters of the 2D point-target simulations.
| Parameters | Value |
|---|---|
| Center frequency/GHz | 30 |
| Signal bandwidth/MHz | 150 |
| Platform height /m | 1000 |
| The size of the 2D array/m | 4 × 4 |
| Total number of APCs | 1600 |
| Total number of scattering units | 101× 101 |
| Spacing between adjacent scattering unit/m | 0.3 m |
Table 3.
The evaluation results under different sampling rates.
| Sampling Rate | Standards | OMP | FMSBL | SBRIM | FBCS–RVM |
|---|---|---|---|---|---|
| 20% | NMSE | 0.3884 | 0.0102 | 0.0063 | 0.0035 |
| TBR | 78.0341 | 312.9847 | 103.6925 | 313.0533 | |
| ENT | 0.1495 | 0.0244 | 0.0343 | 0.0238 | |
| ExT/s | 0.4645 | 0.4084 | 84.1898 | 0.8922 | |
| RTSR | 0.5206 | 0.4578 | 94.3654 | 1 | |
| 40% | NMSE | 0.0326 | 0.0051 | 0.0029 | 0.0024 |
| TBR | 85.9777 | 313.0286 | 114.8554 | 313.0587 | |
| ENT | 0.1250 | 0.0233 | 0.0236 | 0.0232 | |
| ExT/s | 0.8680 | 0.6106 | 90.6742 | 0.9839 | |
| RTSR | 0.8822 | 0.6207 | 92.1619 | 1 | |
| 60% | NMSE | 0.0093 | 0.0034 | 0.0026 | 0.0019 |
| TBR | 88.3392 | 313.0428 | 118.3356 | 313.0610 | |
| ENT | 0.1205 | 0.0232 | 0.0255 | 0.0232 | |
| ExT/s | 1.3479 | 0.8379 | 102.7153 | 1.0381 | |
| RTSR | 1.2984 | 0.8072 | 98.9465 | 1 | |
| 80% | NMSE | 0.0066 | 0.0026 | 0.0019 | 0.0017 |
| TBR | 89.8987 | 313.0514 | 120.3862 | 313.0625 | |
| ENT | 0.1118 | 0.0232 | 0.0232 | 0.0231 | |
| ExT/s | 1.8296 | 1.1590 | 118.8683 | 1.1151 | |
| RTSR | 1.6407 | 1.0394 | 106.5902 | 1 | |
| 100% | NMSE | 0.0057 | 0.0021 | 0.0016 | 0.0015 |
| TBR | 91.0592 | 313.0541 | 121.5146 | 313.0634 | |
| ENT | 0.0923 | 0.0230 | 0.0232 | 0.0230 | |
| ExT/s | 2.2521 | 1.6765 | 131.0763 | 1.1934 | |
| RTSR | 1.8896 | 1.4048 | 109.8315 | 1 |
Table 4.
The evaluation results under different SNR.
| SNR | Standards | OMP | FMSBL | SBRIM | FBCS–RVM |
|---|---|---|---|---|---|
| 0 | NMSE | 1.4546 | 1.2445 | 0.6486 | 0.4202 |
| TBR | 70.1586 | 65.3756 | 45.0455 | 61.9777 | |
| ENT | 0.4355 | 0.6267 | 0.7383 | 0.1245 | |
| ExT/s | 2.4882 | 68.6281 | 100.2196 | 3.7812 | |
| RTSR | 0.6581 | 16.3911 | 27.8272 | 1 | |
| 10 | NMSE | 0.4229 | 0.2132 | 0.2290 | 0.0911 |
| TBR | 44.6720 | 58.4351 | 61.8170 | 76.7137 | |
| ENT | 0.3944 | 0.3366 | 0.3611 | 0.0836 | |
| ExT/s | 2.4847 | 15.5745 | 100.0990 | 2.3617 | |
| RTSR | 1.0521 | 6.5945 | 46.2305 | 1 | |
| 20 | NMSE | 0.1328 | 0.0393 | 0.0669 | 0.0216 |
| TBR | 60.1341 | 75.5671 | 76.4821 | 228.0255 | |
| ENT | 0.3461 | 0.1611 | 0.1664 | 0.0592 | |
| ExT/s | 2.4923 | 3.2620 | 99.6250 | 1.2129 | |
| RTSR | 2.0548 | 2.6877 | 82.1351 | 1 | |
| 30 | NMSE | 0.0415 | 0.0081 | 0.0201 | 0.0067 |
| TBR | 70.2377 | 93.5478 | 88.6350 | 313.0359 | |
| ENT | 0.2950 | 0.0252 | 0.0819 | 0.0252 | |
| ExT/s | 2.4900 | 1.5547 | 99.5041 | 1.1929 | |
| RTSR | 2.0873 | 1.2956 | 83.4110 | 1 | |
| 40 | NMSE | 0.0133 | 0.0041 | 0.0074 | 0.0018 |
| TBR | 80.1339 | 312.0601 | 97.4627 | 313.0600 | |
| ENT | 0.2020 | 0.0232 | 0.0449 | 0.0232 | |
| ExT/s | 2.4902 | 0.7551 | 99.7141 | 1.1836 | |
| RTSR | 2.1004 | 0.6380 | 84.1035 | 1 |
Table 5.
The basic parameters of the complex-target simulations.
| Parameters | Value |
|---|---|
| Center frequency/GHz | 30 |
| Signal bandwidth/MHz | 150 |
| Platform height /m | 3000 |
| The size of the 2D array/m | 10 × 15 |
| Traditional array imaging resolution/m | 1.5 × 1 |
| Total number of APCs | 4096 |
| Total number of scattering units | 64 × 64 |
| Spacing between adjacent scattering unit/m | 1.5 m |
Table 6.
The evaluation results under different sampling rates.
| Sampling Rate | Standards | OMP | FMSBL | SBRIM | FBCS–RVM |
|---|---|---|---|---|---|
| 35% | NMSE | 0.1860 | 0.0343 | 0.0180 | 0.0081 |
| TBR | 64.8529 | 356.5519 | 86.1030 | 347.7633 | |
| ENT | 1.5965 | 1.4042 | 1.4499 | 1.3975 | |
| ExT/s | 9.9206 | 7.9548 | 50.0197 | 4.1410 | |
| 50% | NMSE | 0.1229 | 0.0191 | 0.0070 | 0.0059 |
| TBR | 67.5803 | 356.6352 | 92.5163 | 356.7727 | |
| ENT | 1.5795 | 1.3999 | 1.4261 | 1.3951 | |
| ExT/s | 13.4775 | 10.1920 | 59.2569 | 5.0914 | |
| 75% | NMSE | 0.0488 | 0.0118 | 0.0050 | 0.0045 |
| TBR | 70.9421 | 356.6923 | 100.2144 | 356.7769 | |
| ENT | 1.5746 | 1.3982 | 1.4082 | 1.3951 | |
| ExT/s | 19.1810 | 11.8886 | 68.7381 | 7.0756 | |
| 100% | NMSE | 0.0049 | 0.0087 | 0.0042 | 0.0038 |
| TBR | 73.3827 | 356.7177 | 115.6553 | 356.7790 | |
| ENT | 1.5587 | 1.3959 | 1.3972 | 1.3940 | |
| ExT/s | 25.7976 | 16.3656 | 82.4328 | 9.6135 |
Table 7.
The evaluation results under different sparsity.
| Sparsity | Standards | OMP | FMSBL | SBRIM | FBCS–RVM |
|---|---|---|---|---|---|
| 210 | NMSE | 0.1719 | 0.0065 | 0.0131 | 0.0039 |
| TBR | 80.6241 | 358.1459 | 94.6461 | 358.1873 | |
| ENT | 0.7115 | 0.6127 | 0.6383 | 0.6122 | |
| ExT/s | 2.2293 | 4.0253 | 51.5601 | 2.1532 | |
| RTSR | 1.0353 | 1.8695 | 23.9458 | 1 | |
| 495 | NMSE | 0.0454 | 0.0254 | 0.0075 | 0.0062 |
| TBR | 67.2429 | 356.6358 | 53.6697 | 356.7732 | |
| ENT | 1.4737 | 1.3122 | 1.3052 | 1.3050 | |
| ExT/s | 13.8548 | 9.4727 | 52.3047 | 4.6349 | |
| RTSR | 2.9892 | 2.0438 | 11.2631 | 1 | |
| 515 | NMSE | 0.1229 | 0.0191 | 0.0070 | 0.0059 |
| TBR | 67.5803 | 356.6352 | 92.5163 | 356.7727 | |
| ENT | 1.5795 | 1.3999 | 1.4261 | 1.3951 | |
| ExT/s | 13.4775 | 10.1920 | 59.2569 | 5.0914 | |
| RTSR | 2.6431 | 1.9171 | 10.8217 | 1 | |
| 677 | NMSE | 0.1716 | 0.0245 | 0.0340 | 0.0136 |
| TBR | 65.4404 | 354.6187 | 88.7377 | 253.3289 | |
| ENT | 2.0640 | 1.8092 | 1.8432 | 1.8043 | |
| ExT/s | 17.0740 | 13.6286 | 53.3612 | 8.2566 | |
| RTSR | 2.0671 | 1.6506 | 6.4629 | 1 |
Table 8.
The main parameters of 3D simulations.
| Parameters | Airplane | Mountain |
|---|---|---|
| Center frequency/GHz | 37.5 | 37.5 |
| Signal bandwidth/GHz | 0.8 | 0.3 |
| Platform height /m | 1000 | 3000 |
| Size of the 2D array/m | 3 × 3 | 3 × 3 |
| Number of sampling points in range domain | 512 | 512 |
| Number of APCs in the 2D array | 4096 | 16,384 |
| The sampling rate of echo signal | 50% | 50% |
| The size of the 2D imaging scene/m | 50 × 70 | 250 × 250 |
| The number of scattering units in the 2D imaging scene | 101 × 101 | 101 × 101 |
Table 9.
The evaluation results under different targets.
| Target | Standards | OMP | FMSBL | SBRIM | FBCS–RVM |
|---|---|---|---|---|---|
| Airplane | TBR | 65.3520 | 63.9603 | 59.3230 | 68.9073 |
| ENT | 0.1924 | 0.1998 | 0.3998 | 0.0615 | |
| ExT/s | 2628.89 | 3525.32 | 53347.14 | 848.20 | |
| RTSR | 3.0095 | 4.1570 | 62.8955 | 1 | |
| Mountain | TBR | 45.6039 | 43.8738 | 37.1098 | 49.3453 |
| ENT | 0.7645 | 0.9574 | 1.4492 | 0.4036 | |
| ExT/s | 60530.26 | 220966.74 | 223913.66 | 18547.83 | |
| RTSR | 3.2636 | 11.9139 | 12.0727 | 1 |
Table 10.
The parameters of two GDLASAR systems.
| Parameters | System 1 | System 2 |
|---|---|---|
| Center frequency /GHz | 9.62 | 10 |
| Signal bandwidth /GHz | 0.08 | 2 |
| Size of the 2D array/m | 1.25 × 1.25 | 1.5 × 1.3 |
| Number of sampling points in range domain | 500 | 801 |
| Number of APCs in the 2D array | 8928 | 8394 |
| Size of 2D imaging scene/m | 40× 70 | 5 × 5 |
| Number of scattering units in the 2D imaging scene | 101 × 101 | 101 × 101 |
Table 11.
The evaluation results of wall experiment.
| Sampling Rate | Standards | OMP | FMSBL | SBRIM | FBCS–RVM |
|---|---|---|---|---|---|
| 12.5% | TBR | 27.8904 | 25.8961 | 30.3913 | 31.8609 |
| ENT | 1.8007 | 1.8691 | 2.0098 | 1.4276 | |
| ExT/s | 244.7976 | 913.0925 | 15,523.19 | 148.4204 | |
| RTSR | 1.6525 | 6.1639 | 104.7912 | 1 | |
| 25% | TBR | 29.9577 | 27.7150 | 31.5723 | 33.0056 |
| ENT | 1.5790 | 1.7417 | 1.9560 | 1.3140 | |
| ExT/s | 467.4062 | 1358.39 | 21,076.94 | 301.6024 | |
| RTSR | 1.5499 | 4.5043 | 69.8898 | 1 | |
| 50% | TBR | 31.1948 | 28.8495 | 32.9698 | 34.1467 |
| ENT | 1.4733 | 1.5387 | 1.8587 | 1.2026 | |
| ExT/s | 950.8605 | 1950.28 | 32,152.46 | 587.49 | |
| RTSR | 1.6185 | 3.3196 | 54.7279 | 1 | |
| 75% | TBR | 31.7079 | 29.1247 | 33.1911 | 34.4093 |
| ENT | 1.4184 | 1.5000 | 1.8037 | 1.1544 | |
| ExT/s | 1364.31 | 2623.59 | 42,886.93 | 834.57 | |
| RTSR | 1.6347 | 3.1436 | 51.3877 | 1 | |
| 100% | TBR | 31.8951 | 25.8961 | 33.2413 | 34.3879 |
| ENT | 1.4021 | 1.5150 | 1.7713 | 1.1752 | |
| ExT/s | 1827.54 | 3876.47 | 53,749.08 | 1038.27 | |
| RTSR | 1.7602 | 3.7336 | 51.7677 | 1 |
Table 12.
The evaluation results of the two balls experiment.
| Sampling Rate | Standards | OMP | FMSBL | SBRIM | FBCS–RVM |
|---|---|---|---|---|---|
| 12.5% | TBR | 45.3686 | 57.9804 | 31.3033 | 59.1770 |
| ENT | 1.8858 | 0.6891 | 3.7257 | 0.6068 | |
| ExT/s | 137.1024 | 285.7793 | 11,718.08 | 55.0775 | |
| RTSR | 2.4893 | 5.1887 | 212.7652 | 1 | |
| 25% | TBR | 47.2367 | 59.1535 | 33.8888 | 60.6803 |
| ENT | 1.6312 | 0.5383 | 3.2330 | 0.4548 | |
| ExT/s | 257.5522 | 569.6074 | 15,654.62 | 84.1086 | |
| RTSR | 3.0621 | 6.7659 | 186.1239 | 1 | |
| 50% | TBR | 48.1008 | 60.2373 | 36.2445 | 61.5205 |
| ENT | 1.4724 | 0.4749 | 2.8011 | 0.3666 | |
| ExT/s | 495.9828 | 1175.66 | 23,527.45 | 125.8026 | |
| RTSR | 3.9425 | 9.3453 | 187.0188 | 1 | |
| 75% | TBR | 48.5975 | 60.5376 | 37.4526 | 61.9171 |
| ENT | 1.3887 | 0.4846 | 2.6097 | 0.3449 | |
| ExT/s | 769.3935 | 1872.83 | 31,422.70 | 175.1862 | |
| RTSR | 4.3919 | 10.6905 | 179.3674 | 1 | |
| 100% | TBR | 48.5673 | 61.1714 | 38.0847 | 62.8071 |
| ENT | 1.3939 | 0.4783 | 2.5305 | 0.3320 | |
| ExT/s | 1060.19 | 2361.45 | 39,405.99 | 301.1206 | |
| RTSR | 3.5208 | 7.8442 | 130.8645 | 1 |
Table 13.
The evaluation results of Figure 11.
Table 13.
The evaluation results of Figure 11.
| Methods | NMSE | TBR | ENT | ExT/s |
|---|---|---|---|---|
| FCM | 0.2432 | 60.3040 | 1.0713 | 1.7540 |
| K-Means | 0.7264 | 111.0213 | 0.8455 | 3.9616 |
| FBCS–RVM | 0.0060 | 247.0184 | 1.3961 | 5.9264 |
Table 14.
The evaluation results of Figure 12.
Table 14.
The evaluation results of Figure 12.
| TSVD | NMSE | TBR | ENT | ExT/s | |
|---|---|---|---|---|---|
| Figure 12a | × | 2.2746 | 348.4178 | 0.6053 | 3.0735 |
| ✓ | 0.0053 | 356.6006 | 0.6116 | 3.0740 | |
| Figure 12b | × | 2.8868× | 84.7975 | 1.2917 | 5.7222 |
| ✓ | 0.0061 | 82.9849 | 1.3050 | 5.9755 | |
| Figure 12c | × | 9.9908× | 347.4051 | 1.3722 | 5.0965 |
| ✓ | 0.0088 | 351.4521 | 1.3958 | 5.1139 | |
| Figure 12d | × | 4.7497 | 346.5817 | 1.7125 | 8.7975 |
| ✓ | 0.0159 | 317.3393 | 1.8043 | 8.8991 |
Publisher’s Note: MDPI stays neutral with regard to jurisdictional claims in published maps and institutional affiliations. |
© 2021 by the authors. Licensee MDPI, Basel, Switzerland. This article is an open access article distributed under the terms and conditions of the Creative Commons Attribution (CC BY) license (https://creativecommons.org/licenses/by/4.0/).
Share and Cite
MDPI and ACS Style
Tian, B.; Zhang, X.; Li, L.; Pu, L.; Pu, L.; Shi, J.; Wei, S. Fast Bayesian Compressed Sensing Algorithm via Relevance Vector Machine for LASAR 3D Imaging. Remote Sens. 2021, 13, 1751. https://doi.org/10.3390/rs13091751
AMA Style
Tian B, Zhang X, Li L, Pu L, Pu L, Shi J, Wei S. Fast Bayesian Compressed Sensing Algorithm via Relevance Vector Machine for LASAR 3D Imaging. Remote Sensing. 2021; 13(9):1751. https://doi.org/10.3390/rs13091751
Chicago/Turabian StyleTian, Bokun, Xiaoling Zhang, Liang Li, Ling Pu, Liming Pu, Jun Shi, and Shunjun Wei. 2021. "Fast Bayesian Compressed Sensing Algorithm via Relevance Vector Machine for LASAR 3D Imaging" Remote Sensing 13, no. 9: 1751. https://doi.org/10.3390/rs13091751
Note that from the first issue of 2016, this journal uses article numbers instead of page numbers. See further details here.