Abstract
We describe an “Urban Observatory” facility designed for the study of complex urban systems via persistent, synoptic, and granular imaging of dynamical processes in cities. An initial deployment of the facility has been demonstrated in New York City and consists of a suite of imaging systems—both broadband and hyperspectral—sensitive to wavelengths from the visible (∼400 nm) to the infrared (∼13 micron) operating at cadences of ∼0.01–30 Hz (characteristically ∼0.1 Hz). Much like an astronomical survey, the facility generates a large imaging catalog from which we have extracted observables (e.g., time-dependent brightnesses, spectra, temperatures, chemical species, etc.), collecting them in a parallel source catalog. We have demonstrated that, in addition to the urban science of cities as systems, these data are applicable to a myriad of domain-specific scientific inquiries related to urban functioning including energy consumption and end use, environmental impacts of cities, and patterns of life and public health. We show that an Urban Observatory facility of this type has the potential to improve both a city’s operations and the quality of life of its inhabitants.
1. Introduction
With millions of interacting people and hundreds of governing agencies, urban environments are the largest, most dynamic, and most complex human systems on earth. Some 80% of the US population (and 50% of the global population) now live in cities [1], and within those urban boundaries are a multitude of interactions between the three fundamental components of urban systems: the inhabitants, the natural environment, and the built environment. The study of cities as complex systems is not new [2,3,4]. Research in urban planning [5,6], engineering [7,8], transportation [9,10], etc., all have a rich history of quantifying city life at multiple scales and with networked interactions [11,12]. The application of that work addresses everything from quality of life [13,14,15] to public health [16,17] to sustainability and resilience [18,19,20]. However, there are two recent revolutions that are leading to a dramatic change in the way we understand complexity in urban environments: the systematic collection, digitization, and curation of vast quantities of urban records data [21,22,23] and the development of computational techniques that make it possible to jointly analyze large, disparate data sources.
This advent of large scale urban data collection and availability, and the application of modern statistical methods to that data, has led to the emerging field of “urban science” [24,25,26,27], in which approaches from the natural, computational, and engineering sciences are blended with those from the social and earth sciences to describe emergent phenomena and interactions between the the human, built, and natural environment components of urban systems. Interactions between these components are characterized by their temporal evolution over multiple time scales and their interconnection between multiple urban subsystems [11,28,29]. These “dynamics” in complex urban systems present in contexts as diverse as patterns of transportation activity [30], pedestrian foot traffic [31,32], urban energy use [33], heating and cooling of infrastructure [34,35], air quality variability [36,37], human mobility and displacement [38,39,40,41], and evolution of urban boundaries [42,43,44]. Urban science lines of inquiry are characterized by the analysis of highly heterogeneous data sources of diverse origin and provenance, including public records data, transactional data, and sensor data (e.g., in situ environmental sensors, audio [45,46], imaging/video [31,47,48], etc.), and it is the fusion of those data sources in the context of urban dynamics and functioning that underpins the methodological approach of urban science.
An important field of study for complex urban environments is that of remote sensing [49,50,51,52,53] and the associated data collection from overhead satellite platforms at a variety of wavelengths [54,55]. These satellite data are both large in volume and rich in information content, and their analysis has been used to correlate remote observables with land use characteristics [56], energy consumption [57,58,59,60,61], light pollution [62,63,64], poverty [65,66,67], and urban growth [68,69,70] (among many others). Characteristically, these overhead platforms provide spatial resolution of ∼10 s of meters and temporal resolution ∼1 day or more (though recent advances in satellite technology are pushing towards increased granularity on both fronts). However, at present, this resolution is insufficient to study dynamical interactions in cities on the time scale of minutes, and the overhead vantage point—while ideal for total spatial coverage—only captures photons that are emitted upward, providing an incomplete picture for several science cases (e.g., the ecological and public health impacts of light pollution [62,71,72,73]).
In this paper, we describe an “Urban Observatory” (UO) for the study of dynamical processes in complex urban systems. In Section 2, we outline our initial deployment of this UO in New York City (NYC), a multi-modal platform with the flexibility and spatio-temporal sensitivity and resolution to quantify a myriad of dynamical processes in urban systems that are not observable by other means of remote sensing. In Section 3, we give an in-depth description of the range of urban phenomenology that is accessible via this system, including unique quantifications of three key components of complex urban systems and urban metabolism [74] more generally: energy use in cities, environmental impacts, and human factors. In Section 4, we discuss the linkages between these diverse urban science domain applications in the context of subsystem dependencies and urban metabolism. In Section 5, we conclude with what we envision to be important future deployments of UO facilities in other cities.
2. Instrumentation
The core UO platform consists of a suite of imaging systems mounted atop tall buildings at a distance of 1–4 km from the area of study (see Figure 1), providing a synoptic view of city skylines [75,76]. As we discuss in more depth in Section 3, the spatial resolution of UO instrumentation is sufficiently granular to segment the imaging at the sub-building level, and (inspired by astronomical observatories operating in survey mode such as the Sloan Digital Sky Survey [77] or PanSTARRS [78]) the system operates persistently in order to observe multiple temporal scales: minutes, hourly, daily, weekly, monthly, annual, etc. In addition to the imaging devices themselves, associated computing hardware is located both at the device (where minimal edge computations are performed) and at a central server location. The former consists of small mini-computers (Raspberry PIs or similar), while the latter is a multi-purpose backend infrastructure that

Figure 1.
Top left: an example of one of our Urban Observatory (UO) deployments of a Visible Near-Infrared (VNIR) Hyperspectral camera. The camera itself is encased in a weatherized housing and sits atop a pan/tilt, both of which are connected to (and controlled by) our backend computing infrastructure. Upper right: An example broadband nighttime image of Midtown Manhattan and the Lower East Side captured by that vantage point [75]. Lower left: An example infrared image captured from the same vantage point. Middle and lower right: An example VNIR hyperspectral scan of the same scene shown in false color. The middle false color image is constructed from three individual wavelengths while the lower panel shows three spectra from the scene [76].
- Drives the imaging devices remotely;
- Pulls and queues data transfer from the deployed devices;
- Performs signal processing, computer vision, and machine learning tasks on the images and associated products; and
- Holds and serves imaging and source databases associated with the data collection and analysis.
This backend infrastructure/architecture is described in detail in Appendix A. We note that while we present our fully deployed UO below, the fundamental components of the observational system are modular in the sense that individual modalities can be deployed in various combinations (and with various spectral or spatial resolutions) with associated variation in the required backend computational and data storage capacity as well as monetary cost. Furthermore, as we highlight in Section 3, different combinations of modalities enable different urban science drivers. While we envision that the UO will ultimately carry out observations across the full (available) electro-magnetic spectrum at multiple time scales, the current deployments—which yield the science content described in Section 3—consist of the following modalities.
2.1. Broadband Visible
The first deployed camera system was a three color (RGB), 8 Megapixel USB camera with a 35mm lens mounted atop a tall building in Brooklyn, NY with a panoramic view of the Manhattan skyline (Figure 1). The instrument was set to a fixed pointing, enclosed in a weatherized housing, and triggered to acquire images via a co-located laptop in a weatherized casing. The initial image capture rate was Hz [75]. Current deployments have incorporated a pan/tilt mechanism for increased field-of-view (FOV) via multiple pointings, mini-PCs for triggering and data transfer, and ethernet controlled instruments of two types: 20 Megapixel cameras (sampling at Hz) and DSLRs operating in video mode at a sampling frequency of Hz.
2.2. Broadband Infrared
Our current broadband infrared (IR) devices are FLIR A310/320 cameras with a pixel resolution of 320 × 240, wavelength range of 7.5–13 micron, and temperature sensitivity of ± 2 °C. As with our visible wavelength imaging, our initial IR deployment was encased in a weatherized housing, had a fixed pointing, and operated at Hz (Figure 1 shows an example image), while subsequent deployments incorporate a pan/tilt mechanism for increased FOV.
2.3. Visible and Near Infrared Hyperspectral
In addition to our broadband imaging devices, we have deployed hyperspectral imagers operating at visible and near-infrared (VNIR) wavelengths. These instruments are single-slit spectrographs: the aperture is a vertical slit while a diffraction grating behind the slit generates the wavelength information. They are mounted atop pan/tilt mechanisms that provide horizontal information as the detector is exposed at ≈30 frames per second during the pan. The wavelength range is 0.4–1.0 micron with an average bandwidth of 0.75 nm resulting in ∼850 spectral channels [76,79]. Scans are captured at cadences of ∼10−3 Hz. An example image and associated spectra are shown in Figure 1.
2.4. Long Wave Infrared Hyperspectral
In April of 2015, the UO carried out a test deployment of a Long Wave IR (LWIR) hyperspectral camera. This actively cooled instrument was sensitive to 7.5–13.5 micron in 128 spectral channels and was operated in survey mode at roughly Hz, using the same panning mechanism described for the VNIR camera above. The deployment was done in collaboration with the Aerospace Corporation from whom the UO rented the equipment for an 8-day observational campaign [80].
2.5. Data Fusion
In order to maximize the utility of our UO facility, it is important that we be able to integrate the massive imaging data sets that we generate with available geospatial data including publicly available data such as census data, building-level energy consumption, fuel types, external sensor data (e.g., air quality sensors or radar data), etc. Our data fusion utilizes publicly available LiDAR data from NYC [81] to locate the 3-space coordinate that is covered by each pixel. Specifically, using the collinearity equations, we project the topographic LiDAR point cloud into the 2D-image plane (given the position, pitch, yaw, roll, and focus of the camera) and, for each pixel, choose the closest LiDAR point. Since the LiDAR resolution is ∼1 foot, there are pixel lines-of-sight for which the nearest LiDAR point is behind the nearest surface in that direction, and so we make a “no overhang” approximation and assign a given pixel the same 3-space coordinate as the pixel above it if the pixel above it is found to be closer to the camera. Finally, we use the publicly available MapPLUTO (Primary Land Use Tax-lot Output) data that contains the geospatial footprints for each building to associate the x,y components of the 3-space coordinate of a pixel with a given building footprint. Thus, we are able to tag each pixel as “observing” a given building (see Figure 2). Additional geospatial data at coarser resolution (e.g., census tracts, utility distribution zones, etc.) can be associated as well.
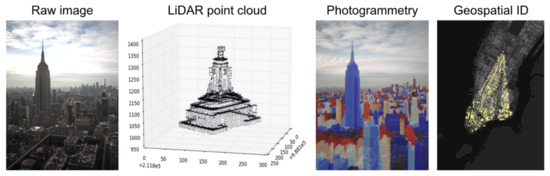
Figure 2.
Left: a broadband visible image from a UO deployment in midtown Manhattan. Center left: a LiDAR point cloud of the top of Empire State Building. Photogrammetric techniques allow us to use LiDAR to identify the buildings observed by each pixel (center right) given the building taxlot footprints from a publicly available data base (right). With these building IDs, we can integrate geospatial information with image data.
By identifying the individual buildings that are viewable in a given image, and by using topographic information related to the building shapes themselves, we are also able to estimate spatial coverage and the impacts of occlusion. For a large city like NYC, complete coverage is not possible with a single deployment (we currently have two deployment sites in NYC) and in fact our image segmentation methods also allow for the determination of “optimal” vantage points to assess future sites. Finally, it is important to point out that, for a given urban science domain question, the establishment of a statistical sample size is important to make inferences regarding aggregate patterns. Deriving a building ID and occlusion fraction for each pixel allows for a determination of whether a given scene contains sufficient information. For example, in [75] the robustness of patterns of lighting activity (see Section 3.3.1) were assessed by sequentially randomly sub-sampling the number of light sources in the scene to check for coherence of the associated temporal patterns. While not all scenes provide sufficient coverage for all lines of inquiry, in Section 3 below we demonstrate that a wide variety of domain-specific studies are possible from a single vantage point.
2.6. Privacy Protections and Ethical Considerations
At its core, the UO is a platform for automated analysis of living environments through images and the application of machine learning, computer vision, and computational statistics to extract dynamical, time-dependent measures of urban functioning. As such, it falls within a category of methods for which ethical considerations are essential to ensure that the platform is dedicated to improving quality of life, protection of natural resources, and prevention of data misuse [82,83].
Concerns related to both the reliability and scope of models and methodology specifically arise in the context of computer vision applications [83,84,85]. In particular, given the nature of our observational platform, it is of highest importance that the UO ensure appropriate privacy protections for inhabitants of cities [86]. This imperative is not unique to the UO nor is it restricted to imaging modalities; all observational platforms (whether acoustic sensors, air quality sensors, traffic sensors, etc.) must enact strict limits on the type and content of the data they collect—and the analysis procedures applied to that data—to ensure the privacy of individuals.
However, while the issue of personally identifiable information (PII) [87] collection is mitigated by the UO image resolution that by design does not contain sufficient information to identify individuals within the images as shown in Figure 3 (implying that the UO imaging is not subject to the ethical implications of collection of PII such as facial [88] or gait [89] features; see below), the urban science domain applications that we describe in Section 3 (see Table 1) constitute the study of living, dynamical patterns in cities. To mitigate the risks associated with the fusion of such data (see section Section 2.5) across multiple data sets [90,91], we enact strict additional privacy protecting policies beyond spatial resolution limitations. The UO’s privacy protection policies consist of four core components:
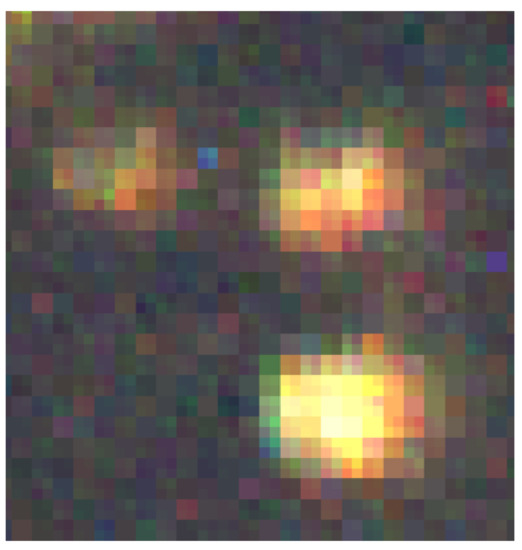
Figure 3.
A zoomed-in example of three of the closest sources in the upper right panel of Figure 1. The resolution of all UO imaging is sufficiently low that no interior information is visible or detectable.

Table 1.
The urban science domains accessible to UO operations for a each broadband (BB) and hyperspectral (HSI) modality including the required spatial and temporal resolution to extract the observables necessary to inform a given line of inquiry. While the fundamental capability to address these urban science domains has been demonstrated in Section 3, we also give the current status of full scale analyses in prior and future works.
- No personally identifiable information (PII) [87] is collected.
- All imaging is strictly limited in pixel resolution so that building interiors cannot be seen (see Figure 3).
- All analysis is aggregated and de-identified.
- An individual source cannot be tracked across multiple modalities to infer PII.
Furthermore, it is UO policy that data and analyses are not voluntarily shared with enforcement agencies (e.g., law enforcement, environmental regulatory enforcement, etc.).
Finally, while the UO data to date has not been made publicly available, we anticipate that future public release of imaging data from UO deployments will incorporate additional privacy protection measures including long temporal lags between data collection and data release, release of aggregate (rather than raw) extracted features, temporal and spatial downsampling, and application of differential privacy techniques to extracted patterns of activity [92,93].
3. Urban Science and Domains
The instrumentation and associated operational modes described in Section 2 enable a wide variety of domain science inquiries related to the dynamics of urban systems from sub-second to yearly time-scales. Below, we describe several core aspects of city functioning that we are exploring through the application of computer vision, image processing, machine learning, and astronomical analysis techniques to the UO data streams. These avenues of study can be largely grouped into three categories: Energy, Environment, and Human Factors. These represent topical areas that are closely associated with the fundamental components of urban systems. The science focus of the UO is to develop a deeper understanding of cities through observational determination of the dynamical interplay between these areas.
We note that, regardless of imaging modality (e.g., high frequency video or low frequency hyperspectral), the segmentation of each image into individual buildings by geolocating each pixel in the image as we have demonstrated in Section 2.5, is an essential first step in all of the topics described below. Furthermore, this “building ID” step allows us to fuse imaging data from the UO with publicly available records data which can enable lines of inquiry that are otherwise impossible.
3.1. Energy
Urban energy use—including electricity, natural gas, heating oil, etc.—drives city functioning and is at the heart of urban science questions related to resource consumption and distribution, infrastructure performance and maintenance, and future urban planning. Furthermore, it serves as the primary source of cities’ impacts on the environment [98]. The UO’s imaging capabilities with their multiple spatial and temporal scales allow for numerous unique ways of quantifying urban energy use characteristics from remote vantage points.
3.1.1. Remote Energy Monitoring
Remote assessment of energy use in cities by overhead observational platforms has a long history (e.g., [58,59,99]) including the use of lighting as a proxy for both electricity and total consumption [100,101,102]. Recently, there have been several studies using these overhead platforms to estimate the spatio-temporal dynamics of energy use (and the corresponding impacts on CO2 emissions [58,103,104]) on timescales of weeks and spatial scales ∼1 km [48,61,105] with, for example, nighttime stable light data derived from imaging by the Defense Meteorological Satellite Program’s Operational Linescan System (DMSP/OLS). Beyond satellites, drone-based platforms have also been deployed to push the temporal granularity down to hourly timescales for short deployments [106].
With the UO platform described above, lighting variability in cities can be observed via broadband visible imaging at significantly higher temporal and spatial resolution while incorporating persistent observations for longitudinal studies, complementing overhead platforms that are capable of broader spatial coverage. In particular, with observations at 0.1 Hz (10 s between images) and spatial resolutions ∼1 m, in [75] we showed that aggregated lighting variability in NYC displays a diurnal pattern of use (on/off behavior) that roughly repeats night-to-night. This variability encodes occupancy characteristics that serve as strong correlates to total energy consumption [107], and in work that it in progress, we find that using these imaging data as an input to a convolutional neural network (CNN) trained on ground truth consumption data results in a 10–15% improvement on network-level electricity consumption prediction models trained on temperature and humidity data alone. These remote proxies for energy consumption at granular spatial scales can provide important operational inputs in near-real time such as building-level outage detection at ∼minute timescales, and they can also serve as important supplements to records-based methods of assessment of energy use on granular spatial scales via up-sampling (down-scaling) of spatially coarse data [108,109].
3.1.2. Lighting Technologies and End-Use
Beyond total consumption, estimates derived from correlations with integrated nighttime luminosity, the determination of lighting technology that is in use in urban environments via the different luminosity signatures in multiple spectral channels is an active area of study [110,111,112]. Lighting technology identification has several important energy uses including identification of targets for energy efficient lighting upgrades by practitioners, empirical determination of end-use characteristics by consumers [113], and measuring rates of adoption of modern lighting technologies by developing cities [114].
The VNIR hyperspectral instrumentation described in Section 2.3 has sufficient spectral resolution and photometric sensitivity to identify characteristic emission features in nighttime lighting [115,116] at a distance of several kilometers. In [76,94] we showed that the VNIR HSI data obtained with the UO can be used to determine the lighting type of individual sources (with spatial resolution ∼1 m) via comparison to spectra measured in the lab and developed Template Activated Partition (TAP) clustering to identify lighting types that were not previously cataloged. An example of the technique applied to recently acquired imaging is shown in Figure 4. Subsequently, other targeted, single-night observations have similarly quantified the lighting profiles of urban environments using both multi-/hyperspectral data [117,118,119] as well as low [120,121] and high [122] frequency variability. By comparing the bulb type of individual sources over several years with persistent UO VNIR imaging, a longitudinal study demonstrating the effects of LED changeover is in progress.
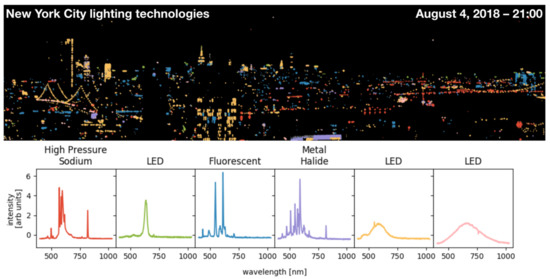
Figure 4.
A night time hyperspectral scan of the scene in Figure 1. The top panel shows each source in the scene color-coded by the lighting type determined from the spectra (bottom panel) of the light sources measured with a single scan from a hyperspectral camera.
3.1.3. Grid Stability and Phase
At frequencies of 60 Hz (in the US), the fluctuation of the AC mains voltage is reflected in a sinusoidal oscillation of flux in the lights connected to the mains for a subset of lighting technologies, e.g., incandescent, traditionally-ballasted halogen, fluorescent, etc. In [95], we showed that observing city lights at high temporal frequencies allows us to monitor the grid frequency at city scale. However, since persistent observations at frequencies of 100s of Hz is not feasible (e.g., due to data transfer and storage limitations), in [95] we used a liquid crystal shutter operating at ∼119.75 Hz to generate an ∼0.25 Hz beat frequency that is observable with cadences of ∼several Hz. As we described, this capability allows for monitoring of the stability of the grid across an urban distribution network, detection of relative phase of sources, and (with sufficiently accurate observations) potentially also transient phase shifts due to load at the unit level.
Further work by [96,122,123,124] showed that an alternative to the oscillating shutter technique for creating an observable beat frequency is the serendipitous use of a camera’s frame rate operating near a harmonic of the 60 Hz frequency. This type of grid monitoring via remote imaging is complimentary to more standard, modern approaches of large scale in situ phasor measurement unit (PMU) deployments [125,126], and planned future deployments of UO sites in developing cities will enable monitoring of the grid when such in situ devices are unavailable or deployment is unfeasible.
3.1.4. Building Thermography at Scale
Thermographic studies of building envelopes is an important diagnostic tool for assessment of individual building energy and thermal efficiency [127,128], materials [129], and potential defects [130], as well as larger thermal couplings between urban built structures that can lead to aggregate phenomena such as the urban heat island effect [131,132,133]. With the infrared imaging capabilities described in Section 2.2, we can combine the thermographic studies of individual building facades [127] with the coverage and persistence of the UO platform to generate unique quantifications of patterns of built infrastructure use in cities.
In Figure 5 we demonstrate the use of time-dependent broadband infrared imaging to study thermographic envelopes of large numbers of buildings in the city skyline. In particular, not only are efficiency characteristics such as heat leaks and thermal couplings detectable [134,135], but the figure also shows that individual HVAC vent duty cycles can be seen at a distance as well. In ongoing and future work we are applying signal processing techniques (e.g., changepoint detection and/or Hidden Markov Models) on these infrared “sources” to extract on and off transitions much like we have done in the broadband visible imaging case [75]. As with the broadband visible wavelength imaging, this type of source variability can serve as an input to energy consumption models trained on consumption data. In addition, Building Management System operations and heating/cooling efficiency can be measured at scale across thousands of buildings from a single IR sensor.
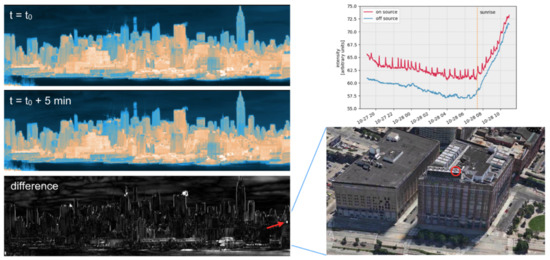
Figure 5.
Left: two IR images separated by 5 min and the difference between the two. The difference image shows both steam plumes as well as HVAC vents (lower right) that heat up and cool down with building energy use. Top right: the time-dependent signature of a similar source (in red) compared to the building facade (in blue) over one night shows the cadence of the building’s heating/cooling system.
3.2. Environment
Energy use in cities (and urban metabolism more broadly) generates byproducts of that use that have significant environmental impact. These impacts have local effects (e.g., degraded air quality leading to breathing-related health outcomes [136,137,138,139,140]), regional effects (e.g., fine-particle air pollution of regions surrounding cities [141]), and—due to the physical and population size of large cities—global effects (e.g., greenhouse emissions and reduced biodiversity [142,143]). The UO instrumentation extends traditional remote sensing of environment by satellites to increased spatial and temporal resolution (albeit with decreased geospatial coverage) to allow for the study of dynamical detection of environmental impacts of cities on sub-minute timescales.
3.2.1. Soot Plumes and Steam Venting
As buildings in urban environments burn oil for heat, they produce soot plumes that are dispersed through the ambient air as they are advected away from the source by local winds [144]. Such plumes are responsible for ∼75% of greenhouse gas production in NYC [145] and can potentially have significant impacts on regional and global climate [146,147]. While, to date, most remote sensing studies focus on the aggregate effects of many plumes, Figure 6 shows an example of the use of UO visible wavelength observations at cadences of 0.1 Hz to directly detect individual plumes produced by buildings. In the raw imaging, the dark, very low surface brightness of the plume makes it extremely difficult to detect directly from these raw data. However, foreground/background separation techniques [148,149] reveal the plume clearly towards the center of the image. In subsequent images, the plume is blown to the right as it disperses. In addition to soot plumes, the venting of steam from building heating and cooling systems is also visible.
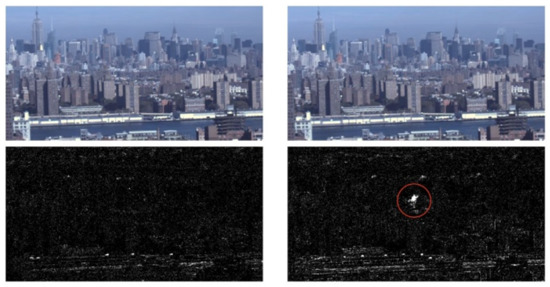
Figure 6.
Top panels: Two broadband visible daytime images separated by one minute. Bottom panels: the same two images, but with the time-independent background removed. The application of foreground/background separation techniques clearly reveals a soot plume (circled in red) that has been ejected from one of the buildings in the scene.
The tracking of plumes has significant potential for not only monitoring the total number of plumes produced and the resulting effects on local air quality, but their motion can also be used as tracers of urban winds, informing studies of air flows through complex urban terrains (including simulations of such effects; e.g., [150]). The plume in Figure 6 is a particularly striking example, however most plumes are quite difficult to detect through classical computer vision techniques due to the complex urban background, time-dependent shadowing, low source brightness, and the amorphous nature of the plumes. We have recently found that applications of regional convolutional neural networks (R-CNNs) [151,152,153] can be tuned to detect such plumes [97] and we have developed end-to-end tracking systems for application to these types of data [154]. By fusing the imaging data with data on fuel types for each building through the image segmentation methods described in Section 2.5, future work will focus on deriving the patterns of soot plume production on time scales of minutes and spatial scales of 10s of meters.
3.2.2. Remote Speciation of Pollution Plumes
Although fuel type for a given building provides an estimate for the chemical contents of a given plume, broadband visible wavelength observations do not provide direct speciation of plume contents. However, a variety of molecular compounds have strong absorption and emission features in the 7.5–13.5 micron range of the LWIR instrument described in Section 2.4. Over the course of a ∼10 day observational campaign, we showed in [80] that numerous molecular compounds, including Ammonia, Methane, Acetone, Freon-22, CO2, etc., could be identified in plumes emitted from buildings along the NYC skyline.
In Figure 7, we show a simple detection of an Ammonia plume using a Principle Component Analysis (PCA) decomposition of a single data cube produced by the LWIR instrument. The various PCA components capture blackbody radiation, atmospheric (including water vapor) effects, and instrumental artifacts. The PCA model for each pixel, when subtracted from the raw data reveals a spatially localized deficit (i.e., a plume) in the 10.35 micron residual that is due to the absorption line of Ammonia at that wavelength. This application of image and signal processing techniques to data from UO deployed LWIR instrumentation has significant applications [155] for both environmental studies of cities as well as emergency management and tracking of toxic materials release.
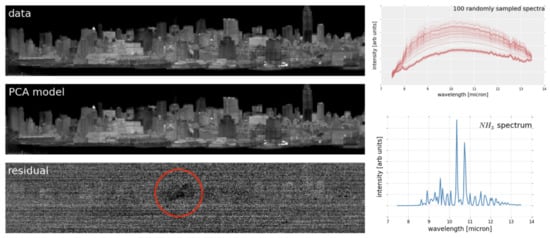
Figure 7.
Left: A Principle Component Analysis (PCA) model fit to a Long Wave Infrared hyperspectral image. The PCA model (middle) was reconstructed from the first 10 principle spectral components of spectra in the scene (top right) and the model at 10.3 micron was subtracted from the raw data (top) to produce the 10.3 micron residual in the bottom left panel. The result is a clear, extended Ammonia plume, which has a 10.3 micron absorption feature as shown in the lower right.
3.2.3. Urban Vegetative Health
Remote monitoring of the health of vegetation by overhead platforms has had a strong focus on the use of multi- and hyperspectral observations to determine reflectance spectra of plants [156,157,158], features of which relate to their chlorophyll content and photosynthetic properties. In particular, combinations and ratios of reflectance values at certain wavelengths can provide strong indicators of the health of vegetation with the “red edge” [156] location at ∼700 nm, the associated Normalized Difference Vegetation Index (NDVI) [159,160], and the Photochemical Reflectance Index (PRI, the normalized difference between 570 and 530 nm) [161,162] being among the most common indicators of photosynthetic efficiency and vegetative health.
Vegetation in urban environments is under unique stress given the density of built structures and the complexities associated with maintenance of urban forestry. In Figure 8, we show that the UO’s daytime VNIR observations have sufficient sensitivity to directly measure chlorophyll features in the reflectance spectra of urban vegetation [163] including the red edge, NDVI, and PRI. Moreover, because of the extremely high spectral resolution and sensitivity, as well as the persistent nature of the UO’s observational strategy, new metrics on vegetative health can be developed, low signal-to-noise effects such as solar-induced fluorescence [164] can be measured, and short timescale response to local air quality (e.g., particular matter or ozone [165,166,167]) can be determined to high precision by fusing (see Section 2.5) data from in situ air quality sensors with UO imagery. This has the potential to not only inform urban science studies of the impact of human use of built structures on the natural environment (see Section 4 below), but can provide operational capacity by generating advanced warning indicators of low-level plant stress [165,168].
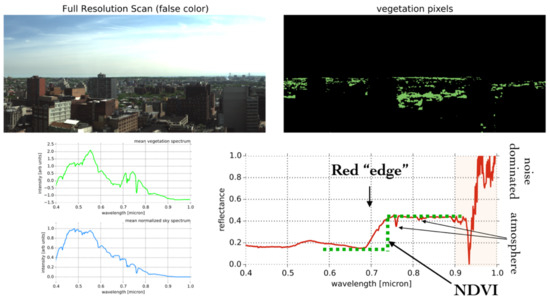
Figure 8.
Top left: a false color representation of a VNIR scan of Brooklyn, NY during the daytime. Top right: the vegetation pixels in the scene identified by clustering-based image segmentation. Bottom left: the mean vegetation spectrum and mean sky spectrum in the scene. Bottom right: the ratio of those two yielding plant reflectance as a function of wavelength. The Normalized Difference Vegetation Index (and other vegetative health indices) is easily determined given the spectral resolution and sensitivity of our VNIR instrument.
3.2.4. Ecological Impacts of Light Pollution
It is well known that city lighting has detrimental impacts on local ecologies including migratory avian behavior [169] as analysis of regional radar data indicates that birds in transit are drawn to the glow of city lights. These effects are both regional [170] and highly local (i.e., individual light installations [171]), with both short timescale and longer seasonal effects [172,173]. Recent work by [174] expanded light exposure estimates for migrating birds in flight to continental spatial scales and with longitudinal baselines of ∼20 years. To date, analyses have focused on aggregated lighting from a given city as a whole (e.g., appropriate for birds flying at high altitudes [175]) or on very bright, point sources of light beamed towards the sky [171], that may trap birds during stopover events [176].
Imaging by the UO has the potential to bridge the gap between these spatial scales, providing sufficient spatial, temporal, and spectral resolution to quantify correlations at neighborhood (∼1 km-sq) scale in cities. In collaboration with the New York City Audubon bird conservancy, we have deployed visible wavelength cameras acquiring images at 0.1 Hz to detect time-dependent lighting in lower Manhattan. In work in progress, we are combining this data with regional NEXRAD radar scans [177] to measure the ecological impacts from urban lighting on migratory bird densities at scales of ∼100s of meters and at time scales of minutes.
3.3. Human Factors
Urban functioning is fundamentally driven by human decision making. Infrastructure use, transportation choices and their management, economic transactions, etc., all have, at their core, a human element that drives observable patterns of activity. This micro-behavior aggregates to macro-scale patterns of life with diurnal, weekly, monthly, and annual rhythms that can be detected by deployed sensing platforms like the UO.
3.3.1. Patterns of Lighting Activity and Circadian Phase
In [75], we showed that aggregate lighting activity in NYC displays clear diurnal patterns that repeat day after day and week after week. These patterns (on/off transitions of individual light sources) differ for residential versus commercial buildings and—as noted above—can serve as proxies for occupancy characteristics of buildings. In addition, these patterns for residential buildings correlate with the circadian behavior of the population as shown in Figure 9 [178]. Given that exposure to artificial lighting (and in particular blue wavelength light) during evening hours can result in melatonin suppression and circadian phase delay [179,180], UO HSI observations at high spectral resolution, combined with aggregate usage duration from our broadband visible wavelength imaging, can bring the techniques of proximal remote sensing to bear on the study of impacts of nocturnal light exposure on human circadian phase by enabling an empirical measurement of variations of these patterns with ambient lighting intensity to quantify the effects of light pollution on public health [73,181,182].
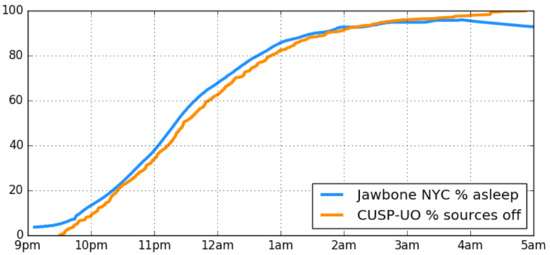
Figure 9.
An overlay of the percentage of sources “off” after 9:30 pm on a single Monday night (from UO broadband visible nighttime imaging of the scene in Figure 1) with the fraction of JawboneTM users asleep in NYC on Monday 31st March 2014. There is a clear correspondence between our observations of lighting variability and the aggregate circadian patterns of NYC.
Interestingly, in [75] we also showed that, while the aggregate patterns of light usage in cities were strictly repeating—albeit with different behavior on weekends versus weekdays—a given source does not strictly repeat from one day to the next (nor from one day to one week later). This type of UO data directly address the micro/macro behavioral properties of the population [183,184] and the scale of the transition between the two.
3.3.2. Technology Adoption and Rebound
Technological choice, and in particular the correlation of choice with socio-economic and demographic characteristics of the population, is an important indicator of population dynamics. In the energy sector, choice is an end-use characteristic studied most commonly by surveys of users [185], however there have been recent works focused specifically on using techniques from remote sensing to estimate lighting (and in particular LED) choice [186].
By combining the lighting patterns described in Section 3.3.1 with the lighting technology identification described in Section 3.1.2 over time, our UO platform is ideally suited to not only quantify choice as a function of population characteristics via fusion (as described in Section 2.5) of imaging data with census data, but also allows for a direct, empirical measurement of the amplitude of the rebound effect [185,187] in which the benefits of energy efficiency are offset by increased use stemming from a decreased economic incentive of curtailing use.
4. Discussion
In the previous sections we have outlined the hardware and operational characteristics of a multi-modal UO and demonstrated its potential to inform a range of urban science domains. While there are of course disadvantages of the ground-based platform including reduced spatial coverage relative to satellites for a single deployment and complexity of the scene understanding required to extract relevant image features, the flexibility of the system provides two key benefits relative to other modern observational platforms.
- Temporal granularity: the cadence provided by the UO is not currently possible (or practical) for any spaceborne or airborne platform. However the timescales accessible to the UO align with patterns of life that present in other urban data sets (energy consumption, circadian rhythms, heating/cooling, technological choice, vegetative health, aviation migration, etc.) enabling the fusion of these data to inform the time-dependent dynamical properties of urban systems.
- Oblique observational angles: even low-lying cities have a significant vertical component and purely downward-facing platforms are not able to capture these features. This is particularly important for several of the indicators of lived experience described in Section 3 such as light pollution, the effects of which (e.g., circadian rhythm disruption, sky glow, and impacts on migratory species) are due to light emitted “out” or “down” as opposed to “up”, or the variation in heating and cooling properties of multi-floor buildings as a function of height in the building.
This combination of spatiotemporal granularity with a side-facing viewing angle allows for unique quantifications of urban dynamics that are not accessible via other methods.
We have also described how these dynamics relate to urban science domains and lines of inquiry and highlighted numerous use cases that can inform the fundamental science of cities as well as the practical operation of urban environments. All of the urban science domain studies presented in Section 3 are associated with the three fundamental components of urban systems: the human, built, and natural environments. In fact, one of the conceptual drivers behind the initial creation of the UO in NYC was the link between these three components and how observable temporal patterns generated by one component result in observable temporal patterns in another component. This is closely connected to the field of socio-environmental systems including the concept of “urban metabolism” within the fields of Urban Ecology, Industrial Ecology, and Urban Political Ecology [74]. Within Urban Ecology in particular, urban metabolism represents the interactions between subsystems in urban environments [188] that link the three fundamental components of cities [189,190,191], and it is precisely these interactions (on multiple temporal and spatial scales) that lead to dynamical variability in UO imaging data.
In fact, by way of example, we can quantitatively tie together three of the urban science cases in Section 3 within that framework to demonstrate the holistic methodology enabled by UO observations. Human activity and decision making in buildings leads to energy use through heating and cooling, the cadence of which can be identified via change-point detection methods or other state-based time series analysis approaches applied to UO observations in the IR (Section 3.1.4). That energy produces byproducts in the form of a pattern of recurring pollution plumes (Section 3.2.1) that can be observed and tracked via neural networks or other object detection techniques from computer vision applied to UO broadband visible observations or extracted from spectra in our HSI observations. The natural environment effects of those pollution plumes on vegetation, for example, can then be assessed by remotely monitoring vegetative health via HSI scans (Section 3.2.3). In each of these observational cases there are patterns at minute, hourly, diurnal, weekly, seasonal, and annual time scales and deriving the relationship (relative phase, temporal lag, transfer functions, etc.) between those patterns in each case will inform studies of the interactions in urban socio-environmental systems and will be the subject of future work. While there is still significant understanding in each of the urban science domains that is required to fully explore the dynamical evolution of each subsystem, the novel UO methodology presented here represents an observational platform for tying together the individual threads of the science of cities.
5. Conclusions
Modern cities are systems with tremendous complexity, and the functioning and behavioral properties of those systems have significant implications for their current and future environmental impacts as well as the quality of life of the inhabitants. It is through a detailed analysis of the three fundamental components of urban systems (the human, built, and natural environments) that one can uncover the temporal dynamics that govern urban behavior. Measuring those dynamical interactions of urban systems requires high spatial and temporal resolution, with sufficient coverage to generate a representative sample of that system as a whole. We have presented an observational platform for the collection of data that can provide inputs to machine learning, computer vision, image processing, and astronomical analysis techniques that extract information relevant to the functioning of cities. Our first realization of that platform in New York City is the creation of the Urban Observatory facility, consisting of imaging systems (both broadband and hyperspectral) sensitive to visible and infrared wavelengths, with an operational mode that is persistent, synoptic, and granular. The urban science and domain topics that this data can address are broad ranging from energy use and its environmental impacts to patterns of life and public health. As the technology develops, deployment of similar Urban Observatories to cities of various sizes, local environments, and localities will enable a comprehensive and rich comparative study of diverse cities, deepening our core understanding of complex urban systems.
Author Contributions
Conceptualization, G.D., F.B.B., M.G., J.W. and S.E.K.; methodology, G.D., F.B.B., M.G., J.W. and S.E.K.; software, G.D., F.B.B., M.S.S. and J.B.; validation, G.D., F.B.B., A.K. and M.G.; formal analysis, G.D., F.B.B., J.B., M.G., J.W. and S.E.K.; investigation, all authors; resources, G.D., F.B.B., M.G. and S.E.K.; data curation, G.D., F.B.B., M.S.S. and A.K.; writing—original draft preparation, G.D.; writing—review and editing, all authors; visualization, G.D.; supervision, G.D., F.B.B., M.G. and S.E.K.; project administration, G.D., F.B.B., M.G. and S.E.K.; funding acquisition, G.D., F.B.B. and S.E.K. All authors have read and agreed to the published version of the manuscript.
Funding
GD’s and MSS’s work has been supported by a Complex Systems Scholar Award from the James S. McDonnell Foundation (JSMF; number:220020434). FBB, GD, JB, and MSS have been partially supported by Department of Energy (DOE) ARPA-E IDEAS grant (award number: DE-AR0000886). Imaging deployments have been supported by the JSMF, DOE ARPA-E, and the Leon Levy Foundation.
Data Availability Statement
Data sharing not applicable.
Acknowledgments
We thank the New York City Audubon for their partnership and collaboration and Ryan Holifield, Woonsup Choi, Arijit Sen, Dawn Erb, and David Kaplan for conceptual conversations surrounding the Urban Observatory’s ability to measure urban metabolism.
Conflicts of Interest
The authors declare no conflict of interest.
Appendix A. Backend Infrastructure
The deployed instruments and their associated operational modes described in Section 2 require a flexible and robust backend computing infrastructure to collect, store, and analyze the large volume of data generated by the UO. This infrastructure consists of both hardware and software components that, taken together, operate continuously to yield persistent observations. Our backend infrastructure consists of the following core components with associated functionality (a full end-to-end illustration of the UO’s operational methodology is shown in Figure A1).

Figure A1.
An end-to-end illustration of the Urban Observatory’s operational methodology. Remotely deployed instrumentation collects raw imaging data from visible to infrared wavelengths in both broadband and hypserspectral modalities that are transferred and permanently stored in an imaging database. The images are processed through an image processing pipeline that extracts source features (brightness in the visible or infrared, spectrum, chemical species, lighting type, etc.) that are themselves stored in a parallel source database. The images, source characteristics, and external data (building characteristics, aggregate socio-economic and demographic characteristics, in situ sensor data, etc.) are fused via geospatial projection of each pixel (see Section 2.5) and a variety of machine learning and computational statistical methods are applied to inform the variety of urban science domain studies described in Section 3 and summarized in Table 1.
- Camera control devices—Each imaging device is equipped with a mini-computer that opens a direct link with the camera itself. This machine is tasked with communicating directly with the camera, lens, and other peripherals and issuing image acquisition commands. In certain instances, this computer can also be used to perform edge computations including compression or sub-sampling of the data. Acquired data may be saved temporarily on disk on this machine for buffered transfer over an encrypted session back through the gateway server, or be written directly to bulk data storage.
- Gateway server—The main communications hub between our computing platform and the deployed instrumentation is a gateway server that works on a pub sub model, issuing scheduled commands to the edge mini computers. This hub is also responsible for the pull (from the deployment) and push (to the bulk data storage) functionality for the data acquisition as well as the firewalled gateway for remote connections of UO users to interact with the databases in our computing platform.
- Bulk data storage—At full operational capacity, a UO site (consisting of a broadband visible camera operating at 0.1 Hz, broadband infrared camera operating at 0.1 Hz, a DSLR operating in video mode, and a VNIR hyperspectral camera operating at 10−3 Hz) acquires roughly 2–3 TB per day. This data rate necessitates not only careful data buffering and transfer protocols to minimize packet loss from the remote devices, but also a large bulk data storage with an appropriate catalog for the imaging data. This ∼PB-scale storage server is connected to our computing servers using NFS (Network File System) protocols for computational speed. This storage server also hosts parallel source catalogs that store information extracted from the data.
- Computing server—Our main computing cluster that is used to process UO data consists of a dedicated >100 core machine that is primarily tasked with processing pipelines including: registration, image correction, source extraction, etc. We have designed our own custom platform as a service interface that seamlessly allows UO users to interact with the data while background data processing and cataloging tasks operate continuously.
- GPU mini-cluster—Several of the data processing tasks described in Section 3 require the building and training of machine learning models with large numbers of parameters including convolutional neural networks. For these tasks, we use a GPU mini-cluster that is directly connected to our main computing server and which is continuously fed streaming input data from which objects and object features are extracted.
References
- United Nations. 2018 Revision of World Urbanization Prospects; United Nations: Rome, Italy, 2018. [Google Scholar]
- Batty, M. Cities and Complexity: Understanding Cities with Cellular Automata, Agent-Based Models, and Fractals; MIT Press: Cambridge, MA, USA, 2007. [Google Scholar]
- Batty, M. The size, scale, and shape of cities. Science 2008, 319, 769–771. [Google Scholar] [CrossRef]
- White, R.; Engelen, G.; Uljee, I. Modeling Cities and Regions as Complex Systems: From Theory to Planning Applications; MIT Press: Cambridge, MA, USA, 2015. [Google Scholar]
- Bai, X.; McAllister, R.R.; Beaty, R.M.; Taylor, B. Urban policy and governance in a global environment: Complex systems, scale mismatches and public participation. Curr. Opin. Environ. Sustain. 2010, 2, 129–135. [Google Scholar] [CrossRef]
- Wilson, A.G. Complex Spatial Systems: The Modelling Foundations of Urban and Regional Analysis; Routledge: London, UK, 2014. [Google Scholar]
- Chang, S.E.; McDaniels, T.; Fox, J.; Dhariwal, R.; Longstaff, H. Toward disaster-resilient cities: Characterizing resilience of infrastructure systems with expert judgments. Risk Anal. 2014, 34, 416–434. [Google Scholar] [CrossRef]
- Moffatt, S.; Kohler, N. Conceptualizing the built environment as a social–ecological system. Build. Res. Inf. 2008, 36, 248–268. [Google Scholar] [CrossRef]
- Jifeng, W.; Huapu, L.; Hu, P. System dynamics model of urban transportation system and its application. J. Trans. Syst. Eng. Inf. Technol. 2008, 8, 83–89. [Google Scholar]
- Aleta, A.; Meloni, S.; Moreno, Y. A multilayer perspective for the analysis of urban transportation systems. Sci. Rep. 2017, 7, 44359. [Google Scholar] [CrossRef]
- Batty, M. Cities as Complex Systems: Scaling, Interaction, Networks, Dynamics and Urban Morphologies; UCL Centre for Advanced Spatial Analysis: London, UK, 2009. [Google Scholar]
- Albeverio, S.; Andrey, D.; Giordano, P.; Vancheri, A. The Dynamics of Complex Urban Systems: An Interdisciplinary Approach; Springer: New York, NY, USA, 2007. [Google Scholar]
- Diener, E.; Suh, E. Measuring quality of life: Economic, social, and subjective indicators. Soc. Indic. Res. 1997, 40, 189–216. [Google Scholar] [CrossRef]
- Shapiro, J.M. Smart cities: Quality of life, productivity, and the growth effects of human capital. Rev. Econ. Stat. 2006, 88, 324–335. [Google Scholar] [CrossRef]
- Węziak-Białowolska, D. Quality of life in cities—Empirical evidence in comparative European perspective. Cities 2016, 58, 87–96. [Google Scholar] [CrossRef]
- Frank, L.D.; Engelke, P.O. The built environment and human activity patterns: Exploring the impacts of urban form on public health. J. Plan. Lit. 2001, 16, 202–218. [Google Scholar] [CrossRef]
- Frumkin, H.; Frank, L.; Jackson, R.J. Urban Sprawl and Public Health: Designing, Planning, and Building for Healthy Communities; Island Press: Washington, DC, USA, 2004. [Google Scholar]
- Godschalk, D.R. Urban hazard mitigation: Creating resilient cities. Nat. Hazard. Rev. 2003, 4, 136–143. [Google Scholar] [CrossRef]
- Fiksel, J. Sustainability and resilience: Toward a systems approach. Sustain. Sci. Pract. Policy 2006, 2, 14–21. [Google Scholar] [CrossRef]
- Collier, M.J.; Nedović-Budić, Z.; Aerts, J.; Connop, S.; Foley, D.; Foley, K.; Newport, D.; McQuaid, S.; Slaev, A.; Verburg, P. Transitioning to resilience and sustainability in urban communities. Cities 2013, 32, S21–S28. [Google Scholar] [CrossRef]
- Townsend, A.M. Smart Cities: Big Data, Civic Hackers, and the Quest for a New Utopia; WW Norton & Company: New York, NY, USA, 2013. [Google Scholar]
- Kitchin, R. The Data Revolution: Big Data, Open Data, Data Infrastructures and their Consequences; Sage: Thousand Oaks, CA, USA, 2014. [Google Scholar]
- Batty, M. Big data, smart cities and city planning. Dial. Hum. Geogr. 2013, 3, 274–279. [Google Scholar] [CrossRef] [PubMed]
- Batty, M. The New Science of Cities; MIT Press: Cambridge, MA, USA, 2013. [Google Scholar]
- Townsend, A. Cities of data: Examining the new urban science. Public Cult. 2015, 27, 201–212. [Google Scholar] [CrossRef]
- Kitchin, R. The ethics of smart cities and urban science. Philos. Trans. R. Soc. A 2016, 374, 20160115. [Google Scholar] [CrossRef]
- Acuto, M.; Parnell, S.; Seto, K.C. Building a global urban science. Nat. Sustain. 2018, 1, 2–4. [Google Scholar] [CrossRef]
- Batty, M. Fifty years of urban modeling: Macro-statics to micro-dynamics. In The Dynamics of Complex Urban Systems; Springer: Berlin/Heidelberg, Germany, 2008; pp. 1–20. [Google Scholar]
- Bettencourt, L.M. Cities as complex systems. Modeling Complex Systems for Public Policies; IPEA: Brasilia, Brasil, 2015; pp. 217–236. [Google Scholar]
- Faghih-Imani, A.; Hampshire, R.; Marla, L.; Eluru, N. An empirical analysis of bike sharing usage and rebalancing: Evidence from Barcelona and Seville. Transp. Res. Part A Policy Pract. 2017, 97, 177–191. [Google Scholar] [CrossRef]
- Dobler, G.; Vani, J.; Dam, T.T.L. Patterns of Urban Foot Traffic Dynamics. arXiv 2019, arXiv:1910.02380. [Google Scholar]
- Berghauser Pont, M.; Stavroulaki, G.; Marcus, L. Development of urban types based on network centrality, built density and their impact on pedestrian movement. Environ. Plan. B 2019, 46, 1549–1564. [Google Scholar] [CrossRef]
- Huebner, G.; Shipworth, D.; Hamilton, I.; Chalabi, Z.; Oreszczyn, T. Understanding electricity consumption: A comparative contribution of building factors, socio-demographics, appliances, behaviours and attitudes. Appl. Energy 2016, 177, 692–702. [Google Scholar] [CrossRef]
- Rasul, A.; Balzter, H.; Smith, C. Diurnal and seasonal variation of surface urban cool and heat islands in the semi-arid city of Erbil, Iraq. Climate 2016, 4, 42. [Google Scholar] [CrossRef]
- Sun, R.; Lü, Y.; Yang, X.; Chen, L. Understanding the variability of urban heat islands from local background climate and urbanization. J. Clean. Prod. 2019, 208, 743–752. [Google Scholar] [CrossRef]
- Chen, W.; Tang, H.; Zhao, H. Diurnal, weekly and monthly spatial variations of air pollutants and air quality of Beijing. Atmos. Environ. 2015, 119, 21–34. [Google Scholar] [CrossRef]
- Masiol, M.; Squizzato, S.; Formenton, G.; Harrison, R.M.; Agostinelli, C. Air quality across a European hotspot: Spatial gradients, seasonality, diurnal cycles and trends in the Veneto region, NE Italy. Sci. Total Environ. 2017, 576, 210–224. [Google Scholar] [CrossRef]
- Cheng, Z.; Caverlee, J.; Lee, K.; Sui, D. Exploring millions of footprints in location sharing services. In Proceedings of the International AAAI Conference on Web and Social Media, Barcelona, Spain, 17–21 July 2011; Volume 5. [Google Scholar]
- Noulas, A.; Scellato, S.; Lambiotte, R.; Pontil, M.; Mascolo, C. A tale of many cities: Universal patterns in human urban mobility. PLoS ONE 2012, 7, e37027. [Google Scholar] [CrossRef]
- Hasan, S.; Schneider, C.M.; Ukkusuri, S.V.; González, M.C. Spatiotemporal patterns of urban human mobility. J. Stat. Phys. 2013, 151, 304–318. [Google Scholar] [CrossRef]
- Alessandretti, L.; Sapiezynski, P.; Lehmann, S.; Baronchelli, A. Multi-scale spatio-temporal analysis of human mobility. PLoS ONE 2017, 12, e0171686. [Google Scholar] [CrossRef]
- Henderson, M.; Yeh, E.T.; Gong, P.; Elvidge, C.; Baugh, K. Validation of urban boundaries derived from global night-time satellite imagery. Int. J. Remote Sens. 2003, 24, 595–609. [Google Scholar] [CrossRef]
- Small, C.; Pozzi, F.; Elvidge, C.D. Spatial analysis of global urban extent from DMSP-OLS night lights. Remote Sens. Environ. 2005, 96, 277–291. [Google Scholar] [CrossRef]
- Li, X.; Zhou, Y. Urban mapping using DMSP/OLS stable night-time light: a review. Int. J. Remote Sens. 2017, 38, 6030–6046. [Google Scholar] [CrossRef]
- Mydlarz, C.; Salamon, J.; Bello, J.P. The implementation of low-cost urban acoustic monitoring devices. Appl. Acoust. 2017, 117, 207–218. [Google Scholar] [CrossRef]
- Bello, J.P.; Silva, C.; Nov, O.; Dubois, R.L.; Arora, A.; Salamon, J.; Mydlarz, C.; Doraiswamy, H. Sonyc: A system for monitoring, analyzing, and mitigating urban noise pollution. Commun. ACM 2019, 62, 68–77. [Google Scholar] [CrossRef]
- Li, C.; Chiang, A.; Dobler, G.; Wang, Y.; Xie, K.; Ozbay, K.; Ghandehari, M.; Zhou, J.; Wang, D. Robust vehicle tracking for urban traffic videos at intersections. In Proceedings of the 13th IEEE International Conference on Advanced Video and Signal Based Surveillance (AVSS), Colorado Springs, CO, USA, 23–26 August 2016; pp. 207–213. [Google Scholar]
- Xie, Y.; Weng, Q. Detecting urban-scale dynamics of electricity consumption at Chinese cities using time-series DMSP-OLS (Defense Meteorological Satellite Program-Operational Linescan System) nighttime light imageries. Energy 2016, 100, 177–189. [Google Scholar] [CrossRef]
- Urban, R. Extraction and modeling of urban attributes using remote sensing technology. In People and Pixels: Linking Remote Sensing and Social Science; National Academies Press: Washington, DC, USA, 1998; p. 164. [Google Scholar]
- Jensen, J.R.; Cowen, D.C. Remote sensing of urban/suburban infrastructure and socio-economic attributes. Photogramm. Eng. Remote Sens. 1999, 65, 611–622. [Google Scholar]
- Chen, X.L.; Zhao, H.M.; Li, P.X.; Yin, Z.Y. Remote sensing image-based analysis of the relationship between urban heat island and land use/cover changes. Remote Sens. Environ. 2006, 104, 133–146. [Google Scholar] [CrossRef]
- Benediktsson, J.A.; Pesaresi, M.; Amason, K. Classification and feature extraction for remote sensing images from urban areas based on morphological transformations. IEEE Trans. Geosci. Remote Sens. 2003, 41, 1940–1949. [Google Scholar] [CrossRef]
- Weng, Q.; Quattrochi, D.; Gamba, P.E. Urban Remote Sensing; CRC Press: Boca Raton, FL, USA, 2018. [Google Scholar]
- Pohl, C.; Van Genderen, J.L. Review article multisensor image fusion in remote sensing: Concepts, methods and applications. Int. J. Remote Sens. 1998, 19, 823–854. [Google Scholar] [CrossRef]
- Maktav, D.; Erbek, F.; Jürgens, C. Remote sensing of urban areas. Int. J. Remote Sens. 2005, 26, 655–659. [Google Scholar] [CrossRef]
- Anderson, J.R. A Land use Furthermore, Land Cover Classification System for use with Remote Sensor Data; US Government Printing Office: Washington, DC, USA, 1976; Volume 964.
- Welch, R. Monitoring urban population and energy utilization patterns from satellite data. Remote Sens. Environ. 1980, 9, 1–9. [Google Scholar] [CrossRef]
- Elvidge, C.D.; Baugh, K.E.; Kihn, E.A.; Kroehl, H.W.; Davis, E.R.; Davis, C.W. Relation between satellite observed visible-near infrared emissions, population, economic activity and electric power consumption. Int. J. Remote Sens. 1997, 18, 1373–1379. [Google Scholar] [CrossRef]
- Amaral, S.; Câmara, G.; Monteiro, A.M.V.; Quintanilha, J.A.; Elvidge, C.D. Estimating population and energy consumption in Brazilian Amazonia using DMSP night-time satellite data. Comput. Environ. Urban Syst. 2005, 29, 179–195. [Google Scholar] [CrossRef]
- Chand, T.K.; Badarinath, K.; Elvidge, C.; Tuttle, B. Spatial characterization of electrical power consumption patterns over India using temporal DMSP-OLS night-time satellite data. Int. J. Remote Sens. 2009, 30, 647–661. [Google Scholar] [CrossRef]
- Shi, K.; Chen, Y.; Yu, B.; Xu, T.; Yang, C.; Li, L.; Huang, C.; Chen, Z.; Liu, R.; Wu, J. Detecting spatiotemporal dynamics of global electric power consumption using DMSP-OLS nighttime stable light data. Appl. Energy 2016, 184, 450–463. [Google Scholar] [CrossRef]
- Longcore, T.; Rich, C. Ecological light pollution. Front. Ecol. Environ. 2004, 2, 191–198. [Google Scholar] [CrossRef]
- Bennie, J.; Davies, T.W.; Duffy, J.P.; Inger, R.; Gaston, K.J. Contrasting trends in light pollution across Europe based on satellite observed night time lights. Sci. Rep. 2014, 4, 1–6. [Google Scholar] [CrossRef] [PubMed]
- Falchi, F.; Cinzano, P.; Duriscoe, D.; Kyba, C.C.; Elvidge, C.D.; Baugh, K.; Portnov, B.A.; Rybnikova, N.A.; Furgoni, R. The new world atlas of artificial night sky brightness. Sci. Adv. 2016, 2, e1600377. [Google Scholar] [CrossRef]
- Hall, G.B.; Malcolm, N.W.; Piwowar, J.M. Integration of remote sensing and GIS to detect pockets of urban poverty: The case of Rosario, Argentina. Trans. GIS 2001, 5, 235–253. [Google Scholar] [CrossRef]
- Elvidge, C.D.; Sutton, P.C.; Ghosh, T.; Tuttle, B.T.; Baugh, K.E.; Bhaduri, B.; Bright, E. A global poverty map derived from satellite data. Comput. Geosci. 2009, 35, 1652–1660. [Google Scholar] [CrossRef]
- Xie, M.; Jean, N.; Burke, M.; Lobell, D.; Ermon, S. Transfer learning from deep features for remote sensing and poverty mapping. In Proceedings of the Thirtieth AAAI Conference on Artificial Intelligence, Phoenix, AZ, USA, 12–17 February 2016. [Google Scholar]
- Masek, J.; Lindsay, F.; Goward, S. Dynamics of urban growth in the Washington DC metropolitan area, 1973–1996, from Landsat observations. Int. J. Remote Sens. 2000, 21, 3473–3486. [Google Scholar] [CrossRef]
- Weng, Q. Land use change analysis in the Zhujiang Delta of China using satellite remote sensing, GIS and stochastic modelling. J. Environ. Manag. 2002, 64, 273–284. [Google Scholar] [CrossRef] [PubMed]
- Xiao, J.; Shen, Y.; Ge, J.; Tateishi, R.; Tang, C.; Liang, Y.; Huang, Z. Evaluating urban expansion and land use change in Shijiazhuang, China, by using GIS and remote sensing. Landsc. Urban Plan. 2006, 75, 69–80. [Google Scholar] [CrossRef]
- Gaston, K.J.; Bennie, J.; Davies, T.W.; Hopkins, J. The ecological impacts of nighttime light pollution: A mechanistic appraisal. Biol. Rev. 2013, 88, 912–927. [Google Scholar] [CrossRef]
- Chepesiuk, R. Missing the dark: Health effects of light pollution. Environ. Health Perspect. 2009. [Google Scholar] [CrossRef]
- Falchi, F.; Cinzano, P.; Elvidge, C.D.; Keith, D.M.; Haim, A. Limiting the impact of light pollution on human health, environment and stellar visibility. J. Environ. Manag. 2011, 92, 2714–2722. [Google Scholar] [CrossRef] [PubMed]
- Newell, J.P.; Cousins, J.J. The boundaries of urban metabolism: Towards a political—Industrial ecology. Prog. Hum. Geogr. 2015, 39, 702–728. [Google Scholar] [CrossRef]
- Dobler, G.; Ghandehari, M.; Koonin, S.E.; Nazari, R.; Patrinos, A.; Sharma, M.S.; Tafvizi, A.; Vo, H.T.; Wurtele, J.S. Dynamics of the urban lightscape. Inf. Syst. 2015, 54, 115–126. [Google Scholar] [CrossRef]
- Dobler, G.; Ghandehari, M.; Koonin, S.E.; Sharma, M.S. A hyperspectral survey of New York City lighting technology. Sensors 2016, 16, 2047. [Google Scholar] [CrossRef]
- York, D.G.; Adelman, J.; Anderson, J.E., Jr.; Anderson, S.F.; Annis, J.; Bahcall, N.A.; Bakken, J.; Barkhouser, R.; Bastian, S.; Berman, E.; et al. The sloan digital sky survey: Technical summary. Astronom. J. 2000, 120, 1579. [Google Scholar] [CrossRef]
- Kaiser, N.; Aussel, H.; Burke, B.E.; Boesgaard, H.; Chambers, K.; Chun, M.R.; Heasley, J.N.; Hodapp, K.W.; Hunt, B.; Jedicke, R.; et al. Pan-STARRS: A large synoptic survey telescope array. In Survey and Other Telescope Technologies and Discoveries; International Society for Optics and Photonics: Bellingham, WA, USA, 2002; Volume 4836, pp. 154–164. [Google Scholar]
- Qamar, F.; Dobler, G. Pixel-Wise Classification of High-Resolution Ground-Based Urban Hypers pectral Images with Convolutional Neural Networks. Remote Sens. 2020, 12, 2540. [Google Scholar] [CrossRef]
- Ghandehari, M.; Aghamohamadnia, M.; Dobler, G.; Karpf, A.; Buckland, K.; Qian, J.; Koonin, S. Mapping refrigerant gases in the new york city skyline. Sci. Rep. 2017, 7, 1–10. [Google Scholar] [CrossRef]
- Ahearn, S.C.; Ahn, H.J. Quality assurance and potential applications of a high density lidar data set for the city of New York. In Proceedings of the ASPRS Annual Conference, New York, NY, USA, 1–5 May 2011; p. 9. [Google Scholar]
- Floridi, L.; Cowls, J.; Beltrametti, M.; Chatila, R.; Chazerand, P.; Dignum, V.; Luetge, C.; Madelin, R.; Pagallo, U.; Rossi, F.; et al. AI4People—an ethical framework for a good AI society: Opportunities, risks, principles, and recommendations. Minds Mach. 2018, 28, 689–707. [Google Scholar] [CrossRef]
- Benjamin, R. Race after technology: Abolitionist tools for the new jim code. Soc. Forces 2019. [Google Scholar] [CrossRef]
- Adams, A.A.; Ferryman, J.M. The future of video analytics for surveillance and its ethical implications. Secur. J. 2015, 28, 272–289. [Google Scholar] [CrossRef]
- Tom Yeh, M. Designing a moral compass for the future of computer vision using speculative analysis. In Proceedings of the IEEE Conference on Computer Vision and Pattern Recognition Workshops, Honolulu, HI, USA, 21–26 July 2017; pp. 64–73. [Google Scholar]
- Lane, J.; Stodden, V.; Bender, S.; Nissenbaum, H. Privacy, Big Data, and the Public Good: Frameworks for Engagement; Cambridge University Press: Cambridge, UK, 2014. [Google Scholar]
- McCallister, E. Guide to Protecting the Confidentiality of Personally Identifiable Information; Diane Publishing: Darby, PA, USA, 2010; Volume 800. [Google Scholar]
- Raji, I.D.; Gebru, T.; Mitchell, M.; Buolamwini, J.; Lee, J.; Denton, E. Saving face: Investigating the ethical concerns of facial recognition auditing. In Proceedings of the AAAI/ACM Conference on AI, Ethics, and Society, New York, NY, USA, 7–8 February 2020; pp. 145–151. [Google Scholar]
- Liu, Z.; Sarkar, S. Outdoor recognition at a distance by fusing gait and face. Image Vis. Comput. 2007, 25, 817–832. [Google Scholar] [CrossRef]
- Sweeney, L. k-anonymity: A model for protecting privacy. Int. J. Uncertain. Fuzziness Knowl. Based Syst. 2002, 10, 557–570. [Google Scholar] [CrossRef]
- Bertino, E.; Verma, D.; Calo, S. A policy system for control of data fusion processes and derived data. In Proceedings of the 21st International Conference on Information Fusion (FUSION), IEEE, Cambridge, UK, 10–13 July 2018; pp. 807–813. [Google Scholar]
- Dwork, C. Differential privacy: A survey of results. In Proceedings of the International Conference on Theory and Applications of Models of Computation, Changsha, China, 18–20 October 2018; Springer: New York, NY, USA, 2008; pp. 1–19. [Google Scholar]
- Dwork, C.; Roth, A. The algorithmic foundations of differential privacy. Found. Trends Theor. Comput. Sci. 2014, 9, 211–407. [Google Scholar] [CrossRef]
- Baur, J.; Dobler, G.; Bianco, F.; Sharma, M.; Karpf, A. Persistent Hyperspectral Observations of the Urban Lightscape. In Proceedings of the 2018 IEEE Global Conference on Signal and Information Processing (GlobalSIP), IEEE, Anaheim, CA, USA, 26–29 November 2018; pp. 983–987. [Google Scholar]
- Bianco, F.B.; Koonin, S.E.; Mydlarz, C.; Sharma, M.S. Hypertemporal imaging of NYC grid dynamics: Short paper. In Proceedings of the 3rd ACM International Conference on Systems for Energy-Efficient Built Environments, Trento, Italy, 12–15 September 2016; pp. 61–64. [Google Scholar]
- Bianco, F.B.; Dobler, G.G.; Koonin, S.E. System, Method, and Computer-Accessible Medium for Remote Sensing of the Electrical Distribution Grid with Hypertemporal Imaging. U.S. Patent Application No. 16,581,966, 26 March 2020. [Google Scholar]
- Steers, B.; Kastelan, J.; Tsai, C.C.; Bianco, F.B.; Dobler, G. Detection of polluting plumes ejected from NYC buildings. Authorea Prepr. 2019. [Google Scholar] [CrossRef]
- Hillman, T.; Ramaswami, A. Greenhouse Gas Emission Footprints and Energy use Benchmarks for Eight US Cities; ACS Publications: Washington, DC, USA, 2010. [Google Scholar]
- Doll, C.N.; Muller, J.P.; Elvidge, C.D. Night-time imagery as a tool for global mapping of socioeconomic parameters and greenhouse gas emissions. Ambio 2000, 29, 157–162. [Google Scholar] [CrossRef]
- Kyba, C.; Garz, S.; Kuechly, H.; De Miguel, A.S.; Zamorano, J.; Fischer, J.; Hölker, F. High-resolution imagery of earth at night: New sources, opportunities and challenges. Remote Sens. 2015, 7, 1–23. [Google Scholar] [CrossRef]
- Zhao, M.; Zhou, Y.; Li, X.; Cao, W.; He, C.; Yu, B.; Li, X.; Elvidge, C.D.; Cheng, W.; Zhou, C. Applications of satellite remote sensing of nighttime light observations: Advances, challenges, and perspectives. Remote Sens. 2019, 11, 1971. [Google Scholar] [CrossRef]
- Levin, N.; Kyba, C.C.; Zhang, Q.; de Miguel, A.S.; Román, M.O.; Li, X.; Portnov, B.A.; Molthan, A.L.; Jechow, A.; Miller, S.D.; et al. Remote sensing of night lights: A review and an outlook for the future. Remote Sens. Environ. 2020, 237, 111443. [Google Scholar] [CrossRef]
- Letu, H.; Hara, M.; Tana, G.; Nishio, F. A saturated light correction method for DMSP/OLS nighttime satellite imagery. IEEE Trans. Geosci. Remote Sens. 2011, 50, 389–396. [Google Scholar] [CrossRef]
- Shi, K.; Chen, Y.; Li, L.; Huang, C. Spatiotemporal variations of urban CO2 emissions in China: A multiscale perspective. Appl. Energy 2018, 211, 218–229. [Google Scholar] [CrossRef]
- He, C.; Ma, Q.; Liu, Z.; Zhang, Q. Modeling the spatiotemporal dynamics of electric power consumption in Mainland China using saturation-corrected DMSP/OLS nighttime stable light data. Int. J. Digit. Earth 2014, 7, 993–1014. [Google Scholar] [CrossRef]
- Li, X.; Levin, N.; Xie, J.; Li, D. Monitoring hourly night-time light by an unmanned aerial vehicle and its implications to satellite remote sensing. Remote Sens. Environ. 2020, 247, 111942. [Google Scholar] [CrossRef]
- Kontokosta, C.E. Local Law 84 Energy Benchmarking Data: Report to the New York City Mayor’s Office of Long-Term Planning and Sustainability. Retrieved Febr. 2012, 9, 2018. [Google Scholar]
- Nageler, P.; Zahrer, G.; Heimrath, R.; Mach, T.; Mauthner, F.; Leusbrock, I.; Schranzhofer, H.; Hochenauer, C. Novel validated method for GIS based automated dynamic urban building energy simulations. Energy 2017, 139, 142–154. [Google Scholar] [CrossRef]
- Sikder, S.K.; Nagarajan, M.; Kar, S.; Koetter, T. A geospatial approach of downscaling urban energy consumption density in mega-city Dhaka, Bangladesh. Urban Clim. 2018, 26, 10–30. [Google Scholar] [CrossRef]
- Elvidge, C.D.; Cinzano, P.; Pettit, D.; Arvesen, J.; Sutton, P.; Small, C.; Nemani, R.; Longcore, T.; Rich, C.; Safran, J.; et al. The Nightsat mission concept. Int. J. Remote Sens. 2007, 28, 2645–2670. [Google Scholar] [CrossRef]
- Elvidge, C.D.; Keith, D.M.; Tuttle, B.T.; Baugh, K.E. Spectral identification of lighting type and character. Sensors 2010, 10, 3961–3988. [Google Scholar] [CrossRef] [PubMed]
- Zheng, Q.; Weng, Q.; Huang, L.; Wang, K.; Deng, J.; Jiang, R.; Ye, Z.; Gan, M. A new source of multi-spectral high spatial resolution night-time light imagery—JL1-3B. Remote Sens. Environ. 2018, 215, 300–312. [Google Scholar] [CrossRef]
- Swan, L.G.; Ugursal, V.I. Modeling of end-use energy consumption in the residential sector: A review of modeling techniques. Renew. Sustain. Energy Rev. 2009, 13, 1819–1835. [Google Scholar] [CrossRef]
- Anderson, S.T.; Newell, R.G. Information programs for technology adoption: The case of energy-efficiency audits. Resour. Energy Econ. 2004, 26, 27–50. [Google Scholar] [CrossRef]
- Kruse, F.A.; Elvidge, C.D. Identifying and mapping night lights using imaging spectrometry. In Proceedings of the 2011 Aerospace Conference, IEEE, Big Sky, MT, USA, 5–12 March 2011; pp. 1–6. [Google Scholar]
- Kruse, F.A.; Elvidge, C.D. Characterizing urban light sources using imaging spectrometry. In Proceedings of the 2011 Joint Urban Remote Sensing Event, IEEE, Munich, Germany, 11–13 April 2011; pp. 149–152. [Google Scholar]
- Kolláth, Z.; Dömény, A.; Kolláth, K.; Nagy, B. Qualifying lighting remodelling in a Hungarian city based on light pollution effects. J. Quant. Spectrosc. Radiat. Transf. 2016, 181, 46–51. [Google Scholar] [CrossRef]
- Alamús, R.; Bará, S.; Corbera, J.; Escofet, J.; Palà, V.; Pipia, L.; Tardà, A. Ground-based hyperspectral analysis of the urban nightscape. ISPRS J. Photogramm. Remote Sens. 2017, 124, 16–26. [Google Scholar] [CrossRef]
- Barentine, J.C.; Walker, C.E.; Kocifaj, M.; Kundracik, F.; Juan, A.; Kanemoto, J.; Monrad, C.K. Skyglow changes over Tucson, Arizona, resulting from a municipal LED street lighting conversion. J. Quant. Spectrosc. Radiat. Transf. 2018, 212, 10–23. [Google Scholar] [CrossRef]
- Meier, J.M. Temporal Profiles of Urban Lighting: Proposal for a research design and first results from three sites in Berlin. Int. J. Sustain. Lighting 2018. [Google Scholar] [CrossRef]
- Bará, S.; Rodríguez-Arós, Á.; Pérez, M.; Tosar, B.; Lima, R.C.; Sánchez de Miguel, A.; Zamorano, J. Estimating the relative contribution of streetlights, vehicles, and residential lighting to the urban night sky brightness. Lighting Res. Technol. 2019, 51, 1092–1107. [Google Scholar] [CrossRef]
- Sheinin, M.; Schechner, Y.Y.; Kutulakos, K.N. Computational imaging on the electric grid. In Proceedings of the IEEE Conference on Computer Vision and Pattern Recognition, Honolulu, HI, USA, 21–26 July 2017; pp. 6437–6446. [Google Scholar]
- Sheinin, M.; Schechner, Y.Y.; Kutulakos, K.N. Rolling shutter imaging on the electric grid. In Proceedings of the 2018 IEEE International Conference on Computational Photography (ICCP), IEEE, Pittsburgh, PA, USA, 4–6 May 2018; pp. 1–12. [Google Scholar]
- Shah, Z.; Yen, A.; Pandey, A.; Taneja, J. GridInSight: Monitoring Electricity Using Visible Lights. In Proceedings of the 6th ACM International Conference on Systems for Energy-Efficient Buildings, Cities, and Transportation, New York, NY, USA, 10–13 November 2019; pp. 243–252. [Google Scholar]
- Liu, Y.; You, S.; Yao, W.; Cui, Y.; Wu, L.; Zhou, D.; Zhao, J.; Liu, H.; Liu, Y. A distribution level wide area monitoring system for the electric power grid—FNET/GridEye. IEEE Access 2017, 5, 2329–2338. [Google Scholar] [CrossRef]
- Gopakumar, P.; Mallikajuna, B.; Reddy, M.J.B.; Mohanta, D.K. Remote monitoring system for real time detection and classification of transmission line faults in a power grid using PMU measurements. Prot. Control Modern Power Syst. 2018, 3, 1–10. [Google Scholar] [CrossRef]
- Balaras, C.A.; Argiriou, A. Infrared thermography for building diagnostics. Energy Build. 2002, 34, 171–183. [Google Scholar] [CrossRef]
- Kylili, A.; Fokaides, P.A.; Christou, P.; Kalogirou, S.A. Infrared thermography (IRT) applications for building diagnostics: A review. Appl. Energy 2014, 134, 531–549. [Google Scholar] [CrossRef]
- Barreira, E.; de Freitas, V.P. Evaluation of building materials using infrared thermography. Constr. Build. Mater. 2007, 21, 218–224. [Google Scholar] [CrossRef]
- Fox, M.; Coley, D.; Goodhew, S.; De Wilde, P. Thermography methodologies for detecting energy related building defects. Renew. Sustain. Energy Rev. 2014, 40, 296–310. [Google Scholar] [CrossRef]
- Lo, C.P.; Quattrochi, D.A.; Luvall, J.C. Application of high-resolution thermal infrared remote sensing and GIS to assess the urban heat island effect. Int. J. Remote Sens. 1997, 18, 287–304. [Google Scholar] [CrossRef]
- Sobrino, J.A.; Oltra-Carrió, R.; Sòria, G.; Jiménez-Muñoz, J.C.; Franch, B.; Hidalgo, V.; Mattar, C.; Julien, Y.; Cuenca, J.; Romaguera, M.; et al. Evaluation of the surface urban heat island effect in the city of Madrid by thermal remote sensing. Int. J. Remote Sens. 2013, 34, 3177–3192. [Google Scholar] [CrossRef]
- Huang, X.; Wang, Y. Investigating the effects of 3D urban morphology on the surface urban heat island effect in urban functional zones by using high-resolution remote sensing data: A case study of Wuhan, Central China. ISPRS J. Photogramm. Remote Sens. 2019, 152, 119–131. [Google Scholar] [CrossRef]
- Kaplan, H. Practical Applications of Infrared Thermal Sensing and Imaging Equipment; SPIE Press: Bellingham, WA, USA, 2007; Volume 75. [Google Scholar]
- Ghandehari, M.; Emig, T.; Aghamohamadnia, M. Surface temperatures in New York City: Geospatial data enables the accurate prediction of radiative heat transfer. Sci. Rep. 2018, 8, 1–10. [Google Scholar] [CrossRef]
- Schwartz, J. Particulate air pollution and chronic respiratory disease. Environ. Res. 1993, 62, 7–13. [Google Scholar] [CrossRef]
- Penttinen, P.; Timonen, K.; Tiittanen, P.; Mirme, A.; Ruuskanen, J.; Pekkanen, J. Ultrafine particles in urban air and respiratory health among adult asthmatics. Eur. Respir. J. 2001, 17, 428–435. [Google Scholar] [CrossRef]
- Janssen, N.A.; Brunekreef, B.; van Vliet, P.; Aarts, F.; Meliefste, K.; Harssema, H.; Fischer, P. The relationship between air pollution from heavy traffic and allergic sensitization, bronchial hyperresponsiveness, and respiratory symptoms in Dutch schoolchildren. Environ. Health Perspect. 2003, 111, 1512–1518. [Google Scholar] [CrossRef]
- D’Amato, G.; Cecchi, L.; D’amato, M.; Liccardi, G. Urban air pollution and climate change as environmental risk factors of respiratory allergy: An update. J. Investig. Allergol. Clin. Immunol. 2010, 20, 95–102. [Google Scholar] [PubMed]
- Caplin, A.; Ghandehari, M.; Lim, C.; Glimcher, P.; Thurston, G. Advancing environmental exposure assessment science to benefit society. Nat. Commun. 2019, 10, 1–11. [Google Scholar] [CrossRef] [PubMed]
- Han, L.; Zhou, W.; Li, W. Increasing impact of urban fine particles (PM 2.5) on areas surrounding Chinese cities. Sci. Rep. 2015, 5, 12467. [Google Scholar] [CrossRef]
- Ramanathan, V.; Feng, Y. Air pollution, greenhouse gases and climate change: Global and regional perspectives. Atmos. Environ. 2009, 43, 37–50. [Google Scholar] [CrossRef]
- Seto, K.C.; Güneralp, B.; Hutyra, L.R. Global forecasts of urban expansion to 2030 and direct impacts on biodiversity and carbon pools. Proc. Natl. Acad. Sci. USA 2012, 109, 16083–16088. [Google Scholar] [CrossRef] [PubMed]
- Yuan, M.; Huang, Y.; Shen, H.; Li, T. Effects of urban form on haze pollution in China: Spatial regression analysis based on PM2. 5 remote sensing data. Appl. Geogr. 2018, 98, 215–223. [Google Scholar] [CrossRef]
- Dickinson, J.; Tenorio, A. Inventory of New York City Greenhouse Gas Emissions; Mayor’s Office of Long-Term Planning and Sustainability: New York, NY, USA, 2011.
- Adachi, K.; Chung, S.H.; Buseck, P.R. Shapes of soot aerosol particles and implications for their effects on climate. J. Geophys. Res. Atmos. 2010, 115. [Google Scholar] [CrossRef]
- Wu, Y.; Arapi, A.; Huang, J.; Gross, B.; Moshary, F. Intra-continental wildfire smoke transport and impact on local air quality observed by ground-based and satellite remote sensing in New York City. Atmos. Environ. 2018, 187, 266–281. [Google Scholar] [CrossRef]
- McIvor, A.M. Background subtraction techniques. Proc. Image Vis. Comput. 2000, 4, 3099–3104. [Google Scholar]
- Brutzer, S.; Höferlin, B.; Heidemann, G. Evaluation of background subtraction techniques for video surveillance. In Proceedings of the CVPR 2011, IEEE, Colorado Springs, CO, USA, 20–25 June 2011; pp. 1937–1944. [Google Scholar]
- Mou, B.; He, B.J.; Zhao, D.X.; Chau, K.w. Numerical simulation of the effects of building dimensional variation on wind pressure distribution. Eng. Appl. Comput. Fluid Mech. 2017, 11, 293–309. [Google Scholar] [CrossRef]
- Girshick, R.; Donahue, J.; Darrell, T.; Malik, J. Rich feature hierarchies for accurate object detection and semantic segmentation. In Proceedings of the IEEE Conference on Computer Vision and Pattern Recognition, Columbus, OH, USA, 23–28 June 2014; pp. 580–587. [Google Scholar]
- Girshick, R. Fast r-cnn. In Proceedings of the IEEE International Conference on Computer Vision, Santiago, Chile, 7–13 December 2015; pp. 1440–1448. [Google Scholar]
- Ren, S.; He, K.; Girshick, R.; Sun, J. Faster r-cnn: Towards real-time object detection with region proposal networks. arXiv 2015, arXiv:1506.01497. [Google Scholar] [CrossRef]
- Li, C.; Dobler, G.; Feng, X.; Wang, Y. TrackNet: Simultaneous Object Detection and Tracking and Its Application in Traffic Video Analysis. arXiv 2019, arXiv:1902.01466. [Google Scholar]
- Manolakis, D.; Pieper, M.; Truslow, E.; Lockwood, R.; Weisner, A.; Jacobson, J.; Cooley, T. Longwave infrared hyperspectral imaging: Principles, progress, and challenges. IEEE Geosci. Remote Sens. Mag. 2019, 7, 72–100. [Google Scholar] [CrossRef]
- Horler, D.; Dockray, M.; Barber, J. The red edge of plant leaf reflectance. Int. J. Remote Sens. 1983, 4, 273–288. [Google Scholar] [CrossRef]
- Elvidge, C.D. Visible and near infrared reflectance characteristics of dry plant materials. Remote Sens. 1990, 11, 1775–1795. [Google Scholar] [CrossRef]
- Xue, J.; Su, B. Significant remote sensing vegetation indices: A review of developments and applications. J. Sens. 2017, 2017. [Google Scholar] [CrossRef]
- Rouse, J.; Haas, R.; Schell, J.; Deering, D. Monitoring vegetation systems in the Great Plains with ERTS. NASA Spec. Publ. 1974, 351, 309. [Google Scholar]
- Robinson, N.P.; Allred, B.W.; Jones, M.O.; Moreno, A.; Kimball, J.S.; Naugle, D.E.; Erickson, T.A.; Richardson, A.D. A dynamic Landsat derived normalized difference vegetation index (NDVI) product for the conterminous United States. Remote Sens. 2017, 9, 863. [Google Scholar] [CrossRef]
- Gamon, J.; Serrano, L.; Surfus, J. The photochemical reflectance index: An optical indicator of photosynthetic radiation use efficiency across species, functional types, and nutrient levels. Oecologia 1997, 112, 492–501. [Google Scholar] [CrossRef]
- Garbulsky, M.F.; Peñuelas, J.; Gamon, J.; Inoue, Y.; Filella, I. The photochemical reflectance index (PRI) and the remote sensing of leaf, canopy and ecosystem radiation use efficiencies: A review and meta-analysis. Remote Sens. Environ. 2011, 115, 281–297. [Google Scholar] [CrossRef]
- Thenkabail, P.S.; Lyon, J.G.; Huete, A. Advances in Hyperspectral Remote Sensing of Vegetation and Agricultural Croplands; Taylor & Francis Group: New York, NY, USA, 2012. [Google Scholar]
- Meroni, M.; Rossini, M.; Guanter, L.; Alonso, L.; Rascher, U.; Colombo, R.; Moreno, J. Remote sensing of solar-induced chlorophyll fluorescence: Review of methods and applications. Remote Sens. Environ. 2009, 113, 2037–2051. [Google Scholar] [CrossRef]
- Meroni, M.; Rossini, M.; Picchi, V.; Panigada, C.; Cogliati, S.; Nali, C.; Colombo, R. Assessing steady-state fluorescence and PRI from hyperspectral proximal sensing as early indicators of plant stress: The case of ozone exposure. Sensors 2008, 8, 1740–1754. [Google Scholar] [CrossRef] [PubMed]
- Karnosky, D.F.; Skelly, J.M.; Percy, K.E.; Chappelka, A.H. Perspectives regarding 50 years of research on effects of tropospheric ozone air pollution on US forests. Environ. Pollut. 2007, 147, 489–506. [Google Scholar] [CrossRef] [PubMed]
- Žibret, G.; Kopačková, V. Comparison of two methods for indirect measurement of atmospheric dust deposition: Street-dust composition and vegetation-health status derived from hyperspectral image data. Ambio 2019, 48, 423–435. [Google Scholar] [CrossRef]
- Hernández-Clemente, R.; Hornero, A.; Mottus, M.; Penuelas, J.; González-Dugo, V.; Jiménez, J.; Suárez, L.; Alonso, L.; Zarco-Tejada, P.J. Early diagnosis of vegetation health from high-resolution hyperspectral and thermal imagery: Lessons learned from empirical relationships and radiative transfer modelling. Curr. For. Rep. 2019, 5, 169–183. [Google Scholar] [CrossRef]
- Rich, C.; Longcore, T. Ecological Consequences of Artificial Night Lighting; Island Press: Washington, DC, USA, 2013. [Google Scholar]
- Gauthreaux, S.A., Jr.; Belser, C.G.; Rich, C.; Longcore, T. Effects of artificial night lighting on migrating birds. Ecological Consequences of Artificial Night Lighting; Island Press: Washington, DC, USA, 2006; pp. 67–93. [Google Scholar]
- Van Doren, B.M.; Horton, K.G.; Dokter, A.M.; Klinck, H.; Elbin, S.B.; Farnsworth, A. High-intensity urban light installation dramatically alters nocturnal bird migration. Proc. Natl. Acad. Sci. USA 2017, 114, 11175–11180. [Google Scholar] [CrossRef]
- La Sorte, F.A.; Fink, D.; Buler, J.J.; Farnsworth, A.; Cabrera-Cruz, S.A. Seasonal associations with urban light pollution for nocturnally migrating bird populations. Glob. Change Biol. 2017, 23, 4609–4619. [Google Scholar] [CrossRef] [PubMed]
- Cabrera-Cruz, S.A.; Smolinsky, J.A.; Buler, J.J. Light pollution is greatest within migration passage areas for nocturnally-migrating birds around the world. Sci. Rep. 2018, 8, 1–8. [Google Scholar]
- Horton, K.G.; Nilsson, C.; Van Doren, B.M.; La Sorte, F.A.; Dokter, A.M.; Farnsworth, A. Bright lights in the big cities: Migratory birds’ exposure to artificial light. Front. Ecol. Environ. 2019, 17, 209–214. [Google Scholar] [CrossRef]
- Cabrera-Cruz, S.A.; Smolinsky, J.A.; McCarthy, K.P.; Buler, J.J. Urban areas affect flight altitudes of nocturnally migrating birds. J. Anim. Ecol. 2019, 88, 1873–1887. [Google Scholar] [CrossRef] [PubMed]
- Cabrera-Cruz, S.A.; Cohen, E.B.; Smolinsky, J.A.; Buler, J.J. Artificial light at night is related to broad-scale stopover distributions of nocturnally migrating landbirds along the Yucatan Peninsula, Mexico. Remote Sens. 2020, 12, 395. [Google Scholar] [CrossRef]
- NOAA National Weather Service (NWS) Radar Operations Center. NOAA Next Generation Radar (NEXRAD) Level 2 Base Data; NOAA National Centers for Environmental Information: Washington, DC, USA, 1991.
- Wilt, B. In the City that We Love. The Jawbone Blog. 2014. Available online: https://www.jawbone.com/blog/jawbone-up-data-by-city/ (accessed on 18 August 2014).
- Zeitzer, J.M.; Dijk, D.J.; Kronauer, R.E.; Brown, E.N.; Czeisler, C.A. Sensitivity of the human circadian pacemaker to nocturnal light: Melatonin phase resetting and suppression. J. Physiol. 2000, 526, 695–702. [Google Scholar] [CrossRef]
- Rea, M.S.; Figueiro, M.G.; Bierman, A.; Bullough, J.D. Circadian light. J. Circad. Rhythm. 2010, 8, 2. [Google Scholar] [CrossRef] [PubMed]
- Pauley, S.M. Lighting for the human circadian clock: Recent research indicates that lighting has become a public health issue. Med. Hypotheses 2004, 63, 588–596. [Google Scholar] [CrossRef]
- Mason, I.C.; Boubekri, M.; Figueiro, M.G.; Hasler, B.P.; Hattar, S.; Hill, S.M.; Nelson, R.J.; Sharkey, K.M.; Wright, K.P.; Boyd, W.A.; et al. Circadian health and light: A report on the National Heart, Lung, and Blood Institute’s workshop. J. Biol. Rhythm. 2018, 33, 451–457. [Google Scholar] [CrossRef] [PubMed]
- Dolfin, M.; Leonida, L.; Outada, N. Modeling human behavior in economics and social science. Phys. Life Rev. 2017, 22, 1–21. [Google Scholar] [CrossRef] [PubMed]
- Müller-Hansen, F.; Schlüter, M.; Mäs, M.; Donges, J.F.; Kolb, J.J.; Thonicke, K.; Heitzig, J. Towards representing human behavior and decision making in Earth system models–an overview of techniques and approaches. Earth Syst. Dynam. 2017, 8, 977–1007. [Google Scholar] [CrossRef]
- Greening, L.A.; Greene, D.L.; Difiglio, C. Energy efficiency and consumption—The rebound effect—A survey. Energy Policy 2000, 28, 389–401. [Google Scholar] [CrossRef]
- Kyba, C.C.; Kuester, T.; De Miguel, A.S.; Baugh, K.; Jechow, A.; Hölker, F.; Bennie, J.; Elvidge, C.D.; Gaston, K.J.; Guanter, L. Artificially lit surface of Earth at night increasing in radiance and extent. Sci. Adv. 2017, 3, e1701528. [Google Scholar] [CrossRef]
- Tsao, J.Y.; Saunders, H.D.; Creighton, J.R.; Coltrin, M.E.; Simmons, J.A. Solid-state lighting: An energy-economics perspective. J. Phys. D Appl. Phys. 2010, 43, 354001. [Google Scholar] [CrossRef]
- Alberti, M. Modeling the urban ecosystem: A conceptual framework. Environ. Plan. B Plan. Des. 1999, 26, 605–629. [Google Scholar] [CrossRef]
- Grimm, N.B.; Grove, J.G.; Pickett, S.T.; Redman, C.L. Integrated approaches to long-term studies of urban ecological systems: Urban ecological systems present multiple challenges to ecologists—Pervasive human impact and extreme heterogeneity of cities, and the need to integrate social and ecological approaches, concepts, and theory. BioScience 2000, 50, 571–584. [Google Scholar]
- Alberti, M. Advances in Urban Ecology: Integrating Humans and Ecological Processes in Urban Ecosystems; Number 574.5268 A4; Springer: New York, NY, USA, 2008. [Google Scholar]
- Golubiewski, N. Is there a metabolism of an urban ecosystem? An ecological critique. Ambio 2012, 41, 751–764. [Google Scholar] [CrossRef]
Publisher’s Note: MDPI stays neutral with regard to jurisdictional claims in published maps and institutional affiliations. |
© 2021 by the authors. Licensee MDPI, Basel, Switzerland. This article is an open access article distributed under the terms and conditions of the Creative Commons Attribution (CC BY) license (https://creativecommons.org/licenses/by/4.0/).