
Evaluating Alternative Flight Plans in Thermal Drone Wildlife Surveys—Simulation Study


Museum and Institute of Zoology Polish Academy of Sciences, Wilcza 64, 00-679 Warszawa, Poland
*
Author to whom correspondence should be addressed.
Remote Sens. 2021, 13(6), 1102; https://doi.org/10.3390/rs13061102
Submission received: 8 February 2021
/
Revised: 27 February 2021
/
Accepted: 8 March 2021
/
Published: 14 March 2021
(This article belongs to the Special Issue Drones for Ecology and Conservation)
Abstract
:The rapidly developing technology of unmanned aerial vehicles (drones) extends to the availability of aerial surveys for wildlife research and management. However, regulations limiting drone operations to visual line of sight (VLOS) seriously affect the design of surveys, as flight paths must be concentrated within small sampling blocks. Such a design is inferior to spatially unrestricted randomized designs available if operations beyond visual line of sight (BVLOS) are allowed. We used computer simulations to assess whether the VLOS rule affects the accuracy and precision of wildlife density estimates derived from drone collected data. We tested two alternative flight plans (VLOS vs. BVLOS) in simulated surveys of low-, medium- and high-density populations of a hypothetical ungulate species with three levels of effort (one to three repetitions). The population density was estimated using the ratio estimate and distance sampling method. The observed differences in the accuracy and precision of estimates from the VLOS and BVLOS surveys were relatively small and negligible. Only in the case of the low-density population (2 ind./100 ha) surveyed once was the VLOS design inferior to BVLOS, delivering biased and less precise estimates. These results show that while the VLOS regulations complicate survey logistics and interfere with random survey design, the quality of derived estimates does not have to be compromised. We advise testing alternative survey variants with the aid of computer simulations to achieve reliable estimates while minimizing survey costs.
Keywords:
bias; BVLOS; population density; survey design; thermal infrared; UAV; ungulates; variability; VLOS; wildlife monitoring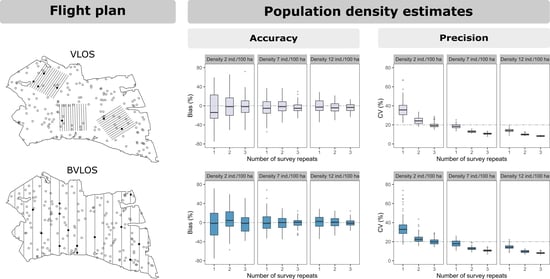
1. Introduction
Estimating population size is one of the fundamental tasks in wildlife management and conservation. Accurate and precise estimates of densities are especially important in the case of wild ungulates, which are not only popular game species, but also cause damage to forestry and agriculture, and are involved in vehicle collisions and transmission of diseases to livestock [1]. Since ungulate populations often occupy large, mostly forested areas, surveying them is logistically difficult and costly. The currently used ground-based survey methods, such as drive counts or snow tracking are acknowledged to be unreliable and inefficient [2]. Alternative methods such as aerial surveys are more effective; however, over the forests, their use remains limited, as camouflage coloration of ungulate coats impedes their detection on the cluttered background of the forest floor. Additionally, in areas where ungulates are active mostly during dusk and dawn [3,4,5], the applicability of aerial surveys is further reduced; in times of poor visibility, especially at lower altitudes, manned aircraft flights are challenging and dangerous.
The recent development of unmanned aerial vehicles (UAVs, commonly known as “drones”) industry, together with the improvement, miniaturization, and increased availability of thermal infrared cameras has brought new possibilities to aerial wildlife surveys. The use of drones and thermography overcomes limitations of manned aircraft, since drones can safely fly even in the dark and animal detection based on thermal contrast is not affected by camouflage coats of animals. Successful tests of such surveys have been reported and interest in the implementation of drones for wildlife research and management is still growing [6,7,8].
While drones have many advantages over manned aircraft, they also have limitations. The flight range of small or medium drones used by wildlife researchers is constrained by the battery capacity or fuel tank size. More importantly, regulations applied in most countries limit the flight range by restricting drone operation to visual line of sight (VLOS), meaning that during the whole flight the drone must be visible to the operator or assisting visual observer. Some countries (e.g., in the European Union [9]) tend to have more relaxed UAV policies and allow flights beyond the visual line of sight (BVLOS); nevertheless, in most cases, researchers planning to use drones for wildlife monitoring will have to cope with limited drone range under VLOS restrictions. The regulation not only reduces the efficiency but also affects the design of surveys by the need to concentrate flight paths into small sampling blocks. The number and location of these blocks may be additionally limited by the availability of convenient take-off and landing spots. These factors can lead to poor designs and, as a consequence, to biased estimates of population densities. Therefore, it is important to understand whether being constrained by the VLOS rule survey design affects the accuracy and precision of the obtained results. Here, we aimed to answer this question with the aid of computer simulations.
To assess the effect of the survey design on the accuracy (bias) and precision (variability) of density estimates derived from drone collected data, we conducted simulated surveys of three virtual populations of a hypothetical ungulate species (differing in animal density) using two alternative flight plan designs: (1) under VLOS restriction, and (2) assuming no restriction of the flight range (BVLOS). For each design, we additionally tested three levels of survey effort (from one to three survey repetitions).
2. Materials and Methods
The methods of conducting surveys and estimating population density applied in the simulations were the same as those used in the actual field tests of thermal drone surveys conducted in 2017 in several hunting districts in Poland (Table S1). As a virtual study area (Figure 1), we chose one of the surveyed districts (8400 ha). For simulated data collection, we assumed the same conditions as during field tests—flight altitude of 150 m and a 640-pixel camera resolution—resulting in a survey strip width of 65 m.
The simulations were run in three steps: (1) generation of the virtual population, (2) simulation of aerial survey of this population, and (3) estimation of population density based on the data collected during the simulated survey.
2.1. Virtual Populations
Since the population size influences the precision and accuracy of density estimates [10], we conducted simulations for three levels of population densities of a hypothetical ungulate species. Chosen density levels represented the range of local red deer densities in Poland: low (two individuals per 100 ha), medium (seven individuals per 100 ha), and high (12 individuals per 100 ha) [11]. In the study area of 8400 ha, these densities translate to population sizes of 168, 588, and 1008 individuals. In the first step of each simulation, we generated a virtual population of a given size and distributed its individuals throughout the study area. In natural populations, animals often occur in groups of varying sizes; however, in simulations, we assumed that animals occur individually, to reduce the variability in density estimates due to the effect of group size [10]. To emulate uneven spatial distribution of animals across the study area, we used the density surface with randomly placed spots of low and high animal density (Figure 1).
2.2. Surveys
We tested two alternative variants of the flight plan: VLOS design vs. BVLOS design. In the VLOS variant (flights within visual line of sight), the transects were allocated within three sample blocks placed throughout the study area. Based on the results of pilot field tests, we determined the optimal form of sample blocks as the 2 km by 2.5 km rectangle. To place blocks within the study area, we used a quasi-random procedure. The coordinates of the blocks’ centroids were randomly selected with two restrictions: the distance between centroids had to be greater than 1.5 km (to avoid blocks overlapping), and the distance of centroids to the boundaries of the study area had to be greater than 1 km (to avoid placing a significant part of the block outside the study area). Then, the blocks were rotated around their centroids for the best fit inside the study area. In case of one block, it was necessary to move its centroid ~200 m from its initially drawn location. Inside each block, we placed 13 parallel transects spaced 200 m apart (Figure 2a). We assumed that such spacing between transects should minimize the chance of double counting moving animals during the surveys [8]. The total length of 39 transects within all three blocks was 104.5 km. Previous field tests revealed that the thermal survey according to such a flight plan using a fixed-wing drone is logistically challenging but can be completed in about three hours.
The second variant assumed flights beyond the visual line of sight (BVLOS). In this case, the flight plan had a form of parallel systematic transects running across the entire study area (Figure 2b). Transects were delineated perpendicular to the long axis of the area (to maximize the number of transects). To achieve the same effort as in the VLOS variant (i.e., the same total transect length ~104 km), we set up 16 transects spaced 800 m apart.
Given the thermal swath width of 65 m, the total area surveyed along all transects constituted approximately 8% of the entire area of the hunting district in case of both designs (VLOS and BVLOS).
Over the forest, the probability of detection during aerial surveys with a thermal camera depends mainly on the sensor efficiency as well as the availability of animals for detection (animals under canopy are unavailable for detection). For simplicity, during simulated surveys, we arbitrarily set the overall value of the detection probability to p = 0.6, assuming it is equal to availability and independent of the distance to the transect line. This means that every animal in the virtual population, which, during the survey, was located inside the 65 m wide transect strip, had a 60% chance of detection. This rather conservative figure is based on the mean value of the tree cover density (~40%) in the studied area calculated from remotely sensed data [12].
2.3. Population Density Estimation
For the population density estimation based on data from simulated surveys, we used two methods: the ratio estimate [13,14] and distance sampling [15].
In the ratio method, the estimated density per unit area was calculated as
where xi is the number of animals detected on transect i and ai is the area of transect i. The total population abundance in the study area A was calculated as
with the approximated variance calculated as
where ns is the number of surveyed transects, and nt is the total number of all possible transects. To assess the precision of the estimates, we calculated the coefficient of variation as
Relative bias was calculated as
where D is the true density.
The distance sampling method accounts for the decrease of detectability with the increasing distance from the transect that is often observed in wildlife surveys. The perpendicular distances of detected individuals from the transect centerline recorded during the survey are used to fit the detection function model, which is then used to estimate density. The main assumptions of the method are: detection at distance zero (at the transect line) is certain, distances are measured without error, and animals do not move in response to the observer. Distance sampling is a commonly used method for density estimation in aerial surveys. Here, we used the simplest form of distance sampling—conventional distance sampling (CDS). In each CDS analysis, three alternative models were fit to the distance data generated during survey simulations (half-normal, hazard rate, and uniform with cosine adjustment terms) and the best model was selected based on the minimum Akaike Information Criterion (AIC) value. Distance sampling estimates, along with the corresponding coefficient of variation (CV) were calculated using the Distance package in R [16]. Relative bias was calculated as for the ratio estimate (Equation 5).
For both methods, the ratio estimate and the distance sampling do not account for animals unavailable for detection—present on the transect strip but hidden under the canopy. To correct for bias caused by unavailability, the density values obtained with either of the methods need to be multiplied by the correction factors. In practice, such factors are estimated, but incorporating the correction factor uncertainty in the simulations would introduce additional variability to population density estimates and could obscure possible differences driven by alternative flight plans. Thus, for simplicity, we assumed constant correction factor, equal to the reciprocal of the preconceived availability for detection, i.e., 1/0.6.
2.4. Simulations
For all combinations of the survey design (VLOS, BVLOS), the level of population density (low, medium, high) and level of survey effort (one to three survey repetitions), we ran 100 iterations of simulated surveys; thus, a total of 1800 survey results were generated. For each iteration, the population density was estimated using the ratio estimate and the distance sampling method. For repeated surveys, the density estimates and their variance were calculated from summed detections across repeats. To assess the differences in the accuracy and precision of the results from alternative survey designs, we plotted the distribution of performance metrics (relative bias and coefficient of variation) as a series of boxplots. All procedures were run in R 4.0.0. program [17] using packages DSsim 1.1.5. [18] and Distance 1.0.0 [16].
3. Results
The population density estimates derived from surveys under the VLOS design were in general of a similar quality to those from BVOS surveys (Figure 3). Only in one scenario—the surveys of the low-density population with low effort—did the VLOS design appear to be significantly inferior to BVLOS, showing moderate bias (median underestimation of −14%, Figure 3a) and slightly less precise results (median CVs for VLOS up to 3% higher than for BVLOS, Figure 3b).
Regardless of the survey design, the precision of estimates increased with increasing population density as well as with increasing survey effort (Figure 3). However, the most apparent improvement in precision was observed for two survey repetitions (~30% decrease in median CV values). The third survey repetition resulted in a further increase in precision but to a lesser degree (~16% decrease in median CV values).
In terms of accuracy, both estimation methods—the ratio estimate and distance sampling—provided unbiased estimates of population density in the surveys of medium and high-density populations (median bias from −5 to 2% for the ratio estimate and from 0 to 7% for distance sampling). However, in the case of a low-density population, distance sampling tended to overestimate density (median bias up to 18%). In terms of precision, the methods differed substantially in the quality of the obtained results. For all analyzed survey scenarios distance sampling estimates were less precise, showing CV values from 4 to 15% higher than those for the ratio estimates.
4. Discussion
The main goal of this study was to assess whether VLOS restriction would affect the accuracy and precision of the results of a wildlife aerial survey. We used simulations to compare two alternative flight plans (within VLOS vs. BVLOS) together with several combinations of survey conditions (three density levels of the surveyed population and three levels of survey effort).
The observed differences in the accuracy and precision of the population density estimates derived from the VLOS and BVLOS surveys were relatively small and negligible. Only in the case of a low-density population and low survey effort did the differences between designs become more distinct—the estimates obtained under VLOS design were biased and less precise than those derived under BVLOS (Figure 3). This was a result of the uneven coverage of VLOS design, coupled with the sparseness of the population (2 ind./100 ha) and minimum effort of one survey. However, increasing effort by one additional survey was sufficient to reduce the differences in accuracy and precision between the two designs. These results are encouraging, as the applicability of drones, which are hoped to revolutionize data collection in wildlife research [19], remains to be constrained by the VLOS rule. While the design and logistics of surveys are seriously impacted by the need to maintain visual contact with the aircraft, the results obtained in this study provide evidence that the quality of the derived estimates does not have to be compromised.
Researchers planning surveys under VLOS restriction face several issues and challenges. First, the transects must be grouped in blocks. To make survey logistics efficient, the number of blocks needs to be small, and the size of the blocks as large as possible under the constraints of VLOS in given conditions. At the same time, the set of surveyed transects in the blocks has to be representative of the entire study area. To achieve this, the blocks must be placed randomly. In a situation where the majority of the study area is forested, it may be necessary to adjust block locations by shifting them towards open areas or other suitable places for drone deployment. Such interference with the random placement of blocks may lead to the overrepresentation of open areas on transects and biased population density estimations. Thus, after the adjustment of block locations, it is advisable to compare the proportions of different land cover classes or habitats in the study area with those along transects. It is worth noticing that if locations of blocks significantly depart from random—potentially leading to biased estimates—it is possible to apply more advanced, model-based methods of density estimation [20]. These methods can overcome the issue of non-random transect placement by using spatial covariates (e.g., habitat) to model animal abundance [21].
Another challenge with thermal drone surveys, especially under VLOS restriction, is the relatively small width of the surveyed transect strip. Assuming 10 cm as the minimum ground resolution needed to recognize an animal the size of a deer [8], the surveyed strip using the most common 640-pixel resolution camera is only about 64 m wide. This results in a small area coverage per kilometer of transect. Given the limited size of the sample blocks due to the VLOS rule and the necessity of maintaining sufficient distance between transects within the blocks to avoid double counting, it is difficult to design a survey plan with transects covering more than 10% of the study area. As shown by our results, in the case of low-density populations, this may not be enough to achieve an adequate sample size and thus the desired precision of the estimate. Increasing transect coverage by delineating additional sample blocks will often be impossible because of a lack of space within the study area, and it would also complicate the survey logistics. Therefore, the best solution to increase the sample size in the aerial survey under VLOS conditions is to increase the sampling effort by repeating surveys along the same transects. The results of our simulations show that for the low-density population, three survey repeats are required to obtain a CV of about 20%, a commonly acceptable level of precision for wildlife management purposes [13,22] (Figure 3b). Under BVLOS design, besides survey repeats, higher coverage can be achieved by simply decreasing transect spacing and adding additional transects. The distance between transects in the simulated BVLOS variant was 800 m; changing it to 267 m would triple the area coverage.
Both survey data analysis methods applied in the study—the ratio estimate and distance sampling—in general gave unbiased estimates of population density. Only in the case of the low-density population did we observe a tendency for distance sampling to overestimate density (Figure 3a). This might be caused by a small number of detections (mean 16, range 2 to 42) in simulated surveys of such a sparse population, insufficient to correctly model the detection probability function (uniform in this case). It is assumed that at least 60 observations are required to accurately model the detection function in distance sampling, and with smaller samples, the results should be treated with caution [15]. Comparing the precision of the two methods, we observed that distance sampling gave far less precise results than the ratio estimate (Figure 3b). Density estimates with a CV of about 20% from distance sampling were obtained only for the medium- and high-density populations, but it always required two or three survey repeats (Figure 3b). For the low-density population, acceptable CV values could not be obtained even with three repetitions. The lower precision of distance sampling estimates is caused by uncertainty in modeling the detection probability functions. In the case of the ratio estimates, values of CV equal to or below 20% were achieved for the medium- and high-density populations with minimal effort of one survey, and for the low-density population with three survey repeats (Figure 3b).
It should be pointed out that for the presented survey simulations, the distance analysis was in fact not quite adequate, as the generated detection data were independent of the distance to the transect line. Nevertheless, the purpose of using it was to demonstrate how a non-optimal choice of data analysis method affects the quality of the resulting estimates. The distance sampling method has a long history of use in traditional aerial surveys, where detections are made by a human observer and the detection probability drops with increasing distance from the transect line. The method is robust and has many sophisticated variants suitable for different scenarios (inclusion of covariates in the detection probability function, double observers, etc.) [23,24], and well-developed, free software for survey planning and analysis is available [16,25]. Thus, distance sampling is often a method of first choice for researchers analyzing data from aerial wildlife surveys, including surveys using thermal infrared sensing [26,27,28]. However, during such surveys, presence of the distance effect in detections underlying the method may depend on factors such as the camera mounting angle (vertical, forward, oblique), type and quality of the camera lenses, or method of image reviewing (i.e., visual or automatic). For example, in research using a vertically looking camera for deer surveys by Kissell and Nimmo [26], uniform detection models gave the best fit to the data, which suggests no or a very limited impact of distance on detection probability. Therefore, before choosing an analysis method, it is important to find convincing support for the distance-dependence of the detection probability in the approach used for data acquisition and treatment. If there is strong support for the presence of the distance effect, then the use of distance sampling is justified; otherwise, an alternative estimation method should be adopted.
In the simulations, we used several simplifications—we ignored the fact that ungulates usually occur in groups of various sizes, and we assumed that the true availability for detection is known. Such simplifications may lead to the over-optimistic evaluation of survey performance; however, they were used here to reduce the variability of density estimates due to factors other than survey design. Since the simplifications affected both of the compared designs in the same way, the differences in accuracy and precision caused solely by the design variant were made more distinct. In practice, the availability of animals for detection is usually unknown, unless surveys are conducted over open areas and at the times of their activity peaks. Not adjusting for imperfect availability for detection is an important source of bias; thus, the reliable assessment of the availability value is crucial to obtain accurate estimates of population density.
Simplifications used here must be avoided when simulations are used to assess the minimum effort—the total length of transects or number of survey repeats—needed to achieve a given level of precision in a survey of a specific population. In such cases, an attempt should be made to simulate the population in focus and survey conditions as closely as possible and account for all sources of possible errors [29]. Data available from previous surveys can be used to set a possible range of population densities and mean group sizes, while the remotely sensed data on land cover and tree-crown density may serve to estimate reasonable values of availability for detection. Simulations using realistic system parameters will ensure the selection of the best survey variants to achieve reliable estimates while minimizing survey costs [30].
5. Conclusions
Wildlife surveys with the use of drones are usually constrained by regulations limiting drone operations to visual line of sight. While the regulations complicate the logistics of surveys and may interfere with random survey design, the accuracy and precision of the derived population density estimates do not have to be compromised. Our results show that, in general, VLOS surveys can provide estimates of similar quality to those from spatially unrestricted randomized designs under BVLOS operations. However, in low-density populations, surveys under VLOS design are prone to bias if the applied survey effort is too small to provide adequate sample sizes. In such cases, increasing effort by repeating surveys along the same flight paths allows the reduction of the sampling variance and achieves unbiased estimates of population density. Comparing the precision of the two estimation methods used in the study, we observed that distance sampling gave far less precise results than the ratio estimate. Thus, unless there is strong evidence that the detection probability in drone surveys depends on distance, other estimation methods than distance sampling should be adopted. To ensure accurate and precise density estimates while minimizing survey costs, we recommend testing alternative survey designs with the aid of computer simulations.
Supplementary Materials
The following are available online at https://www.mdpi.com/2072-4292/13/6/1102/s1, Table S1: The details of ungulate thermal drone surveys conducted in hunting district nr 473 in Krotoszyn Forest District, Poland.
Author Contributions
Conceptualization, J.W. and S.P.; Formal analysis, J.W. and S.P.; Funding acquisition, J.W. and S.P.; Investigation, J.W. and S.P.; Methodology, J.W. and S.P.; Project administration, J.W.; Visualization, S.P.; Writing—original draft, J.W. and S.P.; Writing—review & editing, J.W. and S.P. All authors have read and agreed to the published version of the manuscript.
Funding
This research was funded by Narodowe Centrum Badań i Rozwoju (National Centre for Research and Development, Poland), grant number PBS3/B8/18/2015.
Data Availability Statement
The data presented in this study are available on request from the corresponding author.
Acknowledgments
We are grateful to two anonymous reviewers for their helpful comments on the manuscript.
Conflicts of Interest
The authors declare no conflict of interest.
References
- Putman, R.; Apollonio, M.; Andersen, R. (Eds.) Ungulate Management in Europe: Problems and Practices; Cambridge University Press: Cambridge, UK, 2011; p. x + 398. [Google Scholar]
- Morellet, N.; Klein, F.; Solberg, E.; Andersen, R. The census and management of populations of ungulates in Europe. In Ungulate Management in Europe: Problems and Practices; Apollonio, M., Andersen, R., Putman, R., Eds.; Cambridge University Press: Cambridge, UK, 2011; pp. 106–143. [Google Scholar]
- Ikeda, T.; Takahashi, H.; Igota, H.; Matsuura, Y.; Azumaya, M.; Yoshida, T.; Kaji, K. Effects of culling intensity on diel and seasonal activity patterns of sika deer (Cervus nippon). Sci. Rep. 2019, 9, 17205. [Google Scholar] [CrossRef] [PubMed]
- Ogurtsov, S.S.; Zheltukhin, A.S.; Kotlov, I.P. Daily activity patterns of large and medium-sized mammals based on camera traps data in the Central Forest Nature Reserve, Valdai Upland, Russia. Nat. Conserv. Res. 2018, 3, 68–88. [Google Scholar] [CrossRef] [Green Version]
- Stache, A.; Heller, E.; Hothorn, T.; Heurich, M. Activity patterns of European roe deer (Capreolus capreolus) are strongly influenced by individual behaviour. Folia Zool. 2013, 62, 67–75. [Google Scholar] [CrossRef]
- Beaver, J.T.; Baldwin, R.W.; Messinger, M.; Newbolt, C.H.; Ditchkoff, S.S.; Silman, M.R. Evaluating the use of drones equipped with thermal sensors as an effective method for estimating wildlife. Wildl. Soc. Bull. 2020, 44, 434–443. [Google Scholar] [CrossRef]
- Corcoran, E.; Denman, S.; Hanger, J.; Wilson, B.; Hamilton, G. Automated detection of koalas using low-level aerial surveillance and machine learning. Sci. Rep. 2019, 9, 3208. [Google Scholar] [CrossRef] [PubMed] [Green Version]
- Witczuk, J.; Pagacz, S.; Zmarz, A.; Cypel, M. Exploring the feasibility of unmanned aerial vehicles and thermal imaging for ungulate surveys in forests—preliminary results. Int. J. Remote Sens. 2018, 39, 5504–5521. [Google Scholar] [CrossRef]
- European Union Aviation Safety Agency. Easy Access Rules for Unmanned Aircraft Systems (Regulations (EU) 2019/947 and (EU) 2019/945). Available online: https://www.easa.europa.eu/document-library/easy-access-rules/online-publications/easy-access-rules-unmanned-aircraft-systems (accessed on 22 February 2021).
- Witczuk, J.; Pagacz, S. Wpływ cech populacji i środowiska na dokładność i precyzję wyników symulacji lotniczej inwentaryzacji zwierzyny [Effects of population and habitat characteristics on the accuracy and precision of wildlife aerial surveys results]. Sylwan 2020, 164, 560–567. [Google Scholar] [CrossRef]
- Bobek, B.; Merta, D.; Furtek, J.; Wojciuch-Płoskonka, M.; Kopeć, K.; Maślanka, J.; Ziobrowski, M. Ocena dynamiki liczebności i zagęszczenia populacji dzikich kopytnych przy użyciu różnych metod w czterech regionach Polski [Population dynamics of wild ungulates in various regions of Poland estimated by different methods]. Studia I Mater. Cepl. 2013, 15, 88–101. [Google Scholar]
- European Union. Copernicus Land Monitoring Service, European Environment Agency (EEA). Available online: https://land.copernicus.eu/pan-european/high-resolution-layers/forests/tree-cover-density (accessed on 22 February 2021).
- Krebs, C.J. Ecological Methodology; Benjamin Cummings: Menlo Park, CA, USA, 1999; p. xii + 620. [Google Scholar]
- Pierce, B.L.; Lopez, R.R.; Silvy, N.J. Estimating animal abundance. In The Wildlife Techniques Manual Research; Silvy, N.J., Ed.; The Johns Hopkins University Press: Baltimore, MD, USA, 2012; Volume 1, pp. 284–310. [Google Scholar]
- Buckland, S.T.; Anderson, D.R.; Burnham, K.P.; Laake, J.L.; Borchers, D.L.; Thomas, L. Introduction to Distance Sampling: Estimating Abundance of Biological Populations; Oxford University Press: Oxford, UK, 2001; p. xv + 432. [Google Scholar]
- Miller, D.L.; Rexstad, E.; Thomas, L.; Marshall, L.; Laake, J.L. Distance sampling in R. J. Stat. Softw. 2019, 89, 1–28. [Google Scholar] [CrossRef] [Green Version]
- R Core Team. R: A Language and Environment for Statistical Computing; R Foundation for Statistical Computing: Vienna, Austria, 2020. [Google Scholar]
- Marshall, L. DSsim: Distance Sampling Simulations. Available online: https://CRAN.R-project.org/package=DSsim (accessed on 16 November 2020).
- Anderson, K.; Gaston, K.J. Lightweight unmanned aerial vehicles will revolutionize spatial ecology. Front. Ecol. Env. 2013, 11, 138–146. [Google Scholar] [CrossRef] [Green Version]
- Borchers, D.L.; Buckland, S.T.; Zucchini, W. Estimating Animal Abundance: Closed Populations; Springer: London, UK, 2002; p. xiii + 314. [Google Scholar]
- Hedley, S.L.; Buckland, S.T. Spatial models for line transect sampling. J. Agric. Biol. Environ. Stat. 2004, 9, 181. [Google Scholar] [CrossRef] [Green Version]
- Skalski, J.R.; Ryding, K.E.; Millspaugh, J.J. Estimating population abundance. In Wildlife Demography; Skalski, J.R., Ryding, K.E., Millspaugh, J.J., Eds.; Academic Press: Burlington, NJ, USA, 2005; pp. 435–539. [Google Scholar]
- Buckland, S.T.; Anderson, D.R.; Burnham, K.P.; Laake, J.L.; Borchers, D.L.; Thomas, L. Advanced Distance Sampling. Estimating Abundance of Biological Populations; Oxford University Press: Oxford, UK, 2004; pp. xvii + 416. [Google Scholar]
- Buckland, S.T.; Rexstad, E.A.; Marques, T.A.; Oedekoven, C.S. Distance Sampling: Methods and Applications; Springer International Publishing: Cham, Switzerland, 2015; p. 292. [Google Scholar]
- Thomas, L.; Buckland, S.T.; Rexstad, E.A.; Laake, J.L.; Strindberg, S.; Hedley, S.L.; Bishop, J.R.B.; Marques, T.A.; Burnham, K.P. Distance software: Design and analysis of distance sampling surveys for estimating population size. J. Appl. Ecol. 2010, 47, 5–14. [Google Scholar] [CrossRef] [Green Version]
- Kissell, R.E.; Nimmo, S.K. A technique to estimate white-tailed deer Odocoileus virginianus density using vertical-looking infrared imagery. Wildl. Biol. 2011, 17, 85–92. [Google Scholar] [CrossRef] [Green Version]
- Lethbridge, M.; Stead, M.; Wells, C. Estimating kangaroo density by aerial survey: A comparison of thermal cameras with human observers. Wildl. Res. 2019, 46, 639–648. [Google Scholar] [CrossRef]
- Schoenecker, K.A.; Doherty, P.F., Jr.; Hourt, J.S.; Romero, J.P. Testing infrared camera surveys and distance analyses to estimate feral horse abundance in a known population. Wildl. Soc. Bull. 2018, 42, 452–459. [Google Scholar] [CrossRef]
- Brack, I.V.; Kindel, A.; Oliveira, L.F.B. Detection errors in wildlife abundance estimates from Unmanned Aerial Systems (UAS) surveys: Synthesis, solutions, and challenges. Methods Ecol. Evol. 2018, 9, 1864–1873. [Google Scholar] [CrossRef]
- Conn, P.B.; Moreland, E.E.; Regehr, E.V.; Richmond, E.L.; Cameron, M.F.; Boveng, P.L. Using simulation to evaluate wildlife survey designs: Polar bears and seals in the Chukchi Sea. R. Soc. Open Sci. 2016, 3, 150561. [Google Scholar] [CrossRef] [PubMed] [Green Version]
Figure 1.
The study area with density surface used to emulate uneven spatial distribution of individuals in the virtual populations.
Figure 1.
The study area with density surface used to emulate uneven spatial distribution of individuals in the virtual populations.

Figure 2.
Sample transects (gray lines) under (a) VLOS and (b) BVLOS flight variants with example realizations of a simulated survey of low-density population (two individuals per 100 ha, N = 168); open circles represent locations of undetected animals and filled circles represent locations of animals detected with probability p = 0.6.

Figure 3.
Pairwise comparison of (a) bias and (b) coefficient of variation distributions for population density estimates from simulated aerial surveys under VLOS and BVLOS design, in relation to different population densities, levels of survey effort, and methods of analysis. Dashed lines denote the desired level of bias (0%) and the acceptable value of the coefficient of variation (20%) for density estimates in wildlife management.

Publisher’s Note: MDPI stays neutral with regard to jurisdictional claims in published maps and institutional affiliations. |
© 2021 by the authors. Licensee MDPI, Basel, Switzerland. This article is an open access article distributed under the terms and conditions of the Creative Commons Attribution (CC BY) license (http://creativecommons.org/licenses/by/4.0/).
Share and Cite
MDPI and ACS Style
Witczuk, J.; Pagacz, S. Evaluating Alternative Flight Plans in Thermal Drone Wildlife Surveys—Simulation Study. Remote Sens. 2021, 13, 1102. https://doi.org/10.3390/rs13061102
AMA Style
Witczuk J, Pagacz S. Evaluating Alternative Flight Plans in Thermal Drone Wildlife Surveys—Simulation Study. Remote Sensing. 2021; 13(6):1102. https://doi.org/10.3390/rs13061102
Chicago/Turabian StyleWitczuk, Julia, and Stanisław Pagacz. 2021. "Evaluating Alternative Flight Plans in Thermal Drone Wildlife Surveys—Simulation Study" Remote Sensing 13, no. 6: 1102. https://doi.org/10.3390/rs13061102
Note that from the first issue of 2016, this journal uses article numbers instead of page numbers. See further details here.