
High Accuracy Interpolation of DEM Using Generative Adversarial Network


School of Geodesy and Geomatics, Wuhan University, Wuhan 430079, China
*
Author to whom correspondence should be addressed.
Remote Sens. 2021, 13(4), 676; https://doi.org/10.3390/rs13040676
Submission received: 21 December 2020
/
Revised: 29 January 2021
/
Accepted: 5 February 2021
/
Published: 13 February 2021
(This article belongs to the Special Issue Advanced Application of Artificial Intelligence and Machine Vision in Remote Sensing)
Abstract
:Digital elevation model (DEM) interpolation is aimed at predicting the elevation values of unobserved locations, given a series of collected points. Over the years, the traditional interpolation methods have been widely used but can easily lead to accuracy degradation. In recent years, generative adversarial networks (GANs) have been proven to be more efficient than the traditional methods. However, the interpolation accuracy is not guaranteed. In this paper, we propose a GAN-based network named gated and symmetric-dilated U-net GAN (GSUGAN) for improved DEM interpolation, which performs visibly and quantitatively better than the traditional methods and the conditional encoder-decoder GAN (CEDGAN). We also discuss combinations of new techniques in the generator. This shows that the gated convolution and symmetric dilated convolution structure perform slightly better. Furthermore, based on the performance of the different methods, it was concluded that the Convolutional Neural Network (CNN)-based method has an advantage in the quantitative accuracy but the GAN-based method can obtain a better visual quality, especially in complex terrains. In summary, in this paper, we propose a GAN-based network for improved DEM interpolation and we further illustrate the GAN-based method’s performance compared to that of the CNN-based method.

1. Introduction
A digital elevation model (DEM) is a digital representation of terrain surfaces. DEMs can provide accurate geographic information and, thus, play a crucial role in the related scientific research and practical applications such as mapping, hydrology, and meteorology. DEMs can be obtained from contour lines, topographic maps, field surveys, photogrammetry techniques, radar interferometry, and laser altimetry [1,2]. For all these techniques, interpolation is necessary to establish the values for all the terrain points. Different interpolation methods can result in different results, even when applied to the same source data. So, it is necessary to study the different interpolation methods and assess their suitability.
The interpolation technique is based on the principle of spatial autocorrelation or the assumption that the terrain surface is continuous and smooth [3,4,5]. Traditional interpolation methods can be classified in many ways including local/global, exact/approximate, and deterministic/geostatistical methods. Nevertheless, deterministic/geostatistical methods are the most widely used [6]. Deterministic interpolation methods create surfaces from measured points based on either the degree of similarity (e.g., natural neighbor (NN), inverse distance weighted (IDW)) or the degree of smoothing (e.g., radial basis functions (RBF)) [6]. The NN is based on Voronoi cells (Thiessen polygons) to find the closest samples and then calculate a weighted average as the value at the position by applying a different weight of each sample station according to the proportionate area [7]. This method keeps all interpolated values within the elevation range of samples. However, it cannot infer terrain trends and generate peaks, depressions, ridges, or valleys that the input sample has not yet represented. The IDW method is also a weighted average technique but uses the inverse of the distances between the sampling points and the required point to calculate the weighted average [8]. This method is susceptible to extreme values but can perform well when applied on uniformly distributed samples. The RBF methods are a series of exact interpolation algorithms that a surface must go through in each measured sample location [6,9]. This method is best suited for generating gently changing surfaces, and some researchers [9,10] consider it as the best interpolation method. Geostatistical interpolation methods (e.g., kriging [11]) are based on statistics and are used for more advanced prediction surface modelling, which includes error or uncertainty of prediction [12]. The kriging method considers the autocorrelation structure of the elevation to define the optimal weight and can perform better than IDW, especially when a good variogram model is available [3]. However, the kriging method requires a skilled user with knowledge of geostatistics and its processing speed limits its use in large-scale applications.
Although many studies [13,14] have concluded that these traditional interpolation methods work well in some cases, they tend to over-smooth the predicted space and still cannot totally explain the complex continuity and heterogeneity in geographical digital representation [15]. In recent years, deep learning has flourished, as it can extract the underlying patterns, even in the case of a complex spatial context. Single-frame image super-resolution reconstruction methods [16,17,18,19] have obtained superior performances in some indicators, and some of them have now been introduced into DEM interpolation and reconstruction. For example, Chen et al. [20] extended the super-resolution convolutional neural network (SRCNN) [16] to DEM scenes (D-SRCNN) and achieved more robust and accurate interpolation. The enhanced deep super-resolution network (EDSR) [19] is one of the methods that can acquire the highest reconstruction accuracy at present. Furthermore, Xu et al. [21] integrated gradient information into the EDSR network and acquired a higher-quality DEM by transfer learning, which, to some extent, overcomes the problems of the large dynamic range of elevation and the scarcity of training samples.
As a semi-supervised learning method, generative adversarial networks (GANs) are now very popular in the current deep learning field. While the regular, supervised CNN networks attempt to directly learn the mapping while being highly dependent on predetermined assumptions, the GAN-based networks are much more flexible, due to the incorporated unsupervised training. Goodfellow et al. [22] first learned from the noise distribution and created realistic-looking but fake images. Subsequent research included the conditional generative adversarial network (cGAN) [23], which formalizes the deterministic conditions as auxiliary features without spatial information. The cGAN approach has been used in a number of applications, such as image super-resolution [24] and terrain reconstruction [25]. However, only a few GAN-based studies have been devoted to DEM interpolation, to reduce the discrepancy between the DEM generation and the ground truth. For example, Zhu et al. [26] considered the workflow of spatial interpolation as a generative process. The spatial mode was reproduced realistically in this study, but the accuracy needed to be further improved. Gavriil et al. [27] also explored the potential of a GAN in describing the context of a DEM, but this approach is limited to restoring the missing regions in a DEM.
Depending on the method of DEM acquisition, the source distribution of the terrain points can be a regular grid or other irregular shapes. In this paper, we only considered the regular distribution. Study of this source distribution is meaningful because it is sometimes necessary to interpolate regular DEM raster data to establish the elevations of other grid sites. Furthermore, one of the methods discussed in this paper (EDSR) can only use grid-sampled images as input. For convenience, we did not further discuss these DEM interpolation methods in an irregular distribution situation.
In this paper, based on Zhu’s CEDGAN method [26] and Yu’s DeepFill v2 method [28], we propose a deep adversarial network for DEM interpolation. We also discuss some of the applied techniques and compare the GAN-based and CNN-based networks. This paper is organized as follows. Section 1 reviews the related research on image and DEM super-resolution/interpolation. Section 2 introduces the proposed method in detail. In Section 3, the experiments conducted in this study are described and analyzed. Finally, our conclusions and possible directions for future research are discussed in Section 4.
2. Materials and Methods
2.1. Generative Adversarial Networks
A GAN is a kind of framework for training a generative model via an adversarial process. It consists of two models: (1) a generative model G that captures the data distribution and (2) a discriminative model D that estimates the probability of a sample coming from the training data rather than G [22]. G and D are trained following a two-player minimax game by G minimizing θg and D maximizing θd. An objective function of this game can be denoted as:
where G minimizes θg to map vector z’s prior distribution Pz(z) to vector x’s distribution Pdata(x) and generates G(z). D maximizes θd to best distinguish the real data from fake samples (G(z)).
Originally, vector z is random noise and provides no additional information. So, the results generated by G are random and unpredictable, limiting the use of GANs in some fields. To extend GANs to a field such as super-resolution or style transfer, it can replace the noise with other conditions or apply these conditions to both G and D as auxiliary features. The objective function can then be formed as:
According to Mirza et al. (2014) [23], y represents the auxiliary vector. Furthermore, as GANs are difficult to train during the adversarial process, faster and more stable training is another optimization approach that can be attempted. For example, a popular way of stabilizing the training process is using the earth mover’s distance instead of Jensen–Shannon divergence [29], since the latter may result in vanishing gradients or mode collapse under certain unexpected situations. Miyato et al. [30] also showed that spectral normalization (SN) applied on the discriminator can achieve more efficient computation than a gradient penalty. Moreover, to extend this generation success to high-resolution data, some researchers have suggested the use of fully convolutional layers in the network architecture, which can bring simplicity, deeper models, flexibility in image resolution, and insight into what the GAN learns [27]. Adding dilated convolutions can take this one step further, bringing back an enhanced receptive field that was previously handled by fully connected layers [27].
2.2. CEDGAN
Zhu et al. [26] first formalized spatial interpolation as a generative task. Despite only consisting of a simple generator and a simple discriminator, this network easily outperforms the traditional IDW method, with a higher accuracy and faster speed. However, the generator has only six convolutional layers, which limits its receptive fields. Hence, the network is only valid for small images, such as 32 × 32 images, and interpolating large images such as 256 × 256 images can fail. Furthermore, the authors used binary cross-entropy (BCE) loss, which inputs only one value and judges whether it is true or false. This fixes the input image size under an unchanged discriminator structure. Therefore, the discriminator only accepts images of 32 × 32 in size. More recently, new techniques such as PatchGAN, different losses combinations, are more commonly adopted in building an adversarial structure. These techniques have been shown to be able to achieve superior performances [27,28,30,31]. We, therefore, think that these techniques could be used to enhance the existing GAN networks for DEM interpolation.
2.3. Model Architecture
By considering the spatial interpolation as a generative process, we proposed the use of an adversarial network for DEM interpolation. The proposed network was inspired by some recent image inpainting studies [27,28,32], and can also be considered as an adaptation of DeepFill v2 [28]. Compared to the CEDGAN method, more new techniques are applied, which contribute to making the network perform better. In the following, we introduce these related techniques and the proposed model architecture.
2.3.1. Gated Convolution
For the inpainting task, the proposed gated convolution [28] is formulated as shown in Equation (3). This convolution can learn a soft mask automatically from the data and can thus avoid some visual artifacts such as blurring and obvious edges, which are a problem in the free-form mask image inpainting tasks [28]. Unlike the super-resolution task, which involves downsampling the original image to a smaller size as the input, to test this convolution in the proposed interpolation network, we sampled the DEM at a certain interval, filled the rest with 0, and marked valid and invalid pixels with 0 and 1, respectively, to obtain a grid-shaped mask. We then built the generator structure according to the original image size.
2.3.2. Dilated Convolution Structure
Dilated convolution is very useful in deep networks, as it can preserve the data’s inner structure and enhance the receptive fields previously handled by other convolutional layers. In addition to the dilated convolution structure, which has only increasing dilations (2-4-8-16), as presented in DeepFill v2, we also tested first increasing and then decreasing dilations (2-4-8-8-4-2), as in [27]. According to Hamaguchi et al. [33], decreasing dilations can improve the local feature aggregation in remote sensing applications.
2.3.3. SN-PatchGAN and its Discriminative Loss
We used Yu’s discriminator, named SN-PatchGAN [28], which is enhanced by spectral normalization and PatchGAN. According to Miyato et al. [30], spectral normalization can make the discriminator’s training more stable. PatchGAN exports each point of the output map with the size of h × w × c (where h, w, and c are the generated feature map’s height, width, and channels, respectively), instead of one value. The different patches in an image can then be judged as true or false, instead of the whole image. This helps the network to focus on different locations and different semantics [34]. The discriminative loss is computed by Equation (4):
where Dsn represents the spectral-normalized discriminator, and G is the image interpolation network that takes the masked image z as the input. G(z) is the generated image x is the ground truth image.
2.3.4. The Proposed Generator’s Structure and its Loss
The proposed generator structure is presented in Figure 1. Compared to CEDGAN’s generator, the proposed structure had much deeper layers (more than 20), which greatly enlarged the receptive fields for high-resolution images. It is also an encoder-decoder structure, but more like U-Net [32], where applied skip-connections transfer un-downsampled feature maps in the encoder to the decoder, to avoid the information loss caused by downsampling and the gradient vanishing problem that accompanies deep layers. In our task, this structure was also more stable and easier to converge than the coarse-to-fine structure [28]. Most layers use a 3 × 3 convolutional layer, except for the first three layers. In the first three layers, we used 7 × 7 and 5 × 5 kernels to enlarge the receptive field size, which is necessary when an image with high resolution is received. The input of the encoder is a tensor with the size of 256 × 256 × 2, i.e., a DEM image obtained by fixed-position sampling and a binary mask describing the position to be interpolated. The encoder downsamples seven times with a stride of 2, with the aim being to extract multiple-scale feature maps from the sampled image. Dilated convolution layers were then adopted, to further enlarge the receptive field size and improve the local feature aggregation. Similarly, the tanh activation function was used for the output layer, and each convolutional layer used leakyRelu as the activation function. We did not use batch normalization layers since EDSR and DeepFill v2 do not use them, and it is believed that these layers may remove the range flexibility of the network and negatively affect the color coherence [21].
In Yu’s research [28], the generator loss was represented by adding adversarial loss to L1 distance loss, with the default loss balancing the hyperparameters as 1:1. As L1 loss directly compares the generated DEM with the ground truth, enlarging the L1 loss can make the generation better meet the requirements of our high-accuracy DEM interpolation task at the pixel level. Meanwhile, adversarial loss with a lower ratio reduces fake textures. We achieved this bidirectional adjustment by giving a ratio λ that was less than 1 to the adversarial loss, so the final generator loss was as Equation (5). (For further details see Github).
2.4. Data Description
We used the 1-m resolution USGS 3D Elevation Program (3DEP) DEMs in this experiment. Each DEM image has 10,000 × 10,000 cells, with an original accuracy of 3.04 m under a 95% confidence level. For the training and validation, three DEMs were selected as the raw data, whose elevations ranged from 1793 m to 2690 m, 222 m to 2102 m, and 1618 m to 2840 m, respectively. Without repetition, the DEMs were randomly cropped to 12,000 DEM tiles (256 × 256) in total, as ground truths, with 10,000 tiles for the training and 2000 for the validation. The elevation difference of each tile was calculated by subtracting the minimum elevation from the maximum elevation, and then the mean of elevation difference across all the tiles was calculated, represented with meanH. The meanH of the validation set was 129.278 m.
2.5. Evaluation Metrics
2.5.1. Quantitative Evaluation
For quantitative evaluation, the root-mean-square error (RMSE) was calculated in pixel level. In addition to the average elevation error (Eelevation, Equation (11)) across tiles, the average slope error (Eslope, Equation (12)) was also computed since DEM errors affect terrain factors. All the generated values can be mapped back to their original elevation range by Equation (6). Eelevation is calculated using the mapped elevations, and so is the slope (Equations (8)– (10)).
where Hmax and Hmin are the true maximum and minimum elevation values in each DEM tile, H represents the true or mapped elevation from the generator’s output, and HG is the normalized elevation for the generator’s input or the elevation generated by the generator. Figure 2 shows the relative locations of the elements in Equations (8)–(9). Slope is calculated by Equation (10), where the variable Slopewe (Equation (8)) denotes the slope in the horizontal direction and the Slopesn (Equation (9)) denotes slope in the vertical direction slope [34]. Slope is measured in degrees. Cellsize represents DEM’s resolution (in meters). Equations (11) and (12) compute the RMSE of the elevation and slope, respectively, where n represents the tile’s pixels, “true” represents the ground true DEM image, and “fake” represents the interpolated DEM image.
2.5.2. Visual Evaluation
In this study, interpolated result’s degree of smoothing to the ground truth’s is the main indicator for judging visual quality. The smoothness is measured by roughness (Equation (13), [35]). The term roughness has been used in different ways to depict a surface property [36]. It is a good visual variable since it is terrain complexity or a measure of topographic texture [37]. Large roughness value often indicates small smoothness. To conform to the human’s overall visual perception, we compared tiles’ average roughness instead of the roughness at the pixel level for visual evaluation. Tile’s roughness and the roughness difference between the ground truth and the generated results are calculated by Equations (14) and (15), respectively.
3. Results
3.1. Training and Validation
In this section, we introduce the training and validation procedure, and compare some other methods with the proposed method.
The operating system used for the experiments was Windows 10, the central processing unit (CPU) was an Intel i9 7980XE, and the graphics processing unit (GPU) was a GeForce RTX 2080 Ti. For stable and efficient training, we normalized each tile linearly to [−1,1] by Equation (7). The downsampled DEM images were uniformly sampled from 7225 locations from the ground truth and filled with zeros in other locations; so they were still of 256 × 256 in size. Since gated convolution was computed on vectors including masks, the downsampled DEM images were then concatenated with binary masks as the input, where the binary masks marked the locations to be interpolated. G and D were synchronously updated by the Adam optimizer with the same initial learning rate of 10 × 10−4, where β1 and β2 were 0.5 and 0.999, respectively. The batch size was 16. The learning rates were the default rates in DeepFill v2, as we found that a lower learning rate made little contribution to improving the accuracy but slowed down the convergence. Intuitively, we set λ as 0.05, as we found during the training that the backpropagation gradient of the adversarial loss was about 20 times more than that of the L1 distance loss.
Generators with different combinations (GSUGAN, gated and increase-dilated U-net GAN (GIUGAN), vanilla and symmetric-dilated U-net GAN (VSUGAN)) of convolutions (vanilla or gated) with a dilated convolution structure (2-4-8-16 or 2-4-8-8-4-2) were trained. As Figure 3 shows, gated convolution had a negligible influence on the convergence speed of the training or the accuracy in terms of the L1 distance. This may be because vanilla convolution can already capture the spatial structure of the grid type well, while gated convolution has a greater advantage in the free-form structure situation, as demonstrated by DeepFill v2. Figure 3 shows symmetric dilation also had a negligible influence on the convergence speed and the accuracy. The elevation and slope errors listed in Table 1 indicate that the gated convolution and symmetric dilated structure combination did obtain a slightly higher accuracy than the other two combinations, but such small improvements may be insignificant in some practical applications. In Figure 4, we have enlarged some regions for analysis. As we can see, generally, the generated results with less smoothness seem more similar to the ground truths and DR values that close to zeros reveal this well, which we considered the results that obtained better visual quality. Clearly, (1)(e)–(1)(g) and (3)(e)–(3)(g) show that textures generated by these combinations were a little different to each other. When (3)(e) and (3)(g) were compared with (3)(f), this indicated that the symmetric dilated structure prevented the production of more fake textures. Although these textures all look fake when compared to the ground truth, to different extents, overall, the results generated by the gated convolution and symmetric dilated structure had the closest complexity to the ground truths (see especially (g) in Figure 4, and DR values in Table 1).
In addition to IDW and CEDGAN, as a CNN-based network, EDSR was also compared. The distance decay parameter of IDW was set to 2. For the EDSR training, the input DEM images were of 85 × 85 pixels, uniformly sampled from the original DEM tiles. The learning rate was 10 × 10−4. For the CEDGAN training, to make sure that the structure of the discriminator did not change, we had to crop the 256 × 256 tiles to 32 × 32 for training, the same size as the input’s for CEDGAN in [26]. As in Section 2.2, we analyzed that the discriminator only accepted 32 × 32 for training. For the validation, we also cropped the 256 × 256 tiles to 32 × 32, with an 8 × 8 pixel overlap, and concatenated them to 256 × 256 for a fairer comparison, since we found that inputting the 256 × 256 size image tiles led to extremely high errors. The reason for this is that the limited convolutional layers of the generator limited its receptive field for bigger images. As can be seen in Table 1, all the deep learning-based methods outperformed the traditional IDW method in terms of elevation and slope errors. Although the proposed methods obtained a similar elevation interpolation accuracy to CEDGAN, they did achieve a higher slope accuracy. Compared to the GAN-based methods, it was concluded that EDSR took an overwhelming advantage in quantitative quality. The main reason was that GAN including a discriminator can always produce some new textures and, thus, increase the interpolation uncertainty at the pixel level.
To demonstrate visual quality of different methods, some cases are visualized in Figure 4. Firstly, as can be seen, CEDGAN’s results always had bigger positive DR values, while the proposed methods’ had negative ones, which indicates that CEDGAN generated more complex textures than the ground truth and the proposed methods. Especially, (1)(d) was too “abundant” to look real, and (1)(e)-(1)(g) produced by the proposed methods were more similar to the ground truth. We attributed this to the L1 loss supervising the training of the generator, which traded off some of the adversarial loss’s creativity and made it possible to keep the generation consistent with the ground truth at the pixel level. Then, since CEDGAN’s generator was not deep and, thus, only accepted a small size for input, there was not enough contextual information to infer the correct distribution. This led to awful interpolations in some local areas (see Figure 4 (3)d, the region in the top of (3)d is extremely bad). Furthermore, unlike the CNN-based methods, only backpropagating the L1 loss or L2 loss between the generation and the ground truth directly, the adversarial network judged the result indirectly by the discriminator loss and, due to this, the network had the potential to create new textures that may not exist in the low-resolution images. As a result (see especially (3)d in Figure 4, in which EDSR’s result looks smoother than others’), both these adversarial methods supplemented more details than EDSR, even though the details may not have been exactly the same as the ground truth. This signified that, although the generative adversarial methods performed modestly in the quantitative evaluation, they can supplement more details than the CNN-based methods and go further in avoiding over-smoothing, which is a compromise between the quantitative accuracy and visual quality.
3.2. Potentials
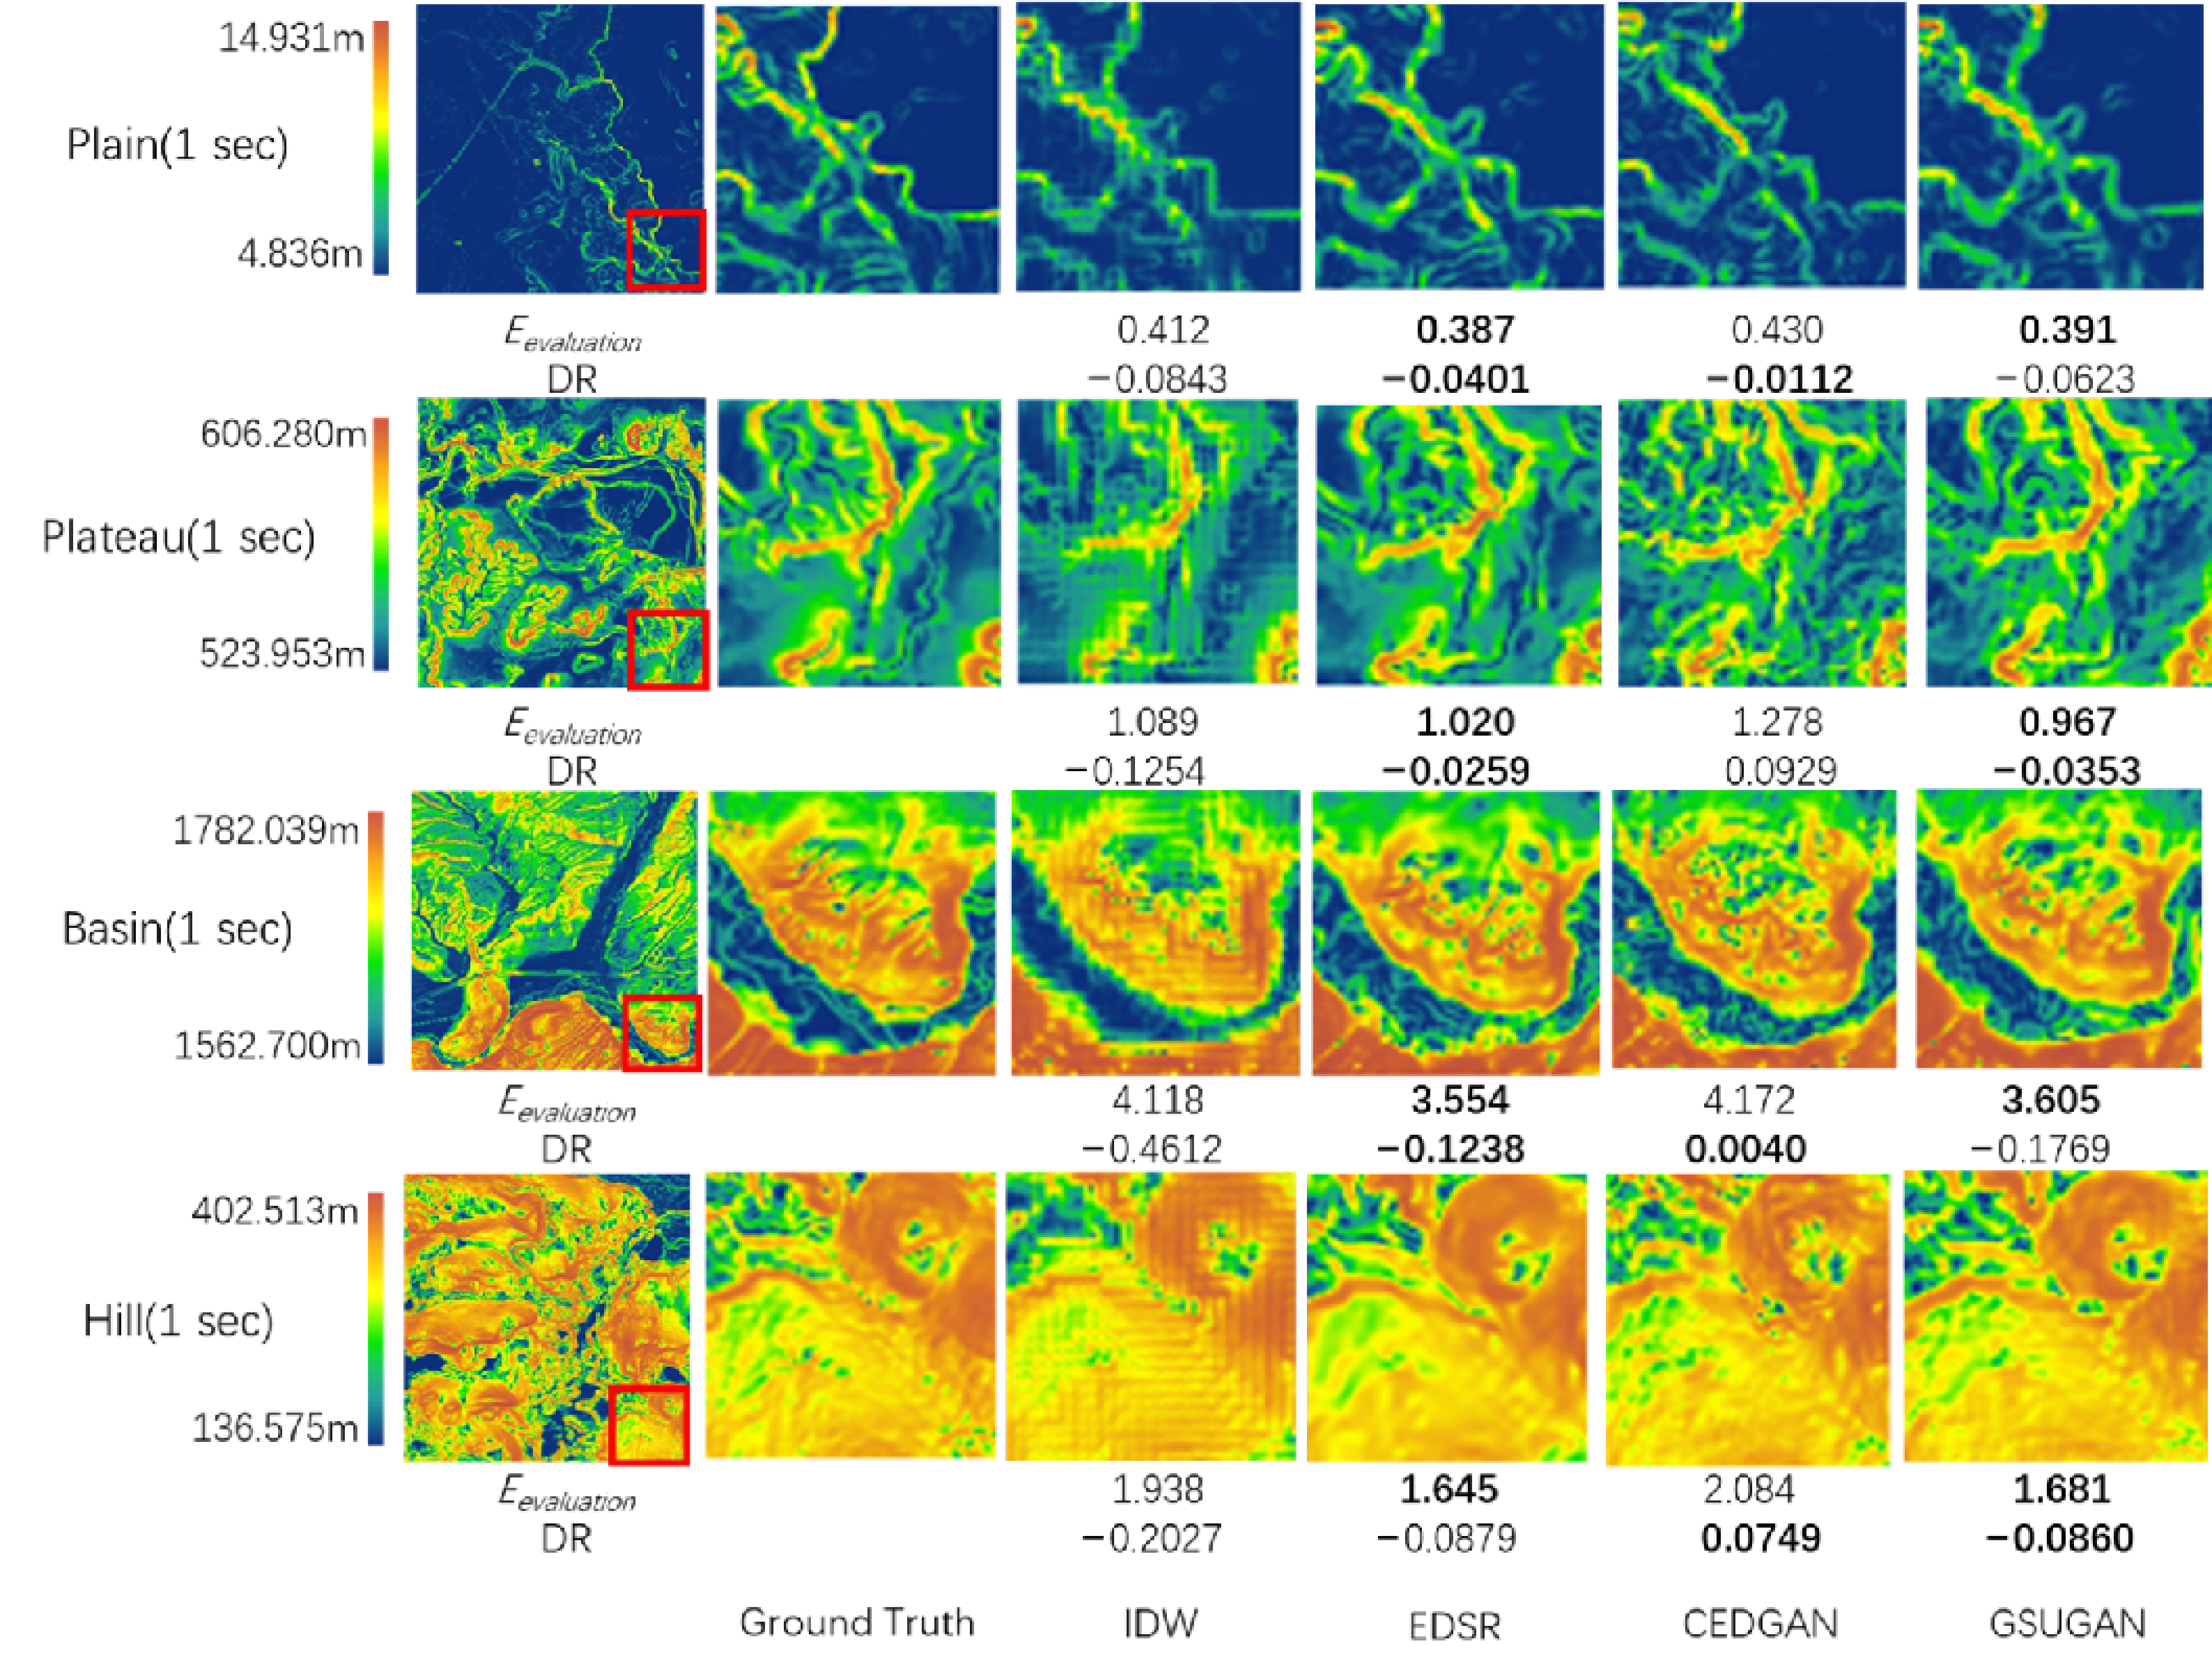
Without any parameter fine-tuning, we applied the best pretrained combination, i.e., GSUGAN and the pretrained models of the other methods on four typical terrain cases, to test their generalization capability, with the terrains being located in quite different places from where the terrain of the validation set was located. For DEMs with three different resolutions of 1 m, 1/3 s (around 10 m), and 1 s (around 30 m) being all available, DEMs of the Atlantic Plain, the Edwards Plateau, the Great Basin, and Hampshire Hill in the US were chosen to split to 256 × 256-size tiles as the ground truths. DEM images of different resolutions with the same terrain type and image size were picked near the same geographical positions, which meant that the DEM with a lower resolution included a larger geographical scope than the higher-resolution DEM. These original images were randomly cropped to 1000 tiles, with these tiles’ average meanH and average slope values listed in Table 2. The terrain relief can be reflected by these two values. In addition, DR, tiles’ average Eelevation and average Eslope values were obtained for comparing the different interpolation methods (Big DR values are bold)
Comparisons of the different methods are presented in Table 2 and Figure 5. As mentioned above, the terrains with a lower resolution included a wider geographical scope. In Table 2, it can be seen that the lower the resolution, the more dynamic the elevation range. In general, the elevation interpolation accuracy and slope accuracy of all the methods decreased when the elevation difference and the slope increased. The different methods all showed no significant difference in flat areas such as plains. When the terrain rose and fell dynamically, as in the Great Basin, both the elevation and slope errors reached their maximums. Therefore, the terrain relief instead of the resolution is the main factor influencing the interpolation ability of these methods. Taking IDW as the baseline, Table 2 shows CEDGAN had almost no advantage, while EDSR still obtained the highest accuracy on the different kinds of terrains, and the proposed method still performed modestly. However, Figure 5 also shows that in some cases of basin and hill, GSUGAN led to quite close elevation errors to EDSR. There is, thus, a possibility that the proposed method and EDSR may have comparable accuracy in complex terrains.
Table 2 shows that CEDGAN has always obtained positive DR values. It indicates that in all terrains, CEDGAN tends to generate more complex textures. DR values in Table 2 and the Plain visualization in Figure 5 also demonstrate that, in plain terrains, CEDGAN and EDSR produced quite better visual quality than the proposed method. However, the two GAN-based methods had their advantages when it came to complex terrains, like basin and hill, which may contain a lot of discontinuities. Especially, Great Basin with 1-sec resolution was the most complex terrain in our experiment. GSUGAN performed quite best in this terrain. Based on plenty of statistics, it was concluded that the proposed method interpolates complex terrains with best visual quality.
4. Conclusions
GANs have been proven to be more efficient than the traditional methods, as they can supplement more local details and avoid over-smoothing the predicted space. In this study, inspired by recent techniques in GANs and CEDGAN, we reconstructed parts of DeepFill v2 to interpolate a DEM with a higher accuracy, which performs visibly and quantitatively better than the traditional methods and CEDGAN. It can be seen as further proof of the viability of the deep generative models in the context of a DEM [26,27]. Furthermore, we demonstrated the use of the classical enhanced deep super-resolution (EDSR) method on the same data set. Based on the performance of the different methods, it was concluded that the CNN-based method has an advantage in the quantitative accuracy, but the GAN-based method can obtain a better visual quality especially in complex terrains.
We discussed some new techniques applied in GANs for DEM interpolation. It was concluded that gated convolution is not very essential in grid-shaped spatial prediction, although it does get little higher accuracy than vallina convolution. Building an appropriate dilated convolution structure can contribute to reducing the artifacts generated by the GAN. By adding L1 loss to the generator loss as a constraint, the GAN method can perform better at the pixel level and can reduce fake texture generation. Integrating different losses such as adversarial loss and L1 loss can also break the constraints of human perception existing in the CNN-based models [38], for which these constraints require further investigation in the future.
However, the parameters in the proposed network may be redundant. So, in our future work, we will attempt to reduce the parameters and build a more elegant structure, while maintaining the performance. Meanwhile, we will undertake more research on improving the method’s interpolation accuracy to be as high as the accuracy of the CNN-based methods. In addition, the noise existing in DEM data will be taken into account, and the network will also be adjusted so that it can adapt to different scale factors.
Author Contributions
Conceptualization, L.Y. and Y.Z.; methodology, L.Y. and Y.Z.; validation, X.T.; formal analysis, X.T.; writing—original draft preparation, X.T.; writing—review and editing, Y.Z. and X.T.; project administration, L.Y.; funding acquisition, L.Y.. All authors have read and agreed to the published version of the manuscript.
Funding
This study was supported by National Key Research and Development Project (2020YFD1100203).
Informed Consent Statement
Informed consent was obtained from all subjects involved in the study.
Data Availability Statement
No new data were created or analyzed in this study. Data sharing is not applicable to this article.
Acknowledgments
A publicly available GitHub repository was adapted for our experiments [28].
Conflicts of Interest
The authors declare no conflict of interest.
References
- Peralvo, M.; Maidment, D. Influence of DEM interpolation methods in drainage analysis. Gis Hydro 2004, 4. [Google Scholar]
- Nelson, A.; Reuter, H.; Gessler, P. DEM production methods and sources. Dev. Soil Sci. 2009, 33, 65–85. [Google Scholar]
- Arun, P.V. A comparative analysis of different DEM interpolation methods. Egypt. J. Remote Sens. Space Sci. 2013, 16, 133–139. [Google Scholar]
- Li, Z.; Zhu, C.; Gold, C. Digital Terrain Modeling: Principles and Methodology; CRC Press: Boca Raton, FL, USA, 2004. [Google Scholar]
- Mitas, L.; Mitasova, H. Spatial interpolation. Geogr. Inf. Syst. Princ. Tech. Manag. Appl. 1999, 1. [Google Scholar]
- Erdogan, S. A comparision of interpolation methods for producing digital elevation models at the field scale. Earth Surf. Process. Landf. 2009, 34, 366–376. [Google Scholar] [CrossRef]
- Habib, M. Evaluation of DEM interpolation techniques for characterizing terrain roughness. CATENA 2021, 198, 105072. [Google Scholar] [CrossRef]
- Pizor, P.J. Principles of Geographical Information Systems for Land Resources Assessment. Soil Sci. 1987, 144, 306. [Google Scholar] [CrossRef]
- Aguilar, F.J.; Agüera, F.; Aguilar, M.A.; Carvajal, F. Effects of Terrain Morphology, Sampling Density, and Interpolation Methods on Grid DEM Accuracy. Photogramm. Eng. Remote Sens. 2005, 71, 805–816. [Google Scholar] [CrossRef] [Green Version]
- Desmet, P.J.J. Effects of Interpolation Errors on the Analysis of DEMs. Earth Surf. Process. Landf. 1997, 22, 563. [Google Scholar] [CrossRef]
- Cressie, N. The origins of kriging. Math. Geol. 1990, 22, 239–252. [Google Scholar] [CrossRef]
- Gong, J.; Li, Z.; Zhu, Q.; Sui, H.; Zhou, Y. Effects of various factors on the accuracy of DEMs: An intensive experimental investigation. Photogramm. Eng. Remote Sens. 2000, 66, 1113–1117. [Google Scholar]
- Chaplot, V.; Darboux, F.d.r.; Bourennane, H.; Leguédois, S.; Silvera, N.; Phachomphon, K. Accuracy of interpolation techniques for the derivation of digital elevation models in relation to landform types and data density. Geomorphology 2006, 77, 126–141. [Google Scholar] [CrossRef]
- Habib, A.; Khoshelham, K.; Akdim, N.; El Ghandour, F.-e.; Labbassi, K.; Menenti, M. Impact of spatial resolution, interpolation and filtering algorithms on DEM accuracy for geomorphometric research: A case study from Sahel-Doukkala, Morocco. Model. Earth Syst. Environ. 2018, 4, 1537–1554. [Google Scholar] [CrossRef]
- Zhu, D.; Huang, Z.; Shi, L.; Wu, L.; Liu, Y. Inferring spatial interaction patterns from sequential snapshots of spatial distributions. Int. J. Geogr. Inf. Sci. 2018, 32, 783–805. [Google Scholar] [CrossRef]
- Dong, C.; Loy, C.C.; He, K.; Tang, X. Image super-resolution using deep convolutional networks. IEEE Trans. Pattern Anal. Mach. Intell. 2015, 38, 295–307. [Google Scholar] [CrossRef] [PubMed] [Green Version]
- Kim, J.; Kwon Lee, J.; Mu Lee, K. Accurate Image Super-resolution Using Very Deep Convolutional Networks. In Proceedings of the IEEE Conference on Computer Vision and Pattern Recognition, Las Vegas, NV, USA, 26 June–1 July 2016; IEEE: Piscataway, NY, USA, 2016; pp. 1646–1654. [Google Scholar]
- Shi, W.; Caballero, J.; Huszár, F.; Totz, J.; Aitken, A.P.; Bishop, R.; Rueckert, D.; Wang, Z. Real-time Single Image and Video Super-resolution Using an Efficient Sub-pixel Convolutional Neural Network. In Proceedings of the IEEE Conference on Computer Vision and Pattern Recognition, Las Vegas, NV, USA, 26 June–1 July 2016; IEEE: Piscataway, NY, USA, 2016; pp. 1874–1883. [Google Scholar]
- Lim, B.; Son, S.; Kim, H.; Nah, S.; Mu Lee, K. Enhanced Deep Residual Networks for Single Image Super-resolution. In Proceedings of the IEEE Conference on Computer Vision and Pattern Recognition Workshops, Las Vegas, NV, USA, 26 June–1 July 2016; IEEE: Piscataway, NY, USA, 2016; pp. 136–144. [Google Scholar]
- Chen, Z.; Wang, X.; Xu, Z. Convolutional Neural Network Based Dem Super Resolution. In Proceedings of the The International Archives of the Photogrammetry, Remote Sensing and Spatial Information Sciences, 2016 XXIII ISPRS Congress, Prague, Czech Republic, 12–19 July 2016; Volume XLI-B3. [Google Scholar]
- Xu, Z.; Chen, Z.; Yi, W.; Gui, Q.; Hou, W.; Ding, M. Deep gradient prior network for DEM super-resolution: Transfer learning from image to DEM. ISPRS J. Photogramm. Remote Sens. 2019, 150, 80–90. [Google Scholar] [CrossRef]
- Goodfellow, I.J.; Pouget-Abadie, J.; Mirza, M.; Xu, B.; Warde-Farley, D.; Ozair, S.; Courville, A.; Bengio, Y. Generative Adversarial Nets. In Proceedings of the 27th International Conference on Neural Information Processing Systems, Montreal, QC, Canada, 8–13 December 2014; Volume 2, pp. 2672–2680. [Google Scholar]
- Mirza, M.; Osindero, S. Conditional Generative Adversarial Nets. arXiv 2014, arXiv:1411.1784. [Google Scholar]
- Ledig, C.; Theis, L.; Huszar, F.; Caballero, J.; Cunningham, A.; Acosta, A.; Aitken, A.; Tejani, A.; Totz, J.; Wang, Z.; et al. Photo-Realistic Single Image Super-Resolution Using a Generative Adversarial Network. arXiv 2016, arXiv:1609.04802. [Google Scholar]
- Guérin, É.; Digne, J.; Galin, É.; Peytavie, A.; Wolf, C.; Benes, B.; Martinez, B.t. Interactive example-based terrain authoring with conditional generative adversarial networks. ACM Trans. Graph. 2017, 36, 228. [Google Scholar] [CrossRef] [Green Version]
- Zhu, D.; Cheng, X.; Zhang, F.; Yao, X.; Gao, Y.; Liu, Y. Spatial interpolation using conditional generative adversarial neural networks. Int. J. Geogr. Inf. Sci. 2020, 34, 735–758. [Google Scholar] [CrossRef]
- Gavriil, K.; Muntingh, G.; Barrowclough, O.J.D. Void Filling of Digital Elevation Models With Deep Generative Models. IEEE Geosci. Remote Sens. Lett. 2019, 16, 1645. [Google Scholar] [CrossRef]
- Yu, J.; Lin, Z.; Yang, J.; Shen, X.; Lu, X.; Huang, T. Free-Form Image Inpainting with Gated Convolution. arXiv 2018, arXiv:1806.03589. [Google Scholar]
- Arjovsky, M.; Chintala, S.; Bottou, L.o. Wasserstein Generative Adversarial Networks. In Proceedings of the 34th International Conference on Machine Learning, Sydney, NSW, Australia, 6–11 August 2017; Volume 70, pp. 214–223. [Google Scholar]
- Miyato, T.; Kataoka, T.; Koyama, M.; Yoshida, Y. Spectral Normalization for Generative Adversarial Networks. arXiv 2018, arXiv:1802.05957. [Google Scholar]
- Isola, P.; Zhu, J.-Y.; Zhou, T.; Efros, A.A. Image-to-Image Translation with Conditional Adversarial Networks. arXiv 2016, arXiv:1611.07004. [Google Scholar]
- Jo, Y.; Park, J. SC-FEGAN: Face Editing Generative Adversarial Network with User’s Sketch and Color. arXiv 2019, arXiv:1902.06838. [Google Scholar]
- Hamaguchi, R.; Fujita, A.; Nemoto, K.; Imaizumi, T.; Hikosaka, S. Effective Use of Dilated Convolutions for Segmenting Small Object Instances in Remote Sensing Imagery. arXiv 2017, arXiv:1709.00179. [Google Scholar]
- Horn, B.K.P. Hill shading and the reflectance map. Proc. IEEE 1981, 69, 14–47. [Google Scholar] [CrossRef] [Green Version]
- Shepard, M.K.; Campbell, B.A.; Bulmer, M.H.; Farr, T.G.; Gaddis, L.R.; Plaut, J.J. The roughness of natural terrain: A planetary and remote sensing perspective. J. Geophys. Res. Planets 2001, 106, 32777–32795. [Google Scholar] [CrossRef]
- Smith, M.W. Roughness in the Earth Sciences. Earth-Sci. Rev. 2014, 136, 202–225. [Google Scholar] [CrossRef]
- Riley, S.; Degloria, S.; Elliot, S.D. A Terrain Ruggedness Index that Quantifies Topographic Heterogeneity. Int. J. Sci. 1999, 5, 23–27. [Google Scholar]
- Ha, V.K.; Ren, J.-C.; Xu, X.-Y.; Zhao, S.; Xie, G.; Masero, V.; Hussain, A. Deep Learning Based Single Image Super-resolution: A Survey. Int. J. Autom. Comput. 2019, 16, 413–426. [Google Scholar] [CrossRef]
Figure 1.
Generator’s structure. In this figure, “c64k7s2” means there are 64 channels, kernel size with 7, and stride with 2 in this convolutional layer. The ”deconv” is a deconvolution layer. Number in “2-4-8-16/2-4-8-8-4-2” means different dilation rate.
Figure 1.
Generator’s structure. In this figure, “c64k7s2” means there are 64 channels, kernel size with 7, and stride with 2 in this convolutional layer. The ”deconv” is a deconvolution layer. Number in “2-4-8-16/2-4-8-8-4-2” means different dilation rate.

Figure 2.
Moving window for slope and roughness computation. In this figure, e1~e9 represent the elevation values on the Digital Elevation Model (DEM) image.
Figure 2.
Moving window for slope and roughness computation. In this figure, e1~e9 represent the elevation values on the Digital Elevation Model (DEM) image.
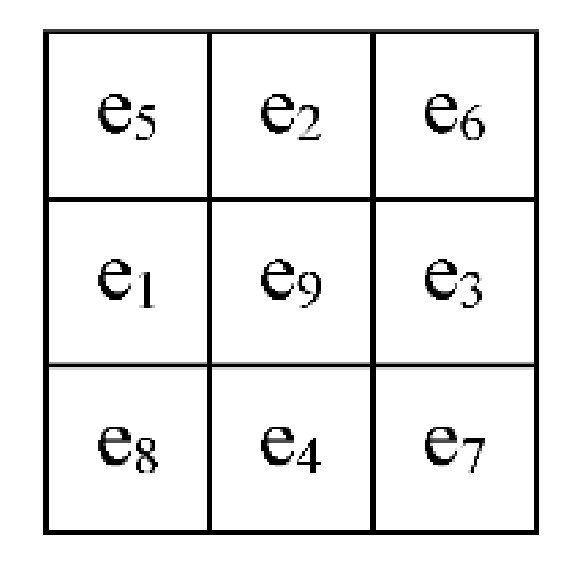
Figure 3.
Training set’s average L1 loss among epochs of different combinations (convolutions (vanilla or gated) and dilation convolution structure (2-4-8-8-4-2 or 2-4-8-16)) during the training procedure.
Figure 3.
Training set’s average L1 loss among epochs of different combinations (convolutions (vanilla or gated) and dilation convolution structure (2-4-8-8-4-2 or 2-4-8-16)) during the training procedure.
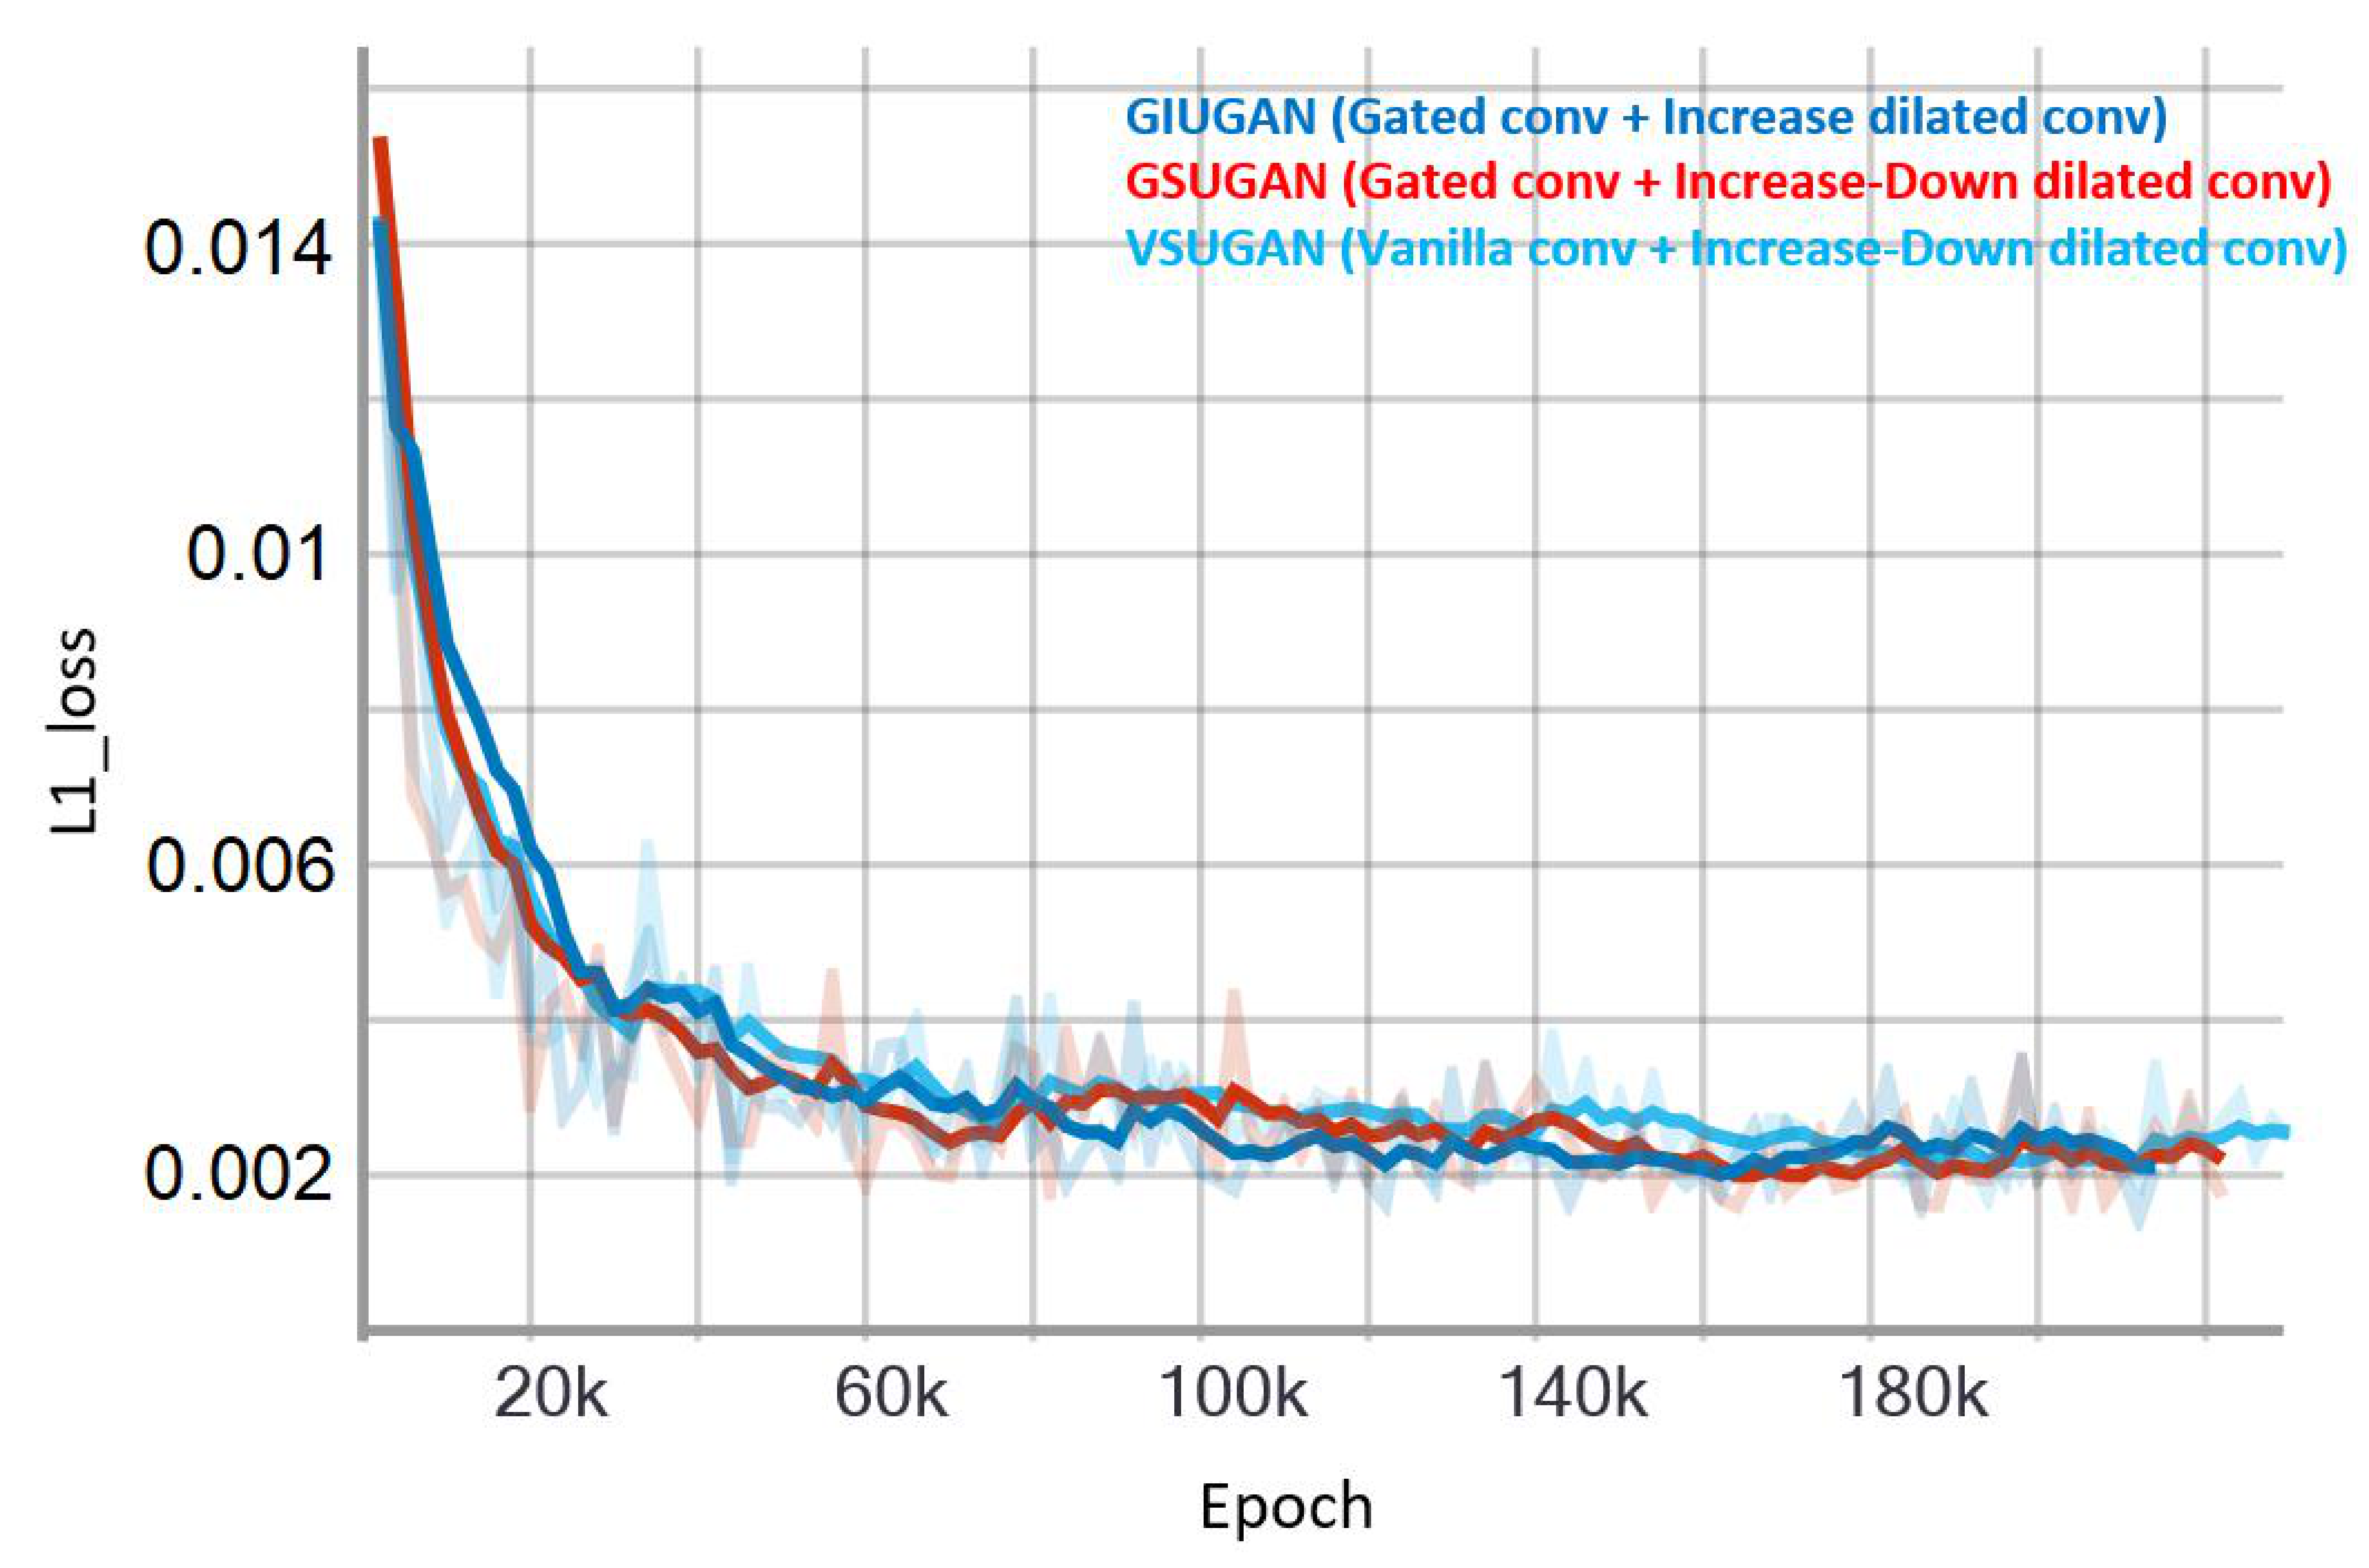
Figure 4.
Visualization of different methods’ results. In this figure, (A) Ground Truth, (B) inverse distance weighted (IDW), (C) enhanced deep super-resolution network (EDSR), (D) conditional encoder-decoder GAN (CEDGAN), (E) VSUGAN (Vanilla conv + Increase-Down dilated conv), (F) GIUGAN (Gated conv + Increase dilated conv), (G) GSUGAN (Gated conv + Increase-Down dilated conv). (A–G) are elevation maps with 256 × 256 cells and (a–g) in (1)–(3) are enlarged regions marked by rectangles above. Warmer colors label higher elevation values. It can been seen that instead of small elevation errors, closer-to-zero DR values reveal better visual quality.
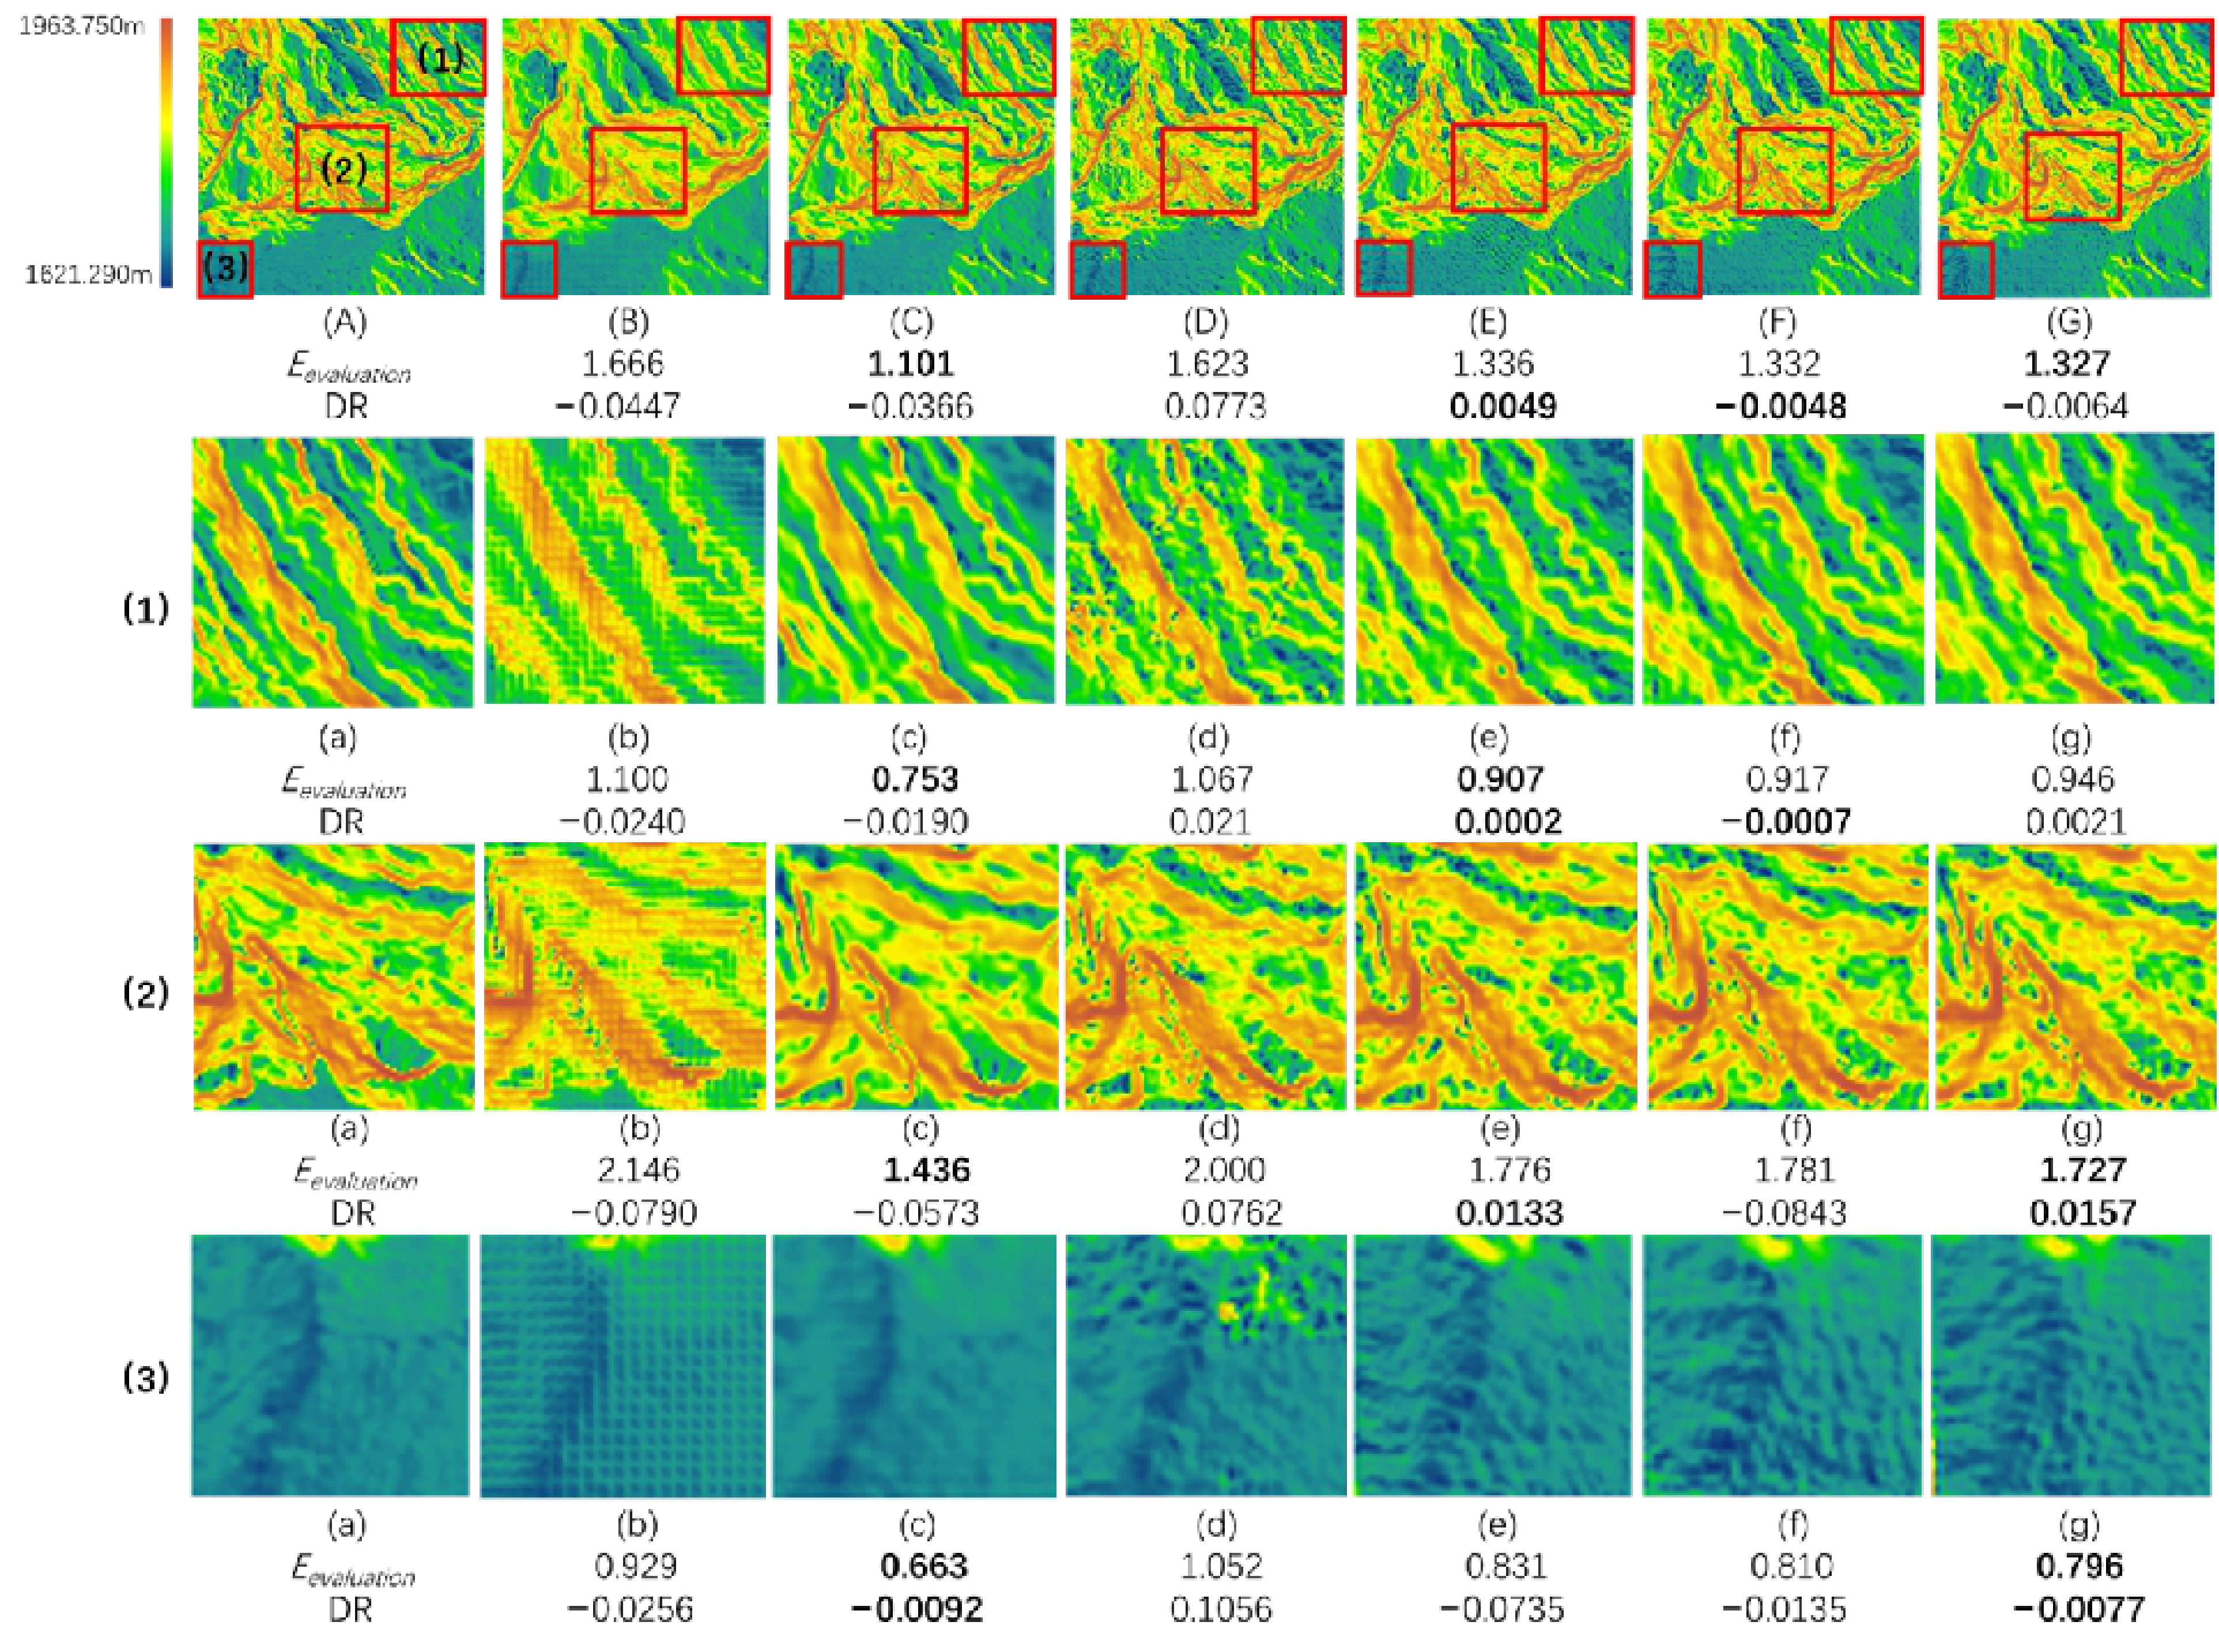
Figure 5.
Visualization of terrains for different methods. In this figure, four different methods’ performances on four kinds of terrains are visualized by enlarging some regions. Generative adversarial networks (GANs’) results show more detail information, especially in complicated terrains.
Figure 5.
Visualization of terrains for different methods. In this figure, four different methods’ performances on four kinds of terrains are visualized by enlarging some regions. Generative adversarial networks (GANs’) results show more detail information, especially in complicated terrains.

Table 1.
Elevation’s and Slope’s root-mean-square error (RMSEs) and DRs of Different Methods on Validation Set.
Table 1.
Elevation’s and Slope’s root-mean-square error (RMSEs) and DRs of Different Methods on Validation Set.
| Methods | Eelevation | Eslope | DR |
|---|---|---|---|
| IDW | 0.186 | 3.389 | −0.0025 |
| EDSR [19] | 0.088 | 1.842 | −0.0032 |
| CEDGAN [26] | 0.168 | 3.345 | 0.0058 |
| VSUGAN (Vanilla conv + Increase-Down dilated conv) | 0.176 | 2.825 | 0.0030 |
| GIUGAN (Gated conv + Increase dilated conv) | 0.165 | 2.877 | 0.0018 |
| GSUGAN (Gated conv + Increase-Down dilated conv) | 0.153 | 2.710 | 0.0005 |
Table 2.
Generalization performances of different methods on external data set.
| Terrain | Resolution | Meanh | Eelevation | Slope | Eslope | DR | ||||||||||
|---|---|---|---|---|---|---|---|---|---|---|---|---|---|---|---|---|
| IDW | ESDR | CEDGAN | GSUGAN | IDW | ESDR | CEDGAN | GSUGAN | IDW | ESDR | CEDGAN | GSUGAN | |||||
| Plain | 1 m | 2.283 | 0.055 | 0.055 | 0.070 | 0.052 | 3.1844 | 1.888 | 1.567 | 1.795 | 1.598 | 0.0342 | −0.0160 | −0.0068 | 0.0015 | −0.0105 |
| 1/3 s | 9.260 | 0.135 | 0.125 | 0.160 | 0.134 | 0.954 | 0.436 | 0.386 | 0.466 | 0.421 | 0.0812 | −0.0234 | −0.0094 | 0.0025 | −0.0111 | |
| 1 s | 15.034 | 0.298 | 0.268 | 0.338 | 0.275 | 0.563 | 0.328 | 0.279 | 0.328 | 0.295 | 0.1607 | −0.0507 | −0.0176 | 0.0044 | −0.0260 | |
| Plateau | 1 m | 6.469 | 0.021 | 0.023 | 0.028 | 0.024 | 3.031 | 0.634 | 0.641 | 0.763 | 0.675 | 0.0199 | −0.0049 | −0.0039 | −0.0009 | −0.0038 |
| 1/3 s | 49.056 | 0.286 | 0.150 | 0.253 | 0.220 | 3.488 | 0.797 | 0.487 | 0.762 | 0.671 | 0.2290 | −0.0152 | −0.0051 | 0.0107 | −0.0020 | |
| 1sec | 92.474 | 0.986 | 0.599 | 0.892 | 0.783 | 3.234 | 0.933 | 0.630 | 0.867 | 0.786 | 0.6289 | −0.0838 | −0.0122 | 0.0383 | −0.0020 | |
| Basin | 1 m | 139.351 | 0.202 | 0.093 | 0.196 | 0.174 | 25.626 | 2.910 | 1.460 | 3.174 | 2.472 | 0.2816 | 0.0009 | −0.0017 | 0.0086 | 0.0031 |
| 1/3 s | 224.816 | 0.722 | 0.305 | 0.607 | 0.519 | 8.571 | 1.614 | 0.813 | 1.562 | 1.265 | 0.8115 | −0.0330 | −0.0096 | 0.0237 | 0.0029 | |
| 1 s | 520.604 | 2.964 | 1.660 | 2.783 | 2.466 | 8.407 | 2.379 | 1.464 | 2.347 | 2.057 | 2.4317 | −0.3054 | −0.0895 | 0.0794 | −0.0168 | |
| Hill | 1 m | 39.995 | 0.092 | 0.054 | 0.093 | 0.075 | 11.071 | 2.420 | 1.631 | 2.571 | 1.694 | 0.1031 | −0.0061 | −0.0044 | 0.0028 | −0.0025 |
| 1/3 s | 178.745 | 0.737 | 0.446 | 0.719 | 0.6000 | 7.655 | 2.017 | 1.356 | 2.044 | 1.694 | 0.7182 | −0.0609 | −0.0322 | 0.0181 | −0.0192 | |
| 1 s | 344.718 | 2.358 | 1.581 | 2.291 | 2.000 | 6.946 | 2.123 | 1.568 | 2.155 | 1.879 | 2.0041 | −0.2610 | −0.1228 | 0.0363 | −0.0820 | |
Publisher’s Note: MDPI stays neutral with regard to jurisdictional claims in published maps and institutional affiliations. |
© 2021 by the authors. Licensee MDPI, Basel, Switzerland. This article is an open access article distributed under the terms and conditions of the Creative Commons Attribution (CC BY) license (http://creativecommons.org/licenses/by/4.0/).
Share and Cite
MDPI and ACS Style
Yan, L.; Tang, X.; Zhang, Y. High Accuracy Interpolation of DEM Using Generative Adversarial Network. Remote Sens. 2021, 13, 676. https://doi.org/10.3390/rs13040676
AMA Style
Yan L, Tang X, Zhang Y. High Accuracy Interpolation of DEM Using Generative Adversarial Network. Remote Sensing. 2021; 13(4):676. https://doi.org/10.3390/rs13040676
Chicago/Turabian StyleYan, Li, Xingfen Tang, and Yi Zhang. 2021. "High Accuracy Interpolation of DEM Using Generative Adversarial Network" Remote Sensing 13, no. 4: 676. https://doi.org/10.3390/rs13040676
Note that from the first issue of 2016, this journal uses article numbers instead of page numbers. See further details here.