Article

Distance–Intensity Image Strategy for Pulsed LiDAR Based on the Double-Scale Intensity-Weighted Centroid Algorithm

1
National Key Laboratory of Tunable Laser Technology, Harbin Institute of Technology, Harbin 150001, China
2
Shenzhen Geling Institute of Artificial Intelligence and Robotics, Shenzhen 518000, China
3
School of Electronic and Information Engineering, Harbin Institute of Technology, Harbin 150001, China
*
Author to whom correspondence should be addressed.
Remote Sens. 2021, 13(3), 432; https://doi.org/10.3390/rs13030432
Submission received: 13 December 2020 / Revised: 12 January 2021 / Accepted: 22 January 2021 / Published: 26 January 2021
(This article belongs to the Section Engineering Remote Sensing)

Abstract

:
We report on a self-adaptive waveform centroid algorithm that combines the selection of double-scale data and the intensity-weighted (DSIW) method for accurate LiDAR distance–intensity imaging. A time window is set to adaptively select the effective data. At the same time, the intensity-weighted method can reduce the influence of sharp noise on the calculation. The horizontal and vertical coordinates of the centroid point obtained by the proposed algorithm are utilized to record the distance and echo intensity information, respectively. The proposed algorithm was experimentally tested, achieving an average ranging error of less than 0.3 ns under the various noise conditions in the listed tests, thus exerting better precision compared to the digital constant fraction discriminator (DCFD) algorithm, peak (PK) algorithm, Gauss fitting (GF) algorithm, and traditional waveform centroid (TC) algorithm. Furthermore, the proposed algorithm is fairly robust, with remarkably successful ranging rates of above 97% in all tests in this paper. Furthermore, the laser echo intensity measured by the proposed algorithm was proved to be robust to noise and to work in accordance with the transmission characteristics of LiDAR. Finally, we provide a distance–intensity point cloud image calibrated by our algorithm. The empirical findings in this study provide a new understanding of using LiDAR to draw multi-dimensional point cloud images.

1. Introduction

Since its emergence, LiDAR has been rapidly applied to the acquisition of three-dimensional space information, providing a new technical solution for three-dimensional modeling of cities [1], exploration and detection of geology and roads [2,3], autonomous driving and unmanned driving of vehicles [4,5], etc. The 3D point cloud data acquired by LiDAR can represent the contour information of terrain and buildings. Traditional applications of 3D LiDAR often focus on the spatial information of the targets contained in the point cloud data, making the application of LiDAR data relatively limited. However, more information (e.g., the target’s intensity information) is beneficial for efficient classification and feature extraction of detected targets [6,7].
There are two main methods for determining the time difference between LiDAR’s transmitted pulse and echo pulse: One relies on a time-to-digital converter (TDC) [8,9]; the other is the full waveform method [10]. The backscattered optical power is internally converted into a voltage, sampled by an analog-to-digital converter, and, finally, transformed into a Digital Number (DN), that is, a scaled integer value called the “intensity” [11]. The recorded DN involves the physical characteristics of the scanned target at that position. In recent years, several studies have shown that LiDAR intensity data have strong application potential in several scientific areas, e.g., target recognition [12], remote sensing parameter inversion [13], and plant monitoring [14,15]. Blackburn et al. [16] measured the peak value as the intensity of the laser pulse and inferred that it is independent of the model of the electron dynamics. Nilson et al. [17] demonstrated that the pulse width is a function of laser intensity.
Moreover, most related research is based on intensity data from commercial LiDAR or terrestrial laser scanning (TLS) sensors. It is not easy to unify their acquisition and calibration methods. In addition, no research was found that surveyed the robustness of ranging and the representation of digital LiDAR intensity data with the impact of noise.

2. LiDAR Transmission Mechanism and System Description

2.1. LiDAR Transmission Mechanism

The laser emitter of LiDAR transmits a narrow and low-divergence laser beam to a scanning mechanism (e.g., a two-dimensional galvanometer or scanning MEMS micro-mirror). The laser beam reflected from the scanning mechanism illuminates the target surface. The receiver of LiDAR records the echo laser pulse signals backscattered from the scanned target. This process can be expressed by the LiDAR transmission equation as [18]:
P r = η s y s η a t m D r 2 4 π β 2 R 4 P t σ ,
where η s y s is the LiDAR system transmission factor, η a t m is the atmospheric impact factor, D r is the LiDAR receiver aperture diameter, β is the divergence angle of the transmitting laser beam, R is the ranging distance, P r is the received echo laser power, P t is the transmitted laser power, and σ is the backscattering cross-section, which can be represented as [18]:
σ = 4 π Ω s ρ A i cos θ i ,
where Ω s is the solid angle of the backscattering direction, ρ is the target biconical reflectance (BRF) at the laser wavelength used, A i is the area of the spot illuminated at the target, and θ i is the angle of incidence.
A i cos θ i can be considered as the effective area of the spot illuminated at the target, which can be expressed as:
A i cos θ i = π R 2 sin 2 ( β β 2 2 ) π R 2 β 2 4 .
We assume that the target is a Lambertian reflector, and the radiation is uniformly scattered in the hemisphere [19]. Combining with the Lambert body cosine theorem, the following can be obtained:
Ω s = π cos θ s ,
where θ s is the backscattering zenith angle, which is the angle of emergence in the generic sense.
Combined with Equations (2)–(4), Equation (1) can be simplified as [4]:
P r = η s y s η a t m D r 2 4 R 2 P t ρ cos θ s .
For LiDAR, the directions of laser emission and echo detection are almost the same. In most cases, the angle of incidence θ i and the angle of emergence θ s can be considered equal. Remarkably, the recording method of LiDAR echo intensity and the noise in laser transmission and reception will affect the value of the LiDAR echo intensity data.

2.2. Pulsed LiDAR System and Its Operating Principle

The pulsed LiDAR system is mainly composed of the transmitting system, receiving system, and signal-processing module, which are shown in Figure 1. The transmitting system is mainly composed of a laser, a scanning mechanism, and an optical lens device. The laser emits a specific power and a particular wavelength of the laser, and then, through the scanning mechanism, a sequenced light covering a particular angle space is formed. Finally, the optical lens expands the scanning angle and collimates the laser beam. In the process of laser pulse transmission, on the one hand, there are the absorption and scattering of atmospheric particles, and the laser energy will have an attenuation. On the other hand, the statistical dependence of the laser will change due to atmospheric end flow. It should be noted that, notwithstanding that the atmospheric transmission has an impact on the laser, since the LiDAR used for the working distance in automatic driving is about several hundred meters, the influence of the atmosphere can be ignored in fine and cloudless weather. The receiving system’s responsibility is to receive the echo signal collected and amplified by the photoelectric converter (e.g., avalanche photodiode (APD)) and amplifier, which is then sampled by analog-to-digital converter (ADC) and converted into a digital signal. Finally, the sampled digital signal is output to the signal processing system for operation.
According to the principle of flight time ranging, the distance between the LiDAR and the target can be obtained by measuring the time difference [20]. Consequently, the distance can be determined as:
D = c · Δ t 2 ,
where Δ t represents the time interval between the transmitting pulse and echo pulse, and C represents the velocity of light.

3. Methodology

3.1. Methods of Distance Acquisition

The essence of distance measurement by pulsed LiDAR is determining the launch time and arrival time of the pulse, getting the pulse’s flight time through these two moments, and, finally, calculating the distance between the target and the LiDAR. Usually, this kind of device can determine pulse transmission time, and the arrival is called a timing discriminator. At present, the time extraction methods for the transmitting pulse and echo pulse can be divided into two categories:
1. The first kind of method depends on the discriminator and time-to-digital converter (TDC) to determine the time interval between the transmitted pulse and echo pulse. The leading edge discrimination method [8] and constant fraction discriminator (CFD) [9] method are representative. These methods locate the transmitting pulse and echo at a specific moment to form a shaped pulse and then use a TDC to differentiate between them.
2. The other kind of method uses a high-speed analog-to-digital converter (ADC) to sample the whole laser pulse’s waveform. This kind of method obtains the interval time with the digital signal algorithm with a discrete pulse signal. Simultaneously, this kind of method can express the echo intensity because of the high-speed ADC used. The Peak (PK) algorithm, traditional waveform centroid (TC) algorithm, and Gaussian fitting (GF) algorithm are typical digital signal algorithms. As its name suggests, the Peak algorithm is used to select the time value of the peak point of the laser emission pulse or echo pulse to represent the time of the pulse transmission or arrival, respectively. According to the waveform data, the Gaussian fitting method needs to set the initial value of each parameter in the Gaussian function reasonably in advance. Then, it uses the iterative least-squares method to update all Gaussian function parameters until it finds the optimal solution. Compared with the GF algorithm, the TC algorithm only includes the basic operations of addition, subtraction, multiplication, and division, so it has more hardware implementation advantages. The centroid of a LiDAR waveform is considered a virtual point in the echo, which relates to the echo pulse waveform’s total length, shape, and position. The typical waveform centroid can be expressed as:
t c = i = 1 n u i t i i = 1 n u i , u c = i = 1 n u i t i i = 1 n t i ,
where t c is the centroid moment of the laser pulse, u c is the centroid amplitude of the laser pulse, and t i and u i are the corresponding moment of each sampling point of the laser pulse and the amplitude of each sampling point of the laser, respectively.

3.2. Methods of Intensity Recording

Various ways are applied to record the echo intensity information of LiDAR, such as the echo peak value, echo waveform integral value, and echo pulse width. There is no uniform standard at present. In the practical application of pulsed LiDAR, the LiDAR continuously transmits pulse signals to the target, which are modulated in the form of a Gaussian function in the time domain. Therefore, Equation (1) can be transformed into the time domain as [21]:
P r ( t ) = η s y s η a t m D r 2 4 π β 2 R 4 P t ( t ) σ ( t )
p t ( t ) = p t ^ e t 2 t 2 2 s t 2 2 s t 2
where * represents the convolution operation, and p t ^ and s i are the peak value and standard deviation of the emitting laser pulse, respectively.
Analogously, we assume that σ ( t ) is a Gaussian function in the time domain. Therefore, the backscattering cross-section σ has the following relation with it:
σ = + σ ( t ) d t = + σ ^ e t 2 t 2 2 s o 2 2 s o 2 d t = 2 π σ ^ s o ,
where σ ^ and s o are the peak value and standard deviation of σ ( t ) , respectively. Further, by substituting Equations (9) and (10) into Equation (8), one finds:
p r ( t ) = 2 π · η s y s η a t m D r 2 4 π β 2 R 4 · p t ^ · σ ^ · s i s o s i 2 + s o 2 e ( t t 0 ) 2 2 s i 2 + s o 2 = p r ^ e t t 0 2 2 s r 2 ,
where t 0 is the flight time of the laser pulse, and s r = s i 2 + s o 2 is the standard deviation of laser echo pulse p r ( t ) . Herein, we derive the mathematical expressions of the above three kinds of LiDAR echo intensity as:
1. Peak value: Setting p r ^ as the peak value of the laser echo pulse p r ( t ) , we get:
p r ^ = η s y s η a t m D r 2 p t ^ σ 4 π β 2 R 4 · s i s s .
Recalling that the backscattering cross-section σ , as given in Equation (2), is directly related to the biconical reflectance ρ , by substituting Equation (2) into Equation (12), we find:
p r ^ = η s y s η a t m D r 2 p t ^ 4 π β 2 R 4 · π 2 ρ R 2 β 2 Ω s · s i s s = η s y s η a t m D r 2 π ρ 4 R 2 Ω s · p t ^ · s i s s .
2. Integral value: Note that the Gaussian function integral formula, the integral value of the laser echo pulse, can be written as:
I N T p r ( t ) = + p r ( t ) d t = + p r ^ e t t 0 2 2 s r 2 d t = η s y s η a t m D r 2 σ 4 π β 2 R 4 · 2 π p t ^ s i = η s y s η a t m D r 2 σ 4 π β 2 R 4 · + p t ( t ) d t = η s y s η a t m D r 2 σ 4 π β 2 R 4 · I N T p t ( t ) .
Substituting Equation (2) into Equation (14), we find:
I N T p r ( t ) = η s y s η a t m D r 2 4 π β 2 R 4 · π 2 ρ R 2 β 2 Ω s · I N T p t ( t ) = η s y s η a t m D r 2 π ρ 4 R 2 Ω s · I N T p t ( t ) .
Equations (13) and (15) have similar representations that describe the influences of the LiDAR system parameters, transmission process factors, target surface reflection characteristics, and distance on the return intensity. Therefore, both the echo peak value and the echo waveform integral value appropriately record the return intensity data for LiDAR.
3. Laser pulse width: While laser pulse width is involved in many papers, there is no consistent measurement form [22,23]. Our paper chooses the full width at half maximum (FWHM) to describe the laser pulse width. Herein, for a laser echo pulse, its laser pulse width is defined as:
P W p r = 2 2 s r 2 ln ( 0.5 ) .
As Equation (16) shows, the FWHM of the laser pulse has no direct relation with the laser transmission process and target surface characteristics.

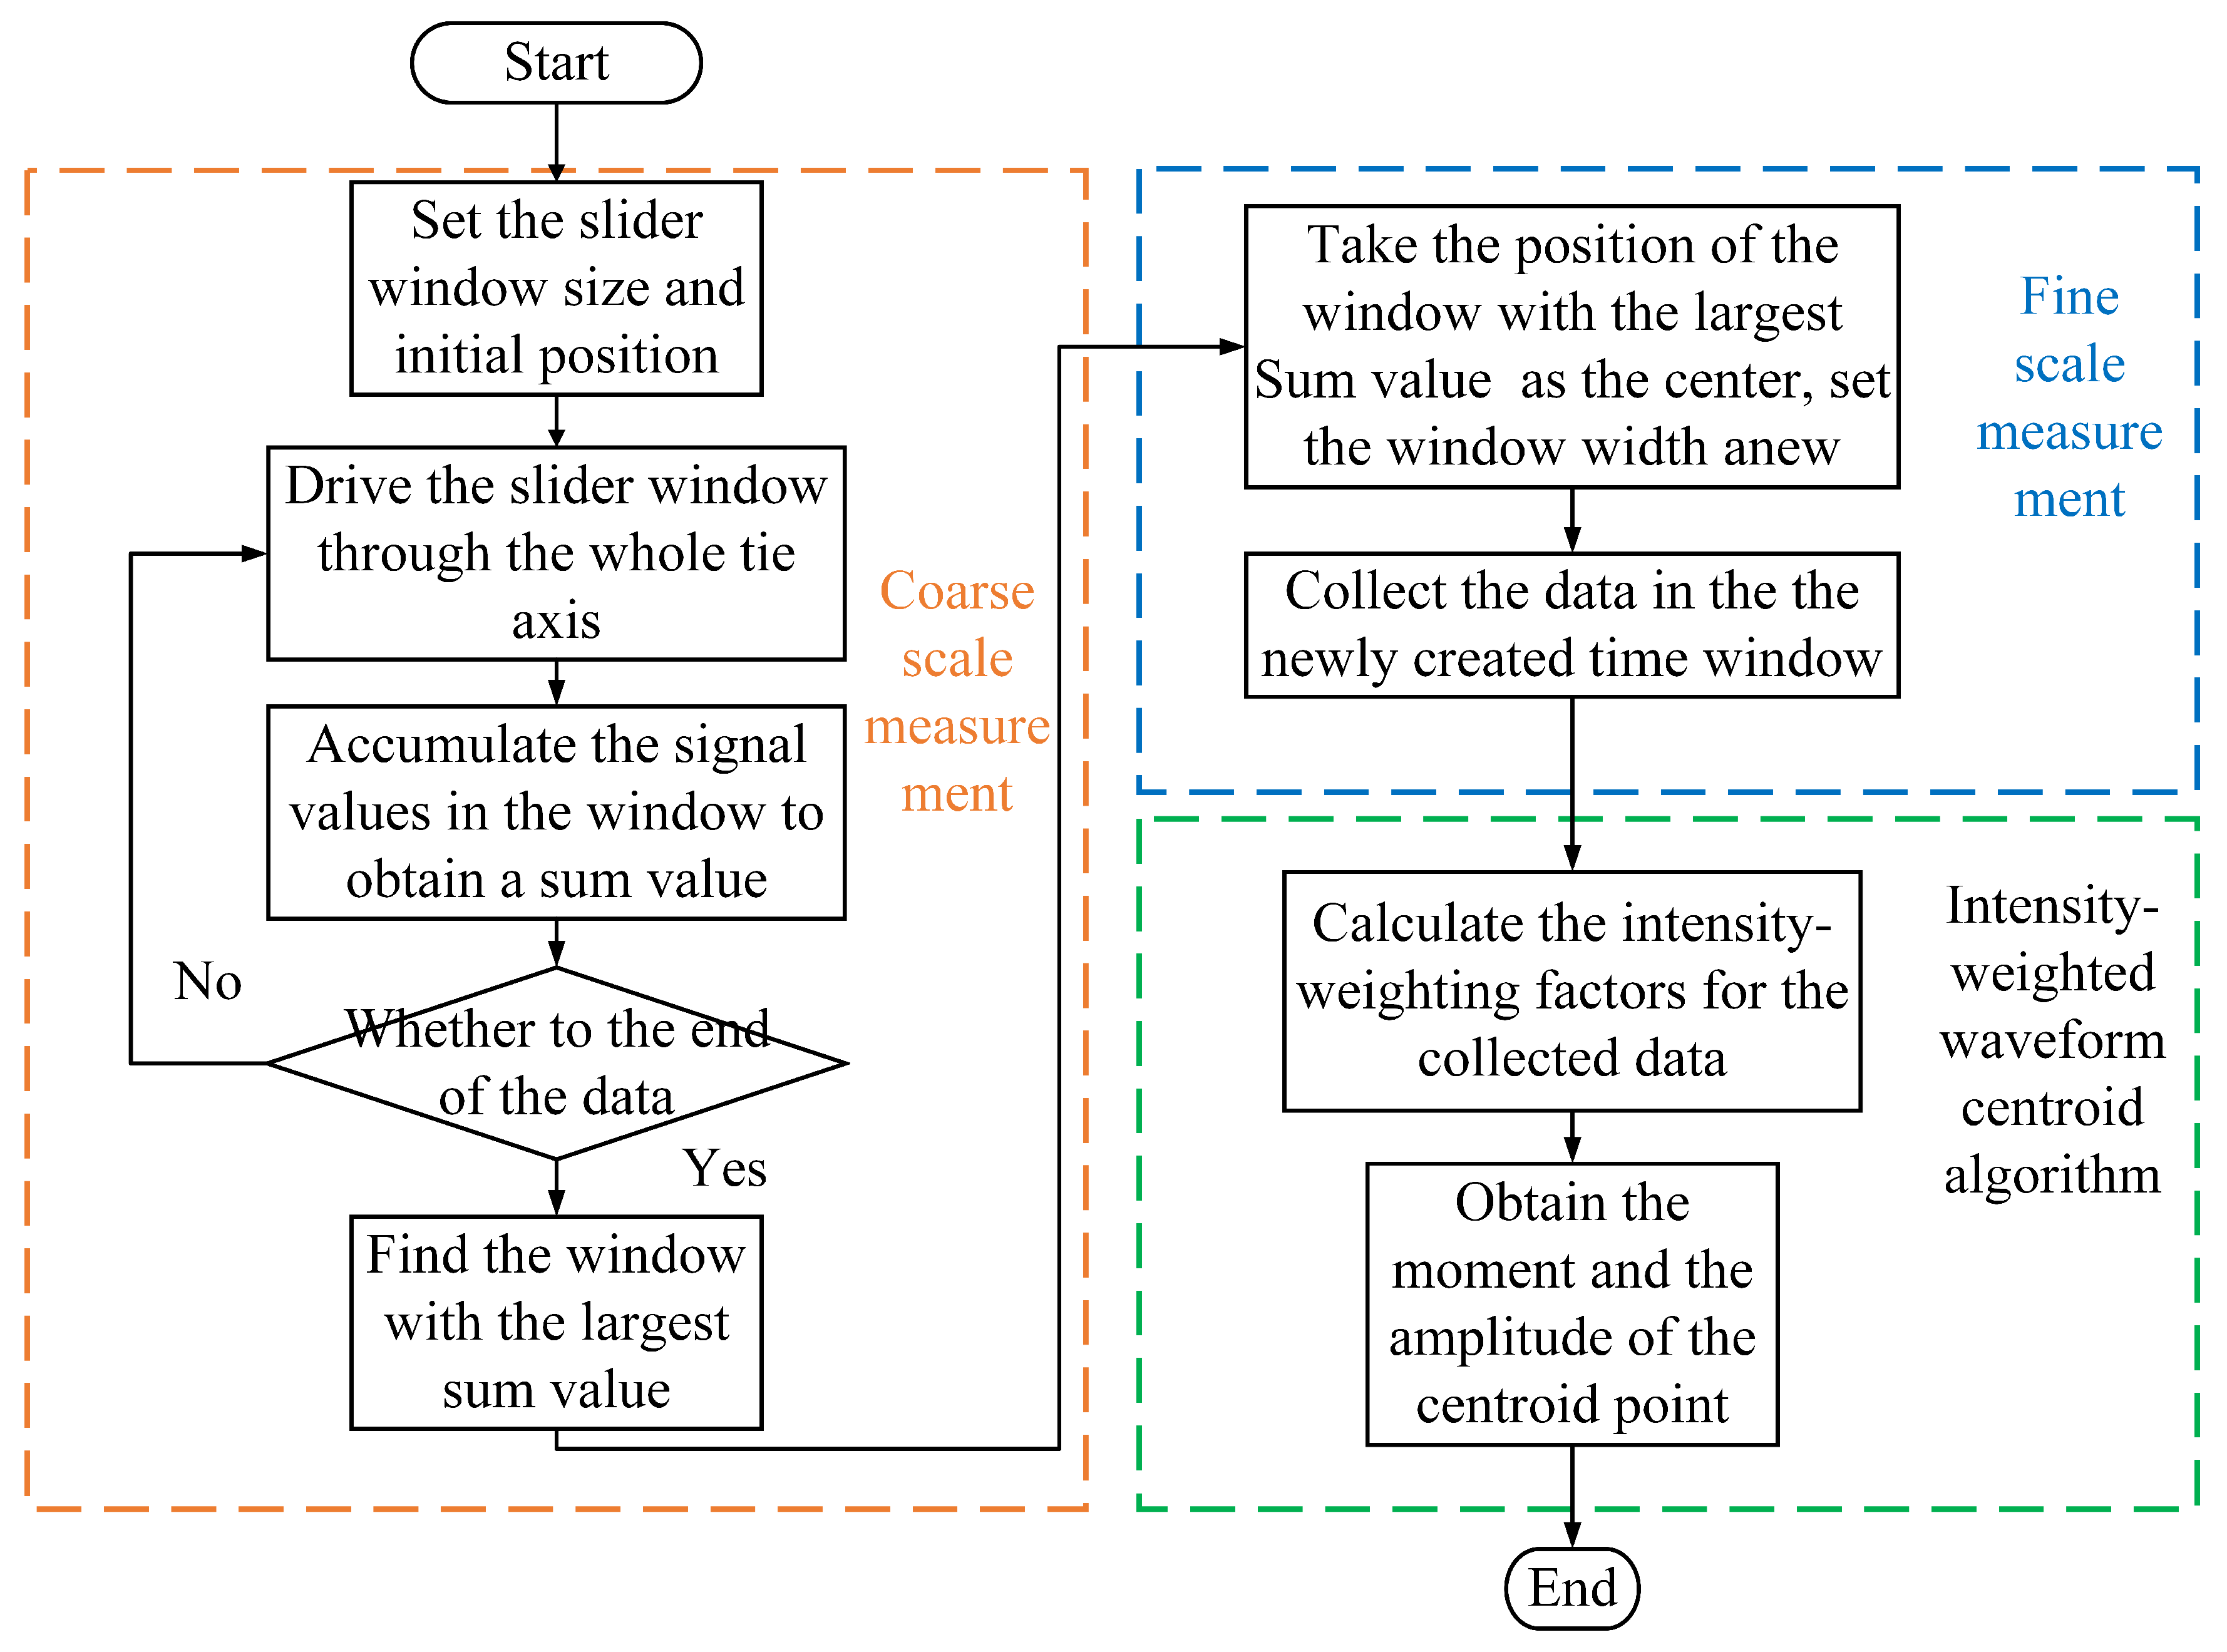
3.3. Double-Scale Intensity-Weighted Waveform Centroid Algorithm (DSIW)

In the above, we introduced the methods for determining the laser pulse emission time and echo arrival time and derived the correlation expressions of the echo intensity recording mode. Except for the peak algorithm and the conventional waveform centroid algorithm, the other methods fail to calculate the flight time and echo intensity simultaneously. Relatively simple methods (e.g., waveform peak algorithm) are susceptible to noise and are hardly benchmarks for modern LiDARs. Furthermore, the traditional centroid algorithm is weakly robust to relatively strong noise due to its lack of a sufficient data selection mechanism and noise smoothing mechanism.
Herein, given the above methods’ deficiencies, we report a double-scale intensity-weighted waveform centroid algorithm (DSIW). Compared with the conventional centroid algorithm, the algorithm can locate the centroid points of a laser pulse waveform more accurately and can perform better than the conventional method in robustness and adaptability. Firstly, a time window with a preset width is set and is driven to slide through the signal time axis. The sum values in the window are calculated to provide a reference for subsequent calculations. Before the intensity-weighted assessment, a collection is done by setting a new time window from the center of the time window corresponding to the maximum sum value, including the entire pulse peak. We call these two data screenings double-scale screening. In this way, the main lobe of the echo signal can be selected to the greatest extent. The first data screening’s time window width should be set as two times the waveform pulse width to adapt to the possible broadening of the waveform. The time window width of the second data screening should be set as the waveform pulse width. After collection, the data are shipped to obtain the intensity-weighting factors, which are defined as:
I W i = 1 j = 1 , j i n Q i . j ,
where Q i . j = A j A j A i A i , i = 1 , , n ; j = 1 , , n ; i j , A is the amplitude of the sample point.
After obtaining the intensity-weighting factors, the centroid of the pulse is calculated by:
X i w = i = 1 n I W i · t i i = 1 n I W i , Y i w = i = 1 n I W i · A i i = 1 n I W i ,
where A i represents the sampled discrete signal of the laser echo to which the detector responds.
This algorithm uses the intensity-weighting factor to calculate the centroid coordinates because it has a smoothing effect on the waveform. Generally speaking, LiDAR noise has a relatively high frequency, resulting in some sharp jitters in the signal.
A flowchart of the double-scale intensity-weighted waveform centroid algorithm is shown in Figure 2.

4. Experiments and Evaluation

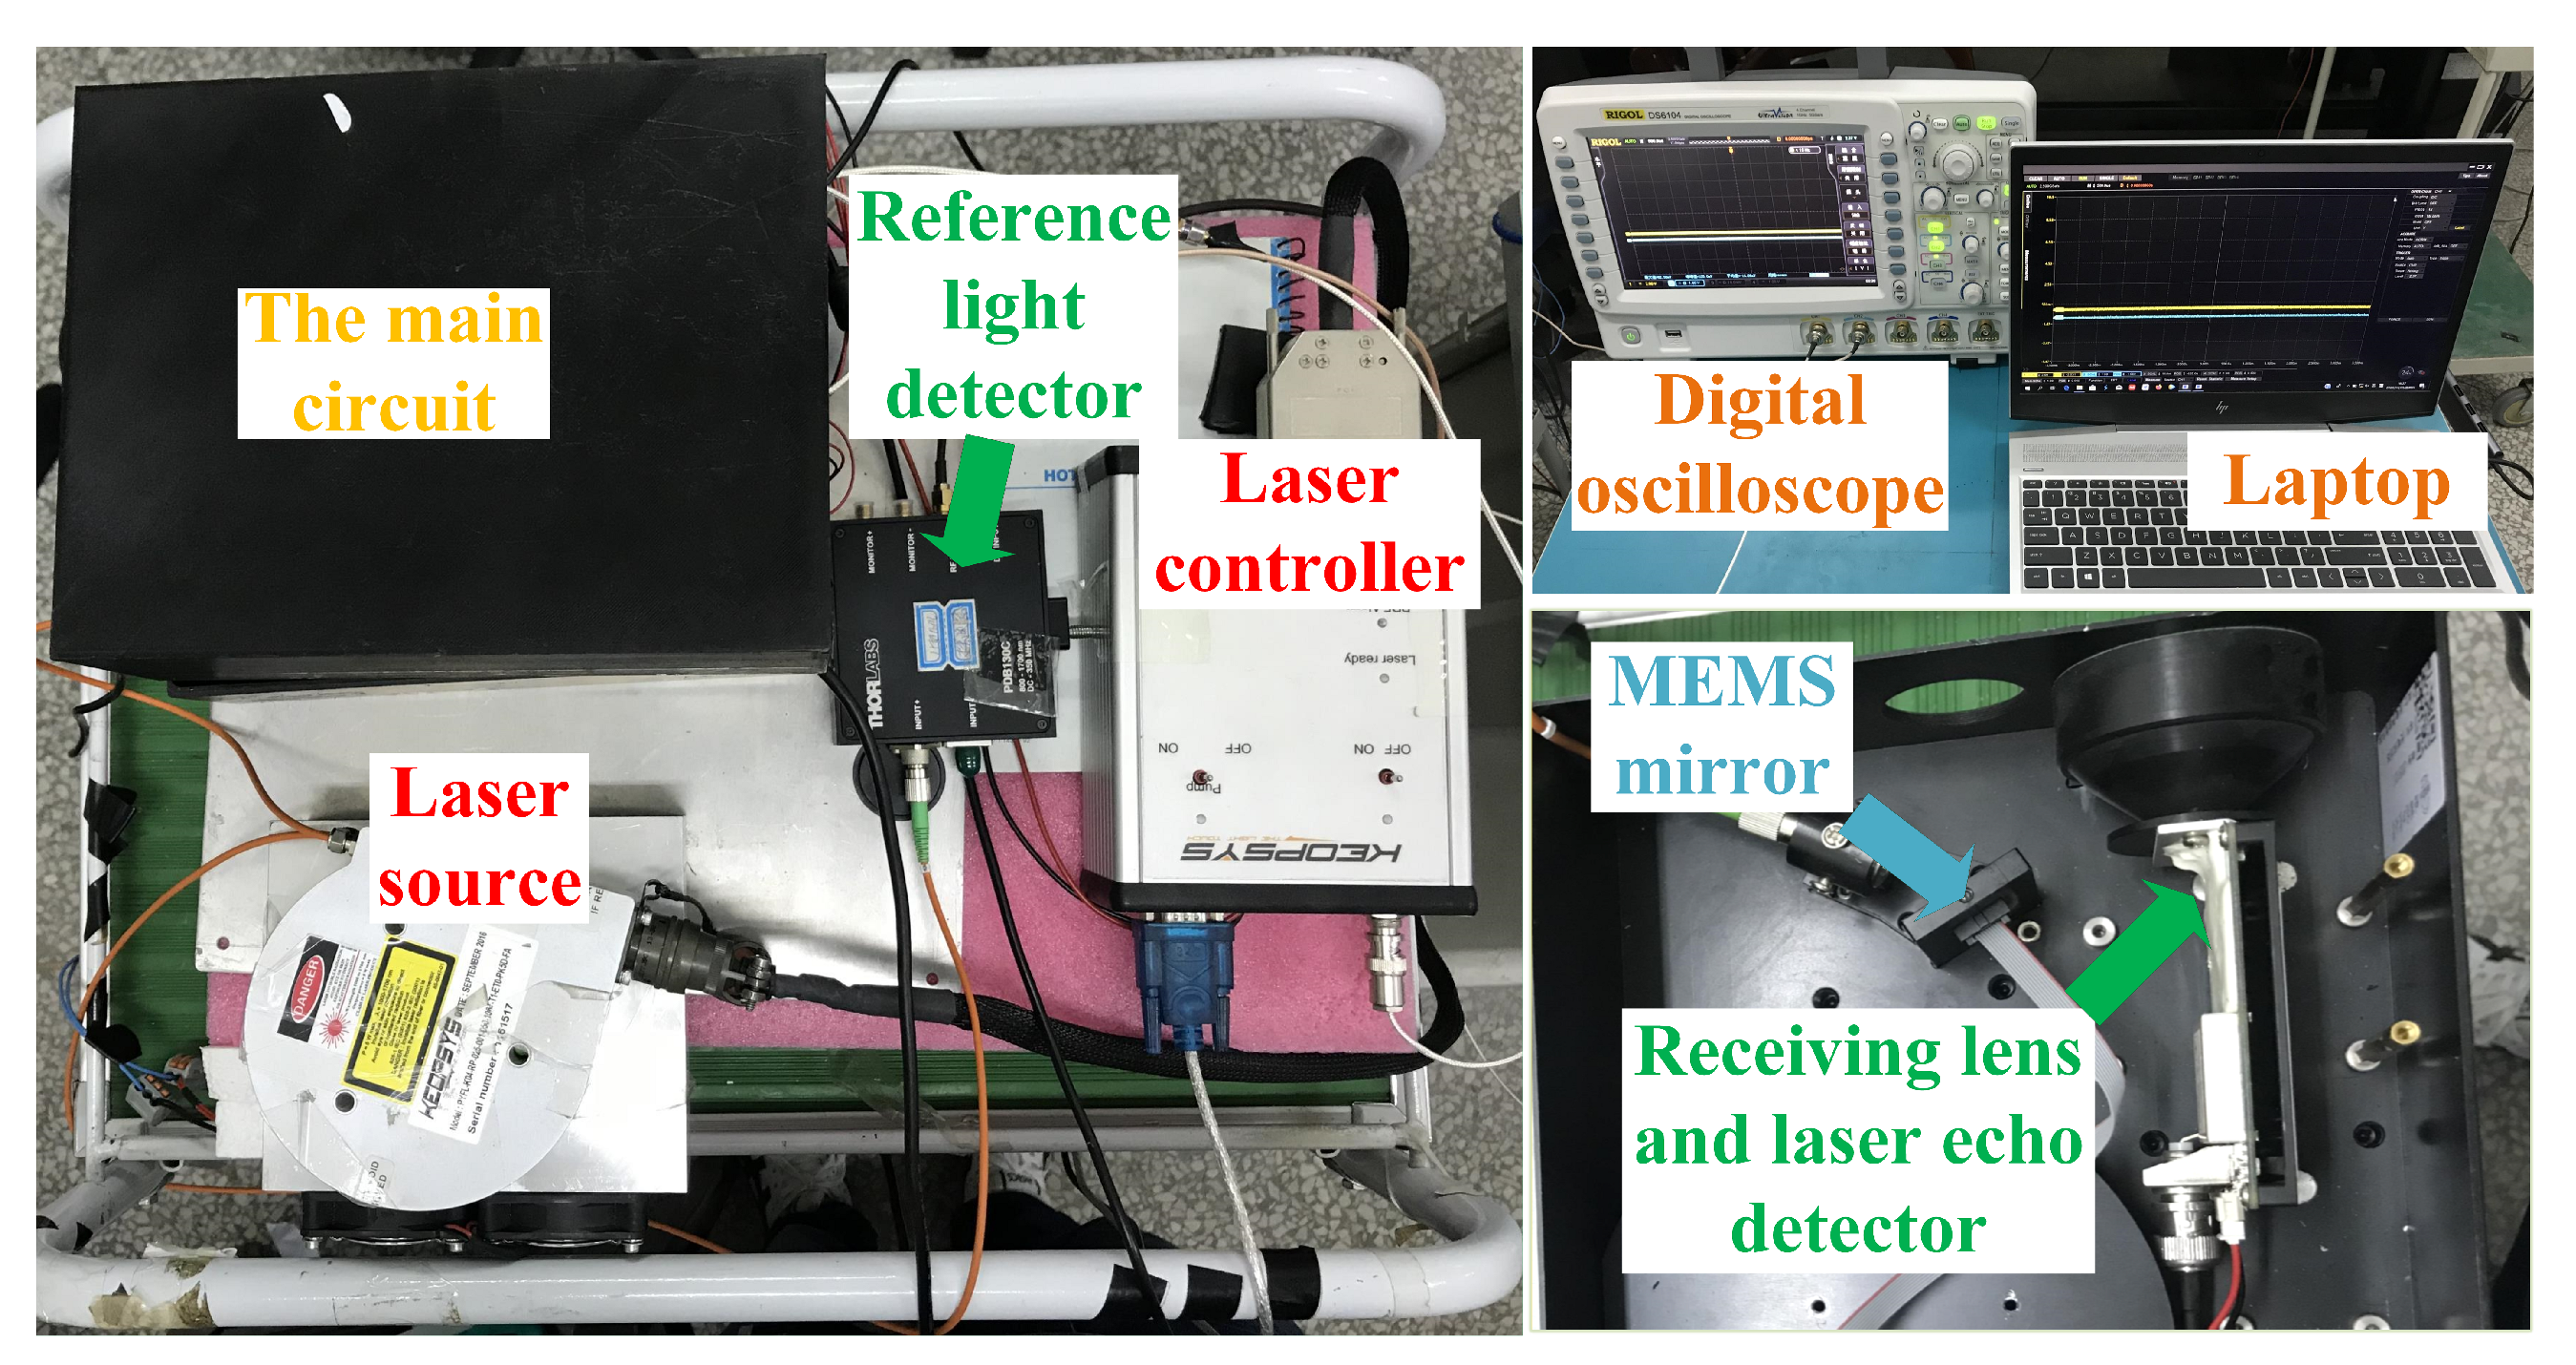
4.1. Experimental System

To verify our algorithm’s validity, we demonstrated and evaluated our algorithm in ranging accuracy and intensity recording stability with experimental datasets. The proof-of-principle system in its operational state is depicted in Figure 3.
The experimental instrument consists of a base structure made of polylactic acid and serial optical and electronic components. A 1064 nm laser source, a MEMS mirror, a micro-control unit (MCU), an avalanche photodiode (APD) with its circuit, and a RIGOL DS6000 digital oscilloscope are the core of this instrument. Table 1 lists the specifications of our experimental instrument.

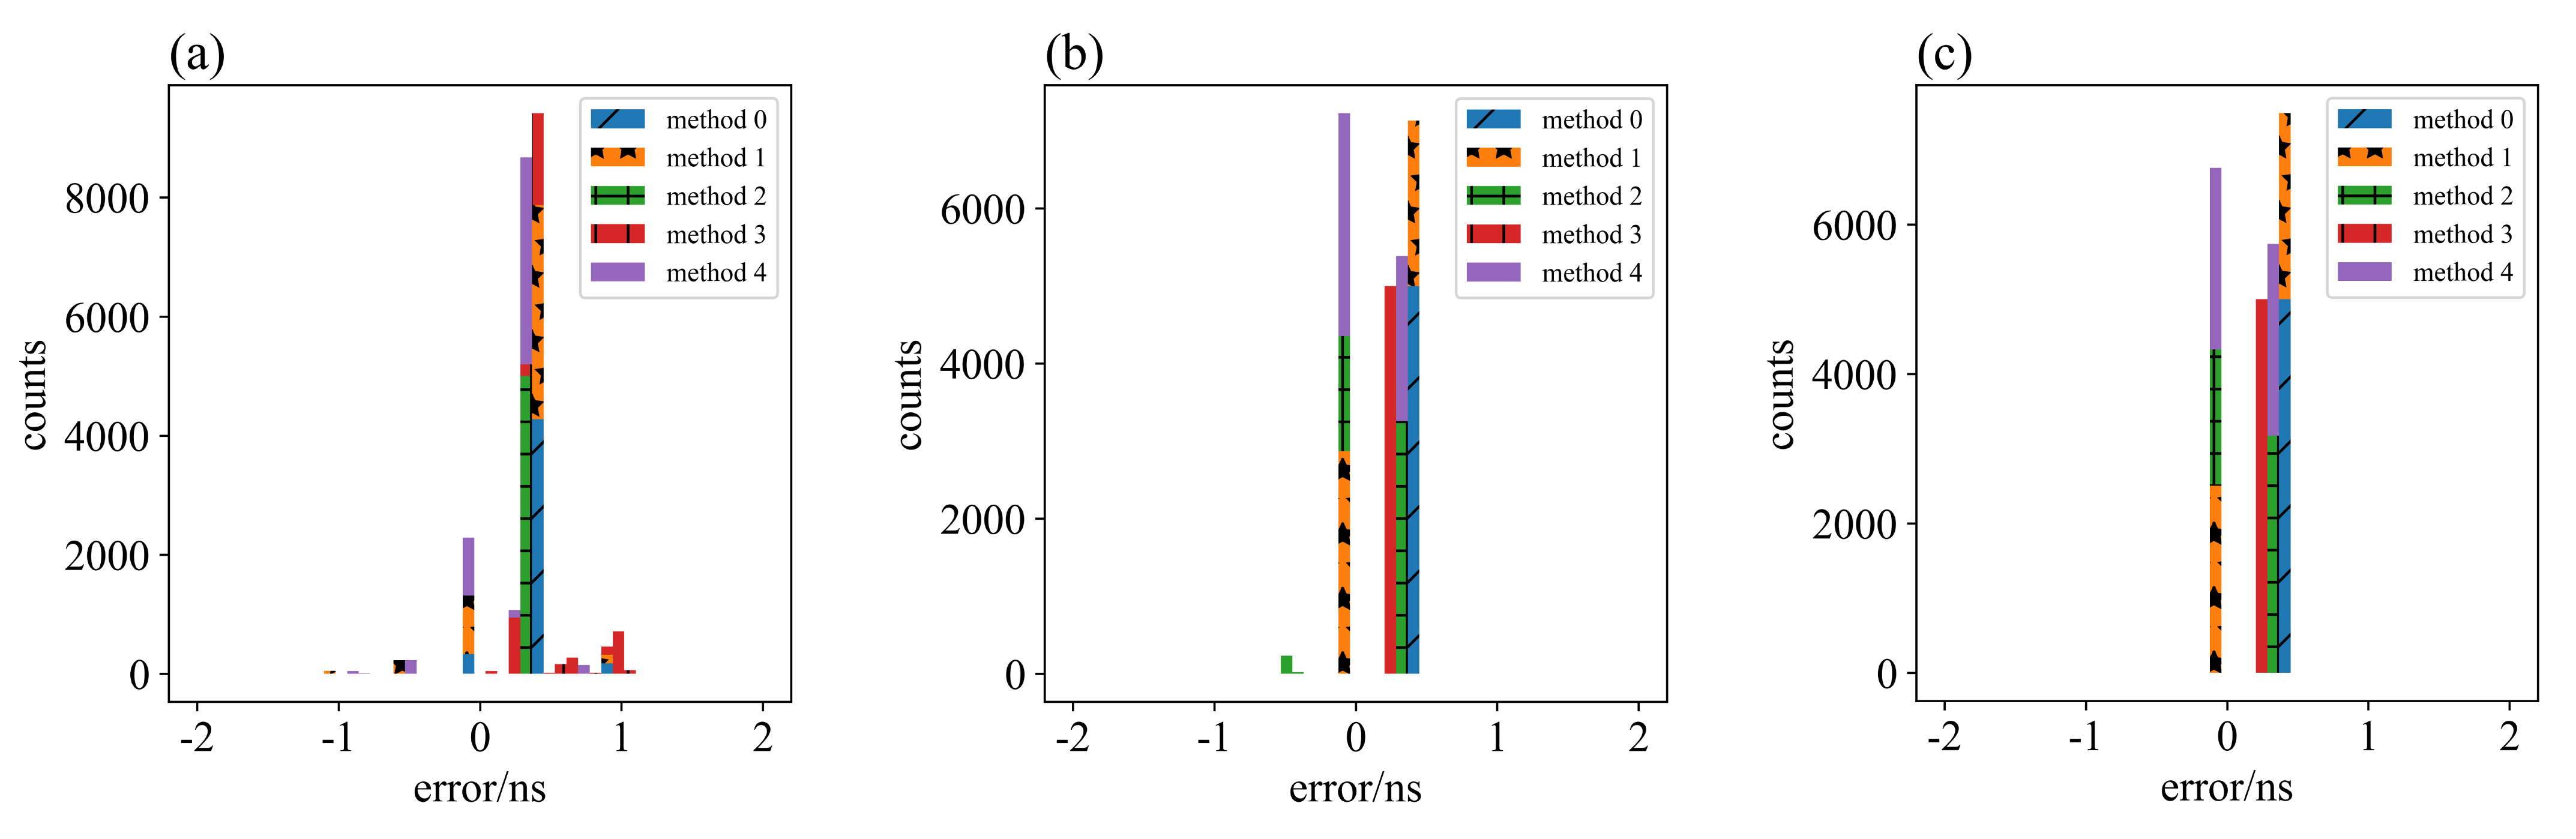
4.2. Ranging Accuracy and Ranging Robustness with Different Time Measurement Methods

To verify the preceding theoretical deduction, we designed an experiment for evaluating the ranging performance of the DSIW waveform centroid algorithm. A standard diffuse reflector with a bidirectional reflectivity factor (BRF) of 50% was placed perpendicularly to the incident laser (the incident angle of laser was 0 ) at the distances of 15 and 33 m. The reference distances listed in this paper were derived from the Leica-s910 rangefinder. Under the same conditions, 20 groups of laser emission echo signals were collected at each distance. The echoes of the standard diffuse reflector with a BRF of 50% at different distances are shown in Figure 4.
As the experimental environment was indoors, the external atmospheric environment was relatively stable, and the interference of background noise (such as sunlight and other light sources) could almost be ignored. Herein, we applied the average value of the above 20 groups of laser emission signals and echoed signals as the fundamental signal and superimposed the random Gaussian white noise with different signal-to-noise ratios (35, 42.5, and 50 dB) on the original laser echo signal, and then used different time measurement algorithms to calculate 5000 times. Herein, we assigned the tests at the distance of 15 m with the above signal-to-noise ratio (SNR) levels of Gaussian white noise—from strong to weak—as test.1 to test.3. Correspondingly, the tests at the distance of 33 m with the different Gaussian white noise levels were assigned as test.4 to test.6. The average laser echoes of each test are shown in Figure 5.
The digital CFD algorithm, PK algorithm, GF algorithm, TC algorithm, and the proposed DSIW algorithm were tested by calculating the laser pulse flight time. The average absolute ranging error (ABRE) and ranging standard deviation (RSD) of each algorithm were compared to evaluate their ranging performance, as shown in Table 2.
By analyzing the data in Table 2, it can be seen that some algorithms obtain an excessive average error when the noise is relatively strong. Herein, we define the ranging success rate of a ranging algorithm to express the above ranging algorithms’ stability. When the average absolute ranging error is less than 1 ns, the calculation is considered to be efficacious. We list the detection success rates of the above ranging algorithms in Table 3.
Combining the data of Table 2 and Table 3, we divided the tests in this paper into two groups: the strong noise group (test.1 and test.4) and weak noise group (test.2, test.3, test.5, and test.6). The ranging results of the DCFD algorithm fluctuated considerably in intense noise (strong noise group), and the average ranging error was large. With the attenuation of noise, the ranging effect of the DCFD algorithm was improved, and the average error of 0.40 ns was obtained without ranging fluctuation. In all tests, the DCFD algorithm’s ranging success rate was above 95%. For the Peak algorithm, the data obtained in this paper were greatly affected by noise. The result agreed with our previous knowledge of this algorithm. The Gaussian fitting algorithm’s result was similar to that of the peak algorithm because we set the time value of the vertex of the Gaussian fitting curve as the pulse moment. Because of its fixed filtering threshold, the TC algorithm had difficulties in obtaining ranging results in intense noise. In the case of the vital main lobe of the laser echo (test.3, test.6), the TC algorithm was able to achieve average ranging errors of about 0.26 and 0.36 ns, respectively, and the fluctuation was minimal (the standard deviations of the ranging error were 0.000015 and 0.000964 ns, respectively). However, in the case of intense noise, the ranging performance was unsatisfactory. Overall, the DSIW algorithm proposed in this paper performed splendidly. In all tests, this algorithm’s average error was less than 0.32 ns, and it was hardly affected by noise. It should be pointed out that the average ranging error of the proposed algorithm was about 0.20 ns in the case of weak noise. In all tests, the ranging success rate of the proposed algorithm was above 97% (test.4) and was able to reach 100% in most cases (test.1, test.2, test.3, test.5, and test.6).
A histogram of each method’s ranging error distribution under different SNRs at a distance of 15 m is shown in Figure 6. Methods 0 to 4 represent the DCFD algorithm, PK algorithm, GF algorithm, TC algorithm, and our proposed DSIW algorithm, respectively.
As shown in Figure 6, in the case of weak noise, the ranging results of the DCFD algorithm did not fluctuate, but failed to adapt to intense noise. Ranging errors of the PK algorithm fluctuated wildly, and the numerical value was enormous. Those of the TC algorithm had little fluctuation, but the numerical values were relatively large. The error distribution of the DSIW algorithm was relatively concentrated, and near 0, the performance was remarkable.

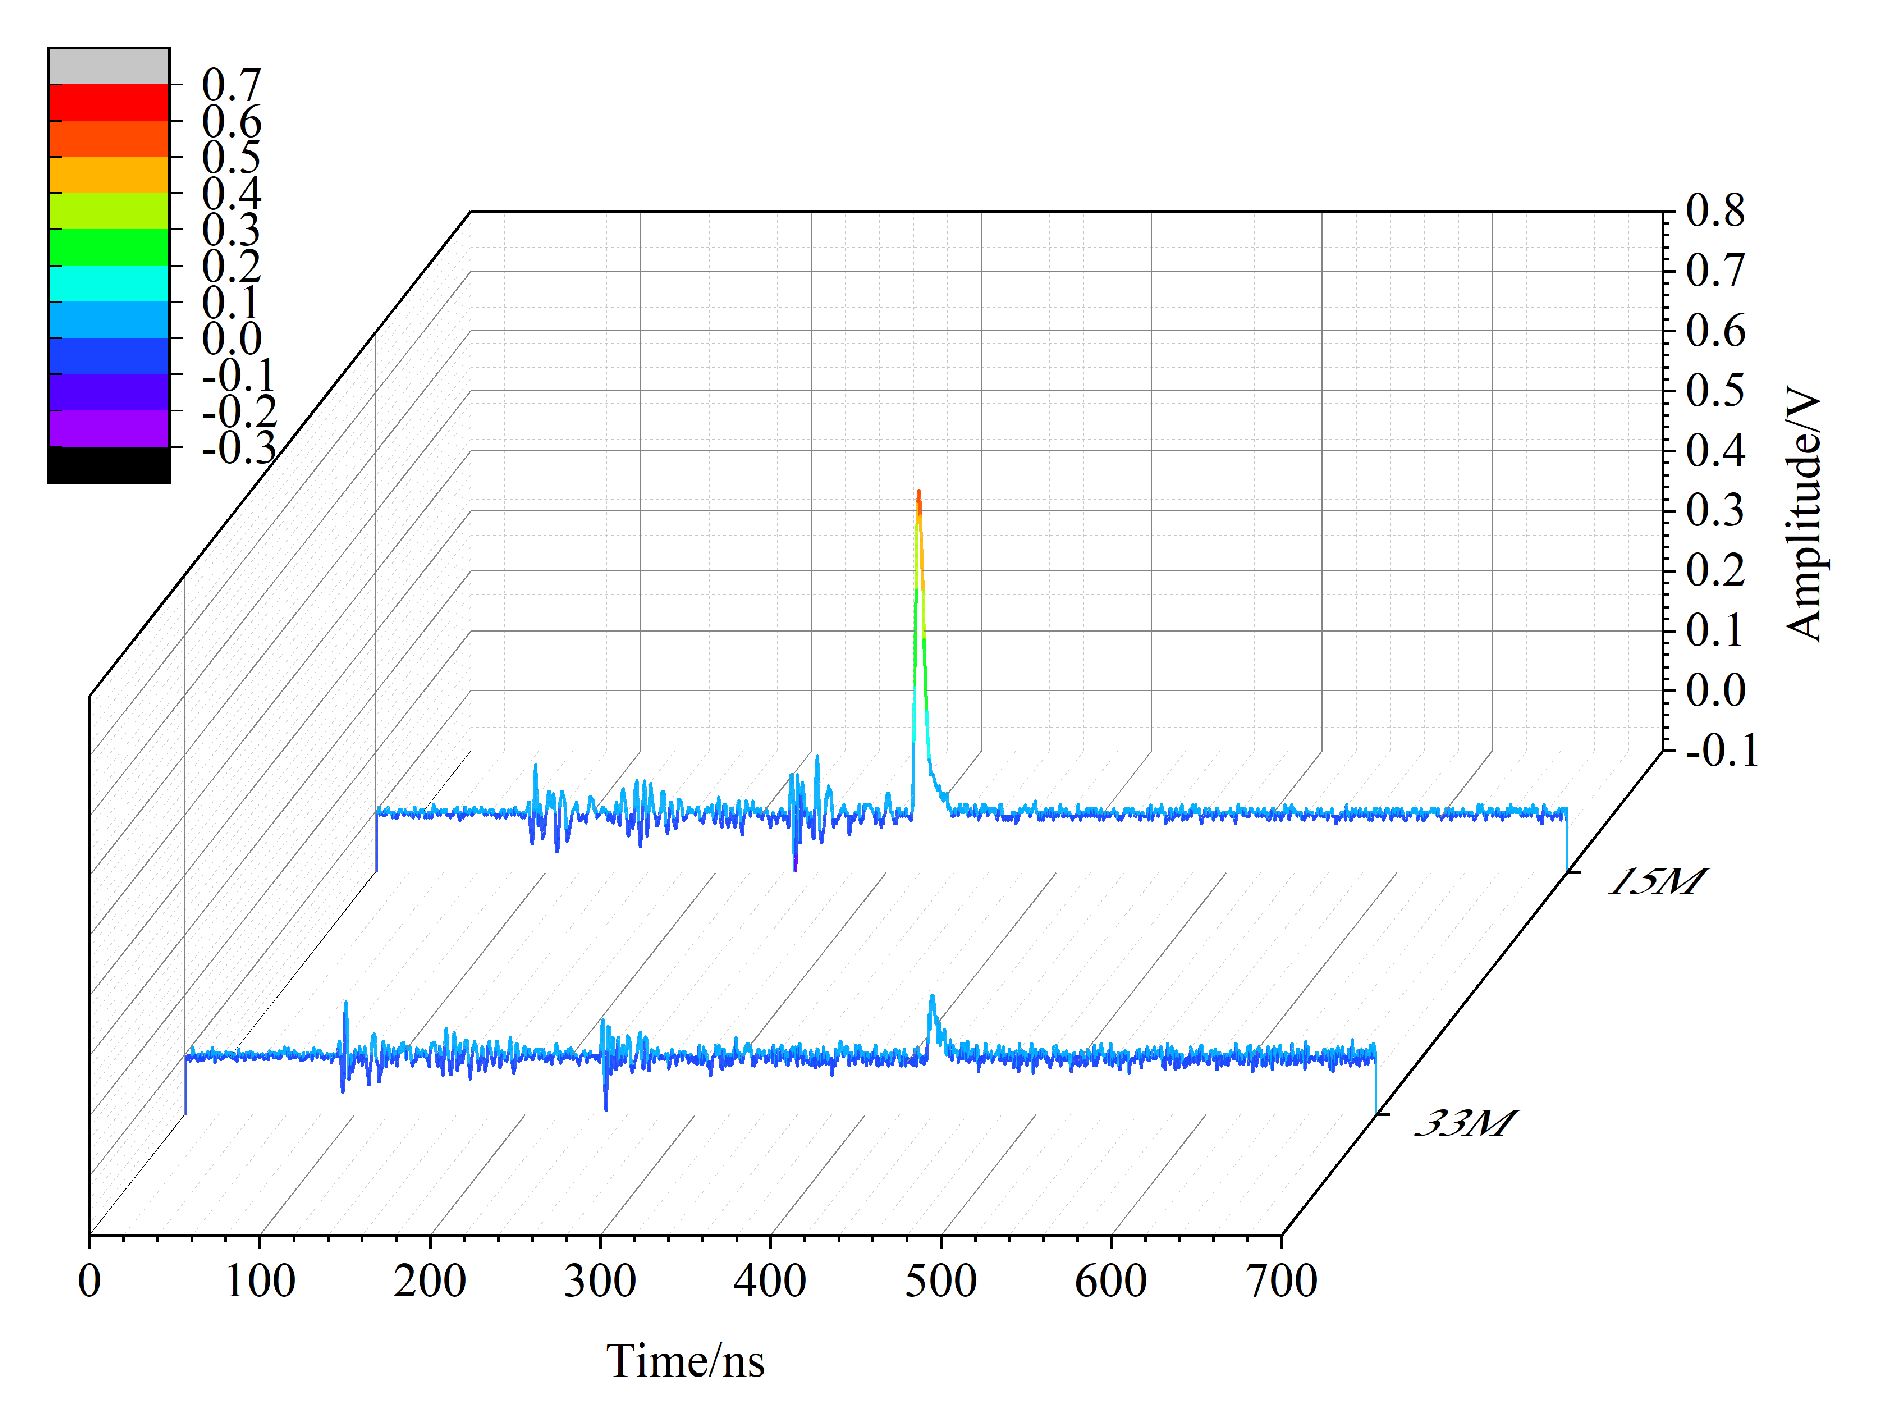
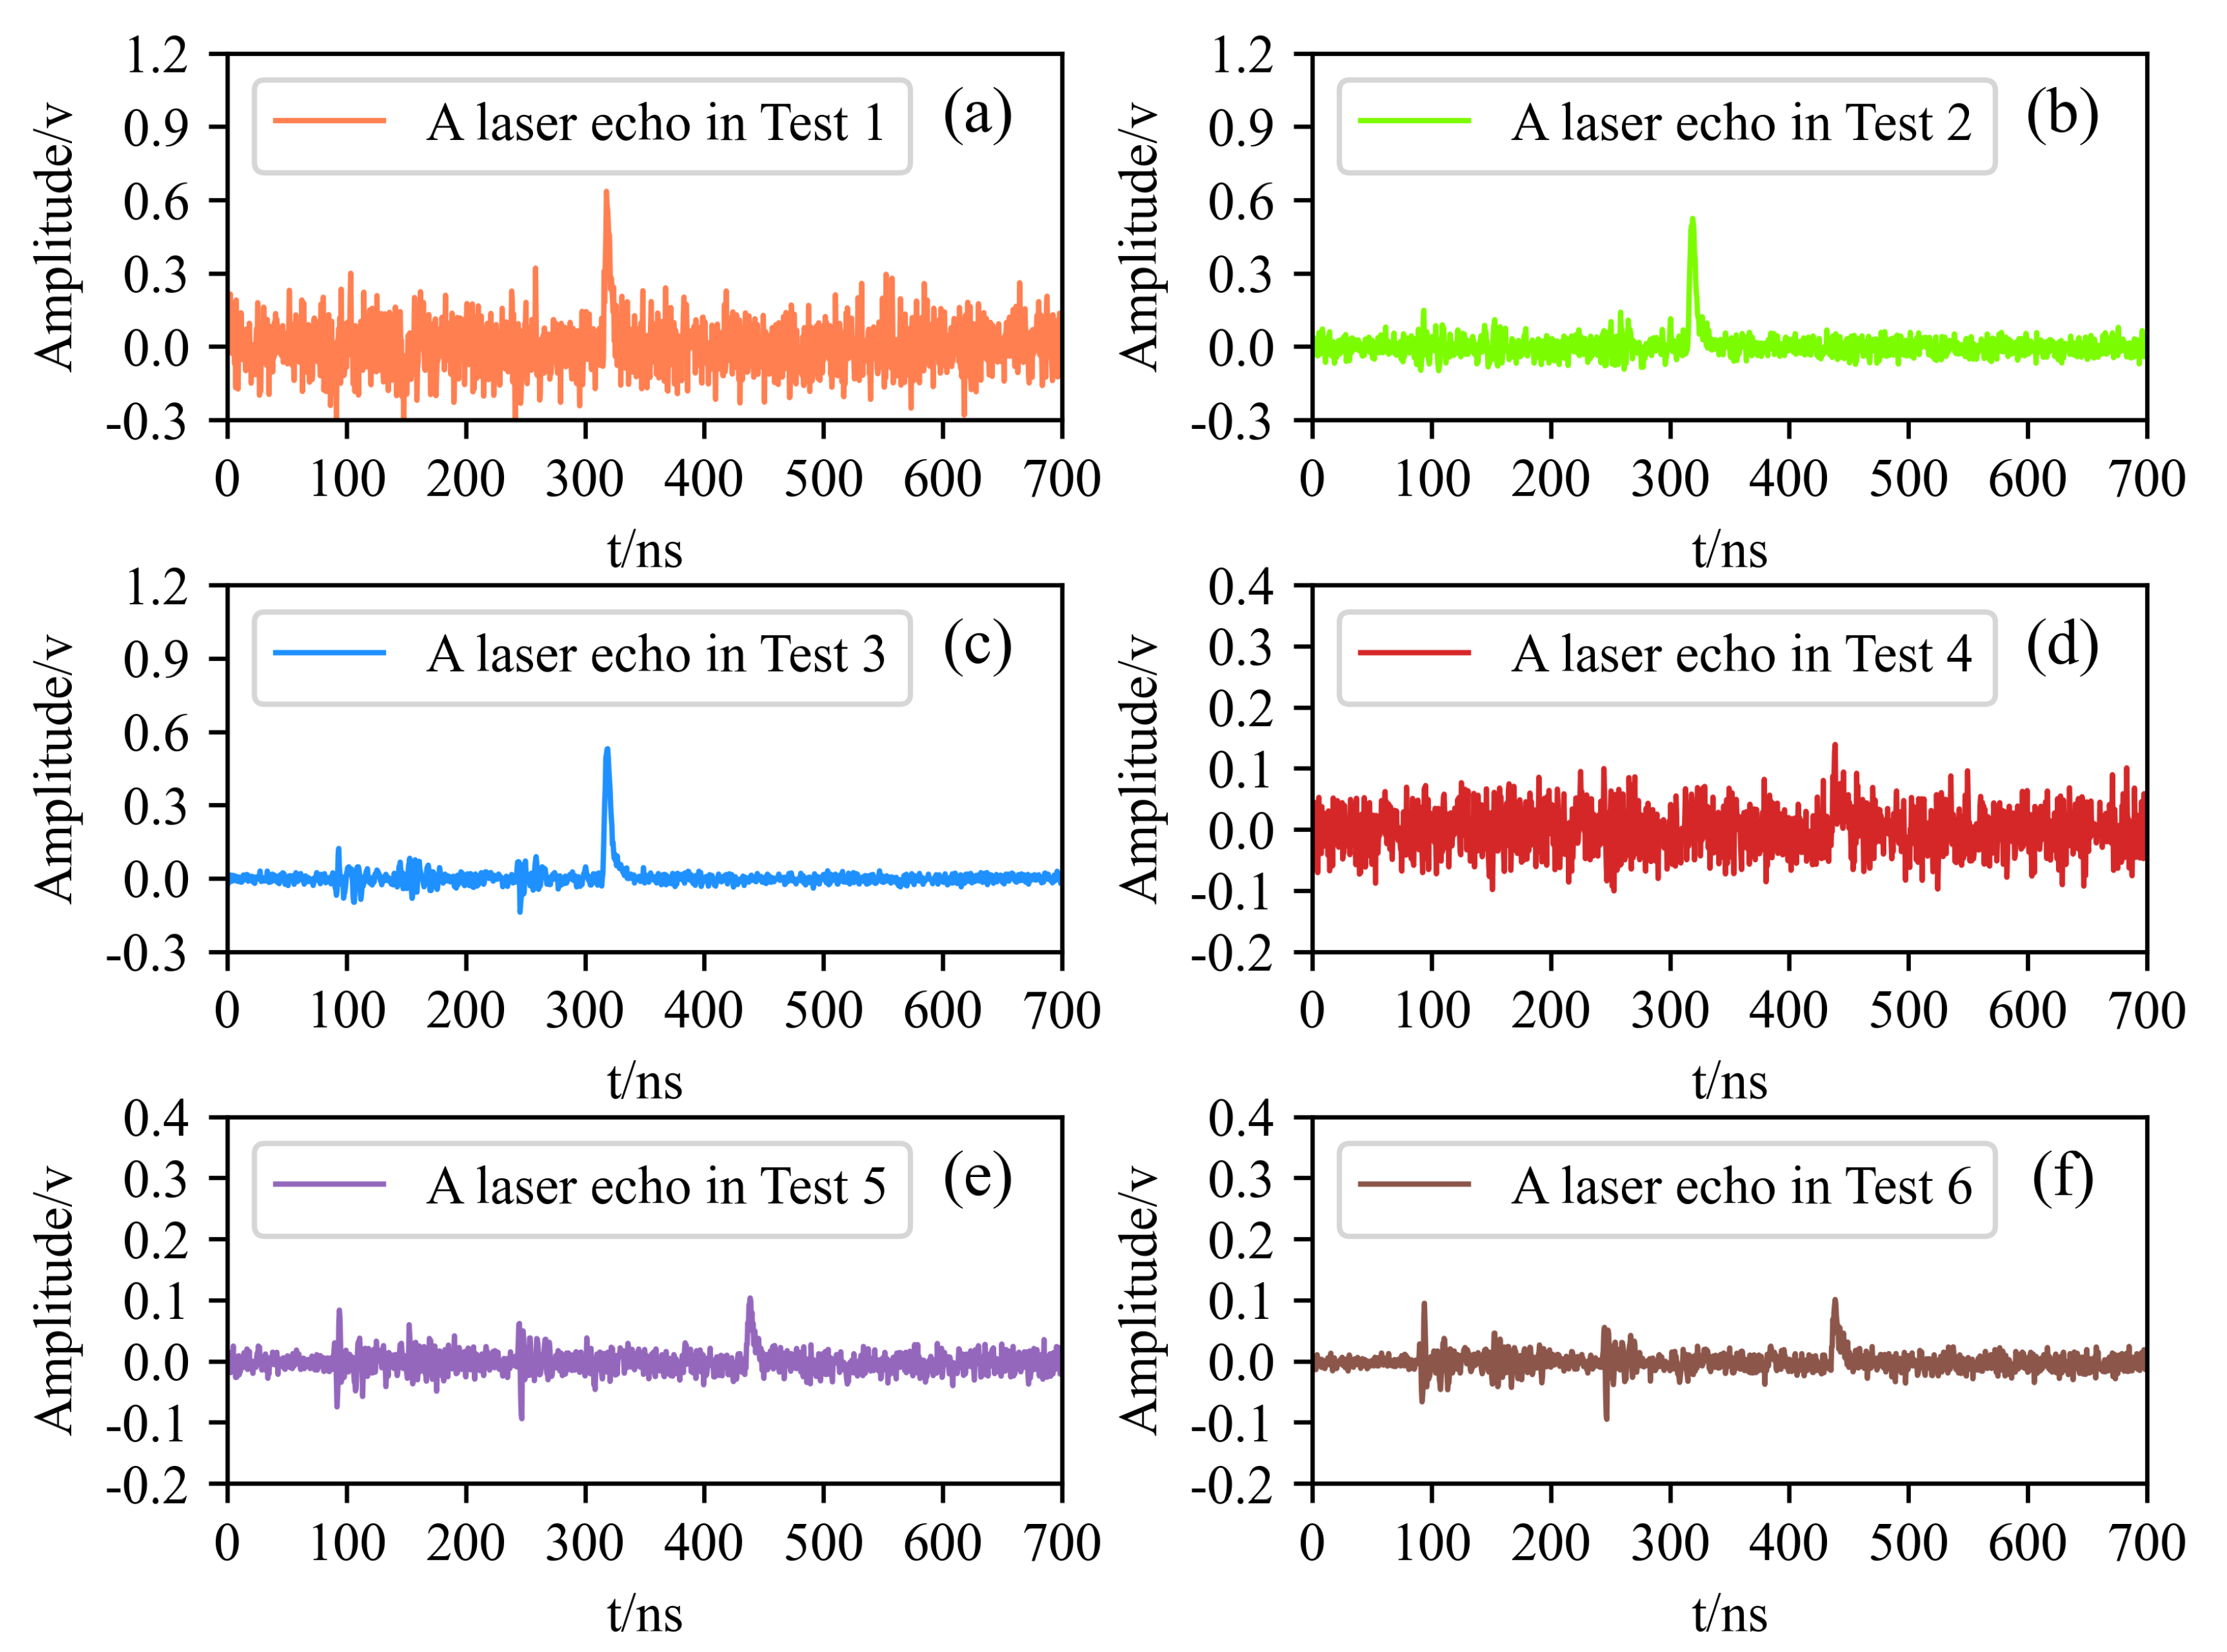
4.3. Rationality and Robustness of Laser Echo Intensity Data with Different Recording Methods

Based on the above derivation of the laser echo intensity recording mode, the laser echo intensity should conform to the LiDAR transmission equation. To verify this statement, we designed two groups of experiments. Under the condition of ensuring the expected incidence of the laser, the standard diffuse reflectors with different reflectivity values (BRF of 10%, 20%, 35%, 50%, and 75%) were placed 15 m away from the LiDAR, and the laser echo signals of different standard diffuse reflectors were collected.
Similarly, we used the previous section’s method of adding Gaussian white noise with different signal-to-noise ratios based on the average value of 20 groups of laser echo signals to simulate the LiDAR echo signal under actual working conditions. The echo waveform peak value, echo integral value, and centroid point amplitude of DSIW targets with different reflectance values at 15 m were calculated. Recording intensity with the pulse width fails to explain why the echo pulses with various intensities have similar pulse widths. Pulse widths are not a good proxy for the echo pulse intensities. Therefore, we will not discuss the pulse width performance recording of the laser pulse intensity in the following content. Here, we did not measure the laser echo intensity obtained by the TC algorithm. This is because the algorithm uses a fixed threshold to filter the laser echo pulse’s main lobe. Different thresholds have a significant influence on the amplitude of the centroid obtained by traditional centroid calculation. Moreover, due to the fixed threshold value, the distance of screening for the laser echo primary lobe data with different intensities can vary. The echo intensity data obtained by the traditional centroid algorithm are barely to correspond with the LiDAR transmission equation.
Table 4 shows the average intensity data and standard deviation of each method in the test. Compared with the other two algorithms, the integral value of the echo fluctuates significantly. The average and standard deviation of the echo intensity data obtained with the selected peak value and DSIW algorithm have the same order of magnitude. It is worth noting that the intensity data obtained DSIW have the smallest standard deviation, which proves that it has the strongest robustness to noise among the three methods in this paper.
Herein, we established the fitting relationship between BRF and echoed intensity with the three laser echo recording modes at 15 m with added Gaussian white noise of 42.5 dB, as shown in Figure 7.
As shown in Figure 7, all three methods’ laser echo intensities are linearly related to the reflectivity, which is consistent with the statement that these three methods can represent the echo intensity of LiDAR. The root-mean-square error (RMSE) of the fitting of the intensity data of DSIW and BRF is 0.01543, which is the smallest among the above fitting results. Therefore, it can be considered that, among the listed three methods, the intensity data of DSIW are more consistent with LiDAR transmission characteristics.

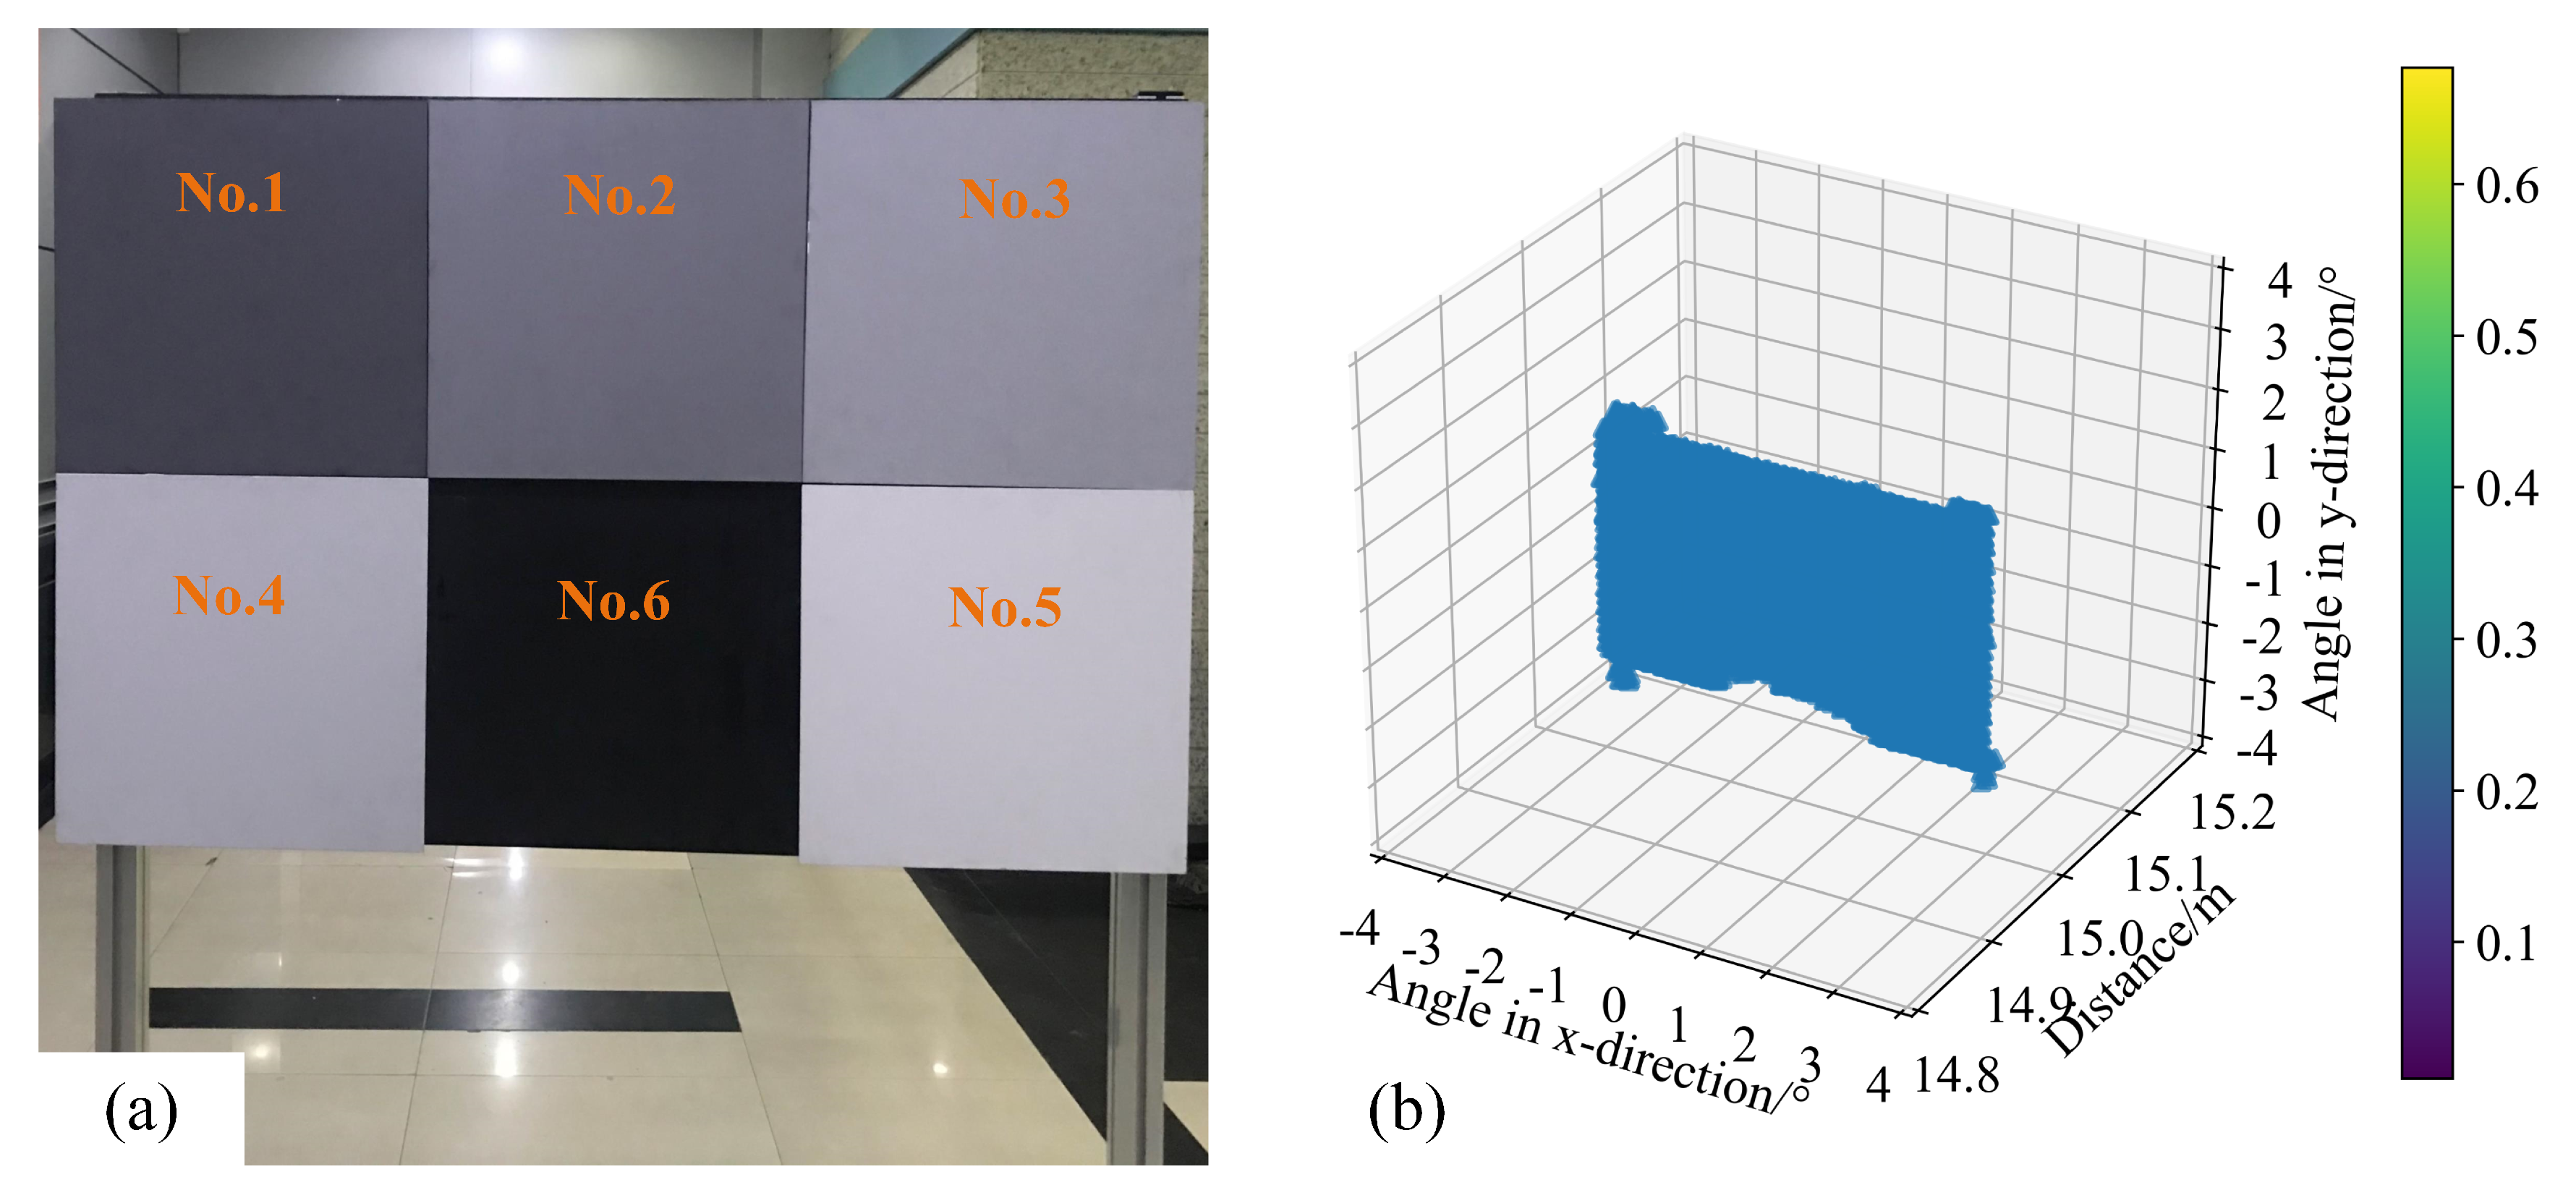
4.4. Distance–Intensity Imaging by the DSIW Waveform Centroid Algorithm

The point cloud imaging results calibrated by the proposed DSIW algorithm with the established proof-of-principle system are presented in this section. The imaged target consisted of five standard diffuse reflector boards—No.1, No.2, No.3, No.4, and No.5, as shown in Figure 8a. These standard diffuse reflectors were magnetically attached to a black metal backplane. Their shapes were identical. However, their surface reflectivity values were different. Herein, we call the uncovered black metal area No.6. The point cloud images calibrated by the proposed DSIW algorithm are presented in Figure 8b–d.
It can be seen that the distance image can provide the distance and shape of the target. However, it fails to demonstrate differences in the target’s surface. As shown in Figure 8b, the distance image has no effect on recognition of No.1, No.2, No.3, No.4, or No.5. However, the distance–intensity image provides intensity data, which can help identify and distinguish differences in the target’s surface. This shows that the point cloud image obtained by the DSIW algorithm can supply diverse information about the target and, thereby, achieve superior identification of several similar targets.

5. Conclusions

This paper reports an algorithm for single-point detection with LiDAR that can synchronously get the distance and laser echo intensity information. By establishing a proof-of-principle system and combining it with experiments, we prove the remarkable accuracy and ranging success rates of the proposed algorithm under relatively strong noise in comparison with typical ranging methods (DCFD, PK, GF, and TC). By measuring the laser echo intensities of targets with different reflectivity values over time, the intensity data obtained by this algorithm are robust to noise and are in accordance with the characteristics of the LiDAR transmission equation in comparison with some representative methods (waveform peak value, integral waveform value). Furthermore, we took a clear 3D point cloud image of the target of interest with the proof-of-principle system. This work contributes to existing knowledge of multi-dimensional point cloud acquisition by providing the double-scale intensity-weighted waveform centroid algorithm for LiDAR.

Author Contributions

S.Y. conducted the simulations and experiments and completed the manuscript. G.Y. gave some suggestions and revised this work. Q.L., B.Z. and Y.Z. carefully improved the presentation of this manuscript. Y.W. participated in data curation and plotting. C.W. modified this manuscript. All authors have read and agreed to the published version of the manuscript.

Funding

This work was supported by the National Natural Science Foundation of China (No. 61775048 and No. 62027823) and Natural Science Foundation of Shenzhen (No. JCYJ2020109150808037).

Acknowledgments

The authors would like to thank T.C. for supplying guidance in circuit design.

Conflicts of Interest

The authors declare no conflict of interest.

References

  1. Garcia-Moreno, A.I. Dynamic multi-sensor platform for efficient 3D-digitalization of cities. J. Comput. Inf. Ence Eng. 2019, 20, 1–15. [Google Scholar]
  2. Yindan, Z.; Chen, G.; Vukomanovic, J.; Singh, K.K.; Meentemeyer, R.K. Recurrent Shadow Attention Model (RSAM) for shadow removal in high-resolution urban land-cover mapping. Remote Sens. Environ. 2020, 247, 111945. [Google Scholar]
  3. He, P.; Wang, X.; Wan, Y.; Xu, J.; Yang, W. Automatic Registration Between Low-Altitude LiDAR Point Clouds and Aerial Images Using Road Features. J. Indian Soc. Remote Sens. 2018, 46. [Google Scholar] [CrossRef]
  4. Goodin, C.; Doude, M.; Hudson, C.; Carruth, D. Enabling Off-Road Autonomous Navigation-Simulation of LIDAR in Dense Vegetation. Electronics 2018, 7, 154. [Google Scholar] [CrossRef] [Green Version]
  5. Kim, J.K.; Kim, J.W.; Kim, J.H.; Jung, T.H.; Park, Y.J.; Ko, Y.H.; Jung, S. Experimental Studies of Autonomous Driving of a Vehicle on the Road Using LiDAR and DGPS. In Proceedings of the International Conference on Control, Automation and Systems (ICCAS), Busan, Korea, 13–16 October 2015; pp. 1366–1369. [Google Scholar]
  6. Jia, S.; Zhang, M.; Zhu, J. Gabor Wavelet Based Feature Extraction and Fusion for Hyperspectral and Lidar Remote Sensing Data. In Proceedings of the IGARSS 2018–2018 IEEE International Geoscience and Remote Sensing Symposium, Valencia, Spain, 22–27 July 2018. [Google Scholar]
  7. Xu, Z.; Guan, K.; Casler, N.; Peng, B.; Wang, S. A 3D convolutional neural network method for land cover classification using LiDAR and multi-temporal Landsat imagery. ISPRS J. Photogramm. Remote Sens. 2018, 144, 423–434. [Google Scholar] [CrossRef]
  8. Yang, J.Q.; Gu, G.; Qian, W.; Ren, K.; Chen, Q. Pulsed light time-of-flight measurement based on differential hysteresis timing discrimination method. Opt. Express 2020, 28, 23554–23568. [Google Scholar] [CrossRef]
  9. Chen, S.; Zhang, H.; Xu, X. Influence of time discrimination methods on ranging distribution of pulsed laser detecting tilted plane. Optik 2019, 179, 305–314. [Google Scholar] [CrossRef]
  10. Fieber, K.D.; Davenport, I.J.; Ferryman, J.M.; Gurney, R.J.; Walker, J.P.; Hacker, J.M. Analysis of full-waveform LiDAR data for classification of an orange orchard scene. ISPRS J. Photogramm. Remote Sens. 2013, 82, 63–82. [Google Scholar] [CrossRef] [Green Version]
  11. Hoefle, B.; Pfeifer, N. Correction of laser scanning intensity data: Data and model-driven approaches. ISPRS J. Photogramm. Remote Sens. 2007, 62, 415–433. [Google Scholar] [CrossRef]
  12. Chen, B.; Shi, S.; Gong, W.; Sun, J.; Chen, B.; Du, L.; Yang, J.; Guo, K.; Zhao, X. True-Color Three-Dimensional Imaging and Target Classification Based on Hyperspectral LiDAR. Remote Sens. 2019, 11, 1541. [Google Scholar] [CrossRef] [Green Version]
  13. Challis, K.; Carey, C.; Kincey, M.; Howard, A.J. Assessing the preservation potential of temperate, lowland alluvial sediments using airborne lidar intensity. J. Archaeol. Ence 2011, 38, 301–311. [Google Scholar] [CrossRef]
  14. Lin, H.; Zhang, Y.; Mei, L. A fluorescence Scheimpflug LiDAR developed for three-dimension profiling of plants. Opt. Express 2020, 28, 9269–9279. [Google Scholar] [CrossRef]
  15. Luo, S.; Chen, J.M.; Wang, C.; Gonsamo, A.; Qin, H. Comparative Performances of Airborne LiDAR Height and Intensity Data for Leaf Area Index Estimation. IEEE J. Sel. Top. Appl. Earth Obs. Remote Sens. 2017, 11, 300–310. [Google Scholar] [CrossRef]
  16. Blackburn, T.G.; Gerstmayr, E.; Mangles, S.P.D.; Marklund, M. Model-independent inference of laser intensity. Phys. Rev. Accel. Beams 2019, 23. [Google Scholar]
  17. Nilson, P.M.; Davies, J.R.; Theobald, W.; Jaanimagi, P.A.; Mileham, C.; Jungquist, R.K.; Stoeckl, C.; Begishev, I.A.; Solodov, A.A.; Myatt, J.F.; et al. Time-Resolved Measurements of Hot-Electron Equilibration Dynamics in High-Intensity Laser Interactions with Thin-Foil Solid Targets. Phys. Rev. Lett. 2012, 108, 085002. [Google Scholar] [CrossRef] [PubMed] [Green Version]
  18. Wagner, W. Radiometric calibration of small-footprint full-waveform airborne laser scanner measurements: Basic physical concepts. ISPRS J. Photogramm. Remote Sens. 2010, 65, 505–513. [Google Scholar] [CrossRef]
  19. Tan, K.; Cheng, X. Modeling hemispherical reflectance for natural surfaces based on terrestrial laser scanning backscattered intensity data. Opt. Express 2016, 24, 22971. [Google Scholar] [CrossRef]
  20. Jiang, Y.; Karpf, S.; Jalali, B. Time-stretch LiDAR as a spectrally scanned time-of-flight ranging camera. Nat. Photonics 2020, 14. [Google Scholar] [CrossRef]
  21. Wagner, W.; Ullrich, A.; Ducic, V.; Melzer, T.; Studnicka, N. Gaussian decomposition and calibration of a novel small-footprint full-waveform digitising airborne laser scanner. ISPRS J. Photogramm. Remote Sens. 2006, 60, 100–112. [Google Scholar] [CrossRef]
  22. Koldunov, M.F.; Manenkov, A.A.; Pokotilo, I.L. Pulse-width and pulse-shape dependencies of laser-induced damage threshold to transparent optical materials. In Proceedings of the SPIE—The International Society for Optical Engineering; SPIE: Bellingham, WA, USA, 1996; Volume 2714, pp. 718–730. [Google Scholar]
  23. Sun, T.; Xin, J. Pulse delay-controlled passive Q-switched laser with tunable pulse width. Opt. Eng. 2019, 58, 036102.1–036102.7. [Google Scholar] [CrossRef]
Figure 1. Schematic diagram of the pulsed LiDAR system.
Remotesensing 13 00432 g001
Figure 2. Flowchart of the DSIW waveform centroid algorithm.
Remotesensing 13 00432 g002
Figure 3. Experimental equipment diagram.
Remotesensing 13 00432 g003
Figure 4. Echoes of the standard diffuse reflector with a bidirectional reflectivity factor (BRF) of 50% at different distances.
Remotesensing 13 00432 g004
Figure 5. The laser echoes of the tests: (a) a laser echo in test.1;(b) a laser echo in test.2; (c) a laser echo in test.3; (d) a laser echo in test.4; (e) a laser echo in test.5; (f) a laser echo in test.6.
Remotesensing 13 00432 g005
Figure 6. The histogram of ranging error distribution: (a) the ranging error distribution of each method in test.1; (b) the ranging error distribution of each method in test.2; (c) the ranging error distribution of each method in test.3.
Remotesensing 13 00432 g006
Figure 7. Fitting result of BRF and laser echo intensity. (a) Relationship of BRF and the echo peak value, (b) relationship of BRF and the echo integral value, and (c) relationship of BRF and the amplitude of the echo’s centroid.
Remotesensing 13 00432 g007
Figure 8. The scanning target and its point clouds. (a) The scanning target, (b) point cloud without intensity data, and (c,d) the distance–intensity point clouds of the target.
Remotesensing 13 00432 g008aRemotesensing 13 00432 g008b
Table 1. Specifications of the experimental instrument.
ParameterValue
Laser wavelength1064 nm
Laser pulse width4 ns
Angle of divergence0.5 mrad
Transmitting system optical aperture32 mm
Receiving system optical aperture50 mm
Size of avalanche photodiode (APD) photosensitive surface3 mm
APD response frequency band250 MHz
Oscilloscope sampling rate5 GSa/s
Oscilloscope bandwidth1 GHz
Oscilloscope sampling digit14 bit
Table 2. Average absolute ranging error and ranging standard deviation.
TestABRE of DCFDRSD of DCFDABRE of PKRSD of PKABRE of GFRSD of GFABRE of TCRSD of TCABRE of DSIWRSD of DSIW
No.10.54 ns1.43 ns0.37 ns0.32 ns0.34 ns0.01 ns2.41 ns0.46 ns0.30 ns0.26 ns
No.20.40 ns0.00 ns0.27 ns0.24 ns0.25 ns0.23 ns0.36 ns0.00 ns0.21 ns0.19 ns
No.30.40 ns0.00 ns0.25 ns0.25 ns0.23 ns0.19 ns0.26 ns0.00 ns0.20 ns0.19 ns
No.41.66 ns5.67 ns1.19 ns1.42 ns0.51 ns0.32 ns18.60 ns0.28 ns0.31 ns0.22 ns
No.50.40 ns0.00 ns0.72 ns0.32 ns0.45 ns0.32 ns12.11 ns0.22 ns0.21 ns0.22 ns
No.60.40 ns0.00 ns0.32 ns0.21 ns0.30 ns0.21 ns0.36 ns0.00 ns0.21 ns0.17 ns
Table 3. Ranging success rates of the algorithms.
No. of TestTest 1Test 2Test 3Test 4Test 5Test 6
DCFD algorithm95.64%100.00%100.00%95.22%100.00%100.00%
PK algorithm99.00%100.00%100.00%79.44%100.00%100.00%
GF algorithm99.22%100.00%100.00%79.76%100.00%100.00%
TC algorithm77.50%100.00%100.00%66.08%75.20%100.00%
DSIW algorithm100.00%100.00%100.00%97.00%100.00%100.00%
Table 4. Average intensity data and standard deviation of each method with added Gaussian white noise of 42.5 dB.
Bidirectional Reflectivity Factor (BRF)Average Waveform Peak ValueStandard Deviation of Waveform Peak ValueAverage Waveform Integral valueStandard Deviation of Waveform Integral ValueAverage Amplitude of Centroid by DSIWStandard Deviation of Amplitude of Centroid by DSIW
10%0.1508 V0.0049 V1.9686 V0.0613 V0.1344 V0.0014 V
20%0.2507 V0.0054 V3.1798 V0.0676 V0.2305 V0.0026 V
35%0.4189 V0.0067 V5.3307 V0.0839 V0.3797 V0.0031 V
50%0.5379 V0.0093 V6.8029 V0.0819 V0.4912 V0.0024 V
75%0.7379 V0.0097 V9.2571 V0.1098 V0.6769 V0.0027 V
Publisher’s Note: MDPI stays neutral with regard to jurisdictional claims in published maps and institutional affiliations.

