
Landslide Extraction from High-Resolution Remote Sensing Imagery Using Fully Convolutional Spectral–Topographic Fusion Network


1
Aerospace Information Research Institute, Chinese Academy of Sciences, Beijing 100094, China
2
Computer Network Information Center, Chinese Academy of Sciences, Beijing 100190, China
3
University of Chinese Academy of Sciences, Beijing 100049, China
*
Author to whom correspondence should be addressed.
Remote Sens. 2021, 13(24), 5116; https://doi.org/10.3390/rs13245116
Submission received: 29 October 2021
/
Revised: 9 December 2021
/
Accepted: 10 December 2021
/
Published: 16 December 2021
(This article belongs to the Special Issue Explainable Artificial Intelligence (XAI) in Remote Sensing Big Data)
Abstract
:Considering the complexity of landslide hazards, their manual investigation lacks efficiency and is time-consuming, especially in high-altitude plateau areas. Therefore, extracting landslide information using remote sensing technology has great advantages. In this study, comprehensive research was carried out on the landslide features of high-resolution remote sensing images on the Mangkam dataset. Based on the idea of feature-driven classification, the landslide extraction model of a fully convolutional spectral–topographic fusion network (FSTF-Net) based on a deep convolutional neural network of multi-source data fusion is proposed, which takes into account the topographic factor (slope and aspect) and the normalized difference vegetation index (NDVI) as multi-source data input by which to train the model. In this paper, a high-resolution remote sensing image classification method based on a fully convolutional network was used to extract the landslide information, thereby realizing the accurate extraction of the landslide and surrounding ground-object information. With Mangkam County in the southeast of the Qinghai–Tibet Plateau China as the study area, the proposed method was evaluated based on the high-precision digital elevation model (DEM) generated from stereoscopic images of Resources Satellite-3 and multi-source high-resolution remote sensing image data (Beijing-2, Worldview-3, and SuperView-1). Results show that our method had a landslide detection precision of 0.85 and an overall classification accuracy of 0.89. Compared with the latest DeepLab_v3+, our model increases the landslide detection precision by 5%. Thus, the proposed FSTF-Net model has high reliability and robustness.
1. Introduction
A landslide is a type of natural disaster that is very common. In addition to its impact on the physical environment, landslides often have serious socio-economic impacts [1]. The accurate extraction of landslide disasters can provide key information for their early prevention. Remote sensing datasets and processing technologies (such as segmentation [2] and classification [3]) can be used to provide services for quick information extraction and the emergency management of landslide disasters. Compared with synthetic aperture radar (SAR) and light detection and ranging (LiDAR), optical imaging sensors are more easily supported by different platforms and have significant advantages including their wide coverage, short update cycle, few environmental limitations, and large amount of information. With the increasing number of satellites, the number of optical remote sensing images is rapidly increasing. Therefore, landslide extraction using optical remote sensing images has become a research hotspot in recent years [4,5,6,7]. As an increasing number of remote sensing satellites with high spatial resolution (<2 m) are being launched, researchers are able to obtain more abundant and detailed ground object information. In addition to more effective spectral information, information such as ground-object texture, geometric structure, and shape can also be obtained, which will improve the landslide extraction accuracy of distribution, quantity, and contour [8,9,10].
Current landslide information extraction methods using high-resolution remote sensing images are mainly divided into pixel based and object based [11,12]. In a study by Yong et al. [13], landslides were extracted from high-resolution remote sensing images based on the optimal partition algorithm. The random forest algorithm has also been used to extract landslide information based on the texture feature of Landsat 8 images [14]. The pixel-based method relies on the homogeneous radiation assumption of landslides represented by heterogeneous polygons. Therefore, it is unable to process the multi-level spatial details of landslides provided by high-resolution images. Different machine learning methods and classifiers have been integrated with object-oriented extraction and used for landslide extraction. Heleno et al. [3] applied an automatic landslide extraction method for rainfall-induced landslides on Madeira Island using the support vector machine (SVM) and object-oriented with a radial basis function kernel. Ma et al. [15] used wordview2 images for the automatic detection of shallow landslides, and the object-oriented method had a relatively high accuracy which could reach 85%. Efstratios Karantanellis et al. [16] developed a new object-based image analysis (OBIA) methodology, and its outputs demonstrated the potential for the accurate characterization of individual landslide objects. Since a landslide is a slope sliding process, the topographic-driven segmentation of the study area is of significance for the object-based methods [2,8,17]. From the perspective of mode identification, the selection of artificial thresholds and representative feature extraction limits the accuracy of landslide-information extraction. Therefore, the accuracy can be effectively improved by automatic feature learning from remote sensing datasets rather than manually performed, since we can carry out ground object classification and landslide extraction using effective features.
Great theoretical and practical significance is involved in the application of deep learning to remote sensing images and performing research into intelligent analysis with target identification and ground-object classification [18]. Recently, various deep learning architectures based on graph convolutional networks (GCNs) [19], generative adversarial networks (GANs) [20] and long short-term memory (LSTM) [21] have been applied to remote sensing, and they have been shown to produce state-of-the-art results. Multilayer autoencoders (AEs) are usually used for spectral–spatial feature learning and have good effects [22]. Residual spectral-spatial attention networks [23] have made great progress in hyperspectral image classification. A gated bidirectional network was proposed for the feature fusion of remote sensing scene classification [24]. Current deep learning methods have demonstrated advantages in landslide extraction. Ding et al. [25] applied the convolutional neural network (CNN) structure to landslide detection using GF-1 images in Shenzhen, and the landslide detection rate was 72.5%. Using a CNN and an improved region-growing algorithm, Yu et al. [26] extracted the area and boundary of landslides which exhibited high accuracy in the landslide extraction. A CNN model was developed by Lei et al. [27] to solve the complexity and spatial uncertainties of landslides. Nikhil Prakash et al. [4] presented a modified U-Net model for the semantic segmentation of landslides at a regional scale from EO data, and it has a better performance than traditional machine methods. Haojie Wang et al. [28] proposed a deep-learning method to identify natural terrain landslides using integrated geodatabases, which outperforms other machine learning algorithms due to its strengths in feature extraction and multi-data processing. Multiple deep learning networks including VGG16, VGG19, ResNet50, ResNet101, DenseNet120, DenseNet201, UNet−, UNet+, and ResUNet were compared in the study of Chang Li et al. [29]. Results showed that VGG models have the highest precision but the lowest recall. Shengwu Qin et al. [30] introduced a distant domain transfer learning (DDTL) method for landslide detection and classification, which outperforms traditional CNN methods. In these studies, good results could only be obtained based on a large number of training samples. Moreover, these methods were only applicable to specific areas. If cross-scenes and multiple sensors were taken into account, the performance of these models would be greatly reduced. Therefore, a landslide extraction network with a lifelong learning ability should be built.
Internal factors such as topography, geological structure, and lithology are the primary causes of landslides, while external factors including rainfall, underground water, surface water, human activities, and earthquakes accelerate the occurrence of landslides. Owing to the complexity and uncertainty of landslides, it is challenging to extract landslide information. It was effective to detect landslides based on different features, given that landslides had no unique spectral features and shapes. For instance, NDVI [9], topographical features (slope, aspect, and curvature) [31], morphological features [15], and other geological features have been used for landslide detection and extraction. A residual network was trained based on spectral and topographical features, and the results of different feature integration strategies were compared [6]. Xu et al. [32] proposed an end-to-end network model for post-earthquake landslide segmentation and extraction, and a number of non-landslide areas were removed through the comprehensive use of the geological features to improve the overall extraction accuracy. Peng Liu et al. [33] proposed improved U-Net model adding a spatial information band (DSM, slope, and aspect), and the extraction accuracy is 13.8% higher than the traditional U-Net model. With the accumulation of multi-source data, such as remote sensing and basic geographic data, it is necessary to integrate multi-source data into the network to design an appropriate network structure, thereby improving the accuracy of landslide extraction.
The contributions of this study include the following aspects. (1) Given that image segmentation and classification could be integrated using the fully convolutional network, such a network was chosen as the basic network for the pixel-level classification of landslides and surrounding ground objects, which provided the quantity of landslides as well as distribution, and contour information. (2) Based on the atrous convolution, pyramid pooling, an encoder–decoder structure, the multi-scale feature, and contextual information of the fully convolutional network model were effectively integrated. Moreover, the multi-source data (slope, aspect, and NDVI data) were input into the branch network to extract the features and then fused with the feature extracted by optical remote sensing RGB images. A landslide information extraction model of a fully convolutional spectral–topographic fusion network, named FSTF-Net, was proposed. The FSTF-Net model can not only identify different shapes of landslides and ground objects but also obtain clear landslide boundaries. Our approach can considerably improve the extraction accuracy of landslides and surrounding ground objects.
2. Methods
In this paper, a fully convolutional spectral–topographic fusion network to extract landslide information from high-resolution remote sensing imagery is proposed. It contains three stages: data preparation, training, and classification stages, which are illustrated in Figure 1. In the data-preparation stage (Figure 1a), the image data, slope, aspect, NDVI data, and labeled data were sliced into small patches using superpixel segmentation. Meanwhile, the multistage sampling 16 [34] method was employed to ensure that the sample proportions of various classes were relatively balanced. In the training stage, training samples were input to the proposed FSTF-net network (Figure 1b), and the stochastic gradient descent (SDG) was used to update network parameters. In the final stage, the trained FSTF-Net network was performed on test data to generate the classification results of landslides and surrounding ground objects.
2.1. Encoder–Decoder
To obtain the classification results of each pixel, not only is the class information of the target required, but so is the location information. The encoder–decoder network structure [35] was adopted in this study, which conformed to the end-to-end learning mode. The encoding part was used to extract the deep and abstract feature based on which the decoding part obtained the pixel-level prediction results.
2.1.1. Resnet and Atrous Spatial Pyramid Pooling
In this study, the encoding structure chooses the ResNet50 feature extraction part (conv1-block4) combined with ASPP as the backbone of the encoding module. The structure of ResNet50 consists of one convolution layer and four blocks. Each block has several bottleneck units. Inside the bottleneck unit, there is a shortcut connection between the input and output. The bottleneck unit solved the vanishing gradient problem. Original images are downsampled by 1/32 in the standard ResNet50. It changed the 3 × 3 convolution stride of the first bottleneck in block4-1. For the receptive field, kept unchanged from the remaining convolution kernels in block4, the standard convolution was replaced with atrous convolution with the rate of 2 to obtain 16 times downsampled feature maps of the original image.
Landslides have different directions, structures, boundaries, and shapes, and thus the multi-scale feature must be considered and redundant information eliminated so as to improve the accuracy of extraction. Since there is severe non-uniformity in the landslide area, it is difficult to obtain effective landslide features. However, this difficulty can be solved by the pyramid pooling (PP) module, which is suitable for the feature learning of the landslide area and solving the misclassification problem of small area landslides.
In order to achieve the effectiveness of feature learning, we extract the output from convolutional layers of different scales. The last block in the ResNet50 network (block4 of ResNet50) is replicated in parallel by the ASPP network. There were four parallel atrous convolutions, one 1 × 1 convolution and three 3 × 3 convolutions at expansion rates of 6, 12, and 18. Global average pooling is applied to the lasted feature image to include global contextual information into the model and generate a 1 × 1 convolution kernel with 256 filters. It provides better global information than the maximum pooling. The final output of the encoding stage is the fusion result of multi-scale feature maps. After fusion, 1 × 1 convolution is used to reduce the dimensionality of three feature maps of different sizes, and enter the decoding module to obtain a feature map with the same size as the original image. Figure 2 shows details of the encoder structure.
2.1.2. Decoder
Inspired by the encoding–decoding structure from UNet which has been widely used in the dense semantic classification task of remote sensing images, the skip connection between the downsampling path and the upsampling path restores the spatial information lost during the maximum pooling operation [36]. The decoder structure connects the convolutional layer with the corresponding deconvolutional layer so that the deconvolutional layer can perform targeted upsampling operations. Based on feature fusion from the encoder structure, the multi-step decoder structure is adopted to restore the original resolution of the feature map. The feature map is bilinearly two times upsampled and concatenated with the corresponding low-level feature in the encoder part, which is the conv1 of bottleneck4 in block2 of ResNet, and then the lower level feature in ResNet (conv1 of bottleneck3 in block1) also used to be fused. The image resolution is refined after the last layer skip connection. As part of FSTF-Net, the Resnet + ASPP + encoder–decoder (RAE-D) network structure is illustrated in Figure 3, which only can be trained by high-resolution RGB images.
Based on the integration of multi-scale features and contextual information in remote sensing pixel-level semantic classification, the RAE-D network structure of the RGB image feature was used in this study. Equipped with the advantages of atrous spatial pyramid pooling (ASPP) and the encoder–decoder structure, a feature pyramid with different levels was generated by the encoder. The low-level feature focused on details, while the high-level feature focused on the overall situation. The PP module was integrated into the backbone network to overcome the global pooling problem. In the decoder, an additional connection was added to the network so as to provide access to low-level information for the top-level classification layer. Two skip connections were used to integrate the low-level and high-level features into the final feature map, thereby effectively obtaining more contextual information and transmitting detailed information from the lower layer to a higher layer. Hence, the spatial information destroyed by pooling could be better restored, and the landslide obtained after the decoder in the final prediction had a clear boundary contour.
2.2. Proposed FSTF-Net
In this study, a landslide information extraction model named FSTF-Net based on the fully convolutional network of multi-source data fusion was proposed that is composed of a fully convolutional network containing encoding and decoding stages and adding a completely different branch in the networks. The final feature is obtained after the RGB band of the image entered one branch structure composed of Resnet50 and ASPP. In addition, the features of the slope, aspect, and NDVI were effectively extracted in another branch and then integrated into the backbone framework to improve the extraction accuracy of landslides and surrounding ground objects.
2.2.1. Fusion of Multiple Sources
The multi-source data fusion strategy based on the deep-learning classification network can be divided into layer stacking [7] and feature fusion [37], as shown in Figure 4. Multiple sources are integrated as multiple inputs of the single network model in layer stacking, and the number of input channels is increased. Targeted learning cannot be carried out on the multi-source image data. In addition, different features have different semantic expressions, thus the effect of layer stacking is not ideal [6]. In this study, a feature-level fusion based on multi-source remote sensing-image data was researched. Multiple features were independently obtained through the backbone structure of different branches, then the feature was fused and input into the classifier, and the weight coefficients of each feature were automatically learned. The method improved image classification performance and information extraction accuracy.
There are two methods of achieving feature-level fusion. In early studies, the corresponding elements of two input vectors were directly added or multiplied, or the maximum value was taken [38]. The other method was to concat multiple vectors on a specified axis. Recent studies [39,40] showed that the mode of concat could more effectively encode features of different sources. Thus, the mode of concat for feature fusion was used in the network structure in this study, as shown in Figure 5.
The design of network architecture is difficult when the different sources of input data are collected. Therefore, a network model must be designed based on the input datasets and types. In this study, landslide extraction was based on the spectral, slope, aspect, and NDVI using the proposed fusion network, and two parallel independent branch networks were used as feature extractors to convert the spectral data and topographical data into the abstract features for representation. Before classification, these features were fused through Concat, that is, various feature vectors were stacked on the specific axis and classified after being restored to the original resolution through the decoding module, thereby realizing landslide-information extraction.
(i = 1, 2,…, n) is the output of the branch network to be fused. The function is the feature fusion operation in the third dimension. The fusion equation is:
2.2.2. Spectral–Topographic Fusion Network
In this study, a new fusion network model FSTF-Net was proposed to extract landslides and surrounding ground-object information from high-resolution remote sensing images based on spectral and topographical information. The aim was to obtain superior extraction results from multi-source data fusion than from single-source images. As core parts, ResNet, PP, VGGNet, and feature fusion were used in this study. FSTF-Net is composed of two parallel networks that were merged at the final stage so that the entire network could learn the fusion feature of branch networks. The spectral RGB data and multi-source data (NDVI, slope, and aspect) were inputs of the proposed FSTF-Net. The scheme of the proposed FSTF-Net is displayed in Figure 6.
In the study of Sameen et al. [6], the CNN model had better performance than that of ResNet for inputs such as topographical variables. When the CNN model is used for landslide extraction, a deeper-level model does not ensure better accuracy, and the network depth has no impact on the final results. Therefore, to build a network with computing memory efficiency, conv1 to conv5 of VGG-16 were selected to extract high-level features of multi-source data as the backbones of branch networks with the topographical data and NDVI data. The branch through four iterations of 2-fold downsampling and the 16 times downsampled feature map was eventually generated, as shown in Figure 7.
The FSTF-Net network integrates the advantages of multi-scale atrous convolution and skip connections, which can not only obtain multi-scale features and retain contextual information, but also improve the extraction ability of slope, aspect, and NDVI. The network structure is shown in Figure 8. The red dotted line in the figure represents the features extracted from the high-resolution RGB images using Resnet with the ASPP branch network, and the blue dotted line shows the extraction of the slope, aspect, and NDVI multi-source data feature using the VGG-16 branch network. The high-level output features from the branch network are fused. Then, the fusion network model was trained based on error back-propagation. In this study, the cross-entropy function was used as the loss function, and the network parameters were updated using SDG. Conditional random fields (CRFs) were not used for post-processing because the adjustment of additional hyper-parameters was required, which only leads to a small improvement or even adverse effects.
The loss function of the model is calculated by cross-entropy loss:
Cross-entropy is a well-known and default loss function, where is the output value of the softmax that corresponds to the prediction value of each pixel, and is the result of true classification, which means the pixel point of the label value. , b, , and are the jth weight of the ith neuron, bias, ith output of the network, and the actual classification result. Dropout was introduced into the method, which reduced the number of iterating parameters during training and prevented over-fitting.
In the training stage of the model, we used stochastic gradient descent (SGD) for parameters updating:
where is the parameter increment, which is the combination of the original parameter, gradient, and historical increment, and are the original and updated parameters:
where is used to control the iteration step length by the preset learning-rate parameter; is the cost function; and and are the parameters of the weight decay and momentum.
2.3. Dropout and Batch Normalization
In this study, the feature extraction ability of the proposed FSTF-Net structure gradually improved with the increasing number of network layers, however, the number of parameters in the network also increased. This leads to overfitting, resulting in the degradation of network performance. Hence, dropout [41] and Batch Normalization (BN) [42] were introduced to the network to improve the calculation and learning efficiency. The dropout set a probability to eliminate the nodes in the neural network, thereby reducing the number of iterative parameters and preventing overfitting. BN was added to each convolutional layer in this study to reduce the difference in data distribution, thereby eliminating the local fluctuation caused by weight updating and lowering the probability of overfitting. In the network structure, the BN layer was inserted before inputting the data of each layer to the activation function. The input of the batch was set to , and the training parameters of the BN algorithm are γ and β.
Mini-batch mean—indent:
Mini-batch variance:
Normalize:
The output of batch normalization:
To introduce dropout to the network structure, it was added to the bottom layer of the network structure before the classifier and after the rectified linear unit (ReLU) activation function and BN layer, as shown in Figure 9. Through the dropout and BN optimization, the proposed network achieved good classification results and showed great generalization ability.
3. Experiment and Comparison
3.1. Study Area
Mangkam County, in the southeast of the Qinghai–Tibet Plateau, China, was taken as the study area in the present work (Figure 10). It is located in the plateau monsoon climate region with a rough topography, frequent geological disasters, and severe environmental conditions (low pressure, anoxia, severe cold, gales, and intense radiation). Since there is no communication signal in most regions and people have to cross a wide range of depopulated zones, it is very difficult to manually explore landslide disasters. It is also difficult for short-range unmanned aerial vehicles (UAVs) to monitor detailed terrestrial changes within a severe environment. Thus, using high-resolution satellite remote sensing to obtain surface information has become the only choice.
3.2. Datasets
Our datasets are composed of three different high spatial resolution optical satellite remote sensing data from January to March 2018, including Beijing-2, WorldView 3, and SuperView-1, as shown in Table 1. Among them, Beijing-2 is capable of collecting satellite imagery with a spatial resolution of 0.8 m panchromatic and 3.2 m spatial resolution multispectral bands. The WorldView-3 satellite images include a panchromatic image with 0.31 m spatial resolution and eight-band multispectral imagery with a resolution of 1.24 m, and it can be applied to the extraction of key elements of the landslide body. SuperView-1 satellite images include panchromatic images with a 0.5 m spatial resolution and multispectral imagery with a resolution of 2 m. Taking into account the needs of landslide information extraction and the monitoring of the surrounding environment, since the edges of landslides have a certain degree of ambiguity, our datasets were labeled into the following six classes: landslide, building, forest, water, road, and bare land, which can better distinguish the landslides and surrounding ground objects in the study area (Figure 11).
Owing to the regionality of landslide disasters, topographical data (slope and aspect) and NDVI data were chosen as the extraction factors in our study with which to measure the difference between landslide and non-landslide features based on the geological conditions, environmental feature, and topography in the study area and its surrounding areas. Although other factors such as rainfall and geological structure (lithology and seismic intensity) were also important for landslide extraction, due to the small coverage of high-resolution remote sensing data in the study area, the rainfall and geological structure were not significantly changed.
A stereoscopic image obtained by Resources Satellite 3 was used to generate the DEM, the accuracy of which can reach 5 m. The images of the study area collected by Resources Satellite 3 in February 2018 had a product level of 1A (radiation correction product through pre-processing) and a cloud cover of 0%. At the stage of pre-processing datasets [43,44], in order to fit the inputs of the fully convolutional network model, we applied the resampling method of cubic convolution [45] to process the DEM to the spatial resolution of 0.3 m. The NDVI data were calculated from Landsat 8 (30 m) and resampled to match the same resolution of the network input. Two topographical data (slope and aspect) were generated by the DEM. The source and format of the obtained landslide-extraction factors are shown in Table 2. All data were converted into grid format in the WGS-1984 coordinate system. The construction of the landslide information database was mainly derived from 175 pairs of sample data, including remote sensing images, topographical, NDVI, and label data. The sample dataset was organized in the format of “image–label” and for each pixel in the original image, the corresponding ground-object class and feature values of multi-source data could thus be obtained (Figure 12).
3.3. Training and Metrics
Based on the aforementioned datasets, two experiments were designed to verify the proposed method as follows: (1) high-resolution RGB images were used to train the encoding–decoding structure RAE-D of the FSTF-Net model, and (2) RGB images and multi-source data were integrated to train the FSTF-Net model.
To evaluate the effectiveness of multi-source data fusion, the feature learning performances of four end-to-end classification network models (ASPP, DeeplabV3+, RAE-D, and FSTF-Net) were compared. ASPP and DeeplabV3+ were used as universal high-resolution remote sensing image classification networks. Because of the triple-channel network structure, multi-source data fusion could not be realized. RAE-D is an important branch structure of the proposed FSTF-Net model. As a branch network of RGB high-resolution remote sensing image inputs, RAE-D is used as a reference structure for comparing the effect of non-multi-source data fusion on the final performance. The results showed the effectiveness and advantages of the FSTF-Net.
Our approach was based on the TensorFlow framework in the Linux system environment. The network layers were built through Tersorflow.keras, which can easily realize the customization of multiple networks. The Sklearn library was used to evaluate the final accuracy. Our training used the SGD method for 300 epochs. A “step” policy for the learning rate adjustment (gamma = 0.1, step-size = 15,000) was used during each epoch. Batch normalization was used for optimization after each convolutional layer. The basic parameters for calculating the increments were m = 0.9 and dw = 0.0005, and the base learning rate was 0.001. In the training stage, we first randomly shuffled all of the samples and subsequently fed them into the network in batches. The labeled data were used to evaluate their accuracy. To ensure the consistency of the comparison of algorithms, these models used the same training and test datasets.
The performance of the various methods can be evaluated based on the criteria as follows: per-class precision, overall accuracy (OA), average recall average, and F1-score G-mean, which are considered easily interpretable and have better theoretical properties than other classification measures. The research of this paper was mainly for the information extraction of landslides and surrounding ground objects from high-resolution remote sensing images. However, due to the fuzzy boundaries of the extracted landslides and the complicated internal structure, it is difficult to accurately evaluate the results of the landslide information extraction using only the evaluation method of classification accuracy. Taking into account the existing accuracy evaluation methods, our landslide extraction accuracy indicators are mainly divided into two schemes: the remote sensing image classification accuracy evaluation method based on the confusion matrix and the specific landslide target detection accuracy evaluation method based on error analysis.
The following indicators are used as the classification accuracy evaluation criteria:
where , , , and represent the numbers of true positives, true negatives, false positives, and false negatives as predicted by the network model, respectively.
For the evaluation of the extraction results of a single landslide-specific target, a more reliable evaluation method was to use the error analysis of the evaluation of the accuracy of landslide extraction. The samples here are also divided into (the landslide that was correctly detected), (which was a landslide that was not detected as a non-landslide), (a non-landslide that was correctly classified), and (it was a non-landslide that was falsely detected as a landslide). The four evaluation parameters used were: detection percentage (), which indicates the probability that the algorithm correctly recognizes the landslide; the omission error affected by , also known as the omission errors (); The misclassification error, affected by , is also called commission errors (); quality percentage () is a comprehensive index of the target extraction accuracy which is affected by and . The higher the , the higher the overall accuracy of landslide extraction. The definition of the four comprehensive accuracy indicators is:
3.4. Experimental Results
To better evaluate the performance of our method in the extraction of landslides and surrounding ground objects, Basic FCN, FCN-8s, ASPP, and DeepLab_v3+ [46] were adopted as the baseline for the comparison to our proposed model. Our model achieves the highest OA value of 0.89. Although the model has little improvement in terms of overall accuracy, there were significant changes from DeepLab_v3+ in the classification accuracies for the landslides: the accuracies of extraction were enhanced by 0.03. As shown in Table 3, the accuracy of landslide extraction reaches approximately 0.86. As part of FSTF-Net, the Resnet + ASPP + encoder–decoder (RAE-D) also performed very well on small targets for roads’ and buildings’ classification accuracies with 0.80 and 0.78, respectively.
Overall, according to the consistency analysis of Table 3 and Figure 13, although the RAE-D network obtained high classification accuracy, our FSTF-Net obtains the highest accuracy among all methods in the experiment. This is because the architecture of FSTF-Net combines spectral information from RGB and NDVI images, with geographical information from slope and aspect.
This approach was also evaluated for landslide extraction accuracy based on error analysis. The DP, OE, CE, and QP for landslides in these experiments are shown in Table 4. Compared with the results obtained by ASPP and DeeplabV3+, the results showed that the proposed FSTF-Net method was better in landslide extraction. The purpose of multi-source data fusion by deep learning in this study was to improve the final accuracy of landslide extraction through the integration of more types of data, including basic geographical data such as DEM data and traditional RGB image data, thereby obtaining a better representation of landslide features.
4. Discussion
4.1. Importance of Multi-Source Data Fusion
The encoding–decoding structure of RAE-D only takes RGB images as input. Compared with Deeplabv3+, this adds a skip connection to restore the detailed information of ground objects. As shown in Figure 14, landslides can be identified based on spectral information. When using the feature fusion network FSTF-Net, the additional topographic information could improve performance in the extraction of landslides and surrounding ground objects and reduce the salt-and-pepper noise. It is worth noting that DeeplabV3+ cannot distinguish small targets well because it has fewer low-level features compared to FSTF-Net and RAE-D.
A deep convolutional network is effective in the recognition of complex image patterns and semantic classification. However, whether the landslide boundary can be obtained in pixel-level classification should be discussed. For the explanation, the landslide areas extracted by FSTF-Net and RAE-D were overlapped, as shown in Figure 15a,b. Different models were used to compare the landslide boundary and range in the area. The red area is the true value of the yellow part of RAE-D, and the purple is that of FSTF-Net. It can be seen that the FSTF-Net benefited from the multi-source data, and the extracted landslide boundary was significantly better with a more complete shape. The landslide area in the figure has some additional extended structures that can be learned from the topographical feature. In summary, the results of FSTF-Net were more accurate, continuous, and close to the true value.
In addition, although topographical information does not significantly improve the overall accuracy of the results, it is very helpful for distinguishing built-up areas from landslide areas which have similar spectral features. As shown in Figure 16, the red polygon marks the landslide area and the blue polygon marks the non-landslide built-up area. Their topographical information can be effectively distinguished because most landslides usually occur on steep slopes. From the hill shade, slope, and aspect, the blue flat area is unlikely to be a landslide area. Therefore, by training and learning the topographic features of landslides, the FSTF-Net model can clearly distinguish a landslide area from a non-landslide area. The deep fusion network proposed in this study not only used two-branch networks to obtain multiple features at the same time but also learned the multi-scale expression of the feature from the branch networks. Without an additional supervised learning method, different branch networks were integrated into the network to improve the extraction capabilities of the network.
4.2. Analysis of Landslide Change Detection
The landslide extraction results of the FSTF-Net model from the March 2018 images were compared with those from the January and February 2018 images to analyze the landslide information changes in some areas of the study area from January to March 2018.
Figure 17 shows the specific information of new landslide area #1. The area is located near an artificial mining area, and there landslides have already occurred nearby. (a) The red polygon area was bare land in January 2018. (b) The red polygon area was a half-bare-hand and half-landslide area in February 2018. (c) The red polygon area in March 2018 became a landslide area. In March 2018, there were a few bare land areas and many landslides, possibly due to mining activities.
Figure 18 shows the information for new landslide area #2. This area is located in an unstable area, where there have already been landslides nearby. (a) The red polygon area was bare land in January 2018 and (b) was also bare land in February 2018 without any obvious changes. A small number of gravel fragments can be seen at the bottom, which is a sign of geological activity. (c) In March 2018, most of the red polygon area represented landslides. In terms of landslide monitoring, the present study provides useful ideas for change detection by the post-classification comparison of landslides and the surrounding ground objects.
4.3. Applications of Proposed Approach
To verify the feasibility and applicability of the proposed approach, the high-resolution remote sensing images of landslides caused by the Jiuzhaigou earthquake were used for the information extraction of the landslide and surrounding ground objects. The datasets were used as the experimental data, as shown in Table 5. We also obtained the resampled DEM and NDVI results by using the cubic convolution method in order to fit the inputs of the fully convolutional network model. In the plateau area under the same constraints, the FSTF-Net model that was trained in the Mangkam County area was used for transfer learning. Results show that the model can directly identify and classify the Jiuzhaigou landslide and surrounding ground objects without extra training. Thus, the proposed FSTF-Net model has great advantages in cross-scene and multi-sensor scenarios.
In this study, the classification accuracy of the Jiuzhaigou landslide and surrounding ground objects using the FSTF-Net model is shown in Table 6. Among the results, the classification accuracy of vegetation was the highest, reaching approximately 88%. The accuracy of the landslides was also impressive (79%), and the overall accuracy was 82% (Figure 19).
From the perspective of landslide extraction accuracy, the DP, OE, CE, and QP of landslides are shown in Table 7, and the extraction results of landslides are shown in Figure 20.
The model trained by the Mangkam dataset was applied to the Jiuzhaigou landslide extraction and high-quality results were obtained. From the Jiuzhaigou landslide extraction results, it can be clearly seen that the FSTF-Net model successfully extracted most of the landslide contour, without obvious omissions. The value of DP was approximately 81%. In addition, the result was not influenced by other ground objects such as trees, verifying the advantages of using spectral and topographic information in the FSTF-Net model. Although the classification accuracy of the proposed method must still be improved, it presents many advantages, requires less preparatory work, and has high extraction efficiency. The overall performance is slightly lower than that of the Mangkam dataset, which may be due to the difference in scenes. In the Jiuzhaigou area, the vegetation area is higher than that in Mangkam County, and the network did not learn this prior knowledge. A possible solution to this problem is transfer learning; that is, a small sample dataset in the new landslide extraction area can be applied to fine-tune the model to improve its performance. This method is especially suitable for post-disaster evaluation, where time constraints are prevalent and the number of landslide samples is small.
Aiming at the landslide extraction from high-resolution remote sensing images, we propose a comprehensive and widely used scheme. For two landslide extraction tasks in different regions, the designed model is able to use the information obtained in the first landslide extraction task, as prior knowledge about the landslide, and apply it to the second landslide extraction task. This is a major improvement because the training of a common deep learning model was not very flexible and difficult to adapt to different regions. The model proposed in this study follows the trend of information extraction with specific constraints and specific targets. Currently, the model is limited to the extraction of landslide information from high-resolution remote sensing images in plateau areas. However, the network framework of deep learning and its variants are universal and can provide references for the analysis and application of other data in remote sensing images.
5. Conclusions
In this study, we proposed a deep convolutional neural network named FSTF-Net for landslide extraction. Based on multi-source data fusion, the network is an end-to-end accurate landslide extraction framework. The following conclusions can be drawn:
- Based on the atrous convolution, pyramid pooling, and encoding–decoding structure, the multi-scale feature and the contextual information of the fully convolutional network model were effectively integrated to improve the performance of the network. The multi-source data, including topographical factors (slope and aspect) and NDVI, were input into the network and integrated with the feature extracted by remote sensing images. Through the improvement and optimization of the network structure, the end-to-end FSTF-Net model based on multi-source data was obtained. Comparison with other existing networks showed that the FSTF-Net model achieved accurate landslide extraction and the detailed recovery of different types of ground objects in complex scenes. Based on the existing multi-source data, the model effectively increased the accuracy of landslide extraction. The overall classification accuracy reached 89% and the accuracy of the landslide detection was 85%.
- Taking the geological disaster caused by the Jiuzhaigou earthquake in 2017 as an example, high-resolution remote sensing satellite images were collected from Google Earth. Based on these images, the trained FSTF-Net model from the Mangkam dataset was used to extract the information of landslides and surrounding ground objects after the Jiuzhaigou earthquake. The accuracy of the landslide detection was 81%. The method not only greatly reduced labor costs and time but also ensured the accuracy and reliability of the interpretation of the surface environment, providing a reference for subsequent research on the automatic extraction of landslide information.
Author Contributions
Conceptualization, W.X.; methodology, W.X.; software, W.X.; validation, W.L.; supervision, J.L.; formal analysis, J.C.; data curation, J.C.; writing—original draft preparation, W.X.; writing—review and editing, W.X. and C.M. All authors have read and agreed to the published version of the manuscript.
Funding
This research was funded by the National Key Research and Development Program of China (No. 2019YFC1511304).
Institutional Review Board Statement
Not applicable.
Informed Consent Statement
Not applicable.
Data Availability Statement
Not applicable.
Acknowledgments
We are especially grateful to the Key Laboratory of Active Tectonics and Volcano, Institute of Geology, China Earthquake Administration for the inventory vector file of landslides triggered by the 8 August 2017 MW 6.5 Jiuzhaigou Earthquake, China.
Conflicts of Interest
The authors declare no conflict of interest.
References
- Turner, A.K. Social and environmental impacts of landslides. Innov. Infrastruct. Solut. 2018, 3, 70. [Google Scholar] [CrossRef]
- Piralilou, S.T.; Shahabi, H.; Jarihani, B.; Ghorbanzadeh, O.; Blaschke, T.; Gholamnia, K.; Meena, S.R.; Aryal, J. Landslide detection using multi-scale image segmentation and different machine learning models in the higher Himalayas. Remote Sens. 2019, 11, 2575. [Google Scholar] [CrossRef] [Green Version]
- Heleno, S.; Matias, M.; Pina, P.; Sousa, A.J. Semiautomated object-based classification of rain-induced landslides with VHR multispectral images on Madeira Island. Nat. Hazards Earth Syst. Sci. 2016, 16, 1035–1048. [Google Scholar] [CrossRef] [Green Version]
- Prakash, N.; Manconi, A.; Loew, S. Mapping landslides on EO data: Performance of deep learning models vs. traditional machine learning models. Remote Sens. 2020, 12, 346. [Google Scholar] [CrossRef] [Green Version]
- Ghorbanzadeh, O.; Blaschke, T.; Gholamnia, K.; Meena, S.R.; Tiede, D.; Aryal, J. Evaluation of different machine learning methods and deep-learning convolutional neural networks for landslide detection. Remote Sens. 2019, 11, 196. [Google Scholar] [CrossRef] [Green Version]
- Sameen, M.I.; Pradha, B. Landslide detection using residual networks and the fusion of spectral and topographic information. IEEE Access 2019, 7, 114363–114373. [Google Scholar] [CrossRef]
- Lei, T.; Zhang, Q.; Xue, D.; Chen, T.; Meng, H.; Nandi, A.K. End-to-end Change Detection Using a Symmetric Fully Convolutional Network for Landslide Mapping. In Proceedings of the ICASSP 2019—2019 IEEE International Conference on Acoustics, Speech and Signal Processing (ICASSP), Brighton, UK, 12–17 May 2019; pp. 3027–3031. [Google Scholar]
- Martha, T.R.; Kerle, N.; Jetten, V.; Van Westen, C.; Kumar, K.V. Characterising spectral, spatial and morphometric properties of landslides for semi-automatic detection using object-oriented methods. Geomorphology 2010, 116, 24–36. [Google Scholar] [CrossRef]
- Mondini, A.; Guzzetti, F.; Reichenbach, P.; Rossi, M.; Cardinali, M.; Ardizzone, F. Semi-automatic recognition and mapping of rainfall induced shallow landslides using optical satellite images. Remote Sens. Environ. 2011, 115, 1743–1757. [Google Scholar] [CrossRef]
- Stumpf, A.; Kerle, N. Object-oriented mapping of landslides using Random Forests. Remote Sens. Environ. 2011, 115, 2564–2577. [Google Scholar] [CrossRef]
- Wessel, M.; Brandmeier, M.; Tiede, D. Evaluation of different machine learning algorithms for scalable classification of tree types and tree species based on Sentinel-2 data. Remote Sens. 2018, 10, 1419. [Google Scholar] [CrossRef] [Green Version]
- Ghorbanzadeh, O.; Blaschke, T. Optimizing sample patches selection of cnn to improve the miou on landslide detection. In Proceedings of the 5th International Conference on Geographical Information Systems Theory, Applications and Management: GISTAM, Heraklion, Greece, 3–5 May 2019; pp. 3–5. [Google Scholar]
- Yong, W.; Yang, S.; Zhang, L.; Yang, M.; Geomatics, F.O. Landslide information extraction based on the optimal segmentation scale. Sci. Surv. Mapp. 2017, 42, 120–125. [Google Scholar]
- Chen, F.; Yu, B.; Li, B. A practical trial of landslide detection from single-temporal Landsat8 images using contour-based proposals and random forest: A case study of national Nepal. Landslides 2018, 15, 453–464. [Google Scholar] [CrossRef]
- Ma, H.-R.; Cheng, X.; Chen, L.; Zhang, H.; Xiong, H. Automatic identification of shallow landslides based on Worldview2 remote sensing images. J. Appl. Remote Sens. 2016, 10, 016008. [Google Scholar] [CrossRef]
- Karantanellis, E.; Marinos, V.; Vassilakis, E.; Christaras, B. Object-Based Analysis Using Unmanned Aerial Vehicles (UAVs) for Site-Specific Landslide Assessment. Remote Sens. 2020, 12, 1711. [Google Scholar] [CrossRef]
- Roodposhti, M.S.; Aryal, J.; Bryan, B.A. A novel algorithm for calculating transition potential in cellular automata models of land-use/cover change. Environ. Model. Softw. 2019, 112, 70–81. [Google Scholar] [CrossRef]
- Peng, L.; Hui, Z.; Eom, K.B. Active Deep Learning for Classification of Hyperspectral Images. IEEE J. Sel. Top. Appl. Earth Obs. Remote Sens. 2017, 10, 712–724. [Google Scholar]
- Hong, D.; Gao, L.; Yao, J.; Zhang, B.; Plaza, A.; Chanussot, J. Graph Convolutional Networks for Hyperspectral Image Classification. IEEE Trans. Geosci. Remote Sens. 2021, 59, 5966–5978. [Google Scholar] [CrossRef]
- Feng, J.; Yu, H.; Wang, L.; Cao, X.; Zhang, X.; Jiao, L. Classification of Hyperspectral Images Based on Multiclass Spatial–Spectral Generative Adversarial Networks. IEEE Trans. Geosci. Remote Sens. 2019, 57, 5329–5343. [Google Scholar] [CrossRef]
- Hu, W.-S.; Li, H.-C.; Pan, L.; Li, W.; Tao, R.; Du, Q. Spatial–Spectral Feature Extraction via Deep ConvLSTM Neural Networks for Hyperspectral Image Classification. IEEE Trans. Geosci. Remote Sens. 2020, 58, 4237–4250. [Google Scholar] [CrossRef]
- Wang, C.; Zhang, L.; Wei, W.; Zhang, Y. When Low Rank Representation Based Hyperspectral Imagery Classification Meets Segmented Stacked Denoising Auto-Encoder Based Spatial-Spectral Feature. Remote Sens. 2018, 10, 284. [Google Scholar] [CrossRef] [Green Version]
- Zhu, M.; Jiao, L.; Liu, F.; Yang, S.; Wang, J. Residual Spectral-Spatial Attention Network for Hyperspectral Image Classification. IEEE Trans. Geosci. Remote Sens. 2020, 59, 449–462. [Google Scholar] [CrossRef]
- Sun, H.; Li, S.; Zheng, X.; Lu, X. Remote Sensing Scene Classification by Gated Bidirectional Network. IEEE Trans. Geosci. Remote Sens. 2019, 58, 82–96. [Google Scholar] [CrossRef]
- Ding, A.; Zhang, Q.; Zhou, X.; Dai, B. Automatic recognition of landslide based on CNN and texture change detection. In Proceedings of the 2016 31st Youth Academic Annual Conference of Chinese Association of Automation (YAC), Wuhan, China, 11–13 November 2016; pp. 444–448. [Google Scholar]
- Yu, H.; Ma, Y.; Wang, L.; Zhai, Y.; Wang, X. A landslide intelligent detection method based on CNN and RSG_R. In Proceedings of the 2017 IEEE International Conference on Mechatronics and Automation (ICMA), Takamatsu, Japan, 6–9 August 2017; pp. 40–44. [Google Scholar]
- Lei, T.; Zhang, Y.; Lv, Z.; Li, S.; Liu, S.; Nandi, A.K. Landslide Inventory Mapping from Bitemporal Images Using Deep Convolutional Neural Networks. IEEE Geosci. Remote Sens. Lett. 2019, 16, 982–986. [Google Scholar] [CrossRef]
- Wang, H.; Zhang, L.; Yin, K.; Luo, H.; Li, J. Landslide identification using machine learning. Geosci. Front. 2021, 12, 351–364. [Google Scholar] [CrossRef]
- Li, C.; Yi, B.; Gao, P.; Li, H.; Sun, J.; Chen, X.; Zhong, C. Valuable Clues for DCNN-Based Landslide Detection from a Comparative Assessment in the Wenchuan Earthquake Area. Sensors 2021, 21, 5191. [Google Scholar] [CrossRef] [PubMed]
- Qin, S.; Guo, X.; Sun, J.; Qiao, S.; Zhang, L.; Yao, J.; Cheng, Q.; Zhang, Y. Landslide Detection from Open Satellite Imagery Using Distant Domain Transfer Learning. Remote Sens. 2021, 13, 3383. [Google Scholar] [CrossRef]
- Fanos, A.; Pradhan, B.; Mansor, S.; Yusoff, Z.M.; bin Abdullah, A.F. A hybrid model using machine learning methods and GIS for potential rockfall source identification from airborne laser scanning data. Landslides 2018, 15, 1833–1850. [Google Scholar] [CrossRef]
- Xu, Q.; Ouyang, C.; Jiang, T.; Fan, X.; Cheng, D. DFPENet-geology: A Deep Learning Framework for High Precision Recognition and Segmentation of Co-Seismic Landslides. arXiv 2019, arXiv:1908.10907. [Google Scholar]
- Liu, P.; Wei, Y.; Wang, Q.; Chen, Y.; Xie, J. Research on Post-Earthquake Landslide Extraction Algorithm Based on Improved U-Net Model. Remote Sens. 2020, 12, 894. [Google Scholar] [CrossRef] [Green Version]
- Xia, W.; Ma, C.; Liu, J.; Liu, S.; Chen, F.; Yang, Z.; Duan, J. High-Resolution Remote Sensing Imagery Classification of Imbalanced Data Using Multistage Sampling Method and Deep Neural Networks. Remote Sens. 2019, 11, 2523. [Google Scholar] [CrossRef] [Green Version]
- Wang, Y.; Liang, B.; Ding, M.; Li, J. Dense Semantic Labeling with Atrous Spatial Pyramid Pooling and Decoder for High-Resolution Remote Sensing Imagery. Remote Sens. 2018, 11, 20. [Google Scholar] [CrossRef] [Green Version]
- Drozdzal, M.; Vorontsov, E.; Chartrand, G.; Kadoury, S.; Pal, C. The importance of skip connections in biomedical image segmentation. In Proceedings of the Deep Learning and Data Labeling for Medical Applications, Athens, Greece, 17–21 October 2016; pp. 179–187. [Google Scholar]
- Eitel, A.; Springenberg, J.T.; Spinello, L.; Riedmiller, M.; Burgard, W. Multimodal deep learning for robust RGB-D object recognition. In Proceedings of the 2015 IEEE/RSJ International Conference on Intelligent Robots and Systems (IROS), Hamburg, Germany, 28 September–2 October 2015; pp. 681–687. [Google Scholar]
- Long, J.; Shelhamer, E.; Darrell, T. Fully convolutional networks for semantic segmentation. In Proceedings of the IEEE Conference on Computer Vision and Pattern Recognition, Boston, MA, USA, 7–12 June 2015; pp. 3431–3440. [Google Scholar]
- Zhao, H.; Shi, J.; Qi, X.; Wang, X.; Jia, J. Pyramid Scene Parsing Network. In Proceedings of the 2017 IEEE Conference on Computer Vision and Pattern Recognition (CVPR), Honolulu, HI, USA, 21–26 July 2017; pp. 6230–6239. [Google Scholar]
- Mortensen, E.N.; Barrett, W.A. Intelligent scissors for image composition. In Proceedings of the 22nd Annual Conference on Computer Graphics and Interactive Techniques, Los Angeles, CA, USA, 6–11 August 1995; pp. 191–198. [Google Scholar]
- Srivastava, N.; Hinton, G.; Krizhevsky, A.; Sutskever, I.; Salakhutdinov, R. Dropout: A simple way to prevent neural networks from overfitting. J. Mach. Learn. Res. 2014, 15, 1929–1958. [Google Scholar]
- Ioffe, S.; Szegedy, C. Batch normalization: Accelerating deep network training by reducing internal covariate shift. In Proceedings of the International Conference on Machine Learning ICML 2015, Lille, France, 7–9 July 2015; pp. 448–456. [Google Scholar]
- Scarpa, G.; Gargiulo, M.; Mazza, A.; Gaetano, R. A CNN-Based Fusion Method for Feature Extraction from Sentinel Data. Remote Sens. 2018, 10, 236. [Google Scholar] [CrossRef] [Green Version]
- Chatziantoniou, A.; Psomiadis, E.; Petropoulos, G.P. Co-Orbital Sentinel 1 and 2 for LULC Mapping with Emphasis on Wetlands in a Mediterranean Setting Based on Machine Learning. Remote Sens. 2017, 9, 1259. [Google Scholar] [CrossRef] [Green Version]
- Keys, R.G. Cubic convolution interpolation for digital image processing. IEEE Trans. Acoust. Speech Signal Process. 2003, 29, 1153–1160. [Google Scholar] [CrossRef] [Green Version]
- Chen, L.-C.; Zhu, Y.; Papandreou, G.; Schroff, F.; Adam, H. Encoder-Decoder with Atrous Separable Convolution for Semantic Image Segmentation. In Proceedings of the European Conference on Computer Vision (ECCV), Munich, Germany, 8–14 September 2018; pp. 833–851. [Google Scholar]
- Tian, Y.; Xu, C.; Ma, S.; Xu, X.; Wang, S.; Zhang, H. Inventory and Spatial Distribution of Landslides Triggered by the 8th August 2017 M W 6.5 Jiuzhaigou Earthquake, China. J. Earth Sci. 2019, 30, 206–217. [Google Scholar] [CrossRef]
Figure 1.
The workflow of our approach.

Figure 2.
Network structure of encoder.

Figure 3.
Network structure of Resnet + ASPP + encoder–decoder (RAE-D).

Figure 4.
Multi-source data fusion based on deep learning classification network (a) layer stacking; and (b) feature fusion.
Figure 4.
Multi-source data fusion based on deep learning classification network (a) layer stacking; and (b) feature fusion.

Figure 5.
Feature fusion implementation method (a) Concat; and (b) Eltwise Sum.

Figure 6.
Deep learning network for landslide extraction from a high-resolution remote sensing image.
Figure 6.
Deep learning network for landslide extraction from a high-resolution remote sensing image.

Figure 7.
Network structure of slope, aspect, and NDVI data input branch.

Figure 8.
Network structure of FSTF-Net.

Figure 9.
Dropout optimized network model.

Figure 10.
Study area: (a) WorldView-3 data; (b) average slope map; and (c) hill shade map.

Figure 11.
Image-label example based on a classification standard (a) Example of landslide (the green part was covered with the sand-proof net) (b) Example of non-landslide.
Figure 11.
Image-label example based on a classification standard (a) Example of landslide (the green part was covered with the sand-proof net) (b) Example of non-landslide.
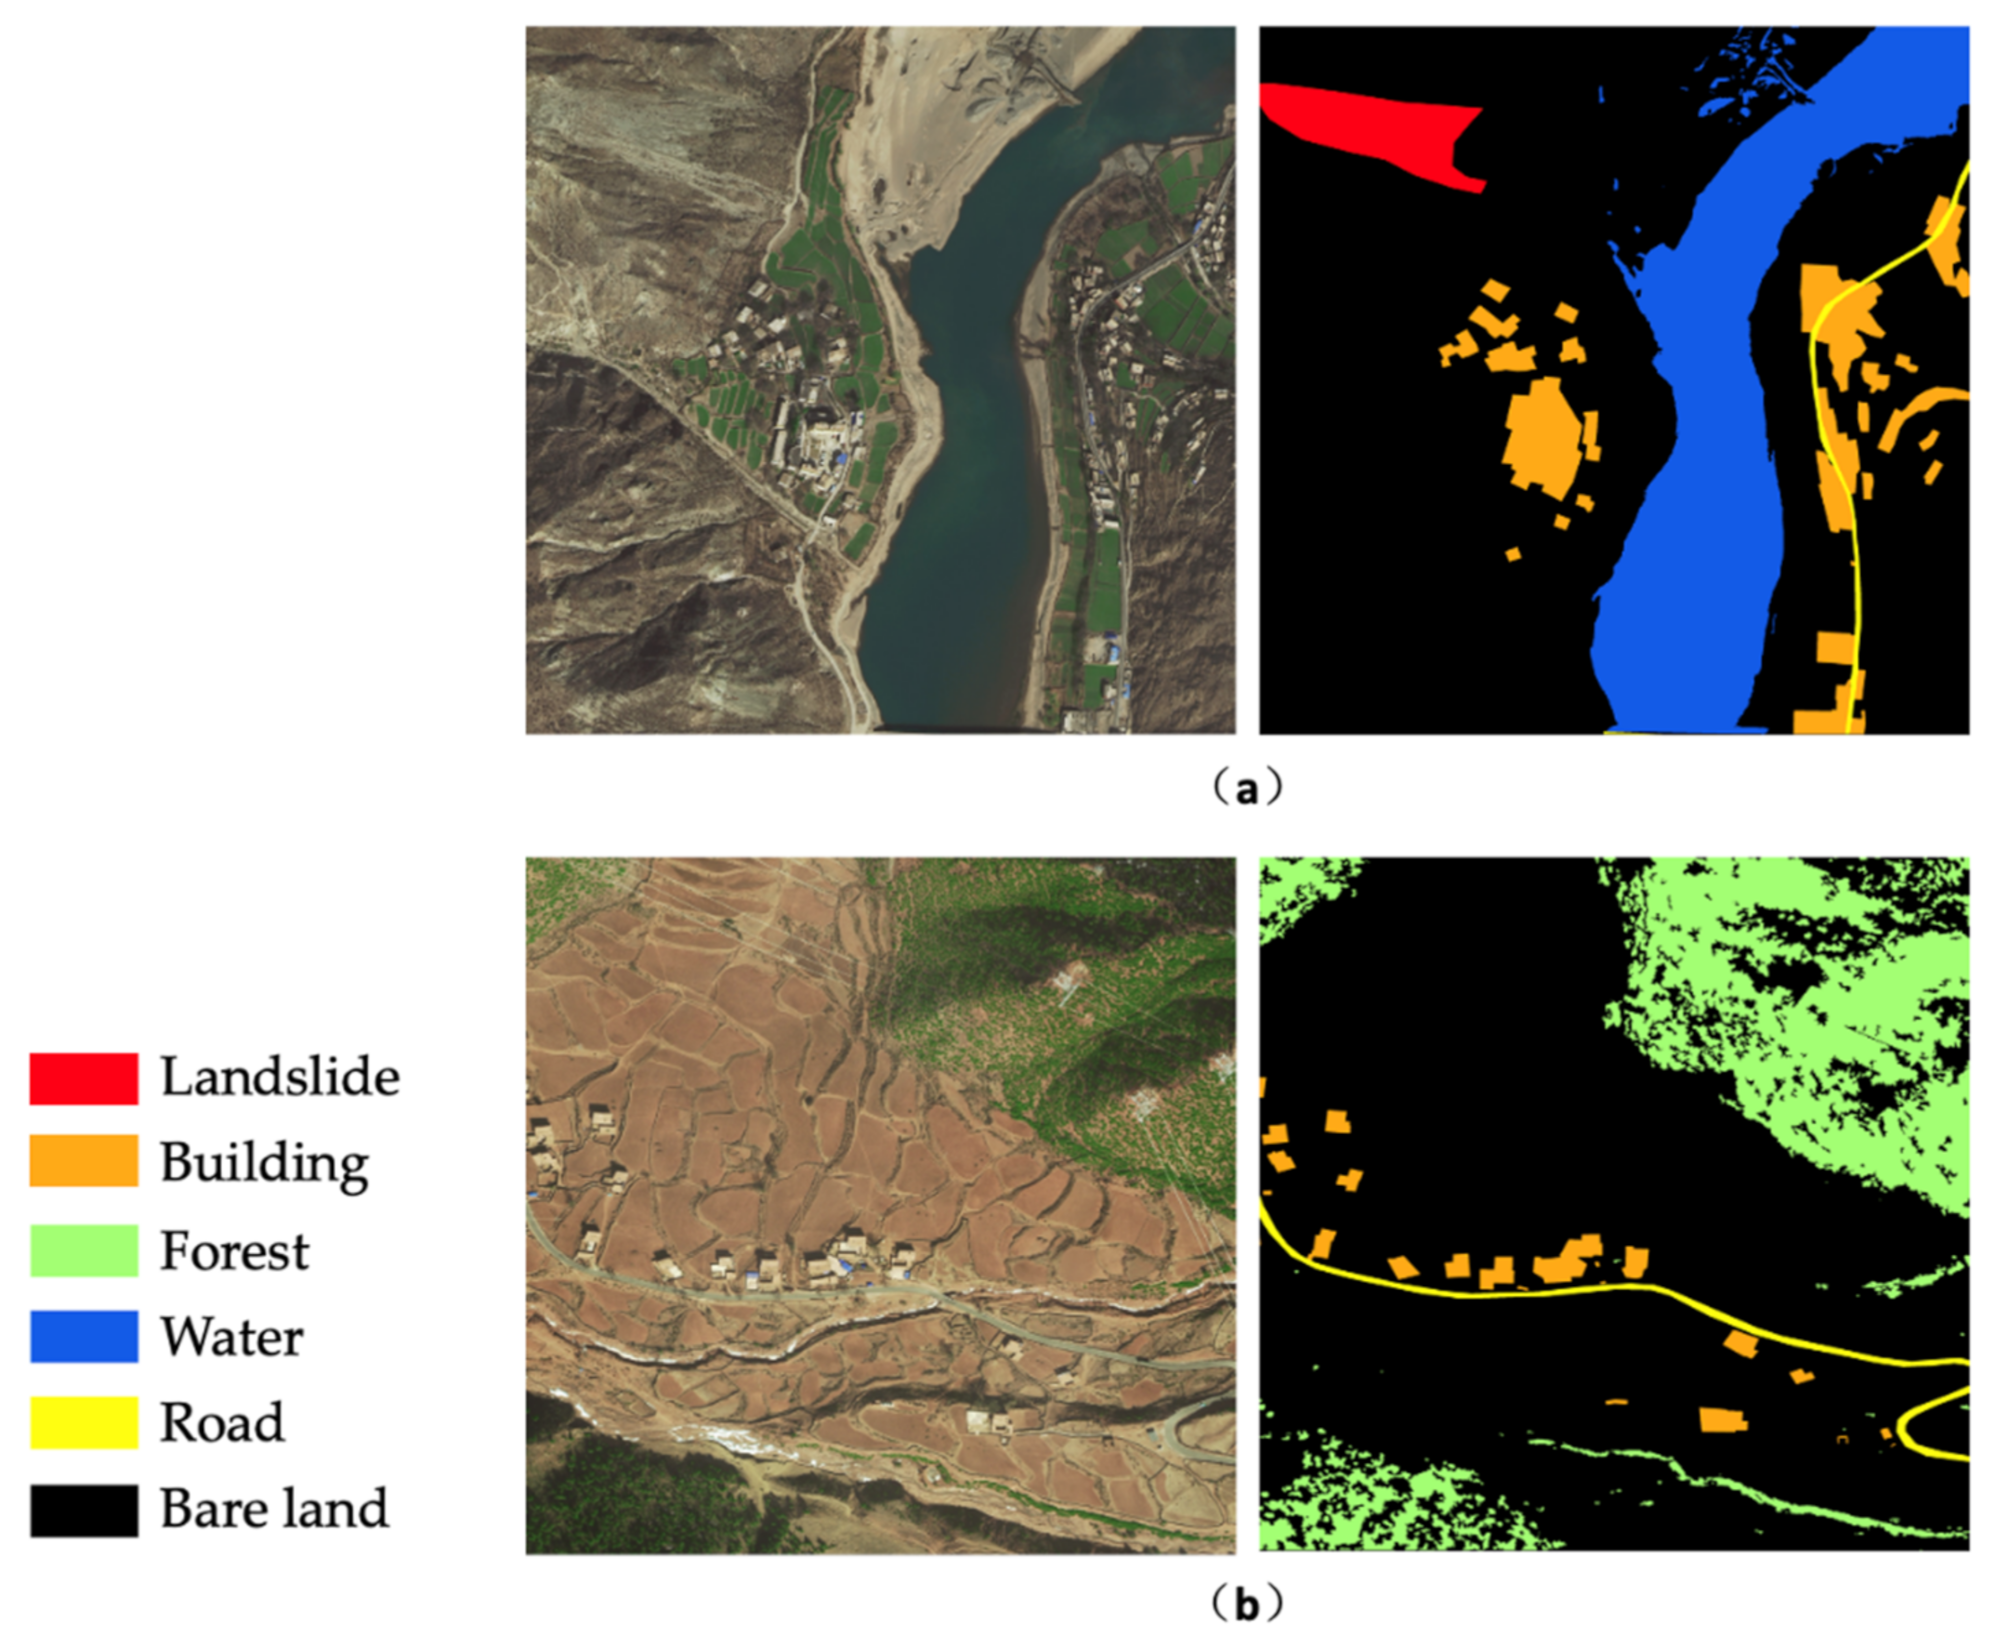
Figure 12.
Dataset of the “Image-Label” (a) remote sensing image; (b) label image; (c) DEM; (d) slope; (e) aspect; and (f) NDVI.
Figure 12.
Dataset of the “Image-Label” (a) remote sensing image; (b) label image; (c) DEM; (d) slope; (e) aspect; and (f) NDVI.

Figure 13.
Classification results of Mangkam County: (a) original image; (b) label image; (c–e) ASPP, encoder–decoder with ASPP and RAE-D; and (f) FSTF-Net classification results.
Figure 13.
Classification results of Mangkam County: (a) original image; (b) label image; (c–e) ASPP, encoder–decoder with ASPP and RAE-D; and (f) FSTF-Net classification results.

Figure 14.
Comparison of landslide extraction results: (a) original image; (b) label image; (c) DeepLab_v3+ landslide extraction result; (d) RAE-D landslide extraction result; and (e) FSTF-Net landslide extraction result.
Figure 14.
Comparison of landslide extraction results: (a) original image; (b) label image; (c) DeepLab_v3+ landslide extraction result; (d) RAE-D landslide extraction result; and (e) FSTF-Net landslide extraction result.

Figure 15.
Comparison results of landslide boundary extraction: (a,b) results of landslide extraction using RAE-D and FSTF-Net.
Figure 15.
Comparison results of landslide boundary extraction: (a,b) results of landslide extraction using RAE-D and FSTF-Net.

Figure 16.
Comparison result of landslide and artificial construction area: (a) original image and corresponding; (b) hill shade; (c) slope; and (d) aspect.
Figure 16.
Comparison result of landslide and artificial construction area: (a) original image and corresponding; (b) hill shade; (c) slope; and (d) aspect.

Figure 17.
Landslide change detection in area #1 (located at 29°56′36″ N and 99°3′29″ E) from January to March 2018 (a) January 2018; (b) February 2018; and (c) March 2018.
Figure 17.
Landslide change detection in area #1 (located at 29°56′36″ N and 99°3′29″ E) from January to March 2018 (a) January 2018; (b) February 2018; and (c) March 2018.

Figure 18.
Landslide change detection in area #2 (locate at 29°56′59″ N and 99°2′50″ E) from January to March 2018 (a) January 2018; (b) February 2018; and (c) March 2018.
Figure 18.
Landslide change detection in area #2 (locate at 29°56′59″ N and 99°2′50″ E) from January to March 2018 (a) January 2018; (b) February 2018; and (c) March 2018.

Figure 19.
Classification results for the Jiuzhaigou high-resolution remote sensing image: (a) original image; (b) label image; and (c) FSTF-Net classification results.
Figure 19.
Classification results for the Jiuzhaigou high-resolution remote sensing image: (a) original image; (b) label image; and (c) FSTF-Net classification results.

Figure 20.
Landslide information extraction results for the Jiuzhaigou high-resolution remote sensing image: (a) original image; (b) label image; and (c) FSTF-Net classification results.
Figure 20.
Landslide information extraction results for the Jiuzhaigou high-resolution remote sensing image: (a) original image; (b) label image; and (c) FSTF-Net classification results.


Table 1.
Data source information.
| Date | Satellite | Resolution (m) | Band Number | Size (Pixels) | Samples |
|---|---|---|---|---|---|
| January 2018 | Beijing-2 | 0.8 | 3 | 3200 ∗ 3200 | 347 |
| January 2018 | WorldView-3 | 0.3 | 3 | 3200 ∗ 3200 | 479 |
| March 2018 | SuperView-1 | 0.5 | 3 | 3200 ∗ 3200 | 60 |
Table 2.
List of landslide recognition factors.
| Datasets | Date | Data | Data Format | Size (Pixels) |
|---|---|---|---|---|
| Geological Disaster Distribution map | January 2018–March 2018 | Landslide point | Point | — |
| Landsat8 | April 2018 | NDVI | Raster image | 0.3 m |
| DEM | February 2018 | Slope aspect | Raster image | 0.3 m |
Table 3.
The comparison of the classification results of BasicFCN, FCN-8s, ASPP, DeepLab_v3+, RAE-D, and FSTF-Net on the Mangkam dataset.
Table 3.
The comparison of the classification results of BasicFCN, FCN-8s, ASPP, DeepLab_v3+, RAE-D, and FSTF-Net on the Mangkam dataset.
| Method | Bare Land | Veg | Water | Building | Road | Landslide | Avg Recall | Avg F1-Score | OA |
|---|---|---|---|---|---|---|---|---|---|
| Basic FCN | 0.83 | 0.79 | 0.72 | 0.57 | 0.51 | 0.69 | 0.72 | 0.70 | 0.77 |
| FCN-8s | 0.90 | 0.83 | 0.80 | 0.63 | 0.62 | 0.79 | 0.74 | 0.76 | 0.81 |
| ASPP | 0.87 | 0.84 | 0.81 | 0.71 | 0.69 | 0.80 | 0.82 | 0.80 | 0.84 |
| DeepLab_v3+ | 0.91 | 0.85 | 0.84 | 0.78 | 0.73 | 0.82 | 0.85 | 0.86 | 0.87 |
| RAE-D | 0.91 | 0.87 | 0.85 | 0.80 | 0.78 | 0.83 | 0.86 | 0.86 | 0.88 |
| FSTF-Net | 0.90 | 0.89 | 0.87 | 0.81 | 0.78 | 0.86 | 0.87 | 0.88 | 0.89 |
Table 4.
Comparison results of landslide extraction accuracy.
| Method | DP | QP | OE | CE |
|---|---|---|---|---|
| BasicFCN | 0.73 | 0.53 | 0.26 | 0.31 |
| FCN-8s | 0.77 | 0.67 | 0.23 | 0.21 |
| ASPP | 0.79 | 0.70 | 0.21 | 0.20 |
| DeepLab_v3+ | 0.80 | 0.72 | 0.20 | 0.18 |
| RAE-D | 0.81 | 0.71 | 0.19 | 0.17 |
| FSTF-Net | 0.85 | 0.76 | 0.15 | 0.14 |
Table 5.
Introduction of data sources in Jiuzhaigou.
| Date | Source | Data | Resolution (m) | Band Number |
|---|---|---|---|---|
| August 2017 | Google Earth | Google Earth | 0.3 | 3 |
| August 2017 | Landslide Vector File [47] | Landslide PLOGY | 0.3 | 1 |
| August 2018 | Landsat8 Image | NDVI | 0.3 | 1 |
| August 2017 | SRTM | DEM | 0.3 | 1 |
Table 6.
Classification result on Jiuzhaigou high-resolution remote sensing images.
| Method | Bare Land | Veg | Landslide | Water | Building | Road | Avg Recall | Avg F1-Score | OA |
|---|---|---|---|---|---|---|---|---|---|
| FSTF-Net | 0.82 | 0.88 | 0.79 | 0.87 | 0.68 | 0.64 | 0.80 | 0.79 | 0.82 |
Table 7.
Introduction of data sources in Jiuzhaigou.
| Method | DP | QP | OE | CE |
|---|---|---|---|---|
| MUS2+FSTF-Net | 0.81 | 0.73 | 0.19 | 0.21 |
Publisher’s Note: MDPI stays neutral with regard to jurisdictional claims in published maps and institutional affiliations. |
© 2021 by the authors. Licensee MDPI, Basel, Switzerland. This article is an open access article distributed under the terms and conditions of the Creative Commons Attribution (CC BY) license (https://creativecommons.org/licenses/by/4.0/).
Share and Cite
MDPI and ACS Style
Xia, W.; Chen, J.; Liu, J.; Ma, C.; Liu, W. Landslide Extraction from High-Resolution Remote Sensing Imagery Using Fully Convolutional Spectral–Topographic Fusion Network. Remote Sens. 2021, 13, 5116. https://doi.org/10.3390/rs13245116
AMA Style
Xia W, Chen J, Liu J, Ma C, Liu W. Landslide Extraction from High-Resolution Remote Sensing Imagery Using Fully Convolutional Spectral–Topographic Fusion Network. Remote Sensing. 2021; 13(24):5116. https://doi.org/10.3390/rs13245116
Chicago/Turabian StyleXia, Wei, Jun Chen, Jianbo Liu, Caihong Ma, and Wei Liu. 2021. "Landslide Extraction from High-Resolution Remote Sensing Imagery Using Fully Convolutional Spectral–Topographic Fusion Network" Remote Sensing 13, no. 24: 5116. https://doi.org/10.3390/rs13245116
Note that from the first issue of 2016, this journal uses article numbers instead of page numbers. See further details here.