A Proof-of-Concept Algorithm for the Retrieval of Total Column Amount of Trace Gases in a Multi-Dimensional Atmosphere


German Aerospace Center (DLR), Remote Sensing Technology Institute, 82234 Oberpfaffenhofen, Germany
*
Author to whom correspondence should be addressed.
Remote Sens. 2021, 13(2), 270; https://doi.org/10.3390/rs13020270
Submission received: 10 December 2020
/
Revised: 4 January 2021
/
Accepted: 7 January 2021
/
Published: 14 January 2021
(This article belongs to the Special Issue Current Advances in Radiative Transfer Modeling for Satellite Optical Remote Sensing Applications)
Abstract
:An algorithm for the retrieval of total column amount of trace gases in a multi-dimensional atmosphere is designed. The algorithm uses (i) certain differential radiance models with internal and external closures as inversion models, (ii) the iteratively regularized Gauss–Newton method as a regularization tool, and (iii) the spherical harmonics discrete ordinate method (SHDOM) as linearized radiative transfer model. For efficiency reasons, SHDOM is equipped with a spectral acceleration approach that combines the correlated k-distribution method with the principal component analysis. The algorithm is used to retrieve the total column amount of nitrogen for two- and three-dimensional cloudy scenes. Although for three-dimensional geometries, the computational time is high, the main concepts of the algorithm are correct and the retrieval results are accurate.
1. Introduction
The retrieval of trace gas products from UV/VIS spectrometers is strongly affected by the presence of clouds. In general, there are three different cloud contributions: (i) the albedo effect, associated with the enhancement of reflectivity for cloudy scenes compared to cloud-free scenes; (ii) the shielding effect when a part of the trace gas column below the cloud is hidden; and (iii) the increase in absorption, related to multiple scattering inside clouds. The albedo and in-cloud absorption effects increase the detectability of trace gases at and above the cloud-top (in case of low clouds), while the shielding effect normally results in an underestimation of the trace gas column [1].
The majority of retrieval algorithms are based on one-dimensional radiative transfer modeling and use the so-called independent pixel approximation (IPA). The IPA for an atmosphere containing partial cloudiness means to compute separately the radiances for completely cloudy and clear skies, and then to express the partially cloudy radiance as a weighted sum of the separate radiances; the weighting factor being provided by the intensity weighted cloud fraction. The clouds within each pixel are assumed to be plane-parallel and homogeneous in both horizontal and vertical directions. The main advantage of the IPA is its computational efficiency, as it requires the solution of only two independent one-dimensional radiative transfer problems. The disadvantage is that for cloudy scenes of small horizontal extent, the errors due to the three-dimensional effects may be very significant [2,3,4]. This is the case of the new generation of atmospheric composition UV–VIS–NIR sensors, such as Sentinel-5P, Sentinel-4, and Sentinel-5. In [5] the importance of three-dimensional effects on computations of air mass factors has been shown.
To analyze the impact of cloud inhomogeneity on the retrieval, multi-dimensional radiative transfer models are used. In particular, for a specific cloudy scene, a spectral signal is simulated by a multi-dimensional radiative transfer model and then included in a one-dimensional retrieval algorithm to derive for example, the total column amount of a trace gas. By comparing the retrieved total column with the true value, a bias due to cloud effects can be deduced, and possible correction strategies can be explored.
In this paper, we go one step further and present the main concepts of an algorithm for retrieving the total column amount of trace gases in a multi-dimensional atmosphere. To achieve this goal we combine inverse models and regularization tools from inversion theory with a fast linearized version of the spherical harmonic discrete ordinate method [6]. These theoretical results are summarized in Section 2, while in Section 3, the accuracy and efficiency of the algorithm, used to retrieve the total column amount of nitrogen dioxide () for two- and three-dimensional cloudy scenes, are numerically investigated. We conclude our analysis with some recommendations for operational retrievals.
2. Retrieval Algorithm
For a multi-dimensional geometry, the spectral signal of an instrument that measures the radiance at the top of the atmosphere in direction at wavelength in the spectral interval , is given by
where, under the assumption that the distance from the top of the atmosphere to the instrument is large,
is the signal integrated over the field of view (FOV) of the instrument at wavelength (see, e.g., in [7] for a general description), the slit function (defined on all ), s the spectral bandwidth, the characteristic function that takes the value for and 0 otherwise, the footprint of the instrument on the top face , and the area of the instrument footprint. Essentially, Equations (1) and (2) state that the mean radiance across the wavelength and the area at the top of the atmosphere is measured. The top of atmosphere radiance at the exiting point along the characteristic , , is computed by using the integral form of the radiative transfer equation
where is the radiance at the surface point , the source function, and the distance between the entering and exiting points, respectively. Equation (3) can be derived by integrating the radiative transfer equation [8,9]. The first term corresponds to the upwelling radiance at the bottom of the atmosphere and attenuated exponentially as it propagates through the atmosphere. The second term refers to the gain due to sources. The source function J contains only the solar term and the multiple scattering term [10].
In the case of an atmosphere consisting of gas molecules and a cloud, we assume that (i) the optical coefficients of the gas molecules depend on the altitude level and the wavelength, while (ii) the optical coefficients of the cloud depend on the spatial coordinates but not on the wavelength. The second assumption is justified by the fact that a narrow spectral interval is considered in the retrieval. According to the additivity property of optical cross sections [11], in the case of gases, the extinction coefficient is computed as
where is the extinction coefficient in the cloud (methods for computing are summarized in [12]), the molecular scattering coefficient due to Rayleigh scattering [13], the absorption coefficient of gas g, and the Cartesian coordinates of point . Considering a discretization of the atmosphere in levels, i.e., , the absorption coefficient on level is given by
where and are the absorption cross section and the number density of gas j on level , respectively. Under the assumption that on a layer j bounded below by and above by , the number density varies linearly with respect to z, the partial and total column of gas g are defined, respectively, by
and
where .
The retrieval algorithm is based on the assumption that cloud information are available from co-located imagers, as, for example, the Moderate Resolution Imaging Spectroradiometer (MODIS) on board the Terra and Aqua satellites and the Visible Infrared Imaging Radiometer Suite (VIIRS) on board the Suomi National Polar-Orbiting Partnership spacecraft. The main cloud products delivered by MODIS/VIIRS are the cloud mask (indicator function of the cloud field), cloud optical thickness, cloud-top height (cloud-top pressure), and effective radius of the size distribution. In the MODIS/VIIRS retrieval algorithm, the cloud geometrical thickness is derived under the assumption that the clouds are homogeneous in the vertical direction, or equivalently, that the liquid water content does not change with the altitude. Therefore, it is appropriate to use stochastic cloud models (in particular statistical cloud generators) which operate with the same assumption. For this reason, we will use stochastic cloud models relying on the vertical homogeneity assumption, and in particular, the two-dimensional broken cloud model of Alexandrov et al. [14].
In general, the design of a retrieval algorithm requires the specification of
- an inverse model,
- a solution method for solving the inverse problem, and
- a linearized multi-dimensional radiative transfer model for computing the forward model and the Jacobian matrix at each iteration step.
2.1. Inverse Models
The retrieval of the total columns of gases can be performed by using two differential radiance models (see details in [15,16,17] and references therein):
- the Differential Radiance Model with Internal closure (DRMI), in which the measured and simulated differential spectral signals are fitted, and
- the Differential Radiance Model with External closure (DRME), in which the measured differential spectral signal and a simulated spectral signal with its smooth component extracted are fitted.
Actually, in DRMI we solve the nonlinear equation
where
and
are the measured and simulated differential spectral signals, respectively, while in DRME we solve the nonlinear equation
In Equations (8)–(11), is the vector comprising the total columns of trace gases; an a priori estimate of ; the (noisy) spectral signal measured by the instrument at wavelength , where , the number of measurement wavelengths; the simulated spectral signal computed by a multi-dimensional radiative transfer model; with , the correction spectra including, for example, the polarization correction spectrum and the Ring spectrum, the number of correction spectra; and with , the (wavelength independent) amplitudes of the correction spectra. The polynomials , , and with degree account for the low-order spectral structure due to the scattering by clouds and aerosols, while the differential spectral signals and are mostly due to the gaseous absorption processes (see Ref. [18] for details). Specifically, in DRMI, the coefficients
of the smoothing polynomials and , respectively, are computed as the solutions of the least-squares problems
and
respectively. Thus, these coefficients, which are uniquely determined by and , are not a part of the retrieval, while in DRMI, the coefficients of the smoothing polynomial are included in the retrieval.
Similar inversion models can be used for tropospheric column retrieval. These models together with the underlying retrieval algorithms are described in Appendix A.
To speed up the calculation, two approximate inverse models can be designed.
- In DRME, we assume the linearized model [19]where the second term in the right-hand side of the equation describes the variations of with respect to the total column amounts of trace gases with , and the third term comprises the contributions of all other atmospheric parameters. Approximating by a smoothing polynomial, i.e., , and putting , we are led to the linear equationwhich is equivalent with the Differential Optical Absorption Spectroscopy (DOAS) equation [18]. This equivalence is proved in Appendix B.
- We adopt an approximate inverse model in which we compute the spectral signal by an one-dimensional radiative transfer model, and (similar to the Ring and polarization correction spectra) introduce a correction spectrum that accounts on three-dimensional effects. To define the correction spectrum, we take into account that, for example, in DRME, we can writewhere and , are the spectral signals computed by a three- and an one-dimensional radiative transfer model, respectively, andis a relative correction spectrum. In deriving Equation (16), we used the first-order Taylor approximation for , and the decomposition , in which, the coefficients are uniquely determined by (see below), while the coefficients are unknown (as the coefficients are). In view of Equation (16), we assume that in the retrieval, the differential spectral termcan be described by , whereis the (differential) correction spectrum due to three-dimensional effects, the associated smoothing polynomial, and the amplitude of the correction spectrum (to be included in the retrieval). From Equation (18), we see that the correction spectrum reproduces the differential structure of the relative correction spectrum .
2.2. Solution Method
The nonlinear Equations (8) and (11) can be written in compact form as
where is the forward model, the state vector, and the noisy data vector. In DRMI and DRME, the state vectors are and , respectively, where is the vector comprising the amplitudes of the correction spectra , . Furthermore, the number of data points is , and the measured differential spectral signals affected by noise for are the components of the noisy data vector .
Because the nonlinear Equation (19) is usually ill-posed, a regularization method, as, for example, the iteratively regularized Gauss–Newton method, is used to compute a solution with physical meaning [15,20,21]. In this approach, at the iteration step k, we consider a linearization of around the current iterate and solve the linearized equation by means of Tikhonov regularization with the penalty term , where is the regularization parameter at the iteration step k, the regularization matrix, and the a priori state vector, the best beforehand estimate of the solution. Thus, the new iterate minimizing the function
is given by
where
is the regularized generalized inverse, the Jacobian matrix evaluated at , and
the linearized data vector at the iteration step k. The following peculiarities of the iteratively regularized Gauss–Newton method deserve to be mentioned [15].
- In contrast to the method of Tikhonov regularization [22], the regularization parameter is not constant during the iterative process. Instead, the regularization parameters are the terms of a decreasing (geometric) sequence, i.e., with . In this way, the amount of regularization is gradually decreased during the iterative process.
- For iterative regularization methods, the number of iteration steps k plays the role of the regularization parameter, and the iterative process is stopped after an appropriate number of steps in order to avoid an uncontrolled expansion of the errors in the data. The stopping rule used in this study is the discrepancy principle [23], according to which, the iterative process is terminated after steps such thatwhere is the residual vector at , a control parameter, and the noise level (an upper bound for the noise in the data). Because in practice the noise level cannot be a priori estimated, we adopt a practical approach based on the observation that the residual decreases during the iterative process and attains a plateau at approximately . Thus, if the nonlinear residuals converge to within a prescribed tolerance, we use the estimate .
- The regularization matrix is chosen as a diagonal matrix, that is, the penalty term is taken asfor DRMI andfor DRME. Here, the scalars , , and give the weight of each component of the state vector into the regularization matrix.
As compared to the method of Tikhonov regularization, the iteratively regularized Gauss–Newton method is less sensitive to overestimations of the regularization parameter, but requires more iteration steps to achieve convergence.
2.3. Linearized Radiative Transfer Model
In order to solve the nonlinear Equation (19) by means of the iteratively Gauss–Newton method, the forward model and the Jacobian matrix have to be calculated at each iteration step. From Equation (3) we infer that the computation of requires the computation of the radiance and the source function at all surface and grid points, respectively, while the computation of requires the computation of the partial derivatives of the extinction field , the surface radiance , and the source function .
For derivative calculations, we employ the same assumption as in the standard DOAS model, that is, the (discrete) number density profile , where , is assumed to be a scaled version of an a priori profile . Consequently, if is the scale factor of gas g, i.e., , for all , the following equalities,
with , are valid. Thus, for any value of the total column , the absorption coefficient is updated as
and the corresponding top of atmosphere radiance is determined by means of a radiative transfer calculation. In general, for computing the derivative of a spectral quantity with respect to the total column , we regard as a function of , i.e., , and assume that the partial derivatives , , are known. Taking into account the one-to-one correspondence (28), we are led to the computational formula
Thus, the radiative transfer model should be linearized with respect to the absorption coefficient, that is, the linearized radiative transfer model should deliver the partial derivatives for and .
The multi-dimensional radiative transfer model used in our retrieval algorithm is the spherical harmonic discrete ordinate method (SHDOM) [6,24]. Linearizations of SHDOM by means of a forward and a forward-adjoint approach have been discussed in [25]. These can be summarized as follows.
- The linearized forward approach relies on an analytical computation of the derivatives. The method is accurate and has the advantage that no assumptions rather than those of the forward model have to be made. However, the method is time consuming and memory demanding when the number of parameters to be retrieved is large. The reason is that not only the source function has to be stored as a spherical harmonic series at each grid point, but also its derivatives with respect to the atmospheric parameters of interest.
- The linearized forward-adjoint approach relies on the application of the adjoint radiative transfer theory. The method requires less storage for derivatives calculation, is much faster, but relatively less accurate. The main reason for this lower accuracy is that different interpolation schemes are used for radiance and derivative calculations.
Because in our application the number of retrieved quantities is relatively small, we decided in the favor of the linearized forward approach. Specifically, the partial derivatives are computed in an analytical manner by using the chain rule in a sort of backward procedure starting with the output radiance and following the chain of dependencies back to the inputs to the model.
In [26], a simplified approach, leading to a considerable reduction of the computation time, was proposed. The idea is to neglect in Equation (3) the contributions of the partial derivatives of the surface radiance and the source function . In other words, when computing the partial derivative of the top of atmosphere radiance , only the contributions of the partial derivatives of the extinction field are taken into account.
To speed up the computations, the linearized SHDOM is equipped with a spectral acceleration approach that combines the correlated k-distribution method with dimensionality reduction techniques. This approach was applied for computing the spectral signal in [27], and can be extended to derivative calculations as follows.
- Correlated k-distribution method. Consider a discretization of the spectral interval into a set of equally spaced wavelengths with the discretization step , and assume that the transmission within a spectral interval depends only on the distribution of the gas absorption coefficient within the spectral interval [28]. Letting be the cumulative density function of in the spectral interval , the inverse distribution function, and a set of quadrature points and weights in the interval , the spectral signal (1) and its partial derivative with respect to the total column are computed aswhere , , and for , , , and Thus, in the framework of the correlated k-distribution method, W monchromatic radiative transfer calculations are required for computing and , and so, and . A further acceleration can be achieved when and are computed by using dimensionality reduction techniques, as for example, the principal component analysis.
- Principal component analysis. At wavelength , the integrated signal is related to the integrated signal calculated by a simplified (approximate) radiative transfer model through the relationi.e.,The correction factor in Equation (32) is actually the quantity that is calculated by means of the principal component analysis. To summarize this approach, we assume that for each wavelength , the spectral variability of the optical parameters can be described by a vector , defined bywhere and are the optical coefficients in the kth level, , and is the number of altitude levels. Denoting by the sample mean of the data, the aim is to find an M-dimensional subspace () spanned by a set of linear independent vectors , such that the centered data belong to this subspace, i.e., yielding for , where , is the pseudoinverse of , and is the kth component of the vector of parameters . In the principal component analysis, the original N-dimensional data are projected on the M-dimensional subspace spanned by the dominant singular vectors of the data covariance matrix , that is, with and being the kth singular value and vector of the matrix , we choose and , where and . Furthermore, approximating the correction factor by a second-order Taylor expansion around , and the gradient and the Hessian of f by central differences, we are led to the computational formulaTo compute the derivative of the integrated signal with respect to the total column , we may use the principal component analysis to calculate the derivative correction factor , defined by [29]in which case, we haveAlternatively, taking the derivative of Equation (33) with respect to , i.e.,we may use the principal component analysis to calculate the derivative correction factor , defined by
3. Numerical Simulations
In this section, we analyze the accuracy and efficiency of the algorithms for retrieving total column amount of under cloudy conditions. The cloudy scenes considered in our simulations are similar to those described in [27]. Specifically, the geometrical and optical parameters are chosen as follows.
- The domain of analysis is a rectangular prism of lengths km and km. The discretization steps along the horizontal directions are km. Along the vertical direction, the atmosphere between 0 and 50 km is discretized with a step of 0.5 km between 0 and 3 km, 0.1 km between 3 and 4 km, 0.5 km between 4 and 10 km, 1.0 km between 10 and 14 km, 2 km between 14 and 30 km, and 5 km between 30 and 50 km.
- A homogeneous cloud is placed between 3 and 4 km. The cloud extinction field is given by , where and is the indicator function (note that takes the values 1 and 0 inside and outside the cloud, respectively). The cloud phase function is a Henyey–Greenstein phase function [30] with the asymmetry parameter , and the cloud single-scattering albedo is 0.99. Eight cloudy scenes are generated by a two-dimensional broken cloud model [14] with a cloud fraction of about The extinction field is smoothed at the boundary of a cloudy region in order to avoid abrupt changes in the horizontal plane. The indicator functions corresponding to the eight cloudy scenes are illustrated in Figure 1a–h. For two-dimensional geometries, slices at km are selected from the cloud fields 1, 2, 3, 5, 6, and 8. The corresponding indicator functions are shown in Figure 2. Note that the slices corresponding to the cloudy scenes 4 and 7 are similar to the slice corresponding to the cloudy scene 2, and are therefore omitted.
- The number of discrete zenith and azimuth angles are and , respectively, the solar and instrument zenith angles are and , respectively, and the relative azimuth angle is .
- A Lambertian reflecting surface with the surface albedo is considered.
- The footprint of the detector is a square of length centered at , and , and a wavelength-dependent slit function corresponding to the TROPOMI instrument is assumed.
- In addition to the scattering and absorption by the cloud, molecular Rayleigh scattering and the absorption by , ozone (), oxygen dimer (), and water vapor () are considered. The measurement spectral grid roughly resembles the TROPOMI’s spectral resolution and consists of 119 spectral points between 425 nm and 450 nm.
The process of generating synthetic measurement spectra is organized as follows.
- For a clean scenario, we use the a priori partial column profile of [17] illustrated in Figure 3 to generate the true (exact) partial column profile. In this regard, denoting the a priori partial columns of gas g by , we choose the true partial columns as , with and . The true total column of gas g is then computed as ; thus, .
- For , we generate the simulated spectral signal by means of SHDOM.
- For cubic smoothing polynomials, i.e., , we determine the coefficients of the polynomial as the solutions of the least-squares problem (13).
- We compute the noisy spectral signal as , where the measurement errors are assumed to be independent Gaussian random variables with zero mean and standard deviation , where SNR is the signal-to-noise ratio. It should be pointed out that in view of the approximationthe error in is yielding for all k. In other words, the measurement error vector is white noise with the covariance matrix , where is the identity matrix. Because in our simulations we are mainly interested in multi-dimensional effects, we take , that is, we assume an almost perfect instrument and neglect the forward model errors.
- We include the Ring correction spectrum illustrated in Figure 4 in the retrieval, and choose the a priori and true Ring amplitudes as and , respectively. Note that the inelastic scattering is described by a first-order Rayleigh scattering model, i.e., by applying a first-order iteration scheme to the one-dimensional radiative transfer equation for inelastic scattering [31].
- For DRMI, we compute the measured differential spectral signal aswhile for DRME, we choose and compute the measured differential spectral signal as
SHDOM is run with a solution accuracy of and by using
- an adaptive grid with a splitting accuracy of ,
- the principal component analysis with , and the derivative correction factor as in Equation (39),
- periodic boundary conditions,
Some parameters characterizing the iteratively regularized Gauss–Newton algorithm are chosen as follows.
- The regularization parameters are the terms of a geometric sequence with ratio and initial value . Thus, at the first iteration step, the regularization parameter is .
- The weighting factors specifying the contribution of each component of the state vector into the regularization matrix are , , , and for all . By this choice, the total columns of the auxiliary gases are stronger constrained to the a priori than the total column of and the Ring correction spectrum.
- The control parameter in the discrepancy principle Equation (24) is .
The simulations were performed on a computer Intel(R) Core(TM) i5-3340M CPU @ 2.70 GHz with 7858 MB RAM.
3.1. Test Example 1
In the first test example we consider a two-dimensional geometry and perform the retrieval by using the DRMI and DRME inverse models. It may in general be noted that
- the inverse problem is severely ill-posed (for the DRMI model, the condition number of the Jacobian matrix at the initial guess is ) and
- there is a strong correlation between the and Ring effect signatures (when the Ring correction spectrum is not included in the retrieval, the condition number is ; thus, decreases by three order of magnitude).
The histories of the residuals with respect to the iteration index are shown in Figure 5. The following conclusions can be drawn.
- At the initial guess, the residual corresponding to DRMI is much smaller than that corresponding to DRME. This occurs because the discrepancies between the differential spectra are usually small.
- In DRMI, the residual decreases very fast at the first iteration step and then more steadily, while in DRME, the residual gradually decreases.
The relative errors and the computation times for DRMI and DRME are given in the first two columns of Table 1 and Table 2, respectively. Because the SNR is high, in both cases, the relative errors are smaller than . On average, the computation times for DRMI and DRME are of about 40 and 35 CPU minutes, respectively. The higher computation time for DRMI is due to the fact that, according to Equation (13), the partial derivative of with respect to needs also to be computed.
In the second two columns of Table 1, we list the relative errors and the computation times for DRMI when the partial derivative of the top of atmosphere radiance is computed by taking into account only the contributions of the partial derivatives of the extinction field . The reduction of the computation time by about 25% does not justify the large relative errors. Thus, the simplified approach suggested in [26] for the retrieval of cloud extinction field, seems not to work in the case of total column trace gas retrieval.
In the second two columns of Table 2, we list the relative errors and the computation times for DRME when the iterative process is stopped after one iteration, that is, when the linear model (14) is considered. A reasonable accuracy can be obtained when the regularization parameter is optimally chosen. Some hints regarding the selection of the optimal value of the regularization parameter can be found by analyzing the history of the residual curve in Figure 5. From this curve, we infer that for the residual is of about , for of about , and for of about . Therefore, by choosing in the range we expect good reconstruction errors. However, as it can be seen in Table 2, depends on the cloud field. Moreover, for some cloudy scenes, should be precisely determined (for example, in the case of the cloudy scene 8, the relative errors are , , and when takes the values , , and , respectively). In this regard, it should be mentioned that although less inefficient, the iteratively regularized Gauss–Newton method is the best option, i.e., when the initial value of regularization parameter is chosen sufficiently large, accurate results will always be found in comparatively small number of iteration steps (which depends on the initial value and the ratio q).
3.2. Test Example 2
For the cloudy scenes considered in Figure 1, we illustrate, in Table 3, the relative errors and the computation times for DRME with several and one iteration steps. The solution accuracies are comparable to those corresponding to two-dimensional geometries. However, the computation time is extremely high; on average, it is of about 14 h and 15 min for DRME with several iteration steps, and 2 h and 30 min for DRME with one iteration step.
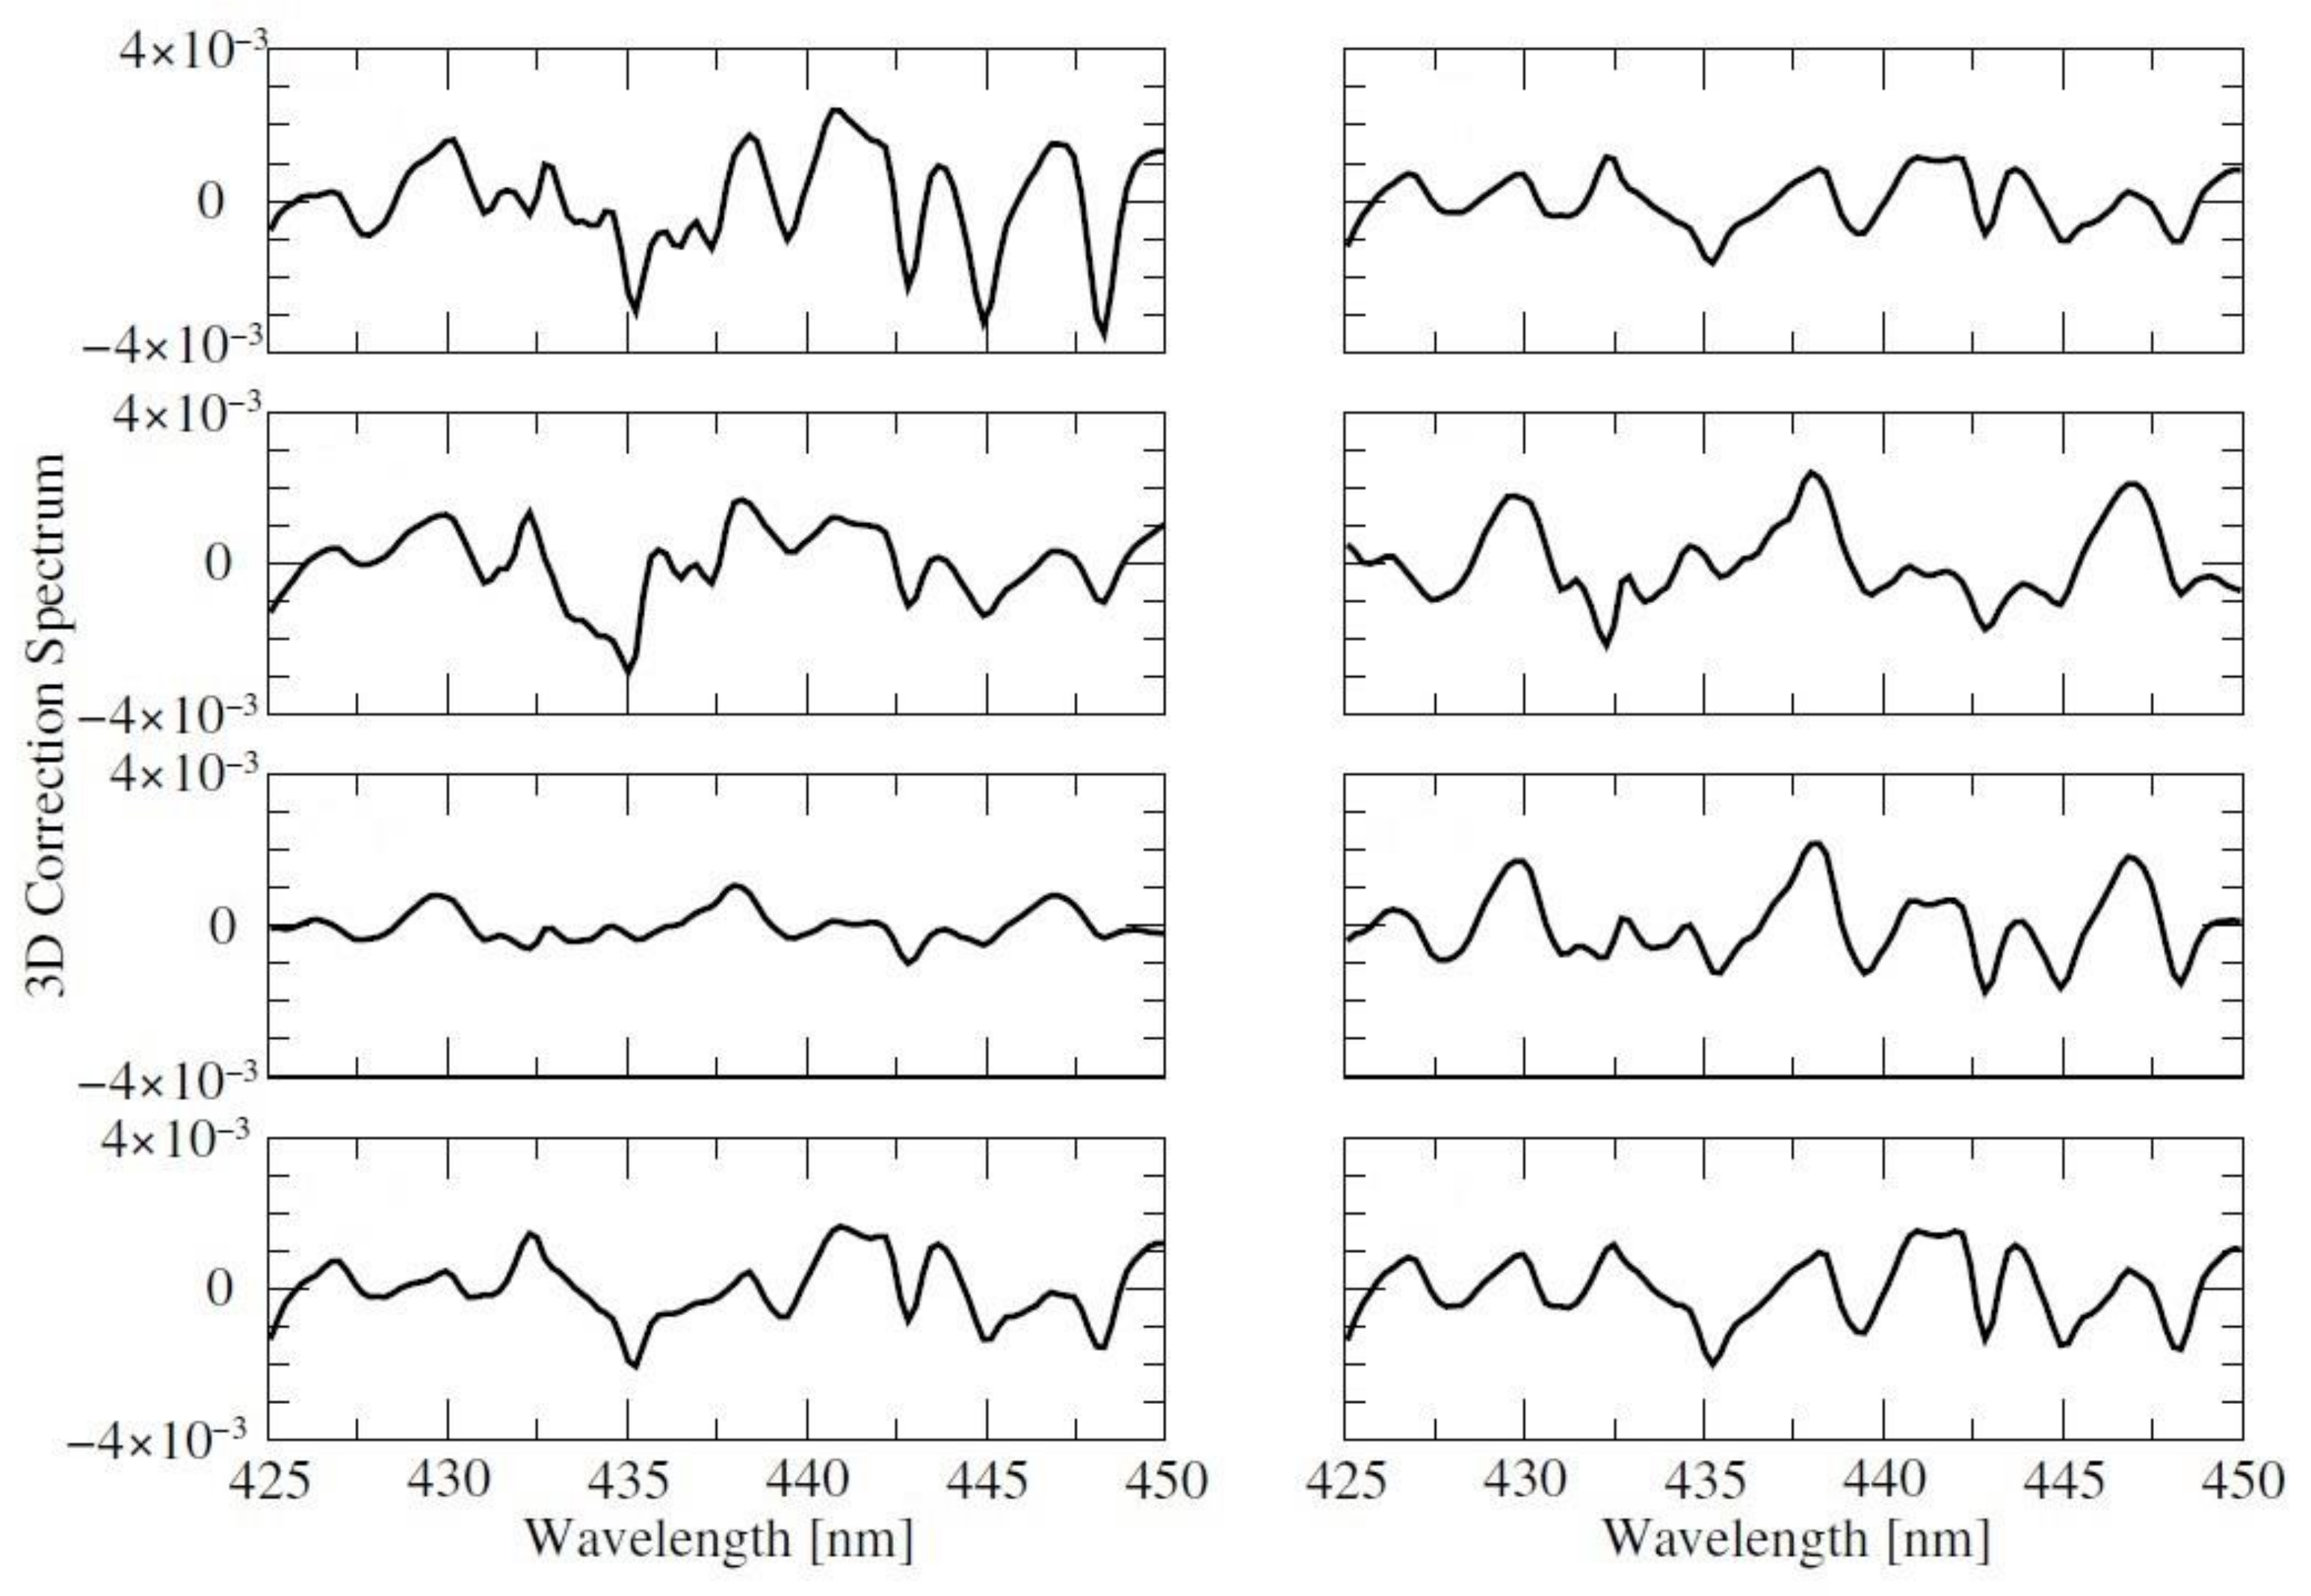
By taking a closer look at the cloudy scenes depicted in Figure 1, we see that the footprint of the detector is almost cloud-free. In this regard, we may try to retrieve the total column amount by using an one-dimensional radiative transfer model for a cloud-free atmosphere. The results given in the first two columns of Table 4 and Table 5 show that in this case, the relative error is about 15%. In these simulations, the spectral signal measured by the instrument is computed by a three-dimensional radiative transfer model, while in the retrieval, the simulated spectral signal is computed by an one-dimensional radiative transfer model. The relative errors can be approximately halved when the differential correction spectrum due to three-dimensional effects (18) is included in the inverse model and its amplitude is retrieved. This is shown in the second two columns of Table 4 and Table 5. Note that the computation time given in these tables does not take into account the time for computing the correction spectrum by a three-dimensional radiative transfer model. As shown in [27], this computation time is of about 1 h and 20 min, so that roughly speaking, this is the time for retrieving the total column amount by an one-dimensional inverse model that accounts on three-dimensional effects. The correction spectra included in the inverse model are shown in Figure 6, and it is apparent that they depend on the cloud field (some similitude can be observed for the cloudy scenes 2 and 7).
4. Discussion
The main concepts of an algorithm for the retrieval of the total column amount of trace gases in a multi-dimensional atmosphere have been presented. The algorithm uses (i) as inverse models, certain differential radiance models with internal and external closures; (ii) as regularization tool, the iteratively regularized Gauss-Newton method; and (iii) as linearized radiative transfer model, the spherical harmonics discrete ordinate method with a spectral acceleration approach that combines the correlated k-distribution method with the principal component analysis.
The algorithm has been applied to the retrieval of the total column amount of under cloudy conditions. For two-dimensional geometries, we come to the following findings.
- The differential radiance models with internal and external closures yield accurate results with reasonable computation times (of about 35–40 min).
- An inverse model based on an approximate computation of the partial derivative leads to a reduction of the computation time by about 25%, but to large relative errors.
- Provided that the regularization parameter is optimally chosen, reasonable accurate results with a computation time of about 6 min can be obtained when the iterative process, corresponding to the differential radiance model with external closure, is stopped after one iteration step. The fact that the optimal value of the regularization parameter depends on the cloudy scene, makes it more difficult to apply this one-step retrieval algorithm, or equivalently, DOAS-type models.
For three-dimensional geometries, we come to the following results.
- Although accurate, the retrievals based on the differential radiance model with external closures are inefficient; the computation time is of about 14 h and 15 min for a full-step retrieval algorithm, and 2 h and 30 min for an one-step retrieval algorithm. The one-step retrieval algorithm is less accurate than in the case of two-dimensional geometries, but the results are still acceptable.
- The application of a fast one-dimensional radiative transfer model to retrieve the column amount for a three-dimensional cloudy scene leads to relative errors up to 15%. These errors can be reduced when a differential correction spectrum due to three-dimensional effects is included in the retrieval.
The main conclusion of our analysis is that although for three-dimensional geometries the computational time is high, the main concepts of the algorithm are correct and the retrieval results are accurate.
For operational retrievals, we recommend
- to construct a database for the spectral signal and its derivatives , and to use these spectra in an one-step, three-dimensional retrieval algorithm, or
- to construct a database for the differential correction spectra accounting on three-dimensional effects , and to use these spectra in a full-step, one-dimensional retrieval algorithm.
The databases should be built up for different cloud scenarios, surface albedo, and solar and satellite geometries. The main problem which has to be solved is the design of a classification algorithm for broken clouds. One option is to use a nearest neighbor classifier based on the two-dimensional principal component analysis. Another option is to use a classification algorithm in which only the distributions of the cloud fields in the two-dimensional domains around the azimuth planes of the solar and viewing directions are of interest. The width of these domains corresponds to the instrument footprint. Note that these domains are also relevant in the tilted independent pixel approximation [34]: the direct solar beam is computed at all grid points which belong to the vertical columns inside the instrument footprint and for all characteristics within the entrance (solar direction) domain, while the measured radiance is computed by integrating the source function along all characteristics within the exit (viewing direction) domain. This will be the topic of a forthcoming paper.
Author Contributions
Conceptualization, A.D.; Software, A.D. and D.S.E.; formal analysis, D.S.E. and T.T.; writing—original draft preparation, A.D.; writing—review and editing, D.S.E. and T.T. All authors have read and agreed to the published version of the manuscript.
Funding
This research received no external funding.
Conflicts of Interest
The authors declare no conflict of interest. The funders had no role in the design of the study; in the collection, analyses, or interpretation of data; in the writing of the manuscript; or in the decision to publish the results.
Appendix A
In this appendix we describe two inversion models for tropospheric column retrieval.
Assuming that the troposphere extends from level 1 to , and the stratosphere from level to , the tropospheric and stratospheric total columns are given, respectively, by
and
Obviously, we have . The retrieval of the tropospheric column of a gas (specifically, ) is performed under the assumption that we have some a priori knowledge about the stratospheric column. In other words, we suppose that can be approximated by , where is delivered for example, by the reference sector method. In this method, the stratospheric columns is estimated from measurements over the remote regions, under the assumptions of low longitudinal variations of stratospheric , and negligible tropospheric [35,36,37]. Denoting by the set of all total columns excepting , i.e., , a tropospheric column retrieval algorithm can be summarized as follows [17].
- With delivered by the reference sector method, and and determined at Step 1, solve the nonlinear equationof the DRMI inversion model for , or the nonlinear equationof the DRME inversion model for .
Appendix B
In this appendix we present a simplified derivation of the standard DOAS equation. For a more rigorous treatment, we refer to the work in [19].
Further, we consider the first-order Taylor expansion
at , that is,
where corresponds to an atmosphere without gaseous absorption and is the linearization error. Defining
which yields
we express Equation (A8) as
In general, can be approximated by a polynomial, but not. However, if is negligible, then we have ; thus, can be approximated by a polynomial, which can be included in . Consequently, we obtain
so that by putting we are led to the following representation for the DRME model (11),
In view of the computational formula (cf. Equation (29))
we define
and rewrite Equation (A13) as
where
is the air mass factor. Equation (A16) represents the standard DOAS equation. Note that if the computation of the partial derivatives in Equation (A15) is an expensive process, we may define by the relation
References
- Efremenko, D.S.; Doicu, A.; Loyola, D.; Trautmann, T. Fast Stochastic Radiative Transfer Models for Trace Gas and Cloud Property Retrievals Under Cloudy Conditions. In Springer Series in Light Scattering; Kokhanovsky, A., Ed.; Springer International Publishing: Cham, Switzerland, 2018; pp. 231–277. [Google Scholar] [CrossRef]
- Belov, V.V.; Kirnos, I.V.; Tarasenkov, M.V. Estimation of the influence of cloudiness on the Earth observation from space through a gap in a cloudy field. In Proceedings of the 21st International Symposium Atmospheric and Ocean Optics: Atmospheric Physics, SPIE, Tomsk, Russia, 22–26 June 2015; Romanovskii, O.A., Ed.; [Google Scholar] [CrossRef]
- Tarasenkov, M.V.; Kirnos, I.V.; Belov, V.V. Observation of the Earth’s surface from the space through a gap in a cloud field. Atmos. Ocean. Opt. 2017, 30, 39–43. [Google Scholar] [CrossRef]
- Zhuravleva, T.B.; Nasrtdinov, I.M.; Russkova, T.V. Influence of 3D cloud effects on spatial-angular characteristics of the reflected solar radiation field. Atmos. Ocean. Opt. 2017, 30, 103–110. [Google Scholar] [CrossRef]
- Schwaerzel, M.; Emde, C.; Brunner, D.; Morales, R.; Wagner, T.; Berne, A.; Buchmann, B.; Kuhlmann, G. Three-dimensional radiative transfer effects on airborne and ground-based trace gas remote sensing. Atmos. Meas. Tech. 2020, 13, 4277–4293. [Google Scholar] [CrossRef]
- Evans, K. The spherical harmonic discrete ordinate method for three-dimensional atmospheric radiative transfer. J. Atmos. Sci. 1998, 55, 429–446. [Google Scholar] [CrossRef]
- Cracknell, A.; Hayes, L. Introduction to Remote Sensing, 2nd ed.; CRC Press: New York, NY, USA, 2007. [Google Scholar]
- Chandrasekhar, S. Radiative Transfer. In Dover Books on Intermediate and Advanced Mathematics; Dover Publications: New York, New York, USA, 1960. [Google Scholar]
- Sobolev, V.V. Light Scattering in Planetary Atmospheres; Pergamon Press: New York, USA, 1972. [Google Scholar]
- Doicu, A.; Efremenko, D.; Trautmann, T. An analysis of the short-characteristic method for the spherical harmonic discrete ordinate method (SHDOM). J. Quant. Spectrosc. Radiat. Transf. 2013, 119, 114–127. [Google Scholar] [CrossRef]
- Bohren, C.; Huffman, D. Absorption and Scattering of Light by Small Particles; Wiley: New York, NY, USA, 1998. [Google Scholar] [CrossRef] [Green Version]
- Kokhanovsky, A. Cloud Optics; Springer: Dordrecht, The Netherlands, 2006. [Google Scholar] [CrossRef]
- Bodhaine, B.; Wood, N.; Dutton, E.; Slusser, J. On Rayleigh optical depth calculations. J. Atmos. Ocean. Technol. 1999, 16, 1854–1861. [Google Scholar] [CrossRef]
- Alexandrov, M.; Marshak, A.; Ackerman, A. Cellular Statistical Models of Broken Cloud Fields. Part I: Theory. J. Atmos. Sci. 2010, 67, 2125–2151. [Google Scholar] [CrossRef]
- Doicu, A.; Trautmann, T.; Schreier, F. Numerical Regularization for Atmospheric Inverse Problems; Springer: Berlin/Heidelberg, Germany, 2010. [Google Scholar] [CrossRef] [Green Version]
- Efremenko, D.; Schüssler, O.; Doicu, A.; Loyola, D. A stochastic cloud model for cloud and ozone retrievals from UV measurements. J. Quant. Spectrosc. Radiat. Transf. 2016, 184, 167–179. [Google Scholar] [CrossRef]
- Liu, S. Inversion Models for the Retrieval of Total and Tropospheric NO2 Columns. Atmosphere 2019, 10, 607. [Google Scholar] [CrossRef] [Green Version]
- Platt, U.; Stutz, J. Differential Optical Absorption Spectroscopy; Springer: Berlin/Heidelberg, Germany, 2008. [Google Scholar] [CrossRef] [Green Version]
- Rozanov, V.V.; Rozanov, A.V. Differential optical absorption spectroscopy (DOAS) and air mass factor concept for a multiply scattering vertically inhomogeneous medium: Theoretical consideration. Atmos. Meas. Tech. 2010, 3, 751–780. [Google Scholar] [CrossRef] [Green Version]
- Bakushinskii, A. The problem of the convergence of the iteratively regularized Gauss–Newton method. Comput. Math. Math. Phys. 1992, 32, 1353–1359. [Google Scholar]
- Xu, J.; Rao, L.; Schreier, F.; Efremenko, D.; Doicu, A.; Trautmann, T. Insight into Construction of Tikhonov-Type Regularization for Atmospheric Retrievals. Atmosphere 2020, 11, 1052. [Google Scholar] [CrossRef]
- Tikhonov, A. On the solution of ill-posed problems and the method of regularization. Dokl. Akad. Nauk SSSR 1963, 151, 501–504. [Google Scholar]
- Morozov, V. On the solution of functional equations by the method of regularization. Dokl. Akad. Nauk SSSR 1966, 167, 510–512. [Google Scholar]
- Spherical Harmonic Discrete Ordinate Method (SHDOM) for Atmospheric Radiative Transfer. Available online: http://coloradolinux.com/shdom/ (accessed on 3 January 2020).
- Doicu, A.; Efremenko, D. Linearizations of the Spherical Harmonic Discrete Ordinate Method (SHDOM). Atmosphere 2019, 10, 292. [Google Scholar] [CrossRef] [Green Version]
- Levis, A.; Schechner, Y.; Aides, A.; Davis, A. Airborne Three-Dimensional Cloud Tomography. In Proceedings of the 2015 IEEE International Conference on Computer Vision (ICCV), Santiago, Chile, 7–13 December 2015. [Google Scholar] [CrossRef]
- Doicu, A.; Efremenko, D.; Trautmann, T. A Spectral Acceleration Approach for the Spherical Harmonics Discrete Ordinate Method. Remote Sens. 2020, 12, 3703. [Google Scholar] [CrossRef]
- Ambartzumyan, V. The effect of the absorption lines on the radiative equilibrium of the outer layers of the stars. Publ. Obs. Astron. Univ. Leningrad 1936, 6, 7–18. [Google Scholar]
- Efremenko, D.; Doicu, A.; Loyola, D.; Trautmann, T. Optical property dimensionality reduction techniques for accelerated radiative transfer performance: Application to remote sensing total ozone retrievals. J. Quant. Spectrosc. Radiat. Transfer. 2014, 133, 128–135. [Google Scholar] [CrossRef]
- Henyey, L.C.; Greenstein, J.L. Diffuse radiation in the Galaxy. Astrophys. J. 1941, 93, 70. [Google Scholar] [CrossRef]
- Rozanov, V.; Vountas, M. Radiative transfer equation accounting for rotational Raman scattering and its solution by the discrete-ordinates method. J. Quant. Spectrosc. Radiat. Transf. 2014, 133, 603–618. [Google Scholar] [CrossRef]
- Wiscombe, W. The delta-M method: Rapid yet accurate radiative flux calculations for strongly asymmetric phase functions. J. Atmos. Sci. 1977, 34, 1408–1422. [Google Scholar] [CrossRef] [Green Version]
- Nakajima, T.; Tanaka, M. Algorithms for radiative intensity calculations in moderately thick atmos using a truncation approximation. J. Quant. Spectrosc. Radiat. Transfer. 1988, 40, 51–69. [Google Scholar] [CrossRef]
- Várnai, T.; Davies, R. Effects of Cloud Heterogeneities on Shortwave Radiation: Comparison of Cloud-Top Variability and Internal Heterogeneity. J. Atmos. Sci. 1999, 56, 4206–4224. [Google Scholar] [CrossRef]
- Richter, A.; Burrows, J. Tropospheric NO2 from GOME measurements. Adv. Space Res. 2002, 29, 1673–1683. [Google Scholar] [CrossRef]
- Bucsela, E.J.; Krotkov, N.A.; Celarier, E.A.; Lamsal, L.N.; Swartz, W.H.; Bhartia, P.K.; Boersma, K.F.; Veefkind, J.P.; Gleason, J.F.; Pickering, K.E. A new stratospheric and tropospheric NO2 retrieval algorithm for nadir-viewing satellite instruments: Applications to OMI. Atmos. Meas. Tech. 2013, 6, 2607–2626. [Google Scholar] [CrossRef] [Green Version]
- Beirle, S.; Hörmann, C.; Jöckel, P.; Liu, S.; de Vries, M.; Pozzer, A.; Sihler, H.; Valks, P.; Wagner, T. The STRatospheric Estimation Algorithm from Mainz (STREAM): Estimating stratospheric NO2 from nadir-viewing satellites by weighted convolution. Atmos. Meas. Tech. 2016, 9, 2753–2779. [Google Scholar] [CrossRef] [Green Version]
Figure 1.
Indicator function with and for the 8 cloudy scenes (cases (a–h)); i and j refer to the pixel index in the xy plane, while each pixel corresponds to a 500 m × 500 m area.
Figure 1.
Indicator function with and for the 8 cloudy scenes (cases (a–h)); i and j refer to the pixel index in the xy plane, while each pixel corresponds to a 500 m × 500 m area.
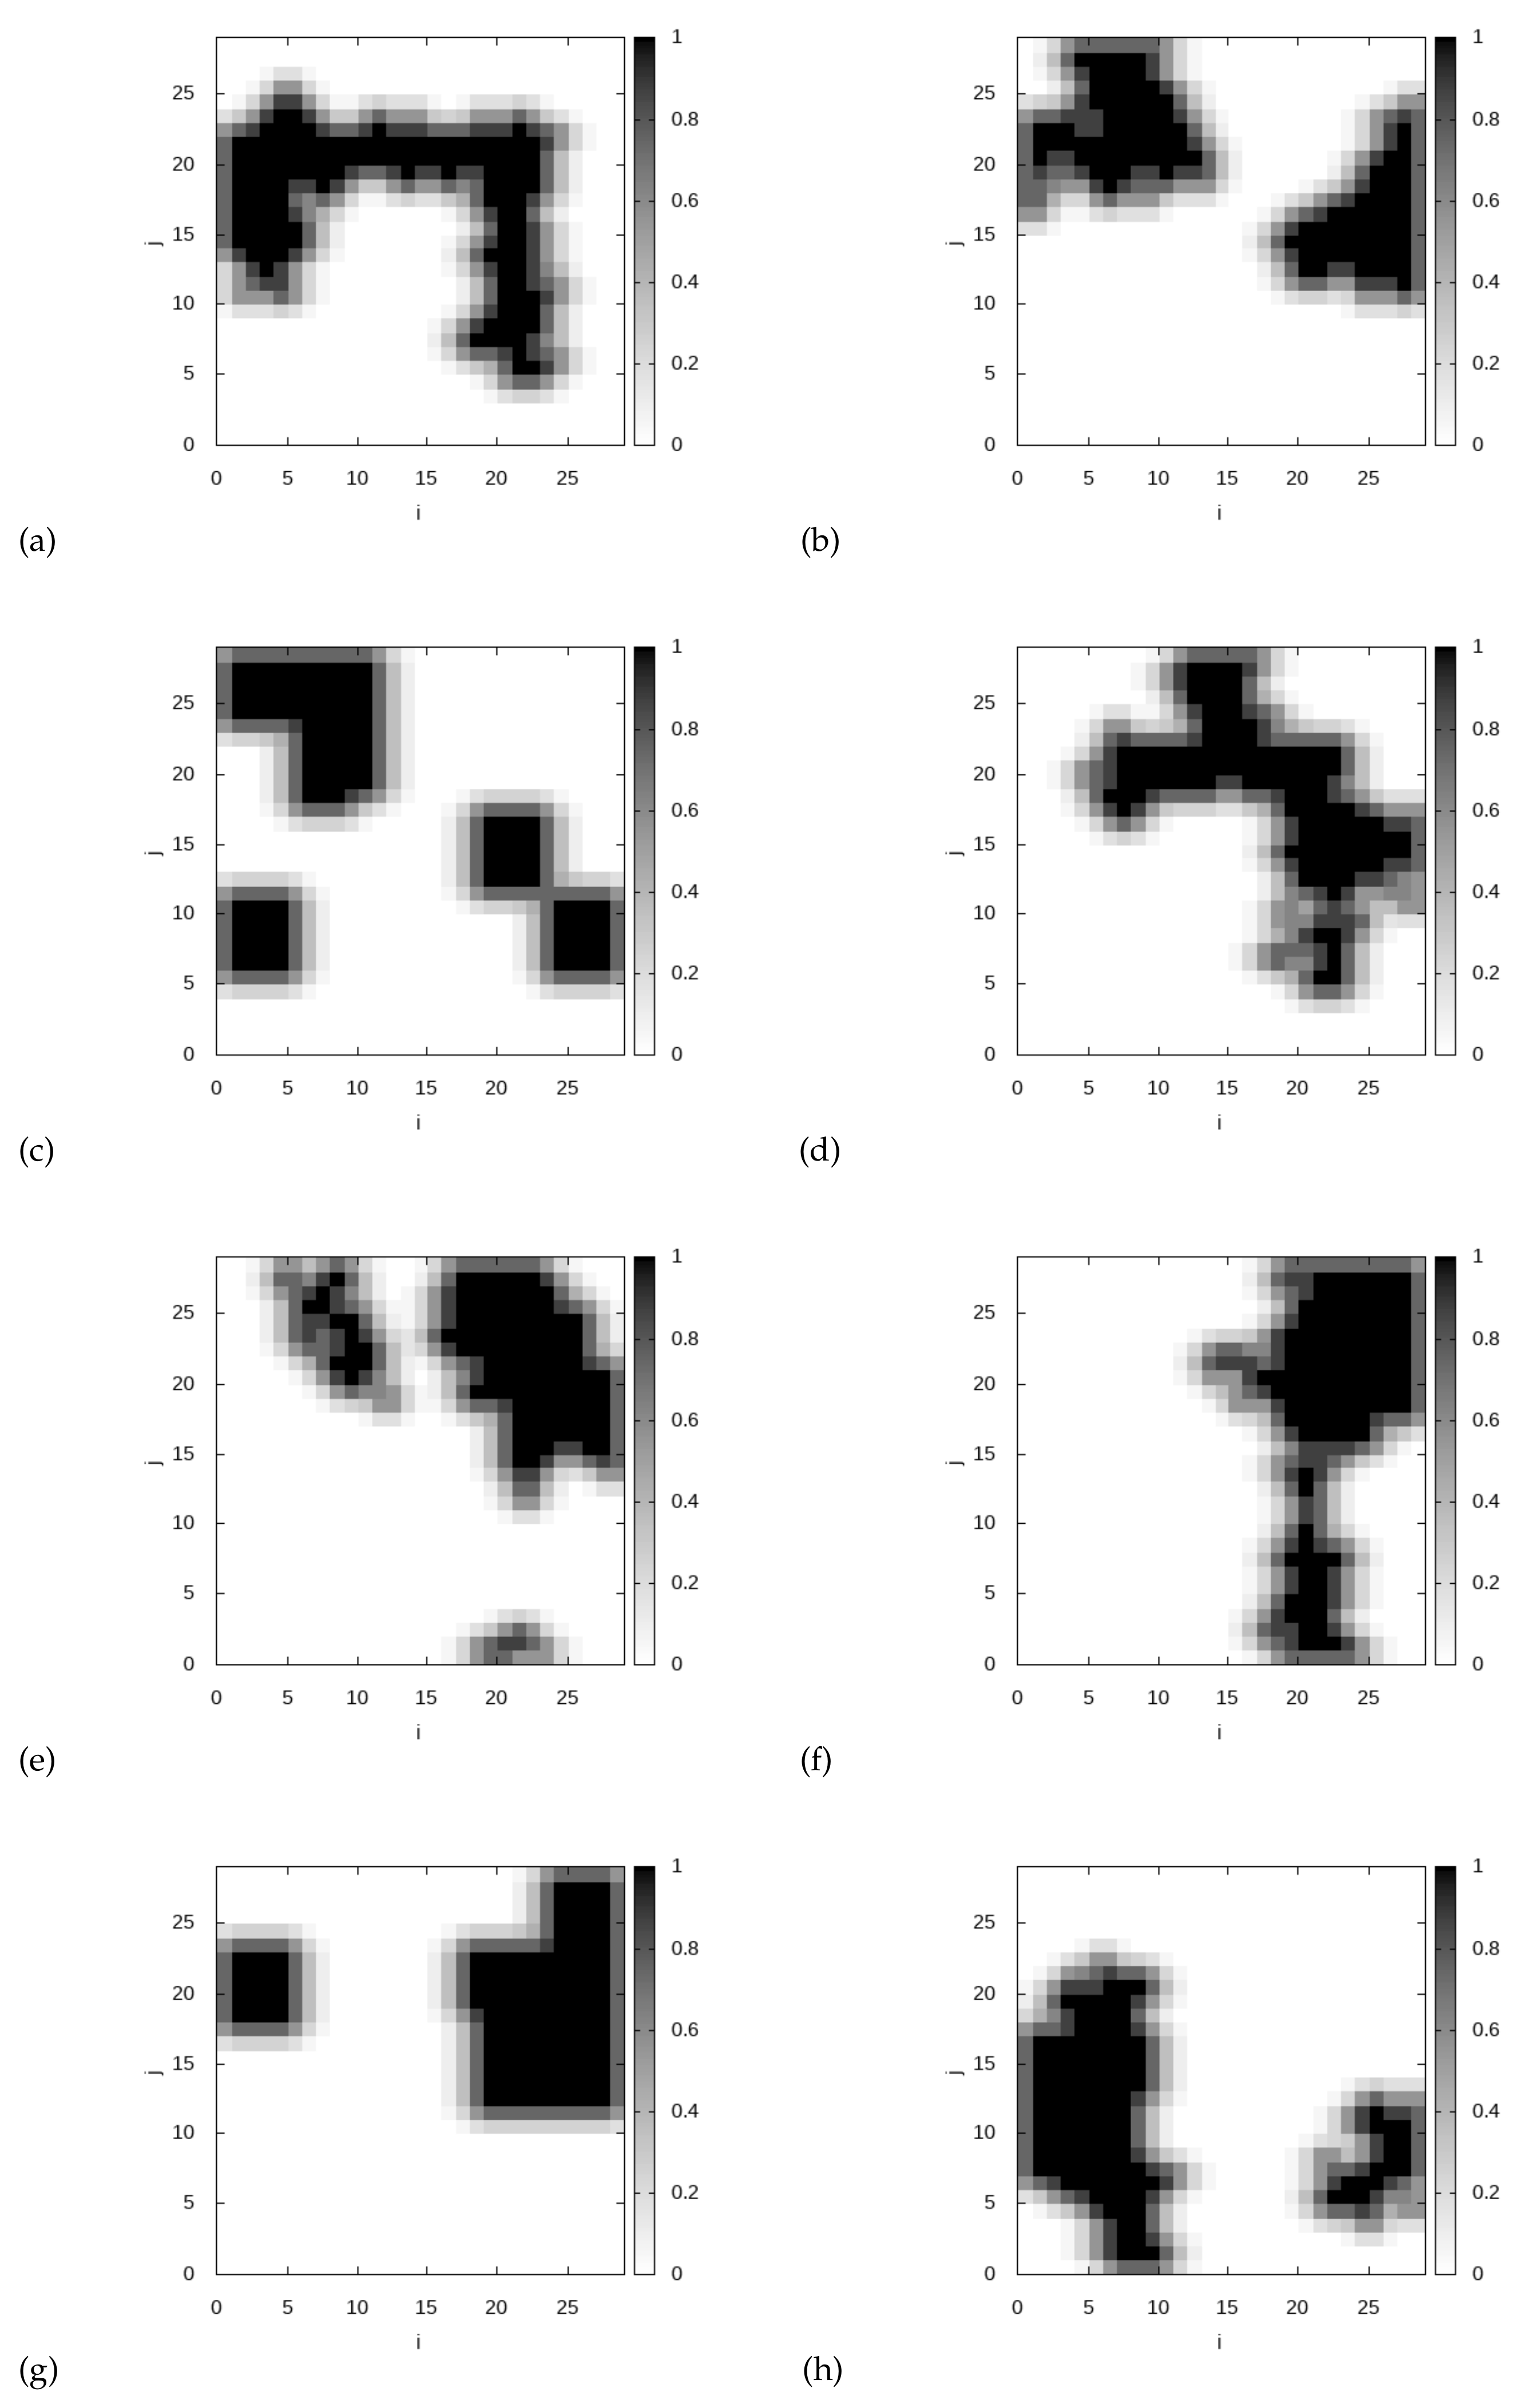
Figure 2.
Slices of the indicator function with at km for the cloudy scenes shown in Figure 1 (a–d,f,h).
Figure 2.
Slices of the indicator function with at km for the cloudy scenes shown in Figure 1 (a–d,f,h).
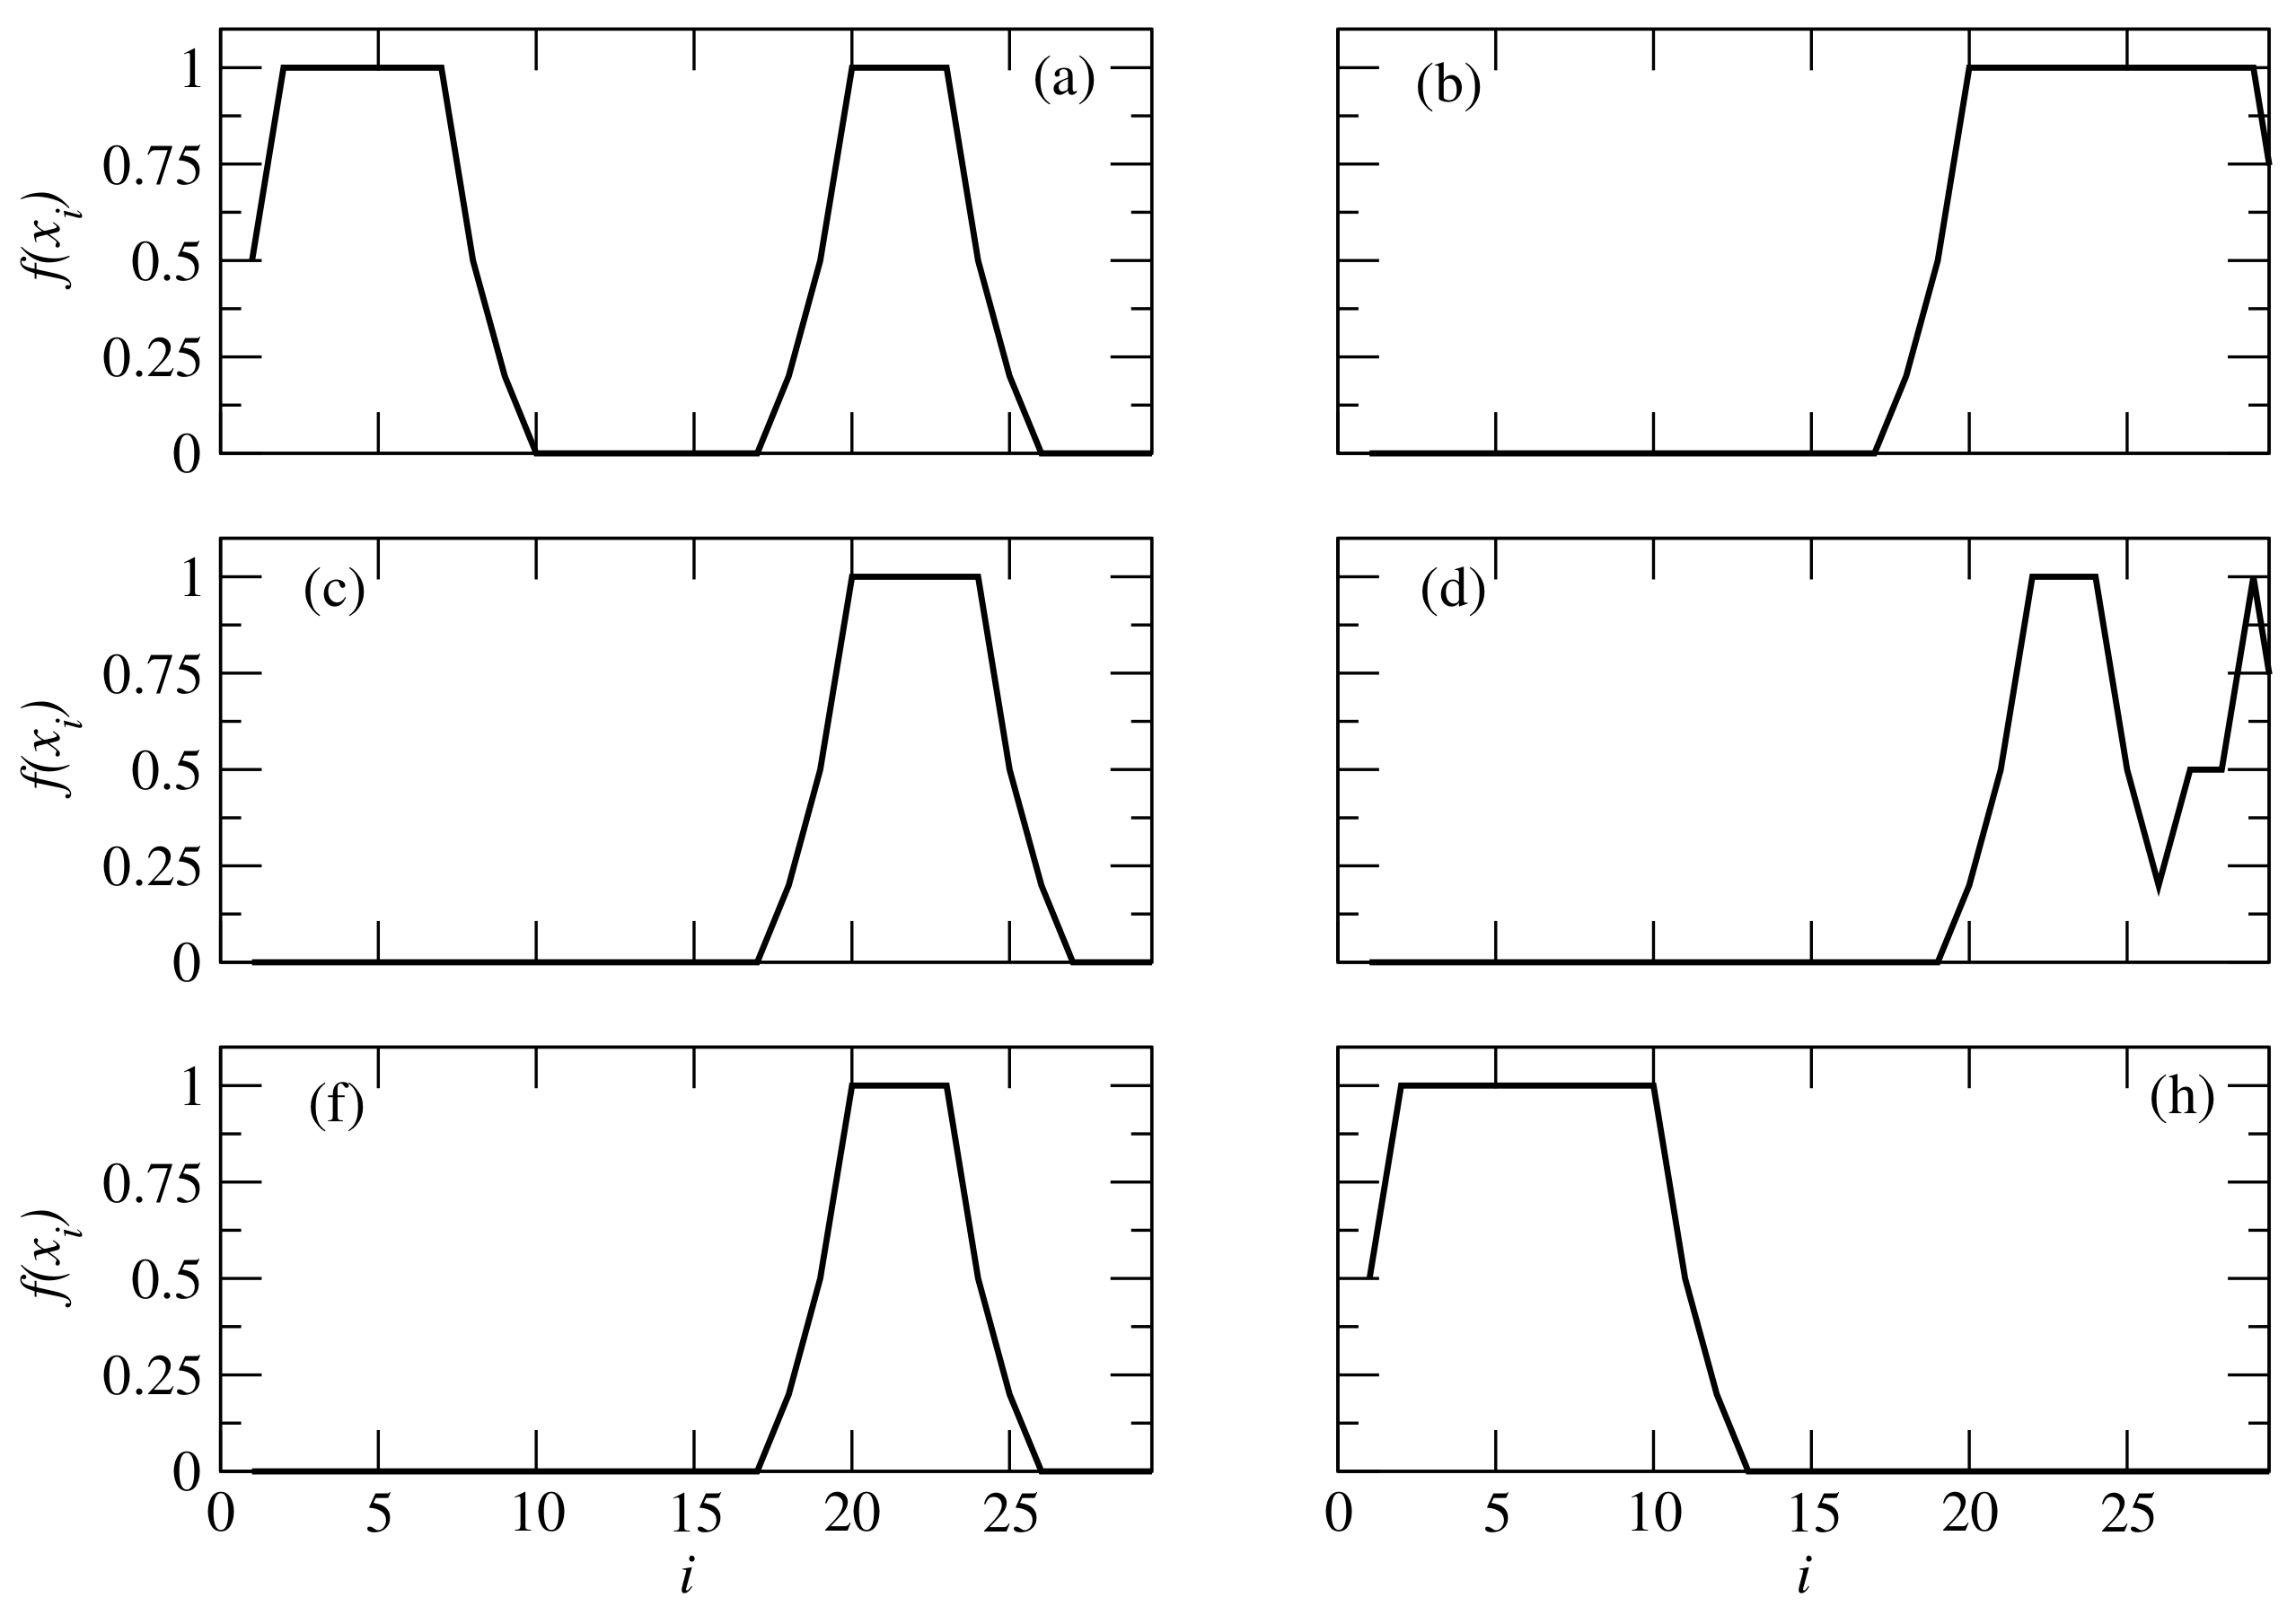
Figure 3.
A priori vertical profile of volume mixing ratio.

Figure 4.
Ring correction spectrum included in the retrieval.

Figure 5.
Residuals versus the iteration index for Differential Radiance Model with Internal closure (DRMI) (left) and Differential Radiance Model with External closure (DRME) (right).
Figure 5.
Residuals versus the iteration index for Differential Radiance Model with Internal closure (DRMI) (left) and Differential Radiance Model with External closure (DRME) (right).
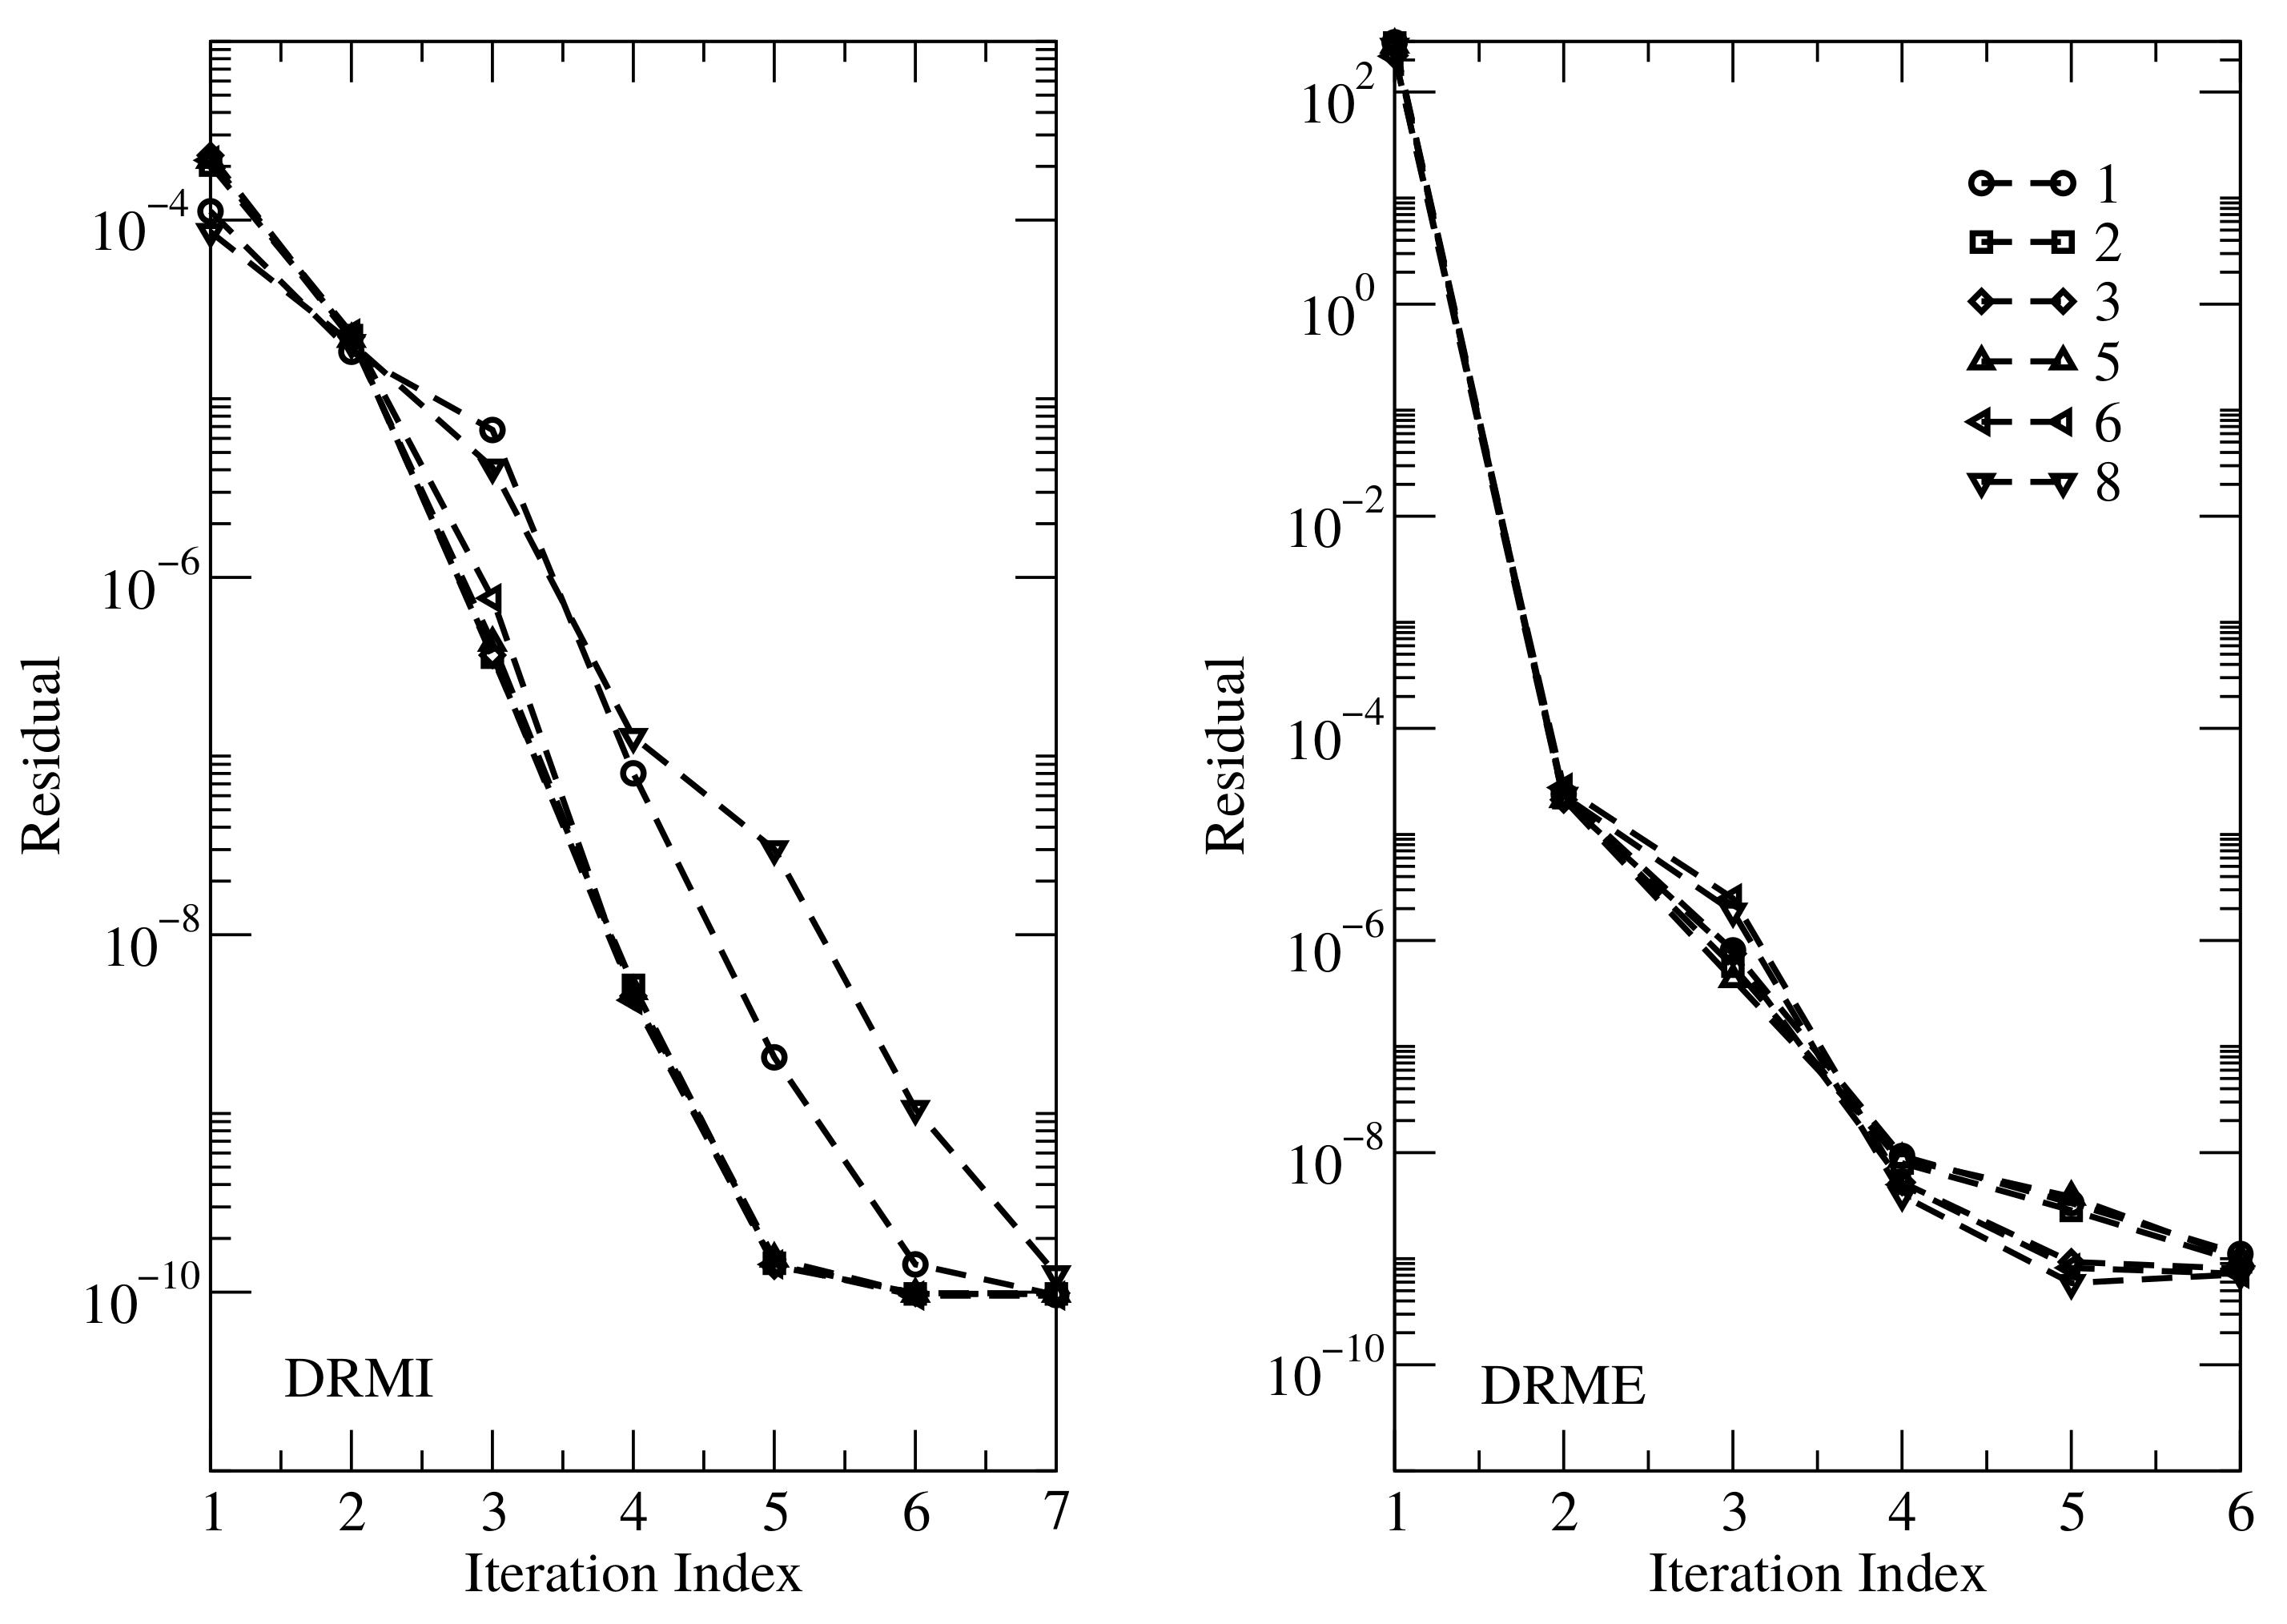
Figure 6.
Correction spectra due to three-dimensional effects.

Table 1.
Relative errors and the computation times (CPU) in minutes: seconds for DRMI. The results correspond to a two-dimensional geometry.
Table 1.
Relative errors and the computation times (CPU) in minutes: seconds for DRMI. The results correspond to a two-dimensional geometry.
| Cloudy Scene | DRMI | DRMI Approx. Derivatives | ||
|---|---|---|---|---|
| Rel. Errors | CPU | Rel. Errors | CPU | |
| 1 | 39:51 | 32:24 | ||
| 2 | 40:12 | 32:48 | ||
| 3 | 39:14 | 31:06 | ||
| 5 | 38:54 | 30:44 | ||
| 6 | 39:32 | 31:16 | ||
| 8 | 40:06 | 32:33 | ||
Table 2.
Relative errors and the computation times (CPU) in minutes:seconds for DRME. The numbers in parenthesis are the values of the regularization parameter . The results correspond to a two-dimensional geometry.
Table 2.
Relative errors and the computation times (CPU) in minutes:seconds for DRME. The numbers in parenthesis are the values of the regularization parameter . The results correspond to a two-dimensional geometry.
| Cloudy Scene | DRME | DRME (One Iteration) | ||
|---|---|---|---|---|
| Rel. Errors | CPU | Rel. Errors | CPU | |
| 1 | 35:10 | 5:33 | ||
| 2 | 36:47 | 5:54 | ||
| 3 | 34:57 | 5:12 | ||
| 5 | 34:23 | 5:01 | ||
| 6 | 35:06 | 5:28 | ||
| 8 | 36:23 | 5:48 | ||
Table 3.
The same as in Table 2 but for a three-dimensional geometry.
Table 3.
The same as in Table 2 but for a three-dimensional geometry.
| Cloudy Scene | DRME | DRME (One Iteration) | ||
|---|---|---|---|---|
| Rel. Errors | CPU | Rel. Errors | CPU | |
| 1 | 14:15:31 | 2:34:03 | ||
| 2 | 14:21:43 | 2:36:42 | ||
| 3 | 14:15:57 | 2:32:26 | ||
| 5 | 14:15:23 | 2:32:11 | ||
| 6 | 14:14:36 | 2:33:38 | ||
| 8 | 14:20:13 | 2:34:16 | ||
Table 4.
Relative errors and the computation times (CPU) in minutes:seconds for DRMI. The measured and simulated spectral signals are computed by a three- and an one-dimensional radiative transfer model, respectively.
Table 4.
Relative errors and the computation times (CPU) in minutes:seconds for DRMI. The measured and simulated spectral signals are computed by a three- and an one-dimensional radiative transfer model, respectively.
| Cloudy Scene | DRMI | DRMI (Correction. Spectrum) | ||
|---|---|---|---|---|
| Rel. Errors | CPU | Rel. Errors | CPU | |
| 1 | 2:21 | 2:42 | ||
| 2 | 2:32 | 2:58 | ||
| 3 | 2:14 | 2:36 | ||
| 4 | 2:04 | 2:24 | ||
| 5 | 2:27 | 2:47 | ||
| 6 | 2:25 | 2:45 | ||
| 7 | 2:25 | 2:46 | ||
| 8 | 2:30 | 2:50 | ||
Table 5.
The same as in Table 4 but for DRME.
Table 5.
The same as in Table 4 but for DRME.
| Cloudy Scene | DRME | DRME (Correction. Spectrum) | ||
|---|---|---|---|---|
| Rel. Errors | CPU | Rel. Errors | CPU | |
| 1 | 2:10 | 2:16 | ||
| 2 | 2:12 | 2:18 | ||
| 3 | 2:05 | 2:11 | ||
| 4 | 1:52 | 2:01 | ||
| 5 | 2:16 | 2:22 | ||
| 6 | 2:14 | 2:18 | ||
| 7 | 2:13 | 2:19 | ||
| 8 | 2:21 | 2:17 | ||
Publisher’s Note: MDPI stays neutral with regard to jurisdictional claims in published maps and institutional affiliations. |
© 2021 by the authors. Licensee MDPI, Basel, Switzerland. This article is an open access article distributed under the terms and conditions of the Creative Commons Attribution (CC BY) license (http://creativecommons.org/licenses/by/4.0/).
Share and Cite
MDPI and ACS Style
Doicu, A.; Efremenko, D.S.; Trautmann, T. A Proof-of-Concept Algorithm for the Retrieval of Total Column Amount of Trace Gases in a Multi-Dimensional Atmosphere. Remote Sens. 2021, 13, 270. https://doi.org/10.3390/rs13020270
AMA Style
Doicu A, Efremenko DS, Trautmann T. A Proof-of-Concept Algorithm for the Retrieval of Total Column Amount of Trace Gases in a Multi-Dimensional Atmosphere. Remote Sensing. 2021; 13(2):270. https://doi.org/10.3390/rs13020270
Chicago/Turabian StyleDoicu, Adrian, Dmitry S. Efremenko, and Thomas Trautmann. 2021. "A Proof-of-Concept Algorithm for the Retrieval of Total Column Amount of Trace Gases in a Multi-Dimensional Atmosphere" Remote Sensing 13, no. 2: 270. https://doi.org/10.3390/rs13020270
Note that from the first issue of 2016, this journal uses article numbers instead of page numbers. See further details here.