
Quantification of Urban Heat Island-Induced Contribution to Advance in Spring Phenology: A Case Study in Hangzhou, China


1
Hydrology and Water Resources College, Hohai University, Nanjing 211100, China
2
Jiangsu Provincial Key Laboratory of Geographic Information Science and Technology, International Institute for Earth System Science, Nanjing University, Nanjing 210023, China
3
National Earth System Science Data Center, National Science & Technology Infrastructure of China, Beijing 100101, China
4
Jiangsu Center for Collaborative Innovation in Geographical Information Resource Development and Application, Nanjing 210023, China
*
Author to whom correspondence should be addressed.
Remote Sens. 2021, 13(18), 3684; https://doi.org/10.3390/rs13183684
Submission received: 11 August 2021
/
Revised: 10 September 2021
/
Accepted: 13 September 2021
/
Published: 15 September 2021
(This article belongs to the Special Issue Remote Sensing of Land Surface Phenology)
Abstract
:Plant phenology is one of the key regulators of ecosystem processes, which are sensitive to environmental change. The acceleration of urbanization in recent years has produced substantial impacts on vegetation phenology over urban areas, such as the local warming induced by the urban heat island effect. However, quantitative contributions of the difference of land surface temperature (LST) between urban and rural (ΔLST) and other factors to the difference of spring phenology (i.e., the start of growing season, SOS) between urban and rural (ΔSOS) were rarely reported. Therefore, the objective of this study is to explore impacts of urbanization on SOS and distinguish corresponding contributions. Using Hangzhou, a typical subtropical metropolis, as the study area, vegetation index-based phenology data (MCD12Q2 and MYD13Q1 EVI) and land surface temperature data (MYD11A2 LST) from 2006–2018 were adopted to analyze the urban–rural gradient in phenology characteristics through buffers. Furthermore, we exploratively quantified the contributions of the ΔLST to the ΔSOS based on a temperature contribution separation model. We found that there was a negative coupling between SOS and LST in over 90% of the vegetated areas in Hangzhou. At the sample-point scale, SOS was weakly, but significantly, negatively correlated with LST at the daytime (R2 = 0.2 and p < 0.01 in rural; R2 = 0.14 and p < 0.05 in urban) rather than that at nighttime. Besides, the ΔSOS dominated by the ΔLST contributed more than 70% of the total ΔSOS. We hope this study could help to deepen the understanding of responses of urban ecosystem to intensive human activities.

1. Introduction
Plant phenology is the time of a certain growth event in the growth cycle, such as germination, branching, leafing, flowering, fruiting, defoliation and dormancy [1,2,3,4]. It directly or indirectly regulates several processes of plant growth, such as carbon and water cycle, playing a crucial role in the earth system [5,6]. Adapting to seasonal changes of the environment, plants show a growth rhythm, which is sensitive to environmental change [7,8]. As one of the most critical factors affecting plant phenology, an increase in temperature can promote the activity of enzymes, thereby prolonging plant development. Specifically, an increase in spring temperature promotes the release of plant dormancy in spring, and generally extends the growth cycle of plants [9,10,11,12,13,14].
Urbanization is an important feature of world development today, and it is one of the main causes of global environmental change in the 21st century. The acceleration of urbanization in recent years has produced substantial impacts on plant phenology over both urban areas and their rural surroundings [15,16,17,18,19]. This is mostly associated to the local warming effect induced by the urban heat island effect, which resulted from the increase in impervious surface percentage and anthropogenic heat emissions [20,21,22,23]. Moreover, it is as well as through the fertilization effect induced by the increase in the concentration of carbon dioxide (CO2), nitrogen oxides (NOx), and other atmospheric trace gases over urban surfaces [24,25,26]. These changes affect urban environments that plants depend on, and have impacts on the growth of plants, thereby changing the plant phenology [27,28].
At present, many studies have paid attention to impacts of urbanization on the change of plant phenology [27,28,29,30,31,32]. There are two methods to explore the impacts above: the historical comparison method and the urban–rural comparison method. The historical comparison method compared the phenology before and after urbanization, which was mainly for fast-developing cities [31]. However, due to the difficulty of obtaining long time series data, the historical comparison method is greatly restricted. The urban–rural comparison method used the data of the urban and the rural at the same time to explore the impact of urbanization on phenology, which is a method of changing space for time. The second one has been widely used, because of the great advantages in large-scale observations of remote sensing data [15,16,17,18,19,32]. Meng et al. investigated the urban and rural phenology of the of 85 giant cities in the continental United States from 2001 to 2014, and the results showed that the start of growing season (SOS) in the urban was 6 days earlier than that in the rural [33]. Wohlfahrt et al. found that with the acceleration of urbanization, the SOS advanced and the senescence delayed in the urban areas where the temperature rises [34]. Hu et al. used the Enhanced Vegetation Index (EVI) to explore the spatio-temporal changes of plant phenology and its response to land surface temperature (LST) in Northeast China [35]. The results showed that the LST was significantly negatively correlated with the SOS. Recently, most current studies focused on varieties of plant phenology and influences of temperature on plant phenology under urbanization, but did not quantitatively evaluate the contribution of the temperature differences to the phenological differences between the urban and the rural. That is, the quantitative contribution of the local warming induced by the urban heat island effect (the difference of LST between urban and rural, ΔLST) to the difference of spring phenology (SOS) between urban and rural (ΔSOS) was less understood in past research.
With the development of statistical methods, it was possible to distinguish the influence of different factors. Li et al. used a statistical method to quantify the contribution of cooling and water supply to the yield benefits due to irrigation. They found that 16% of irrigation yield increase was due to irrigation cooling while the rest (84%) is due to water supply and other factors [36]. Besides, Zhao et al. also used a statistical method to quantifying the impacts of urbanization on vegetation growth. They found that the growth enhancement offset about 40% of direct loss of vegetation productivity caused by replacing productive vegetated surfaces with nonproductive impervious surfaces [16,30]. Based on the studies above, a statistical model was used to carry out this study.
Therefore, the objective of this study is to explore impacts of urbanization on SOS and exploratively distinguish contributions of local warming induced by the urban heat island effect (ΔLST) and other factors to the difference of spring phenology between urban and rural (ΔSOS). Hangzhou, a typical subtropical metropolis, was selected as the study area. Specifically, the spatial differences and inter-annual changes of the phenology in the urban and the rural were compared through a gradient analysis method using satellite-based phenology and LST data from 2006 to 2018. Then, the coupling relationship between phenology and temperature were investigated. After that, taking typical forest grid cells in the urban and the rural areas of Hangzhou as test samples, the local SOS was extracted using a remote sensing vegetation index from 2006 to 2018, and the difference of responses of SOS to LST between the urban and rural was explored. Finally, we exploratively distinguish quantitative contributions of the ΔLST and other factors to the ΔSOS.
2. Materials and Methods
2.1. Study Area
Hangzhou (118°21′–120°31′E, 29°11′–30°33′N) is the capital city of Zhejiang Province, whose GDP ranks among the top 10 in China, with 8.133 million in urban population, 2.227 million in rural population and an urbanization rate of 78.5% in 2019. It is located in the north of Zhejiang Province with a subtropical humid monsoon climate. As for temperature, it is lowest in January (average of 3–5 °C) and highest in July (average of 28–29 °C) with an annual average of 15.3–17 °C. The extreme maximum and minimum temperatures in Hangzhou reached 42.9 °C (31 July 1971) and −15 °C (5 January 1977). For precipitation, the annual average is 1100–1600 mm with rainy days of 130–160 days/year. There are two rainy seasons throughout the year. The first is the plum flood season from May to June, with an average rainfall of 350–500 mm, accounting for 25–31% of the year. The second rainy season is the typhoon rainy season from August to September, with an average rainfall of 120–220 mm, accounting for 8–13%. The forest coverage rate is over 64.77% (about 10,900 km2), dominated by evergreen broad-leaved forests and deciduous broad-leaved forests. In this study, the land cover map with 10 m-spatial resolution in 2017 from Gong Peng Research Group of Tsinghua University was aggregated to pixels of 500 m × 500 m to extract forest areas for the following analysis. To assure both a certain level of homogeneity in the land cover type and an adequate number of pixels for a meaningful analysis, only the pixels of 500 m where the forest type was over 75% were included in this study. Besides, the multi-temporal dataset of global urban boundaries of 2018 was used to divide the scope of the urban and the rural of Hangzhou Figure 1. This dataset is derived from the Global Artificial Impervious Area-GAIA, released by Gong Peng Research Group of Tsinghua University [37]. Then, 5 test areas of deciduous broad-leaved forest were selected in the urban and the rural (i.e., 10 km away from the urban area) of Hangzhou, respectively. In each test area, 2 sample points, a total of 20 sample points, were extracted (Figure 1). Besides, the Google map, latitude and longitude of the test areas in the urban and rural were showed in Table 1.
2.2. Remote Sensing Data
2.2.1. Land Surface Temperature
MODIS MYD11A2 LST product was used in this study, including the LST during the daytime and the nighttime, with a spatial resolution of 1000 m and a temporal resolution of 8 days. The LST of Aqua satellite is observed at 1:30 and 13:30 local solar time, the lowest and highest temperature of the day, which is more representative than that of Terra (monitored at 10:30 and 22:30) in the study of urban heat island. Therefore, the LST data of the Aqua satellite were used in this study [38,39]. The MODIS Reprojection Tool (MRT) was used to process the original images of LST, and so did the following data. Then, they were extracted in light of the study area and resampled to 500 m to be consistent with the phenology data. In addition, to explore the quantitative contributions of the ΔLST to the ΔSOS under urbanization, we collected 1000-m spatial resolution LST data of daytime and nighttime from 2006 to 2018 according to the coordinates of forest sample points.
2.2.2. MODIS Phenology
This paper tried to explore the difference of plant phenology between the urban and the rural of Hangzhou and its temporal and spatial patterns. The SOS from the MCD12Q2 (i.e., a MODIS phenology dataset) across the study area during 2006–2018 was used in this study. The spatial and time resolution of the dataset is 500 m and 1 year, respectively. The phenological events are derived from time series of MODIS 2-band Enhanced Vegetation Index (EVI2), which are fitted by QA/QC-weighted penalized cubic smoothing spline. The phenology data in some high-latitude regions and some semi-arid and arid environments exhibiting low-amplitude EVI2 variation, having uncertainty, while the data of Hangzhou in mid-latitude regions is relatively stable [40]. Besides, these data have been validated with field observations [41] and have been widely used and approved in previous studies [17,18,42].
2.2.3. Enhanced Vegetation Index
The contributions of the ΔLST to the ΔSOS were used to explore at a finer spatial resolution. Here, the Aqua MODIS 16-day EVI data (MYD13Q1, 250 m × 250 m), which matched the LST data from the same satellite (Aqua) to reduce uncertainties, was used to extract the phenology. Previous studies have suggested that EVI could accurately reflect the growth status of vegetation, and effectively extract phenology at both regional and local scales [43,44,45,46,47]. In this study, the asymmetric Gaussian function, which is widely used in curve fitting and phenological extraction, while a 20% threshold was used to fit the EVI curve and extract the SOS for each selected forest sample point from 2006 to 2018 [6,7].
Notably, both the MODIS phenology product and EVI-derived phenology were used in this study. On the one hand, to explore the changes in plant phenology caused by the urban heat island effect, we needed to focus on the forest, which is severely affected by urbanization. At this time, the plant phenology data with a resolution of 500 m cannot satisfy the demand, so the EVI data with a resolution of 250 m at a smaller scale was used to improve the resolution and reduce the influence of mixed pixels. On the other hand, MCD12Q2 uses EVI2 data to extract plant phenology, while EVI2 data lacks the blue band, different from EVI [48]. Therefore, the more widely used and robust EVI data was used for extracting more accurate plant phenology. Considering the reasons above, we selected EVI-based SOS for the research of sample-scale.
Besides, the SOS extracted from MCD12Q2 phenology data and EVI data showed a linear correlation (R2 = 0.54) at the forest sample area in Hangzhou Figure 2. First, the original data and methods to extract SOS were different. The one used the EVI data and the method of asymmetric Gaussian function with a 20% threshold, while the other used the EVI2 data and the method of QA/QC-weighted penalized cubic smoothing spline. Although the correlation of SOS derived from MCD12Q2 and EVI was not satisfied, the relationship was statistically significant (p < 0.05), which could support the consistency between them. Second, in this study, we aimed to explore the quantitative contributions of the difference of land surface temperature between urban and rural and other factors to the difference of spring phenology (ΔSOS) under urbanization. The relative ΔSOS was effective instead of the absolute value of SOS. Therefore, despite the difference in the absolute SOS of the two data, they had a statistically significant linear relationship and there was also a certain relationship between the ΔSOS. Besides, the RMSE of the two data was 5 days, which was smaller than the average ΔSOS of >9 days. In summary, the two data of SOS had a certain consistency in this study.
2.3. Temperature Contribution Separation Model
The rapid development of urbanization dramatically changes the environments which terrestrial ecosystem depended on. Compared with the rural surroundings, there are differences in temperature, photoperiod and atmosphere conditions, having a certain impact on plant phenology. A large number of studies have shown that the acceleration of urbanization in recent years produced substantial impacts on plant phenology over both urban areas and their rural surroundings [15,16,17,18,33]. Therefore, in order to distinguish the contributions of ΔLST and other factors between urban and rural to the difference of spring phenology (ΔSOS), we followed the statistical method of quantifying the contributions of cooling and water supply to the yield benefits due to irrigation of Li et al. [36], establishing a temperature contribution separation model based on the laboratory of the rural and urban of Hangzhou.
Firstly, we performed regression analysis on SOS and average LST during the daytime in spring (February, March, April) from 2006 to 2018 in the rural and the urban Equations (1) and (2), respectively. Secondly, Equations (3)–(5) were used to distinguish the contributions of the ΔLST and other factors to the ΔSOS:
where the subscripts of rural and urban denote the corresponding parameters of the rural and the urban, respectively; the SOS denotes the start of the growing season; the T denotes the average LST during the daytime in spring; the f denotes the regression relationship between LST and SOS. The and denote the contributions of the ΔLST and other factors to the ΔSOS, respectively; and the denotes the percentage of the contribution of the ΔLST.
The temperature contribution separation model was shown in Figure 3. (1) In the figure, the blue and red lines represent the regression relationships between SOS and LST in the rural and the urban Equations (1) and (2), respectively. Points A and D represent the average LST and SOS of the sample points in the same year of the rural and urban, respectively. Line B-D is the difference of the SOS between the rural and the urban. (2) We supposed that the rural surroundings were heated to reach the LST of the urban in the same year. Then, the SOS of the rural (point A) in that year moved to point C according to Equation (3). At this time, the two points A and C were the phenological state only in different LST, and line B-C was the phenological difference only when the LST rose Equation (3), which refers to the influence of the urban heat island effect (ΔLST). (3) However, in the same year, the average LST and SOS of the sample point in the urban was located at point D. There was a phenological difference C-D Equation (4) from point C, which refers to the influence of other environmental factors in the urban except temperature. (4) Furthermore, the percentage of the contribution of the ΔLST to the ΔSOS was calculated by Equation (5).
2.4. Statistical Analysis
In this study, the multi-year average phenology of the SOS of 2006–2018 were calculated to compare the differences of phenology between that in the urban and the rural of Hangzhou, which were extracted from the MCD12Q2 phenology dataset. Besides, a buffer analysis method was adopted to compare the difference of SOS in urban–rural gradient and its relationship with LST in more detail [7,28]. First, the urban boundary of Hangzhou in 2018 was derived from the global urban boundary dataset [12]. Second, the circular buffer zones outside the urban boundary were drawn every 2 km, which were 2, 4, 6, 8, 10, 12, 14, 16, 18 and 20 km, respectively. Finally, the average of SOS and LST in each buffer zone were calculated to explore the relationship between SOS and LST with the distance away from the urban.
Furthermore, the two-factor combination mapping is a very intuitive visualization method that can express the coupling relationship between two variables. The two factors that are incomparable numerically can be compared in a hierarchical manner, and the different levels of the two factors are matched in pairs to different combinations, representing the different coupling relationships of the two factors. In this study, to explore the coupling relationship between SOS and LST, the natural breakpoint classification method was used to divide the daily average LST and SOS in spring of 2018 into three levels: low, medium and high. Additionally, we used the two-factor combination mapping method to display the different coupling relationships, including low LST-low SOS, low LST-medium SOS, low LST-high SOS, medium LST-low SOS, medium LST-medium SOS, medium LST-high SOS, high LST-low SOS, high LST-medium SOS, and high LST-high SOS.
3. Results
3.1. Spatial Patterns of the LST and SOS in Hangzhou
The average LST in spring of 2018 was utilized to explore the difference of LST between that in the urban and the rural Figure 4. The results showed that there was a significant spatial heterogeneity in the LST of Hangzhou, showing a gradient of high in the urban and low in the rural. In terms of spatial distribution, the area with a LST greater than 23.5 °C accounted for 10.9%, mainly distributed in the urban area; 16.6%, 32.9% and 26.6% of the area with a LST of 21.5–23.5, 19.5–21.5 and 17.5–19.5 °C distributed in the middle area of Hangzhou, respectively. The area with a LST less than 17.5 °C (accounting for 13%) was mainly distributed in the northern and southern edges of Hangzhou. Moreover, as shown in the inset chart in Figure 4, the LST followed a generally decreasing urban–rural gradient, showing a significant urban heat island effect that the LST was highest (24 °C) in the urban and lowest (18.6 °C) in the rural. In the range of 0–6 km from the urban, the LST decreased fast (0.72 °C/km), and the decrease tended to slow down (0.08 °C/km) after 6 km.
As shown in Figure 5, the annual average SOS of Hangzhou from 2006 to 2018 showed a significant spatial heterogeneity. The SOS was earlier in the urban and later in the rural. In terms of spatial distribution, the area with the SOS less than 76 day of year (termed DOY) accounted for 8.9%, mainly distributed in the urban and the area within 2 km from the urban, located in the east and south of Hangzhou. About 23.1%, 31.1% and 26.6% of the area with SOS of 76–83, 83–88 and 88–94 DOY were distributed in the middle area of Hangzhou, respectively. The area with SOS more than 94 DOY (accounting for 10.3%) mainly distributed in the northern edges of Hangzhou, in the mountainous areas with higher elevations. Besides, as shown in the inset chart in Figure 5, the SOS followed a generally increasing urban–rural gradient, that is, from urban (79 DOY) to rural (87 DOY), the SOS was continuously delayed by 8 days. In the range of 0–6 km from the urban, the SOS increased fast (1.02 days/km), and the increase tended to slow down (0.14 days/km) after 6 km.
We further explored the spatial difference of SOS between that in the urban and the rural of Hangzhou from 2006 to 2018, and we found that the results from each year had little significant fluctuations. Therefore, in order to avoid information redundancy and excessively long images, we displayed the results every 4 years (2006, 2010, 2014 and 2018) Figure 6. The results showed that although the absolute value of SOS varied from year to year, the spatial differentiation of SOS yearly was consistent with the annual average SOS from 2006 to 2018 in Figure 5. They both showed a significant spatial heterogeneity that the SOS was smaller in the eastern and southern area of Hangzhou and larger in the northern marginal area. As shown in the inset chart in Figure 6, the SOS of the urban was 9, 9, 6 and 6 days earlier than the rural in 2006, 2010, 2014 and 2018, respectively. In addition, the SOS followed a generally increasing urban–rural gradient. In 2006, 2010, 2014 and 2018, the SOS increased fast (1.25, 1.05, 0.83 and 0.93 days/km, respectively) within the range of 0–6 km from the urban, while it tended to be stable (0.07, 0.21, 0.05 and 0.04 days/km, respectively) after 6 km.
Combined with the analysis of the average LST in spring of 2018 and SOS across Hangzhou above, the difference in LST and SOS presented an opposite state and change trend. That is, the LST tended to be higher in the urban and lower in the rural, while SOS tended to be earlier in the urban and later in the rural. The LST followed a generally decreasing urban–rural gradient, while the opposite occurred for SOS, but both the LST and SOS varied greatly within the range of 0–6 km and then tended to be stable. In summary, the LST and SOS showed a negative correlation, and the coupling relationship between them would be further explored below.
3.2. Relationship between LST and SOS in Hangzhou
The results above showed that the spatial distribution and urban–rural gradient of the average LST in spring and SOS showed an opposite trend. Therefore, it could be inferred that there was negative correlation between LST and SOS. Figure 7 shows the coupling relationship between LST and SOS, and the 94.6% of the area conformed to the inference above. The LST and SOS showed a significant negative correlation accounted for 53.9%, more than a half of the total area. Among them, the low LST-high SOS (accounting for 6.2%) mainly distributed in the northern edge of Hangzhou, the outer rural farthest from urban. The medium LST–medium SOS (45.3%) was mainly distributed in the middle part of Hangzhou, with a moderate distance from urban. The high LST–low SOS (2.4%) was mainly distributed in urban and within 2 km from urban. At the same time, there was 40.7% of the area that LST and SOS showed a weaker negative correlation, including low LST–medium SOS (10.9%), medium LST–low SOS (12.2%), medium LST–high SOS (10.1%), and high LST–medium SOS (7.5%), mainly distributed in the area between urban and outer rural. Besides, there was 5.4% of the area that exhibited a contrary relationship to the inference. That is, the LST and SOS showed a significantly positive correlations, which were low LST–low SOS (3.3%) and high LST–high SOS (2.1%). It might be related to the threshold of LST and SOS for the classification. In addition, in areas with low, moderate and high LST, 83%, 67% and 82% of the SOS has a medium-high, moderate and medium-low distribution, respectively. Overall, the results above confirmed the inference that spring LST was negatively correlated with SOS.
In order to further verify the inference above, the annual average SOS of 2006–2018 and its change trend at different levels of LST was calculated to explore the relationship between LST and SOS. As shown in Figure 8a, the annual average SOS at low, medium, and high LST were 88.9, 85.8, and 85.0 DOY, respectively. The SOS continently decreased with the increase of the LST. That is, the spring phenology continued to advance. As shown in Figure 8b, the change trend of SOS at low, medium, and high LST were −5.1, −3.9, and −2 days/10 years, respectively. The downward trend of SOS decreased with the increase of LST. That is, the rate of advancement of phenology continuously slowed down. In general, the inference established that there was a negative correlation between SOS and LST, and it developed in a consistent direction, showing a trend of convergence.
3.3. Relationship between LST and SOS at Sample Points
The relationship between LST and SOS at the sample point scale was further employed Figure 9. The LST in the urban of Hangzhou was significantly higher than that in the rural, exhibiting a significant urban heat island effect. In terms of the LST during the daytime in spring, the difference between that in the urban (23.0 ± 1.2 °C) and the rural (19.7 ± 1.0 °C) was significant, reaching 3.3 ± 1.0 °C. From 2006 to 2018, the difference continued to increase, with an average annual increase of 0.2 °C (p < 0.01). For the LST during the nighttime in spring, the difference between that in the urban (8.2 ± 1.0 °C) and the rural (7.0 ± 0.7 °C) reached 1.2 ± 0.3 °C. Compared with the daytime, the urban heat island effect was weaker at night, reduced by 2.1 °C. Integrating the temperature during the daytime and nighttime Figure 9c, the difference of the daily average temperature between that in the urban (15.6 ± 0.8 °C) and the rural (13.3 ± 0.8 °C) reached 2.3 ± 0.5 °C, and it continued to increase from 2006 to 2018 (Slope = 0.09 °C/years, p < 0.01). To further compare the difference of SOS between that in the urban and the rural Figure 9d, the SOS of urban (79.3 ± 5.6 DOY) was 7.4 ± 2.7 days earlier than that in the rural (86.7 ± 5.0 DOY). It indicated that the plant phenology changed significantly under different environmental backgrounds in the urban and the rural. Besides, it was worth noting that, except 2012 (1.5 days) and 2015 (12.9 days), the difference of SOS between that in the urban and the rural was relatively stable from 2006 to 2018, with a difference of 7.5 ± 1.6 days, and it was consistent with the difference of 6–9 days in Hangzhou Figure 6.
As shown in Figure 10, the LST during the daytime rather than nighttime showed a statistically significantly negative correlation with SOS both in the urban and the rural. In terms of the LST during the daytime Figure 10a, the sample points of LST–SOS in the urban and the rural distributed significantly separately, with LST of 19–28 °C and 16–23 °C, and SOS of 40–100 DOY and 50–110 DOY in the urban and the rural, respectively. Besides, the SOS in the rural was statistically significantly negatively correlated with the LST (Slope = −1.64 days/°C; p < 0.01). The correlation in urban had a degree of significance (Slope = −1.01 days/°C, p < 0.05), and the change trend of the SOS with LST increasing in the urban was smaller than that in the rural. For the LST during the nighttime Figure 10b, the sample points of LST-SOS in the rural and the urban had poor separation and high similarity. There was less statistically significant correlation between SOS and LST (p > 0.05), indicating that the LST during the nighttime had little effect on SOS. However, the fitted trends all showed that the SOS decreased with the increasing LST, which was consistent with the response of SOS to LST in Figure 8.
3.4. Relative Contributions of ΔLST to ΔSOS at Sample Points
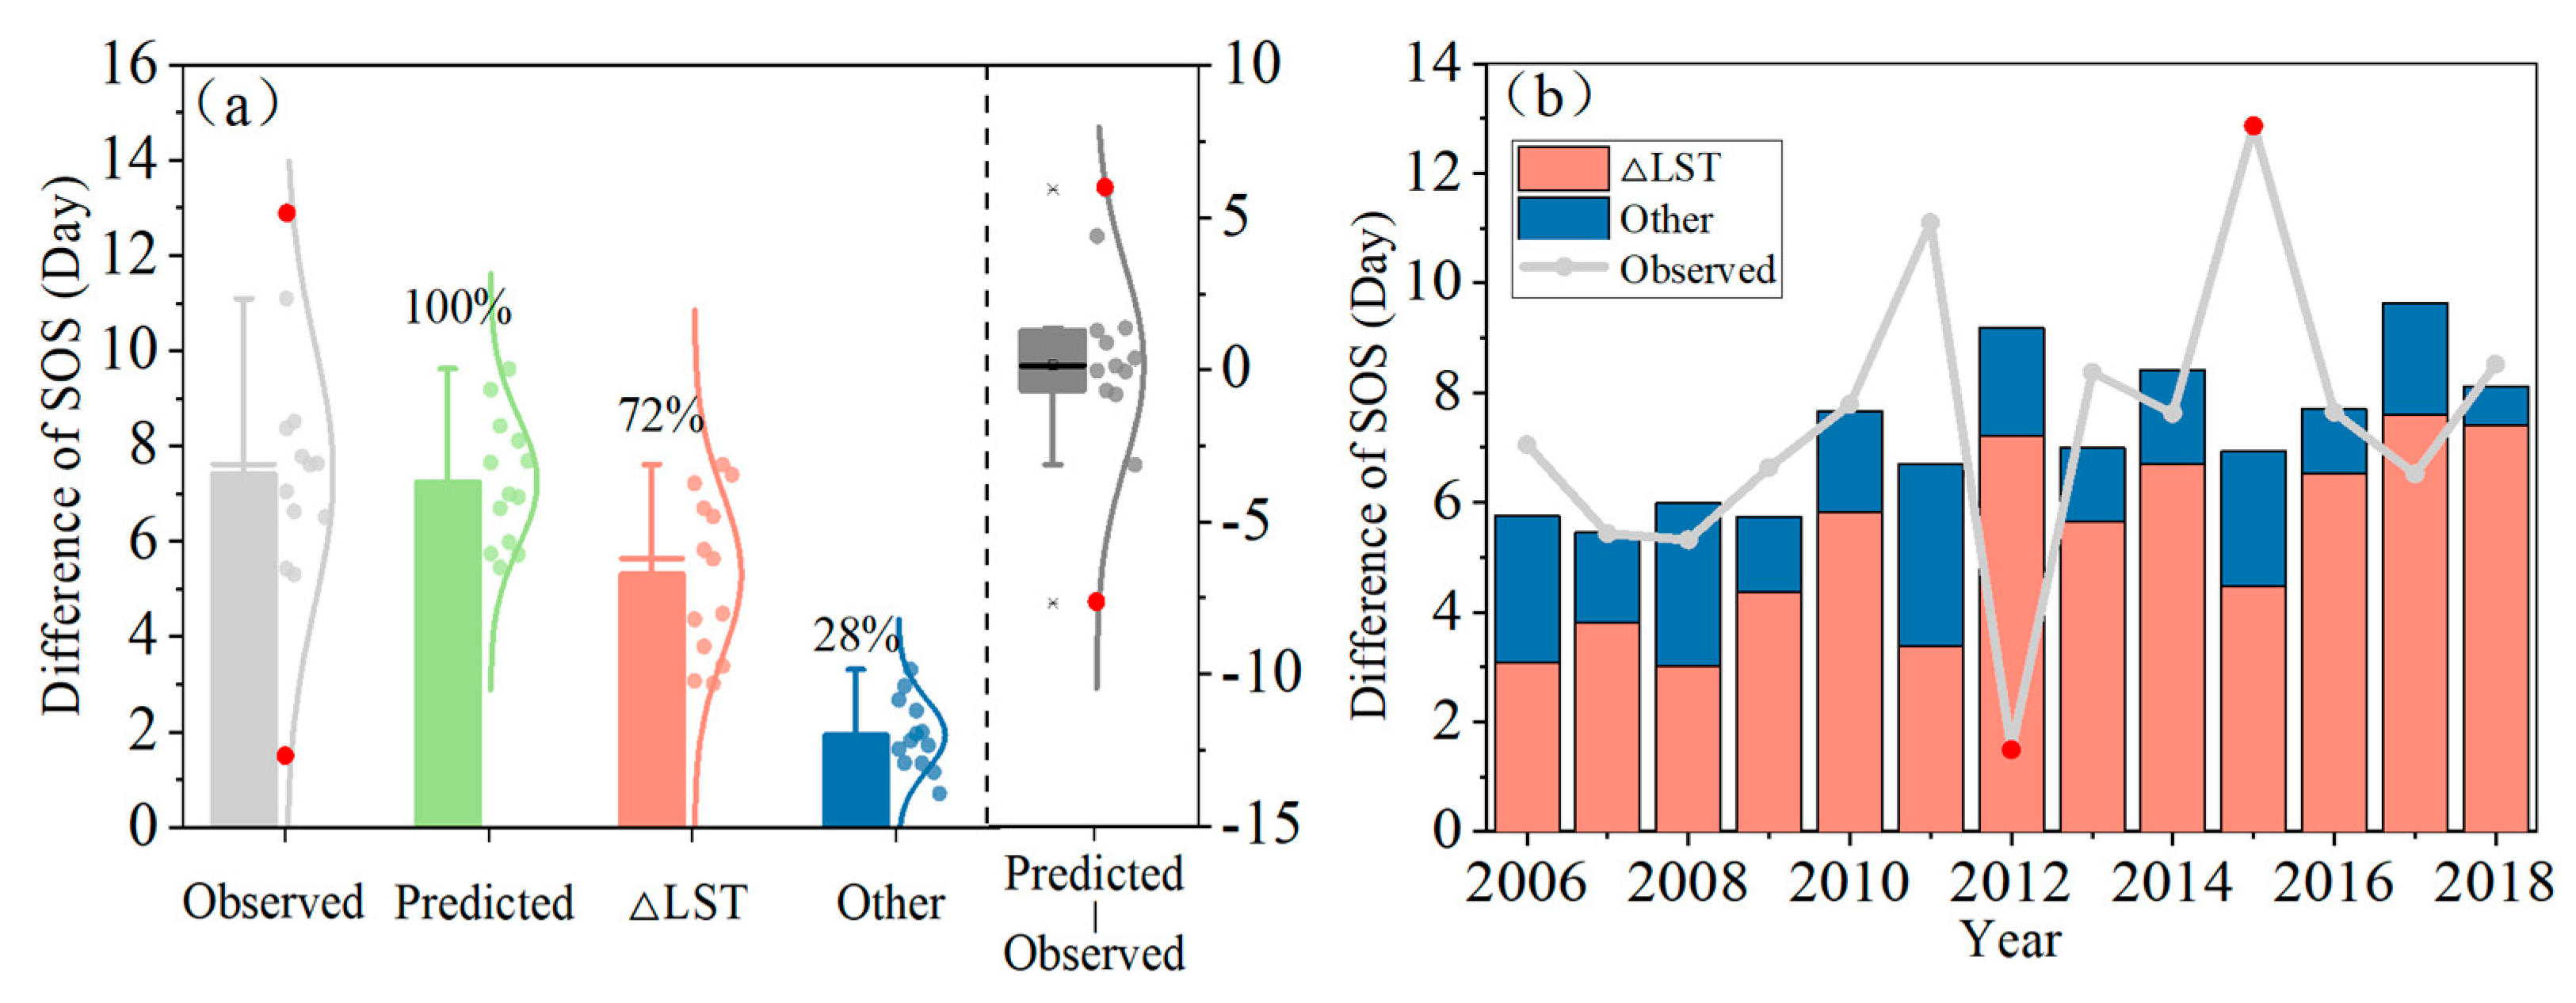
The temperature contribution separation model was utilized to explore the contributions of the ΔLST to the ΔSOS under urbanization. The difference of SOS under urbanization between predicted by the model (7.3 ± 1.3 days) and observed through data (7.4 ± 2.7 days) was −0.16 ± 1.4 days Figure 11a. For the results predicted by the model Figure 11b, the ΔLST played a significant role in the advance of SOS under urbanization and the proportion of its contributions was relatively stable, despite the interannual fluctuations. Besides, we found that the ΔSOS dominated by the ΔLST contributed 72 ± 13.3% (5.3 ± 1.7 of 7.3 ± 1.3 days) to the difference of SOS between that in the urban and the rural Figure 11a. The advance of 28 ± 13.3% (1.9 ± 0.7 days) of SOS under urbanization was dominated by other factors such as photoperiod and air pollution. Overall, the local warming effect induced by the urban heat island effect produced substantial impacts on plant phenology under urbanization, but the impact of other factors also cannot be ignored.
4. Discussion
Plant phenology is one of the key regulators of ecosystem processes, which is sensitive to environmental change. The acceleration of urbanization in recent years has produced substantial impacts on vegetation phenology over urban areas, such as the local warming induced by the urban heat island effect. This study explored impacts of urbanization on SOS and distinguished contributions of ΔLST and other factors to ΔSOS based on a temperature contribution separation model. We found that the SOS was negatively correlated with the daytime LST in spring, and the ΔSOS dominated by the ΔLST and other factors contributed 72% and 28% to the ΔSOS, respectively. Previous studies showed that there were lots of aspects besides temperature were different between urban and rural under urbanization, which had a certain impact on plant phenology. (1) The land cover changes under urbanization changed the soil properties extremely in the urban, affecting the relationship between plants, water and nutrients [49]. (2) There were high concentration of greenhouse gases (such as CO2) and major pollutants (such as NO, NO2, CO, SO2 and particulates with a diameter of 10μm or less) in the urban, resulting from the emissions produced by factories and automobiles [50]. In this regard, many studies showed that pollutants in the urban environment could cause the advance or delay of plant phenology [51,52,53]. (3) Due to the increasing artificial light caused by the human activities at night in the urban, the growth of plants was seriously influenced [54,55]. Therefore, there were various differences between the urban areas and their rural surroundings, not only in terms of temperature, but also in other aspects that affect plant phenology.
The LST in spring from February to April was selected to explore the relationship between LST and SOS in this study. Previous studies showed that meteorological parameters such as temperature and precipitation in a period of time before the phenological event were important determinants affecting the occurrence of phenology. The period of time is significant to the study of the relationship between phenology and climate [56,57], which called preseason duration. Polgar et al. found that the temperature in late winter and spring or preseason temperature played an important role in the occurrence of SOS [58]. Zhou et al. and Jia et al. found that the LST showed a statistically significant correlation with SOS (p < 0.05, R2 > 0.8) [7,15]. In addition, different temperature indicators were used to explore its effect on the SOS, such as daily maximum temperature and diurnal temperature difference. (1) Piao et al. showed that the SOS was more sensitive to the preseason daily maximum temperature in the northern hemisphere, and 68% of the European Union and 83% of the United States had a preseason duration of 0–3 months [59]. (2) The results of Huang et al. showed that 77.2% of the northern hemisphere, the SOS had the strongest correlation with the average diurnal temperature difference in the preseason period of 1–3 months [60]. In general, the results above indicated that the temperature in spring was relevant to SOS with the preseason duration of 0–3 months.
At the same time, there were some limitations in this study. (1) As shown in Figure 10, the LST during the daytime showed a statistically significantly negative correlation with SOS both in the urban (p < 0.05) and the rural (p < 0.01), while the R2 was low. The low R2 might be related to the impurity of the data where existed many mixed pixels in the urban sample. To explore the changes in plant phenology caused by the urban heat island effect, we needed to focus on forest where is severely affected by urbanization. However, the MODIS EVI data with a resolution of 250 m was the data with long time series, the highest resolution and we could currently obtain. Therefore, the problem of mixed pixels inevitably existed in the urban, which affected the correlation between SOS and LST. Although the R2 was relatively low, they were both statistically significant (p < 0.05), which was meaningful in a certain degree. In the future, data with higher resolutions should be used to reduce the uncertainty caused by the data and make results more reliable. (2) In this study, all types of forest in Hangzhou were used to explore the impact of urbanization on plant phenology. Previous studies found that the phenology and the response to urbanization varied in the different types of vegetation. However, due to the limitation of the accuracy of data, we could only exclude shrub, farmland and grassland. Relatively uniform and stable forests were extracted as the study object to weaken the impact of different vegetation types to a certain extent. Reliably, previous studies utilized all vegetation types for the study and got reliable results, having a certain significance [7,33]. In future research, we hope to more finely distinguish the vegetation types and improve the accuracy of the study, in order to obtain more reliable results. (3) As mentioned above, there were lots of aspects besides temperature that were different between urban and rural under urbanization, which had a certain impact on plant phenology. Although other factors were taken into consideration in this study, no specific data analysis was carried out on other factors such as greenhouse gases. In future studies, a more quantitative and detailed discussion on the effects of other factors on vegetation phenology should be advanced. With the development of high-quality data and online data processing platforms (e.g., Google Earth Engine), it is feasible to apply the methodology of our present work to other study areas even to a global scale.
5. Conclusions
Focused on Hangzhou, a typical subtropical metropolis, to investigate the impact of urbanization on plant phenology. Vegetation index-based phenology data and land surface temperature data were adopted to analyze the urban–rural gradient in phenology characteristics and the contributions of ΔLST to the ΔSOS under urbanization. We found that there was a negative coupling between SOS and LST in over 90% of the vegetated areas in Hangzhou. At the sample-point scale, SOS was weakly, but significantly, negatively correlated with LST at the daytime (R2 = 0.2 and p < 0.01 in rural; R2 = 0.14 and p < 0.05 in urban) rather than that at nighttime. Besides, the ΔSOS dominated by the ΔLST contributed more than 70% of the total ΔSOS. We consider that the achievements of this study will provide quantitative evidence for the impact of urbanization on the plant phenology, and help to deepen the understanding of urban ecosystem adaptation under intensive human activities.
Author Contributions
Conceptualization, J.J.; data curation, Y.J.; formal analysis, Y.J.; investigation, Y.J.; methodology, Y.J. and J.J.; project administration, J.J.; resources, J.J.; supervision, J.J.; validation, Y.J.; visualization, Y.J.; writing—original draft, Y.J.; writing—review and editing, J.J., W.Z., F.G. and T.Y. All authors have read and agreed to the published version of the manuscript.
Funding
This research was supported in part by National Natural Science Foundation of China (grant No. 41971374), Fundamental Research Funds for the Central Universities (grant No. B200202016) and Jiangsu Provincial Natural Science Foundation (grant No. BK20180009).
Institutional Review Board Statement
Not applicable.
Informed Consent Statement
Not applicable.
Data Availability Statement
The study did not report any data.
Acknowledgments
We are grateful to NASA’s Land Processes Distributed Active Archive Center (LP DAAC) and Gong Peng Research Group of Tsinghua University for providing the MODIS products and the multi-temporal dataset Global Urban Boundary, respectively. Additionally, we express our gratitude to anonymous reviewers and editors for their professional comments and suggestions.
Conflicts of Interest
The authors declare no conflict of interest.
References
- Badeck, F.W.; Bondeau, A.; Bottcher, K.; Doktor, D.; Lucht, W.; Schaber, J.; Sitch, S. Responses of spring phenology to climate change. New Phytol. 2004, 162, 295–309. [Google Scholar] [CrossRef]
- Chen, X.; Wang, D.; Chen, J.; Wang, C.; Shen, M. The mixed pixel effect in land surface phenology: A simulation study. Remote Sens. Environ. 2018, 211, 338–344. [Google Scholar] [CrossRef]
- White, M.A.; de Beurs, K.M.; Didan, K.; Inouye, D.W.; Richardson, A.D.; Jensen, O.P.; O’Keefe, J.; Zhang, G.; Nemani, R.R.; van Leeuwen, W.J.D.; et al. Intercomparison, interpretation, and assessment of spring phenology in North America estimated from remote sensing for 1982–2006. Glob. Chang. Biol. 2009, 15, 2335–2359. [Google Scholar] [CrossRef]
- Linderholm, H.W. Growing season changes in the last century. Agric. For. Meteorol. 2006, 137, 1–14. [Google Scholar] [CrossRef]
- Menzel, A. Phenology: Its importance to the global change community. Clim. Chang. 2002, 54, 379–385. [Google Scholar] [CrossRef]
- Richardson, A.D.; Black, T.A.; Ciais, P.; Delbart, N.; Friedl, M.A.; Gobron, N.; Hollinger, D.Y.; Carriage, W.L.; Longdoz, B.; Luyssaert, S.; et al. Influence of spring and autumn phenological transitions on forest ecosystem productivity. Philos. Trans. R. Soc. B-Biol. Sci. 2010, 365, 3227–3246. [Google Scholar] [CrossRef] [Green Version]
- Zhou, D.; Zhao, S.; Zhang, L.; Liu, S. Remotely sensed assessment of urbanization effects on vegetation phenology in China’s 32 major cities. Remote Sens. Environ. 2016, 176, 272–281. [Google Scholar] [CrossRef] [Green Version]
- Wang, L.; Chen, H.; Li, Q.; Yu, W. Research advances in plant phenology and climate. Acta Ecol. Sin. 2010, 30, 447–454. [Google Scholar]
- Richardson, A.D.; Keenan, T.F.; Migliavacca, M.; Ryu, Y.; Sunny Day, O.; Toomey, M. Climate change, phenology, and phenological control of vegetation feedbacks to the climate system. Agric. For. Meteorol. 2013, 169, 156–173. [Google Scholar] [CrossRef]
- Cong, N.; Piao, S.; Chen, A.; Wang, X.; Lin, X.; Chen, S.; He, S.; Zhou, G.; Zhang, X. Spring vegetation green-up date in China inferred from SPOT NDVI data: A multiple model analysis. Agric. For. Meteorol. 2012, 165, 104–113. [Google Scholar] [CrossRef]
- Aono, Y.; Kazui, K. Phenological data series of cherry tree flowering in Kyoto, Japan, and its application to reconstruction of springtime temperatures since the 9th century. Int. J. Climatol. 2008, 28, 905–914. [Google Scholar] [CrossRef] [Green Version]
- Delbart, N.; Picard, G.; le Toan, T.; Kergoat, L.; Quegan, S.; Woodward, I.; Dye, D.; Fedotova, V. Spring phenology in boreal Eurasia over a nearly century time scale. Glob. Chang. Biol. 2008, 14, 603–614. [Google Scholar] [CrossRef]
- Keenan, T.F.; Gray, J.; Friedl, M.A.; Toomey, M.; Bohrer, G.; Hollinger, D.Y.; Munger, J.W.; O’Keefe, J.; Schmid, H.P.; SueWing, I. Net carbon uptake has increased through warming-induced changes in temperate forest phenology. Nat. Clim. Chang. 2014, 4, 598–604. [Google Scholar] [CrossRef]
- Zeng, H.; Jia, G.; Epstein, H. Recent changes in phenology over the northern high latitudes detected from multi-satellite data. Environ. Res. Lett. 2011, 6, 045508. [Google Scholar] [CrossRef] [Green Version]
- Jia, W.; Zhao, S.; Zhang, X.; Liu, S.; Henebry, G.M.; Liu, L. Urbanization imprint on land surface phenology: The urban–rural gradient analysis for Chinese cities. Glob. Chang. Biol. 2011, 27, 2895–2904. [Google Scholar] [CrossRef]
- Jia, W.; Zhao, S.; Liu, S. Vegetation growth enhancement in urban environments of the Conterminous United States. Glob. Chang. Biol. 2018, 24, 4084–4094. [Google Scholar] [CrossRef]
- Li, X.; Zhou, Y.; Asrar, G.R.; Mao, J.; Li, X.; Li, W. Response of vegetation phenology to urbanization in the conterminous United States. Glob. Chang. Biol. 2017, 23, 2818–2830. [Google Scholar] [CrossRef]
- Ren, Q.; He, C.; Huang, Q.; Zhou, Y. Urbanization impacts on vegetation phenology in China. Remote Sens. 2018, 10, 1905. [Google Scholar] [CrossRef] [Green Version]
- Li, D.; Stucky, B.J.; Deck, J.; Kiss, B.; Guralnick, R.P. The effect of urbanization on plant phenology depends on regional temperature. Nat. Ecol. Evol. 2019, 3, 1661–1667. [Google Scholar] [CrossRef]
- Arnfield, A.J. Two decades of urban climate research: A review of turbulence, exchanges of energy and water, and the urban heat island. Int. J. Climatol. 2003, 23, 1–26. [Google Scholar] [CrossRef]
- Clinton, N.; Gong, P. MODIS detected surface urban heat islands and sinks: Global locations and controls. Remote Sens. Environ. 2013, 134, 294–304. [Google Scholar] [CrossRef]
- Oke, T.R. The energetic basis of the urban heat island. Q. J. R. Meteorol. Soc. 1982, 108, 1–24. [Google Scholar] [CrossRef]
- He, C.; Shi, P.; Chen, J.; Xu, X. Process and mechanism of urbanization in Beijing area. Acta Geogr. Sin. 2002, 57, 363–371. [Google Scholar] [CrossRef]
- Wang, S.; Ju, W.; Penuelas, J.; Cescatti, A.; Zhou, Y.; Fu, Y.; Huete, A.; Liu, M.; Zhang, Y. Urban-rural gradients reveal joint control of elevated CO2 and temperature on extended photosynthetic seasons. Nat. Ecol. Evol. 2019, 3, 1076–1085. [Google Scholar] [CrossRef] [PubMed] [Green Version]
- Franklin, K.A.; Whitelam, G.C. Light signals, phytochromes and cross-talk with other environmental cues. J. Exp. Bot. 2004, 55, 271–276. [Google Scholar] [CrossRef]
- Mimet, A.; Pellissier, V.; Quenol, H.; Aguejdad, R.; Dubreuil, V.; Rink, F. Urbanization induces early flowering: Evidence from Platanus acerifolia and Prunus cerasus. Int. J. Biometeorol. 2009, 53, 287–298. [Google Scholar] [CrossRef]
- Jeong, S.J.; Park, H.; Ho, C.H.; Kim, J. Impact of urbanization on spring and autumn phenology of deciduous trees in the Seoul Capital Area, South Korea. Int. J. Biometeorol. 2019, 63, 627–637. [Google Scholar] [CrossRef]
- Ding, H.; Xu, L.; Elmore, A.J.; Shi, Y. Vegetation phenology influenced by rapid urbanization of The Yangtze Delta region. Remote Sens. 2020, 12, 1783. [Google Scholar] [CrossRef]
- Tian, J.; Zhu, X.; Wu, J.; Shen, M.; Chen, J. Coarse-resolution satellite images overestimate urbanization effects on vegetation spring phenology. Remote Sens. 2020, 12, 117. [Google Scholar] [CrossRef] [Green Version]
- Zhao, S.; Liu, S.; Zhou, D. Prevalent vegetation growth enhancement in urban environment. Proc. Natl. Acad. Sci. USA 2016, 113, 6313–6318. [Google Scholar] [CrossRef] [Green Version]
- Landsberg, H.E. Atmospheric changes in a growing community (the Columbia, Maryland Experience). Urban Ecol. 1979, 4, 53–81. [Google Scholar] [CrossRef]
- Petterson, J.T.; Stoffel, T.L. Analysis of urban-rural radiation data from St. Louis Missouri. J. Appl. Meteorol. 1980, 19, 275–283. [Google Scholar] [CrossRef] [Green Version]
- Meng, L.; Mao, J.; Zhou, Y.; Richardson, A.D.; Lee, X.H.; Thornton, P.E.; Ricciuto, D.M.; Li, X.; Dai, Y.; Shi, X.; et al. Urban warming advances spring phenology but reduces the response of phenology to temperature in the conterminous United States. Proc. Natl. Acad. Sci. USA 2020, 117, 4228–4233. [Google Scholar] [CrossRef]
- Wohlfahrt, G.; Tomelleri, E.; Hammerle, A. The urban imprint on plant phenology. Nat. Ecol. Evol. 2019, 3, 1669–1674. [Google Scholar] [CrossRef]
- Hu, Z.; Dai, H.; Hou, F.; Li, D. Spatio-temporal change of urban-rural vegetation phenology and its response to land surface temperature in Northeast China. Acta Ecol. Sin. 2020, 40, 4137–4145. [Google Scholar] [CrossRef]
- Li, Y.; Guan, K.; Peng, B.; Franz, T.E.; Wardlow, B.; Pan, M. Quantifying irrigation cooling benefits to maize yield in the US Midwest. Glob. Chang. Biol. 2019, 26, 3065–3078. [Google Scholar] [CrossRef] [PubMed]
- Li, X.; Gong, P.; Zhou, Y.; Wang, J.; Bai, Y.; Chen, B.; Hu, T.; Xiao, Y.; Xu, B.; Yang, J.; et al. Mapping global urban boundaries from the global artificial impervious area (GAIA) data. Environ. Res. Lett. 2020, 15, 094044. [Google Scholar] [CrossRef]
- Zhou, D.; Zhao, S.; Liu, S.; Zhang, L.; Zhu, C. Surface urban heat island in China’s 32 major cities: Spatial patterns and drivers. Remote Sens. Environ. 2014, 152, 51–61. [Google Scholar] [CrossRef]
- Peng, S.; Piao, S.; Ciais, P.; Friedlingstein, P.; Ottle, C.; Bréon, F.M.; Nan, H.; Zhou, L.; Myneni, R.B. Surface urban heat island across 419 global big cities. Environ. Sci. Technol. 2012, 46, 696–703. [Google Scholar] [CrossRef]
- Ganguly, S.; Friedl, M.A.; Tan, B.; Zhang, X.; Verma, M. Land surface phenology from MODIS: Characterization of the Collection 5 global land cover dynamics product. Remote Sens. Environ. 2010, 114, 1805–1816. [Google Scholar] [CrossRef] [Green Version]
- Zhang, X.; Friedl, M.A.; Schaaf, C.B. Global vegetation phenology from Moderate Resolution Imaging Spectroradiometer (MODIS): Evaluation of global patterns and comparison with in situ measurements. J. Geophys. Res. Biogeosci. 2006, 111, G04017. [Google Scholar] [CrossRef]
- Zhang, X.; Friedl, M.A.; Schaaf, C.B.; Strahler, A.H.; Schneider, A. The footprint of urban climates on vegetation phenology. Geophys. Res. Lett. 2004, 31, L12209. [Google Scholar] [CrossRef]
- Huete, A.; Didan, K.; Miura, T.; Rodriguez, E.P.; Gao, X.; Ferreira, L.G. Overview of the radiometric and biophysical performance of the MODIS vegetation indices. Remote Sens. Environ. 2002, 83, 195–213. [Google Scholar] [CrossRef]
- Dallimer, M.; Tang, Z.; Bibby, P.R.; Brindley, P.; Gaston, K.J.; Davies, Z.G. Temporal changes in greenspace in a highly urbanized region. Biol. Lett. 2011, 7, 763–766. [Google Scholar] [CrossRef]
- Zhou, D.; Zhao, S.; Liu, S.; Zhang, L. Spatiotemporal trends of terrestrial vegetation activity along the urban development intensity gradient in China’s 32 major cities. Sci. Total Environ. 2014, 488, 136–145. [Google Scholar] [CrossRef] [PubMed]
- Brown, M.E.; de Beurs, K.M.; Vrieling, A. The response of African land surface phenology to large scale climate oscillations. Remote Sens. Environ. 2010, 114, 2286–2296. [Google Scholar] [CrossRef] [Green Version]
- Buyantuyev, A.; Wu, J. Urbanization diversifies land surface phenology in arid environments: Interactions among vegetation, climatic variation, and land use pattern in the Phoenix metropolitan region, USA. Landsc. Urban Plan. 2012, 105, 149–159. [Google Scholar] [CrossRef]
- Zhang, J.; Tong, X.; Zhang, J.; Meng, P.; Li, J.; Liu, P. Dynamics of phenology and its response to climatic variables in a warm-temperate mixed plantation. For. Ecol. Manag. 2021, 483, 118785. [Google Scholar] [CrossRef]
- Herrmann, D.L.; Schifman, L.A.; Shuster, W.D. Widespread loss of intermediate soil horizons in urban landscapes. Proc. Natl. Acad. Sci. USA 2018, 115, 6751–6755. [Google Scholar] [CrossRef] [PubMed] [Green Version]
- Grange, S.K.; Lewis, A.C.; Moller, S.J.; Carslaw, D.C. Lower vehicular primary emissions of NO2 in Europe than assumed in policy projections. Nat. Geosci. 2017, 10, 914–918. [Google Scholar] [CrossRef]
- Jochner, S.; Markevych, I.; Beck, I.; Traidl-Hoffmann, C.; Heinrich, J.; Menzel, A. The effects of short- and long-term air pollutants on plant phenology and leaf characteristics. Environ. Pollut. 2015, 206, 382–389. [Google Scholar] [CrossRef]
- Honour, S.L.; Bell, J.N.; Ashenden, T.W.; Cape, J.N.; Power, S.A. Responses of herbaceous plants to urban air pollution: Effects on growth, phenology and leaf surface characteristics. Environ. Pollut. 2009, 157, 1279–1286. [Google Scholar] [CrossRef] [Green Version]
- Sanz, J.; Bermejo, V.; Muntifering, R.; Gonzalez-Fernandez, I.; Gimeno, B.S.; Elvira, S.; Alonso, R. Plant phenology, growth and nutritive quality of Briza maxima: Responses induced by enhanced ozone atmospheric levels and nitrogen enrichment. Environ. Pollut. 2011, 159, 423–430. [Google Scholar] [CrossRef]
- Skvareninova, J.; Tuharska, M.; Skvarenina, J.; Babalova, D.; Slobodnikova, L.; Slobodnik, B.; Stredova, H.; Mindas, J. Effects of light pollution on tree phenology in the urban environment. Morav. Geogr. Rep. 2017, 25, 282–290. [Google Scholar] [CrossRef] [Green Version]
- Massetti, L. Assessing the impact of street lighting on Platanus x acerifolia phenology. Urban For. Urban Green. 2018, 34, 71–77. [Google Scholar] [CrossRef]
- Matsumoto, K.; Ohta, T.; Irasawa, M.; Nakamura, T. Climate change and extension of the Ginkgo biloba L. growing season in Japan. Glob. Chang. Biol. 2003, 9, 1634–1642. [Google Scholar] [CrossRef]
- Dai, J.; Wang, H.; Ge, Q. Multiple phenological responses to climate change among 42 plant species in Xi’an, China. Int. J. Biometeorol. 2013, 57, 749–758. [Google Scholar] [CrossRef] [PubMed]
- Polgar, C.; Gallinat, A.; Primack, R.B. Drivers of leaf-out phenology and their implications for species invasions: Insights from Thoreau’s Concord. New Phytol. 2014, 202, 106–115. [Google Scholar] [CrossRef] [PubMed]
- Piao, S.; Tan, J.; Chen, A.; Pennuelas, J.; Ciais, P.; Liu, Q.; Janssens, I.A.; Vicca, S.; Zeng, Z.; Jeong, S.J.; et al. Leaf onset in the northern hemisphere triggered by daytime temperature. Nat. Commun. 2015, 6, 6911. [Google Scholar] [CrossRef] [PubMed] [Green Version]
- Huang, Y.; Jiang, N.; Shen, M.; Guo, L. Effect of preseason diurnal temperature range on the start of vegetation growing season in the Northern Hemisphere. Ecol. Indic. 2020, 112, 106161. [Google Scholar] [CrossRef]
Figure 1.
Spatial distribution of Hangzhou and the location of forest test areas. The small maps in the upper right corner show the location of Hangzhou in Zhejiang Province and the location of Zhejiang Province in China.
Figure 1.
Spatial distribution of Hangzhou and the location of forest test areas. The small maps in the upper right corner show the location of Hangzhou in Zhejiang Province and the location of Zhejiang Province in China.
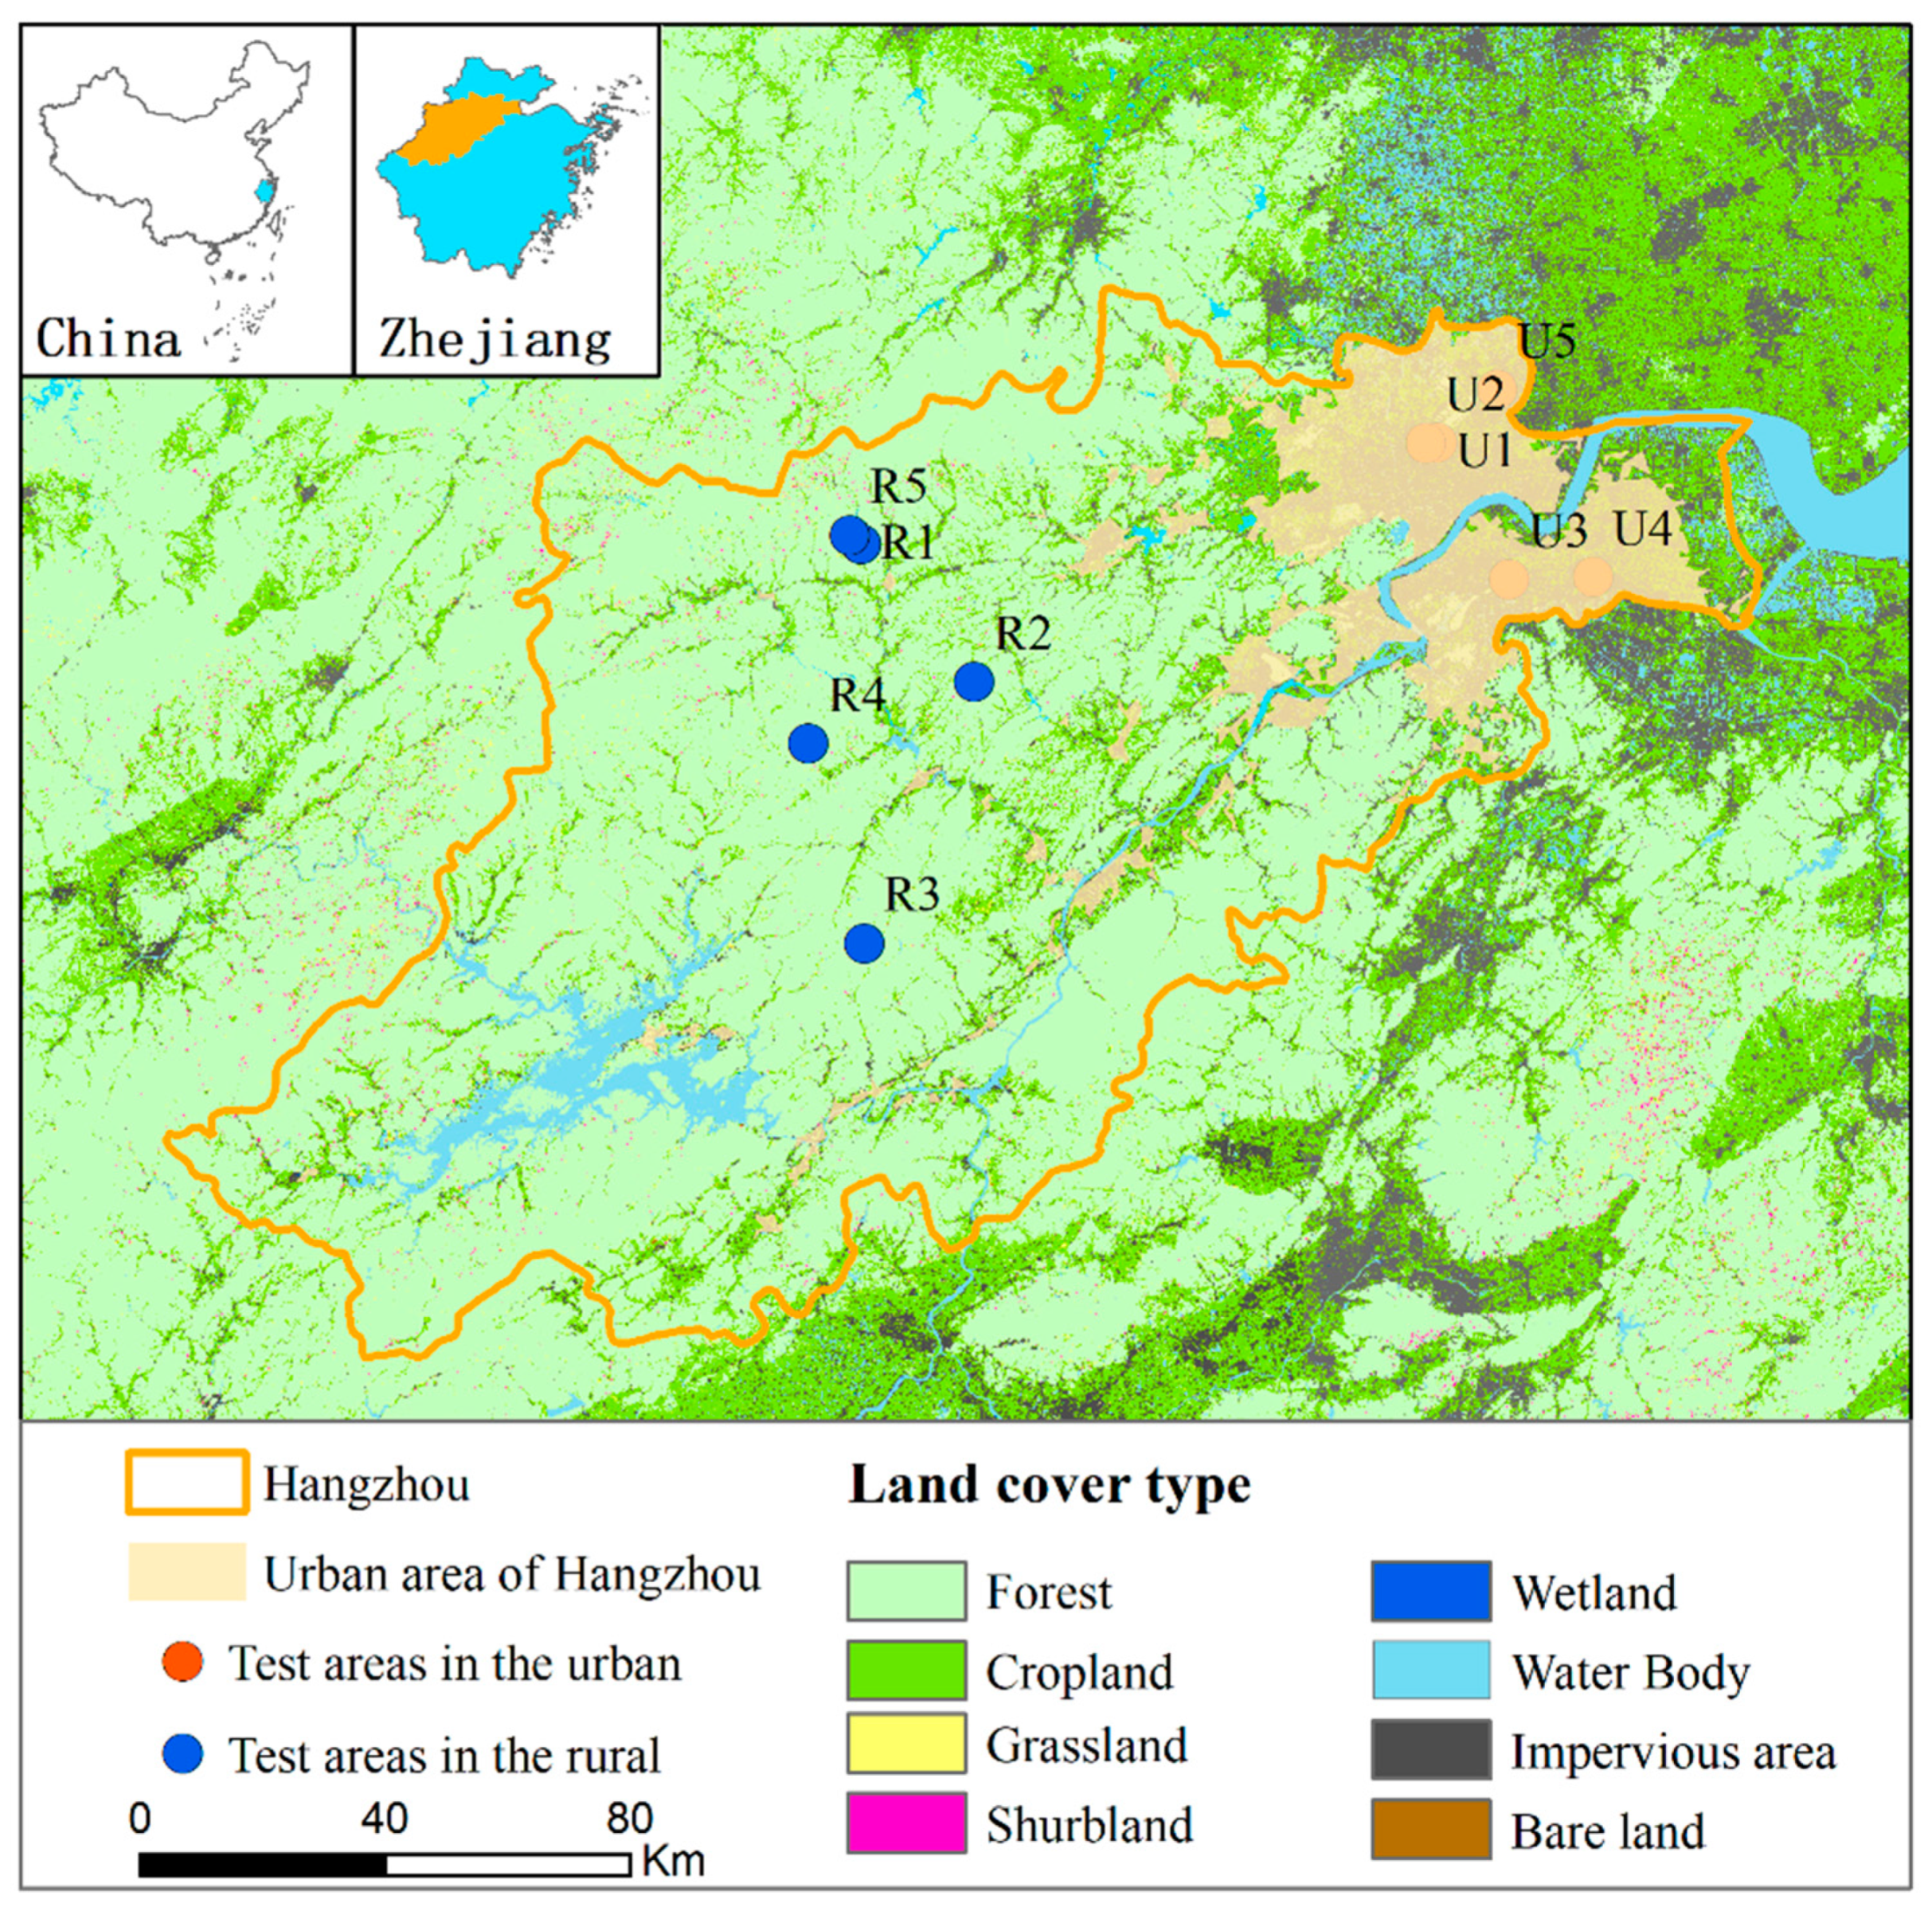
Figure 2.
Correlation of SOS between MCD12Q2 and EVI. Black line denotes linear regression lines. The DOY denotes the day of year.
Figure 2.
Correlation of SOS between MCD12Q2 and EVI. Black line denotes linear regression lines. The DOY denotes the day of year.
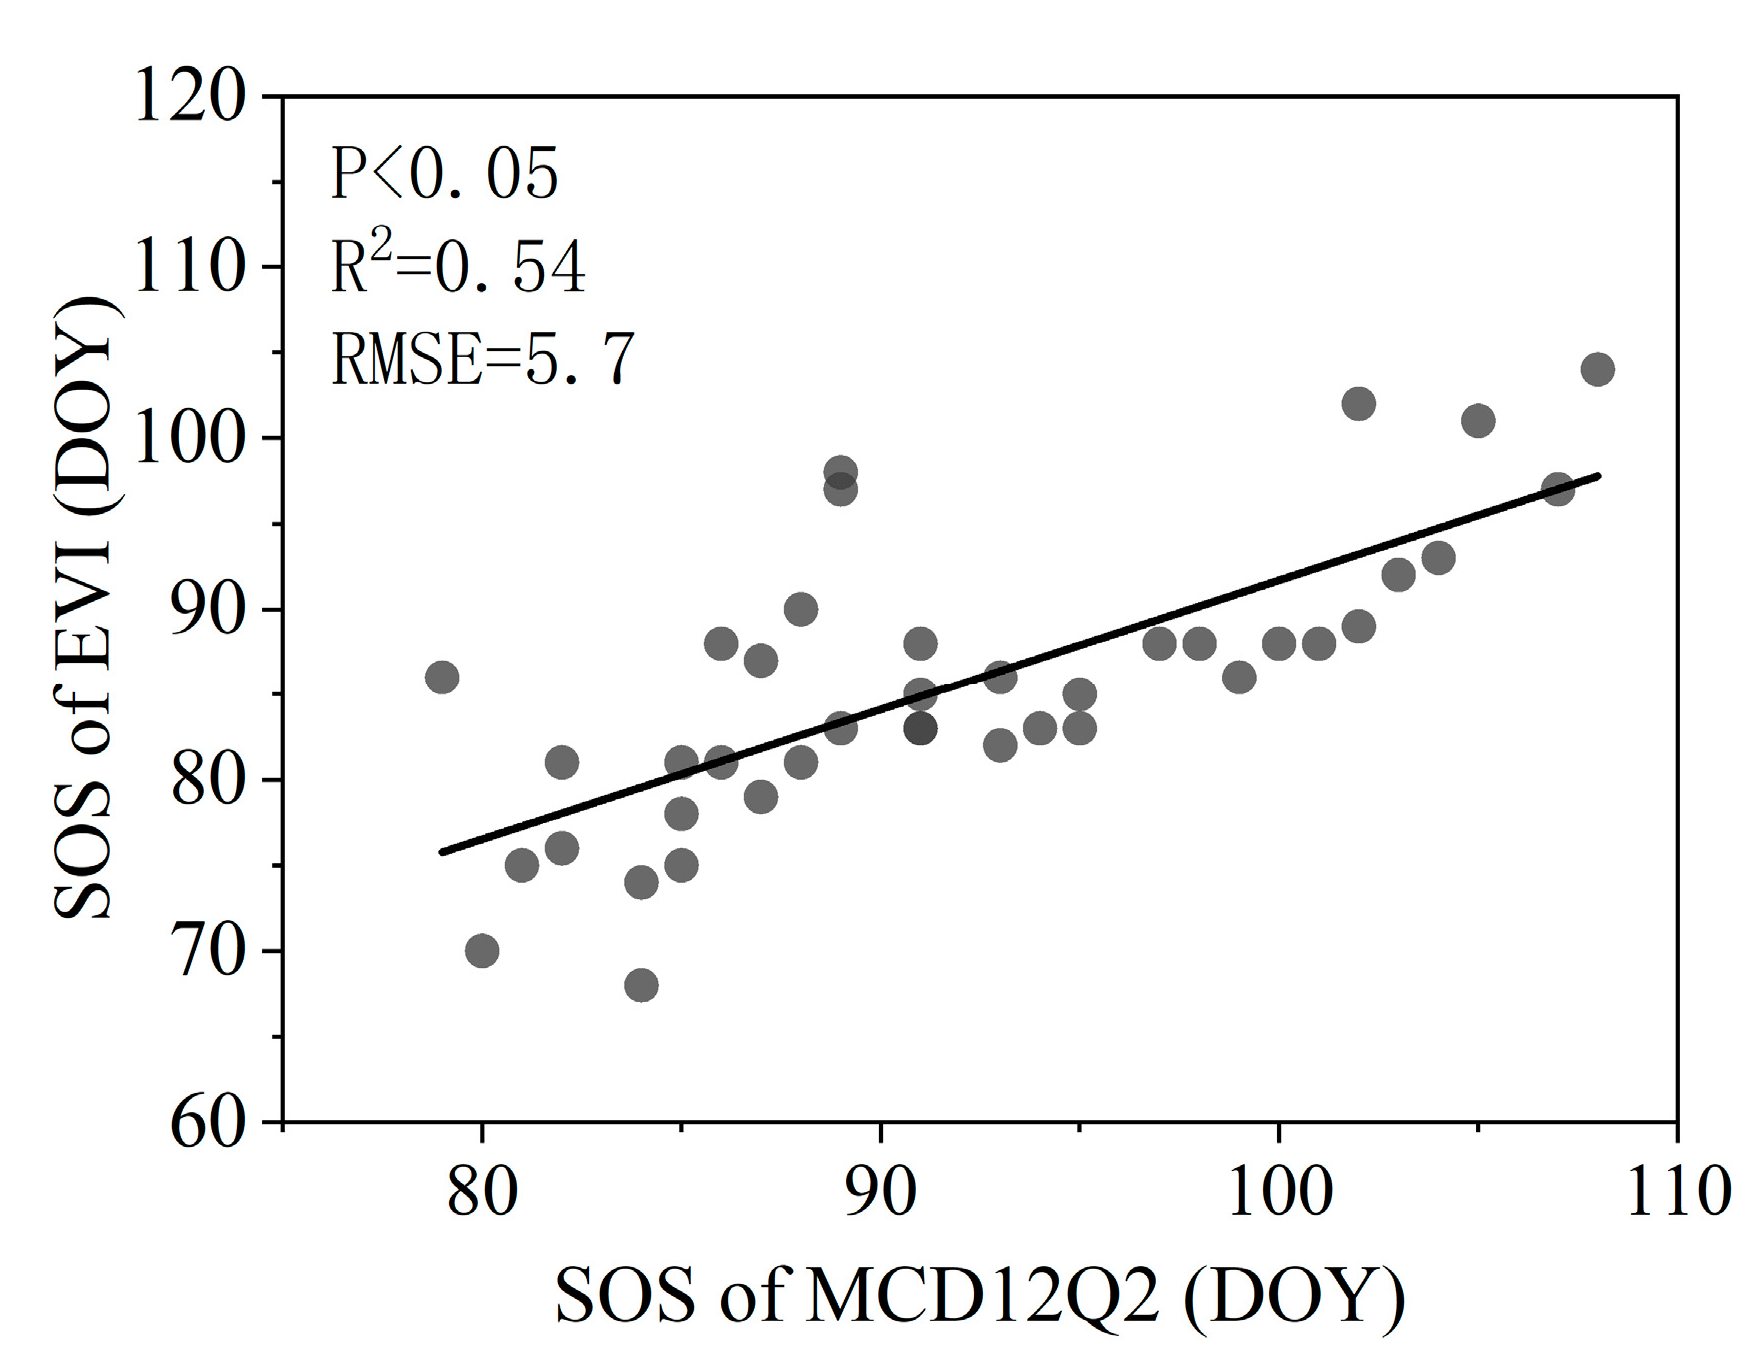
Figure 3.
Temperature contribution separation model. The red/blue solid lines denote the linear regression line of the urban/rural sample point data. Points A and D denote the data of sample points in the rural and the urban in the same year, points B and C denote the predicted values of the model, and gray dotted lines denote the contributions of different factors. The DOY denotes the day of year.
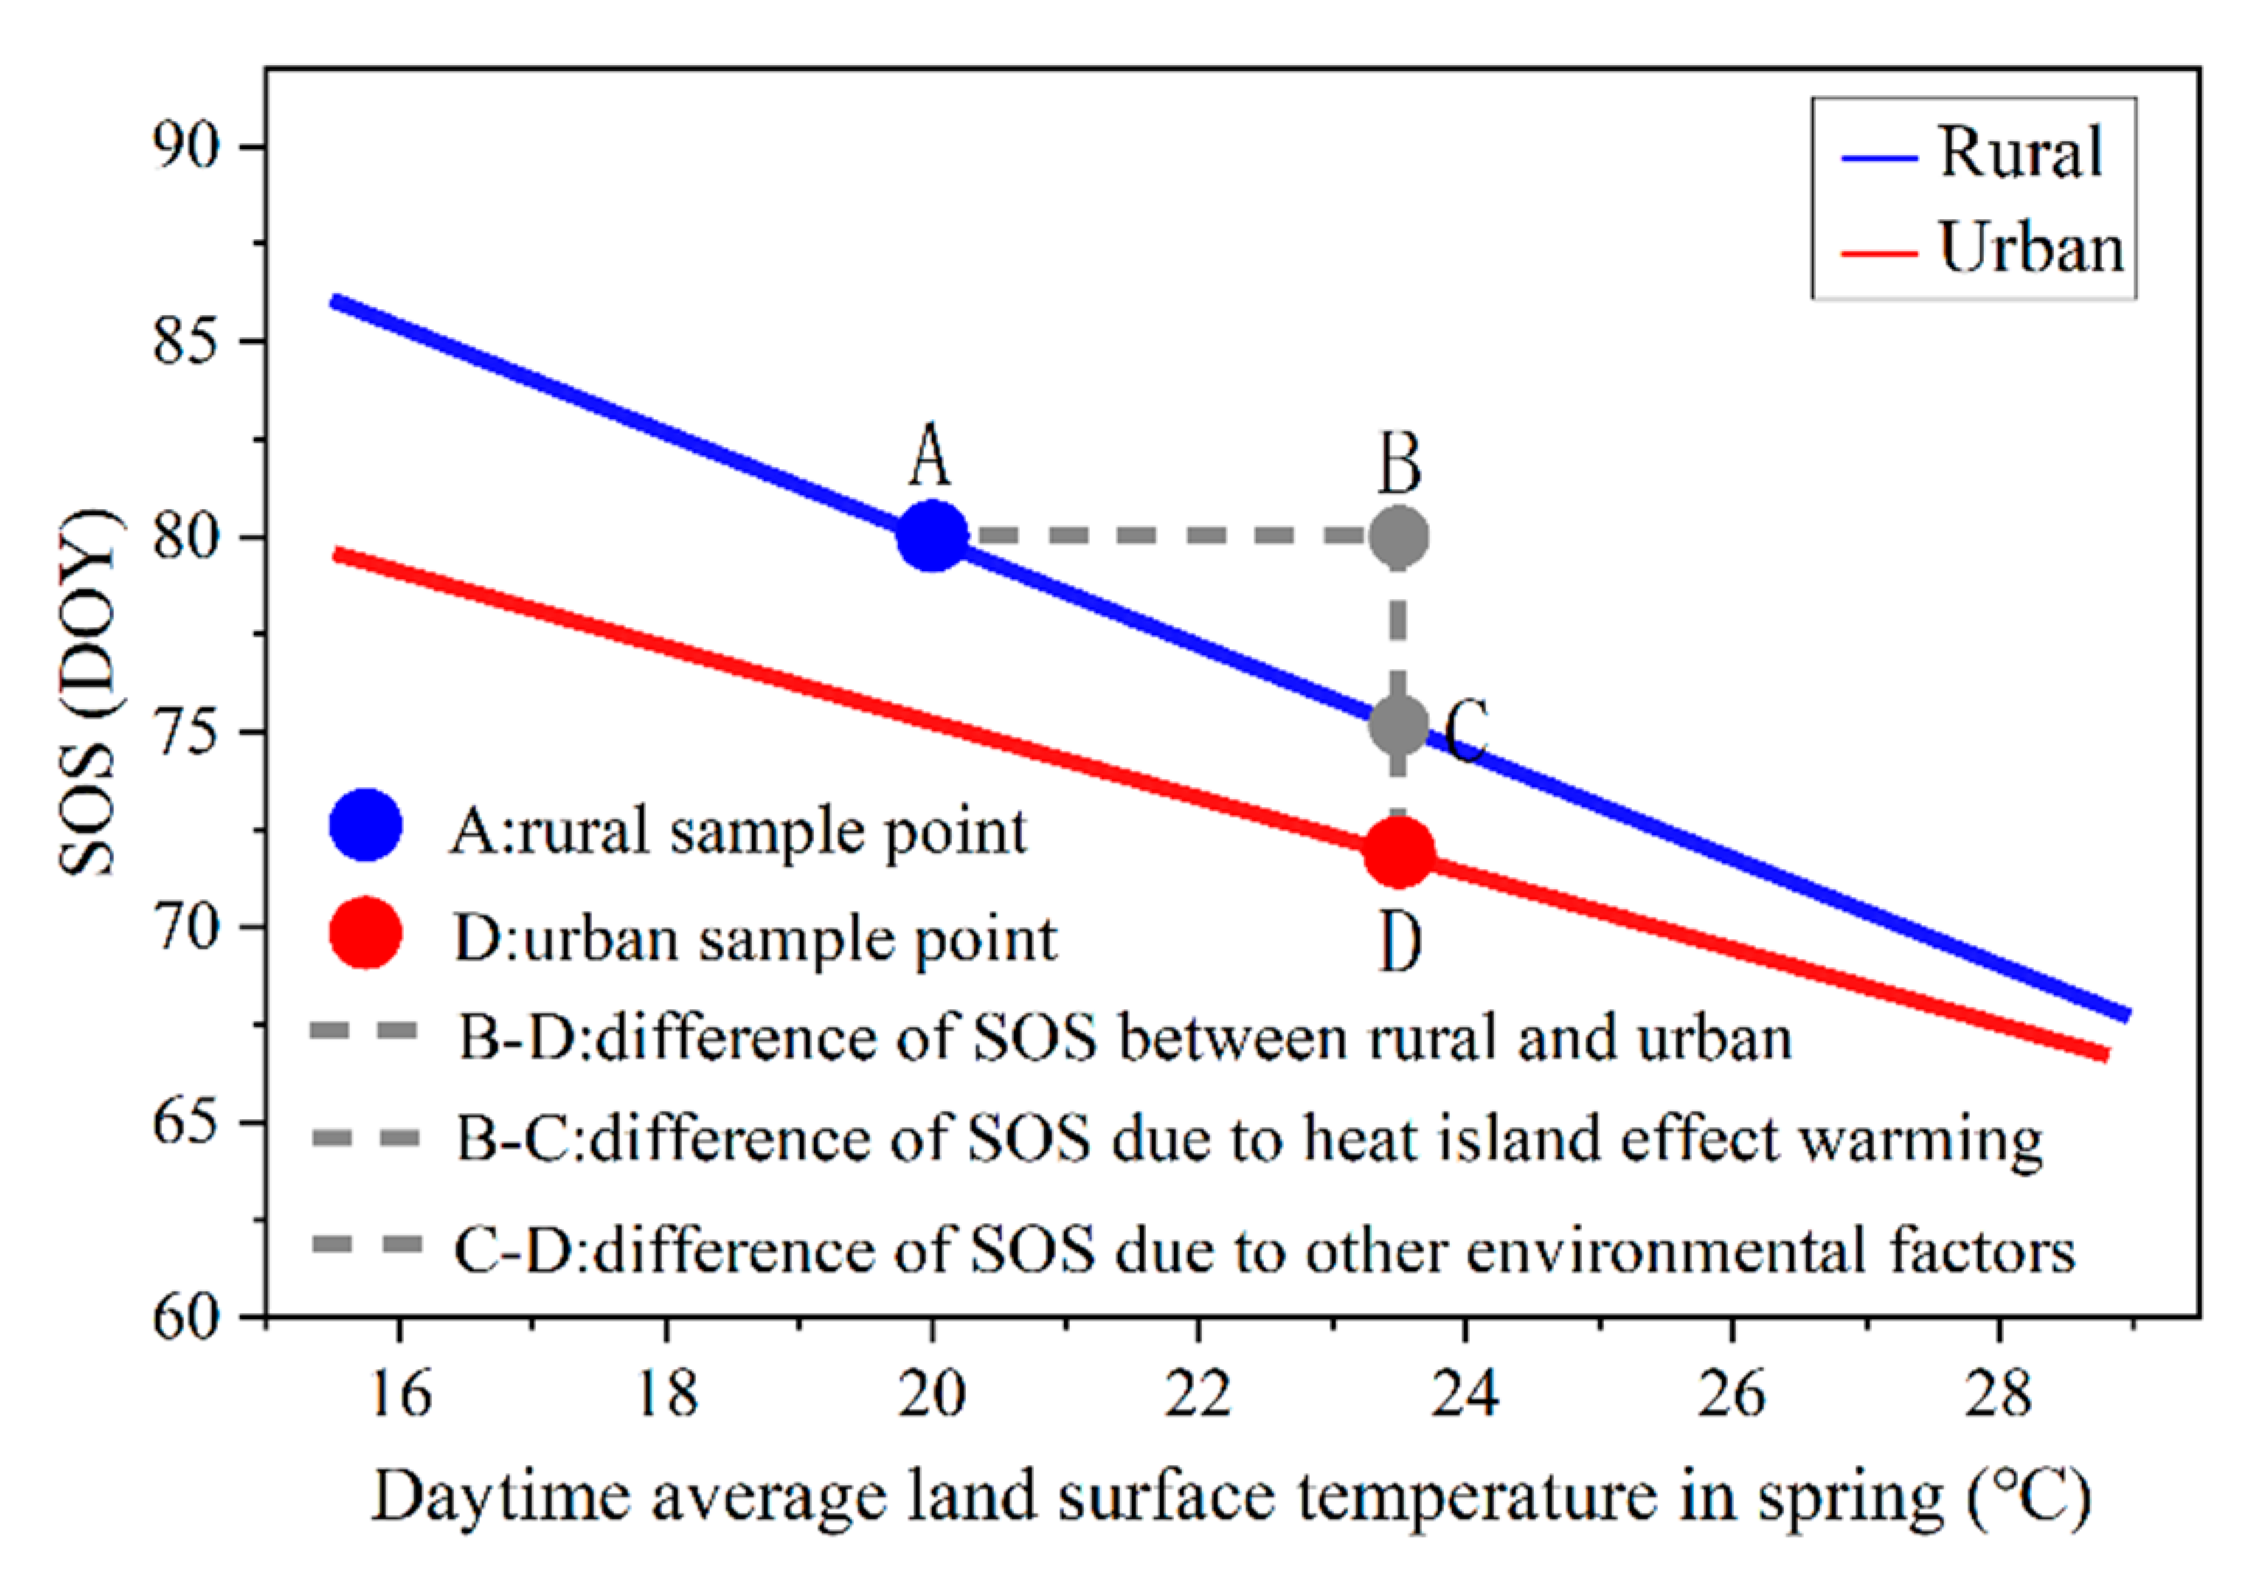
Figure 4.
Spatial distribution of land surface temperature in spring of 2018 in Hangzhou. The histogram denotes the frequency distribution of difference temperature. The inset graph denotes the variation trend of temperature in the buffer zone at different distances from urban. The solid lines denote the urban boundaries, and the wide and short dotted lines denote the 10 km and 20 km buffers of the urban boundaries, respectively.
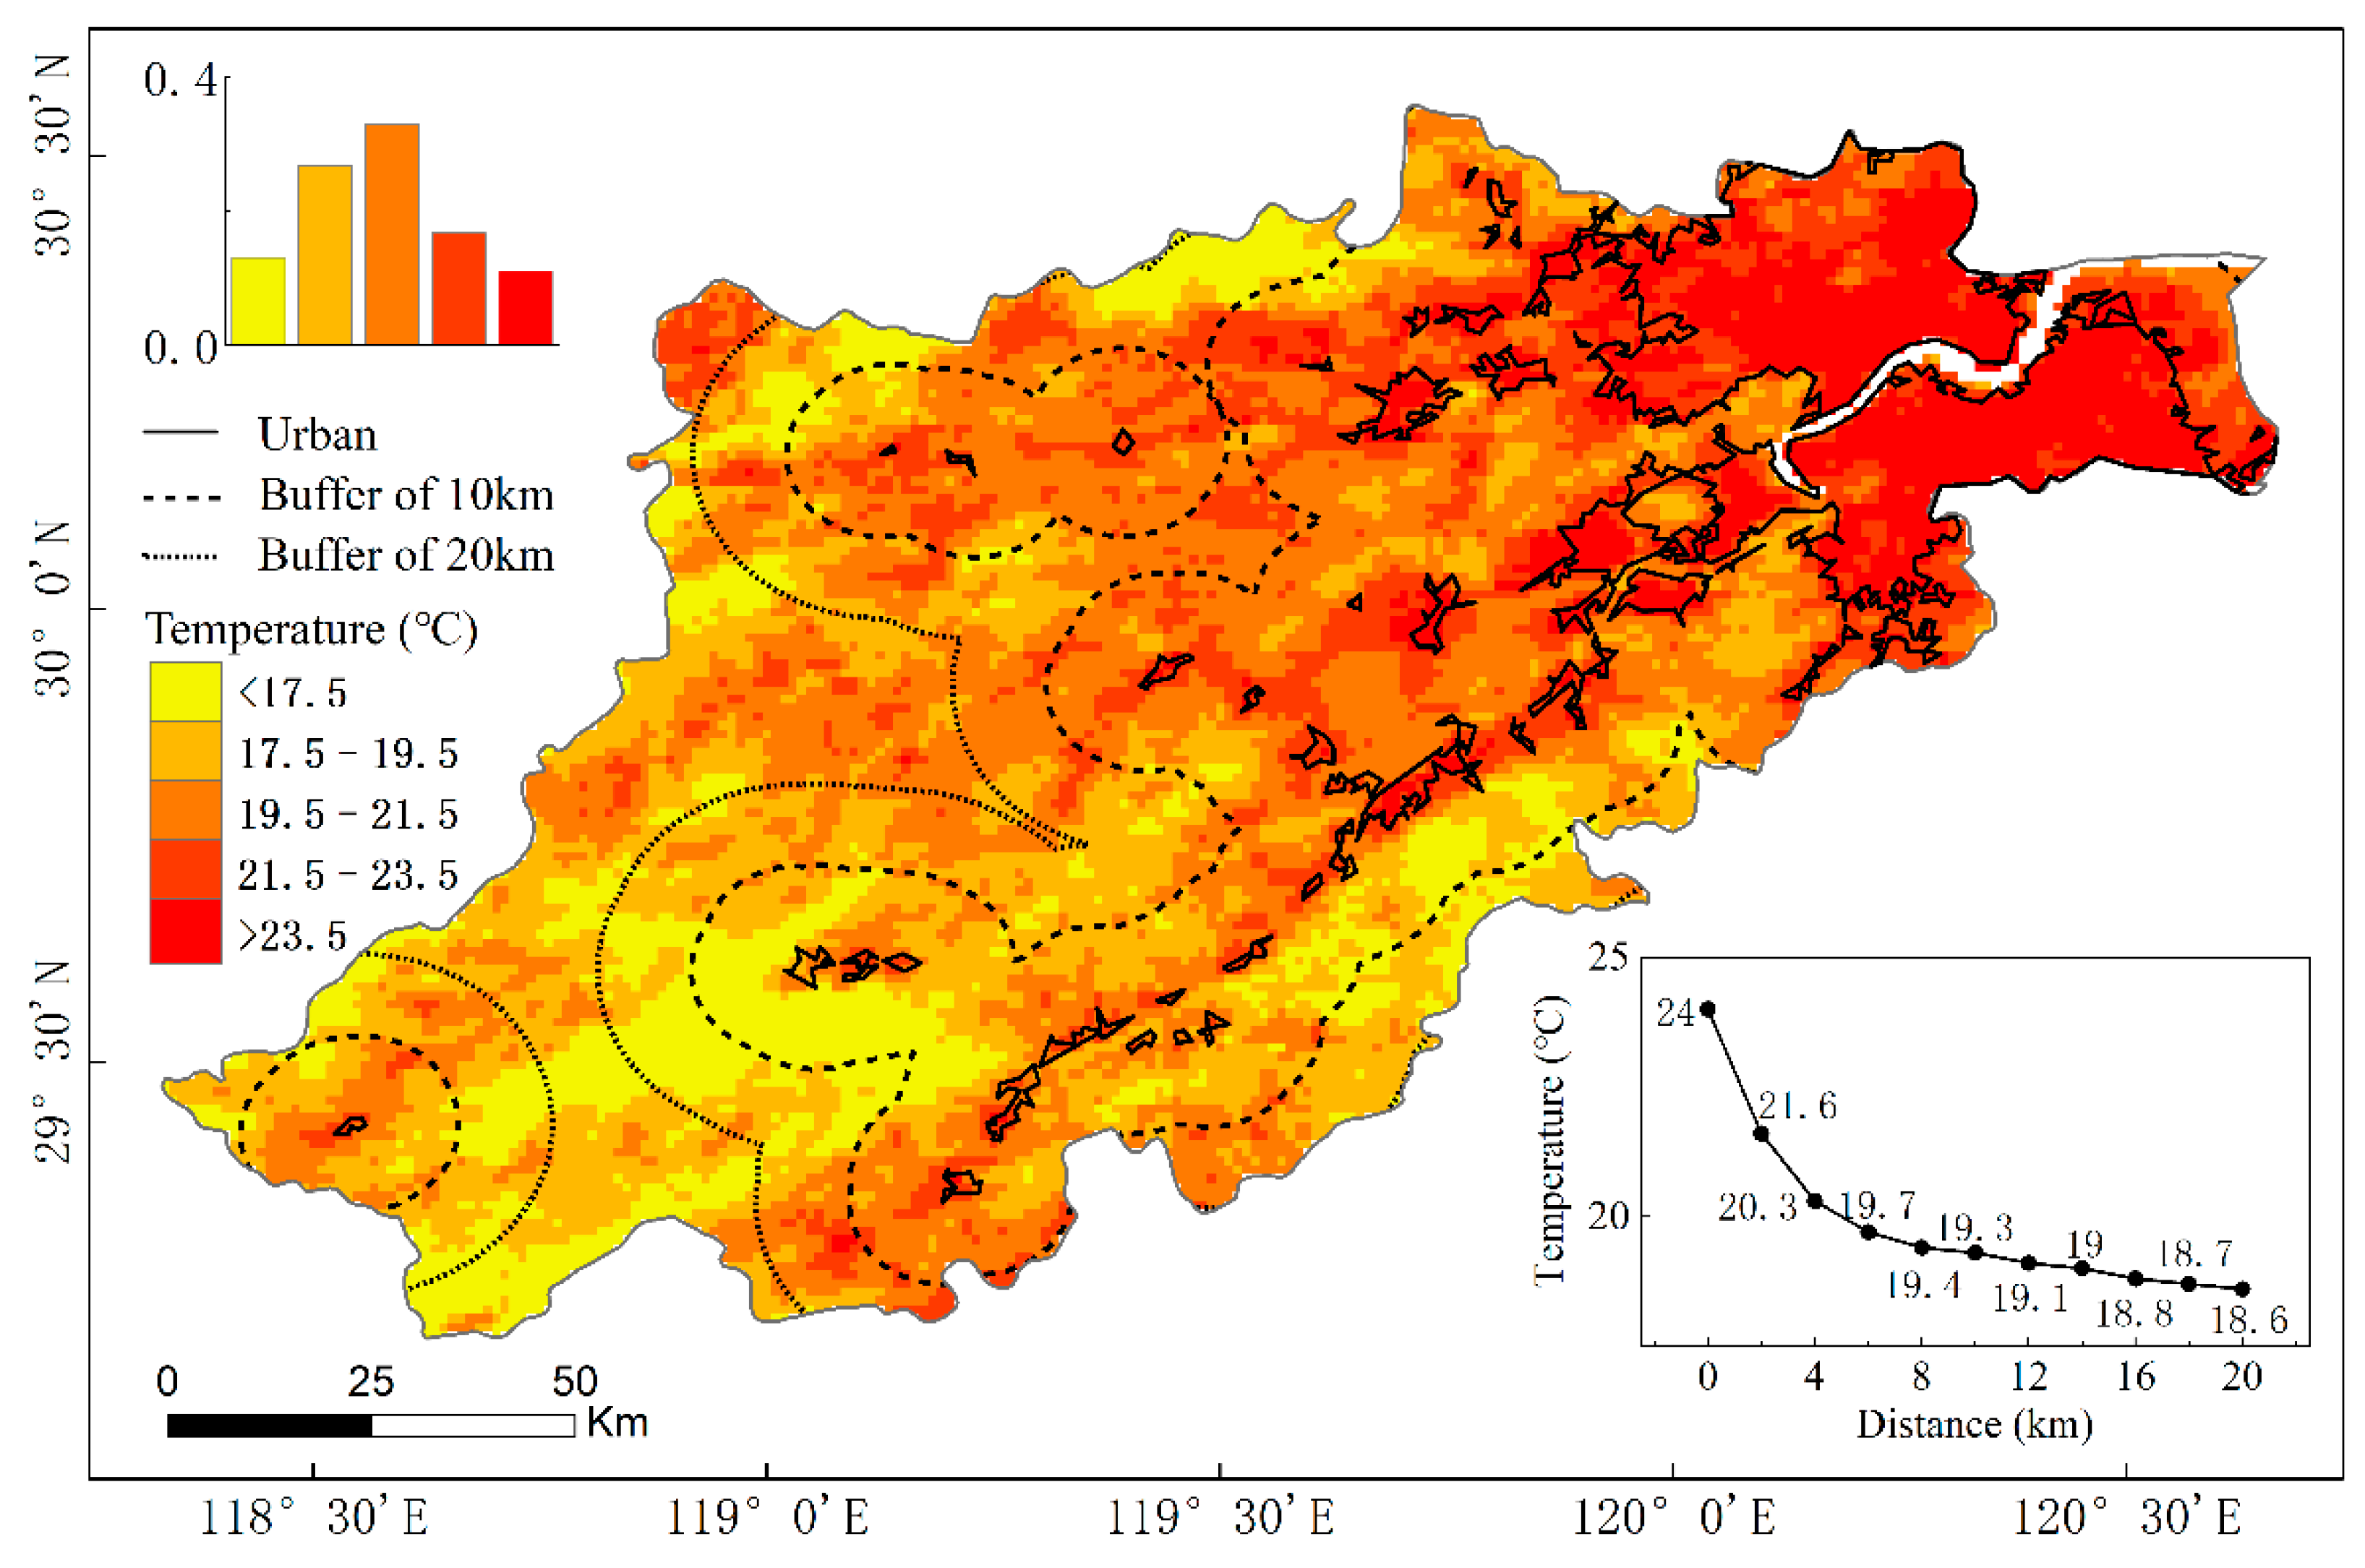
Figure 5.
Spatial distribution of annual average of the start of the growing season (SOS) from 2006 to 2018 in Hangzhou. The histogram denotes the frequency distribution of difference SOS. The inset graph denotes the variation trend of SOS in the buffer zone at different distances from urban. The DOY denotes the day of year. The solid lines denote the urban boundaries, and the wide and short dotted lines denote the 10 km and 20 km buffers of the urban boundaries, respectively.
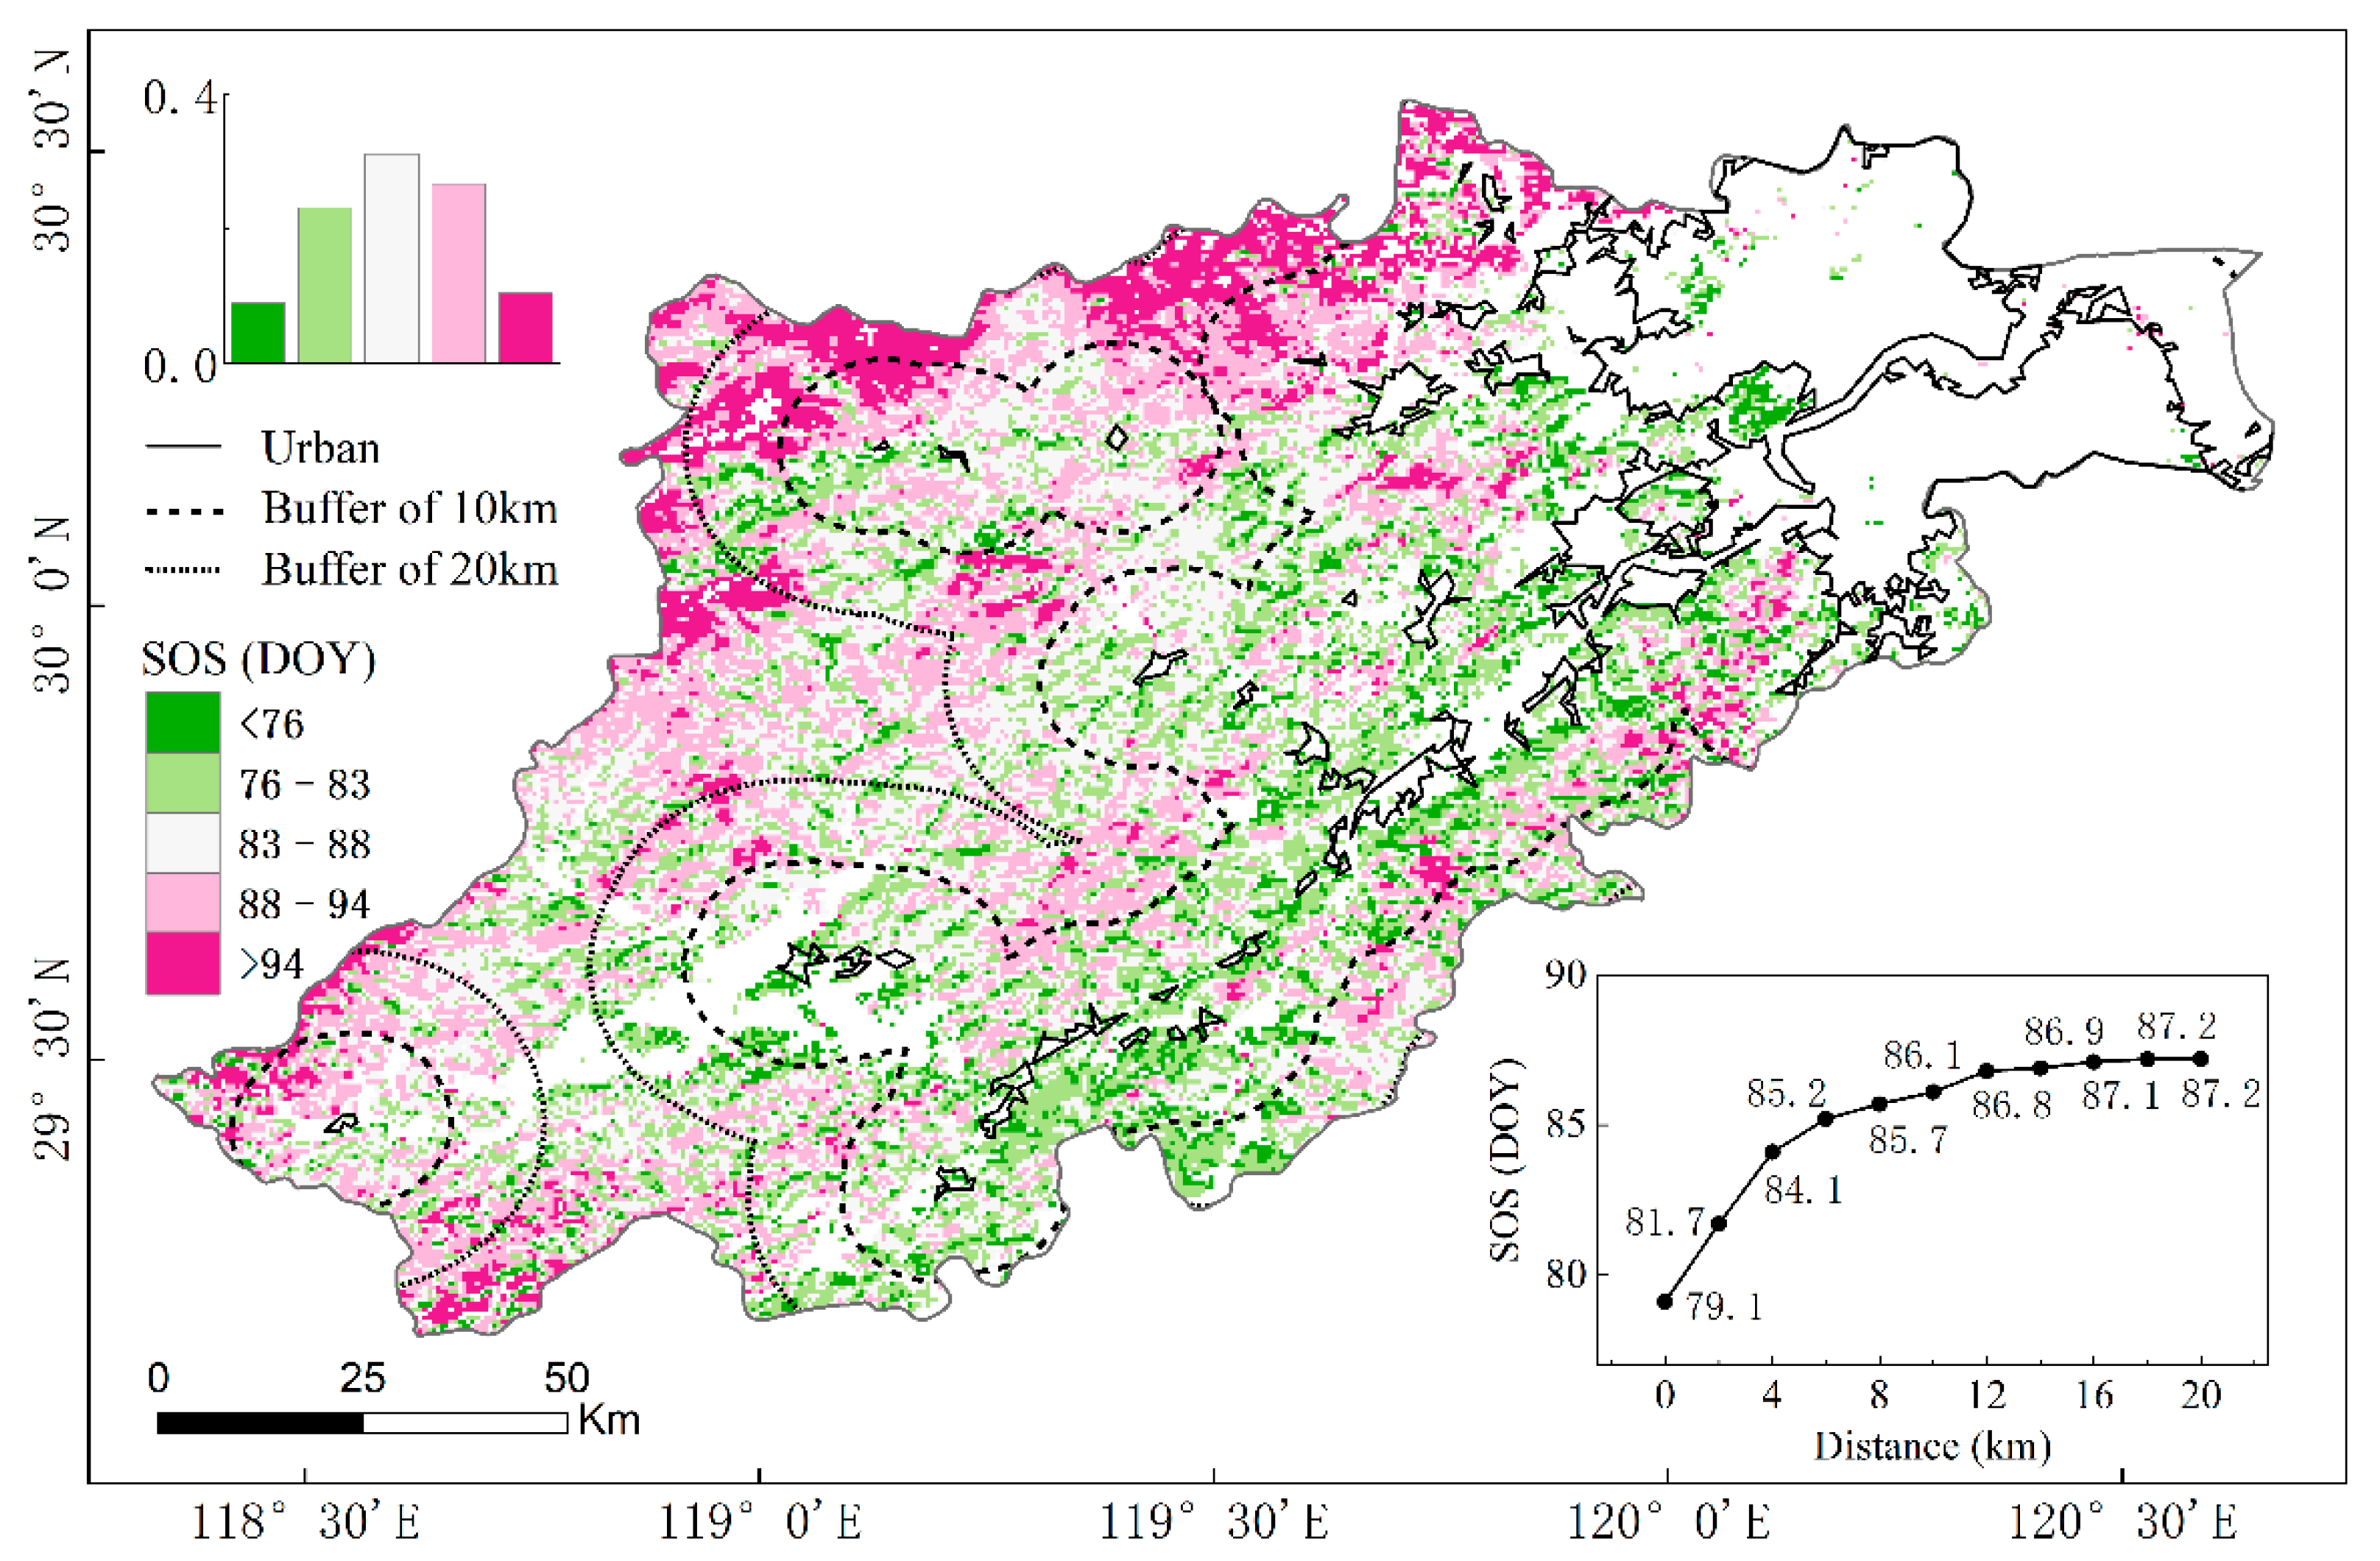
Figure 6.
Spatial distribution of the start of the growing season (SOS) in Hangzhou (left charts), and variation trend of SOS in the buffer zone at different distances from urban (right charts) in 2006, 2010, 2014, and 2018. The black line denotes the urban boundary, dark gray denotes the buffer of 10 km, and light grey denotes the buffer of 20 km. The DOY denotes the day of year. The solid lines denote the urban boundaries, and the wide and short dotted lines denote the 10 km and 20 km buffers of the urban boundaries, respectively.
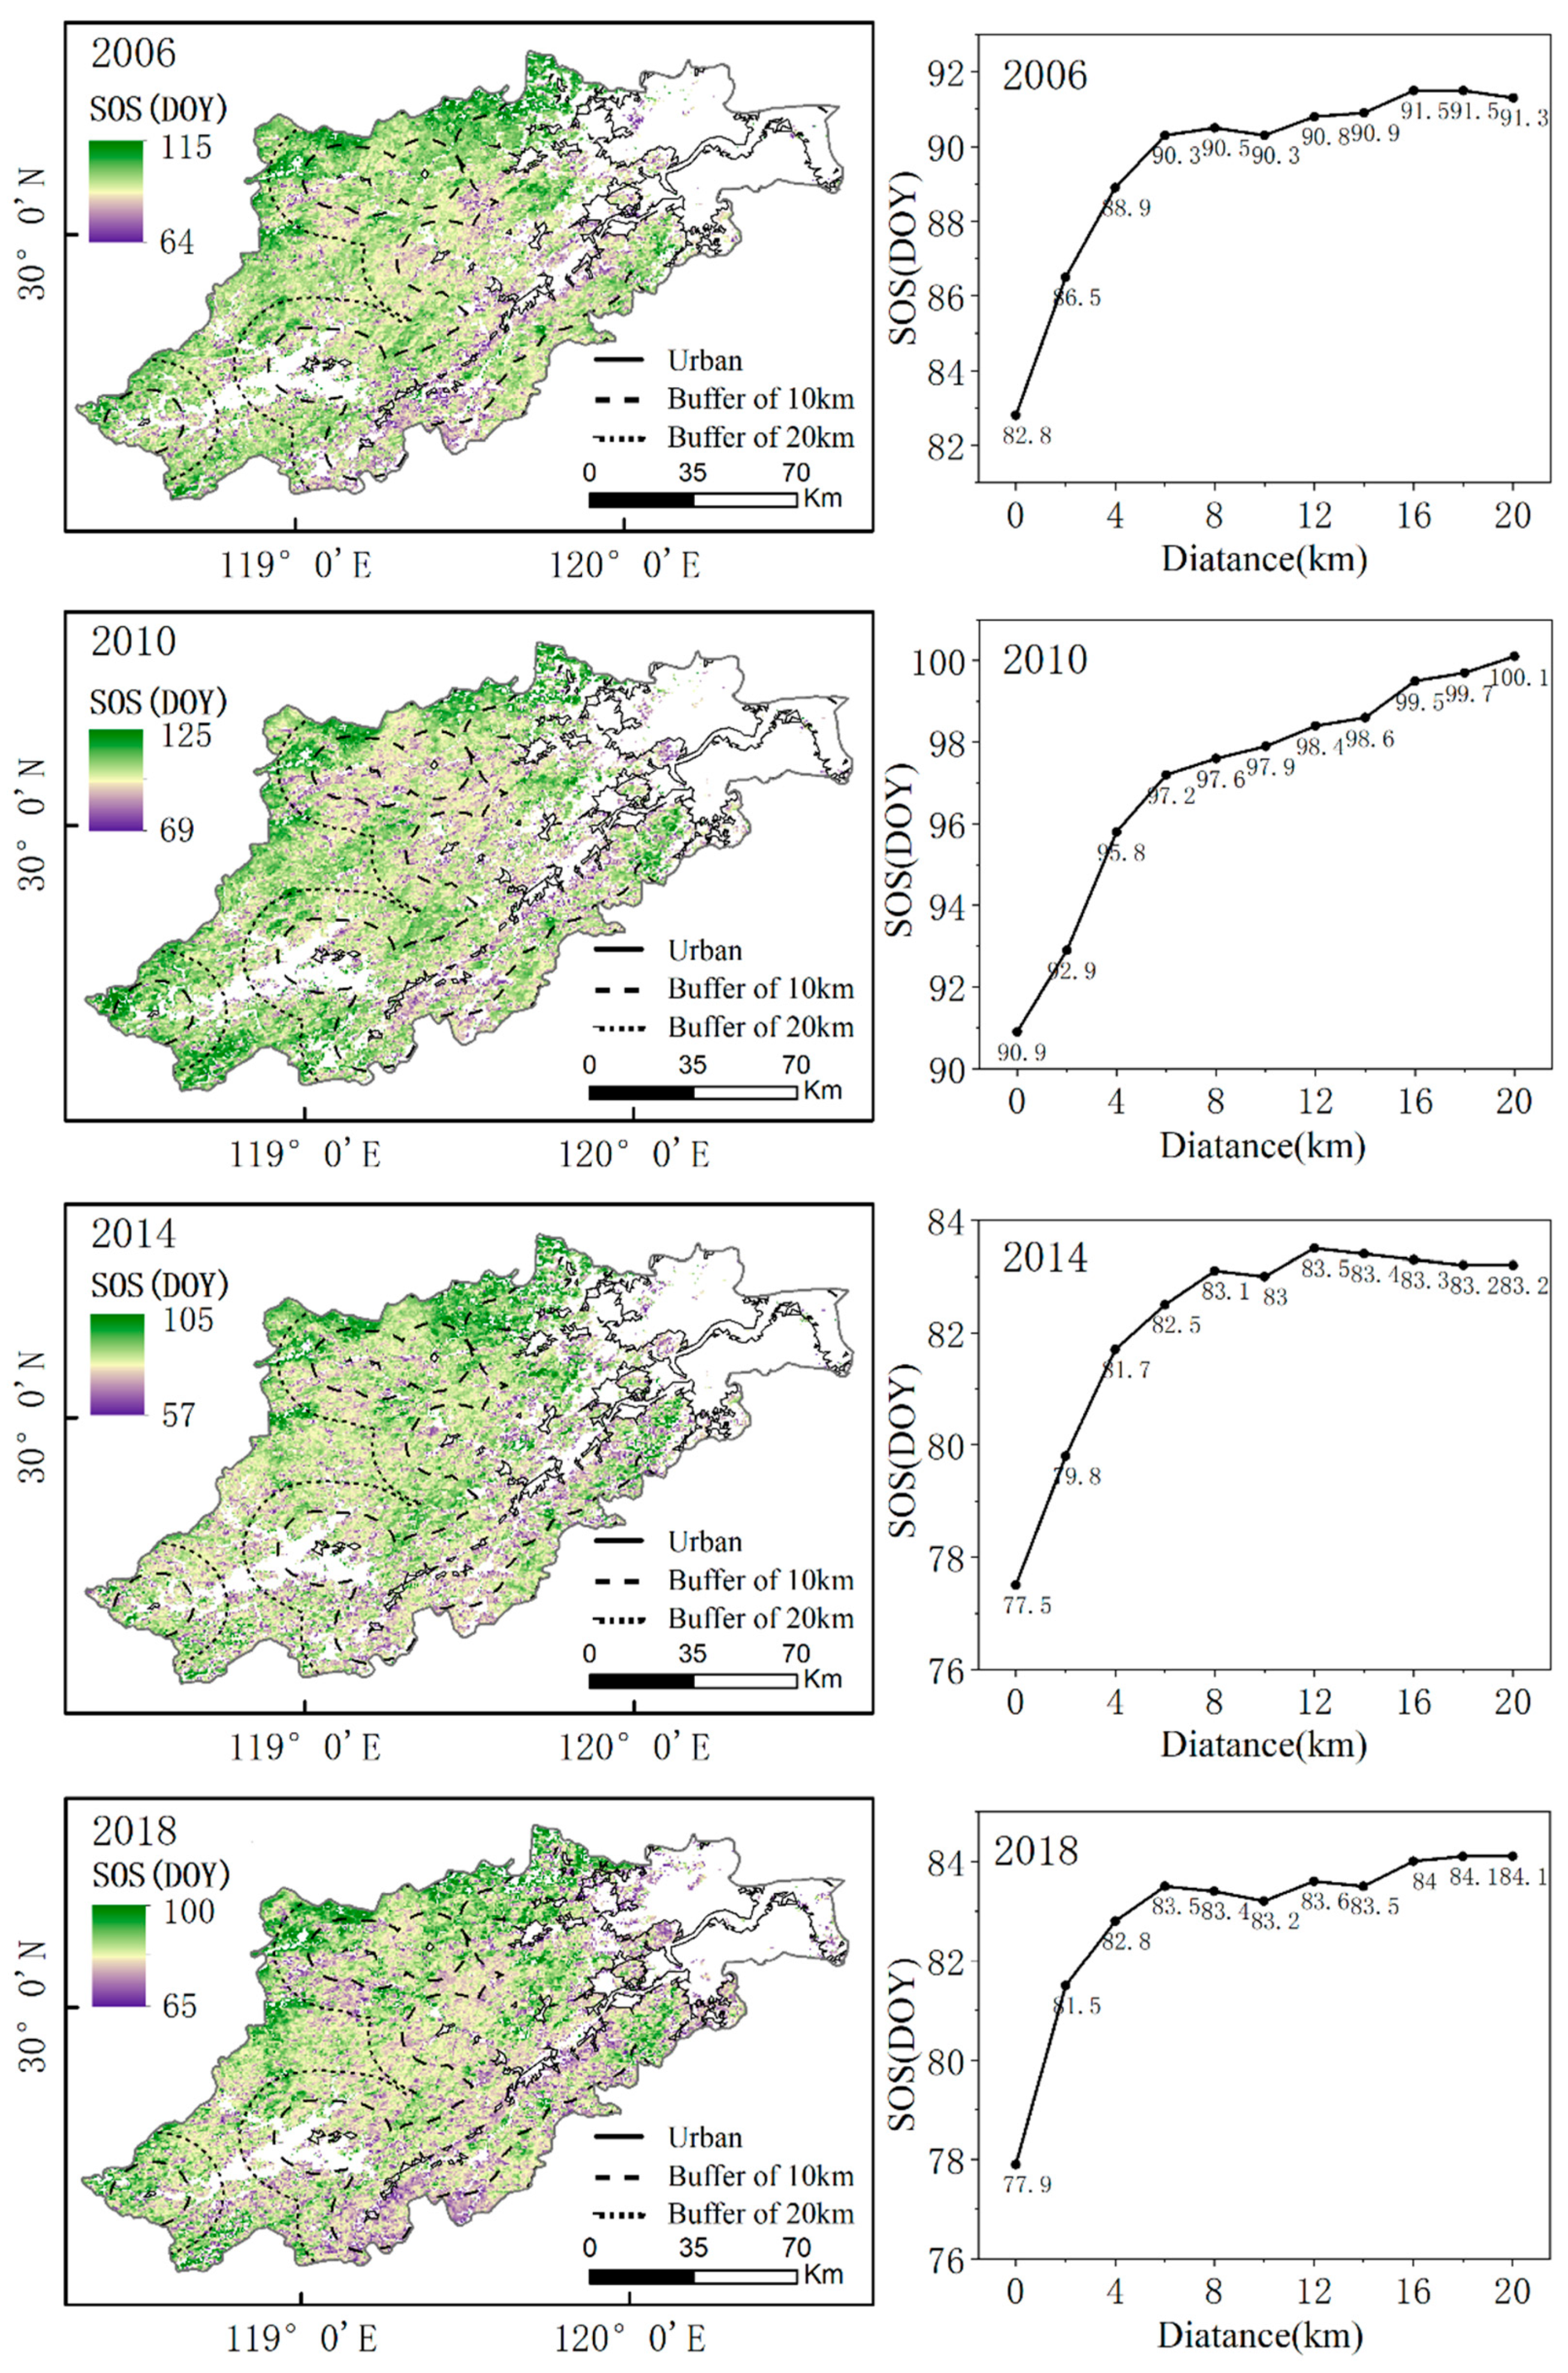
Figure 7.
Coupling relationship between land surface temperature in spring and the start of the growing season (SOS) of 2018 in Hangzhou. The 3D pie chart denotes the percentage of each coupling relationship, and the flat pie charts denote the percentage of SOS by level at different temperatures. The solid lines denote the urban boundaries, and the wide and short dotted lines denote the 10 km and 20 km buffers of the urban boundaries, respectively.
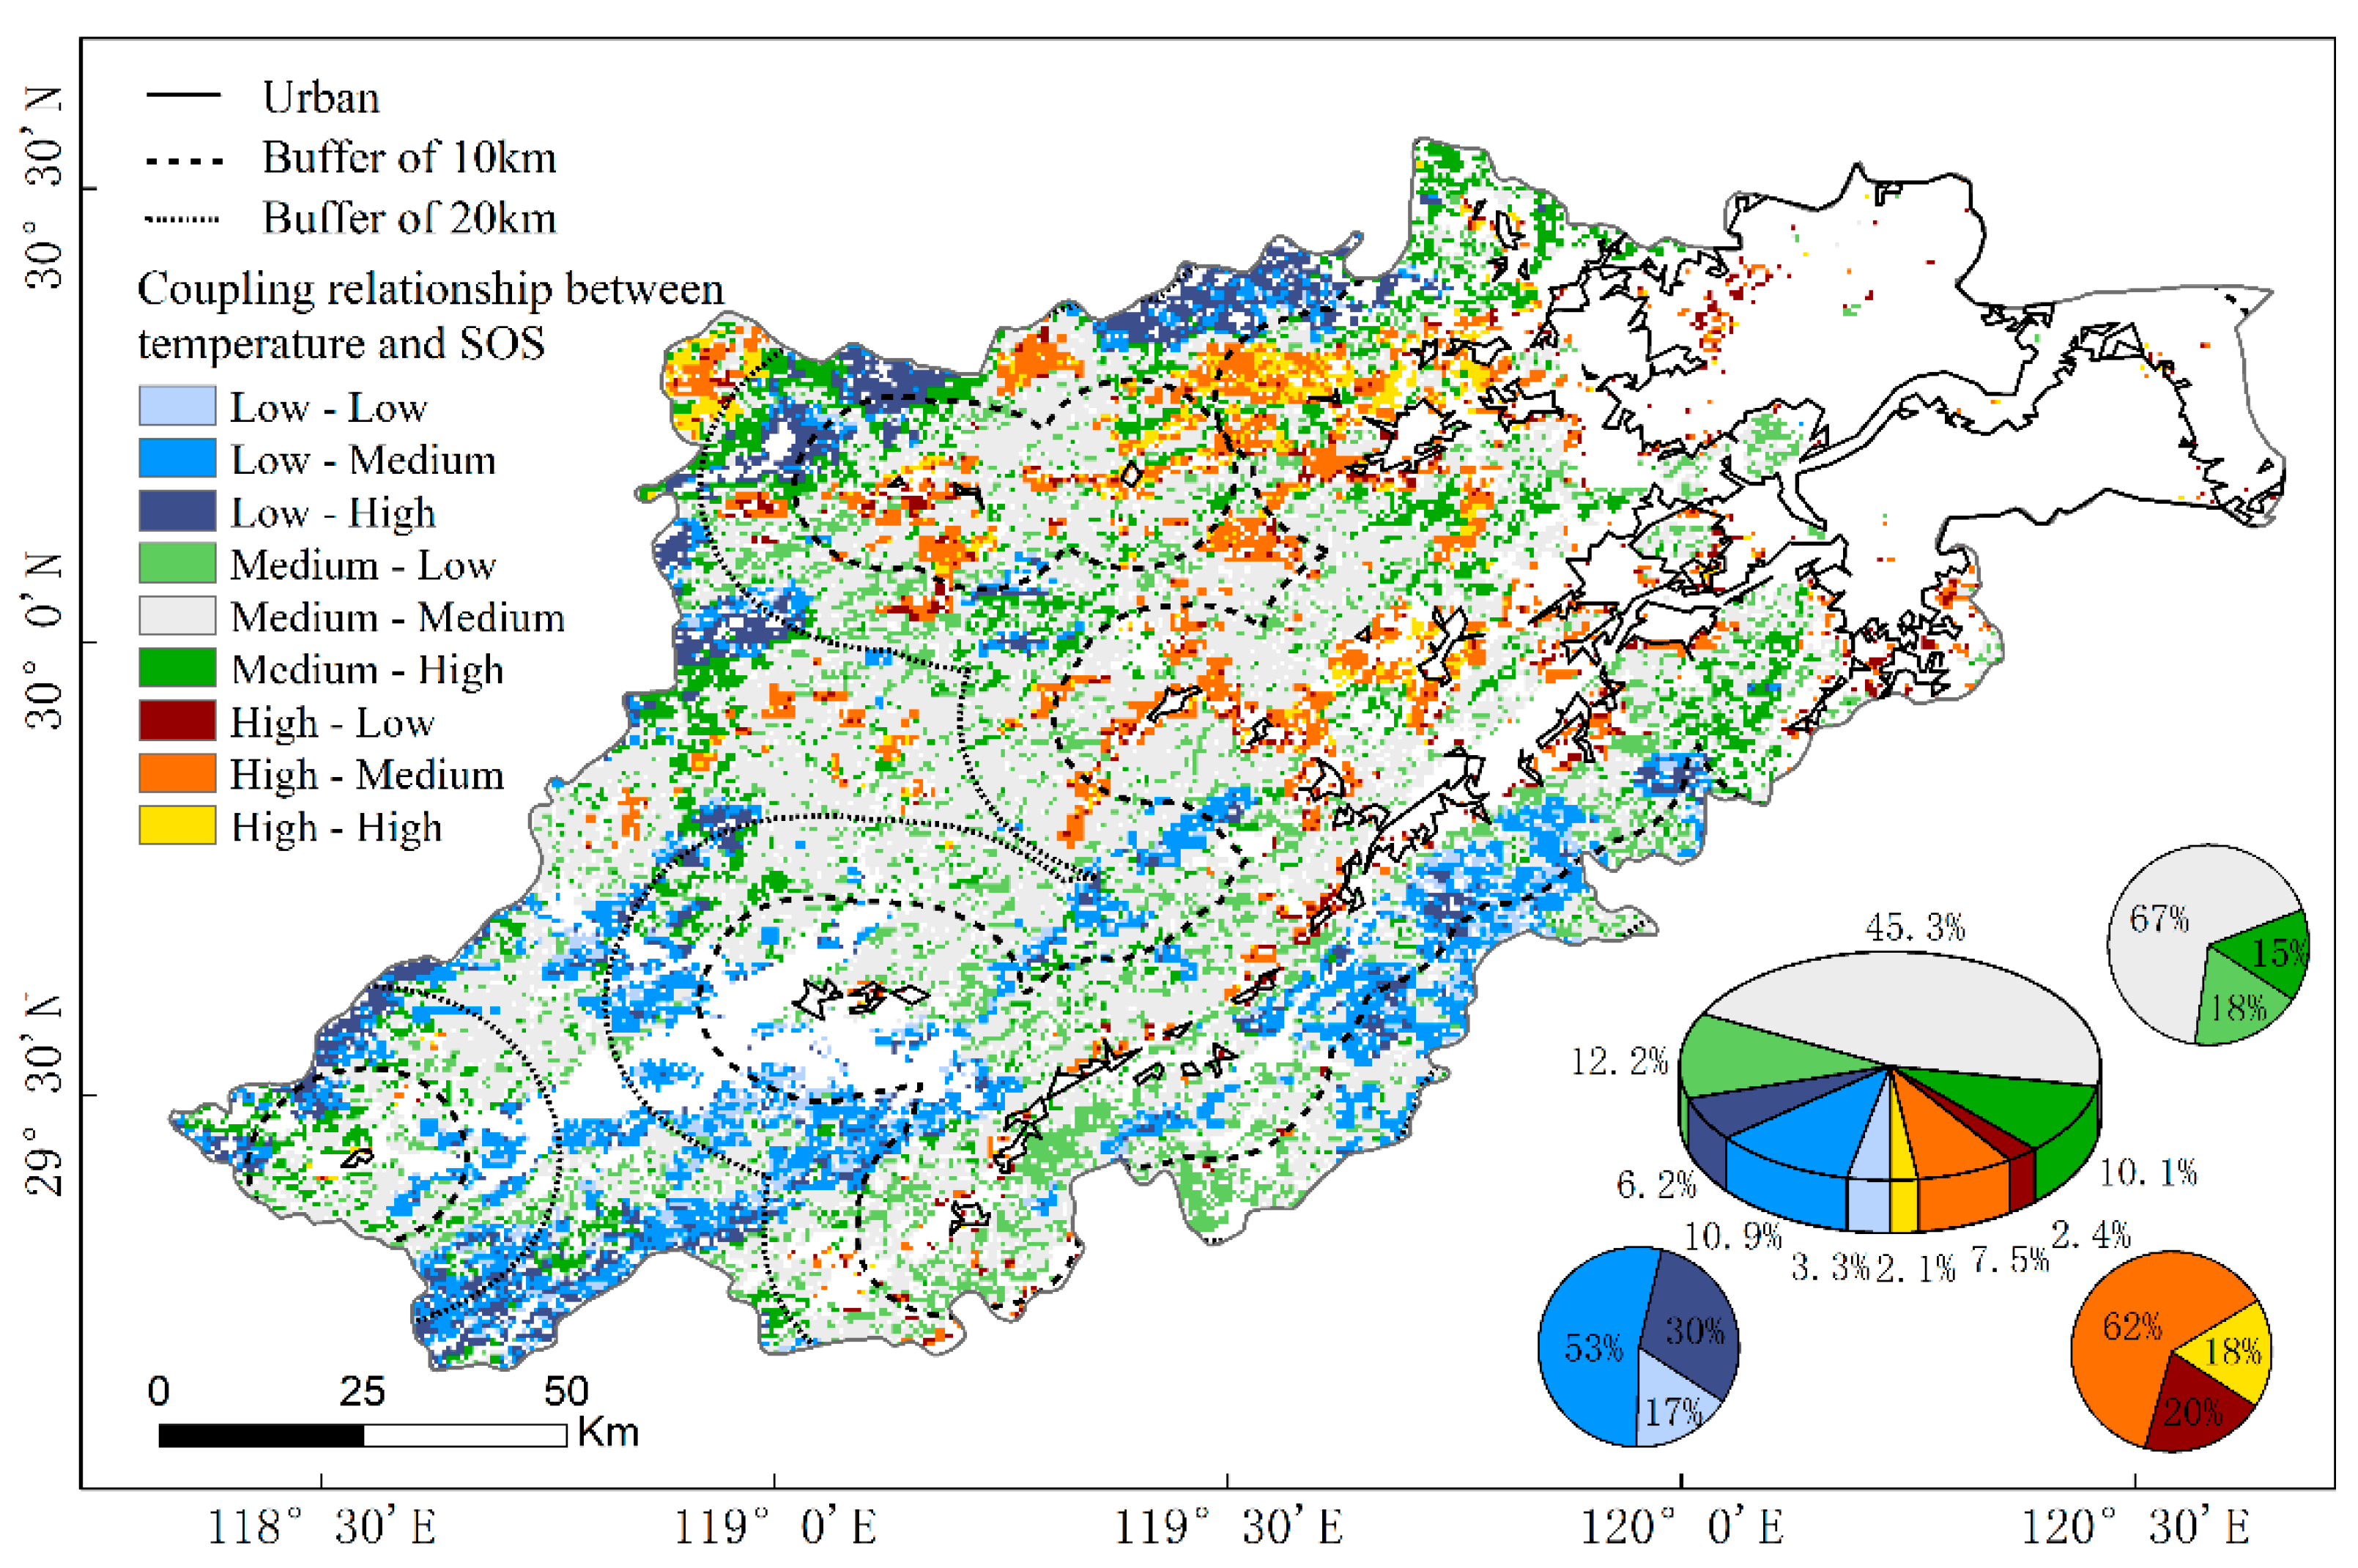
Figure 8.
Distribution of (a) the annual average of the start of growing season (SOS) of 2006–2018 and (b) its interannual variation trend under different temperatures. Slope denotes the slope of the linear regression line between SOS and year. Low, Medium and High denote different temperatures according to the natural breakpoint classification method. The DOY denotes the day of year. In the box charts, the box denote the values of median, lower quartile (Q1) and upper quartile (Q3), respectively; the error bars denote the values of Q1 − 1.5(Q3 − Q1) and Q3 + 1.5(Q3 − Q1), respectively.
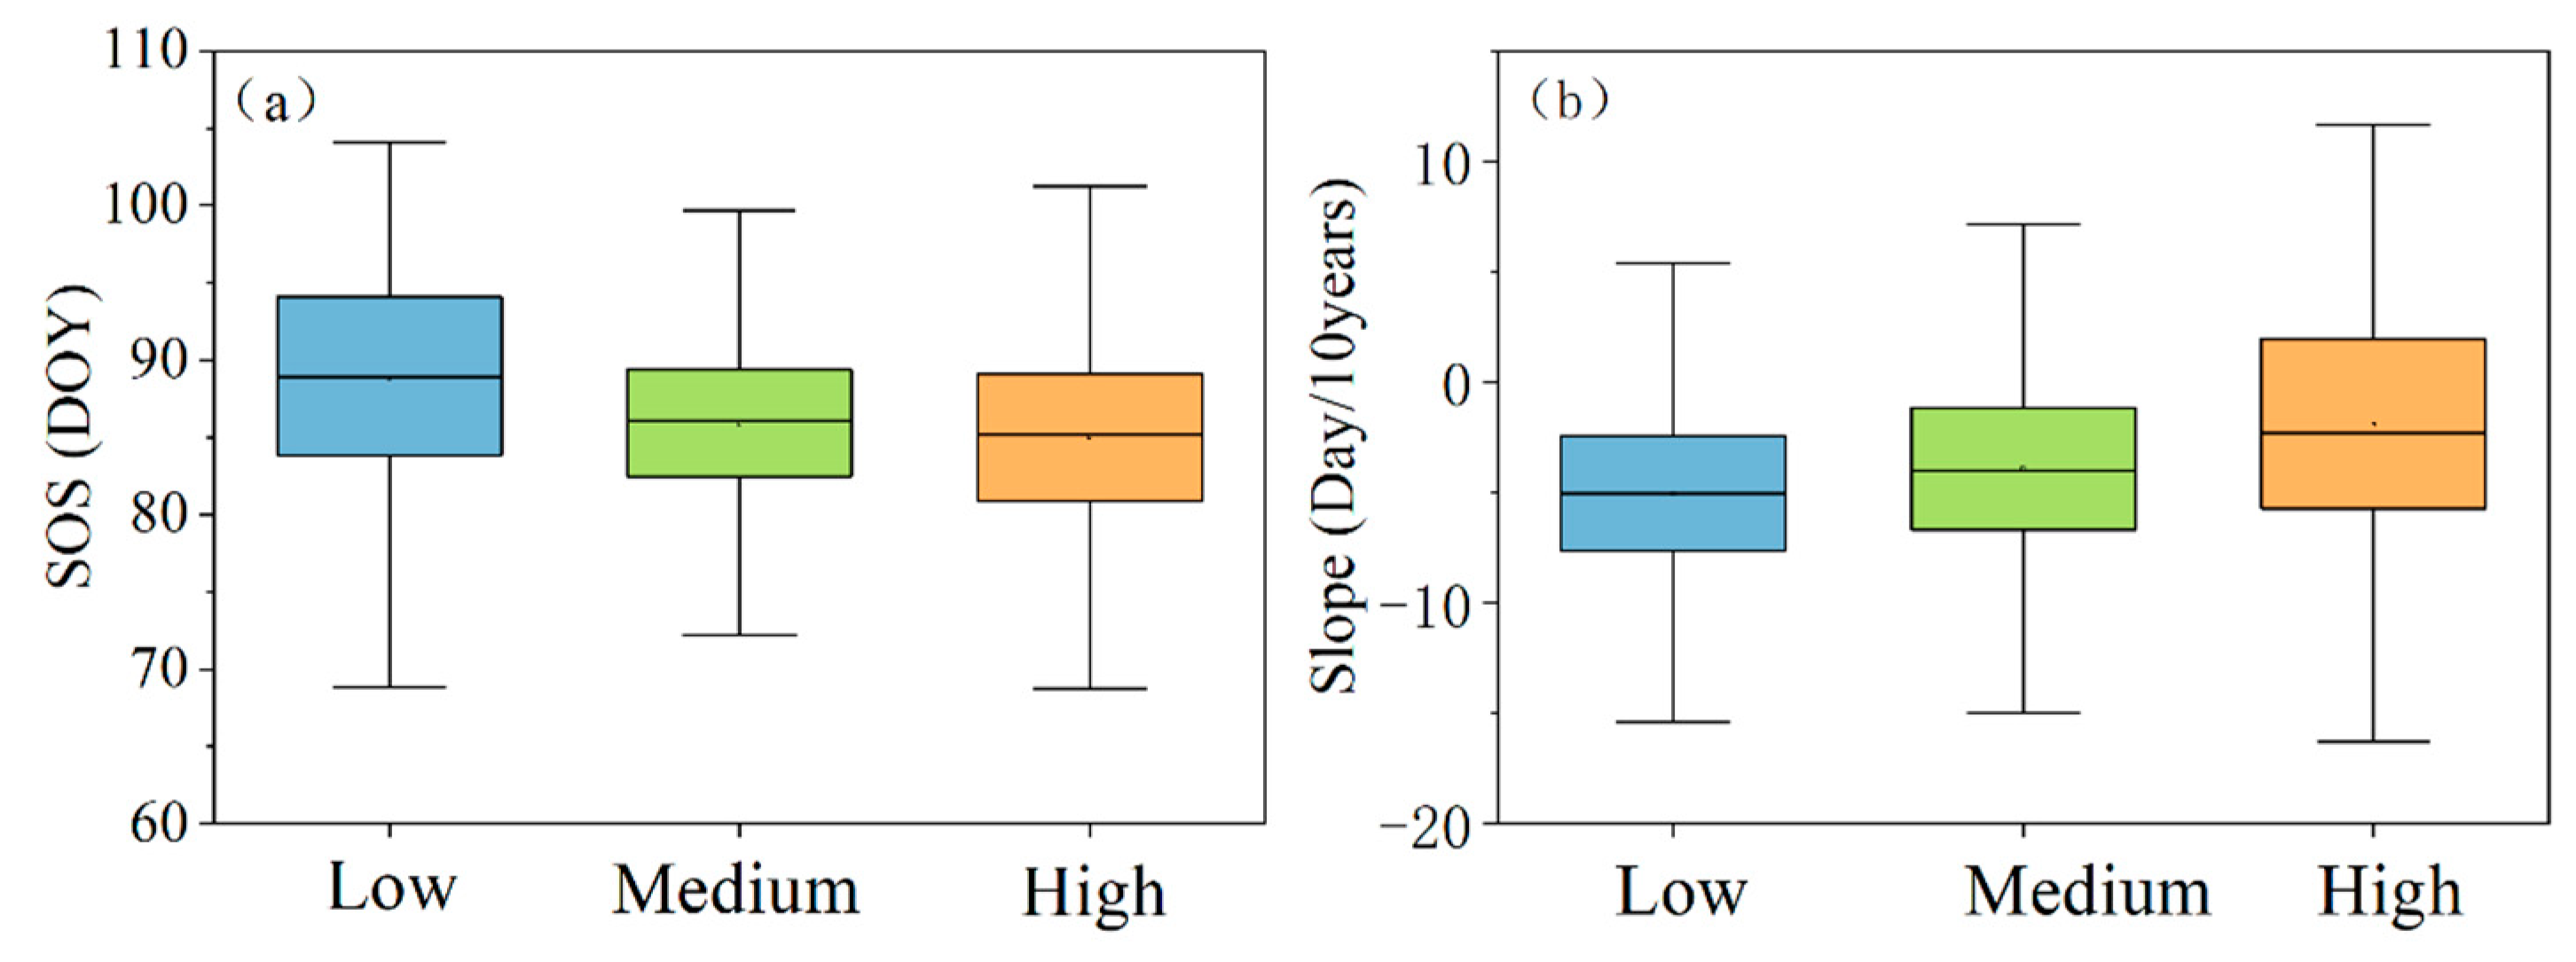
Figure 9.
The interannual changes and differences of (a) the daytime land surface temperature in spring, (b) the nighttime land surface temperature in spring, (c) the daily average temperature, and (d) the start of growing season (SOS) in the urban and the rural from 2006 to 2018. The red/blue dotted lines denote the interannual changes, and the gray bars denote the differences. The DOY denotes the day of year.
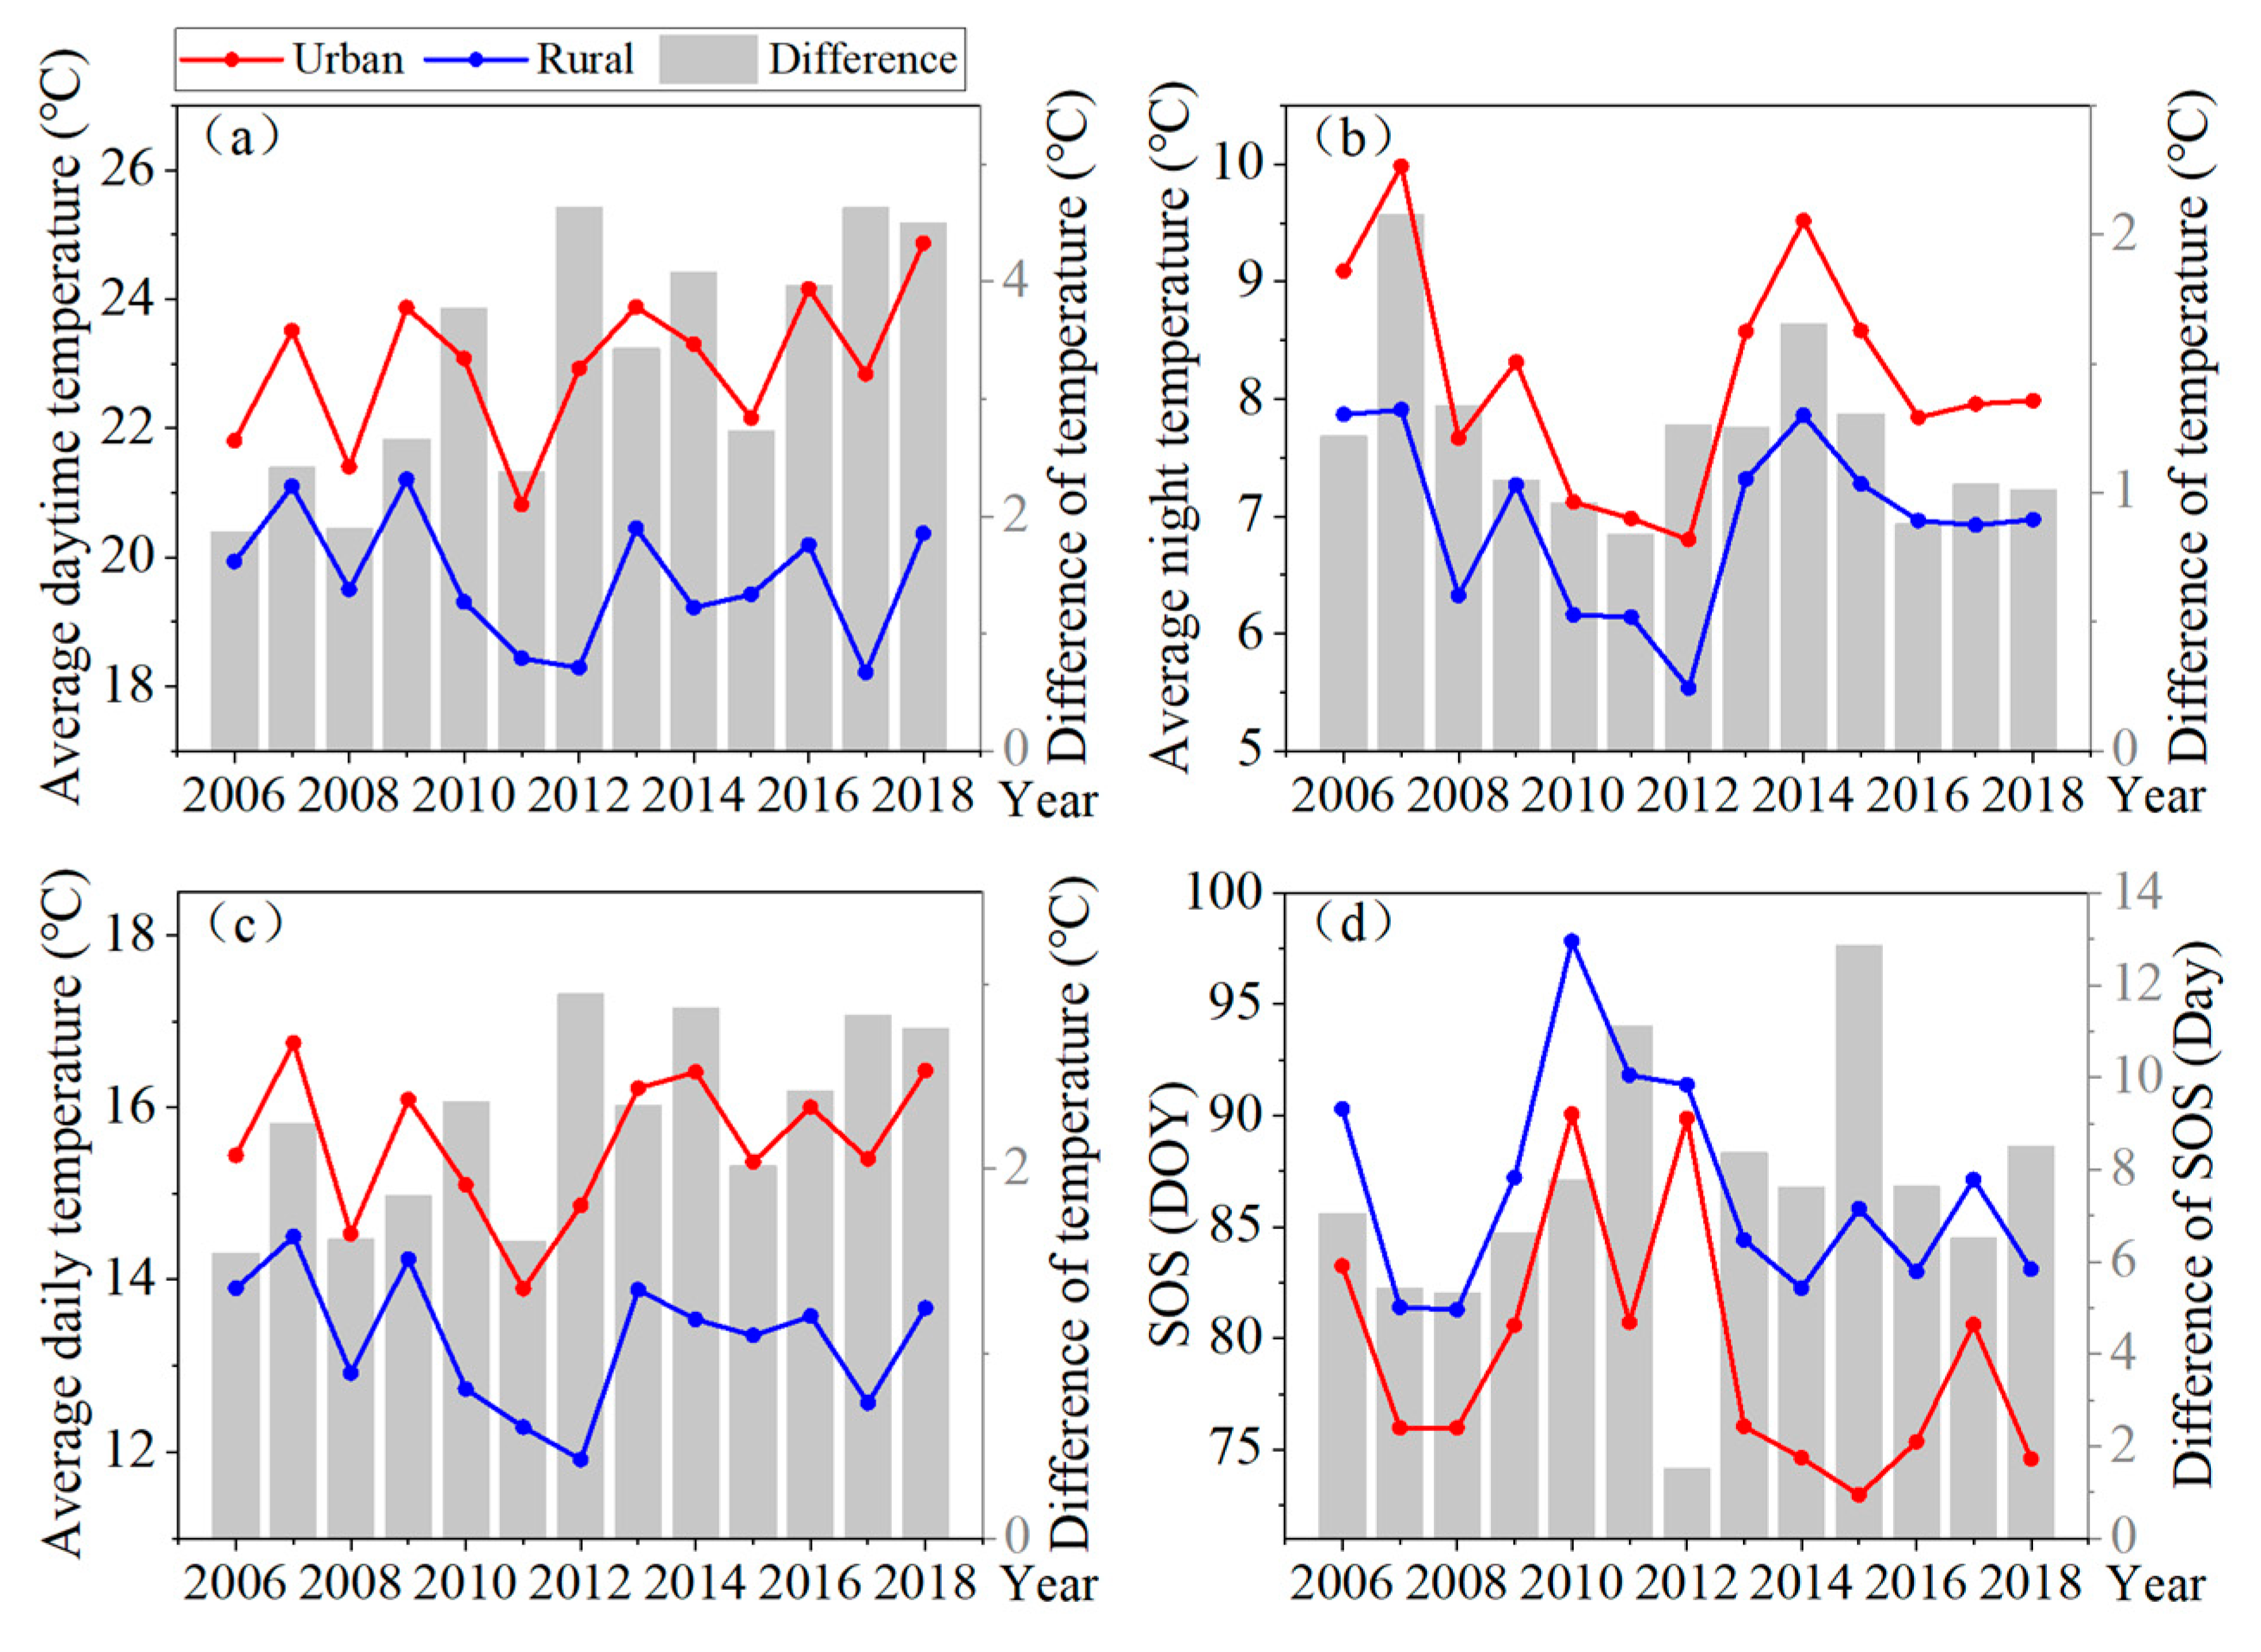
Figure 10.
The response of SOS in the urban and the rural to (a) daytime temperature and (b) nighttime temperature. The SOS means the start of the growing season. The red/blue solid points denote urban/rural sample data, the red/blue solid lines denote linear regression lines, and the regression equation and significance are shown in the illustration. The DOY denotes the day of year.
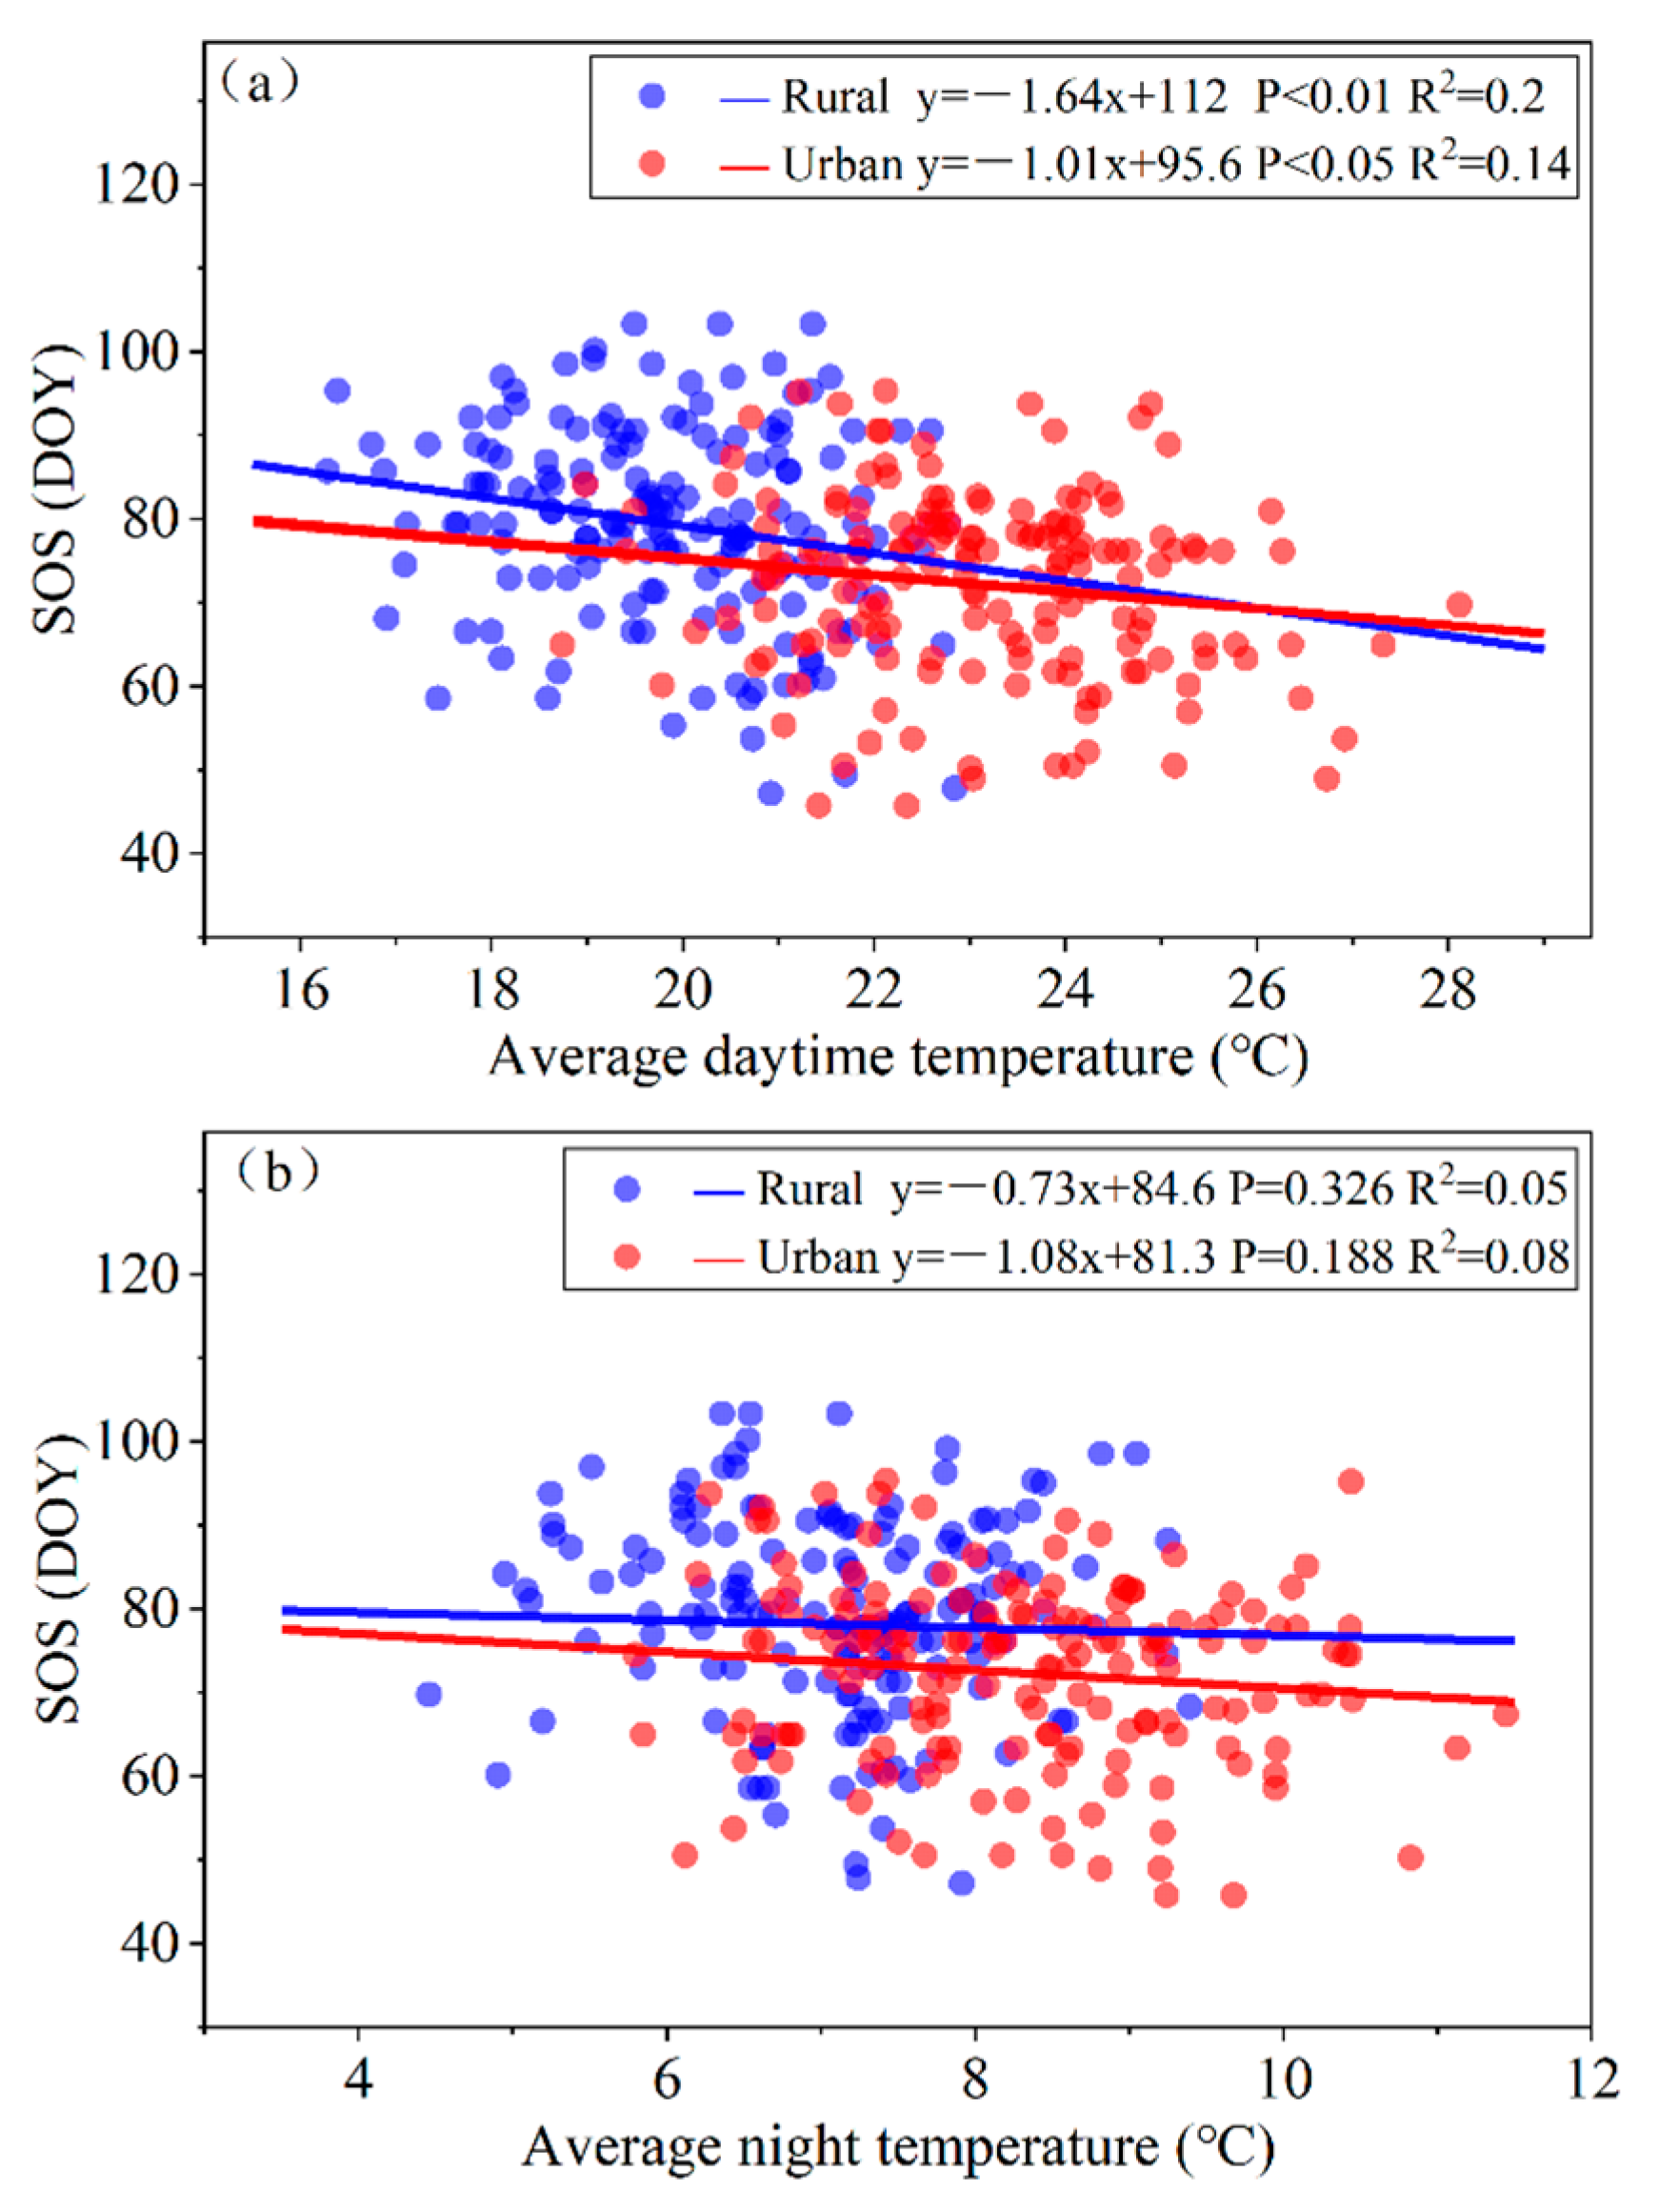
Figure 11.
(a) The contributions of the difference of land surface temperature between urban and rural (ΔLST) and other factors to the difference of plant phenology under urbanization and (b) their interannual variations from 2006 to 2018. The SOS means the start of the growing season. Quantile chart denotes the distribution of SOS differences from 2006 to 2018. Solid red points represent abnormal values. The DOY denotes the day of year.

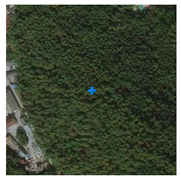
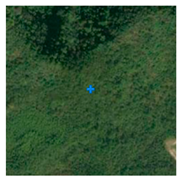
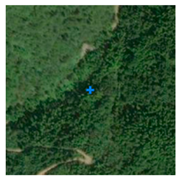
Table 1.
The Google map, latitude and longitude of the test areas in the urban and rural.
| U1 | U2 | U3 |
 |  | 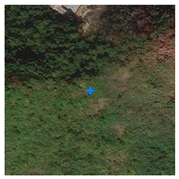 |
| U4 | U5 | No: Latitude, Longitude |
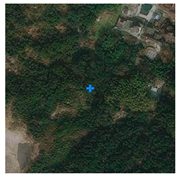 |  | U1: 30.36051N, 120.19516E U2: 30.35946N, 120.17856E U3: 30.18648N, 120.30131E U4: 30.18959N, 120.42429E U5: 30.42698N, 120.28390E |
| R1 | R2 | R3 |
 |  |  |
| R4 | R5 | No: Latitude, Longitude |
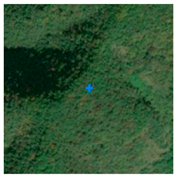 | 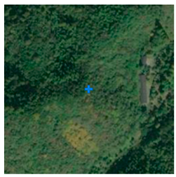 | R1: 30.23112N, 119.35119E R2: 30.05648N, 119.51766E R3: 29.72447N, 119.35588E R4: 29.97818N, 119.27411E R5: 30.24293N, 119.33563E |
Publisher’s Note: MDPI stays neutral with regard to jurisdictional claims in published maps and institutional affiliations. |
© 2021 by the authors. Licensee MDPI, Basel, Switzerland. This article is an open access article distributed under the terms and conditions of the Creative Commons Attribution (CC BY) license (https://creativecommons.org/licenses/by/4.0/).
Share and Cite
MDPI and ACS Style
Ji, Y.; Jin, J.; Zhan, W.; Guo, F.; Yan, T. Quantification of Urban Heat Island-Induced Contribution to Advance in Spring Phenology: A Case Study in Hangzhou, China. Remote Sens. 2021, 13, 3684. https://doi.org/10.3390/rs13183684
AMA Style
Ji Y, Jin J, Zhan W, Guo F, Yan T. Quantification of Urban Heat Island-Induced Contribution to Advance in Spring Phenology: A Case Study in Hangzhou, China. Remote Sensing. 2021; 13(18):3684. https://doi.org/10.3390/rs13183684
Chicago/Turabian StyleJi, Yingying, Jiaxin Jin, Wenfeng Zhan, Fengsheng Guo, and Tao Yan. 2021. "Quantification of Urban Heat Island-Induced Contribution to Advance in Spring Phenology: A Case Study in Hangzhou, China" Remote Sensing 13, no. 18: 3684. https://doi.org/10.3390/rs13183684
Note that from the first issue of 2016, this journal uses article numbers instead of page numbers. See further details here.