
Vegetation Dynamics and Climatological Drivers in Ethiopia at the Turn of the Century


1
Department of Geography, University of Florida 3141 Turlington Hall 220 Newell Drive, Gainesville, FL 32611-7315, USA
2
Department of Geography, University of Tennessee, Knoxville, 1000 Philip Fulmer Way, Knoxville, TN 37996-0925, USA
3
Department of Economics, University of Florida 224 Matherly Hall, P.O. Box 117140, Gainesville, FL 32611-7140, USA
*
Author to whom correspondence should be addressed.
Remote Sens. 2021, 13(16), 3267; https://doi.org/10.3390/rs13163267
Submission received: 20 July 2021
/
Revised: 9 August 2021
/
Accepted: 14 August 2021
/
Published: 18 August 2021
(This article belongs to the Special Issue Remote Sensing Applications for Earth Observation and Global Change Detection)
Abstract
:Global change, particularly climate change, poses a risk of altering vegetation composition and health. The consequences manifest throughout Earth’s system as a change in ecosystem services and socioecological stability. It is therefore critical that vegetation dynamics are monitored to establish baseline conditions and detect shifts. Africa is at high risk of environmental change, yet evaluation of the link between climate and vegetation is still needed for some regions. This work expands on more frequent local and multinational scale studies of vegetation trends by quantifying directional persistence (DP) at a national scale for Ethiopia, based on the normalized difference vegetation index (NDVI) between 2000 and 2016. The DP metric determines cumulative change in vegetation greenness and has been applied to studies of ecological stability and health. Secondary analysis utilizing panel regression methodologies is carried out to measure the effect of climate on NDVI. Models are developed to consider spatial dependence by including fixed effects and spatial weights. Results indicate widespread cumulative declines in NDVI, with the greatest change during the dry season and concentrated in northern Ethiopia. Regression analyses suggest significant control from climatic variables. However, temperature has a larger effect on NDVI, which contrasts with findings of some previous studies.
1. Introduction
Land represents the nexus of environmental and human wellbeing, where vegetation acts as a key indicator of global change resulting from both anthropogenic and natural forces. Shifts in vegetation dynamics, defined as fluctuations in phenology and biomass, are critical in understanding the threats of global environmental change (GEC) [1]. Vegetation dynamics influence crucial aspects of the Earth’s systems, such as regulation of surface albedo and carbon cycles, which have broader impacts on the global energy exchange driving biophysical processes of our planet [2]. These impacts to the larger system have implications for such key issues as biodiversity, nutrient cycling, local hydrologic cycles, and land degradation. Under increasing climate variability and future climate changes, many regions are becoming highly vulnerable to persistent shifts in the composition of vegetation, thereby altering system dynamics [3].
Certain regions appear much more vulnerable than others to GEC. Of these regions, Africa is frequently cited as an area of significant concern to increased stress from various aspects of change, including climate change [4,5]. The effects of GEC are particularly consequential where climate and ecosystem health are intricately linked, such as the drylands that make up the majority of Africa’s landscape [6]. Much of these drylands are also overutilized by humans that rely on various aspects of the land for their livelihoods; a problem that must be mitigated even as population increases and the potential available cropland declines [7]. The contemporaneous pressure on Africa’s landscape from these multiple drivers has intensified land degradation and vegetation loss [8], which manifests as a decline in socioeconomic productivity and resilience [9]. It is therefore imperative to monitor vegetation dynamics and determine the effects of climate on vegetation health.
Remote-sensing technologies present a comprehensive way of detecting vegetation change and its link to drivers of GEC across large spatial and temporal scales. Many studies have utilized remotely sensed data to analyze vegetation dynamics across Africa, including greening trends, shifts in growing seasons, and land-cover change. Most notably, much attention has been placed on the Sahel, which underwent greening in recent decades coinciding with a recovery from a dry period in the 1970s and 1980s [10,11,12]. However, other parts of the continent, including large portions of central and southern Africa, have experienced browning trends since the late 20th century [13,14]. In the case of East Africa, where this study is focused, vegetation showed partial greening between the 1980s and 1990s. However, this trend stalled or reversed to browning by the end of the 1990s and into the 21st century [2,15].
Researchers have investigated the link between vegetation indices and a multitude of climatic variables. Camberlin et al. [16] explored the response of vegetation to rainfall variability across tropical Africa between 1981 and 2000, finding high correlation of vegetation indices and rainfall in semi-arid zones and a weaker response in sub-humid and humid climates. The global study by Yang et al. [14] revealed the variation in the correlation of the normalized difference vegetation index (NDVI) to both temperature and rainfall, showing a high negative (positive) correlation between NDVI and temperature (rainfall) for much of southern Africa, while a more mixed signal was present in the Sahel and Horn of Africa, thus highlighting the need for further studies on this relationship. Liu et al. [17] also carried out a global study comparing interannual NDVI between 1982 and 2012, with results indicating varying trends in greening over time and a nonstationary relationship between climate variables and vegetation. Others have examined this relationship at smaller scales, finding proxies for water availability, such as soil moisture, to have significant control over vegetation greenness [18,19,20]. However, the magnitude of correlation commonly exhibits spatiotemporal variation.
A variety of methodologies have been employed to evaluate the relationship between vegetation and climate. Analyses of correlation coefficients, including Pearson correlation and Kendall’s tau, remain some of the most common approaches and have been applied to various vegetation indices and climate variables [11,15,21,22,23]. Others have used a standard regression approach, often in addition to correlation coefficients (see examples [16,20,24]). However, establishing correlation with these techniques does not always allow for simultaneous consideration of spatial and temporal elements found in longitudinal datasets, which are essential for accurately defining the relationships between climate variability and vegetation [25]. Exclusion of temporal or spatial detail in regression models of vegetation and climate disregards the common nonstationary relationship between the variables [26,27]. Furthermore, violating the assumption of independent observations by using spatially autocorrelated data in nonspatial models can result in an overestimation in the significance of indicator variables and the coefficient of determination. Ji and Peters [28] note this issue, commenting that despite the inherent spatial nature of remotely sensed data, previous research in the field has overlooked the need to adjust models for spatial dependence. In light of the limitations in traditional methods, spatial panel data models have emerged as a useful methodology for studying issues related to land cover across large spatial scales over time [29,30,31]. The enhanced capabilities offered by spatial panel data models have become increasingly useful to remote sensing scientists given the greater availability of large multidimensional datasets. This study builds on the principles described above by developing panel regression models, using two different approaches to incorporate spatial characteristics of the data.
The focus area of this work is Ethiopia, a country that is highly vulnerable to climate change and currently facing widespread land degradation. The issue is especially pertinent given the added pressure exerted by historically inadequate land management, induced largely by population growth and agricultural-focused development strategies [32,33]. Immense concern over GEC and the socioenvironmental impacts expected in Ethiopia highlight the need to assess vegetation trends and the relationship to climate, particularly as this has not been well researched at the national scale [24,34]. Monitoring the dynamics and linkages of NDVI and climate can aid in identifying vulnerable regions, discerning the impacts from natural and anthropogenic drivers, and improving mitigation efforts against GEC. This study uses the NDVI directional ersistence metric to evaluate nonlinear trends in vegetation greenness for the early 21st century across Ethiopia, on a seasonal basis. This metric has been used in a variety of regions to measure vegetation health, ecosystem suitability, and land-cover stability [35,36,37,38].
While the metric enables identification of specific areas with a significant change in vegetation, indicated by significant cumulative declines (browning) or increases (greening) in NDVI between 2005 and 2016, it cannot provide a cause for observed trends. Therefore, time series of climatological variables from the Climate Hazards Center [39] and NDVI from Moderate Resolution Imaging Spectroradiometer (MODIS) Terra Vegetation Indices were used in spatial panel models to examine the interactions between seasonal vegetation, temperature, and rainfall. Models were run separately for areas with significant cumulative greening and browning, as identified by directional persistence. Results of this study contribute to the understanding of recent vegetation dynamics in Ethiopia and application of modern spatial econometric models to understand the relationship between vegetation health and climate. Specifically, this work aims to determine (1) the seasonal trends in vegetation greenness across Ethiopia since the turn of the century and (2) the effect of temperature and precipitation in areas exhibiting significant change in NDVI.
2. Materials and Methods
2.1. Study Area
Ethiopia lies within the tropics, covering approximately 1.1 million km2. It retains the second-largest population in Africa, approximately 112 million people, the majority of whom are concentrated towards the western highland region. The human–environment interaction is expressed on the landscape by the high percentage of Ethiopians that rely on the agricultural sector, which employs approximately 72% of the population and provides 37% to the gross domestic product [40]. Rapid population growth beginning in the latter part of the 20th century has led to urban development and declining land availability. This has resulted in unsustainable agricultural intensification and other forms of environmental degradation [41,42], which has contributed to diminishing land productivity and altered vegetation composition, particularly in the northern highland region [43,44]. Much of the land is water-limited, with approximately 65% of the country occupied by drylands and only 15.1% of the total land considered arable, much of which is located within the drylands [45,46]. Figure 1 shows the elevation and distribution of land cover classified at a 30 m resolution [47]. The dominant classes present throughout the country include bare soil in the northwest, savanna in the eastern and western lowlands, and cropland in the highlands. Due to the extensive deforestation in the 1900s, forest cover is limited and remains mostly in the southwest [48].
Climate conditions vary considerably across Ethiopia. The mean annual temperature ranges from 15 °C in the highlands to more than 25 °C in the lowlands [49]. Rainfall is predominantly controlled by the displacement of the Intertropical Convergence Zone and associated tropical rain belt, while local relief creates orographic effects in some regions. Mean annual rainfall is more than 2000 mm in the southwestern highlands but accumulates to less than 300 mm in the northwestern lowlands. In addition to spatial inconsistencies in total precipitation, temporal variations exist in the cessation and desiccation of the rainy seasons. The country can be divided into three climatologically similar regions [50]. To the west/northwest of Addis Ababa, a monomodal regime peaks in July/August, known as the Kiremt, which contributes 65–95% of the country’s annual rainfall [51]. The rest of the country receives bimodal rainfall, beginning with the Belg from March to May [52]. Central and eastern Ethiopia receive the second peak during the Kiremt summer rains, while the southernmost region observes the second season in October through December, known as the short rains [50,53]. These conditions lead to inconsistencies in climate-induced vulnerability. High temperatures and prolonged droughts are more common in the lowlands, while the highlands are more likely to suffer from intense and erratic rainfall, both resulting in potential declines of vegetation productivity.
Due to the complex topography of the country, climate change forecasts show wide ranges in possible future rainfall patterns and conflicting projections between models, with some predicting increased rainfall and others a decline. Yet, higher temperatures have already been observed over the last 50 years and climate models show warming during all seasons under multiple scenarios [54]. Current and future climatological changes pose the risk of altering the vegetation in this ecologically precarious region, which could produce cascading effects through the human–environment system. The Intergovernmental Panel on Climate Change reported that effects of climate change have already been exhibited in terrestrial ecosystems and further effects are expected to be substantial [55]. However, the vegetation dynamics and driving forces of change in this region are still not well understood, creating a need for further investigation [2,24].
2.2. Data and Methodological Approach
2.2.1. NDVI Data and Directional Persistence Calculation
The 17-year NDVI time series was created from the MOD13Q1.006 Terra Vegetation Index with a 250 m spatial resolution and is used to derive a metric that identifies the direction of vegetation change over time, specifically, a measure of directional persistence (DP), which describes the change in NDVI compared to a fixed baseline condition. For each pixel, the baseline is calculated as the average seasonal NDVI between 2000 and 2004. Seasons are composed of three-month periods: March, April, May (MAM), June, July, August (JJA), September, October, November (SON), and December, January, February (DJF). The five-year period of 2000 to 2004 was used to capture interannual climate variability that may be caused by global ocean–atmosphere oscillations, as opposed to a single-year baseline that may contain anomalies and inaccurately represent climatic conditions. This baseline average is then compared to the NDVI measured at that pixel in each of the 12 years for every season following the baseline. The metric functions similarly to a random walk and its classic statistical properties of a Bernoulli process; for each year following the baseline, +1 (success) or −1 (failure) is assigned to a pixel, conditional on whether the pixel value is larger or smaller than the baseline value. The expectation is a 0.5 probability of an increase or decrease in NDVI regardless of previous outcomes, which would result in a DP value of 0 and indicate no cumulative change. The summation of the integers assigned to each pixel for the 12-year period is then mapped for individual seasons, revealing the frequency of years where NDVI deviated either above or below the baseline. For a more detailed description of the derivation and creation of this index, refer to Waylen et al. [56].
where Dj is the directional persistence of season j determined by the summation of the 12 ti,j values from 2005 to 2016 and representing the cumulative direction of change. The observed NDVI of a given pixel of year i and season j is given as Vi,j, the baseline NDVI value unique to each season is represented by Vcrit, and ti,j is the integer assigned to each pixel for a given year and season (+/−1). For this study, Dj ranges between +12 and −12, where a +12 (−12) denotes a pixel with higher (lower) NDVI compared to the baseline in every year between 2005–2016.
As explained by Waylen et al. [56], the critical value is a threshold denoting the occurrence of change in NDVI past that which is expected due to random chance. The statistical test applied at each pixel determines where the null hypothesis of no change in DP is rejected, and therefore exhibits significant losses or gains of healthy vegetation. With a sample size of 12 years being compared to the baseline, the critical value of +/−8 is used to distinguish pixels with statistically significant DP, using a two-tailed test and α level of 0.05. That means a pixel must observe ten or more years where NDVI is higher (lower) than the baseline to be considered significant cumulative greening (browning) [57]. This methodology enables spatial and temporal specificity by using values at a pixel level and can detect nonlinear trends, which have been noted as an important factor when examining long-term NDVI [13,58]. The DP metric has been applied to evaluate vegetation characteristics, such as the response of drylands to climate variability, changes in biomass in and around protected areas, and identification of regions vulnerable to anthropogenic and environmental causes of change, phenomena that are critical to socioecological resiliency in coupled natural–human systems [35,36,38,59]. The mapped results of this analysis establish which areas exhibit persistent change in NDVI and should therefore be investigated more closely to identify drivers of the observed vegetation dynamics.
2.2.2. Climatic Data and Spatial Panel Regression Models
To better understand the drivers of vegetation dynamics over the study period, it is necessary to assess the effect of climate on NDVI. While human-induced changes to the landscape are also a major contributing factor in altering vegetation, it is beyond the scope of this study to include anthropogenic indicators. Temperature and precipitation are key factors controlling vegetated land cover, particularly in Sub-Saharan Africa where climate greatly influences the phenology and land use practices [3,60,61]. Monthly rainfall data was collected from the Climate Hazard Group Infrared Precipitation with Station data [39], which combines satellite imagery with a 0.05° resolution and in situ station data. The dataset was designed to aid monitoring of GEC over land and has been validated by Dinku et al. [62] for parts of the study area. Seasonal total rainfall was calculated at each pixel to correspond with the seasons used by DP; however, rainfall was lagged by one month to account for vegetation response time, as is performed for many parts of Sub-Saharan Africa [18,63]. Therefore, total precipitation and DP seasons are represented as follows: (FMA–MAM, MJJ–JJA, ASO–SON, NDJ–DJF). Monthly maximum temperature data was also obtained from the Climate Hazards Center, using the CHIRTmax dataset with a 0.05° spatial resolution [64]. The seasonal average maximum temperature was calculated at a pixel level, though no time lag was incorporated, and seasons correspond to those used for DP. Total rainfall, mean temperature, and mean NDVI were then extracted from pixels classified as vegetated land cover, based on the work of Khatami et al. [47], for pixels where DP showed significant change. This process resulted in data from 1925 points for each year in the 17-year study period, which were further subset by pixels with significant positive and negative DP. Points that exhibited significant positive and negative trends were separated on the basis of potential differences in the mechanisms driving change.
Based on the aforementioned limitations of previous studies described above, a quasi-spatial model using fixed effects (FE) ordinary least squares (OLS) regression, validated by the Hausmann test [65], was developed to investigate the relationship between climate and vegetation. This model includes time and location FE as independent variables, based on year and geographic coordinates.
where denotes the NDVI at point j at time t, is the rainfall at point j at time t, and is the temperature at point j at time t. Time and location fixed effects are represented by and , respectively. Finally, the robust standard error for point j and time t is noted as .
Incorporating location FE has been posited to minimize biases in spatially dependent data, however, most of this work has focused on cross-sectional, rather than panel, datasets [66]. Theoretically, the FE approach captures impacts from unobserved heterogeneity that may otherwise bias the model’s estimates due to correlation between variables and the error term. Time FE () are applied to control for unobservable variables that remain constant across the study site but change over time. The location FE () control for geographically specific time-invariant characteristics, which differ spatially across the sample. This includes geographically distinct characteristics, such as elevation or soil type, which are specific to the observation’s location but would likely not change on the temporal scale of this study. Such characteristics have been noted as important factors driving spatial variability in NDVI [21].
Although the quasi-spatial model enables greater specificity of geographic and temporal characteristics, it does not consider the spatial lag effects from neighboring points, meaning that the quasi-spatial model retains the influence from spillover effects in the error term. This includes the effects of vegetation cover or climate that may impact observations at nearby points, for example, the influence of local hydrologic characteristics. To integrate this spatial relationship, a spatial Durbin panel data model (SDPDM) was used with a K nearest neighbors (KNN) weights matrix.
where denotes the NDVI at point j at time t. Fixed effects are shown with and for time and location. The spillover effects of the dependent variable in neighboring samples are considered by the weight matrix, represented as for the sum of the effect from four KNN. The combined effect of the two independent variables has a parameter designated as , where is the beta value for temperature or rainfall (k) and X is the observed value of variable k at location j for time t. To account for the spillover effects of these independent variables in neighboring observations, the model includes , where is the weights matrix with neighbors (α) for location j, is the coefficient of weighted sums of the neighbors for variable k, and is the observed value for neighbors at time t for variable k.
Li and Xiong [29] describe the benefits of the SDPDM, such as its capacity to incorporate spatial lags from both independent and dependent variables. Additionally, it is suggested to employ the spatial Durbin model as an initial general specification for modeling [67]. The SDPDM utilizes the same time and entity FE as the quasi-spatial model using the approach of Belotti et al. [68]. A range of weights matrices were tested, though only results for four KNN are presented, based on the selection criteria of significance followed in Li and Xiong [29]. Additionally, variogram analyses confirmed a distance of autocorrelation that matches the average distance bands of four KNN.
3. Results
3.1. Directional Persistence Analysis
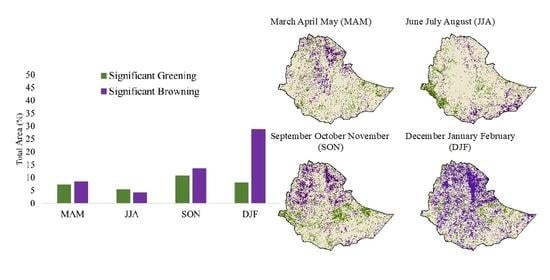
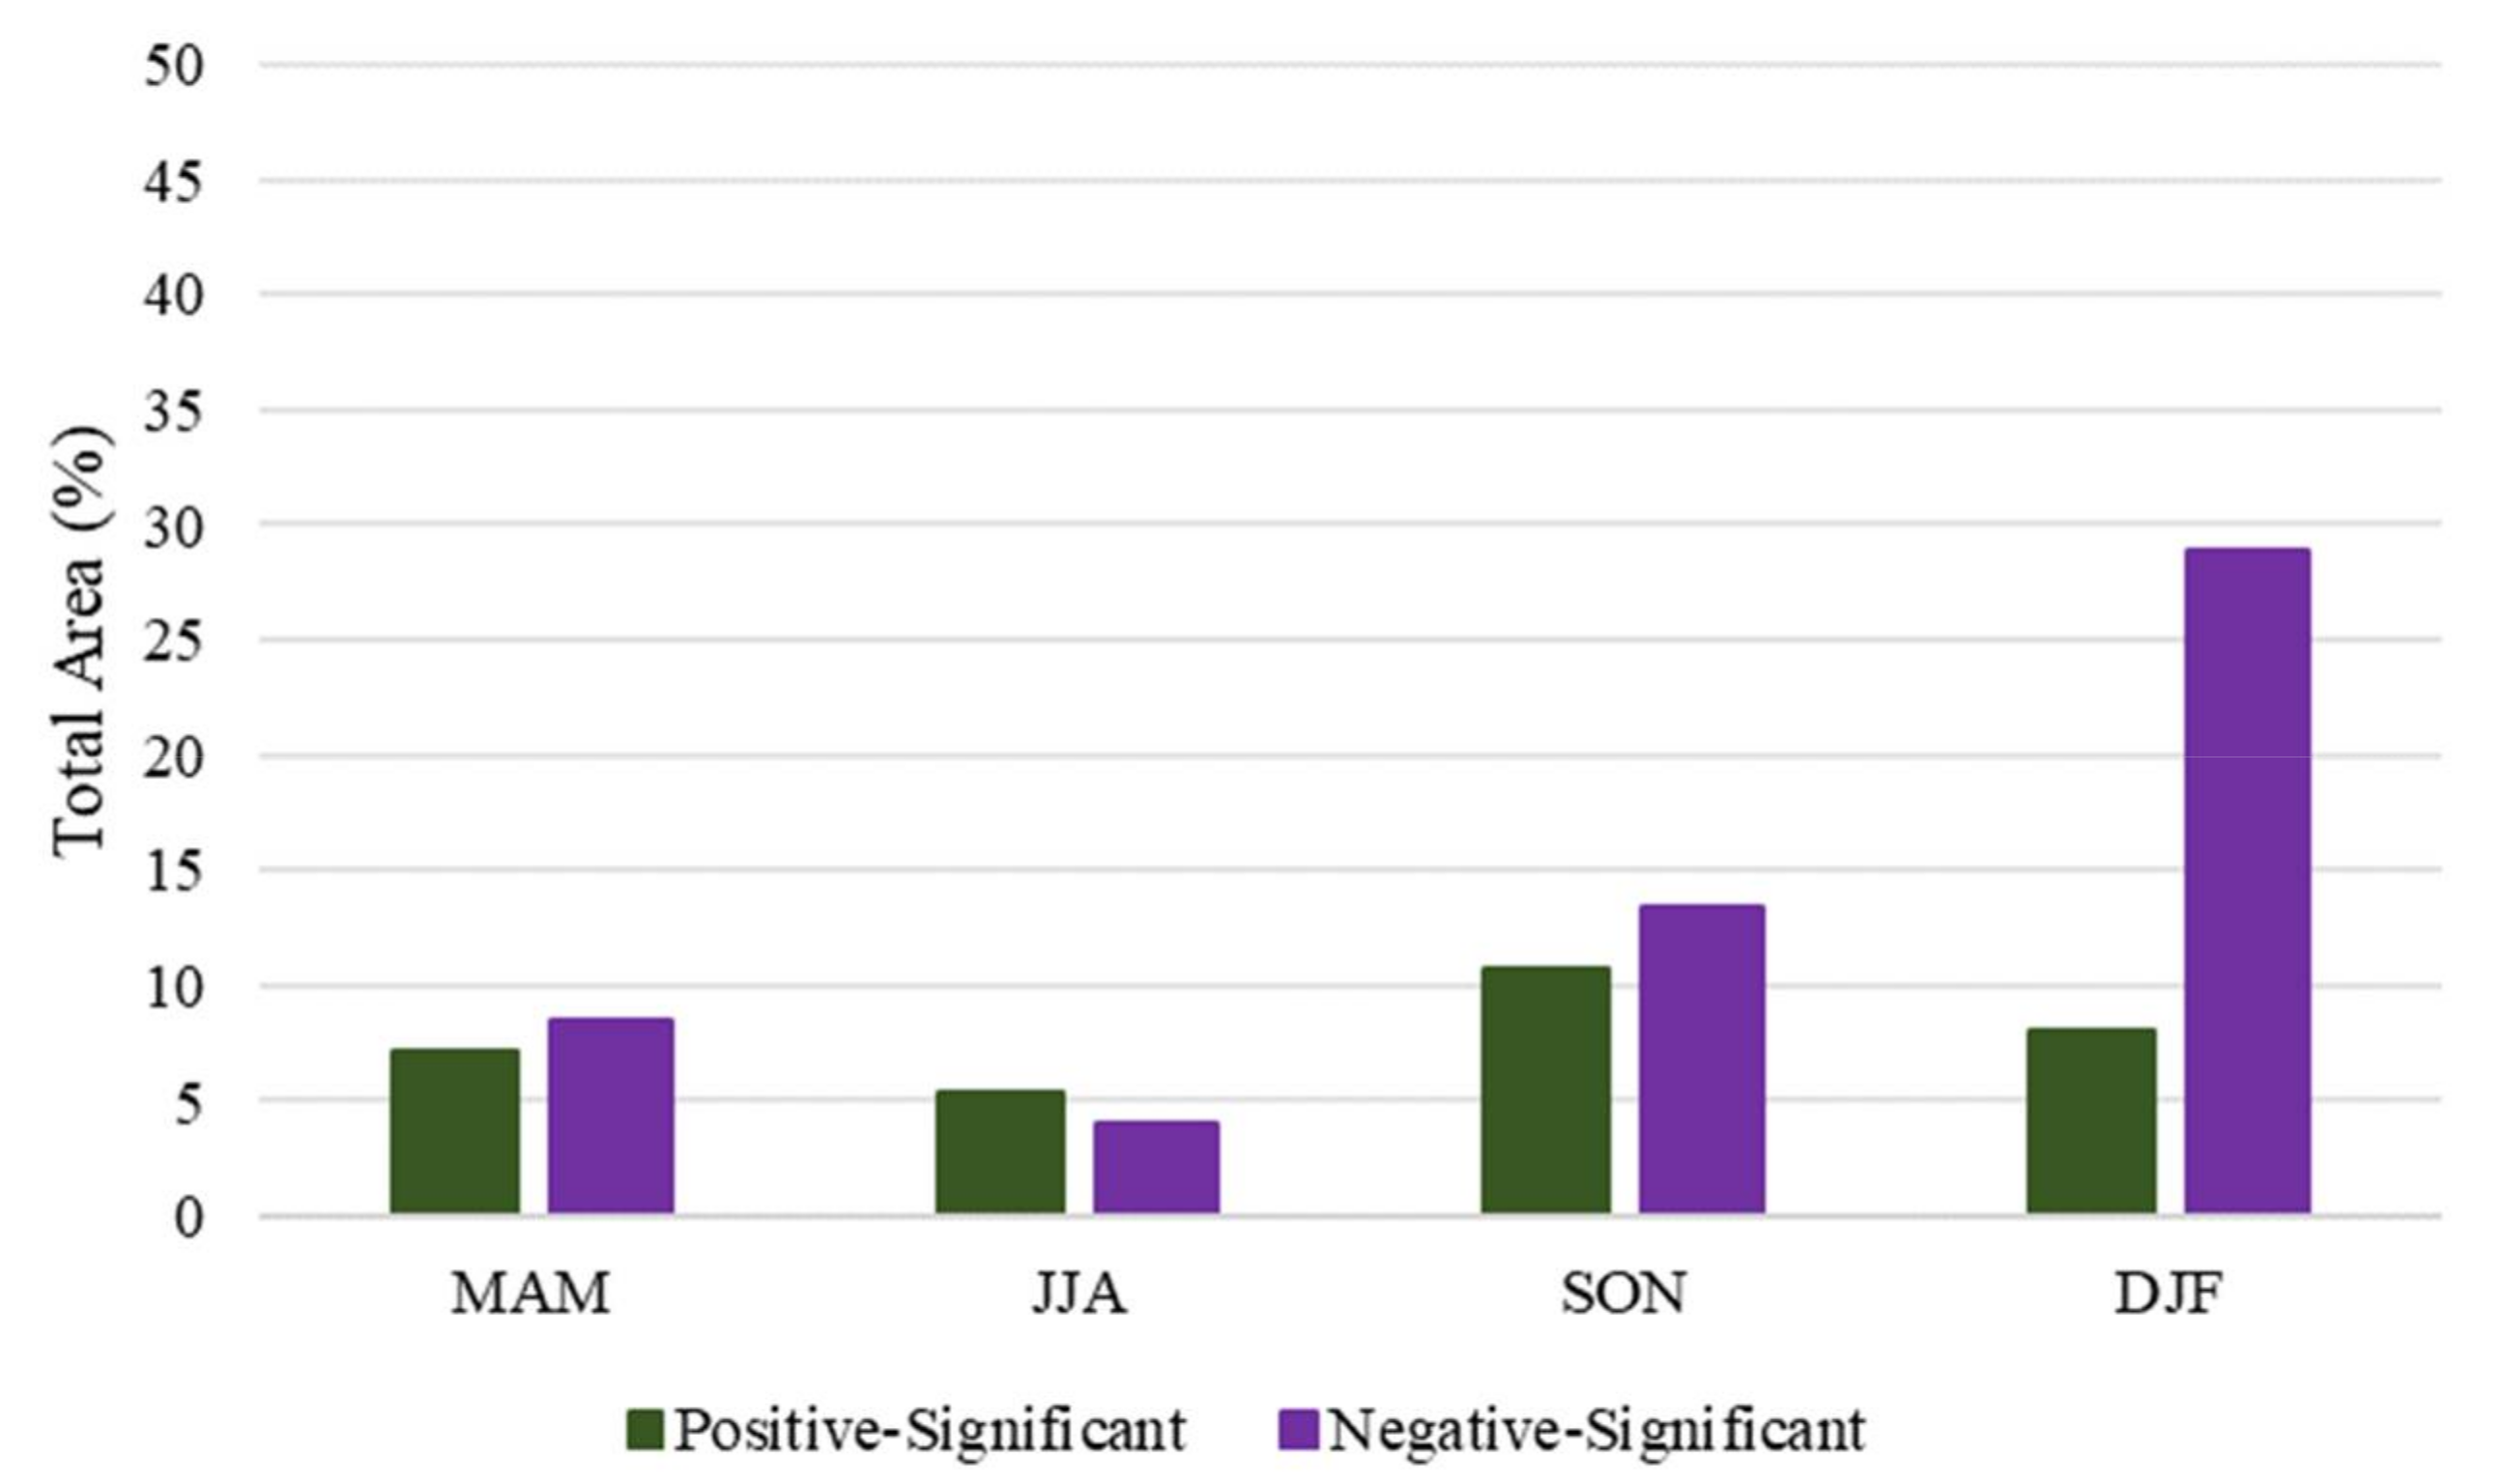
The spatial trends of DP are shown in Figure 2, where green pixels represent significant positive DP or cumulative greening, and purple indicates significant negative DP or cumulative browning. This can be interpreted as pixels where 10 or more years were either above or below the baseline average, respectively. Figure 3 denotes the percent of the total area analyzed where significant change occurred during each season. All seasons exhibit a higher amount of cumulative browning except summer (JJA), where 5.3% of the pixels (64,892 km2) showed positive change. This exception to the generally negative trend may be caused by the high number of pixels omitted due to cloud cover, however, there is a notably strong signature of cumulative greening in the west during this season. The largest extent of significant DP occurred in the dry season (DJF), which showed cumulative browning at 28.9% of pixels (378,170 km2), more than all other seasons combined. This was particularly pronounced in the north along the Afar depression. A similar demarcation of the north is present at the desiccation of the rainy season (SON), as well as a distinct north–south divide. During this season, areas of cumulative greening (browning) are concentrated in the south (north), possibly displaying signatures of the second rainy season.
3.2. Spatial Panel Regression Model
Based on the large extent of significant DP during the dry season (DJF), it was selected to further examine the effect of rainfall and temperature on vegetation greenness. Table 1 provides the coefficient values for the quasi-spatial model and the SDPDM, in addition to a nonspatial OLS model that included only time FE. Both climate variables were used in logarithmic form, and the coefficients should therefore be interpreted as a change in NDVI that is equal to (/100) for every 1% change in the independent variables.
Results across all models indicate that NDVI has a significantly negative and significantly positive correlation to temperature and rainfall, respectively. This trend was consistent across pixels with positive and negative DP, and both samples showed temperature to have higher beta coefficients and a larger effect on vegetation greenness compared to rainfall. The relationship between rainfall and NDVI weakened when the data was analyzed with the spatial models, while effects from temperature increased considerably, suggesting a biased estimation when no spatial variable is considered in the model. Furthermore, comparing the nonspatial OLS and the quasi-spatial OLS, there is a substantial difference in the coefficient of determination, where the latter shows large improvements. However, this value declined in the SDPDM, possibly due to the MLE approach in the XSMLE algorithm, which excludes the FE parameters in its calculations of the coefficient of determination [68]. Nonetheless, beta coefficients from the quasi-spatial model and SDPDM were similar in terms of magnitude, significance, and direction of correlation, though the significant spatial autoregressive parameter (ρ) and partially significant exogenous effects of temperature (θ) highlight the presence of spatial dependence and the need for a spatial model [69].
4. Discussion
Studies of vegetation or cover change often occur at one of two scales, a smaller local case study [8,70,71,72] or a larger multinational or global study [5,13,14,73], and yet for many countries, a national scale understanding is of paramount importance. Without national-level studies, policies are made based on incomplete or geographically limited data [74], whereas national-scale studies provide consistency, enabling a broader understanding that allows policymakers to prescribe more efficient and holistic management decisions, which are commonly made at the national level [75]. Placing the results of this country-level analysis into the context of the existing literature requires synthesis from many local and regional studies [8,9,15,20,76], as national-level studies are less common [24,34]. The disparities in spatial and temporal scales of previous studies reinforces the complexities of synthesis for a region with extraordinarily diverse agroecological conditions, such as Ethiopia. These factors must be carefully considered, given the diverging influence of biophysical variables on NDVI in different seasons and geographic areas [77,78]. Nonetheless, the temporal and spatial nonstationarity between NDVI and climate necessitate replication of correlation analyses across time periods and scales [20].
Broadly, the spatial distribution of cumulative significant change in NDVI as identified by DP corresponds with other findings of recent vegetation dynamics. The areas of cumulative browning are highly concentrated in the northern lowlands and along the Rift Valley, similar to results of Workie and Debella [24], though the time series used in that analysis was not seasonally disaggregated, which may be the reason for a more prominent and extensive signature of cumulative declines in NDVI displayed by DP. The trends of declining NDVI in northern Ethiopia during the dry season also resemble outcomes from small-scale studies within comparable periods [8,20]. The well-established browning trend in the north has likely occurred partly due to the high-intensity land use and consequential soil erosion, but may be exacerbated by the increasing temperature [54,79]. Some localized regions in the north have exhibited increasing NDVI during the dry season in recent decades, specifically the woodlands in the northwest Quara district in Amhara [19], which was supported in the results of this study. Consistent with the results of Liou and Mulualem [34], who observed a positive monotonic trend near Gambela during the growing season between 2001 and 2018, DP confirms widespread cumulative greening in that region during JJA.
With regard to the driving force of climate, results showed that rainfall has a consistently significant positive impact on vegetation greenness, while the opposite is true for temperature. The positive relationship between NDVI and rainfall is in accordance with studies carried out at local to regional scales, although most preface their findings with the presence of spatiotemporal variation. Conversely, the correlation between temperature and NDVI appears to be more conflicting between studies, with reports of positive, negative, and insignificant effects from temperature depending on the region, season, and global climate oscillations [15,19,20,24,34]. Unlike some of the previous studies, results of this analysis revealed temperature, rather than rainfall, to have a larger and more significant effect on NDVI based on regression coefficients. This is particularly crucial given the well-documented increase in temperature occurring in Ethiopia, which has been estimated at 0.28 °C per decade between 1960 and 2006 [33,54]. Furthermore, predictions of future temperature forecast an increase of 1.4 °C to 2.9 °C by the end of the century, relative to historical measures [80], which should worsen the negative trend in NDVI.
Comparing the regression models revealed biased coefficients when no spatial parameter was included in the model, leading to inaccurate estimates for the effects of climate variables and a weakened coefficient of determination. This bias can arise from omitted variables that are correlated with the dependent and independent variables [81]. The relationship between the included and omitted variable results in correlation with the error term and erroneously attributes effects of the omitted variable to those included. For example, geographic characteristics unique to each observation, such as elevation, have been shown to be highly correlated with the climate and vegetation [82,83]. Generally, there is an expectation that rainfall will increase with altitude and temperature will decrease, enabling greater quantities of aboveground biomass and higher NDVI at higher elevations in Ethiopia. This misspecification in the nonspatial model produced an overestimation and underestimation of the effects from rainfall and temperature, respectively. The location-fixed effects in the quasi-spatial model better account for elevation and other unmeasured characteristics specific to geographic location, evidenced by the higher coefficient of determination.
Though large improvements were made by the quasi-spatial model, the potential of spatial dependence and spillover effects should be considered when working with geospatial data. This is factored into the SDPDM, where spatial weights account for the effects on NDVI from the climate and NDVI at neighboring points. Despite the similar coefficients returned by the quasi-spatial model and SDPDM, the significant rho values in the SDPDM indicate the presence of spatial autocorrelation. Based only on the coefficient of determination, the quasi-spatial model appears superior; however, given the default method for calculating this measure in the XSMLE package, the result of the SDPDM may be an underestimation of the actual fit. From the results it appears, in this instance, that the SDPDM is the best choice due to existing spatial dependence; however, this may not hold true across all locations. The regression analyses emphasize the need for further investigation into the possibility of using spatial fixed effects to model spatially dependent observations, a well-known issue associated with geospatial data [84], as the spatial fixed effects may capture the influence from neighboring observations if their impact stays constant over time. Future studies utilizing remotely sensed data should employ a methodological approach that tests data with multiple models, including spatial regression designed to capture spillover effects.
5. Conclusions
Environmental change threatens to alter vegetation in various ways, and in turn produce cascading impacts throughout the Earth’s system. These impacts will manifest as declining ecosystem services, such as water resource availability and carbon sequestration, which will be reflected in human wellbeing [5]. Prediction and mitigation of adverse consequences is dependent upon our ability to accurately assess vegetation dynamics, as it often marks larger changes in Earth’s system [2]. This includes consistent observation of vegetation health and its connections to environmental controls such as climate. Vegetation and climatological trends have been examined across much of Africa, a region particularly vulnerable to environmental change, where findings have revealed the occurrence of a complex and dynamic process. Many studies report trends that are regionally specific, nonstationary, and driven by natural and anthropogenic processes at varying degrees. Efforts to address the issues of vegetation dynamics and environmental change beginning at the turn of the century [3] have been greatly facilitated by remote-sensing technologies that allow analysis at large spatial scales. However, the full extent of the relationship between vegetation and climatic drivers remains uncertain for many regions [76].
This work uses the directional persistence metric to establish recent trends in seasonal NDVI across Ethiopia, a country that still lacks in-depth analysis of vegetation dynamics and the connection to climate [20,24]. The metric identifies pixels with significant cumulative greening and browning since the turn of the century, including instances of weak or nonlinear change. Results showed a higher (lower) prevalence of cumulative browning (greening) during most seasons within the study period. This was especially evident during the dry season (DJF), which experienced the greatest extent of significant change. Much of the cumulative browning was concentrated in the northern lowlands and along the Rift Valley, a region that has been noted as an area of concern for environmental degradation. However, the incidence of cumulative greening is spatially clustered, in agreement with the findings of previous small-scale studies [19,34].
For further evaluation of ways climate may be driving the exhibited vegetation change, this study employed spatial panel regression analyses with seasonal measures of NDVI, temperature, and rainfall. Data was modeled using observations from the dry season (DJF) and separately for vegetated pixels that exhibited significant declines and increases in NDVI based on DP. Model outputs indicate that temperature has a larger and negative effect on vegetation greenness, while the impact from rainfall was weaker and positive. These results suggest a potentially more negative outcome to vegetation due to a change in temperature, as opposed to rainfall, and demonstrate the significance of considering the threat from rising temperatures for policy decisions and mitigation efforts.
Author Contributions
This paper was conceptualized by C.M. and J.S. Curation of the directional persistence metric and acquisition of vegetation index data was completed by R.K. and H.H. Climate data was acquired by C.M. Formal analysis with the panel regression models was performed by B.A. and C.M. Funding acquisition is from J.S. This article was written by C.M. and edited by J.S., R.K., B.A. and H.H. All authors contributed to the writing and editing of this article. All authors have read and agreed to the published version of the manuscript.
Funding
This research was funded by the National Science Foundation’s program for Dynamics of Coupled Natural and Human Systems, grant number 1,617,364.
Institutional Review Board Statement
Not applicable.
Informed Consent Statement
Not applicable.
Data Availability Statement
The data presented in this study are openly available through the Climate Hazards Center and the National Aeronautics Space Agency’s Land Processes Distributed Active Archive Center.
Acknowledgments
The authors would like to gratefully acknowledge the financial support of the National Science Foundation.
Conflicts of Interest
The authors declare no conflict of interest. The funders had no role in the design of the study; in the collection, analyses, or interpretation of data; in the writing of the manuscript, or in the decision to publish the results.
References
- Roerink, G.J.; Menenti, M.; Soepboer, W.; Su, Z. Assessment of climate impact on vegetation dynamics by using remote sensing. Appl. Quant. Remote Sens. Hydrol. 2003, 28, 103–109. [Google Scholar] [CrossRef]
- Wei, F.; Wang, S.; Fu, B.; Pan, N.; Feng, X.; Zhao, W.; Wang, C. Vegetation dynamic trends and the main drivers detected using the ensemble empirical mode decomposition method in East Africa. Land Degrad. Dev. 2018, 29, 2542–2553. [Google Scholar] [CrossRef]
- Scheiter, S.; Higgins, S.I. Impacts of climate change on the vegetation of Africa: An adaptive dynamic vegetation modelling approach. Glob. Chang. Biol. 2009, 15, 2224–2246. [Google Scholar] [CrossRef]
- Serdeczny, O.; Adams, S.; Baarsch, F.; Coumou, D.; Robinson, A.; Hare, W.; Schaeffer, M.; Perrette, M.; Reinhardt, J. Climate change impacts in Sub-Saharan Africa: From physical changes to their social repercussions. Reg. Environ. Chang. 2017, 17, 1585–1600. [Google Scholar] [CrossRef]
- Gonzalez, P.; Neilson, R.P.; Lenihan, J.M.; Drapek, R.J. Global patterns in the vulnerability of ecosystems to vegetation shifts due to climate change. Glob. Ecol. Biogeogr. 2010, 19, 755–768. [Google Scholar] [CrossRef]
- Mwendwa, M.; Begashaw, B. Drylands of Africa Pose Unique Challenge to Achieving MDGs; Columbia Cimate School: New York, NY, USA, 2021. [Google Scholar]
- Chamberlin, J.; Jayne, T.S.; Headey, D. Scarcity amidst abundance? Reassessing the potential for cropland expansion in Africa. Food Policy 2014, 48, 51–65. [Google Scholar] [CrossRef] [Green Version]
- Zewdie, W.; Csaplovics, E.; Inostroza, L. Monitoring ecosystem dynamics in northwestern Ethiopia using NDVI and climate variables to assess long term trends in dryland vegetation variability. Appl. Geogr. 2017, 79, 167–178. [Google Scholar] [CrossRef]
- Cerretelli, S.; Poggio, L.; Gimona, A.; Yakob, G.; Boke, S.; Habte, M.; Coull, M.; Peressotti, A.; Black, H. Spatial assessment of land degradation through key ecosystem services: The role of globally available data. Sci. Total Environ. 2018, 628, 539–555. [Google Scholar] [CrossRef] [PubMed]
- Dardel, C.; Kergoat, L.; Hiernaux, P.; Mougin, E.; Grippa, M.; Tucker, C.J. Re-greening Sahel: 30 years of remote sensing data and field observations (Mali, Niger). Remote Sens. Environ. 2014, 140, 350–364. [Google Scholar] [CrossRef]
- Herrmann, S.M.; Anyamba, A.; Tucker, C.J. Recent trends in vegetation dynamics in the African Sahel and their relationship to climate. Glob. Environ. Chang. 2005, 15, 394–404. [Google Scholar] [CrossRef]
- Hickler, T.; Eklundh, L.; Seaquist, J.W.; Smith, B.; Ardö, J.; Olsson, L.; Sykes, M.T.; Sjöström, M. Precipitation controls Sahel greening trend. Geophys. Res. Lett. 2005, 32, 1–4. [Google Scholar] [CrossRef]
- Pan, N.; Feng, X.; Fu, B.; Wang, S.; Ji, F.; Pan, S. Increasing global vegetation browning hidden in overall vegetation greening: Insights from time-varying trends. Remote Sens. Environ. 2018, 214, 59–72. [Google Scholar] [CrossRef]
- Yang, Y.; Wang, S.; Bai, X.; Tan, Q.; Li, Q.; Wu, L.; Tian, S.; Hu, Z.; Li, C.; Deng, Y. Factors Affecting Long-Term Trends in Global NDVI. Forests 2019, 10, 372. [Google Scholar] [CrossRef] [Green Version]
- Kalisa, W.; Igbawua, T.; Henchiri, M.; Ali, S.; Zhang, S.; Bai, Y.; Zhang, J. Assessment of climate impact on vegetation dynamics over East Africa from 1982 to 2015. Sci. Rep. 2019, 9, 16865. [Google Scholar] [CrossRef] [Green Version]
- Camberlin, P.; Martiny, N.; Philippon, N.; Richard, Y. Determinants of the interannual relationships between remote sensed photosynthetic activity and rainfall in tropical Africa. Remote Sens. Environ. 2007, 106, 199–216. [Google Scholar] [CrossRef] [Green Version]
- Liu, Y.; Li, Y.; Li, S.; Motesharrei, S. Spatial and Temporal Patterns of Global NDVI Trends: Correlations with Climate and Human Factors. Remote Sens. 2015, 7, 13233–13250. [Google Scholar] [CrossRef] [Green Version]
- Jamali, S.; Seaquist, J.; Ardö, J.; Eklundh, L. Investigating temporal relationships between rainfall, soil moisture and MODIS-derived NDVI and EVI for six sites in Africa. In Proceedings of the 34th International Symposium on Remote Sensing of Environment, Sydney, Australia, 10–15 April 2011. [Google Scholar]
- Mucheye, T.; Tebkew, M.; Mariam, Y.G.; Abich, A. Long-term dynamics of woodland vegetation with response of climate variability in the lowlands of north western part of Ethiopia. Environ. Dev. Sustain. 2020, 23, 123–132. [Google Scholar] [CrossRef]
- Siyum, Z.; Ayoade, L.O.; Onilude, M.A.; Feyissa, M. Analysis of Vegetation Dynamics and Responses to Inter-annual Changes of Climatic Variables in Dry Afromontane Forest Fragments, Northern Ethiopia. Am. J. Geogr. Inf. Syst. 2018, 7, 133–144. [Google Scholar]
- Chamaille-Jammes, S.; Fritz, H.; Murindagomo, F. Spatial patterns of the NDVI-rainfall relationship at the seasonal and interannual time scales in an African savanna. Int. J. Remote Sens. 2006, 27, 5185–5200. [Google Scholar] [CrossRef]
- Davenport, M.L.; Nicholson, S.E. On the Relation between Rainfall and the Normalized Difference Vegetation Index for Diverse Vegetation Types in East-Africa. Int. J. Remote Sens. 1993, 14, 2369–2389. [Google Scholar] [CrossRef]
- Zoungrana, B.J.-B.; Conrad, C.; Amekudzi, L.K.; Thiel, M.; Da, E.D. Land Use/Cover Response to Rainfall Variability: A Comparing Analysis between NDVI and EVI in the Southwest of Burkina Faso. Climate 2015, 3, 63–77. [Google Scholar] [CrossRef] [Green Version]
- Workie, T.G.; Debella, H.J. Climate change and its effects on vegetation phenology across ecoregions of Ethiopia. Glob. Ecol. Conserv. 2018, 13, e00366. [Google Scholar] [CrossRef]
- Li, S.; Xie, Y.; Brown, D.G.; Bai, Y.; Hua, J.; Judd, K. Spatial variability of the adaptation of grassland vegetation to climatic change in Inner Mongolia of China. Appl. Geogr. 2013, 43, 1–12. [Google Scholar] [CrossRef]
- Foody, G.M. Geographical weighting as a further refinement to regression modelling: An example focused on the NDVI-rainfall relationship. Remote Sens. Environ. 2003, 88, 283–293. [Google Scholar] [CrossRef]
- Georganos, S.; Abdi, A.M.; Tenenbaum, D.E.; Kalogirou, S. Examining the NDVI-rainfall relationship in the semi-arid Sahel using geographically weighted regression. J. Arid. Environ. 2017, 146, 64–74. [Google Scholar] [CrossRef]
- Ji, L.; Peters, A.J. A spatial regression procedure for evaluating the relationship between AVHRR-NDVI and climate in the northern Great Plains. Int. J. Remote Sens. 2004, 25, 297–311. [Google Scholar] [CrossRef]
- Li, Y.; Xiong, W. A spatial panel data analysis of China’s urban land expansion, 2004–2014. Pap. Reg. Sci. 2019, 98, 393–407. [Google Scholar] [CrossRef] [Green Version]
- Miller-Rushing, A.J.; Inouye, D.W.; Primack, R.B. How well do first flowering dates measure plant responses to climate change? The effects of population size and sampling frequency. J. Ecol. 2008, 96, 1289–1296. [Google Scholar] [CrossRef]
- Seto, K.C.; Kaufmann, R.K. Modeling the drivers of urban land use change in the Pearl River Delta, China: Integrating remote sensing with socioeconomic data. Land Econ. 2003, 79, 106–121. [Google Scholar] [CrossRef] [Green Version]
- Byerlee, D.; Spielman, D.; Alemu, D.; Gautam, M. Policies to Promote Cereal Intensification in Ethiopia: A Review of Evidence and Experience; International Food and Policy Research Institute: Washington, DC, USA, 2007. [Google Scholar]
- Simane, B.; Beyene, H.; Deressa, W.; Kumie, A.; Berhane, K.; Samet, J. Review of Climate Change and Health in Ethiopia: Status and Gap Analysis. Ethiop. J. Health Dev. 2016, 30, 28–41. [Google Scholar]
- Liou, Y.-A.; Mulualem, G.M. Spatio-temporal Assessment of Drought in Ethiopia and the Impact of Recent Intense Droughts. Remote Sens. 2019, 11, 1828. [Google Scholar] [CrossRef] [Green Version]
- Bunting, E.L.; Southworth, J.; Herrero, H.; Ryan, S.J.; Waylen, P. Understanding Long-Term Savanna Vegetation Persistence across Three Drainage Basins in Southern Africa. Remote Sens. 2018, 10, 1013. [Google Scholar] [CrossRef] [Green Version]
- Herrero, H.; Waylen, P.; Southworth, J.; Khatami, R.; Yang, D.; Child, B. A Healthy Park Needs Healthy Vegetation: The Story of Gorongosa National Park in the 21st Century. Remote Sens. 2020, 12, 476. [Google Scholar] [CrossRef] [Green Version]
- Southworth, J.; Zhu, L.; Bunting, E.; Ryan, S.J.; Herrero, H.; Waylen, P.R.; Hill, M.J. Changes in vegetation persistence across global savanna landscapes, 1982–2010. J. Land Use Sci. 2016, 11, 7–32. [Google Scholar] [CrossRef]
- Tsai, H.; Southworth, J.; Waylen, P. Spatial persistence and temporal patterns in vegetation cover across Florida, 1982–2006. Phys. Geogr. 2014, 35, 151–180. [Google Scholar] [CrossRef]
- Funk, C.; Michaelsen, J.; Marshall, M. Mapping Recent Decadal Climate Variations in Precipitation and Temperature across Eastern Africa and the Sahel; Wardlow, B., Anderson, M., Verdin, J., Eds.; CRC Press: Boca Raton, FL, USA, 2012. [Google Scholar]
- FAO. Small Family Farms; Food and Agriculture Organization of the United Nationas: Rome, Italy, 2018. [Google Scholar]
- Ayele, E.G.; Tebeje, A.; Demissie, S.; Belete, M.; Jemberrie, M.; Teshome, W.; Megistu, D.; Teshale, E. Time Series Land Cover Mapping and Change Detection Analysis Using Geographic Information System and Remote Sensing, Northern Ethiopia. Air Soil Water Res. 2018, 11, 1–18. [Google Scholar] [CrossRef] [Green Version]
- Tolessa, T.; Senbeta, F.; Kidane, M. The impact of land use/land cover change on ecosystem services in the central highlands of Ethiopia. Ecosyst. Serv. 2017, 23, 47–54. [Google Scholar] [CrossRef]
- Gashaw, T.; Bantider, A.; Silassie, H.G. Land degradation in Ethiopia: Causes, impacts and rehabilitation techniques. J. Environ. Earth Sci. 2014, 4, 98–104. [Google Scholar]
- Tesfahunegn, G.B. Farmers’ perception on land degradation in northern Ethiopia: Implication for developing sustainable land management. Soc. Sci. J. 2019, 56, 268–287. [Google Scholar] [CrossRef]
- Biazin, B.; Sterk, G. Drought vulnerability drives land-use and land cover changes in the Rift Valley dry lands of Ethiopia. Agric. Ecosyst. Environ. 2013, 164, 100–113. [Google Scholar] [CrossRef]
- World Bank. Arable Land (% of Land Area)–Ethiopia|Data; World Bank: Washington, DC, USA, 2021. [Google Scholar]
- Khatami, R.; Southworth, J.; Muir, C.; Caughlin, T.; Ayana, A.N.; Brown, D.G.; Liao, C.; Agrawal, A. Operational Large-Area Land-Cover Mapping: An Ethiopia Case Study. Remote Sens. 2020, 12, 954. [Google Scholar] [CrossRef] [Green Version]
- Gebru, T. Deforestation in Ethiopia: Causes, impacts, and remedy. Int. J. Eng. Dev. Res. 2016, 4, 204. [Google Scholar]
- Shekuru, A.H.; Berlie, A.B.; Bizuneh, Y.K. Variability and Trends of Temperature and Rainfall over Three Agro-Ecological Zones in North Shewa, Central Ethiopia. 2020. Available online: https://www.researchsquare.com/article/rs-53268/v1 (accessed on 25 June 2021).
- Diro, G.T.; Black, E.; Grimes, D.I.F. Seasonal forecasting of Ethiopian spring rains. Meteorol. Appl. 2008, 15, 73–83. [Google Scholar] [CrossRef]
- Wagesho, N.; Goel, N.K.; Jain, M.K. Temporal and spatial variability of annual and seasonal rainfall over Ethiopia. Hydrol. Sci. J. 2013, 58, 354–373. [Google Scholar] [CrossRef]
- Seleshi, Y.; Zanke, U. Recent changes in rainfall and rainy days in Ethiopia. Int. J. Climatol. 2004, 24, 973–983. [Google Scholar] [CrossRef]
- Lyon, B. Seasonal Drought in the Greater Horn of Africa and Its Recent Increase during the March May Long Rains. J. Clim. 2014, 27, 7953–7975. [Google Scholar] [CrossRef]
- Conway, D.; Schipper, E.L.F. Adaptation to climate change in Africa: Challenges and opportunities identified from Ethiopia. Glob. Environ. Chang. 2011, 21, 227–237. [Google Scholar] [CrossRef]
- Niang, I.; Ruppel, O.C.; Abdrabo, M.A.; Essel, A.; Lennard, C.; Padgham, J.; Urquhart, P. Climate Change 2014: Impacts, Adaptation, and Vulnerability. Part B: Regional Aspects. Contribution of Working Group II to the Fifth Assessment Report of the Intergovernmental Panel on Climate Change; Cambridge University Press: Cambridge, UK; New York, NY, USA, 2014. [Google Scholar]
- Waylen, P.; Southworth, J.; Gibbes, C.; Tsai, H. Time Series Analysis of Land Cover Change: Developing Statistical Tools to Determine Significance of Land Cover Changes in Persistence Analyses. Remote Sens. 2014, 6, 4473–4497. [Google Scholar] [CrossRef] [Green Version]
- Herrero, H.; Southworth, J.; Muir, C.; Khatami, R.; Bunting, E.; Child, B. An Evaluation of Vegetation Health in and around Southern African National Parks during the 21st Century (2000–2016). Appl. Sci. 2020, 10, 2366. [Google Scholar] [CrossRef] [Green Version]
- Forkel, M.; Carvalhais, N.; Verbesselt, J.; Mahecha, M.D.; Neigh, C.S.R.; Reichstein, M. Trend Change Detection in NDVI Time Series: Effects of Inter-Annual Variability and Methodology. Remote Sens. 2013, 5, 2113–2144. [Google Scholar] [CrossRef] [Green Version]
- Gibbes, C.; Southworth, J.; Waylen, P.; Child, B. Climate variability as a dominant driver of post-disturbance savanna dynamics. Appl. Geogr. 2014, 53, 389–401. [Google Scholar] [CrossRef]
- Fuller, D.O.; Prince, S.D. Rainfall and foliar dynamics in tropical southern Africa: Potential impacts of global climatic change on savanna vegetation. Clim. Chang. 1996, 33, 69–96. [Google Scholar] [CrossRef]
- Nicholson, S.E. Climatic and environmental change in Africa during the last two centuries. Clim. Res. 2001, 17, 123–144. [Google Scholar] [CrossRef] [Green Version]
- Dinku, T.; Funk, C.; Peterson, P.; Maidment, R.; Tadesse, T.; Gadain, H.; Ceccato, P. Validation of the CHIRPS satellite rainfall estimates over eastern Africa. Q. J. R. Meteorol. Soc. 2018, 144, 292–312. [Google Scholar] [CrossRef] [Green Version]
- Rousvel, S.; Armand, N.; Andre, L.; Tengeleng, S.; Alain, T.S.; Armel, K. Comparison between Vegetation and Rainfall of Bioclimatic Ecoregions in Central Africa. Atmosphere 2013, 4, 411–427. [Google Scholar] [CrossRef] [Green Version]
- Funk, C.; Peterson, P.; Peterson, S.; Shukla, S.; Davenport, F.; Michaelsen, J.; Knapp, K.R.; Landsfeld, M.; Husak, G.; Harrison, L.; et al. A High-Resolution 1983-2016 T-max Climate Data Record Based on Infrared Temperatures and Stations by the Climate Hazard Center. J. Clim. 2019, 32, 5639–5658. [Google Scholar] [CrossRef]
- Elhorst, J.P. Specification and estimation of spatial panel data models. Int. Reg. Sci. Rev. 2003, 26, 244–268. [Google Scholar] [CrossRef]
- Debarsy, N.; Ertur, C. Testing for spatial autocorrelation in a fixed effects panel data model. Reg. Sci. Urban Econ. 2010, 40, 453–470. [Google Scholar] [CrossRef] [Green Version]
- LeSage, J.P.; Pace, R.K. Spatial Econometric Models; Taylor and Francis: London, UK, 2009. [Google Scholar]
- Belotti, F.; Hughes, G.; Mortari, A.P. Spatial panel-data models using Stata. Stata J. 2017, 17, 139–180. [Google Scholar] [CrossRef] [Green Version]
- Golgher, A.B.; Voss, P.R. How to Interpret the Coefficients of Spatial Models: Spillovers, Direct and Indirect Effects. Spat. Demogr. 2016, 4, 175–205. [Google Scholar] [CrossRef]
- Chiemela, S.N.; Noulekoun, F.; Zenebe, A.; Abadi, N.; Birhane, E. Transformation of degraded farmlands to agroforestry in Zongi Village, Ethiopia. Agrofor. Syst. 2018, 92, 1317–1328. [Google Scholar] [CrossRef]
- Emiru, H.; Mohammed, A. Anthropogenic impact on land use land cover: Influence on weather and vegetation in Bambasi Wereda, Ethiopia. Spat. Inf. Res. 2018, 26, 427. [Google Scholar] [CrossRef]
- Etefa, G.; Frankl, A.; Lanckriet, S.; Biadgilgn, D.; Gebreyohannes, Z.; Amanuel, Z.; Poesen, J.; Nyssen, J. Changes in land use/cover mapped over 80 years in the Highlands of Northern Ethiopia. J. Geogr. Sci. 2018, 28, 1538–1563. [Google Scholar] [CrossRef] [Green Version]
- Song, X.-P.; Hansen, M.C.; Stehman, S.V.; Potapov, P.V.; Tyukavina, A.; Vermote, E.F.; Townshend, J.R. Global land change from 1982 to 2016. Nature 2018, 560, 639–643. [Google Scholar] [CrossRef]
- Kassawmar, T.; Zeleke, G.; Bantider, A.; Gessesse, G.D.; Abraha, L. A synoptic land change assessment of Ethiopia’s Rainfed Agricultural Area for evidence-based agricultural ecosystem management. Heliyon 2018, 4, e00914. [Google Scholar] [CrossRef] [Green Version]
- Xu, Z.; Tang, Y.; Connor, T.; Li, D.; Li, Y.; Liu, J. Climate variability and trends at a national scale. Sci. Rep. 2017, 7, 3258. [Google Scholar] [CrossRef]
- Hawinkel, P.; Thiery, W.; Lhermitte, S.; Swinnen, E.; Verbist, B.; van Orshoven, J.; Muys, B. Vegetation response to precipitation variability in East Africa controlled by biogeographical factors. J. Geophys. Res. Biogeosci. 2016, 121, 2422–2444. [Google Scholar] [CrossRef] [Green Version]
- Campo-Bescós, M.A.; Muñoz-Carpena, R.; Kaplan, D.A.; Southworth, J.; Zhu, L.; Waylen, P.R. Beyond Precipitation: Physiographic Gradients Dictate the Relative Importance of Environmental Drivers on Savanna Vegetation. PLoS ONE 2013, 8, e72348. [Google Scholar] [CrossRef]
- Piedallu, C.; Chéret, V.; Denux, J.P.; Perez, V.; Azcona, J.S.; Seynave, I.; Gégout, J.C. Soil and climate differently impact NDVI patterns according to the season and the stand type. Sci. Total Environ. 2019, 651, 2874–2885. [Google Scholar] [CrossRef] [PubMed]
- Olsson, L.; Barbosa, H.; Bhadwal, S.; Cowie, A.; Delusca, K.; Flores-Renteria, D.; Hermans, K.; Jobbagy, E.; Kurz, W.; Li, D.; et al. Climate Change and Land: An IPCC Special Report on Climate Change, Desertification, Land Degradation, Sustainable Land Management, Food Security, and Greenhouse Gas Fluxes in Terrestrial Ecosystems. 2019. Available online: https://www.ipcc.ch/srccl/ (accessed on 18 May 2021).
- World Bank. Ethiopia–A Country Study on the Economic Impacts of Climate Change; The World Bank: Washington, DC, USA, 2008. [Google Scholar]
- Sessions, D.N.; Stevans, L.K. Investigating omitted variable bias in regression parameter estimation: A genetic algorithm approach. Comput. Stat. Data Anal. 2006, 50, 2835–2854. [Google Scholar] [CrossRef]
- Asefa, M.; Cao, M.; He, Y.; Mekonnen, E.; Song, X.; Yang, J. Ethiopian vegetation types, climate and topography. Plant Divers. 2020, 42, 302–311. [Google Scholar] [CrossRef] [PubMed]
- UNFCCC. Ethiopia’s Second National Communication to the United Nations Framework Convention on Climate Change; Ministry of Environment and Forest: Addis Ababa, Ethiopia, 2015. [Google Scholar]
- Griffith, D.A.; Chun, Y. Spatial Autocorrelation and Uncertainty Associated with Remotely-Sensed Data. Remote Sens. 2016, 8, 535. [Google Scholar] [CrossRef] [Green Version]
Figure 1.
(a) Land cover of Ethiopia for 2017 based on Landsat 30 m resolution imagery from Khatami et al. [47] and (b) shaded relief and elevation in meters above sea level measured from the Shuttle Radar Topography Mission (SRTM).
Figure 1.
(a) Land cover of Ethiopia for 2017 based on Landsat 30 m resolution imagery from Khatami et al. [47] and (b) shaded relief and elevation in meters above sea level measured from the Shuttle Radar Topography Mission (SRTM).
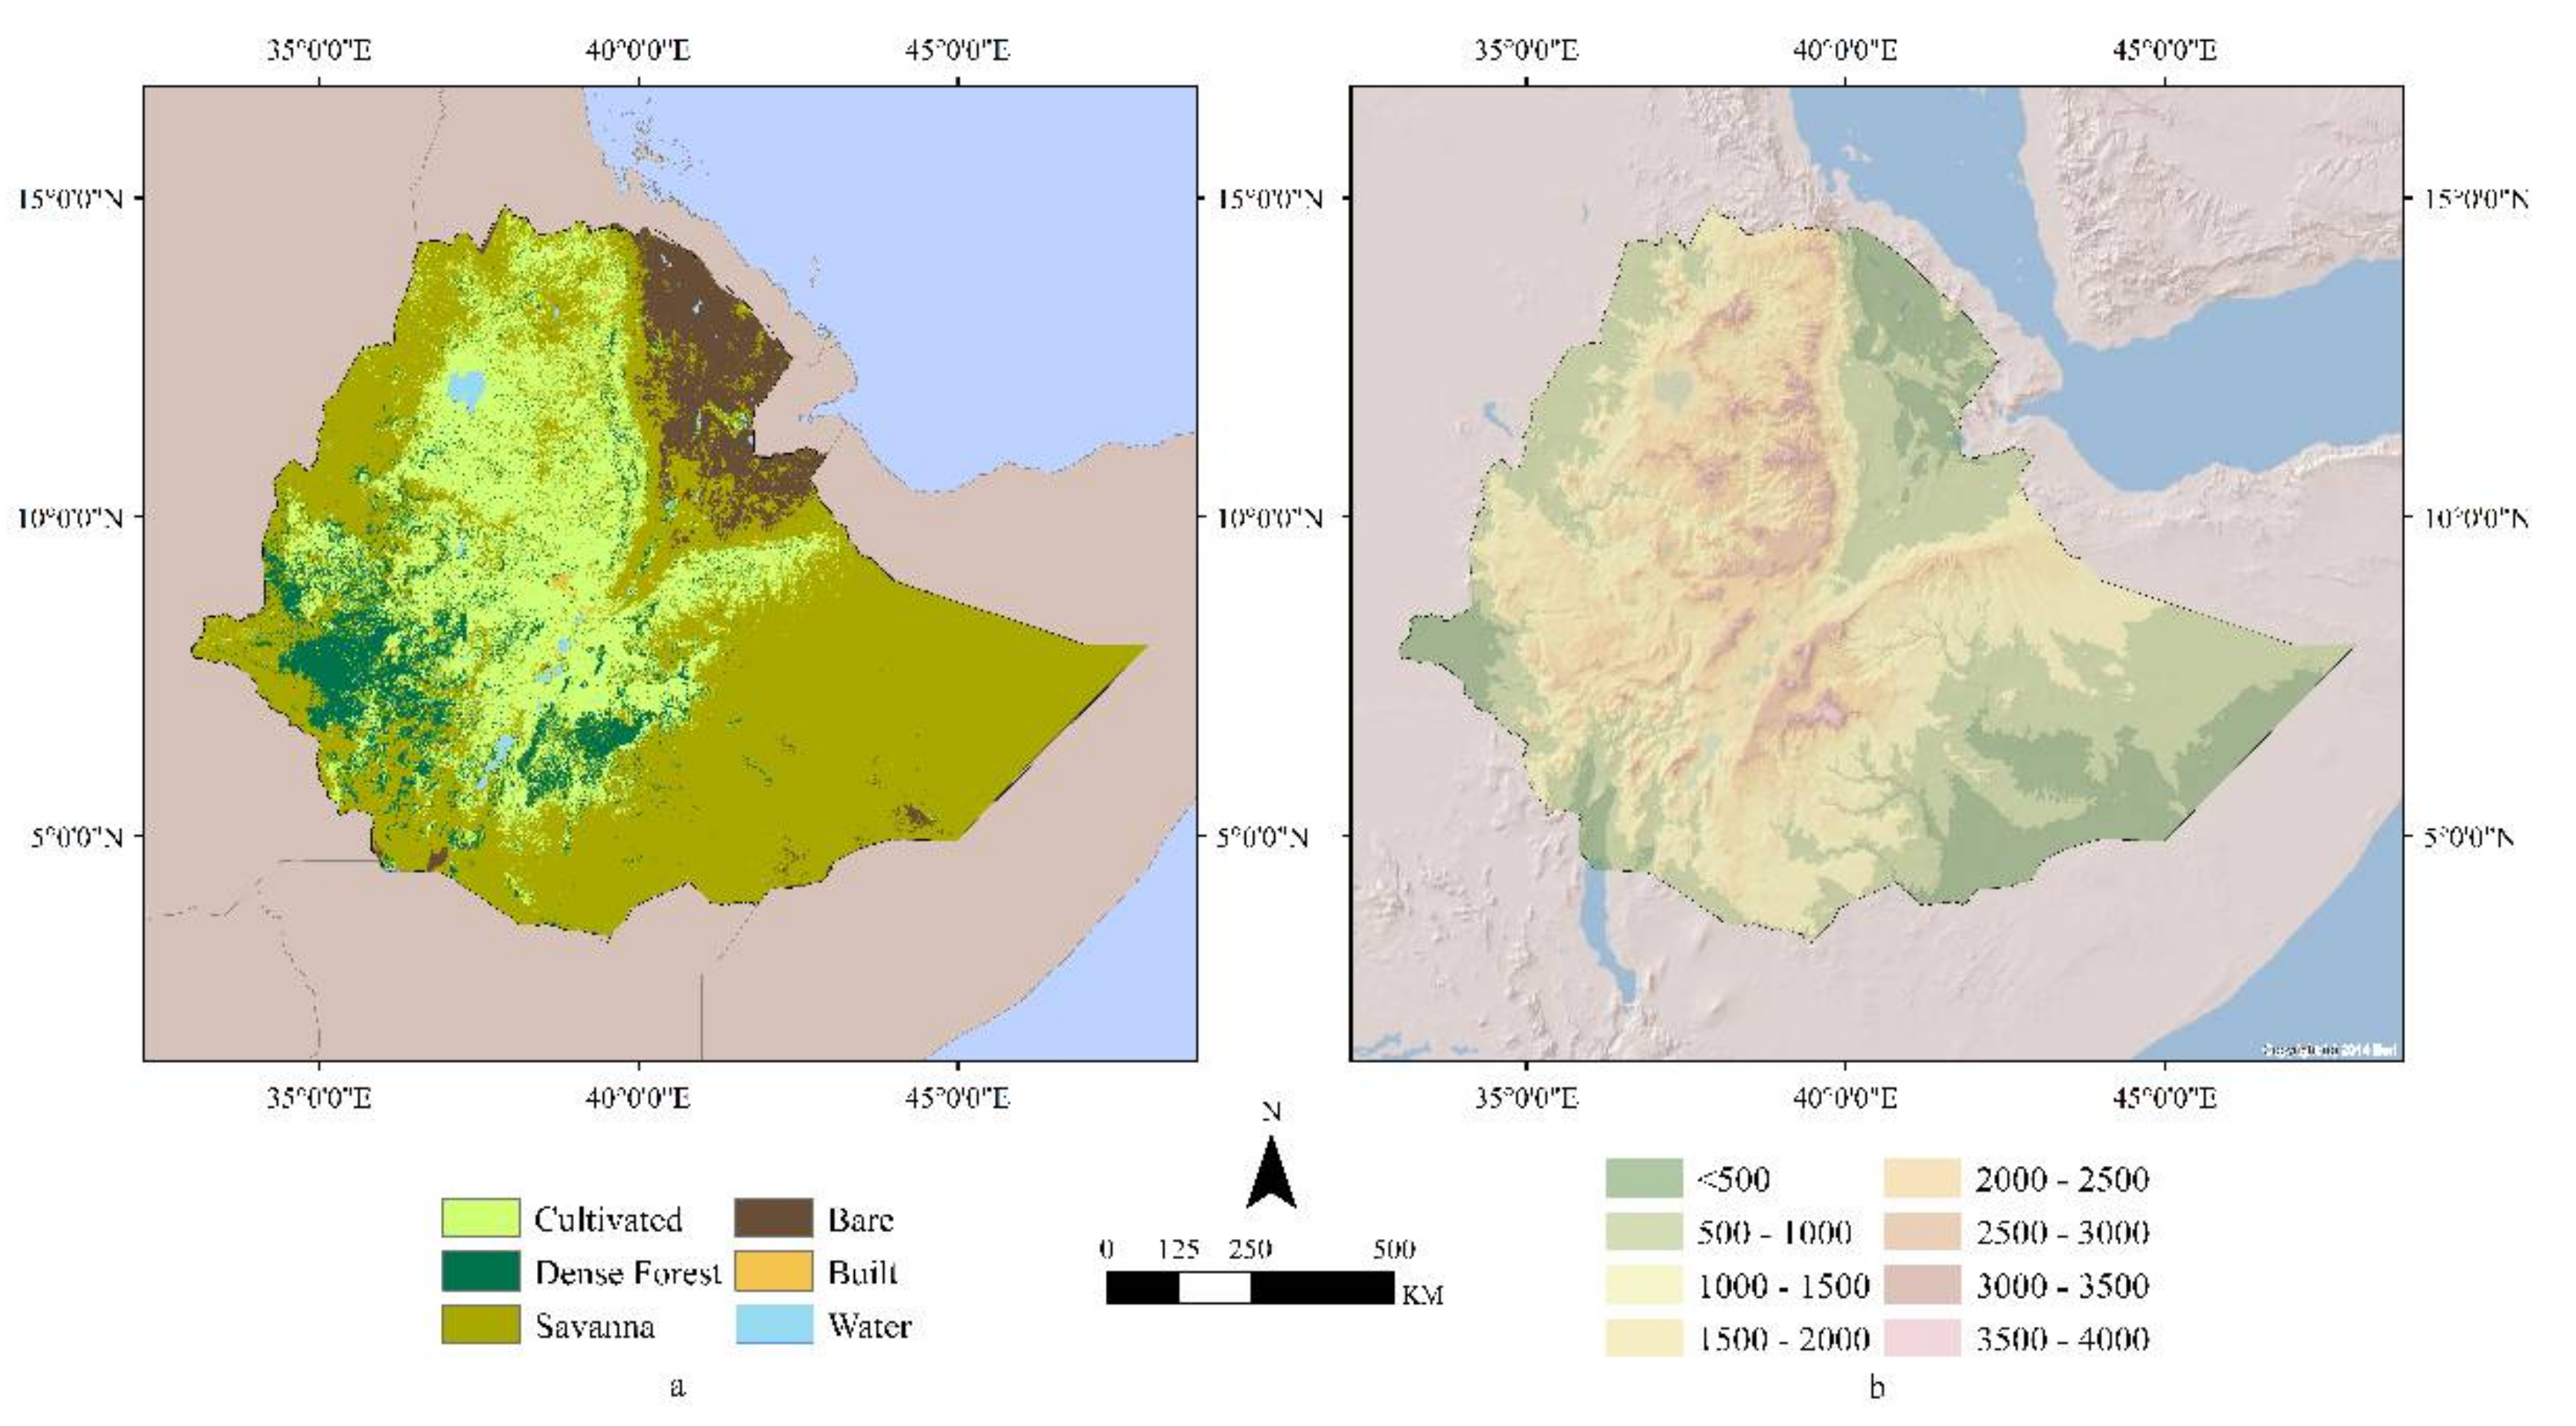
Figure 2.
Spatial distributions of directional persistence outcomes by season in Ethiopia. Seasons are divided into 3-month periods: March–May (MAM), June–August (JJA), September–November (SON), and December–February (DJF).
Figure 2.
Spatial distributions of directional persistence outcomes by season in Ethiopia. Seasons are divided into 3-month periods: March–May (MAM), June–August (JJA), September–November (SON), and December–February (DJF).

Figure 3.
The directional persistence outcomes as a percentage of the total area analyzed in each season: March–May (MAM), June–August (JJA), September–November (SON), and December–February (DJF).
Figure 3.
The directional persistence outcomes as a percentage of the total area analyzed in each season: March–May (MAM), June–August (JJA), September–November (SON), and December–February (DJF).

Table 1.
Coefficients and associated standard errors of the nonspatial OLS, quasi-spatial OLS, and spatial Durbin panel data model, run separately for pixels exhibiting significant negative and positive directional persistence. The nonspatial model includes only time FE, while the quasi-spatial and spatial Durbin models include both time and location FE.
| Nonspatial Model | Quasi-Spatial Model | Spatial Panel Model | ||||
|---|---|---|---|---|---|---|
| Positive | Negative | Positive | Negative | Positive | Negative | |
| Precipitation | 0.0630 *** (0.0019) | 0.0893 *** (0.0014) | 0.0049 *** (0.0015) | 0.0070 *** (0.0005) | 0.0050 *** (0.0012) | 0.0071 *** (0.0005) |
| Temperature | −0.0614 *** (0.0094) | −0.1732 *** (0.0057) | −0.2827 *** (0.0341) | −0.2426 *** (0.0158) | −0.2900 *** (0.0355) | −0.2504 *** (0.0155) |
| 0.21 | 0.28 | 0.94 | 0.97 | 0.03 | 0.19 | |
| Precipitation θ | - | - | - | - | 0.0002 (0.0010) | −0.0019 (0.0009) |
| Temperature θ | - | - | - | - | 0.0426 (0.0278) | 0.0611 * (0.0241) |
| NDVI ρ | - | - | - | - | 0.0495 *** (0.0081) | 0.1823 *** (0.0098) |
| N | 6919 | 25,806 | 6919 | 25,806 | 6919 | 25,806 |
*** p < 0.001; * p < 0.05.
Publisher’s Note: MDPI stays neutral with regard to jurisdictional claims in published maps and institutional affiliations. |
© 2021 by the authors. Licensee MDPI, Basel, Switzerland. This article is an open access article distributed under the terms and conditions of the Creative Commons Attribution (CC BY) license (https://creativecommons.org/licenses/by/4.0/).
Share and Cite
MDPI and ACS Style
Muir, C.; Southworth, J.; Khatami, R.; Herrero, H.; Akyapı, B. Vegetation Dynamics and Climatological Drivers in Ethiopia at the Turn of the Century. Remote Sens. 2021, 13, 3267. https://doi.org/10.3390/rs13163267
AMA Style
Muir C, Southworth J, Khatami R, Herrero H, Akyapı B. Vegetation Dynamics and Climatological Drivers in Ethiopia at the Turn of the Century. Remote Sensing. 2021; 13(16):3267. https://doi.org/10.3390/rs13163267
Chicago/Turabian StyleMuir, Carly, Jane Southworth, Reza Khatami, Hannah Herrero, and Berkay Akyapı. 2021. "Vegetation Dynamics and Climatological Drivers in Ethiopia at the Turn of the Century" Remote Sensing 13, no. 16: 3267. https://doi.org/10.3390/rs13163267
Note that from the first issue of 2016, this journal uses article numbers instead of page numbers. See further details here.