
Building Outline Extraction Directly Using the U2-Net Semantic Segmentation Model from High-Resolution Aerial Images and a Comparison Study

 ,
,  ,
,  ,
,
Abstract
:
1. Introduction
2. Methods
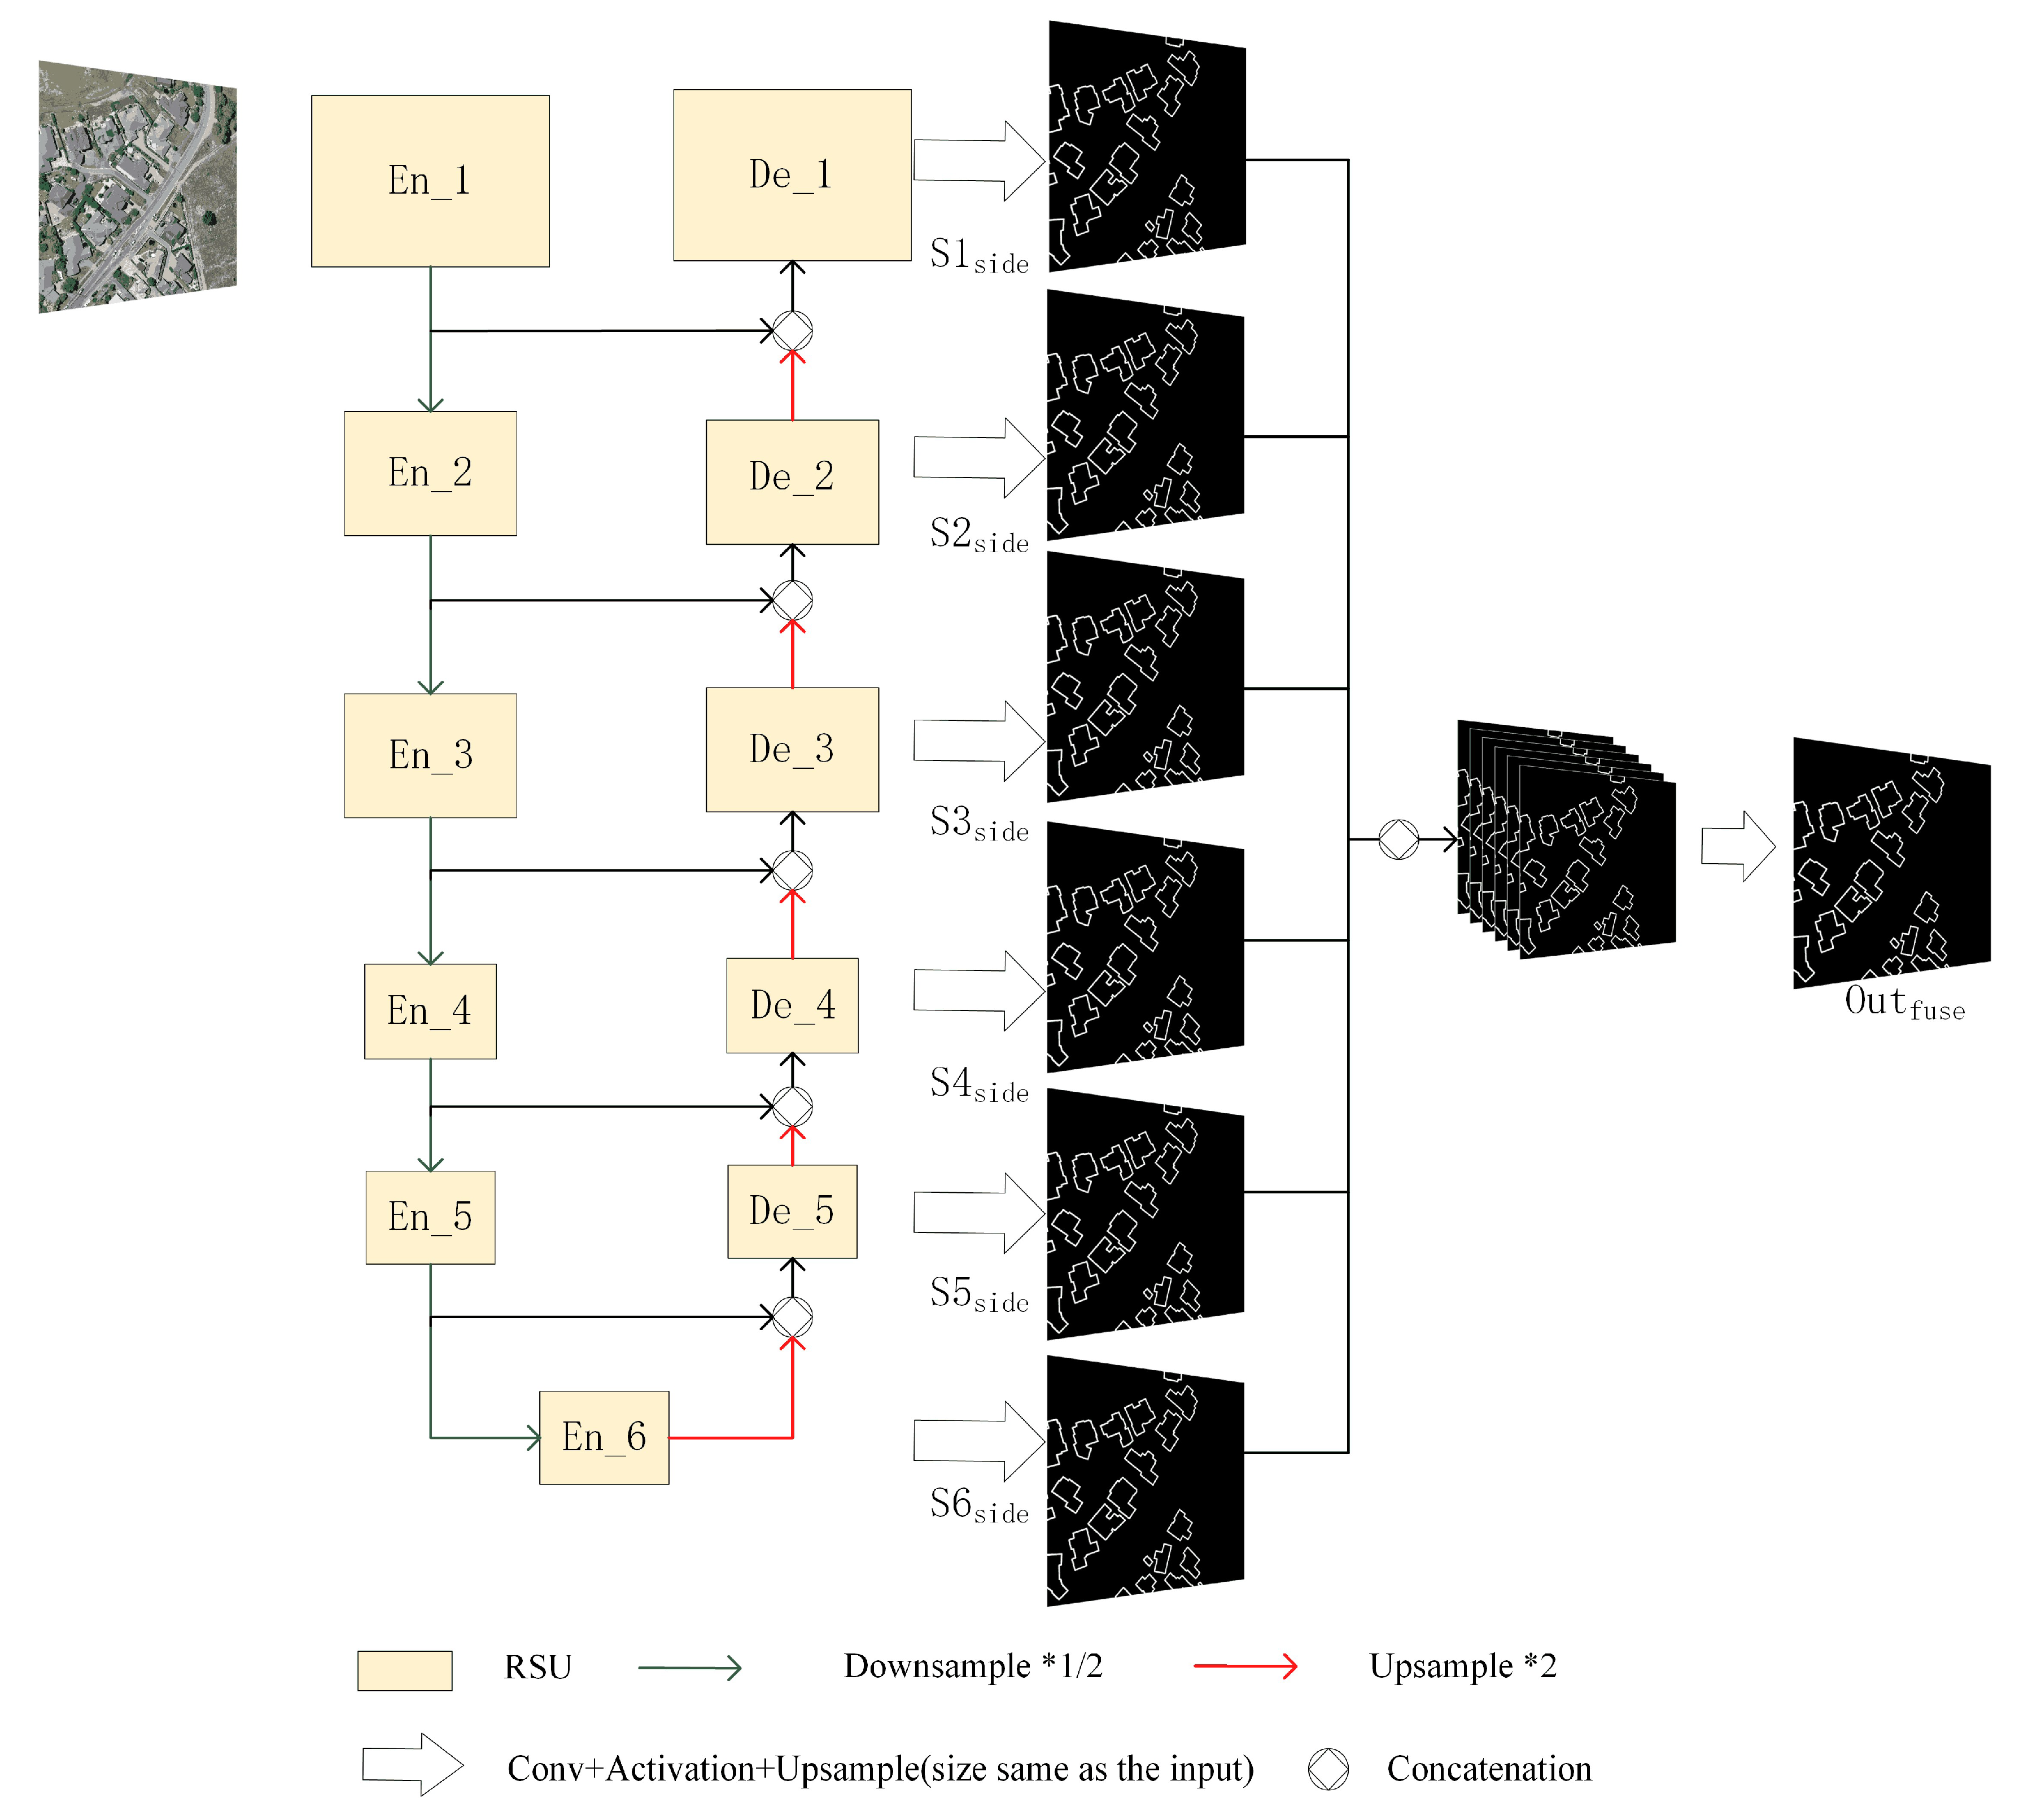
2.1. Overview of Network Architecture
2.2. Residual U-Blocks
2.3. Loss
3. Experiment
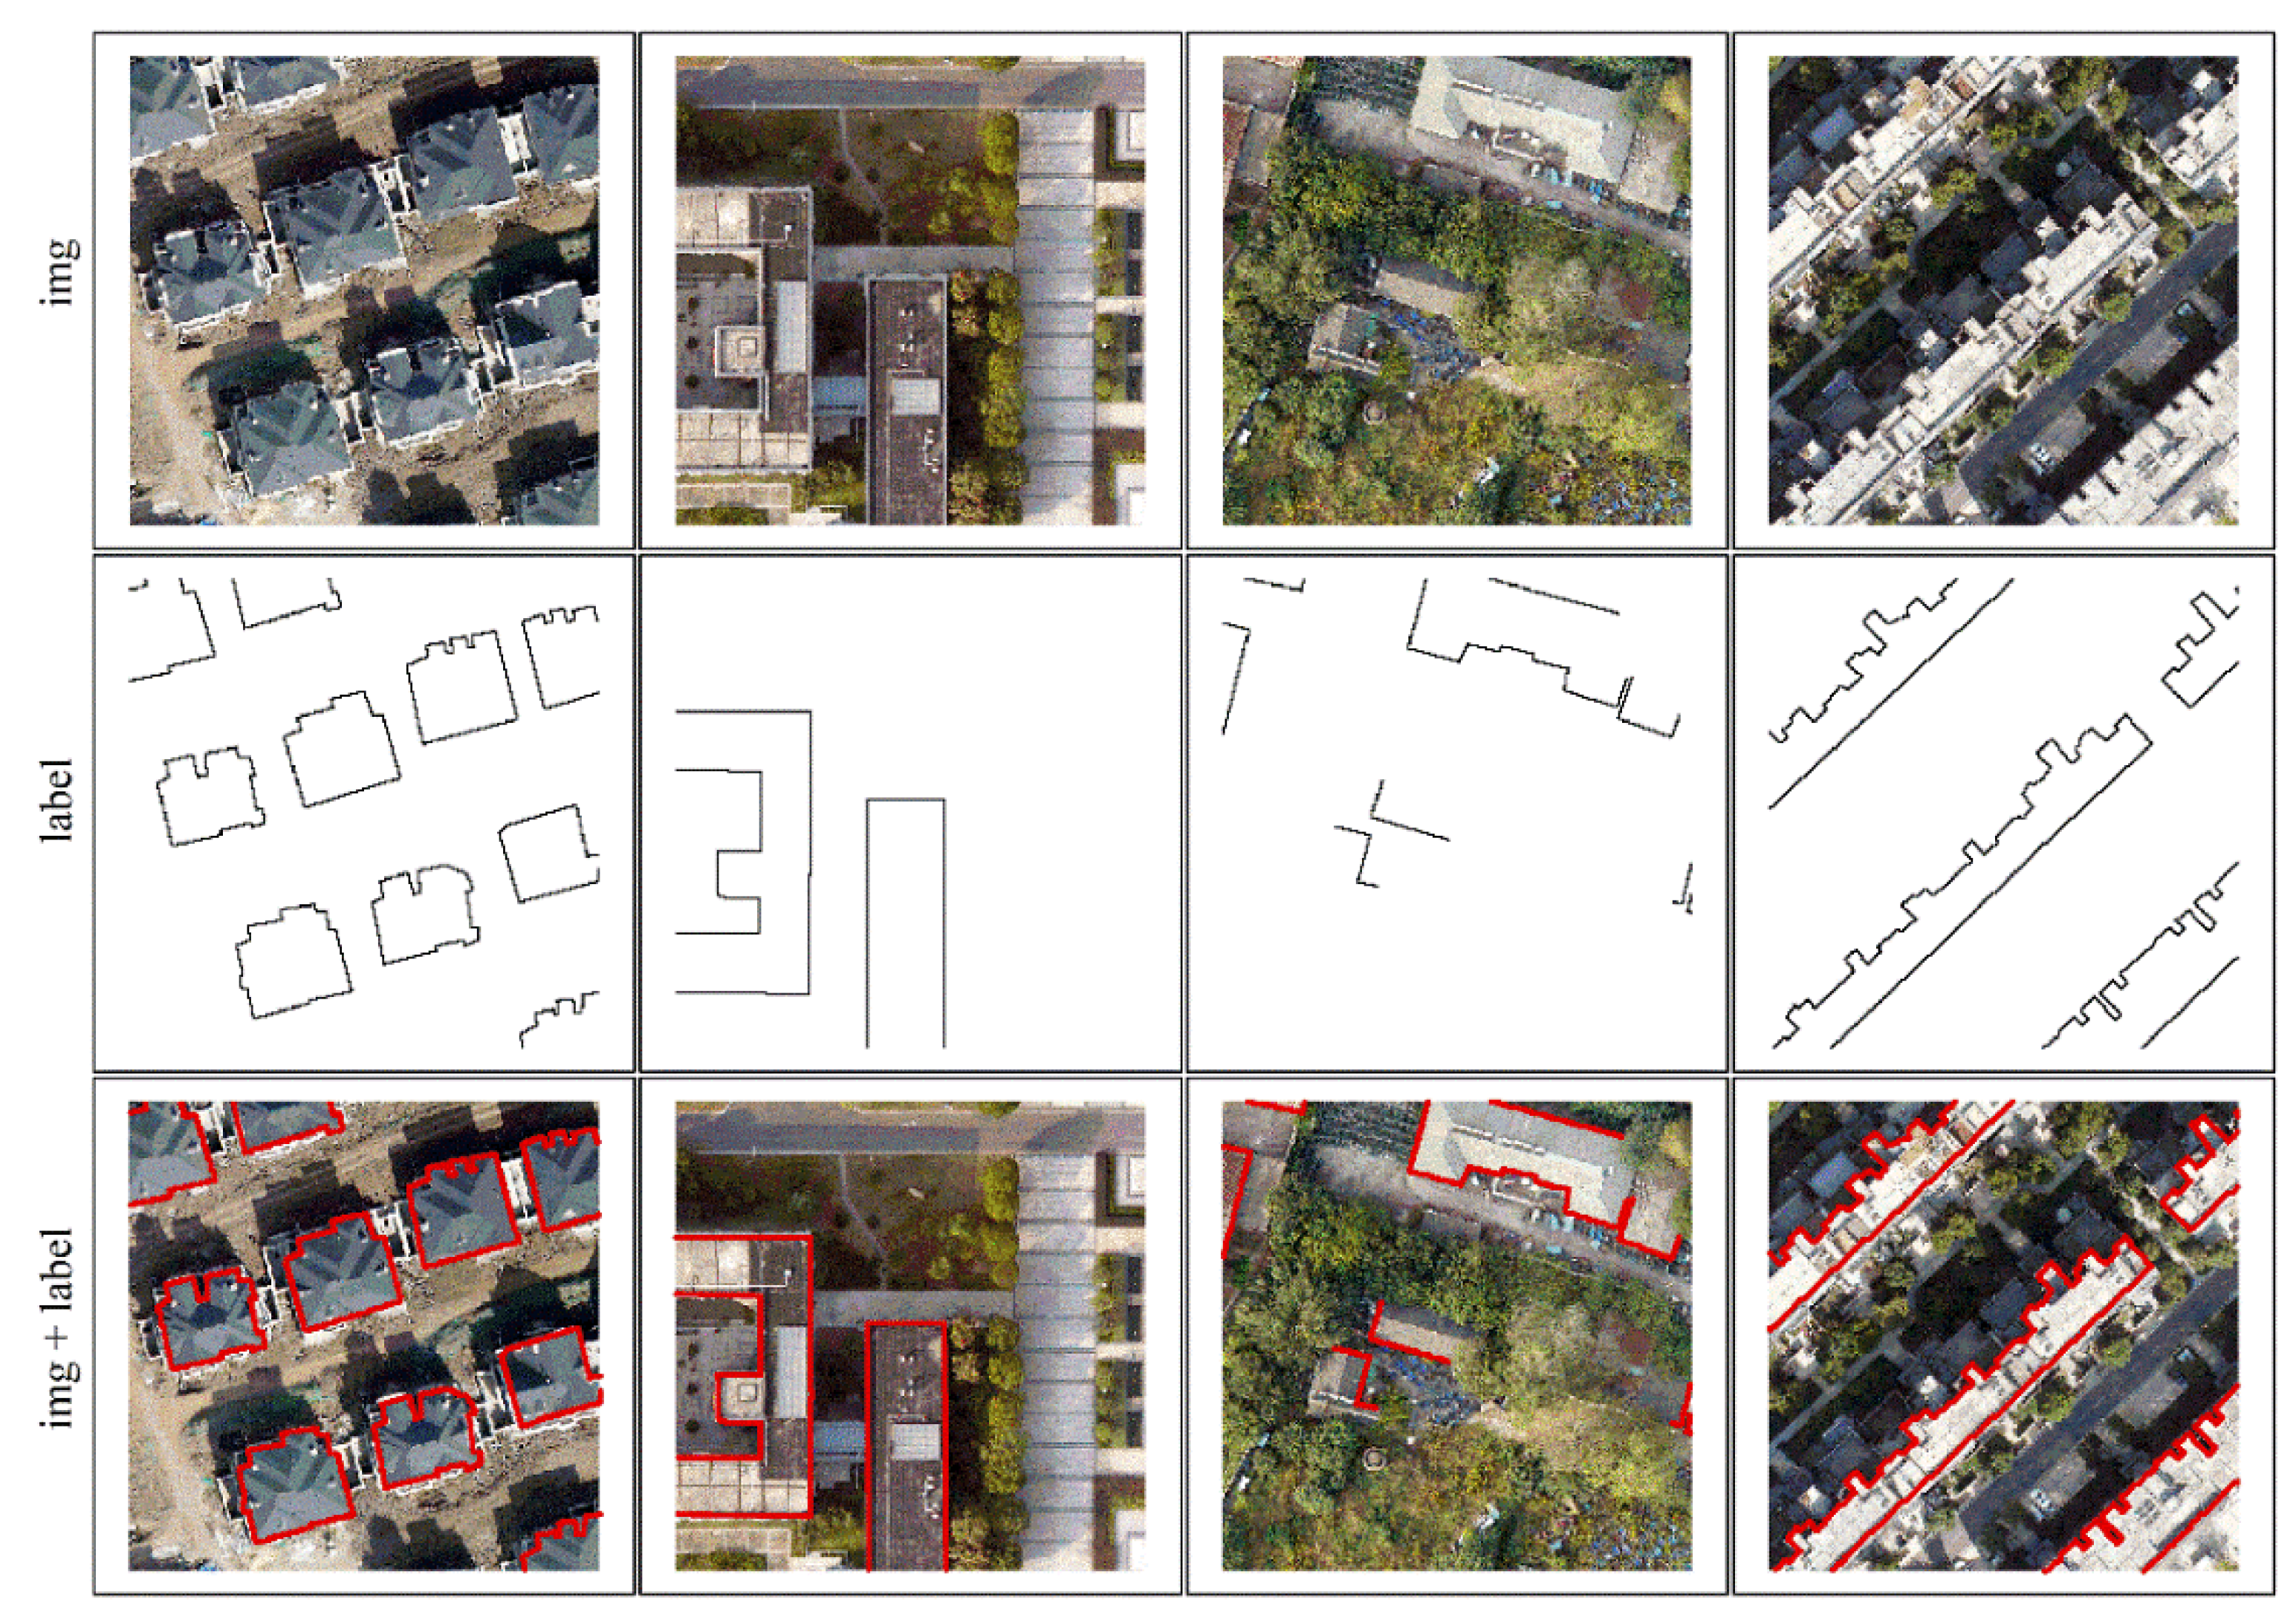
3.1. Dataset
3.2. Experimental Setup
3.3. Evaluation Metrics
4. Results and Discussion
4.1. Nanjing Dataset Experiment
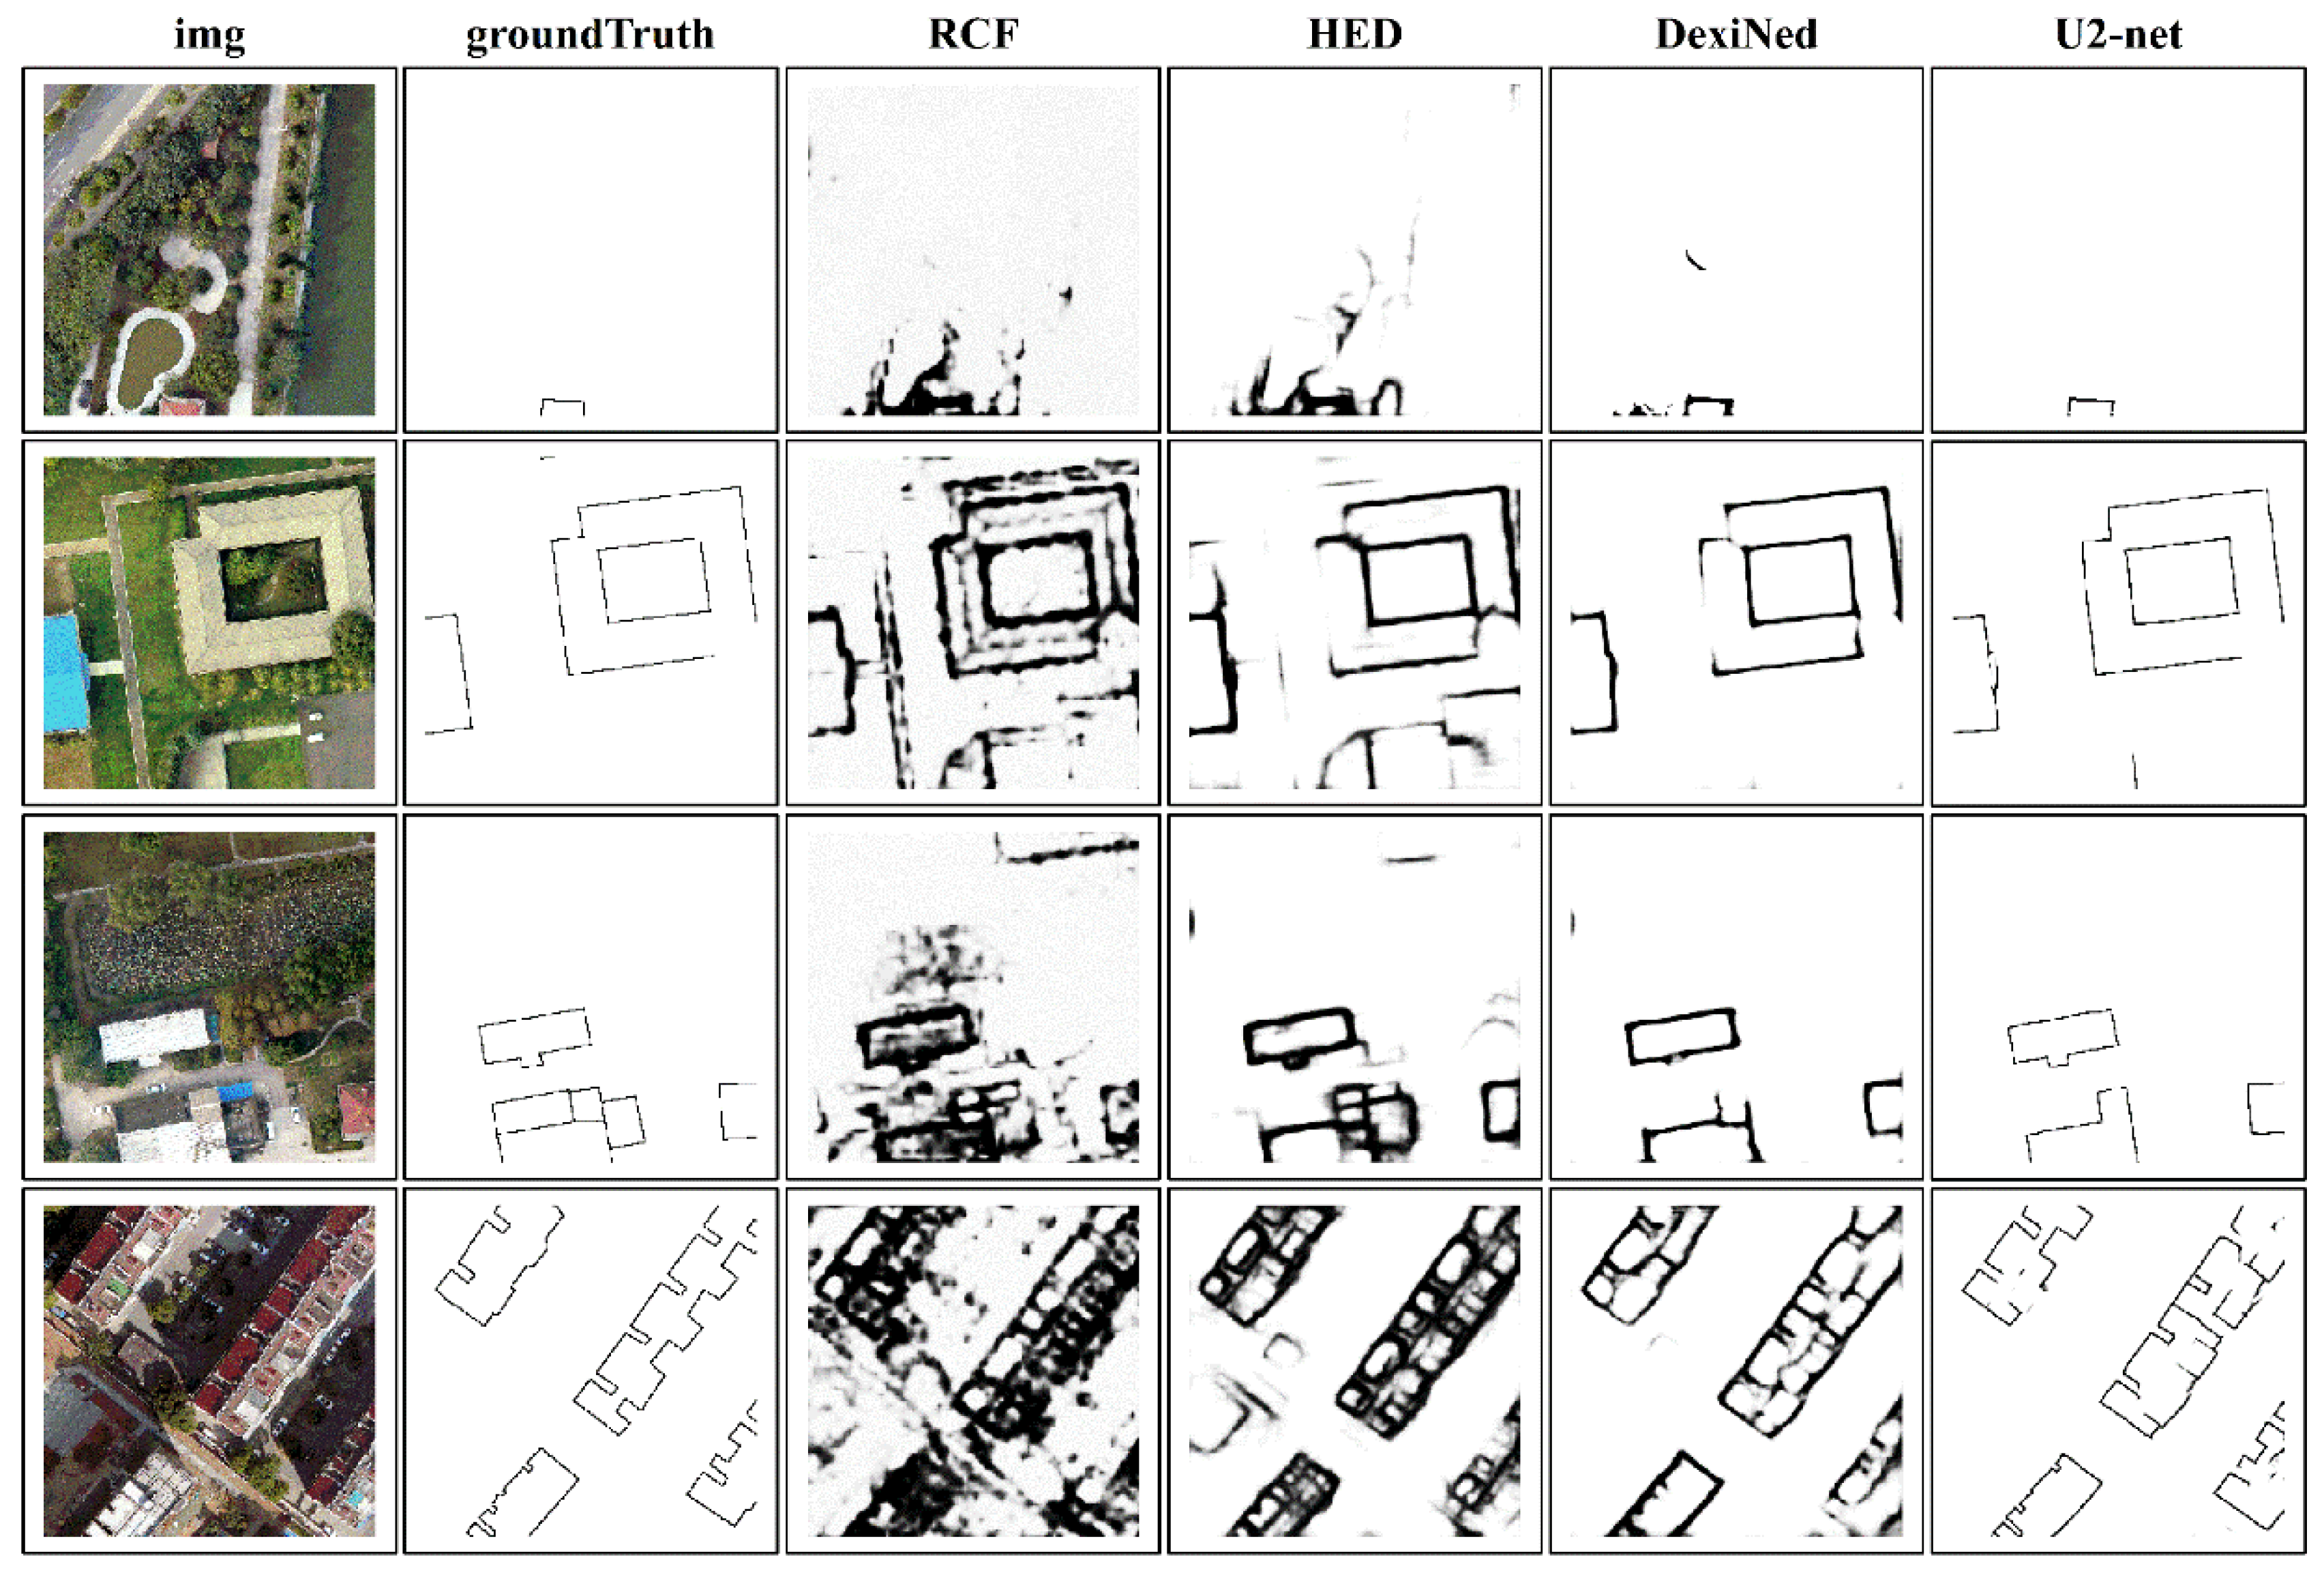
4.1.1. Comparison with Edge Detection Model
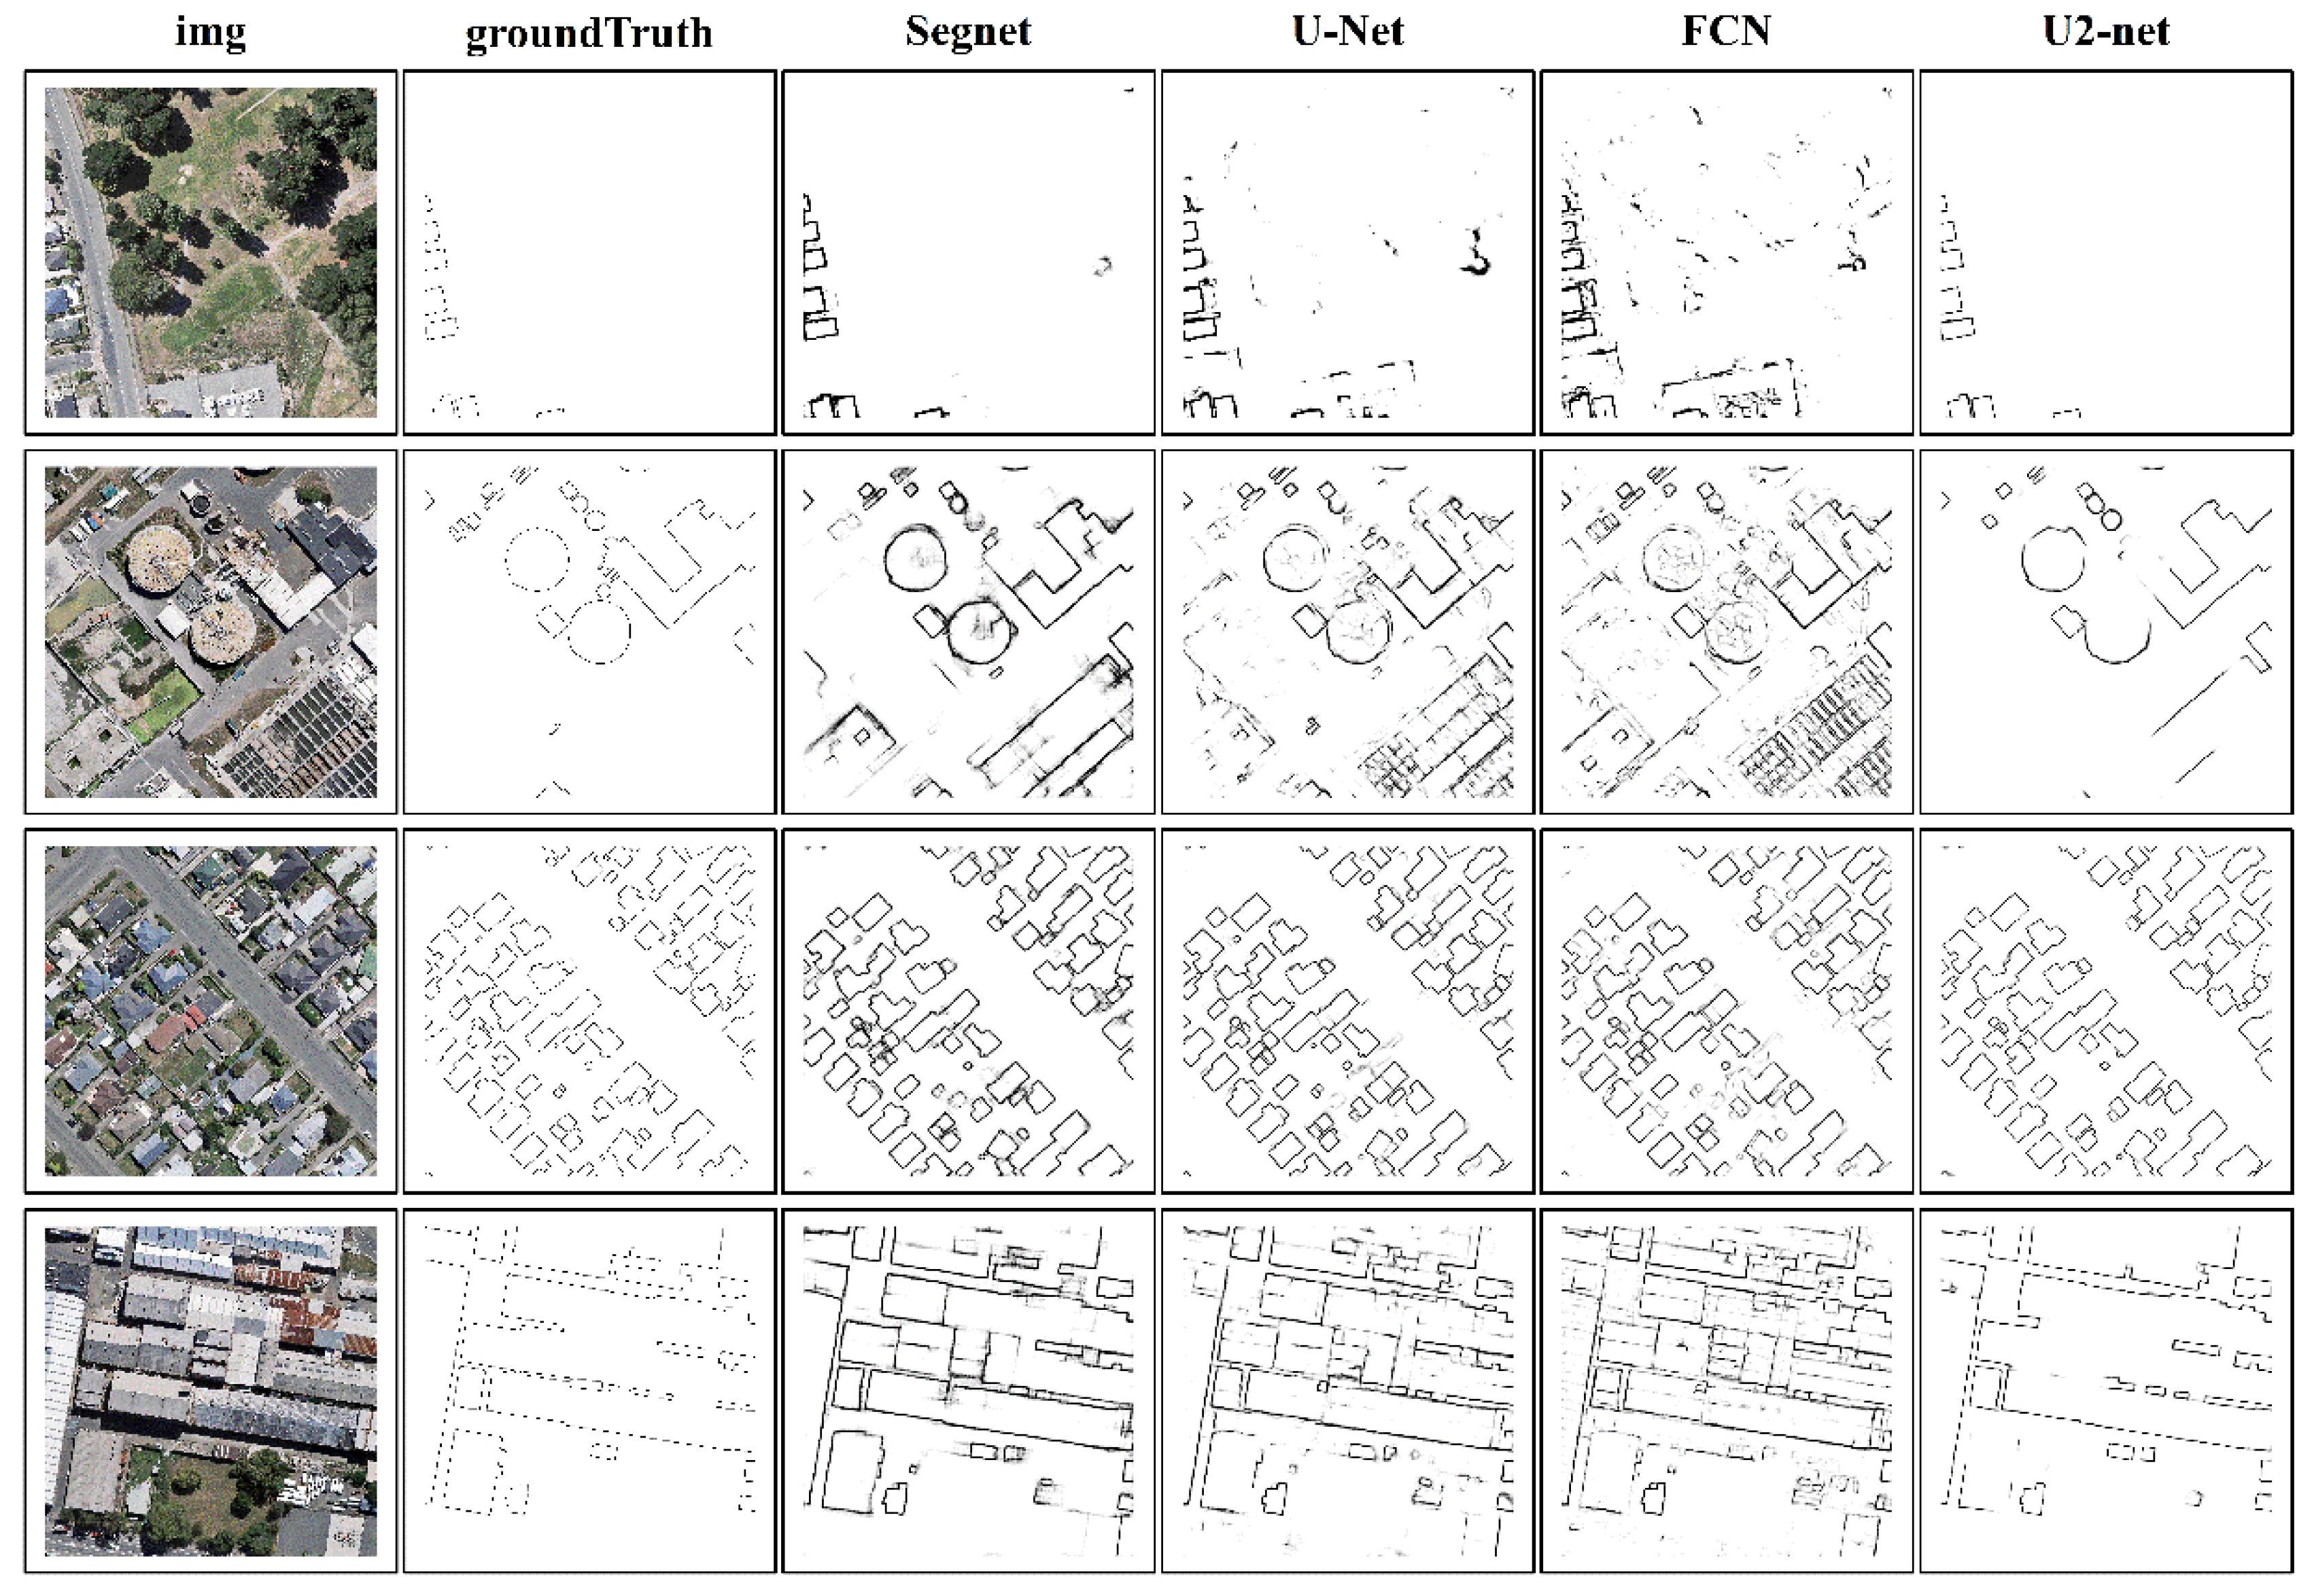
4.1.2. Comparison with Semantic Segmentation Model
4.2. WHU Dataset Experiment
4.2.1. Comparison with Edge Detection Model
4.2.2. Comparison with Semantic Segmentation Model
4.3. Loss Function for Clearer Edge
4.4. Application Prospect in Practical Work
5. Conclusions
Author Contributions
Funding
Institutional Review Board Statement
Informed Consent Statement
Data Availability Statement
Acknowledgments
Conflicts of Interest
References
- Zhang, Y.; Gong, W.; Sun, J.; Li, W. Web-Net: A novel nest networks with ultra-hierarchical sampling for building extraction from aerial imageries. Remote Sens. 2019, 11, 1897. [Google Scholar] [CrossRef] [Green Version]
- Lin, C.; Nevatia, R. Building detection and description from a single intensity image. Comput. Vis. Image Underst. 1998, 72, 101–121. [Google Scholar] [CrossRef]
- Awrangjeb, M.; Hu, X.; Yang, B.; Tian, J. Editorial for Special Issue: “Remote Sensing based Building Extraction”. Rmote Sens. 2020, 12, 549. [Google Scholar] [CrossRef] [Green Version]
- Brunner, D.; Lemoine, G.; Bruzzone, L. Earthquake Damage Assessment of Buildings Using VHR Optical and SAR Imagery. IEEE Trans. Geosci. Remote Sens. 2010, 48, 2403–2420. [Google Scholar] [CrossRef] [Green Version]
- Yang, W.; Zhang, X.; Luo, P. Transferability of Convolutional Neural Network Models for Identifying Damaged Buildings Due to Earthquake. Remote Sens. 2021, 13, 504. [Google Scholar] [CrossRef]
- Rashidian, V.; Baise, L.G.; Koch, M. Detecting Collapsed Buildings After a Natural Hazard on Vhr Optical Satellite Imagery Using U-Net Convolutional Neural Networks. In Proceedings of the IGARSS 2019–2019 IEEE International Geoscience and Remote Sensing Symposium, Yokohama, Japan, 28 July–2 August 2019; pp. 9394–9397. [Google Scholar]
- Li, J.; Cao, J.; Feyissa, M.E.; Yang, X. Automatic building detection from very high-resolution images using multiscale morphological attribute profiles. Remote Sens. Lett. 2020, 11, 640–649. [Google Scholar] [CrossRef]
- Pham, M.-T.; Lefevre, S.; Aptoula, E. Local feature-based attribute profiles for optical remote sensing image classification. IEEE Trans. Geosc. Remote Sens. 2017, 56, 1199–1212. [Google Scholar] [CrossRef] [Green Version]
- Yao, J.; Meng, D.; Zhao, Q.; Cao, W.; Xu, Z. Nonconvex-Sparsity and Nonlocal-Smoothness-Based Blind Hyperspectral Unmixing. IEEE Trans. Image Process. 2019, 28, 2991–3006. [Google Scholar] [CrossRef]
- Chen, Q.; Wang, L.; Waslander, S.L.; Liu, X. An end-to-end shape modeling framework for vectorized building outline generation from aerial images. ISPRS J. Photogramm. Remote Sens. 2020, 170, 114–126. [Google Scholar] [CrossRef]
- Zhao, W.; Persello, C.; Stein, A. Building outline delineation: From aerial images to polygons with an improved end-to-end learning framework. ISPRS J. Photogramm. Remote Sens. 2021, 175, 119–131. [Google Scholar] [CrossRef]
- Lu, T.; Ming, D.; Lin, X.; Hong, Z.; Bai, X.; Fang, J. Detecting building edges from high spatial resolution remote sensing imagery using richer convolution features network. Remote Sens. 2018, 10, 1496. [Google Scholar] [CrossRef] [Green Version]
- Izadi, M.; Saeedi, P. Three-Dimensional Polygonal Building Model Estimation from Single Satellite Images. IEEE Trans. Geosci. Remote Sens. 2012, 50, 2254–2272. [Google Scholar] [CrossRef]
- Wang, J.; Yang, X.; Qin, X.; Ye, X.; Qin, Q. An Efficient Approach for Automatic Rectangular Building Extraction from Very High Resolution Optical Satellite Imagery. IEEE Geosci. Remote Sens. Lett. 2015, 12, 487–491. [Google Scholar] [CrossRef]
- Turker, M.; Koc-San, D. Building extraction from high-resolution optical spaceborne images using the integration of support vector machine (SVM) classification, Hough transformation and perceptual grouping. Int. J. Appl. Earth Obs. Geoinf. 2015, 34, 58–69. [Google Scholar] [CrossRef]
- Karantzalos, K.; Paragios, N. Recognition-Driven Two-Dimensional Competing Priors Toward Automatic and Accurate Building Detection. IEEE Trans. Geosci. Remote Sens. 2009, 47, 133–144. [Google Scholar] [CrossRef]
- Ahmadi, S.; Zoej, M.J.V.; Ebadi, H.; Moghaddam, H.A.; Mohammadzadeh, A. Automatic urban building boundary extraction from high resolution aerial images using an innovative model of active contours. Int. J. Appl. Earth Obs. Geoinf. 2010, 12, 150–157. [Google Scholar] [CrossRef]
- Attarzadeh, R.; Momeni, M. Object-Based Rule Sets and Its Transferability for Building Extraction from High Resolution Satellite Imagery. J. Indian Soc. Remote Sens. 2018, 46, 169–178. [Google Scholar] [CrossRef]
- Sellaouti, A.; Hamouda, A.; Deruyver, A.; Wemmert, C. Template-Based Hierarchical Building Extraction. IEEE Geosci. Remote Sens. Lett. 2014, 11, 706–710. [Google Scholar] [CrossRef]
- LeCun, Y.; Boser, B.; Denker, J.S.; Henderson, D.; Howard, R.E.; Hubbard, W.; Jackel, L.D. Backpropagation applied to handwritten zip code recognition. Neural Comput. 1989, 1, 541–551. [Google Scholar] [CrossRef]
- He, K.; Zhang, X.; Ren, S.; Sun, J. Deep Residual Learning for Image Recognition. In Proceedings of the Proceedings of the IEEE Conference on Computer Vision and Pattern Recognition (CVPR), Las Vegas, NV, USA, 27–30 June 2016; pp. 770–778. [Google Scholar]
- Pan, Z.; Xu, J.; Guo, Y.; Hu, Y.; Wang, G. Deep learning segmentation and classification for urban village using a worldview satellite image based on U-Net. Remote Sens. 2020, 12, 1574. [Google Scholar] [CrossRef]
- Maggiori, E.; Tarabalka, Y.; Charpiat, G.; Alliez, P. Convolutional Neural Networks for Large-Scale Remote-Sensing Image Classification. IEEE Trans. Geosci. Remote Sens. 2017, 55, 645–657. [Google Scholar] [CrossRef] [Green Version]
- Krizhevsky, A.; Sutskever, I.; Hinton, G.E. Imagenet classification with deep convolutional neural networks. Adv. Neural Inf. Process. Syst. 2012, 25, 1097–1105. [Google Scholar] [CrossRef]
- Girshick, R. Fast r-cnn. In Proceedings of the Proceedings of the IEEE International Conference on Computer Vision (ICCV), Santiago, Chile, 7–13 December 2015; pp. 1440–1448. [Google Scholar]
- Liu, W.; Anguelov, D.; Erhan, D.; Szegedy, C.; Reed, S.; Fu, C.-Y.; Berg, A.C. SSD: Single shot multibox detector. In European Conference on Computer Vision; Springer: Cham, Switzerland, 2016; pp. 21–37. [Google Scholar]
- Cao, F.; Liu, Y.; Wang, D. Efficient saliency detection using convolutional neural networks with feature selection. Inf. Sci. 2018, 456, 34–49. [Google Scholar] [CrossRef]
- Tan, J.H.; Fujita, H.; Sivaprasad, S.; Bhandary, S.V.; Rao, A.K.; Chua, K.C.; Acharya, U.R. Automated segmentation of exudates, haemorrhages, microaneurysms using single convolutional neural network. Inf. Sci. 2017, 420, 66–76. [Google Scholar] [CrossRef]
- Long, J.; Shelhamer, E.; Darrell, T. Fully convolutional networks for semantic segmentation. In Proceedings of the Proceedings of the IEEE Conference on Computer Vision and Pattern Recognition, Boston, MA, USA, 7–12 June 2015; pp. 3431–3440. [Google Scholar]
- Agravat, R.R.; Raval, M.S. Deep learning for automated brain tumor segmentation in mri images. In Soft Computing Based Medical Image Analysis; Elsevier: Amsterdam, The Netherlands, 2018; pp. 183–201. [Google Scholar]
- Han, J.; Zhang, D.; Cheng, G.; Guo, L.; Ren, J. Object detection in optical remote sensing images based on weakly supervised learning and high-level feature learning. IEEE Trans. Geosci. Remote Sens. 2014, 53, 3325–3337. [Google Scholar] [CrossRef] [Green Version]
- Ronneberger, O.; Fischer, P.; Brox, T. U-Net: Convolutional Networks for Biomedical Image Segmentation. In International Conference on Medical Image Computing and Computer-Assisted Intervention; Springer: Cham, Switzerland, 2015; pp. 234–241. [Google Scholar]
- Badrinarayanan, V.; Kendall, A.; Cipolla, R. Segnet: A deep convolutional encoder-decoder architecture for image segmentation. IEEE Trans. Pattern Anal. Mach. Intell. 2017, 39, 2481–2495. [Google Scholar] [CrossRef]
- Liu, P.; Zhang, H.; Eom, K.B. Active Deep Learning for Classification of Hyperspectral Images. IEEE J. Sel. Top. Appl. Earth Obs. Remote Sens. 2017, 10, 712–724. [Google Scholar] [CrossRef] [Green Version]
- Huang, Z.; Cheng, G.; Wang, H.; Li, H.; Shi, L.; Pan, C. Building extraction from multi-source remote sensing images via deep deconvolution neural networks. In Proceedings of the 2016 IEEE International Geoscience and Remote Sensing Symposium (IGARSS), Beijing, China, 10–15 July 2016; pp. 1835–1838. [Google Scholar]
- Bittner, K.; Adam, F.; Cui, S.; Körner, M.; Reinartz, P. Building footprint extraction from VHR remote sensing images combined with normalized DSMs using fused fully convolutional networks. IEEE J. Sel. Top. Appl. Earth Obs. Remote Sens. 2018, 11, 2615–2629. [Google Scholar] [CrossRef] [Green Version]
- Hong, D.; Gao, L.; Yao, J.; Zhang, B.; Plaza, A.; Chanussot, J. Graph Convolutional Networks for Hyperspectral Image Classification. IEEE Trans. Geosci. Remote Sens. 2021, 59, 5966–5978. [Google Scholar] [CrossRef]
- Ji, S.; Zhang, C.; Xu, A.; Shi, Y.; Duan, Y. 3D convolutional neural networks for crop classification with multi-temporal remote sensing images. Remote Sens. 2018, 10, 75. [Google Scholar] [CrossRef] [Green Version]
- Farabet, C.; Couprie, C.; Najman, L.; LeCun, Y. Learning hierarchical features for scene labeling. IEEE Trans. Pattern Anal. Mach. Intell. 2012, 35, 1915–1929. [Google Scholar] [CrossRef] [PubMed] [Green Version]
- Vakalopoulou, M.; Karantzalos, K.; Komodakis, N.; Paragios, N. Building Detection in Very High Resolution Multispectral Data with Deep Learning Features. In Proceedings of the 2015 IEEE International Geoscience and Remote Sensing Symposium (IGARSS), Milan, Italy, 26–31 July 2015; pp. 1873–1876. [Google Scholar]
- Diakogiannis, F.I.; Waldner, F.; Caccetta, P.; Wu, C. Resunet-a: A deep learning framework for semantic segmentation of remotely sensed data. ISPRS J. Photogramm. Remote Sens. 2020, 162, 94–114. [Google Scholar] [CrossRef] [Green Version]
- Li, Y.; He, B.; Long, T.; Bai, X. Evaluation the performance of fully convolutional networks for building extraction compared with shallow models. In Proceedings of the 2017 IEEE International Geoscience and Remote Sensing Symposium (IGARSS), Fort Worth, TX, USA, 23–28 July 2017; pp. 850–853. [Google Scholar]
- Liu, P.; Liu, X.; Liu, M.; Shi, Q.; Yang, J.; Xu, X.; Zhang, Y. Building Footprint Extraction from High-Resolution Images via Spatial Residual Inception Convolutional Neural Network. Remote Sens. 2019, 11, 830. [Google Scholar] [CrossRef] [Green Version]
- Bischke, B.; Helber, P.; Folz, J.; Borth, D.; Dengel, A. Multi-task learning for segmentation of building footprints with deep neural networks. In Proceedings of the 2019 IEEE International Conference on Image Processing (ICIP), Taipei, Taiwan, 22–25 September 2019; pp. 1480–1484. [Google Scholar]
- Chen, L.-C.; Papandreou, G.; Kokkinos, I.; Murphy, K.; Yuille, A.L. Deeplab: Semantic image segmentation with deep convolutional nets, atrous convolution, and fully connected crfs. IEEE Trans. Pattern Anal. Mach. Intell. 2017, 40, 834–848. [Google Scholar] [CrossRef] [PubMed]
- Chen, L.-C.; Papandreou, G.; Kokkinos, I.; Murphy, K.; Yuille, A.L. Semantic image segmentation with deep convolutional nets and fully connected crfs. arXiv 2014, arXiv:1412.7062. [Google Scholar]
- Li, E.; Xu, S.; Meng, W.; Zhang, X. Building extraction from remotely sensed images by integrating saliency cue. IEEE J.Sel. Top. Appl. Earth Obs. Remote Sens. 2016, 10, 906–919. [Google Scholar] [CrossRef]
- Shrestha, S.; Vanneschi, L. Improved fully convolutional network with conditional random fields for building extraction. Remote Sens. 2018, 10, 1135. [Google Scholar] [CrossRef] [Green Version]
- Liu, Y.; Cheng, M.-M.; Hu, X.; Wang, K.; Bai, X. Richer Convolutional Features for Edge Detection. In Proceedings of the Proceedings of the IEEE Conference on Computer Vision and Pattern Recognition, Honolulu, HI, USA, 21–26 July 2017; pp. 3000–3009. [Google Scholar]
- Li, Q.; Mou, L.; Hua, Y.; Sun, Y.; Jin, P.; Shi, Y.; Zhu, X.X. Instance Segmentation of Buildings Using Keypoints. In Proceedings of the IGARSS 2020—2020 IEEE International Geoscience and Remote Sensing Symposium, Waikoloa, HI, USA, 26 September–2 October 2020. [Google Scholar]
- Zorzi, S.; Bittner, K.; Fraundorfer, F. Machine-Learned Regularization and Polygonization of Building Segmentation Masks. In Proceedings of the 2020 25th International Conference on Pattern Recognition (ICPR), Milan, Italy, 10–15 January 2021; pp. 3098–3105. [Google Scholar]
- Qin, X.B.; Zhang, Z.C.; Huang, C.Y.; Dehghan, M.; Zaiane, O.R.; Jagersand, M. U-2-Net: Going deeper with nested U-structure for salient object detection. Pattern Recognit. 2020, 106, 12. [Google Scholar] [CrossRef]
- Qin, X.B. Available online: https://github.com/xuebinqin/U-2-Net (accessed on 15 July 2021).
- Tim. Available online: https://github.com/ecsplendid/rembg-greenscreen (accessed on 15 July 2021).
- Xie, S.; Tu, Z. Holistically-Nested Edge Detection. In Proceedings of the Proceedings of the IEEE International Conference on Computer Vision, Santiago, Chile, 7–13 December 2015; pp. 1395–1403. [Google Scholar]
- Poma, X.S.; Riba, E.; Sappa, A. Dense extreme inception network: Towards a robust cnn model for edge detection. In Proceedings of the Proceedings of the IEEE/CVF Winter Conference on Applications of Computer Vision, Snowmass Village, CO, USA, 1–5 March 2020; pp. 1923–1932. [Google Scholar]
- Ji, S.; Wei, S.; Lu, M. Fully convolutional networks for multisource building extraction from an open aerial and satellite imagery data set. IEEE Trans. Geosci. Remote Sens. 2018, 57, 574–586. [Google Scholar] [CrossRef]
- Zhou, D.; Wang, G.; He, G.; Long, T.; Yin, R.; Zhang, Z.; Chen, S.; Luo, B. Robust Building Extraction for High Spatial Resolution Remote Sensing Images with Self-Attention Network. Sensors 2020, 20, 7241. [Google Scholar] [CrossRef]
- Zhang, Z.; Schwing, A.G.; Fidler, S.; Urtasun, R. Monocular object instance segmentation and depth ordering with cnns. In Proceedings of the Proceedings of the IEEE International Conference on Computer Vision, Santiago, Chile, 7–13 December 2015; pp. 2614–2622. [Google Scholar]


| ODS-F1 | OIS-F1 | mIoU | |
|---|---|---|---|
| RCF | 40.22 | 42.61 | 45.33 |
| HED | 46.44 | 50.72 | 55.94 |
| DexiNed | 52.19 | 54.13 | 57.80 |
| U2-net | 57.84 | 58.56 | 60.02 |
| ODS-F1 | OIS-F1 | mIoU | |
|---|---|---|---|
| Segnet | 47.84 | 50.93 | 51.40 |
| U-Net | 54.71 | 57.42 | 58.19 |
| FCN | 48.33 | 51.75 | 52.16 |
| U2-net | 57.84 | 58.56 | 60.02 |
| ODS-F1 | OIS-F1 | mIoU | |
|---|---|---|---|
| RCF | 80.58 | 81.18 | 46.04 |
| HED | 87.65 | 88.06 | 54.95 |
| DexiNed | 89.29 | 89.54 | 62.22 |
| U2-net | 90.64 | 90.77 | 64.34 |
| ODS-F1 | OIS-F1 | mIoU | |
|---|---|---|---|
| Segnet | 89.89 | 90.36 | 60.25 |
| U-Net | 89.31 | 89.55 | 65.29 |
| FCN | 84.68 | 85.04 | 61.66 |
| U2-net | 90.64 | 90.77 | 64.34 |
Publisher’s Note: MDPI stays neutral with regard to jurisdictional claims in published maps and institutional affiliations. |
© 2021 by the authors. Licensee MDPI, Basel, Switzerland. This article is an open access article distributed under the terms and conditions of the Creative Commons Attribution (CC BY) license (https://creativecommons.org/licenses/by/4.0/).
Share and Cite
Wei, X.; Li, X.; Liu, W.; Zhang, L.; Cheng, D.; Ji, H.; Zhang, W.; Yuan, K. Building Outline Extraction Directly Using the U2-Net Semantic Segmentation Model from High-Resolution Aerial Images and a Comparison Study. Remote Sens. 2021, 13, 3187. https://doi.org/10.3390/rs13163187
Wei X, Li X, Liu W, Zhang L, Cheng D, Ji H, Zhang W, Yuan K. Building Outline Extraction Directly Using the U2-Net Semantic Segmentation Model from High-Resolution Aerial Images and a Comparison Study. Remote Sensing. 2021; 13(16):3187. https://doi.org/10.3390/rs13163187
Chicago/Turabian StyleWei, Xinchun, Xing Li, Wei Liu, Lianpeng Zhang, Dayu Cheng, Hanyu Ji, Wenzheng Zhang, and Kai Yuan. 2021. "Building Outline Extraction Directly Using the U2-Net Semantic Segmentation Model from High-Resolution Aerial Images and a Comparison Study" Remote Sensing 13, no. 16: 3187. https://doi.org/10.3390/rs13163187