Article

Assessing an Atmospheric Correction Algorithm for Time Series of Satellite-Based Water-Leaving Reflectance Using Match-Up Sites in Australian Coastal Waters

1
National Earth and Marine Observations, Geoscience Australia, GPO Box 378, Canberra, ACT 2601, Australia
2
CSIRO Land and Water, GPO Box 3023, Canberra, ACT 2601, Australia
3
CSIRO Oceans and Atmosphere, GPO Box 2583, Brisbane, QLD 4001, Australia
4
Imagery, Landgate, Midland, WA 6056, Australia
*
Author to whom correspondence should be addressed.
Remote Sens. 2021, 13(10), 1927; https://doi.org/10.3390/rs13101927
Submission received: 6 April 2021 / Revised: 11 May 2021 / Accepted: 12 May 2021 / Published: 14 May 2021
(This article belongs to the Special Issue Atmospheric Correction for Remotely Sensed Ocean Color Data)

Abstract

:
An atmospheric correction algorithm for medium-resolution satellite data over general water surfaces (open/coastal, estuarine and inland waters) has been assessed in Australian coastal waters. In situ measurements at four match-up sites were used with 21 Landsat 8 images acquired between 2014 and 2017. Three aerosol sources (AERONET, MODIS ocean aerosol and climatology) were used to test the impact of the selection of aerosol optical depth (AOD) and Ångström coefficient on the retrieved accuracy. The initial results showed that the satellite-derived water-leaving reflectance can have good agreement with the in situ measurements, provided that the sun glint is handled effectively. Although the AERONET aerosol data performed best, the contemporary satellite-derived aerosol information from MODIS or an aerosol climatology could also be as effective, and should be assessed with further in situ measurements. Two sun glint correction strategies were assessed for their ability to remove the glint bias. The most successful one used the average of two shortwave infrared (SWIR) bands to represent sun glint and subtracted it from each band. Using this sun glint correction method, the mean all-band error of the retrieved water-leaving reflectance at the Lucinda Jetty Coastal Observatory (LJCO) in north east Australia was close to 4% and unbiased over 14 acquisitions. A persistent bias in the other strategy was likely due to the sky radiance being non-uniform for the selected images. In regard to future options for an operational sun glint correction, the simple method may be sufficient for clear skies until a physically based method has been established.

1. Introduction

Atmospheric, BRDF and terrain illumination corrections have become well established to provide time series of medium- to high-resolution environmental satellites such as the Landsat series and Sentinel-2. Many methods and algorithms have been developed to remove the atmospheric, BRDF and terrain illumination effects in order to obtain consistent and comparable measures of Earth surface reflectance from satellite data [1,2,3]. These corrections go beyond providing basic calibrated and geocoded products traditionally distributed by agencies and have significant advantages—especially for time series and data analytics. Geoscience Australia (GA) developed a time series product that has been applied to the complete Landsat archive of Australia, and, more recently, to other satellite series [4]. The products have mostly been used in various land surface applications, e.g., land cover, fractional cover, water identification, flood mapping, crop monitoring and other time series analysis [4,5]. However, for applications on open/coastal, estuarine and inland water-covered areas, such as estimating water quality, benthic cover, sediment transport and shallow water bathymetry, corrections with different physics that are not included in the land surface reflectance products are needed.
Effective methods for deriving water-leaving reflectance information from remotely sensed data were developed early for the first ocean color Coastal Zone Color Scanner (CZCS) satellite [6]. With increasing data availability, there has been continuing development of models and methods for high sensitivity and low spatial resolution sensors such as SeaWiFS, the MERIS, MODIS and VIIRS. They have also been applied to the high spatial resolution environmental satellites such as Landsat and Sentinel-2 at the scales of concern here. These methods include (among others) the various processing options within the SeaWiFS Data Analysis System software (SeaDAS) [7,8,9], image correction for atmospheric effects (iCOR) [10], atmospheric correction for OLI ‘lite’ (ACOLITE) [11], the polynominal-based algorithm applied to MERIS (POLYMER) [12] and the Case 2 Regional Coast Colour processor (C2RCC) [13].
The continuing improvement in applications has led to widespread use of scientific products from broad scale ocean color sensors [14]. However, validation and inter-comparisons of the methods applied to medium- to high-resolution environmental satellite data return mixed results [15,16,17,18,19,20]. The results from these validation and inter-comparison exercises show that performance at the blue end of the spectrum (coastal blue and blue) and in turbid waters (inland and coastal) were most challenging for the systems and none was shown to work consistently well for all water types. The current methods are generally based on finding a deep clear water reference for atmospheric correction and characteristics of the deep clear water are often used to derive aerosol load and water-leaving reflectance at the same time. Most use a simplified description of the atmospheric correction process that is sufficient for the deep ocean, but seems less so in more complex waters. In addition, many environmental satellites, e.g., Landsat and Sentinel-2, unlike most of the ocean color satellites, have near nadir view. At nadir view, it is often much more difficult to estimate aerosol load using the satellite data itself because of the contamination by sun and sky glint. It seems that many current methods face increasing issues as the waters become more complex and the spatial resolutions increase.
A trial water-leaving reflectance product has been developed within the current GA surface reflectance processing stream which aims to produce a consistent water-leaving reflectance time series in Australian open/coastal, estuarine and inland waters. The time series is being developed as an extension to the current land surface reflectance processing [1] and it will use the same base radiative transfer (RT) code and ancillary inputs which have been successfully applied to land applications. The successful use of RT-based methods for accurate estimation of surface reflectance time series over land areas is well established [3]. For water-covered areas, in addition to atmospheric correction, additional processing needs to include corrections not always applied to the land, such as correction for adjacency effects and unique water processing such as corrections for sun and sky glint effects. Adjacency correction needs consistent RT processing in the land and water, and corrections for sun and sky glint effects are needed to extract water-leaving reflectance from overall surface reflectance. The outputs are proposed as the basis for consistently processed long-term time series that can be used as needed for different applications and analytics. In the same way as for the present land processing system, it is planned to use contemporary independent satellite or climatology products to provide marine aerosol over open ocean and coastal water and the land (or mixed land/water) aerosol over inland waters.
GA’s prototype water-leaving reflectance product has been tested as part of validation by the Commonwealth Scientific and Industrial Research Organisation (CSIRO), using in situ SeaWiFS Photometer Revision for Incident Surface Measurements (SeaPrism) observations [21] in the north east of Australia at the Lucinda Jetty Coastal Observatory (LJCO) and the dynamic above-water radiance (L) and irradiance (E) collector (DALEC) instrument [22] measurements in the north west of Western Australia. Details of the validation can be found in [23]. In this paper, the results are summarized, issues identified in the first phase of validation are resolved and future recommendations are proposed based on the analysis. The paper first describes the basis for the atmospheric, adjacency and sky/sun glint corrections in the prototype water-leaving reflectance product. It then introduces the match-up sites, the measurements made and other data used in the testing and comparison. The outcomes and results from the match-up validation are presented and the remaining issues resolved. Finally, implications arising from the complete analysis are discussed.

2. Methods

2.1. Methods Used to Derive Water-Leaving Reflectance

The background and theory for the GA atmospheric and terrain illumination corrected-surface reflectance product over land have been presented in [1]. A feature of the product is that the processing is maximally physically based and minimally data-dependent or empirical. The processing over water-covered surface aims to be physically based and suitable for all water surfaces including ocean/coastal and inland water. Since the water surface does not involve the land BRDF and terrain illumination effects, a Lambertian surface is assumed and it can be expressed as [24,25]:
L T O A = 1 π E 0 c o s θ s T v T s f v ρ t + 1 f v < ρ > b 1 S < ρ > b + L p
The terms are generally functions of wavelength, source and sensor zenith and azimuth angles. However, to keep the notation simple, the dependence is suppressed except where needed.
In Equation (1), LTOA is the radiance measured by the sensor in the view direction; ρt is the target (Lambertian) surface reflectance in the area defined by the sensor instantaneous field of view (IFOV); <ρ>b is an average reflectance in an adjacent area weighted by the atmospheric point spread function (PSF); fv is the fraction of direct radiation from the surface in the view direction; S is the atmospheric albedo that scatters reflected radiation from the surface back from the atmosphere; Ts and Tv are total transmittances for the sun and viewed radiation; Lp is the path radiance; θs is the source (solar) zenith angle; and E0՛ is Earth–Sun distance-adjusted solar irradiance at the top of atmosphere at the time of sensing. The equation can also be written in terms of the top of atmosphere reflectance (ρTOA):
ρ T O A = π L T O A E 0 c o s θ s = T v T s f v ρ t + 1 f v < ρ > b 1 S < ρ > b + ρ p
The reflectance factor corresponding to the path radiance (ρp) can be defined independently of the spectral solar irradiance. Some satellite sensors (e.g., Landsat 8 and Sentinel-2) now measure ρTOA directly so that for these sensors the relationship between the measurement and ρt can be established without specific knowledge of E0՛. In the processing system used at GA, the terms are defined by running a full, energy-balanced radiative transfer (RT) run of MODTRAN 6 [26]. MODTRAN is based on wavenumber level band models, uses Discrete Ordinates Radiative Transfer (DISORT) Program for a Multi-Layered Plane-Parallel Medium and accumulates to band spectra from the fine level processing. The integrated terms [Ts, Tv, fs, S, ρp] and related terms are output to ensure that the changes in ρTOA due to changes in ρt (at least for a Lambertian earth) predicted by Equations (1) and (2) are close to those obtained from the complete energy balanced RT solution.
Of particular importance is that the expressions for the total transmittances Ts and Tv are accurate and can separate the diffuse and direct irradiances correctly. The total transmittance for the solar irradiance (Ts) can be considered as the sum of a beam transmittance (for the solar beam ts) and a diffuse term (tds) to represent radiation scattered into the cone from the sun to IFOV. That is, Ts = ts + tds and fs = ts/Ts. fs is the fraction of direct radiation at surface, and the fraction of diffuse radiation at the surface (for a black earth) is then 1 − fs or tds/Ts. The direct beam transmittance ts is relatively easy to estimate, but the diffuse transmittance tds is more difficult. Accurate estimation of the diffuse terms generally uses RT modelling, such as DISORT. Reciprocally, the total transmittance of the view cone (Tv) is the sum of a beam (or direct tv) and diffuse transmittance (tdv), where Tv = tv + tdv and fv = tv/Ts. The beam term (tv) represents the transmission of radiation reflected from the IFOV at surface to the sensor, and the diffuse term (tdv) represents radiation from nearby areas entering the cone and being scattered up into the sensor view. The diffuse radiation in the view direction also needs to be accurately estimated, as it includes the reflectance values of other (nearby) pixels and is the source of the atmospheric adjacency effect. The contribution of a pixel in the neighborhood of a target pixel to the diffuse radiation is proportional to its PSF weighted average value. Based on these definitions:
T v f v ρ t + 1 f v < ρ > b = t v ρ t + t d v < ρ > b
That is, the direct transmittance relates to the target reflectance, and the diffuse term to a PSF-weighted background reflectance. If the background average reflectance is significantly different from the target pixel, then it must be taken into account during atmospheric correction processing [27]. The GA processing computes the consistent PSF using MODTRAN with the same atmosphere. The PSF weights can act as a linear filter. As filters can be large, it usually uses fast Fourier transform (FFT) during the operational processing.
Near coasts and islands, as well as in inland lakes with bright or spectrally distinct (e.g., forests) surrounds, the adjacency effect is known to be more significant. There are at least two steps needed to obtain an estimate for ρt. The first step is to assume that the local neighborhood average reflectance is the same as the target (ρeq). Then Equations (1) and (2) are soluble as:
ρ T O A = T v T s ρ e q 1 S ρ e q + ρ p
ρ e q = ρ T O A ρ p T v T s + S ρ T O A ρ p
This solution has accounted for the general (regional) adjacency effects as well as the multiple interactions between the surface and atmosphere. How much it has been affected by local heterogeneity in reflectance (and irradiance) is proportional to δ ρ b = ρ t < ρ > b . For the solution applied at GA, it is assumed that ρeq is close to the “truth”. The PSF filter is applied to the ρeq image, and a first order single step solution is applied, which can be written as [28]:
ρ t ρ e q + 1 f v f v ρ e q < ρ e q > b
This process acts in a similar way to a high pass or sharpening filter. Up to this point, the processing for water and land is consistent, as it must be to undertake the adjacency correction.
Following well accepted steps (e.g., [29]), the radiation above water-covered areas can be separated into that reflected from the (possibly rough) surface boundary by Fresnel reflection, and that refracted into the water and subsequently emerging above the surface after volume transfer and modification. The goal of the surface correction process is to identify the above-water volume term which contains the target information about the water volume and possibly benthic properties. For the present study, the solution from the corrections above (ρt) is modelled as the sum of two reflectance factors, one for that emerging above the water volume (ρw) and the second arising from Fresnel reflections at the water surface boundary (ρg), ignoring the contributions of white caps. The surface reflectance is further sub-divided into factors corresponding to the diffuse irradiance and to the direct solar irradiance.
ρ t = ρ w + ρ g
ρ g = 1 f s ρ s k y , g + f s ρ s u n , g
The additional terms are the sky glint (ρsky,g) and the sun glint (ρsun,g). The model here balances the energy in accounting for these terms using the fraction of diffuse radiation (1 − fs) and the fraction of direct radiation (fs), as derived in Appendix A (Equation (A3)). For near vertical view, as occurs for the images processed in this paper, low wind speeds and assuming a uniform sky radiance distribution (Equation (A14)), the default setting of ρsky,g has been taken as:
ρ s k y , g = ρ F θ v
where ρ F θ v is the Fresnel surface reflectance at sensor zenith angle θv. The validity of these assumptions for coastal and inland water conditions, and alternative estimates when sun glint is strong, will be returned to in the Discussion section of this paper. For the given conditions, observed sun glint is primarily a function of the sun and sensor zenith angles and the azimuth angle between them and the surface roughness, measured by wind speed. The primary study of sun glint based on physical models is due to Cox and Munk [30,31]. Despite the time since this work was done, the method is still used and regarded as the standard (e.g., [32]). A recent and accessible description of the geometrical arguments due to Cox and Munk [31] is in [33]. Appendix A defines the specific model used in this paper (which is based on the same geometry) in detail.
The Cox–Munk [30,31] and similar models have been used to estimate and remove the sun glint to obtain the water-leaving radiance for the CZCS, MERIS and the Sea-viewing Wide Field-of-view Sensor (SeaWiFS) [34,35]. The wind speeds were normally obtained from independent sources, such as the European Centre for Medium-Range Weather Forecasts (ECMWF) global models. However, even if it is possible to carry this out with the coarse resolution ocean color sensors, it is clear from many studies (e.g., [33] for a discussion) that it is difficult to use the wind speed-based physical models directly with high- and medium-resolution sensors. A significant problem is that, at a fine scale, the local wind speeds are highly variable in time and space and often consist of turbulent eddies with multiple scales. In their experiments, Cox and Munk [30,31] found that the roughness of the water was often linearly related with wind speed, but it is clear that other effects, such as diffraction of waves by terrain and bathymetry can also modify the roughness, independently from wind speed. Taken together, it seems that the only accurate information we have on the state of the water and its resulting sun glint during satellite acquisition is from the images themselves. The sun glint estimation therefore must have an empirical or data-dependent component.
Despite the need for an empirical input, the estimation can still be based on Equations (7) and (8) by taking into account (i) that sun glint reflectance is almost constant for different wavelengths (apart from a small variation with refractive index); and (ii) that in the near-infrared (NIR) and shortwave infrared (SWIR), the data are dominated by the sun glint and can be used to estimate the sun glint magnitude. This basic empirical step and the observations (i) and (ii) are the basis for most recent semi-empirical methods that resolve the sun glint term (e.g., [33,36,37,38]).

2.2. Methods Used to Separate and Analyze Glint Effects

During the validation, it was found that the high sun glint levels found in the Great Barrier Reef coastal water around Lucinda created persistent and varying levels of bias in the analysis. In this study, two simple methods were used to remove the sun glint effects and have been compared through their effects on the match-up analysis and accuracy of estimates of ρw. The least complex semi-empirical method for sun glint removal uses the NIR and/or SWIR bands (where there is little diffuse sky radiation) to estimate a constant sun glint reflectance (e.g., A in the following equation) and then compute the correction (sky and sun glint) for all bands as (Appendix A Equation (A3)):
ρ g = 1 f s × ρ s k y , g + f s × A
This expression does not account for differences in refractive index, but they can be included if required (e.g., see [39]). In this equation, it is assumed that A = ρsun,g. There is a wind speed at which the sun glint model is equal to A, and it is sometimes useful to compute this wind speed. For the present paper it was assumed that ρsky,g is given by Equation (9).
The coastal waters around the LJCO are dominated by colored dissolved organic matter and suspended sediments, and therefore generally show a peak in the green spectral range between 500 and 550 nm [40]. At times, the reflectance peak can shift between 550 and 600 nm, when higher concentrations of suspended sediments due to tidal fronts are present. The NIR water-leaving radiance is therefore not always zero. In this case, we believe that the simplest way to estimate sun glint, with reasonable validity, for these types of waters is to assume that the SWIR (1.560–1.660 μm and 2.100–2.300 μm) bands are close to zero or some established minimum value. The corrections to the SWIR bands (b6 and b7 for Landsat 8) can be written:
ρ w 6 = ρ l 6 f s 6 × A   and   ρ w 7 = ρ l 7 f s 7 × A
where ρ w 6 and ρ w 7 are water-leaving reflectance for Landsat 8 bands 6 and 7, respectively; ρ l 6 and ρ l 7 are the surface reflectance after removing the sky glint effect for the two bands; and fs6 and fs7 are fs for bands 6 and 7, respectively. Based on Equations (7) and (8), ρ l j = ρ t j 1 f s j ρ s k y , g and j is Landsat band number and will be 6 or 7 in this case. For the SWIR bands, 1 f s j 0 and ρ w j 0 , from which a simple solution can be defined by setting the average of the two “corrected” SWIR bands to be zero after correction. In that case we have:
A = ρ l 6 + ρ l 7 f s 6 + f s 7
So, the correction for all bands (j = 1, 7) is:
ρ w j = ρ l j f s j × A
This strategy was used to generate the sun glint removed cases in [23].
In many papers (e.g., [37]), especially for above-water instrument processing [38], similar methods have been used to define and subtract the same amount (A) from each band to remove residual sun glint after removing sky glint. The sun glint factor is estimated in the NIR and/or SWIR and then the constant value is subtracted from all bands. The common understanding is that the sun glint is spectrally “flat” and so should be the same for each band. The second strategy was therefore to define:
ρ w j = ρ l j A  
Even though this second model seems to violate the energy balance, because it is often used, both strategies are used and compared in this study.

3. Validation Sites, Data and Processing

3.1. Locations of Sites and In Situ Water-Leaving Reflectance Collection

Reference [23] includes complete details of the sites and data collected for the match-up validation, so only a summary is provided here. The match-up surface radiometry data were collected from a fixed platform at the LJCO, which is located south of Hinchinbrook Island in North Queensland, Australia, and from the Australian Institute of Marine Science (AIMS) research vessel RV Solander in coastal and open ocean waters off the coast of the north west of Australia. Figure 1 shows the locations of the sites and their regional environments. At the LJCO (red box), atmospheric and surface radiometric measurements are routinely collected by CSIRO under the Integrated Marine Observing System (IMOS) Ocean Colour Sub-facility. This site is located at the end of a 6 km-long jetty in coastal waters of the Great Barrier Reef (GBR). The LJCO operates a modified version of a CIMEL CE-318 sun-photometer, capable of performing autonomous atmospheric and above-water radiance measurements at defined viewing and azimuth angles. The system contributes to NASA’s global AERONET-OC network [21] and is called SeaWiFS Photometer Revision for Incident Surface Measurements (SeaPRISM). During clear-sky conditions, the instrument measures the water-leaving radiance at approximately half hourly intervals in 8 spectral bands between 412 and 1018 nm. The SeaPRISM view geometry is 40 degrees onto the water surface from nadir at a relative azimuth of 90 degrees clockwise with respect to the sun’s position and a sky reading is taken at 40 degrees into the sky from zenith. Direct sun and sky radiance (almucantar) measurements are also performed (during data acquisition) to derive spectral columnar AOD and additional products, such as precipitable water vapor. These measurements are available for ground validation. At LJCO, water-leaving radiance data are only available from around noon onwards due to platform limitations. How this affects the data in the current work will be discussed later.
The normalized water-leaving radiance is obtained from the sequence of direct sun, sky and sea-radiance measurements. A detailed description of the processing is available in [21] and can include corrections for residual sky and sun glint. The way that the remote sensing reflectance Rrs has been calculated for this paper is included in [23]. For match-up purposes, if the satellite and in situ data processing for sky and sun glint are consistent, the solution from the GA system (ρw) should be close to ρ w = π R r s , except for some small differences due to sensor look angles or different normalizations.
In addition, through the IMOS Ocean Colour Sub-facility, CSIRO operates the Dynamic above-water radiance and irradiance collector (DALEC) that has been deployed in collaboration with AIMS during voyages on the RV Solander. The DALEC is an autonomous ship-based system that provides hyperspectral above-water radiometry [22]. The sensor head contains three compact hyperspectral spectro-radiometers and is mounted onto the vessel boom positioned overwater to sense the water and sky at angles of 40 degrees from nadir and zenith, respectively, and at a relative azimuth of 135 degrees with respect to the sun. Each radiometer records 200 channels (400–1050 nm) with a spectral resolution of 10 nm spaced at ~3.3 nm intervals. How the remote sensing reflectance Rrs is calculated from DALEC observations is included in [23].

3.2. Landsat 8 Data

Match-ups between the sites in the database of CSIRO DALEC and the SeaPRISM above-water observations were identified in the Landsat 8 granules by GA and CSIRO. Match-ups were calculated using spherical geometry to calculate the minimum distance between the in situ and satellite recorded pixel coordinates on the earth’s surface (great circle distance) and extracted for a 7 × 7 pixel box. The spatial accuracy requirement for a valid match-up sample was approximately 30 m or one Landsat 8 pixel. Prior to the data extraction, the jetty structure was filtered out of the LJCO match-ups, and the target area was adjusted to avoid possible interference from the Jetty infrastructure.
The hyperspectral DALEC and multi-spectral SeaPRISM observations were linearly interpolated to the Landsat 8 bands centered at 443, 482, 561 and 665 nm. Subsequently, the median reflectance values were computed within the 7 × 7 pixel match-up areas to be compared against the matching SeaPRISM and DALEC observations. The quality-controlled satellite and in situ data resulted in 21 samples as matching pairs. In total, 21 Landsat images were processed, and the data spanned from 2014 to 2017. Table 1 lists the data sets used. The satellite images were ortho-corrected L1C data. The column ΔT is the time difference between the time of the Landsat overpass (approximate 10 a.m. local time in Australia) and the time of acquisition of the match-up field data. The time differences are all positive, with an average of 4 h and observation times ranging from noon to nearly 6 p.m. local time.

3.3. Aerosol, Data Sources and Pre-Processing

Selections of aerosol parameters are crucial for the accuracy of estimations of surface reflectance. In this study, aerosol information was provided from three sources. The first is the AERONET data, which are only available for LJCO site; a second source was derived from MODIS AQUA data processed to spectral AOD by an Artificial Neural Network (ANN) [23]; and the third was the climatology data that had been previously used in GA for the land surface reflectance products [41]. The AERONET aerosol parameters are taken as “truth” in this comparison.
The site at LJCO is a part of the AERONET network, a worldwide network of observing stations described in detail in [42,43]. Spectral AOD data were obtained from the AERONET archive, matching the dates of the Landsat overpasses. The MODIS AQUA based aerosol data set was produced using a three-layer perceptron ANN trained by simulations of a coupled ocean-atmosphere radiative transfer model. An earlier version of the method can be found in [44,45] for MERIS, which was further developed as part of the CSIRO eReefs project [46] where it was extended to MODIS and VIIRS. Specific details of this aerosol data, as well as validations, are available in [23]. The data were provided as AQUA images for data matching to the overpass times with four bands of spectral AOD data in selected CIMEL bands (nm): (40,550,670,870). The third aerosol data source uses a climatology aerosol based on a CSIRO long term average of Advanced Along-Track Scanning Radiometer (AATSR) [41]. Due to concerns about the performance of image-based methods in Australia, a climatology was used to provide consistent and stable estimates of AOD for the land processing. Only the AOD at 550 nm is available from this source. Estimates for the water area were obtained from the adjacent land area. If there was no land in the satellite scene, a constant 0.06 AOD value was used.
The data from the AERONET web site and the MODIS ANN products were provided in the form of AOD at a set of wavelengths. These were then processed to obtain values for the AOD at 550 nm (a normal standard) and the Ångström slope by least squares. The Ångström coefficient [47] is defined from the model developed by Ångström for the spectral AOD:
A O D λ = A O D λ 0 λ 0 λ α
In Equation (15), α is Ångström coefficient and AOD is spectral optical depth at wavelength λ. In this paper, λ0 is 550 nm and the mean Ångström slope is defined as the best (least squares) fit to the logarithmic model, by α based on the multiple measurements of AOD for selected wavelengths between 400 nm to 900 nm. The estimates were used to modify the MODTRAN runs to include this slope with the aerosol model. With MODTRAN and other radiative transfer models used for atmospheric correction, Ångström slope is implicitly chosen by selection of aerosol type. For the LJCO AERONET data, the time series of AOD(λj) spectral values were fitted using Equation (15) to obtain values of AOD550 and α. The data were somewhat variable so that about an hour of data around the Landsat overpass was used for averaging. For the ANN data, MODIS AQUA images were provided both with values of AOD(λj) for selected wavelengths and data quality flags. After setting a filter on data quality, images of AOD550 and α were produced again using least squares. The AOD values used were averages from a neighborhood large enough that at least 30 samples were available.
The summary of values for 21 samples from three data sources is listed in Table 2. Note: α for the GA climatology data is based on the MODTRAN default Navy Maritime aerosol type.
The LJCO AERONET observations (image numbers 1–18) have mean values of 0.094 and 0.8564 for AOD550 and Ångström slope, respectively. The average α value is close to the effective value for the default Marine aerosol type. The AOD is generally small but that is not unusual for Australia.
The data from all three sources at the LJCO site were compared for consistency. It should be pointed out that the ANN data were computed at the time of the MODIS AQUA overpass, about 4 h later than the Landsat overpass. Figure 2a shows the three AOD550 data sets plotted together against observations and Figure 2b shows the two sets of α estimates. They are for the 18 LJCO match-ups in date and time order. In Figure 2a, the MODIS ANN AOD550 values are more variable than those of the AERONET and climatology. The overall correlation between the MODIS ANN and AERONET AOD550 values is found to be 0.6519. The correlation calculated between the climatology and AERONET AOD550 values is lower at 0.5524. The AOD550 means are close between AERONET and MODIS ANN (0.0940 and 0.0925, see Table 2), but the climatology mean is lower (0.0693). The climatology is a long term bi-weekly average, which does not include extreme values and is from data for the adjacent land area, so it would not be expected to be the same as the others.
In Figure 2b, the MODIS Ångström slope data seem to be more “damped” than the CIMEL data, or at least they seem to be without some of the high values. They both sense a high Ångström slope at overpass image 1. This could be due to the dust from the land, and the AOD550 values are also relatively high as well. More extreme results may relate to the time difference between the Landsat and MODIS AQUA overpasses. The mean Ångström slope for the MODIS data is a little low at 0.7103, whereas, for the CIMEL data, it is 0.8564, and the correlation between them is 0.4184. Because most of the AOD550 values are less than 0.1, differences of this order are not significant for the present study. For other ancillary data, the precipitable water was extracted from NOAA NECP data [48] and ozone data were obtained from the Geoscience Australia Analysis Ready Data (ARD) processing system [49]. Altogether, six versions were processed for validation, representing different types of aerosol source and application of sun glint correction (see Table 3).

4. Results

4.1. Initial Validation Results

During the validation, several improvements were made based on limitations found in the data. These include: (i) moving to use the Landsat 8 top of atmosphere reflectance product rather than radiance to remove the effect of selection of solar constant model [50]; (ii) introducing a targeted sun glint model in place of an unreliable default wind-speed based model; and (iii) moving to the use of Navy Maritime aerosol types.
It was found in the early match-up experiments that the results for Landsat band 1 were quite different from the match-up data, and they did not conform with expectations of physical models. Eventually, it was deduced that the problem was that GA was using the radiance product from USGS with a MODTRAN default solar constant that was not compatible with the product. In [50], it was found that for Landsat 8 and Sentinel-2, it was necessary to use the reflectance product or the radiance product with a specifically compatible solar constant identified in the study. The sun glint models will be discussed in the following, and it has also been found that for the data used here, as long as a marine aerosol type is used, the specific values of Ångström slope derived from the different aerosol data sets were not major factors in the analysis. However, using a marine aerosol model seems best.
Figure 3 displays the initial validation results from the all of the match-up observations, using different processing versions of Table 3. The plots on the left panel are values for the products matched between the SeaPRISM and DALEC (X) and Landsat 8 (Y) without any sun glint correction (but including sky glint correction as in Equation (9)), and the plots on the right have used the simple model of Equation (13) to remove sun and sky glint. Two observations can immediately be drawn from the plots in Figure 3. The first is that the difference shows the need for sun glint correction for a sensible comparison and in order to achieve the association needed between the data sets. Lucinda has among the worst histories of sun glint of any Australian site, and the sun can be very high in the sky during mid-summer. The second observation is that although the AERONET aerosol option seemed to be “best” overall, all three aerosol strategies were almost equally useful. In particular, the ANN selection was well correlated with the AERONET data. This was a significant finding as it suggests that contemporary MODIS data (which are potentially available at any site) can be used to estimate aerosol AOD550 and α over ocean water for Landsat processing, or they can be used to develop a climatology to use for time series processing. This potential is being further evaluated at a more diverse set of sites.
However, there was still a small but persistent systematic bias between the cases in the coastal/blue end of the spectrum that remained unexplained. It was unknown whether this bias, which is visible in Figure 3d–f above the 1-1 line, had affected the results.

4.2. Data Re-Assessment

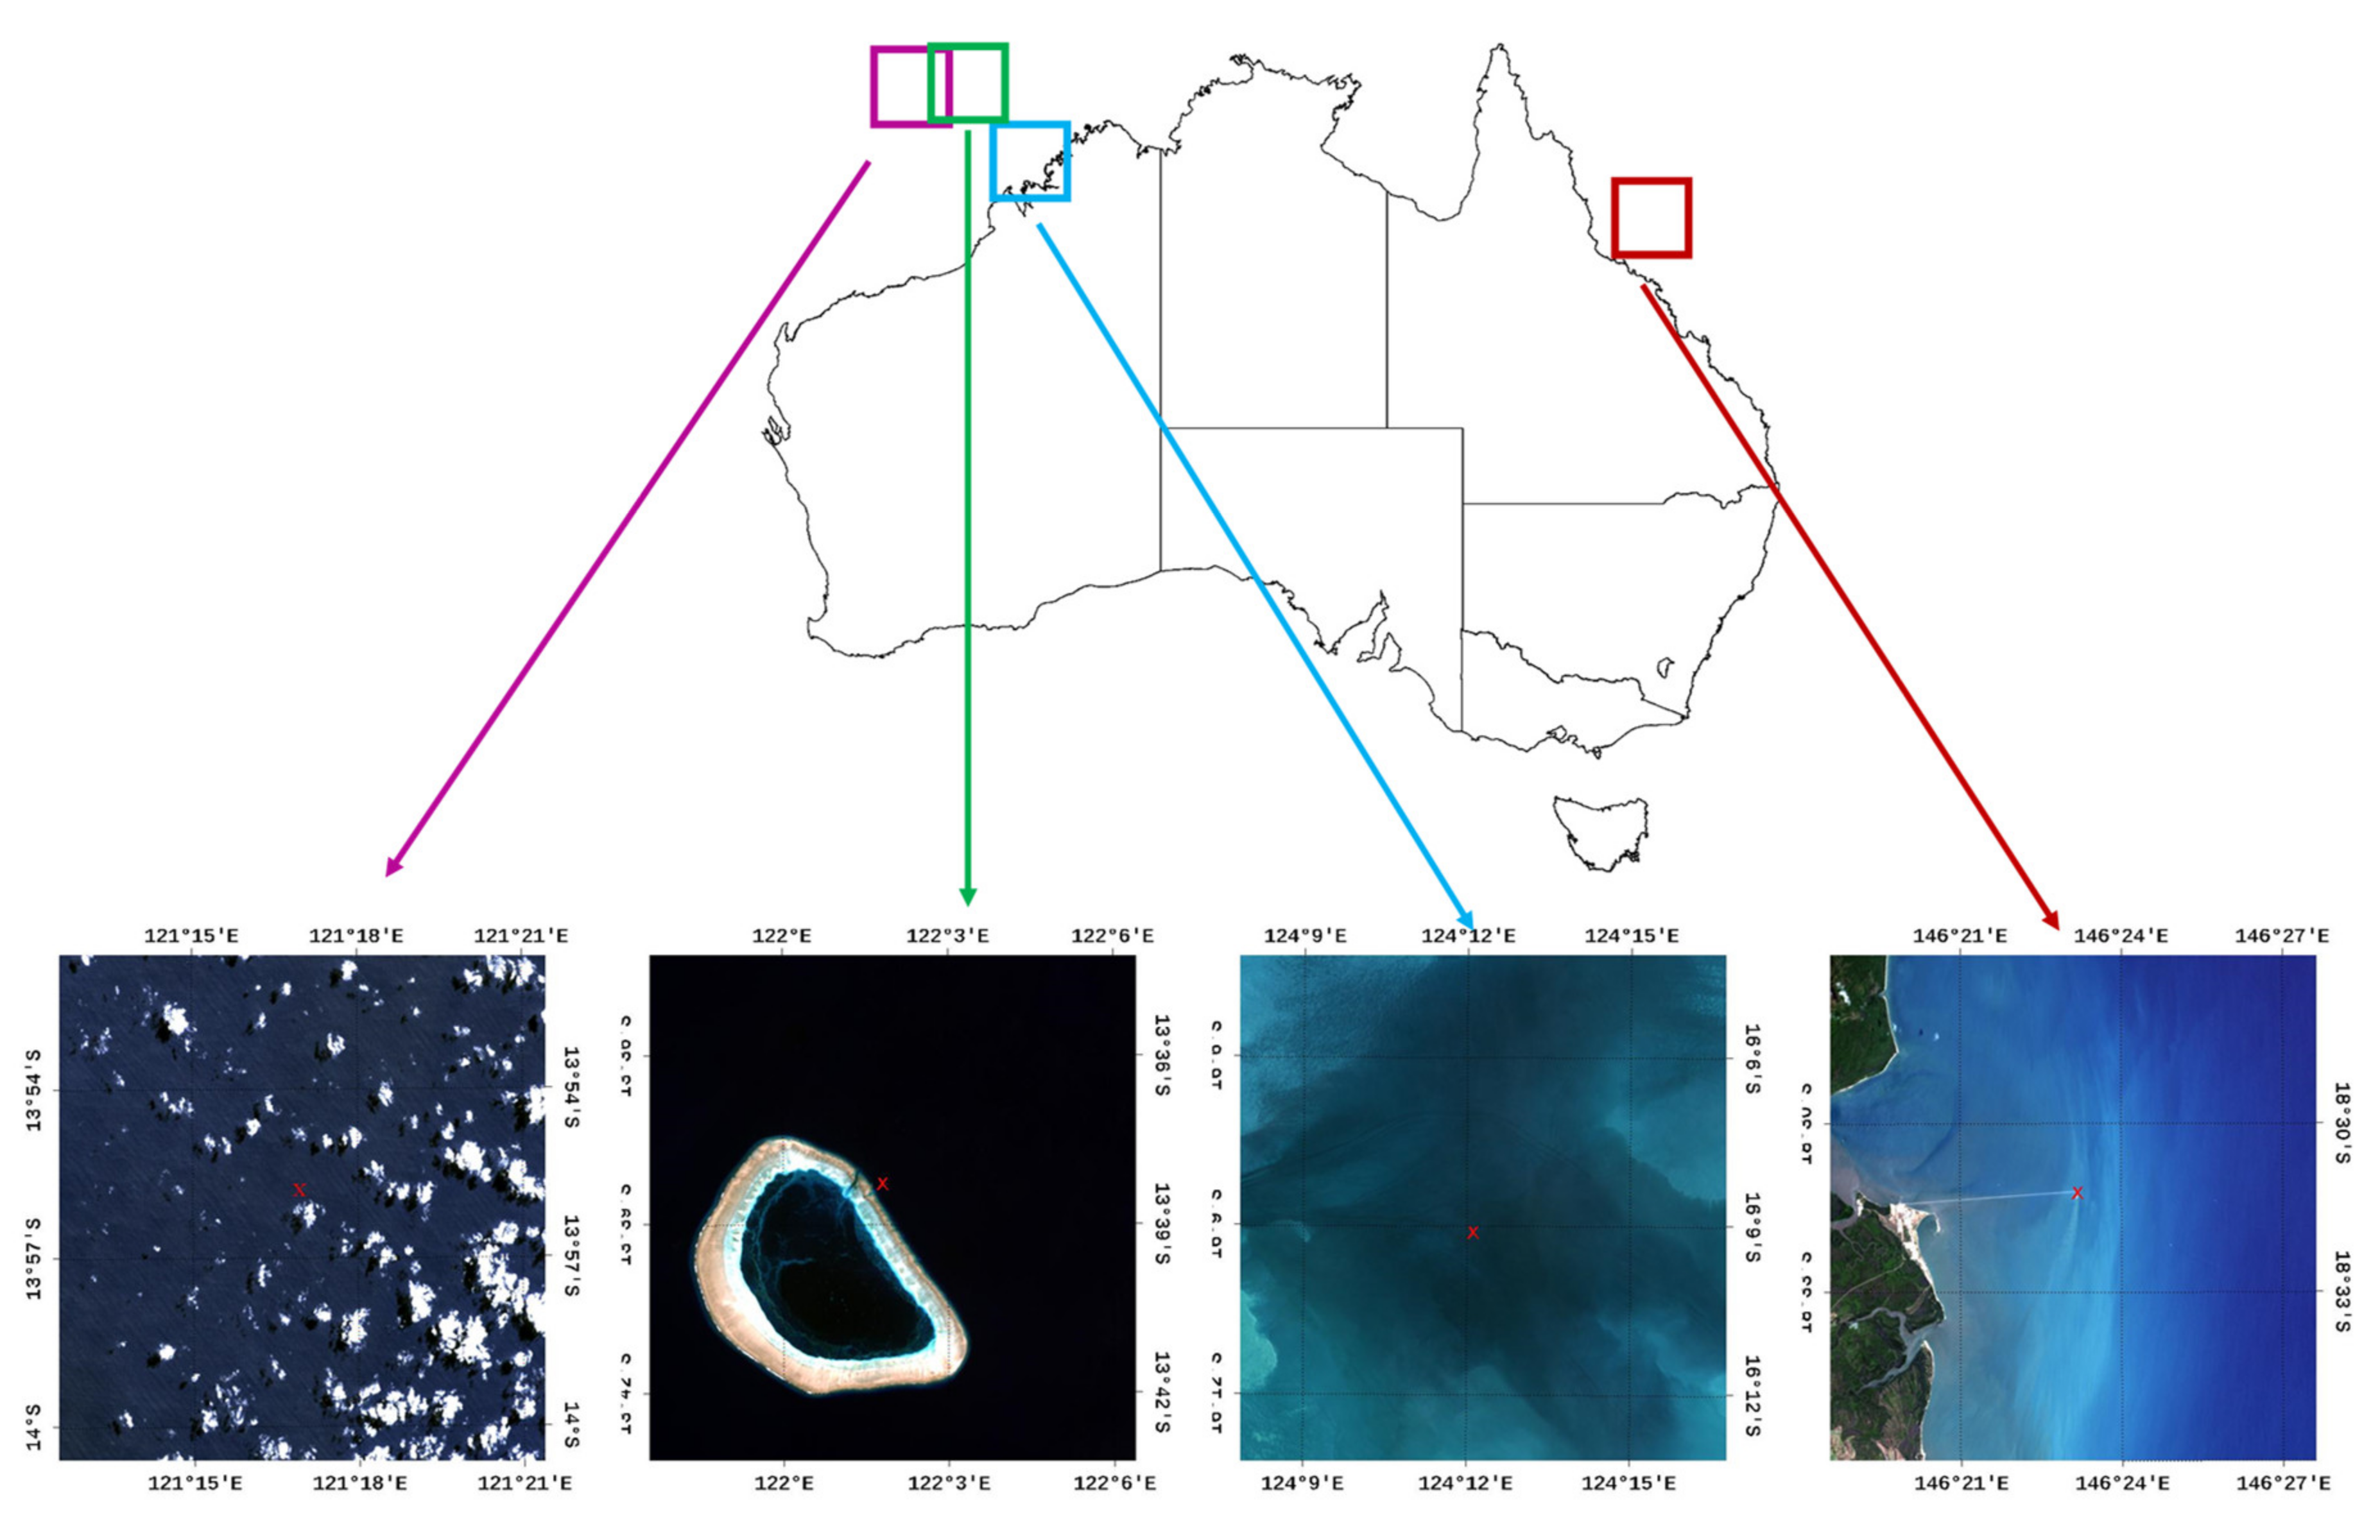
The images were re-investigated and grouped into categories relating to sun glint and time differences between acquisitions. The 18 match-ups at LJCO and the three in north west Australia have quite different waters and environments, as well as instruments and processing methods used. The north west of Western Australia data have been adequately discussed in [23] and only the LJCO match-up site has AOD550 and Ångström slope observations from AERONET. Therefore, only the internally consistent LJCO time series is used in this final analysis. The LJCO site can have quite severe sun glint, especially during mid-summer, when the satellite sensor is viewing more towards the sun glint field. The maximum sun glint statistic (see Appendix A for its calculation) was helpful in assessing images for potential sun glint. The statistic arises because for every situation of given sun and sensor view angles (θS, θV, ϕ), considered as a function of wind speed, there is a “maximum sun glint”. The wind speed at which it occurs can be called the “maximum wind speed”. For wind speeds less than or greater than the maximum case, the sun glint level is lower. For low sun glint cases, (e.g., in winter scenes), the wind speed at which maximum sun glint occurs is large. When the maximum sun glint is high, the wind speed corresponding to it is always small (including commonly occurring speeds). Maximum sun glint does not depend on wavelength, but only on the relative satellite and sun geometries as well as wind speed.
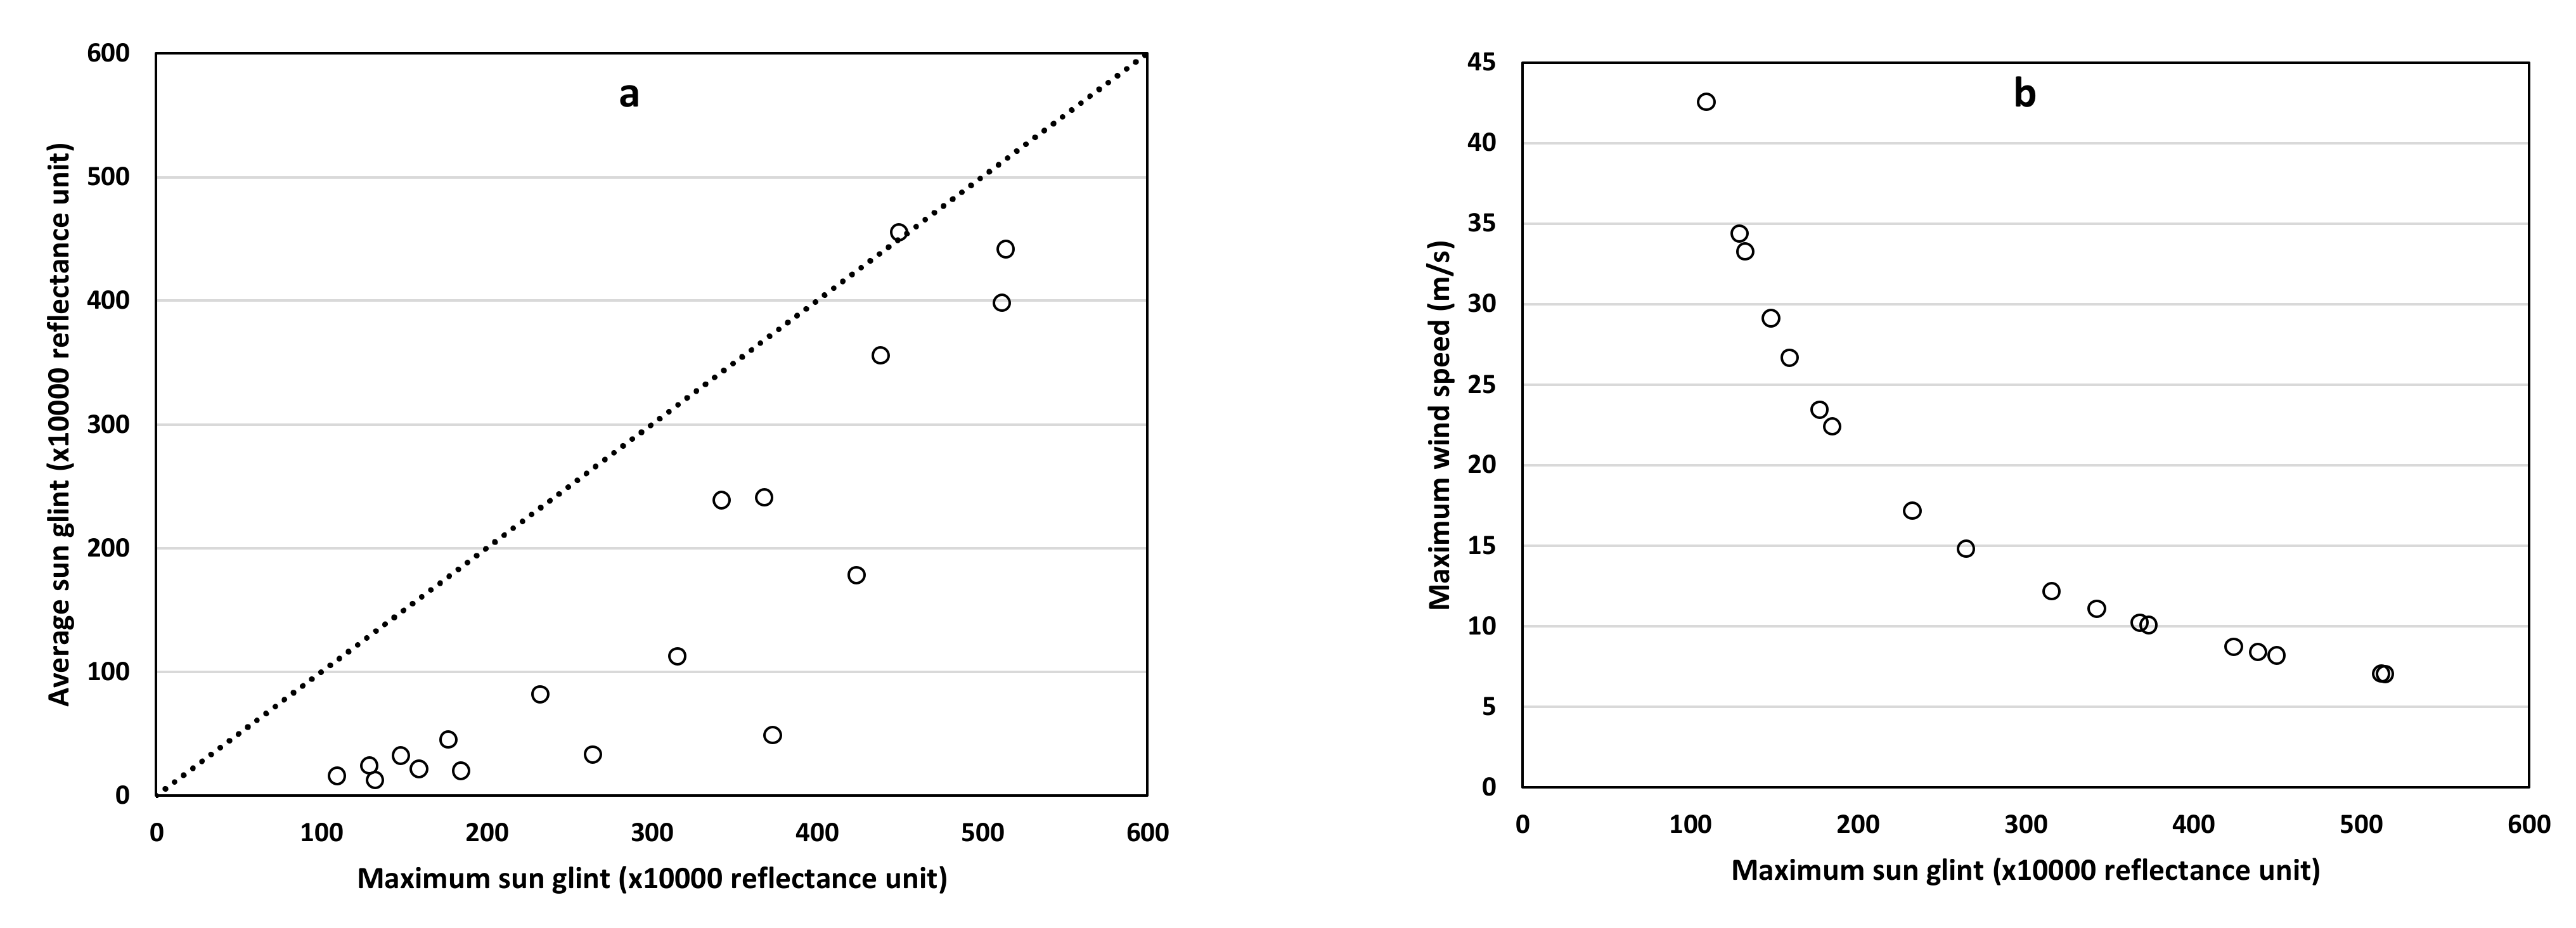
Figure 4 and Table 4 show the computed maximum sun glints and wind speeds for the 18 Landsat images for the LJCO match-up site based on the sun and view angles at the time of data acquisition. Table 4 also includes an estimate for sun glint, which is obtained by averaging the surface reflectance of two SWIR bands after removing the sky glint for these bands ρ l 6 and ρ l 7 in Equation (12)). This is because, for the SWIR bands, ρw should be close to zero and the fraction of direct sun radiation is f s 1 .
There is a wide spread of sun glint levels and the highest values all occur near to December (Austral summer, see Figure 4 and Table 4 for details) when the sun is south of the latitude of Lucinda. The lowest values in almost for all cases are in Austral winter. One value reaches the maximum sun glint, but it is a rare occurrence. Figure 4b shows the relationship between maximum sun glint and maximum wind (m/s). In winter, the maximum sun glint is only obtained with very rough waters (Figure 4b and Table 4) and is possibly never achieved, since the wind speed to reach maximum sun glint could be as high as 45 m/sec. In summer, normally occurring wind speeds (e.g., 7–10 m/s) flare the sun glint and wind speeds as low as 5 m/s can create the (high) maximum sun glint. Some cases (e.g., cases 6 and 18) occur where the estimated sun glint is much lower (e.g., less than 200) than the maximum (e.g., more than 400). It probably means that the local wind speed is either much lower or possibly greater than the maximum wind. Cases where wind speed is above the maximum wind can be hard to process, as the image of the water surface may be rough but dull. Both situations seem to occur at LJCO.
Table 1 shows that there were no cases where the SeaPRISM data were measured at the time of the Landsat morning overpass (approximately 10 a.m. local time in Australia). Most were 3.5–4.5 h later in the early afternoon. This occurred because of the limitations previously described in Section 3.1 for the SeaPRISM to sample suitable water areas in the morning due to the Jetty infrastructure. However, it is quite significant for the re-analysis. The Landsat samples were assessed for potential sun glint in the Landsat data using the maximum sun glint at the overpass time. Taking into account the time difference between acquisition of satellite data and surface observations, maximum sun glint, the SWIR values and visual assessment, it is found that there are: (i) three cases with time difference between image and in situ data > 6 h (maximum > 7 h); (ii) six cases of low sun glint; (iii) six cases of medium sun glint (one medium/low); (iv) three cases of very high sun glint,; and (v) one anomalous image (very different, case 16) which is already among the low sun glint cases.
The statistics for the match-up are valid, despite the time difference, if the water mass remains stable and does not change significantly between the two observations. Three samples with time differences of more than 6 h (later than 4 p.m. local time) have been removed from the further assessment of aerosol and sun glint. The first one of these (case 1) in 
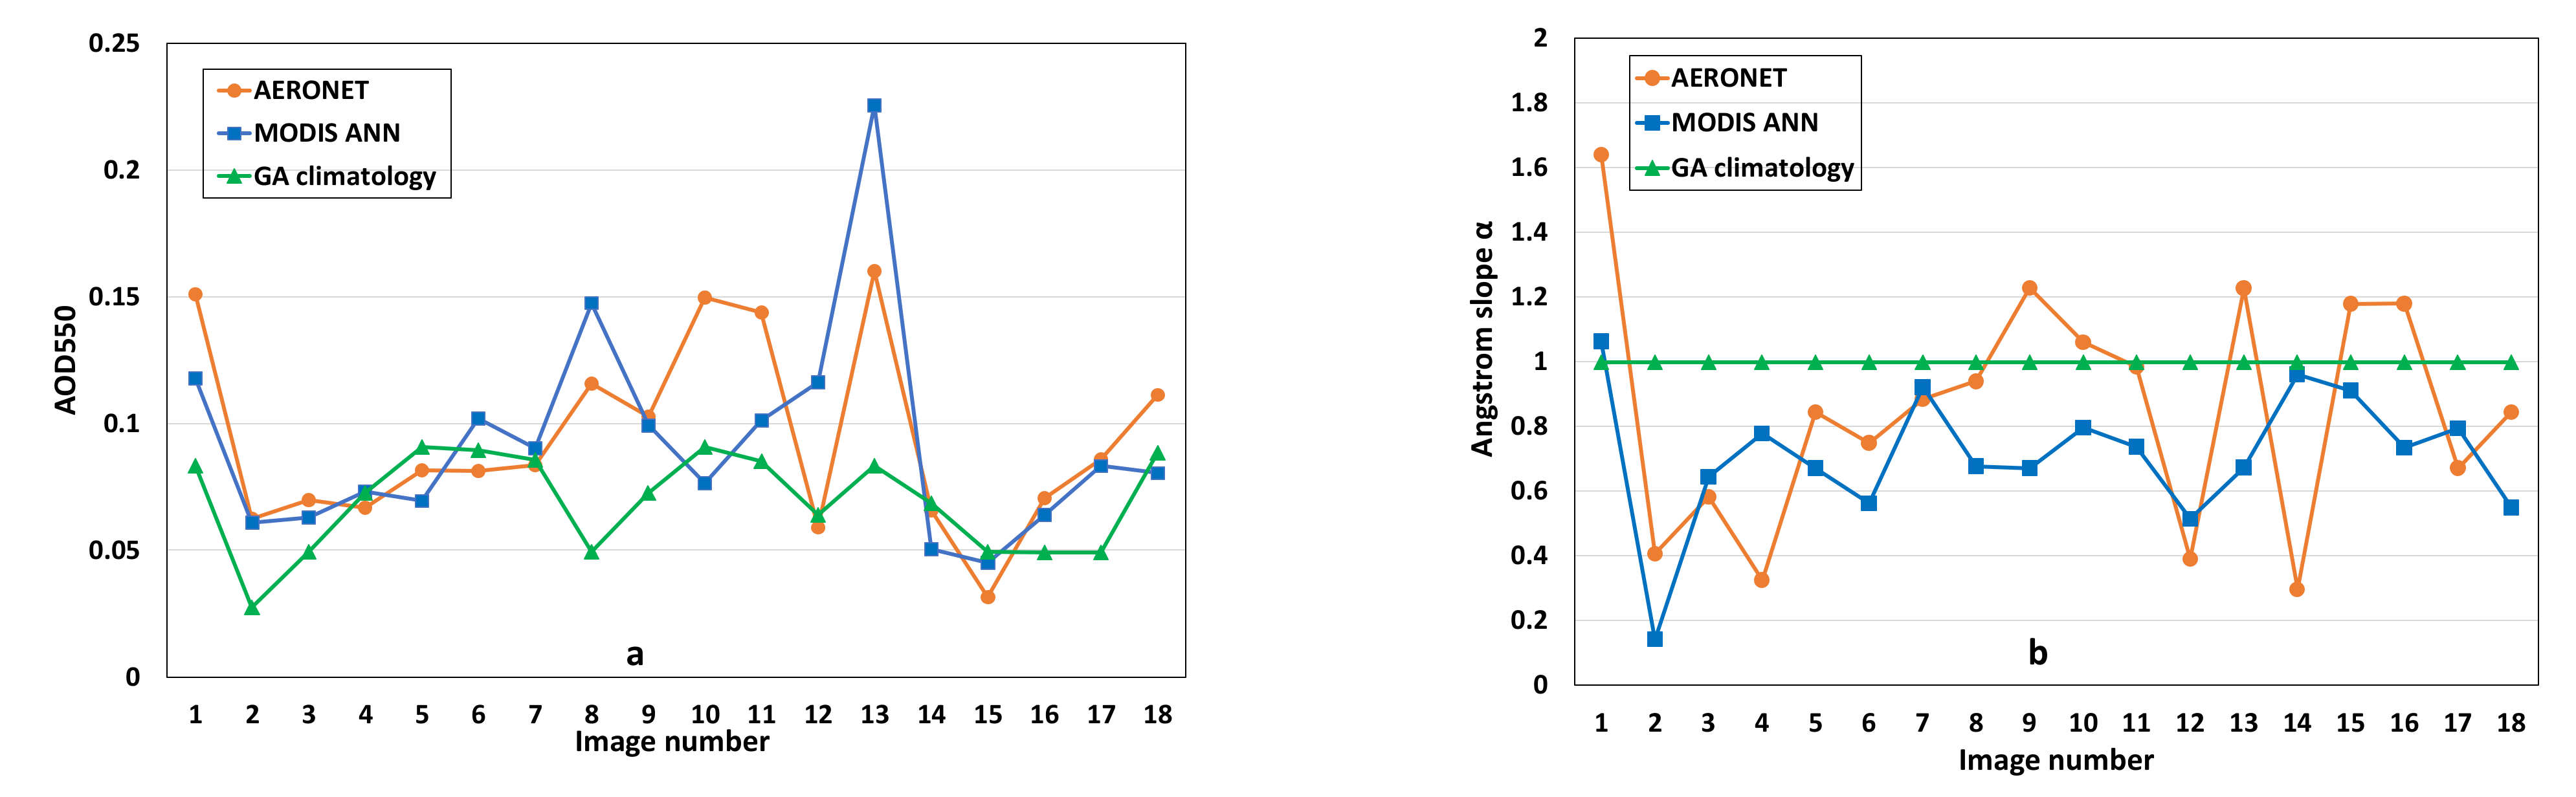
Table 4 was a totally different water signature (the high AOD and Ångström data in Table 2 also indicated a possible wide area dust storm), although the other two are quite well aligned. It is unwise to remove samples only because the values are “very different”. So, in this study, it is reasonable not to use data when ΔT > 6 h. For the others, it seems that they are the same water mass, although their values can be different within the natural variation of the water mass and may sometimes be extreme. The six low sun glint cases are important data. They are not as confounded by the sun glint as are the others. The three very high sun glint cases only provided a small sample, but they were still valuable to use in order to compare the effect of sun glint strategies in more extreme cases. One “anomalous” sample (case 16) was eventually removed for the comparisons, as it had a normal shape but very low values indicating a big change between acquisitions. It was a low sun glint case, so that the number of low sun glint samples retained was only five. Overall, however, the remaining 14 cases form a very good set of samples with different strengths, sun glint conditions and a range of values for comparison.
The 14 images were re-analyzed using the three options of aerosol processing listed in Table 3 (versions 4, 5 and 6 with sun glint corrected). The two sun glint estimations of Equations (13) and (14) were used to provide de-trending for the models. Table 5 lists four different sun glint strategies based on the two primary methods.
The cases Gs1_av and Gs2_av are primarily used to analyze the different aerosol strategies of Table 3 with a common sun glint correction. Gs1 and Gs2 have three different sun glint correction results, each corresponding to aerosol differences, and are best used for comparisons between match-up accuracy and sun glint correction. The average is used for aerosol comparisons as the individual estimates in Gs1 and Gs2 can vary with aerosol type and parameters. To establish the link to the initial results, 
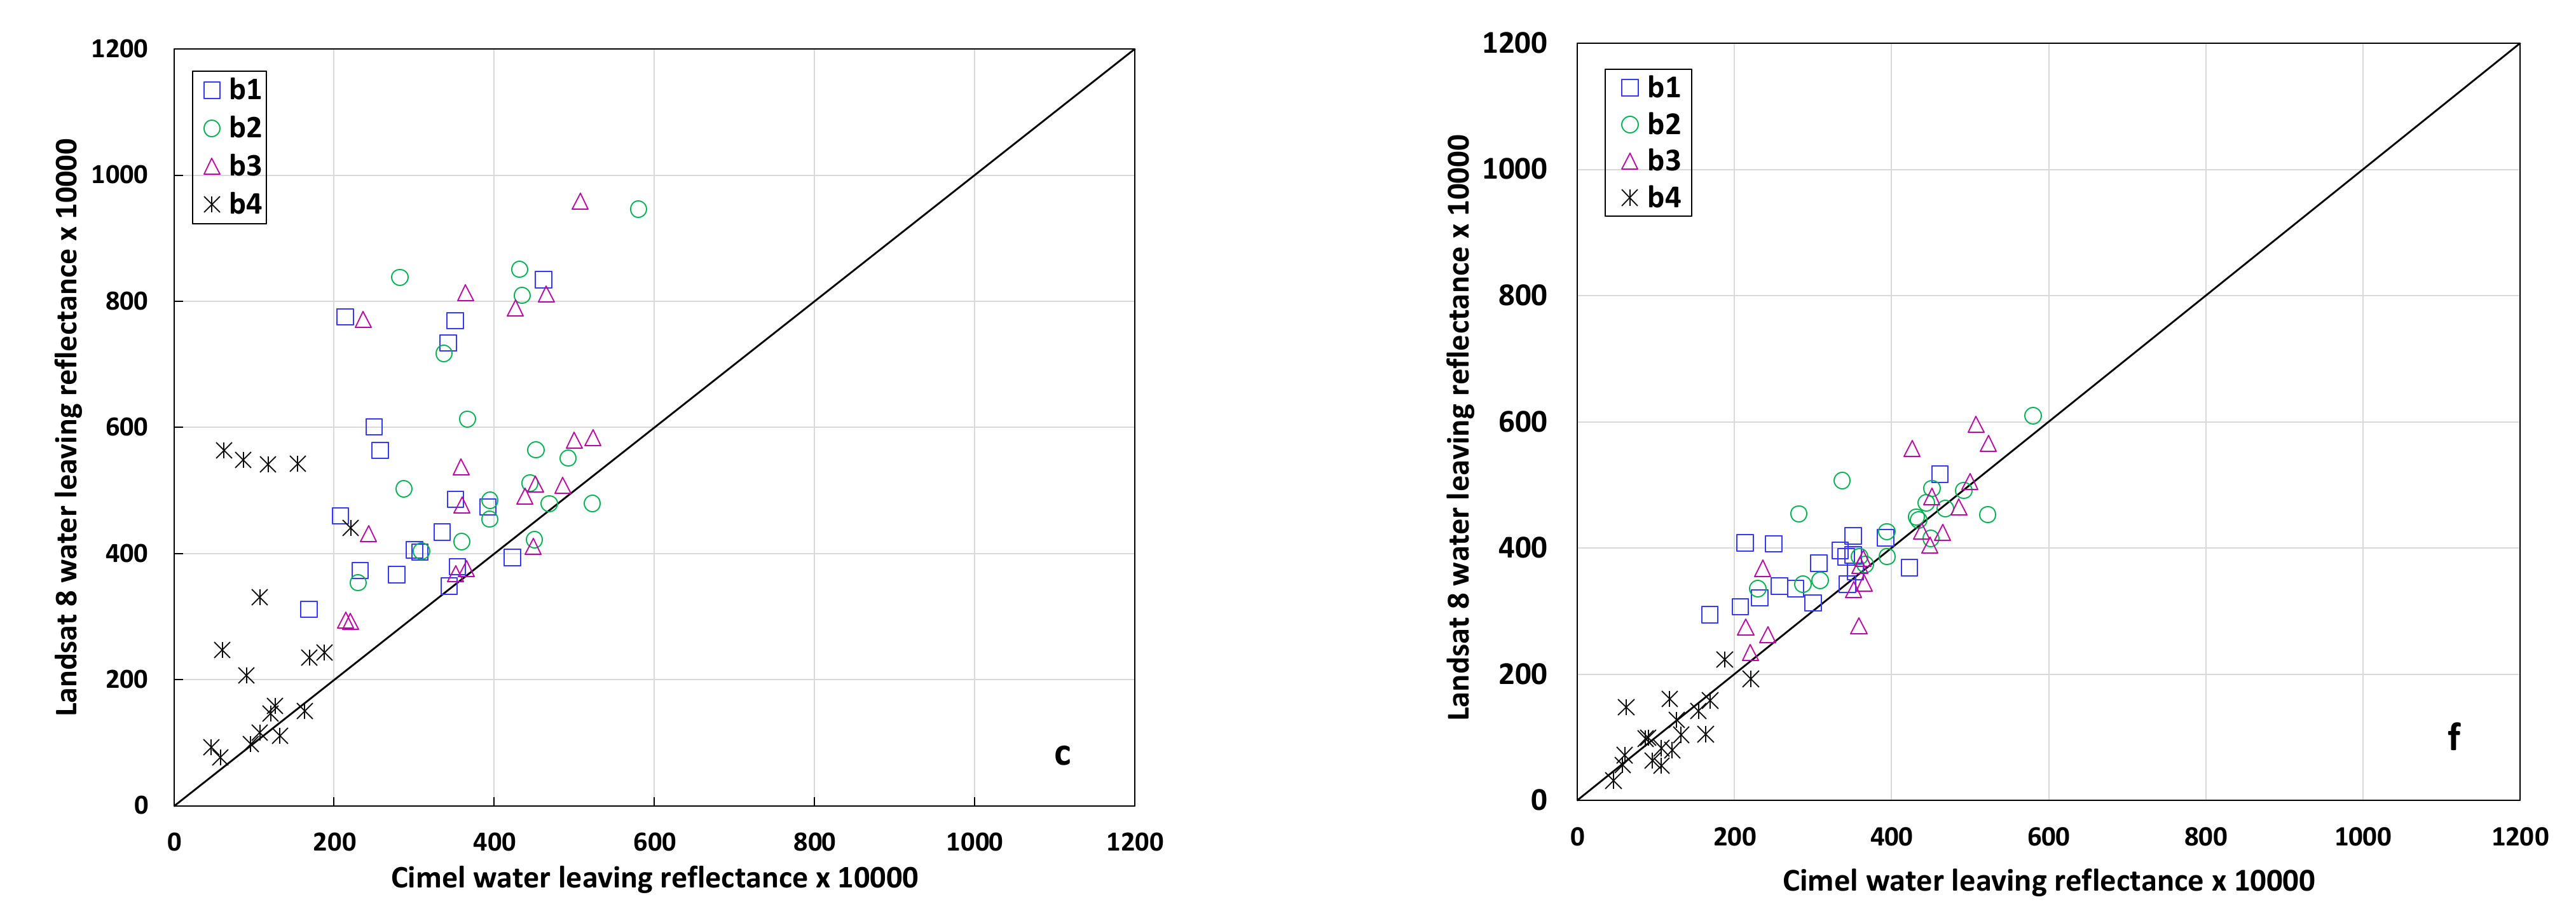
Figure 3f corresponds to using the Gs1 strategy and the AERONET aerosol data.
The results from using the Gs1_av and Gs2_av sun glint strategies are shown in Figure 5. The statistics for Figure 5 are provided in Table 6 by regressing the Landsat data on the SeaPRISM data over all bands. In Table 6, offset and slope are the parameters of a linear regression (not the 1-1 line). A significant difference from zero offset and/or slope of 1.0 indicates bias. The column labelled “R2_adj” is adjusted R-squared correlation. NSR is 100/sqrt(F) where F is the F-ratio in the analysis of variance for the regression. In the same way as the adjusted R-squared, F and NSR are adjusted for degrees of freedom [51]. NSR is the ratio of the RMS error to the RMS model and is used here as an estimate of percent error as zero and negative values can occur from path radiance and sun glint corrections. Finally, the last column labelled “SE” is the standard error of the regression.
The Gs1_av resulted in quite high offsets indicating bias; R2-adj values are less than 0.9 and there are relatively high NSR (5%) and SE (56) values. This result is equivalent to the closest results in Figure 3d–f. The differences here are that these statistics have been based only on LJCO data with the few extreme points removed. However, the results of the Gs2_av are all significantly better than those of the Gs1_av in each statistic. The NSR (3.8%) and SE (39.2) for the best performing aerosol strategy, AERONET, represent less than 0.4% absolute reflectance (i.e., 0.004 reflectance or 0.00127 sr1 Rrs) in SE, or 3.8% relative error as estimated by NSR. The Gs2_av sun glint strategy also shows clearer distinctions between the aerosol strategies. AERONET is best (Table 6), which is what might be expected. The ANN and GA climatology are not as close, but still performed well.
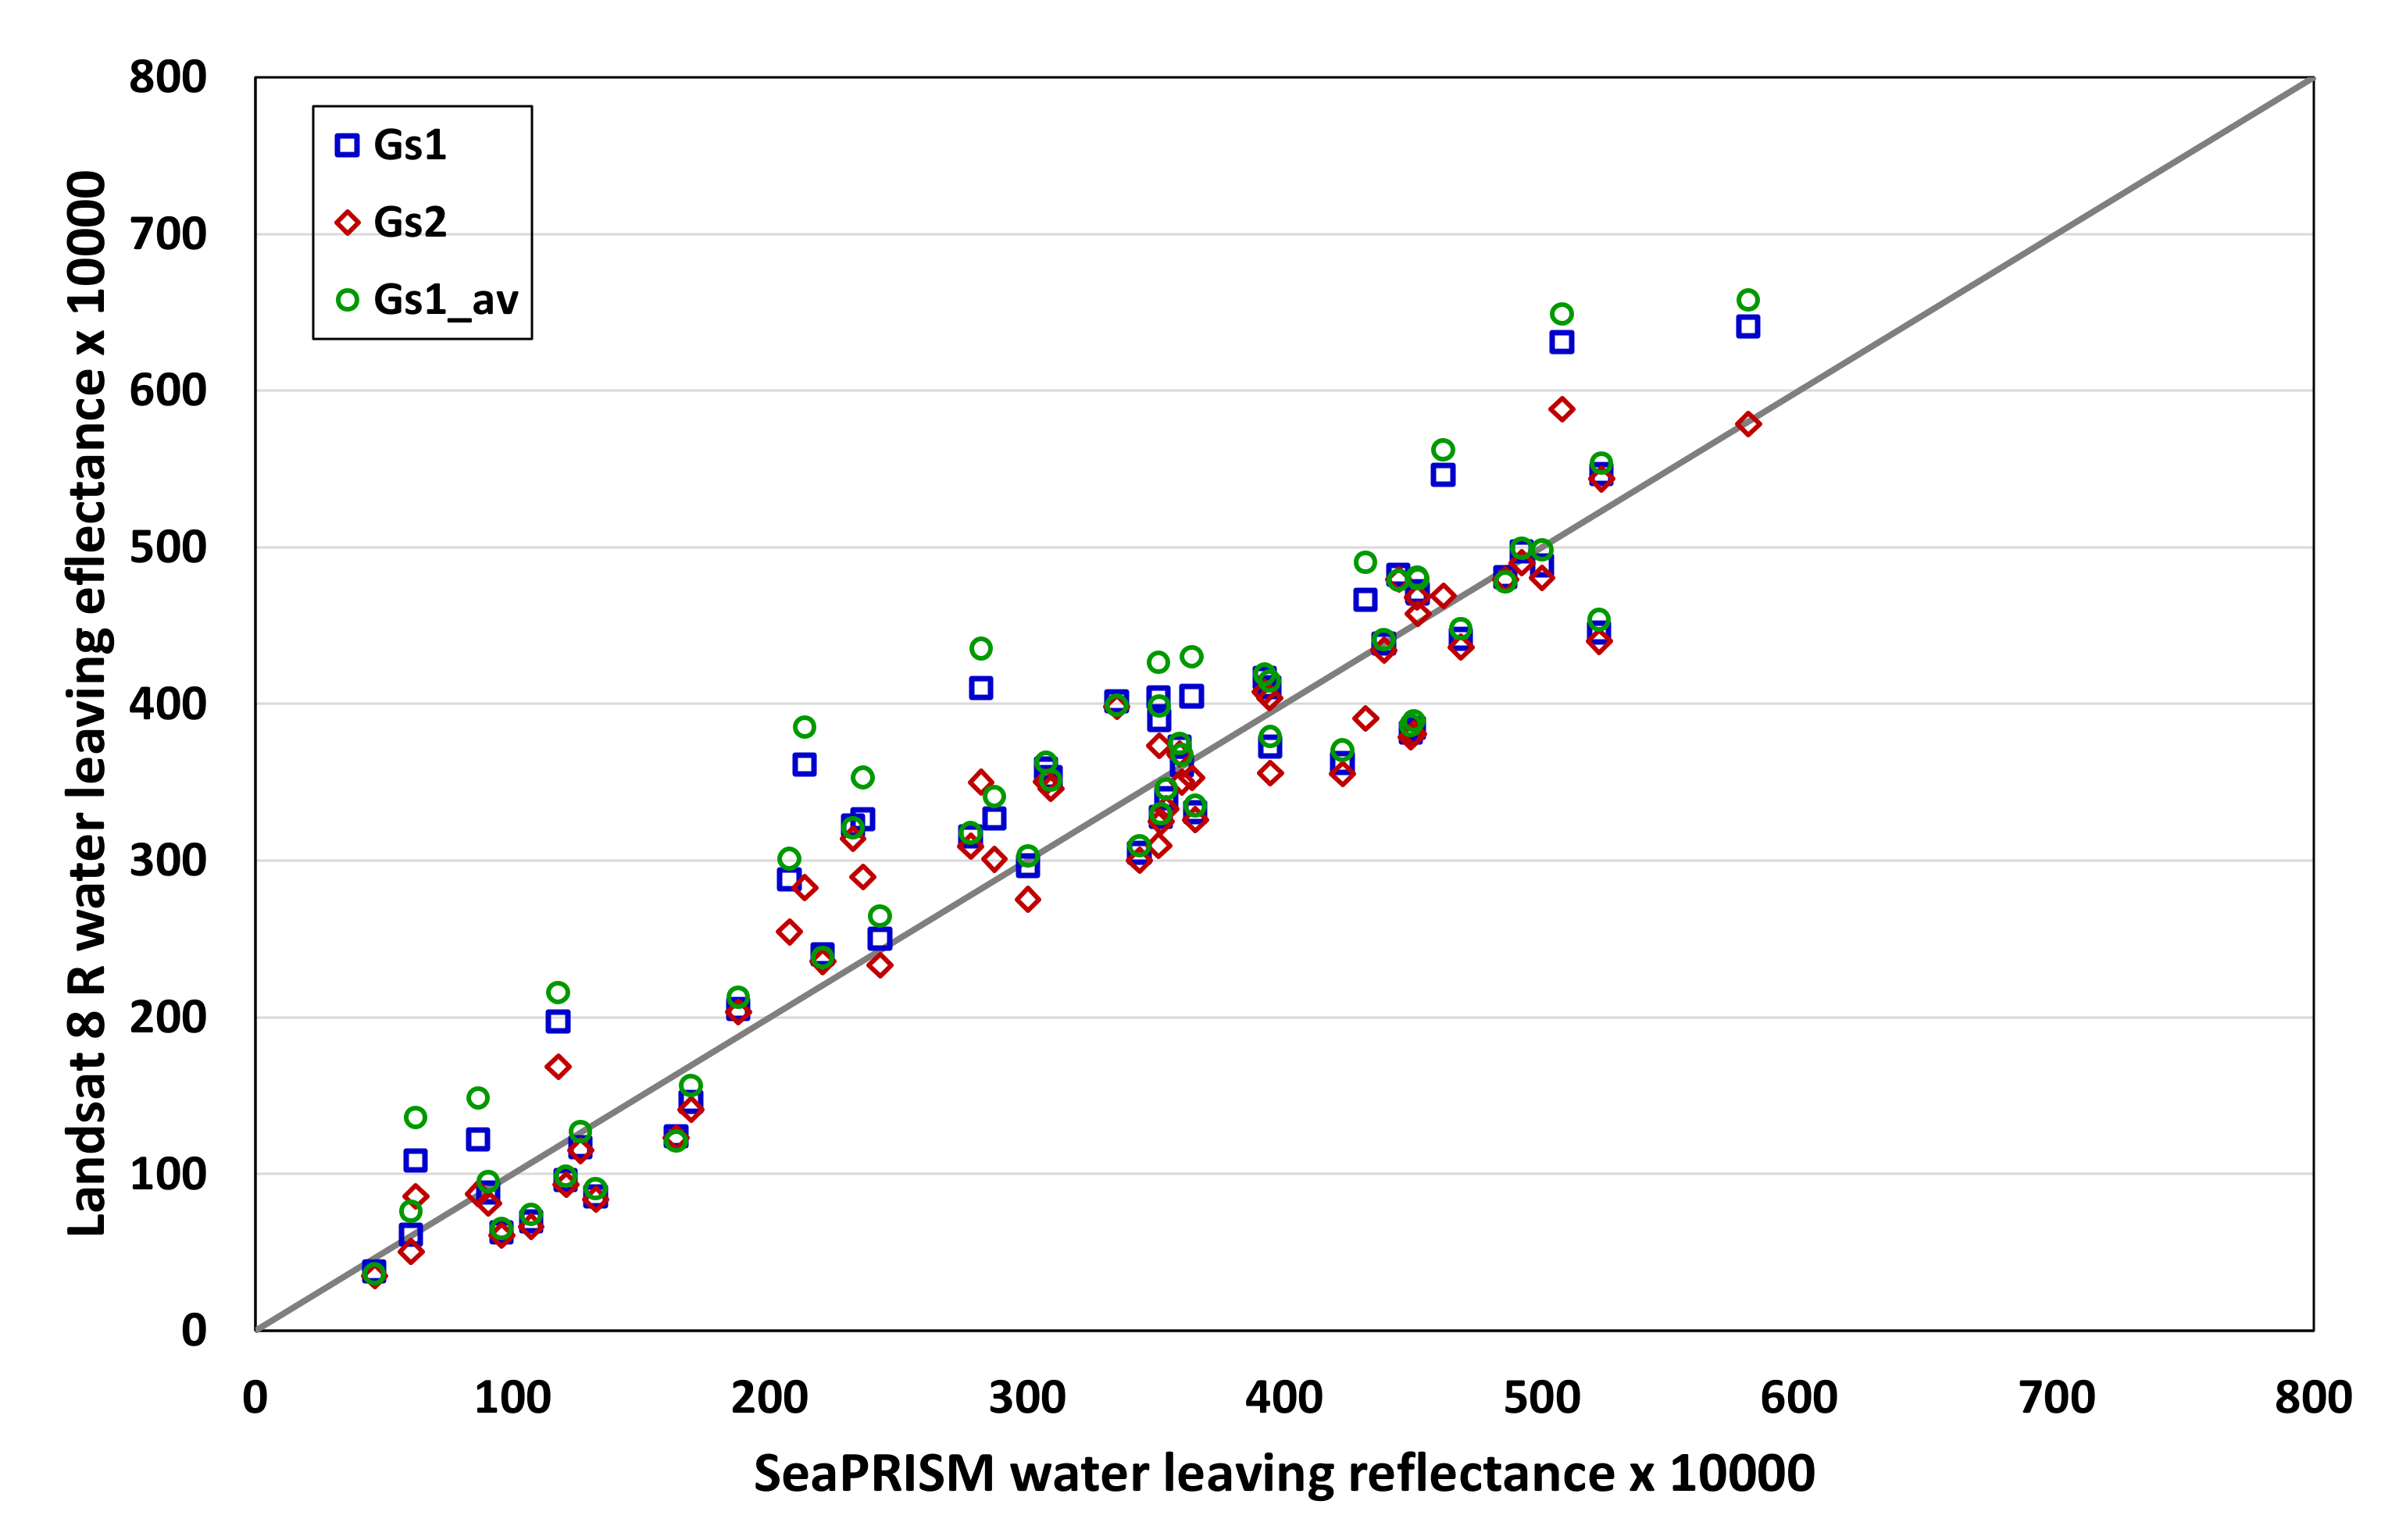
If the AERONET case is used to look at the potential accuracy of the sun glint estimates, it is only necessary to compare the results for the two base sun glint strategies, Gs1 and Gs2. However, as Gs1_av is equivalent to the best matching result in the match-up project result in Figure 3f, it is included as a basis for comparison. As was the case before, using the AERONET information makes extrapolating the results to other situations conditional on having good aerosol information. The results are plotted in Figure 6 and the resulting statistics listed in Table 7. It is clear that Gs1_av and Gs1 provide lower accuracy than Gs2, with Gs2 (red diamonds) as overall the best result. Gs1_av and Gs1 clearly have a higher bias offset value.
The best result in SE for Gs2 represents a difference (SE) between Landsat 8 and the SeaPRISM values of less than 0.004 reflectance or 0.00127 sr1 Rrs estimated over the 14 overpasses. The NSR of 3.76% is a degrees-of-freedom-adjusted estimate for the percent error, and is also small in comparison to the other error budgets. However, as the data sieving would have lowered this estimate, an estimate based on 17 samples, with only the first sample removed, was computed, and this resulted in a SE of 0.0044 or NSR of 4.0%. It has been used to report the best statistical fit to data. The final results also include the independent natural variation in the water mass, as none of the LJCO match-ups are for SeaPRISM data collected at the same time as the Landsat overpass. The inevitable differences between the Landsat and SeaPRISM data sets means the “fit” needs to be statistical, rather than case by case, for each match-up.
The SeaPRISM data were all observed in the afternoon of local time. As previously discussed, the first match-up sample was 7.6 h different, and was a quite different water mass. As the LJCO site is a dynamic tidal mixing area between the coastal and estuarine land side and the open waters of the GBR lagoon, match-up samples were carefully selected. The continuous in-water absorption and scattering optical measurements, including sea and sky webcam imagery at this site, allow an assessment of water mass stability and, therefore, stability of the radiometric observations even at larger time differences. However, taking into account uncertainties from calibration, data processing and environmental perturbations, it has been estimated by [52] that the SeaPRISM uncertainty is 4–5% in the blue and green bands at 443 and 555 nm, respectively, and around 10% at 665 nm. These findings indicate that the accuracy limits with which marine reflectance can be estimated from the Landsat observations at this site have been reached.
It seems that the significant differences in offset bias between the statistics for strategies Gs1 and Gs2 are from the same source as the bias in Figure 3. To isolate the source and nature of the differences, it is useful to consider average results for the match between Gs1 and Gs2 and the SeaPRISM average data (Figure 7). Three groups of averages have been taken. The first is over all of the 14 values used in the previous statistics (Figure 7a). The second is over five low sun glint cases, plus the mid-low sun glint (Figure 7b) and the third is over three high sun glint cases (Figure 3c). The Figure 7a shows a systematic bias for the average of case Gs1 compared with the SeaPRISM average. The difference is likely to be the systematic trend seen in the match-up data. The difference is not “nature” as it is too systematic to be random. It also appears similar in shape to the fraction of diffuse radiation. In the case of Gs2, the difference is small and not as systematic. The match between means shows that the result for Gs2 in Figure 7a is close to unbiased. This is an important observation as, because of the time differences between observations, there will be unavoidable “random” differences at each specific match-up event that could only be reduced in averaging.
Figure 7b shows the average results of six low sun glint cases. Low sun glint does not mean that there is no sun glint, but most are low in both the SWIR and the maximum sun glint statistic. The Gs1 and Gs2 “corrections” were used for the six (days) samples which resulted in signatures that appear to be a little too low due to the forcing of the mean SWIR to zero. There is little difference between applying Gs1 and Gs2, and the systematic bias observed in Figure 7a with Gs1 is not present. Figure 7b also plots another case called “No_sunglint”. This has no sun glint removed and is a little higher than the SeaPRISM data, indicating that some of the samples have some sun glint, albeit small. It also indicates that atmospheric correction is effective even though sun glint correction may need some adjustments in low sun glint situations. For the three high sun glint cases, the averages over the three days are shown in Figure 7c. In Figure 7c, the Gs1 bias is much higher than that in Figure 7a but the Gs2 result is similar to that in Figure 7a. Three samples are too small to obtain the stability of Figure 7a but Figure 7c certainly shows that the bias is systematic and persistent in shape.
Table 8 lists the statistics of the difference between the estimates and the SeaPRISM observations for each of the cases. The mean, RMS and correlation for the “all” and the “high” cases using the Gs1 strategy have large values for each statistic. To achieve some perspective on size, for land targets, a value of 10 (0.1% absolute reflectance or 0.001) is sometimes regarded as almost zero and 20 is very small. Gs1 has a bias significantly correlated with the diffuse fraction. The accuracy of the match-up for Gs2 in all of the studies indicates the underlying accuracy of the atmospherically corrected product – provided sun glint is handled effectively and aerosol is well chosen.
In Table 8, the strong correlation between the “all” samples fraction of diffuse radiation and Gs1 indicates that the shape of systematic bias is that of the diffuse radiation. This means that the bias is likely in the estimate for the sky glint component of the equations and the RMS indicates it is also likely correlated in magnitude with the sun glint.

5. Discussion

5.1. Implication for an Operational Aerosol Strategy

The investigation of aerosol data sources was important for the planning of an operational system. The results of this study re-enforced what had been recommended in [23]. That is, MODIS aerosol information can potentially be used to input current aerosol information or to develop a coastal aerosol climatology.
The best-performing derived AOD and Ångström information sources were used, together with marine and coastal aerosols for coastal and open ocean water and land aerosol for inland water, and implemented in a radiative transfer method (in this case MODTRAN). It was shown to be an effective way to assimilate the data sources for operations. While the AERONET data always gave the best results, using the MODIS ANN information gave results of similar quality and, importantly, they are also available at other times and in other places. This is the basis for concluding that generating a climatology based on MODIS data is a potential option. However, although the use of both AOD and Ångström slope is believed to be useful in the coastal zone, demonstrating its value in this situation will need a more focused study. The majority of AOD values at LJCO were less than 0.1, where it seems that Ångström slope variation and estimation are less critical, so more studies will be needed to fully assess the effects of choice of Ångström slope. The high accuracy of the Gs2 option with AERONET shows that, given suitable aerosol inputs and effective sun glint correction, the estimates of surface reflectance from the atmospheric correction can be effective.
In the future, the option of generating a climatology for coastal and ocean areas can complement the land aerosol approach. Inland waters will necessarily use the present land aerosol strategy, as they are normally not large enough to generate a separate atmosphere. As more satellites become available to generate accurate contemporary aerosol information, the possibility of deriving independent information for the time of acquisition becomes greater, although atmospheric conditions will always limit this, and a default climatology will still be valuable.

5.2. Implication for Sun Glint Correction at Satellite Altitudes

The use of the Gs1 and Gs2 strategies in this study was not specifically intended to define sun glint correction methods. The purpose was to reduce or remove the strong and independently varying sun glint bias that was found in the LJCO data to improve conclusions about fit to surface observations and relative performances of aerosol strategies. However, a conclusion from this work is that sun glint correction is essential in areas such as Lucinda, and that the Gs2 processing seems to have provided an option for sun glint correction. However, more work is clearly needed to evaluate the many options available for this stage of operational processing.
For some of the medium-resolution environmental satellite sensors, such as Landsat and Sentinel-2 series, the view is near to nadir. Unlike the situation for water surface-based radiometers or many ocean color satellites, where the view can be altered to avoid glint, there is no way for these satellites to hide from the sun glint, and sun glint correction is thus needed. Physical models exist for sun glint as a function of water roughness or wind speed. However, as outlined earlier, due to local spatial and temporal variations in surface roughness, using a meteorologically estimated or locally measured wind speed is not sufficient to estimate sun glint. It seems necessary to apply an empirical estimate for the sun glint using information in the near infra-red and/or SWIR. The zero average SWIR was found to be useful in this paper, but it is only one of various options used to estimate local direct sun glint. The works reported in [36,37,39,53] and others all address this stage of the correction in a similar way. However, beyond this step, many of the methods are empirical rather than physical, which can be risky in operational processing. As an option for operational sun glint correction, Gs2 certainly includes some useful properties. It is reversible, simple, uses some physics and involves minimal empirical estimation. A problem is that Gs2 as defined in this paper does not seem to balance the energy, as it mixes terms related to the direct sun irradiance with those apparently related to the scattered diffuse (sky) irradiance. To interpret Gs2 physically, it is useful to consider how above-water radiometric data are processed [38,52]. The methods are all basically similar in form to the model for Gs1, but with a variety of methods for estimating ρsky,g, and expressed in terms of the sky radiance Lsky rather than the energy balance fraction of diffuse radiation [52]. The instrument view geometry is arranged to avoid sun glint, but according to [38], when an instrument cannot take up an optimum position to avoid sun glint, in most cases (e.g., [22,38,53]), the sun glint is estimated from the NIR (and/or possibly SWIR) and subtracted from all bands. This situation led to the alternative use of Gs2 in this paper.
The value used for ρsky,g by different instrument groups (e.g., [38,52]) varies. It is sometimes estimated by empirical equations based on wind speed and its estimation has recently undergone significant discussion. Monte Carlo simulations have been provided in [54,55], which are used by some for operational processing (e.g., [52,56]). The situation at water level is generally more difficult than at the near nadir views of satellites, but it has advantages due to the ability to use view geometry to avoid sun glint. At LJCO, the observation site is on the north of the jetty end, with taller infrastructure to the south. The SeaPRISM always rotates to a position to observe the water at right angles (90 degrees clockwise) to the sun to avoid sun glint. Because of the fixed direction of rotation, the infrastructure prevented morning data near to the Landsat overpass time (approximately 10 a.m. in Australia) from being used. A study by the authors based on maximum sun glint (as defined in Appendix A) suggested that the afternoon SeaPRISM measurements used in this paper all had low levels of potential sun glint. That is, it suggests that the LJCO SeaPRISM observations used in this paper did not contain the extreme levels of regional sun glint that occur in the satellite data. This last point is important, as it implies that the performances of Gs1 and Gs2 were not significantly influenced by different (or the same) methods being used for sun glint correction in the SeaPRISM and satellite data. The variable sun glint and glint bias found at LJCO seem to be an independent effect that occurred primarily in the satellite data.
A physical explanation of the Gs2 model can be obtained by re-grouping the expression for Gs2 (Equation (14)) in Table 7 as:
ρ g = 1 f s ρ s k y , g + A + f s A
The terms fs (fraction of direct irradiance) and (1 − fs) (fraction of diffuse irradiance) represent the energy balance. A is the sun glint reflectance, which is a reciprocal BRF (bi-directional reflectance factor) with magnitude estimated empirically from the NIR and/or SWIR. The apparent problem is that the A value, which is added to ρsky,g inside the bracket, multiplies the diffuse sky radiation, but was derived as a sun glint-related term. However, this way of writing the Gs2 model certainly explains the statistical results (see Figure 7) where the bias ( 1 f s × A ) is correlated with both the shape of the diffuse fraction and also with the magnitude of the sun glint. The Monte Carlo simulations in [54,55] can be used to understand the result. The underlying theoretical ρsky,g term in this paper is the integral over the sky radiance distribution of the sun glint BRF (see Appendix A Equation (A2)). If the sky distribution is assumed to be uniform, the resulting relationship between sky glint reflectance, view zenith angle and wind speed is simulated by [54], which relates it to an early graph for sky glint in [57]. For near vertical view, lower sun angles and lower wind speeds, it is approximately the Fresnel reflectance at the view angle of the sensor. This is basically the model assumed for Gs1, which was found to be systematically biased.
However, if the clear sky distribution is not uniform and has a strong peak at the sun position, the situation can change. In the Figures 6, 8 and 9 in the Mobley paper [54], for high sun angles and higher wind speeds there are significant “sun glint-like” values coming into the diffuse ρsky,g value, due to the non-uniform sky distribution (from [58]) even at some sun-glint avoiding azimuths. It seems that the term (ρsky,g + A) in Equation (16) is an expression of the situation where the scattered sky radiances (including the aureole) are non-uniform and peak around the sun position. This often occurs for clear and sunny days. In Equation (16), this additional sky distribution reflectance effect is approximated by A. It is likely that the sky value of A is not exactly equal to the sun glint A, but its magnitude will certainly be proportional to it. This suggests that there is a way to model the situation physically where (apparently) Gs2 works well and Gs1 does not, to balance the energy and also to model when it will not occur in this way. However, there needs to be more work for these or similar ideas to be implemented in an operational model. In the present situation, and until a better strategy is found, it seems a default (uniform) sky glint reflectance based on [54], with subtraction of empirically estimated sun glint from each band without modification, can be used as a default correction for sunny days. Gs2 has performed well as a sun glint correction in the highly variable glint environment at the LJCO site, and in the future the LJCO site can provide a useful benchmark test site for other candidate methods as well.

6. Conclusions

This study has evaluated an atmospheric correction algorithm over water surfaces, using open and coastal water match-ups and Landsat 8 images. The objective was to assess how well the atmospherically corrected data could match in situ measurements using above-water instruments, such as the SeaPRISM and DALEC. An additional objective was to assess the value of different sources of aerosol data for the processing. It was found that the strong sun glint at Lucinda needed to be handled effectively to reach reliable results. Additional processing has been presented to examine the glint effects, to correct them for the purposes of this analysis and to assess options for a physically based and operational glint correction for the satellite data.
The study of the aerosol options has concluded that the use of aerosol information such as AOD and Ångström coefficient is straightforward enough to be incorporated into radiative transfer programs for operational processing. The resulting solutions, using site aerosol data, were found to be accurate if the sun glint is handled effectively. While AERONET data were best (as expected), alternative more widely available sources from MODIS and aerosol climatology could also be effective. In the generally low AODs found in the site, an AOD climatology would be sufficient. This has led to plans to evaluate options for an aerosol coastal climatology for operational use.
The results for data accuracy and match-up showed that when the sun glint is effectively handled, the match-up data at the longer term LJCO site were as accurate as can be expected, given that the SeaPRISM data and Landsat acquisitions were not concurrent. The water of the site is known to have a tidally varying signature, but the observations seem to be accurately retrieved in the mean and the accuracy level achieved seems not very different from an environmental variation of about 4–5%. For cases where sun glint is very low (e.g., winter cases), the atmospherically and sky glint-corrected data matched the data more closely. In these cases, sun glint correction should not be made to avoid added noise. Two simple strategies were used to remove sun glint. The most successful stategy used the average of two shortwave infrared (SWIR) bands to represent sun glint and subtracted it from each band. The corrected data was found to be accurate and unbiased. The pathway to develop better physically based methods seems to be by extending studies based on realistic sky distributions [54] to the sun and view angles appropriate to satellite data. The simple method can be used for comparisons, while more physically justifiable methods that can work equally in open/coastal, estuarine and inland waters are established from among current options. The glint variation at the LJCO site (and region) of the match-up collection makes it a valuable data set for future comparisons between proposed algorithms.
So far, the water specific use of the algorithm has only been evaluated using coastal and some open ocean water observations and Landsat 8 data. Since the algorithms are to provide a water-leaving reflectance product for all of the water surfaces involved (ocean/coastal, estuarine and inland water) and be sensor-independent, observations from inland water and other satellites (e.g., Sentinel-2) are needed to fully assess its performance. In addition, for stronger statistical recommendations on accuracy and aerosol options, the limited data of this study need to be extended to include other sites.

Author Contributions

Conceptualization, F.L., D.L.B.J., T.S., S.S., J.S. and P.D.; methodology, F.L., D.L.B.J., T.S., S.S., J.S. and P.D.; software, F.L., D.L.B.J., T.S., S.S., J.S. and P.D.; validation, F.L., D.L.B.J., T.S., S.S.; formal analysis, F.L., D.L.B.J., T.S., S.S., J.S. and P.D.; investigation, F.L., D.L.B.J., T.S., S.S., J.S. and P.D.; writing—original draft preparation, F.L., D.L.B.J.; writing—review and editing, F.L., D.L.B.J., T.S., S.S., J.S. and P.D. All authors have read and agreed to the published version of the manuscript.

Funding

This research received no external funding.

Data Availability Statement

AOD data at Lucinda site is from AERONET (https://aeronet.gsfc.nasa.gov/ (accessed on 6 April 2021)).

Acknowledgments

This paper is published with the permission of the CEO, Geoscience Australia. In situ water-leaving reflectance data was sourced from Australia’s Integrated Marine Observing System (IMOS, https://imos.org.au (accessed on 6 April 2021))—IMOS is enabled by the National Collaborative Research Infrastructure Strategy (NCRIS). It is operated by a consortium of institutions as an unincorporated joint venture, with the University of Tasmania as Lead Agent. NCRIS (IMOS) and CSIRO are acknowledged for funding the Lucinda Jetty Coastal Observatory and the DALEC deployments. Landsat 8 raw data were from USGS. The MODTRAN® 6 radiative transfer software was used in calculations and information is taken from the User Manual [7].

Conflicts of Interest

The authors declare no conflict of interest.

Appendix A. Models for Sun Glint, Sky Glint and Maximum Sun Glint

This paper uses the isotropic model for the probability distribution of surface roughness, as discussed and formulated by Cox and Munk [30,31]. The total solar irradiance on the surface (ET) can be separated into direct (Esun) and diffuse (Esky) components so that ET = Esun + Esky. The total surface glint radiance (LG) in the view direction generated from the total solar irradiance is the sum of components generated by the sky glint ( ρ ¯ s k y , g ) and sun glint ( ρ s u n , g ) reflectance as follows:
L s k y , g θ v , ϕ = 1 π ρ ¯ s k y , g θ v ; V E s k y
L s u n , g θ s , θ v , ϕ = 1 π ρ s u n , g θ s , θ v , ϕ ; V E s u n
The reflectance ρ s u n , g θ s , θ v , ϕ ; V is a reciprocal BRF for the sun glint. The primary drivers of the sun glint reflectance values are the sun zenith angle θS, the view zenith angle θV, the relative azimuth angle between sun and view directions ϕ, and the wind speed V in m/sec. The wind speed determines the roughness of the sea surface. If fs is the ratio of direct solar irradiance to total irradiance on the surface, the total surface glint reflectance ( ρ g ) can be written to express the irradiance energy balance in terms of the separate sky and sun glint reflectance values as:
ρ g = π L G E T = 1 f s ρ s k y , g + f s ρ s u n , g
The sky glint reflectance is not independent of the sun glint reflectance and can be written as a function of θV and wind speed V as:
ρ ¯ s k y , g θ v , V = 0 π / 2 1 2 π 0 2 π ρ s u n , g θ v , θ , ϕ ; V N θ , ϕ d ϕ sin θ cos θ d θ 0 π / 2 1 2 π 0 2 π N θ , ϕ d ϕ sin θ cos θ d θ
In this equation, N (θ, ϕ) is the distribution of the diffuse (scattered) radiation sky radiance which includes the aureole. The Fresnel reflectance, ρ F θ at angle of reflection θ in this paper is the unpolarized form:
ρ F θ = 0.5 s i n 2 θ θ s i n 2 θ + θ + t a n 2 θ θ t a n 2 θ + θ
In this expression, the angle of the light refracted into the water column θ = sin 1 sin θ n and ρ F 0 = n 1 n + 1 2 . The refractive index (n) changes slowly with wavelength. For near nadir view and moderate wind speeds, the default value for the sky glint reflectance ρ ¯ s k y , g θ v , V has been taken as ρ F θ v for reasons described below. The sky and sun glint reflectance terms, as functions of the input sun and view angles (θS, θV, ϕ) can then be written:
ρ s k y , g θ v = ρ F θ v
ρ s u n , g θ s , θ v , ϕ = π g ω , β , V ρ F ω
Cox and Munk [31] used an isotropic random Gaussian surface roughness model in which the probability that sunlight is reflected from a facet into the view direction is p(β,V), where V is the wind speed which defines the surface roughness (σ2), is:
p β , V = 1 π σ 2 e t a n 2 β / σ 2
σ 2 = 0.003 + 0.00512 V  
The auxiliary angles (ω, β) are functions only of the input sun and view angles (θS, θV, ϕ).
cos ψ + = cos θ s cos θ v + sin θ s sin θ v cos ϕ
cos ω = 1 2 ( 1 + cos ψ + ) 1 / 2
cos β = cos θ s + cos θ v 2 cos ω
Ψ+ is the angle between the sun and view vectors, ω is the magnitude of the (equal) angles of incidence and reflection when the reflection is specular and β is the slope angle the facet must have for the reflection to be specular. The final model is based on Cox and Munk [31] but in the specific form derived by [59] and presented by [29] as:
g ω , β , V = c o s ω 4 c o s 3 β p β , V
This model for the sun glint reflectance is reciprocal. In this paper, we have introduced and used a quantity called the “maximum (sun) glint”. For given sun and view angles and relative azimuth (constant ω and β) as wind speed varies from zero upwards, it is found that the sun glint first increases to a maximum and then reduces. The maximum is the maximum glint and the wind speed at which it occurs is the maximum wind. The quantities are easy to derive for the isotropic distribution. The maximum of p β , V for constant β occurs where σ m a x 2 = t a n 2 β . The wind speed is found from Equation (A9). The maximum glint is used here to evaluate sun glint potential.
If the distribution of the diffuse (sky) radiation is known, Equation (A7) can be integrated using Equation (A4). If the sky distribution is uniform, the value of ρ ¯ s k y , g θ v , V can be expressed directly as:
ρ ¯ s k y , g θ v , V = 1 π 0 2 π 0 π / 2 ρ s u n , g ( θ , θ v , ϕ , V ) sin θ cos θ d θ d ϕ .  
Cox and Munk [31] approximated this calculation and suggested that for uniform sky distribution and low wind speeds the result is close to ρ F θ v . In [54], this integration was revisited, as reported in [57], and it was matched by Monte Carlo simulation. The general situation by Monte Carlo simulation was investigated in [54,55], which looked at influences of sky distributions, clouds and polarization. The outcomes are discussed in the Discussion Section 5.2 of the paper.

References

  1. Li, F.; Jupp, D.L.; Thankappan, M.; Lymburner, L.; Mueller, N.; Lewis, A.; Held, A. A physics-based atmospheric and BRDF correction for Landsat data over mountainous terrain. Remote Sens. Environ. 2012, 124, 756–770. [Google Scholar] [CrossRef]
  2. Vermote, E.; Justice, C.; Claverie, M.; Franch, B. Preliminary analysis of the performance of the Landsat 8/OLI land surface reflectance product. Remote Sens. Environ. 2016, 185, 46–56. [Google Scholar] [CrossRef] [PubMed]
  3. Doxani, G.; Vermote, E.; Roger, J.-C.; Gascon, F.; Adriaensen, S.; Frantz, D.; Hagolle, O.; Hollstein, A.; Kirches, G.; Li, F.; et al. Atmospheric Correction Inter-Comparison Exercise. Remote Sens. 2018, 10, 352. [Google Scholar] [CrossRef] [PubMed] [Green Version]
  4. Lewis, A.; Oliver, S.; Lymburner, L.; Evans, B.; Wyborn, L.; Mueller, N.; Raevksi, G.; Hooke, J.; Woodcock, R.; Sixsmith, J.; et al. The Australian Geoscience Data Cube—Foundations and lessons learned. Remote Sens. Environ. 2017, 202, 276–292. [Google Scholar] [CrossRef]
  5. Mueller, N.; Lewis, A.; Roberts, D.; Ring, S.; Melrose, R.; Sixsmith, J.; Lymburner, L.; McIntyre, A.; Tan, P.; Curnow, S.; et al. Water observations from space: Mapping surface water from 25 years of Landsat imagery across Australia. Remote Sens. Environ. 2016, 174, 341–352. [Google Scholar] [CrossRef] [Green Version]
  6. Gordon, H.R.; Clark, D.K. Clear water radiances for atmospheric correction of coastal zone color scanner imagery. Appl. Opt. 1981, 20, 4175–4180. [Google Scholar] [CrossRef]
  7. Gordon, H.R.; Wang, M. Retrieval of water-leaving radiance and aerosol optical thickness over the oceans with SeaWiFS: A preliminary algorithm. Appl. Opt. 1994, 33, 443–452. [Google Scholar] [CrossRef]
  8. Bailey, S.W.; Franz, B.A.; Werdell, P.J. Estimation of near-infrared water-leaving reflectance for satellite ocean color data processing. Opt. Express 2010, 18, 7521–7527. [Google Scholar] [CrossRef]
  9. Pahlevan, N.; Chittimalli, S.K.; Balasubramanian, S.V.; Vellucci, V. Sentinel-2/Landsat-8 product consistency and implications for monitoring aquatic systems. Remote Sens. Environ. 2019, 220, 19–29. [Google Scholar] [CrossRef]
  10. De Keukelaere, L.; Sterckx, S.; Adriaensen, S.; Knaeps, E.; Reusen, I.; Giardino, C.; Bresciani, M.; Hunter, P.; Neil, C.; Van Der Zande, D.; et al. Atmospheric correction of Landsat-8/OLI and Sentinel-2/MSI data using iCOR algorithm: Validation for coastal and inland waters. Eur. J. Remote Sens. 2018, 51, 525–542. [Google Scholar] [CrossRef] [Green Version]
  11. Vanhellemont, Q. Adaptation of the dark spectrum fitting atmospheric correction for aquatic applications of the Landsat and Sentinel-2 archives. Remote Sens. Environ. 2019, 225, 175–192. [Google Scholar] [CrossRef]
  12. Steinmetz, F.; Deschamps, P.-Y.; Ramon, D. Atmospheric correction in presence of sun glint: Application to MERIS. Opt. Express 2011, 19, 9783–9800. [Google Scholar] [CrossRef] [Green Version]
  13. Brockmann, C.; Doerffer, R. Evolution of the C2RCC neural network for Sentinel 2 and 3 for the retrieval of ocean colour products in normal and extreme optically complex waters. In Living Planet Symposium; ESA: Prague, Czech Republic, 2016. [Google Scholar]
  14. McClain, C.R. A Decade of Satellite Ocean Color Observations. Annu. Rev. Mar. Sci. 2009, 1, 19–42. [Google Scholar] [CrossRef] [Green Version]
  15. Warren, M.; Simis, S.; Martinez-Vicente, V.; Poser, K.; Bresciani, M.; Alikas, K.; Spyrakos, E.; Giardino, C.; Ansper, A. Assessment of atmospheric correction algorithms for the Sentinel-2A MultiSpectral Imager over coastal and inland waters. Remote Sens. Environ. 2019, 225, 267–289. [Google Scholar] [CrossRef]
  16. Pereira-Sandoval, M.; Ruescas, A.; Urrego, P.; Ruiz-Verdú, A.; Delegido, J.; Tenjo, C.; Soria-Perpinyà, X.; Vicente, E.; Soria, J.; Moreno, J. Evaluation of Atmospheric Correction Algorithms over Spanish Inland Waters for Sentinel-2 Multi Spectral Imagery Data. Remote Sens. 2019, 11, 1469. [Google Scholar] [CrossRef] [Green Version]
  17. Mograne, M.A.; Jamet, C.; Loisel, H.; Vantrepotte, V.; Mériaux, X.; Cauvin, A. Evaluation of Five Atmospheric Correction Algorithms over French Optically-Complex Waters for the Sentinel-3A OLCI Ocean Color Sensor. Remote Sens. 2019, 11, 668. [Google Scholar] [CrossRef] [Green Version]
  18. Ilori, C.O.; Pahlevan, N.; Knudby, A. Analyzing Performances of Different Atmospheric Correction Techniques for Landsat 8: Application for Coastal Remote Sensing. Remote Sens. 2019, 11, 469. [Google Scholar] [CrossRef] [Green Version]
  19. Renosh, P.R.; Doxaran, D.; De Keukelaere, L.; Gossn, J.I. Evaluation of Atmospheric Correction Algorithms for Sentinel-2-MSI and Sentinel-3-OLCI in Highly Turbid Estuarine Waters. Remote Sens. 2020, 12, 1285. [Google Scholar] [CrossRef] [Green Version]
  20. Xu, Y.; Feng, L.; Zhao, D.; Lu, J. Assessment of Landsat atmospheric correction methods for water color applications using global AERONET-OC data. Int. J. Appl. Earth Obs. Geoinf. 2020, 93, 102192. [Google Scholar] [CrossRef]
  21. Zibordi, G.; Mélin, F.; Berthon, J.-F.; Holben, B.N.; Slutsker, I.; Giles, D.; D’Alimonte, D.; VanDeMark, D.; Feng, H.; Schuster, G.; et al. AERONET-OC: A Network for the Validation of Ocean Color Primary Products. J. Atmos. Ocean. Technol. 2009, 26, 1634–1651. [Google Scholar] [CrossRef]
  22. Brando, V.E.; Lovell, J.L.; King, E.A.; Boadle, D.; Scott, R.; Schroeder, T. The Potential of Autonomous Ship-Borne Hyperspectral Radiometers for the Validation of Ocean Color Radiometry Data. Remote Sens. 2016, 8, 150. [Google Scholar] [CrossRef] [Green Version]
  23. Schroeder, T. Aquatic Atmospheric Correction—Aerosol Ancillary Data and Product Validation. In Data Analysis Report, Prepared for Geoscience Australia; CSIRO Oceans and Atmosphere: Brisbane, Australia, 2019; 71p. [Google Scholar] [CrossRef]
  24. Adler-Golden, S.; Acharya, P.; Berk, A.; Matthew, M.; Gorodetzky, D. Remote bathymetry of the littoral zone from AVIRIS, LASH, and QuickBird imagery. IEEE Trans. Geosci. Remote Sens. 2005, 43, 337–347. [Google Scholar] [CrossRef]
  25. Tanre, D.; Herman, M.; Deschamps, P.Y.; De Leffe, A. Atmospheric modeling for space measurements of ground reflectances, including bidirectional properties. Appl. Opt. 1979, 18, 3587–3594. [Google Scholar] [CrossRef] [PubMed]
  26. Berk, A.; van den Bosch, F.J.; Hawes, T.; Perkins, P.F.; Conforti, G.P.; Anderson, R.; Kennett, G.; Acharaya, P.K. Modtran 6.0 User’s Manual. Spectral Sciences Inc., Air Force Research Laboratory. 2017. Available online: http://modtran.spectral.com/ (accessed on 6 April 2021).
  27. Tanre, D.; Herman, M.; Deschamps, P.Y. Influence of the background contribution upon space measurements of ground reflectance. Appl. Opt. 1981, 20, 3676–3684. [Google Scholar] [CrossRef]
  28. Li, F.; Jupp, D.L.B.; Sagar, S.; Wang, L.W.; Coghlan, R. Atmospheric correction for a Landsat and Sentinel-2 product over water surfaces. In Proceedings of the 22nd International Congress on Modelling and Simulation, Hobart, Tasmania, Australia, 3–8 December 2017. [Google Scholar]
  29. Sturm, B. Ocean colour remote sensing and quantitative retrieval of surface chlorophyll in coastal waters using NIMBUS CZCS data. In Oceanography from Space; Gower, J.F., Ed.; Plenum Press: New York, NY, USA; London, UK, 1981; p. 267. [Google Scholar]
  30. Cox, C.; Munk, W. Some problems in optical oceanography. J. Mar. Res. 1955, 14, 63–78. [Google Scholar]
  31. Cox, C.; Munk, W. Slopes of the sea surface deduced from photographs of sun glitter. Bull. Scripps Inst. Oceanogr. 1956, 6, 401–488. [Google Scholar]
  32. Zhang, H.; Wang, M. Evaluation of sun glint models using MODIS measurements. J. Quant. Spectrosc. Radiat. Transf. 2010, 111, 492–506. [Google Scholar] [CrossRef]
  33. Kay, S.; Hedley, J.D.; Lavender, S. Sun Glint Correction of High and Low Spatial Resolution Images of Aquatic Scenes: A Review of Methods for Visible and Near-Infrared Wavelengths. Remote Sens. 2009, 1, 697–730. [Google Scholar] [CrossRef] [Green Version]
  34. Wang, M.; Bailey, S.W. Correction of Sun glint Contamination on the SeaWiFS Ocean and Atmosphere Products. Appl. Opt. 2001, 40, 4790–4798. [Google Scholar] [CrossRef]
  35. Gordon, H.R.; Voss, K.J. MODIS Normalized Water-Leaving Radiance. MODIS Algorithm Theoretical Basis Document, Version 5; NASA: Washington, DC, USA, 2004; 121p.
  36. Hedley, J.D.; Harborne, A.R.; Mumby, P.J. Simple and robust removal of sun glint for mapping shallow-water benthos. Int. J. Remote Sens. 2005, 26, 2107–2112. [Google Scholar] [CrossRef]
  37. Hochberg, E.J. (Ed.) HyspIRI Sun Glint Report; JPL Publication 11-4; Jet Propulsion Laboratory: Pasedena, CA, USA, 2011. Available online: https://hyspiri.jpl.nasa.gov/downloads/2011_Sunglint_Report/2011_HyspIRI_Sunglint_Report_11-4.pdf (accessed on 6 April 2021).
  38. Garaba, S.P.; Zielinski, O. Methods in reducing surface reflected glint for shipborne above-water remote sensing. J. Eur. Opt. Soc. Rapid Publ. 2013, 8, 8. [Google Scholar] [CrossRef] [Green Version]
  39. Harmel, T.; Chami, M.; Tormos, T.; Reynaud, N.; Danis, P.-A. Sunglint correction of the Multi-Spectral Instrument (MSI)-SENTINEL-2 imagery over inland and sea waters from SWIR bands. Remote Sens. Environ. 2018, 204, 308–321. [Google Scholar] [CrossRef]
  40. Soja-Woźniak, M.; Baird, M.; Schroeder, T.; Qin, Y.; Clementson, L.; Baker, B.; Boadle, D.; Brando, V.; Steven, A.D.L. Particulate Backscattering Ratio as an Indicator of Changing Particle Composition in Coastal Waters: Observations from Great Barrier Reef Waters. J. Geophys. Res. Oceans 2019, 124, 5485–5502. [Google Scholar] [CrossRef]
  41. Qin, Y.; Mitchell, R.; Forgan, B.W. Characterizing the Aerosol and Surface Reflectance Over Australia Using AATSR. IEEE Trans. Geosci. Remote Sens. 2015, 53, 6163–6182. [Google Scholar] [CrossRef]
  42. Holben, B.; Eck, T.; Slutsker, I.; Tanré, D.; Buis, J.; Setzer, A.; Vermote, E.; Reagan, J.; Kaufman, Y.; Nakajima, T.; et al. AERONET—A Federated Instrument Network and Data Archive for Aerosol Characterization. Remote Sens. Environ. 1998, 66, 1–16. [Google Scholar] [CrossRef]
  43. Holben, B.N.; Tanré, D.; Smirnov, A.; Eck, T.F.; Slutsker, I.; Abuhassan, N.; Newcomb, W.W.; Schafer, J.S.; Chatenet, B.; Lavenu, F.; et al. An emerging ground-based aerosol climatology: Aerosol optical depth from AERONET. J. Geophys. Res. Space Phys. 2001, 106, 12067–12097. [Google Scholar] [CrossRef]
  44. Schroeder, T.; Fischer, J.; Schaale, M.; Fell, F. Artificial-neural-network-based atmospheric correction algorithm: Application to MERIS data. Ocean Remote Sens. Appl. 2003, 4892, 124–133. [Google Scholar] [CrossRef]
  45. Schroeder, T.; Behnert, I.; Schaale, M.; Fischer, J.; Doerffer, R. Atmospheric correction algorithm for MERIS above case-2 waters. Int. J. Remote Sens. 2007, 28, 1469–1486. [Google Scholar] [CrossRef]
  46. Steven, A.D.L.; Baird, M.E.; Brinkman, R.; Car, N.J.; Cox, S.J.; Herzfeld, M.; Hodge, J.; Jones, E.; King, E.; Margvelashvili, N.; et al. eReefs: An operational information system for managing the Great Barrier Reef. J. Oper. Oceanogr. 2019, 12, S12–S28. [Google Scholar] [CrossRef] [Green Version]
  47. Ångström, A. On the Atmospheric Transmission of Sun Radiation and on Dust in the Air. Geogr. Ann. 1929, 11, 156–166. [Google Scholar] [CrossRef]
  48. Kalnay, E.; Kanamitsu, M.; Kistler, R.; Collins, W.; Deaven, D.; Gandin, L. The NCEP/NCAR 40-Year Reanalysis Project. Bull. Am. Meteorol. Soc. 1996, 77, 437–471. [Google Scholar] [CrossRef] [Green Version]
  49. Geoscience Australia 2020. Available online: https://cmi.ga.gov.au/data-products/dea/365/dea-surface-reflectance-landsat-8-oli-tirs (accessed on 6 April 2021).
  50. Li, F.; Jupp, D.L.B.; Sagar, S.; Schroeder, T. The Impact of Choice of Solar Spectral Irradiance Model on Atmospheric Correction of Landsat 8 OLI Satellite Data. IEEE Trans. Geosci. Remote Sens. 2021, 59, 4094–4104. [Google Scholar] [CrossRef]
  51. Draper, N.R.; Smith, H. Applied Regression Analysis, 2nd ed.; Wiley Interscience: New York, NY, USA, 1981; 709p. [Google Scholar]
  52. Zibordi, G.; Ruddick, K.; Ansko, I.; Moore, G.; Kratzer, S.; Icely, J.; Reinart, A. In situ determination of the remote sensing reflectance: An inter-comparison. Ocean Sci. 2012, 8, 567–586. [Google Scholar] [CrossRef] [Green Version]
  53. Ruddick, K.G.; De Cauwer, V.; Park, Y.-J.; Moore, G. Seaborne measurements of near infrared water-leaving reflectance: The similarity spectrum for turbid waters. Limnol. Oceanogr. 2006, 51, 1167–1179. [Google Scholar] [CrossRef] [Green Version]
  54. Mobley, C.D. Estimation of the remote-sensing reflectance from above-surface measurements. Appl. Opt. 1999, 38, 7442–7455. [Google Scholar] [CrossRef]
  55. Mobley, C.D. Polarized reflectance and transmittance properties of windblown sea surfaces. Appl. Opt. 2015, 54, 4828–4849. [Google Scholar] [CrossRef]
  56. Zibordi, G. Experimental evaluation of theoretical sea surface reflectance factors relevant to above-water radiometry. Opt. Express 2016, 24, A446–A459. [Google Scholar] [CrossRef]
  57. Austin, R.W. Inherent Spectral Radiance Signatures of the Ocean Surface; Duntley, S.Q., Austin, R.W., Wilson, W.H., Edgerton, C.F., Moran, S.E., Eds.; Ocean Color Analysis, SIO Ref. 74-10; Scripps Institution of Oceanography: La Jolla, CA, USA, 1974. [Google Scholar]
  58. Harrison, A.; Coombes, C. An opaque cloud cover model of sky short wavelength radiance. Sol. Energy 1988, 41, 387–392. [Google Scholar] [CrossRef]
  59. Raschke, E. Berechnungen des Durch Mehrfachstreuung Entstehenden Feldes Solarer Strahlung in Einem System Ozean-Atmosphäre; BMBW Publ. W71-20; Bundesminister für Bildung und Wissenschaft: Bonn, Germany, 1971; 120p. [Google Scholar]
Figure 1. Four match-up site locations and examples of Landsat 8 OLI true color images (bands 4, 3 and 2), where the red box in the north east of Australia is the LJCO site, and other three boxes with different colors in the north west of Australia are the DALEC observation sites. See the text for detailed description of the four sites.
Remotesensing 13 01927 g001
Figure 2. AOD at 550 nm (a) and Ångström slope α (b) for the 18 images at LJCO site.
Remotesensing 13 01927 g002
Figure 3. Comparison between satellite-derived water-leaving reflectance (ρw) from different processing versions (Table 3) and in situ observations: (a) version 1; (b) version 2; (c) version 3; (d) version 4, (e) version 5; and (f) version 6.
Remotesensing 13 01927 g003aRemotesensing 13 01927 g003b
Figure 4. The relationship between maximum sun glint and average sun glint (a) and its corresponding wind speed (b) for 18 LJCO samples.
Remotesensing 13 01927 g004
Figure 5. Comparison between different processing options for (a) Gs1_av; and (b) Gs2_av.
Remotesensing 13 01927 g005
Figure 6. The comparison for accuracy for three sun glint strategies listed in Table 5 using AERONET aerosol data.
Remotesensing 13 01927 g006
Figure 7. Water-leaving reflectance comparison between SeaPRISM observations and satellite observations. (a) Average 14 days; (b) average six low sun glint cases; and (c) average three high sun glint cases.
Remotesensing 13 01927 g007
Table 1. Landsat 8 images used for validation.
NoCode/DateIn SituΔTLandsat 8 Scene Center Information
YyyymmddRadiometerhhPath/RowUTC Time (hh)Latitude (°)Longitude (°)Water Type
120140103SeaPRISM7.60095/0730.303118.7902S146.0873Ecoastal
220140628SeaPRISM1.61095/0730.275618.7903S146.1035Ecoastal
320140831SeaPRISM1.57095/0730.281718.7904S146.0985Ecoastal
420140916SeaPRISM3.00095/0730.282518.7903S146.0993Ecoastal
520141002SeaPRISM5.00095/0730.282918.7903S146.1010Ecoastal
620141018SeaPRISM4.37095/0730.284118.7901S146.0880Ecoastal
720141119SeaPRISM6.27095/0730.283118.7903S146.1019Ecoastal
820150818SeaPRISM1.61095/0730.275718.7902S146.0979Ecoastal
920150903SeaPRISM3.52095/0730.277118.7901S146.1040Ecoastal
1020151021SeaPRISM5.25095/0730.281118.7903S146.0968Ecoastal
1120151106SeaPRISM5.72095/0730.282118.79024S146.0913Ecoastal
1220151208SeaPRISM2.95095/0730.282218.7900S146.0987Ecoastal
1320160109SeaPRISM6.62095/0730.281218.7900S146.1081Ecoastal
1420160226SeaPRISM3.75095/0730.278418.7904S146.1086Ecoastal
1520160804SeaPRISM2.64095/0730.280618.7900S146.1027Ecoastal
1620170807SeaPRISM2.64095/0730.280218.7901S146.0924Ecoastal
1720170823SeaPRISM3.57095/0730.281518.7901S146.0925Ecoastal
1820171010SeaPRISM3.85095/0730.284818.7904S146.0794Ecoastal
1920140317DALEC0.00110/0711.819915.9041S123.5765Ecoastal
2020150412DALEC0.89111/0701.897914.4599S122.3463Eopen ocean
2120170408DALEC0.00112/0702.003314.4598S120.8137Eopen ocean
Table 2. Different aerosol sources for the LJCO site.
Code/Date YyyymmddImage NumberAERONETMODIS ANNGA Climatology
AOD550αAOD550AAOD550A
2014010310.15101.63950.11791.06220.08330.9969
2014062820.06240.40570.06090.14050.02730.9969
2014083130.06980.58140.06280.64390.04940.9969
2014091640.06680.32430.07310.77760.07250.9969
2014100250.08160.84300.06940.67010.09070.9969
2014101860.08130.74790.10200.56160.08930.9969
2014111970.08350.88430.09010.92090.08550.9969
2015081880.11570.93880.14750.67610.04940.9969
2015090390.10271.22730.09930.67040.07250.9969
20151021100.14971.05890.07650.79490.09070.9969
20151106110.14370.98310.10120.73590.08500.9969
20151208120.05900.38920.11630.51340.06400.9969
20160109130.16011.22640.22540.67180.08330.9969
20160226140.06560.29460.05050.96040.06840.9969
20160804150.03151.17780.04510.90960.04940.9969
20170807160.07061.17880.06400.73380.04910.9969
20170823170.08580.67060.08330.79330.04910.9969
20171010180.11130.84340.08040.54850.08860.9969
Average 0.09400.85640.09250.71030.06930.9969
2014031719n/an/a0.12050.44440.06000.9969
2015041220n/an/a0.04470.82030.06000.9969
2017040821n/an/a0.23630.22560.06000.9969
Table 3. Processing versions validated.
VersionAerosol TypeAODSun Glint Applied
1MODTRAN Navy MaritimeClimatologyNo
2Ångström from MODISANNNo
3Ångström from AERONET AERONETNo
4MODTRAN Navy MaritimeClimatologyYes
5Ångström from MODISANNYes
6Ångström from AERONETAERONETYes
Table 4. Sun glint assessment for 18 Landsat 8 images covering the LJCO site, where ΔT is the time difference between satellite overpass and in situ measurements (see Table 1).
CaseCode/Date (Yyyymmdd)Sun Glint (×10,000)Maximum Sun Glint (×10,000)Maximum Wind Speed (m/s)Comment
12014010324136810.22ΔT > 6 h
2201406281610942.57Low sun glint
3201408314517823.45Low sun glint
4201409168223217.18Medium sun glint
52014100211331512.17Medium sun glint
6201410181784248.73Medium sun glint
7201411193995127.07ΔT > 6 h; very high sun glint
8201508183214829.13Low sun glint
9201509032018522.41Low sun glint
10201510213564398.41Very high sun glint
11201511064425147.03Very high sun glint
12201512084564508.18Very high sun glint
132016010923934211.09ΔT > 6 h
14201602263326417.83Medium sun glint
15201608042412934.4Low sun glint
16201708071313332.29Low sun glint
17201708232215926.67Medium/Low sun glint
18201710104937310.07Medium sun glint
Table 5. Four sun glint strategies.
Method
Gs1_avρg = (1 − fs)ρsky,g + fsAave, where Aave is the average of A values for the 3 aerosol options listed in Table 3.
Gs1ρg = (1 − fs)ρsky,g + fsA where A is for each of the 3 aerosol options listed in Table 3.
Gs2ρg = (1 − fs)ρsky,g + A where A is for each of the 3 aerosol options listed in Table 3.
Gs2_avρg = (1 − fs)ρsky,g + Aave where Aave is the average of A values for the 3 aerosol options listed in Table 3.
Table 6. Statistical results for Figure 5. Offset, NSR and SE are 10,000 × reflectance.
Sun GlintCaseOffsetSlopeR2_adjNSR%SE
Gs1_avClimatology35.891.00550.86965.2256.26
AERONET29.850.98390.86935.2255.12
ANN35.250.99890.86495.3257.02
Gs2_avClimatology14.020.99350.92143.9441.96
AERONET7.7020.96430.92673.7939.21
ANN10.130.99400.92203.9241.79
Table 7. Statistical results for three sun glint strategies (Gs1_av, Gs1 and Gs2) using the AERONET aerosol data source. Offset and SE are 10,000 x reflectance, NSR is % error.
Sun Glint StrategiesOffsetSlopeR2_adjNSR%SE
Gs1_av29.850.98390.86935.2255.12
Gs119.170.99010.89014.7450.28
Gs27.110.97220.92783.7639.22
Table 8. Statistical results for the differences between three different sample groups and SeaPRISM using AERONET aerosol data source and two sun glint correction strategies. Mean and RMS are 10,000 x reflectance. Corr is correlation coefficient between difference (bias) and diffuse fraction (1 − fs).
CaseGs1Gs2
MeanRMSCorrMeanRMSCorr
All16.0822.290.935−1.589.500.813
Low−11.8415.970.776−7.4518.650.698
High76.9678.460.79221.5425.02−0.683
Publisher’s Note: MDPI stays neutral with regard to jurisdictional claims in published maps and institutional affiliations.

