Article

Measuring Individual Tree Diameter and Height Using GatorEye High-Density UAV-Lidar in an Integrated Crop-Livestock-Forest System

by
Ana Paula Dalla Corte
1,*,
Franciel Eduardo Rex
1,
Danilo Roberti Alves de Almeida
2,
Carlos Roberto Sanquetta
1,
Carlos A. Silva
3,4,
Marks M. Moura
1,
Ben Wilkinson
3,
Angelica Maria Almeyda Zambrano
3,
Ernandes M. da Cunha Neto
1,
Hudson F. P. Veras
1,
Anibal de Moraes
1,
Carine Klauberg
5,
Midhun Mohan
6,
Adrián Cardil
7 and
Eben North Broadbent
3
1
Department of Forest Engineering, Federal University of Paraná–UFPR, Curitiba, PR 80.210-170, Brazil
2
Department of Forest Sciences, “Luiz de Queiroz” College of Agriculture, University of São Paulo (USP/ESALQ), Piracicaba, SP 13.418-900, Brazil
3
Spatial Ecology and Conservation Lab, School of Forest Resources and Conservation, University of Florida, Gainesville, FL 32603, USA
4
Department of Geographical Sciences, University of Maryland, College Park, Maryland, MD 20740, USA
5
Federal University of São João Del Rei–UFSJ, Sete Lagoas, MG 35.701-970, Brazil
6
Department of Geography, University of California–Berkeley, Berkeley, CA 94709, USA
7
Tecnosylva. Parque Tecnológico de León, 24009 León, Spain
*
Author to whom correspondence should be addressed.
Remote Sens. 2020, 12(5), 863; https://doi.org/10.3390/rs12050863
Submission received: 12 February 2020 / Revised: 27 February 2020 / Accepted: 5 March 2020 / Published: 7 March 2020
(This article belongs to the Special Issue LiDAR Remote Sensing of Forest Resources and Wildland Fires)

Abstract

:
Accurate forest parameters are essential for forest inventory. Traditionally, parameters such as diameter at breast height (DBH) and total height are measured in the field by level gauges and hypsometers. However, field inventories are usually based on sample plots, which, despite providing valuable and necessary information, are laborious, expensive, and spatially limited. Most of the work developed for remote measurement of DBH has used terrestrial laser scanning (TLS), which has high density point clouds, being an advantage for the accurate forest inventory. However, TLS still has a spatial limitation to application because it needs to be manually carried to reach the area of interest, requires sometimes challenging field access, and often requires a field team. UAV-borne (unmanned aerial vehicle) lidar has great potential to measure DBH as it provides much higher density point cloud data as compared to aircraft-borne systems. Here, we explore the potential of a UAV-lidar system (GatorEye) to measure individual-tree DBH and total height using an automatic approach in an integrated crop-livestock-forest system with seminal forest plantations of Eucalyptus benthamii. A total of 63 trees were georeferenced and had their DBH and total height measured in the field. In the high-density (>1400 points per meter squared) UAV-lidar point cloud, we applied algorithms (usually used for TLS) for individual tree detection and direct measurement of tree height and DBH. The correlation coefficients (r) between the field-observed and UAV lidar-derived measurements were 0.77 and 0.91 for DBH and total tree height, respectively. The corresponding root mean square errors (RMSE) were 11.3% and 7.9%, respectively. UAV-lidar systems have the potential for measuring relatively broad-scale (thousands of hectares) forest plantations, reducing field effort, and providing an important tool to aid decision making for efficient forest management. We recommend that this potential be explored in other tree plantations and forest environments.

Graphical Abstract

1. Introduction

Because of the high demand for environmental regularization of large companies and farmers, and the need to mitigate the environmental impacts generated by human activities, the number of forest restoration projects has increased worldwide [1]. In an effort to prevent further deforestation and optimize land use as a whole, the Federal Government of Brazil is taking steps to direct the expansion of pastures and crops to already deforested areas and to promote agricultural practices that can increase production in a sustainable manner in areas that are degraded today [2].
In January of 2017, Brazil launched its National Plan for the Recovery of Native Vegetation [3] to promote forest restoration programs and actions. Besides that, another incentive by the Brazilian government is the Low Carbon Agriculture (LCA) program, which promotes research and extension projects, as well as offering credit lines to finance costs related to the implementation/maintenance of integrated crop-livestock and forest system (iCLF) [4,5,6,7]. These systems deserve to be highlighted as an attractive strategy for restoration [8]. Besides the restoration of degraded areas, they also consist of agricultural, livestock and forestry production systems that do not need to open new areas, optimizing land use while providing social benefits to small and medium rural landowners [9,10,11].
Despite these efforts to deploy iCLF systems, accurate tools for monitoring and quantifying these areas are still needed. To this end, forest inventories (FIs) are traditionally considered to describe the structure and to quantify the forest resources, as they help to provide information regarding the state of the forest [12,13]. However, FIs are traditionally based on sample plots, which despite providing valuable and necessary information, are laborious, expensive and spatially limited [14,15]. In this context, a recent remote sensing technology, light detection and ranging (lidar), has attracted much attention from the forest community as a precise tool for forest inventories [16,17]. Airborne lidar (aka airborne laser scanner—ALS) is an active remote sensing technology that can quickly and accurately obtain three-dimensional information about the Earth’s surface [18,19,20].
A number of studies have been developed using this forest area scanning tool. Previous studies have demonstrated the usefulness of lidar for: forest biomass estimation [18,21,22,23,24]; height of the forest canopy [25,26,27,28]; volume [29,30] and basal area [31,32]. Although various types of forest information have been investigated in previous studies, the diameter at breast height (dbh) is the most representative characteristic of a tree and have been measured in most field inventories [33]. To the best of our knowledge, most of the work developed for the direct measurement of dbh was developed using terrestrial lidar (also known as a terrestrial laser scanner—TLS) [34,35,36,37,38,39], since these systems gets high-density-point clouds and can provide more detailed structural information within the forest [36].
TLS has advantages for accurate forest inventory. Previous research [40] explored the methods of using TLS to obtain point cloud data and estimate the height and diameter of individual trees at breast height (dbh), and found a mean RMSE for dbh of 1.28 cm and a mean RMSE for tree height of 0.95 m. In [39], researchers reported RMSE ranging from 1.06 to 3.21 cm for Scots pine (Pinus sylvestris) and 1.19 to 3.58 cm for Norway spruce (Picea abies) using a small set of trees, performing scans specifically designed for single trees, making field measurements from various heights and testing many different modeling methods. Researchers [37] obtained a mean error of less than 1 cm in the lower parts of the loblolly pines (Pinus taeda), which were planted in rows with regular spacing. However, the high time required to collect TLS data (due to its static nature) limits its widespread use among forest technicians and companies [41]. Moreover, these conventional forest inventory techniques are generally based on small plots distributed throughout the population and use statistical extrapolation techniques to generate estimates.
Recently, the use of unmanned aerial vehicles (UAVs) is quickly expanding and should revolutionize remote sensing in natural sciences [42,43]. Improvements in small-scale technology have allowed the use of UAVs as an alternative remote sensing platform, making them even capable of carrying lightweight standalone lidar systems [44,45]. UAV-lidar allows the acquisition of complete population data and is increasingly being used as a way of obtaining structural forest measurements [28]. In addition, the UAV-lidar systems can be used to collect data with an extremely high point density. Currently, little is known about the potential of these new systems in the context of direct measurement of forest structure parameters in the integrated crop-livestock and forest systems (iCLF). Furthermore, the use of UAVs to obtain the taper of a tree would be another gain for forest modeling and would allow adjusting mathematical models to obtain estimates for several forest variables, having great importance in modeling growth and forest production.
Here we present an evaluation of the potential of a UAV-lidar system (GatorEye) to measure forest structural metrics (dbh and individual total height) by an automatic approach in an integrated crop-livestock and forest system (iCLF). We also discuss the methods usually applied to TLS point clouds with the innovation of applying them to UAV-lidar clouds for automatic dbh measurements. Our workflow includes mapping the stems, automatic isolation of stems from isolated trees and finally the extraction of the taper. This procedure should be able to drastically reduce the need for field measurements, which means that a forest inventory can be done more efficiently and with a lower risk of human error and field accidents; field measurement errors may contribute to uncertainties in estimated models of forest attributes from lidar data [46].

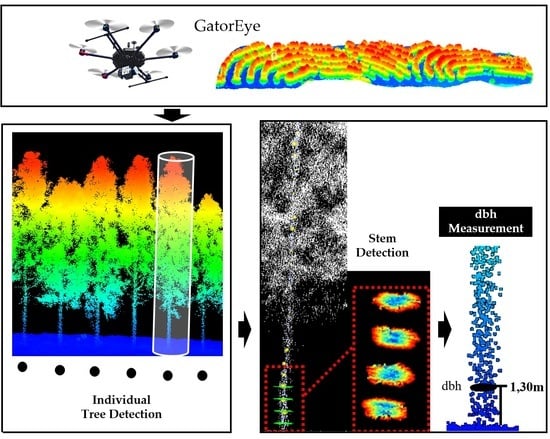
2. Materials and Methods

2.1. Study Area and Field Data

The study area belongs to the Federal University of Paraná (UFPR) in the municipality of Pinhais, State of Paraná, Brazil (25°22′38″S, 49°09′05″W, average elevation of 920 m). Canguiri Site has a project called NITA (Center for Technological Innovation in Agriculture) (Figure 1). The local climate, according to Koppen’s classification, belongs to the type Cfb, subtropical humid without a dry season. The mean monthly temperature of coldest month below 17 °C and mean monthly temperature of the hottest month below 21 °C. The average annual rainfall of 1550 mm, which is slightly concentrated in January and June [47].
The study was conducted on a forest plantation with approximately 17 hectares and corresponds to an iCLF system (integration of crop, livestock and seminal forest plantations of Eucalyptus benthamii Maiden et Cambage). The planting occurred in September 2013 by a contour line and had a spacing of approximately 2 × 14 m (357 individuals ha−1) [48].
In October of 2019, a total of 63 trees in the forest stand were selected by the simple random sampling process and had their circumference at 1.30 m above the ground measured with a measuring tape (cm) and later transformed into dbh. All planted trees in the forest stand are exactly the same age and have a homogeneity of growth in diameter and height.
The number of trees selected was intended to ensure that the relative sampling error was below 10%. The number of selection trees was a relative error for sample size for DBH variable was 3.18% and for height was 3.87% (95% confidence). The total height (meters) was measured with a Haglöf Vertex IV hypsometer. These field surveys were conducted shortly after the lidar flights in order to reduce time discrepancies. The tree locations were obtained using a Garmin GPS receiver, model 62CSX. According to the GPSMAP 62 series owners manual, the margin of error for exact location is accurate to within ±12 feet (or 3.66 m).

2.2. Lidar Data

The UAV-lidar data was obtained in September 2019, with the GatorEye Unmanned Flying Laboratory (available for download at www.gatoreye.org). The GatorEye comprises a DJI M600 Pro UAV, a Phoenix Scout with STIM300 Inertial Measurement Unit (IMU), and a Velodyne Ultra Puck lidar sensor. It has a 360-degree field of view, is capable of capturing 600,000 dual-return pulses per second, and has a maximum laser range of 220 m. The GatorEye uses an L1/L2 dual-frequency GNSS receiver for generating post processing kinematic (PPK) trajectories through integration with on-site base station data in Novatel Inertial Explorer software (Almeida et al., 2019). The system is capable of an absolute accuracy in the order of 3 cm RMSE [49]. In addition, the GatorEye includes a hyperspectral camera and visual sensor for lidar colorization which were not used in the current study. The flying height was 55 m above the ground at a speed of 8 ms−1 and at an approximate horizontal distance between the adjacent flight lines of 15 m, producing a very high-density lidar point cloud (1400 points per meter squared). The UAV flight lines provide for redundant coverage in the area (overlap of 90%). Additionally, returns were limited to those having a range of less than 100 m, and a field of view of 120 m.

2.3. Methods

To the high-density UAV lidar-derived point cloud, a method developed for automatic measurement of dbh and total height from TLS-derived point clouds was applied. The methodological sequence used for this research is summarized in Figure 2.
First of all, from the raw UAV-LiDAR 3D point clouds, we used lastools functions to merge (lasmerge) las files, clip (lasclip) the interest area, classify ground returns (lasground) and eliminate above canopy spurious returns (lasnoise). Once generated the LAS point clouds were classified into ground and non-ground points using the filtering technique available in LASTools. We then generated a digital terrain model (DTM) with a resolution of 0.5 m. After that, also from the cloud, we applied a false return filter and generated a digital surface raster model (DSM) with a resolution of 0.5 m. Finally, based on the DTM, we generated normalized LiDAR point clouds (las normalized).
Simple random sampling (SRS) was used to select the plantation rows and trees. Eleven (11) lines and sixty and three (63) trees were selected. Subsequently, the DBH and total height were performed by a method applied to the TLS point clouds available in the TreeLS package. The algorithm consists of mapping stems at plot level, automatic isolation of stems of isolated trees and taper extraction [39]. The first step was application of the function to extract the tree positions (extract tree map a thinned point cloud). For that, we used the functions of TreeLS called tlsSample and treeMap. The method voxelize was used in tlsSample with the number 0.05. In treeMap we used the function called map.hough. The parameters of application for this function were: min_density = 0.03, hmin = 1, where: min_density = number between 0 and 1 and focuses on minimum point density within a pixel evaluated on the Hough Transform; hmin = minimum height thresholds within the point cloud in which circle search will be performed. Afterwards, we performed the classification of the points and stems (classify stem points—with function stemPoints) and the extraction of the metrics (extract metrics with function stemSegmentation), according to Figure 3. More technical specifications of how the method works can be found at extraction [39]. An interpolation algorithm was developed, which locates the two closest diameters of the DBH to obtain the value at the height of 1.30 m.
Furthermore, the difference between the averages obtained by the UAV-lidar and the traditional methods of field forest inventory was evaluated. The comparison between the averages was made using the spatial join tool in R. Regression analyses and statistical t-tests of paired two-sample means of the dbh and tree heights were performed to assess the significance of their differences. The trees were classified into two dbh classes and two height classes as shown in Figure 4. For this, the amplitude of the variables was calculated and divided into two equal classes. In the diameter class we get the range of diameters and divide in two classes (maximum value − minimum value). The same method was applied for height as well. For that, the Equation (1) was applied:
Range = ( M a x M i n ) 2 ,
C l a s s   1 = M i n 1   ( M i n   v a l u e )   t o   M a x 1   ( M i n + R a n g e )
C l a s s   2 = M i n 2   ( M a x 1 )   t o   M a x 2   ( M a x   v a l u e )
where:
  • Range = (maximum value − minimum value)/2;
  • Min1 = minimum value of class 1;
  • Min2 = minimum value of class 2;
  • Max1 = maximum value of class 1;
  • Max2 = maximum value of class 2.
For statistical evaluations, the correlation coefficient (r) was calculated to show the percentage deviation between the field and UAV-lidar variables of tree height and dbh. Moreover, the absolute and relative root mean square errors (RMSE) (%) were calculated to explain the deviation between the measured and estimated values of these variables. The relative residues between UAV-lidar and traditional field methods were also calculated and plotted on graphs. Additionally, the bias (relative and absolute) was calculated to observe the error in method. Bias was calculated by taking the average of (observed–predicted). The quality of the 1:1 correspondence between the observed values (obs) and those derived (der) was assured by not rejecting the null hypotheses that H0:α = 0 and H0:β = 1, α and β being the coefficients of their regression (obs = α + β·der) [50].
The lidar data processing and analysis were performed in an R environment [51] (R Core Team, 2019—Version 3.6.1) and Rstudio (Version 1.2.5001), using R packages and functions from LAStools software [52] (Isenburg, 2018).

3. Results

3.1. Dbh Measurement

The dbh of the trees measured by the lidar data processing were compared with the field measured values (63 dbhs). The values obtained from UAV-lidar ranged from 15.00 to 43.13 cm, with an average of 30.98 m and with the calculated standard deviation of ±4.39 cm. The field forest inventory data found a minimum value of 19.10 cm, a maximum value of 38.99 cm and an average value of 30.58 cm, with a standard deviation of ±3.93 cm. When the lidar dbh estimates were regressed against the corresponding dbh field measurements, we found a 1:1 correspondence (α = 0 and β = 1 statistically), a correlation coefficient (r) of 0.77, an absolute RMSE of 3.46 cm (relative RMSE of 11.31%) and a bias of −1.30% (or −0.39 m) (Figure 5).

3.2. Height Measurement

The tree heights measured by lidar data processing were compared with the values measured in the field (63 heights). The values obtained from the tree heights of the iCLF system from UAV-lidar ranged from 6.03 to 29.01 m, with an average of 20.84 m and a standard deviation of 3.35 m. When used the P95 (percentile 95%) of heights measured by lidar found the minimum height of 5.72 m, maximum height of 27.57 m and an average height of 19.80 m, with a standard deviation of 3.18 m. Field forest inventory found the minimum height of 5.7 m, maximum height of 24.8 m and an average height of 19.11 m, with a standard deviation of 2.74 m. When the lidar estimates (P95) of total height were regressed in relation to the corresponding field height measurements, we found a 1:1 correspondence (α = 0 and β = 1 statistically), a correlation coefficient (r) of 0.91, an absolute RMSE of 1.51 m (relative RMSE of 7.91%) and the bias of −3.59% (or −0.69 m) (Figure 5). The reader may notice that, in the case of height, the line goes almost by the origin, indicating that the intercept is almost zero and the slope is approximately one, which shows a good relationship between the two variables (measurements from field against lidar heights) which was proved by the significance of the coefficients (p-value > 0.001).
The solid red line is the linear regression fit between observed and lidar-derived measurements (obsi = α + β·der). Both for dbh and total height the values of α and β showed no significant difference of 0 and 1 respectively.
Figure 6a shows examples of errors in measuring stem diameters, which we attribute to the irregularity of points that formed the stem. While in Figure 6b the areas formed by the applied method generated adequate superficies for the stem and consequently values similar to the field.
A paired t-test analysis was done at a 95% (α = 0.05) significance level to see the significance of the relationship between field-based and UAV-lidar measurements of dbh and total height. Accordingly, the results of the t-test showed that there are no statistically significant differences between the field and UAV-lidar measurements.
The dbh classes measured in the field for the classes C1 (19.0–29.0) and C2 (29.1–39.0) (Figure 4) presented the averages of 26.23 ± 2.53 cm and 32.65 ± 2.52 cm, respectively. As for the classes taken in the UAV-lidar cloud, they were 26.55 ± 4.57 cm and 33.08 ± 4.41 cm, respectively (Table 1 and Figure 7). In the case of the total heights measured in the field, the classes C1 (8.75–16.05) and C2 (16.06–24.8) presented averages of 15.43 ± 3.26 m and 20.02 ± 1.63 m, respectively. As for the classes measured in the UAV-lidar cloud, they were 15.74 ± 3.56 m and 20.80 ± 2.15 m, respectively.

4. Discussion

Here we explored the efficiency of a UAV-lidar system to measure dbh and total height. To the best of our knowledge, this is the first study that effectively uses an aerial lidar system for direct measurement of the trees dbh. For that we applied in a high-density UAV-lidar cloud a method developed for TLS clouds in the context of automatic dbh measurement and individual tree level height. The results found in this work using high-density UAV-lidar are a pilot study that demonstrated the potential to be applied in forest inventories and assistance to forest management. However, we know that it can be improved in many ways, for example, to estimate understory vegetation [53], which can be very important for decision-making in silvicultural management.
Our results were difficult to compare with previous studies, because forest plantations are implemented with different spacing and composition variations, also because of different scanning systems and different approaches that have been developed and applied in previous works. Moreover, we realized that, with the recent availability of UAV-lidar systems, few studies have explored the potentialities of this data source for the extraction of derivatives applied in forest plantations. We encourage the development of more studies that test different approaches in this context. For example, tests that examine different combinations of flight variables, such as heights, flight speed and even the spatial design of flight lines, could be further explored for more accurate results.
Researchers [40] verified a better performance in estimates for six forest parameters using UAV-lidar than those obtained in [54], which used airborne lidar. The authors attributed this better performance to the flight characteristics, such as lower flight height (60 m) and slower flight speed (4.8 m·s−1) than the ALS system, which reflected at an average UAV-lidar point density of approximately 160 pts per meter squared, which exceeds the typical point density of the lidar ALS data (usually <25 pts per meter squared) [55]. In our study, the average point density was about 1400 points per meter squared, corroborating [53]. Higher point densities are more appropriate for capturing the canopy structure and allow the three-dimensional structure of forests to be reconstructed on a finer scale and with greater precision [56,57]. In addition, a higher point density ensures a better quality of the generated DTM, which is important for tree height measurements. The alternative and prevalent option, TLS systems, even though found accurate for forest inventories, are still little used on an operational scale due to several difficulties such as: it is a static technology, of low coverage, also because the time taken for collection and processing can even surpass the traditional methods of inventory, not to mention the costs of the equipment involved in the collections.
Regarding the airborne-lidar for obtaining forest attributes such as total height and dbh, we noticed that most of the works were developed using metrics for the derivative of height and to generate indirect predictive models for dbh, which is an approach that has been widely used in other studies [32,54,58,59]. In our work, we present a method of direct measurement. We expected that the improvement of direct dbh measurements using UAV-lidar data can lead to more accurate results. However, some studies have already obtained satisfactory results from indirect models. At the plot level, [28] estimated and mapped the average height and dominant height of Pinus taeda plantations in the south of Brazil using lidar metrics and k-nearest neighbors algorithm (KNN) imputations and obtained a high accuracy in the estimates of plot heights (RMSE < 7% and R² > 0.90). Researchers [60] obtained an RMSE of 0.63 m for tree height estimates and 3.8 cm (10% of the mean value) for dbh using laser-measured tree height and canopy diameter as independent variables in a regression model. The authors used a linear model fitted to the data acquired on boreal forests in Sweden. Overall, the RMSE of the tree height estimated from ALS data is typically less than 1 m [60].
Our dbh measurement results were very promising for individual tree modeling, and the results shown here for the coefficient of determination obtained for the total height and dbh parameters were consistent with those reported in the literature. In the work of [54], the dbh estimation in a boreal forest area was achieved with a relative RMSE of 21% in the best cases, based on characteristics from ALS laser. Our study showed a much better result with a relative RMSE of 11.31%, which could be due to the high-density UAV-lidar data utilized. Having high-density point clouds imply the capability to penetrate through the forest canopy effectively and acquire the whole vertical distribution information leading to a higher ability to estimate forest structural attributes accurately. High overlaps and limited shadows, occlusions and shaking of leaves from surrounding trees or the occasional shaking of leaves might have also partially contributed to the low RMSE values we had observed [61]. Using lidar full-waveform data and a normalized cut segmentation approach, [62] showed promising results and that were close to this study, with a relative RMSE of 9% in the best cases. For the estimative of the dbh, the authors related the good results achieved in the study with the use of full-waveform data—which also benefit from the high-density point clouds; continuous in this case—and the normalized cut segmentation. Researchers [63] tested k-most similar neighbor (k-MSN) and random forest imputation methods and achieved dbh estimates for forest management systems in Finland with RMSE of 13% when evaluated with validation data.
Future research should be performed to improve the structural parameters obtained by the methodology presented here. We believe that we could get even better results if we had a larger tree size gradient. Besides that, varied forest conditions, such as other types of systems and forests should also be considered in order to examine the potential of the method. Forest conditions play an important role in determining the estimation results [64,65]. The automatic processing of high-density UAV-lidar clouds to obtain forest structural parameters has proved to be a very promising alternative under iCLF conditions. Our results showed the potential use of the TreeLS method to estimate the attributes of individual trees in real forests with UAV-lidar data, showing derivatives that were consistent with observed values. Finally, the UAV-lidar data acquisition operational easiness provides applications in monitoring, focusing on following up on the dynamic forest processes of growth.

5. Conclusions

In this study, we tested an automatic approach —consisting of mapping the stems, automatic isolation of stems from isolated trees and extraction of taper—for extracting individual tree dbh and total heights from UAV-lidar 3D point in a crop-livestock-forest system. We found that individual tree dbh and total height can be efficiently extracted from UAV-lidar data and obtained acceptable relative RMSE values of 11.31 % and 7.91 %. Moreover, the high average point density proved very helpful in recreating three-dimensional forest structures at a finer scale with high precision and better quality DTM which enhanced tree height calculations. However, this potential should be further tested in other plantations and forest environments as well. In hindsight, our findings using UAV-lidar may contribute to an increasingly automated forest inventory that can further optimize the number of field operations done in the future. To reiterate, UAV-lidar systems have the capability to measure relatively broad-scale (thousands of hectares) forest plantations and reduce (or eliminate) field efforts and thereby, should be perceived and implemented as an important tool for aiding decision making on forest management.

Author Contributions

For research articles with several authors, a short paragraph specifying their individual contributions must be provided. A.P.D.C.: conceptualization, formal analysis, investigation, methodology, project administration, resources, writing—original draft; F.E.R.: formal analysis, methodology, resources, writing—original draft; D.R.A.d.A.: investigation, methodology, writing—review and editing; C.R.S.: conceptualization, data curation, investigation, methodology, supervision; C.A.S.: formal analysis, methodology, writing—review and editing; M.M.M.: data curation, software; B.W.: investigation, resources, writing—review and editing; A.M.A.Z.: investigation, writing—review and editing; E.M.d.C.N.: data curation, software; H.F.P.V.: data curation; C.A.S.: investigation, writing—review and editing; C.K.: investigation, writing—review and editing; A.d.M.: data curation; A.C.: resources, writing—review and editing; M.M.: resources, writing—review and editing; E.N.B.: conceptualization, data curation, investigation, project administration, resources, supervision, writing—review and editing. All authors have read and agreed to the published version of the manuscript.

Funding

This study was financed in part by the Coordenação de Aperfeiçoamento de Pessoal de Nível Superior—Brasil (CAPES)—Finance Code 001 (A. Corte # 88887.373249/2019-00). D. Almeida was supported by the São Paulo Research Foundation (#2018/21338-3 and #2019/14697-0).

Acknowledgments

The authors are very grateful to the Spatial Ecology and Conservation (SPEC) Lab at the University of Florida who funded and collected the GatorEye Unmanned Flying Laboratory lidar data, with support from the USDA National Institute of Food and Agriculture McIntire-Stennis program, and the Federal University of Parana (UFPR) and NITA working group coordinated by Professor Anibal de Moraes for the use of the study area.

Conflicts of Interest

The authors declare no conflict of interest.

References

  1. Allan, J.D.; McIntyre, P.B.; Smith, S.D.; Halpern, B.S.; Boyer, G.L.; Buchsbaum, A.; Burton, G.; Campbell, L.M.; Chadderton, W.L.; Ciborowski, J.J.H.; et al. Joint analysis of stressors and ecosystem services to enhance restoration effectiveness. Proc. Natl. Acad. Sci. USA 2013, 110, 372–377. [Google Scholar] [CrossRef] [PubMed] [Green Version]
  2. Gil, J.; Siebold, M.; Berger, T. Adoption and development of integrated crop–livestock–forestry systems in Mato Grosso, Brazil. Agric. Ecosyst. Environ. 2015, 199, 394–406. [Google Scholar] [CrossRef]
  3. Governo Federal do Brasil. Decreto Federal n. 8.972, de 23 de Janeiro de 2017. Available online: http://www.planalto.gov.br/ccivil_03/_ato2015-2018/2017/decreto/D8972.htm (accessed on 20 December 2019).
  4. Newton, P.; Gomez, A.E.A.; Jung, S.; Kelly, T.; de Araújo Mendes, T.; Rasmussen, L.V.; Dos Reis, J.C.; Rodrigues, R.D.A.R.; Tipper, R.; Van Der Horst, D.; et al. Overcoming barriers to low carbon agriculture and forest restoration in Brazil: The Rural Sustentável project. World Dev. Perspect. 2016, 4, 5–7. [Google Scholar] [CrossRef]
  5. de Moraes Sá, J.C.; Lal, R.; Cerri, C.C.; Lorenz, K.; Hungria, M.; Carvalho, P. Low-carbon agriculture in South America to mitigate global climate change and advance food security. Environ. Int. 2017, 98, 102–112. [Google Scholar]
  6. Lampreia, J.; De Araujo MS, M.; De Campos, C.P.; Freitas MA, V.; Rosa, L.P.; Solari, R.; Gesteira, C.; Ribas, R.; Silva, N.F. Analyses and perspectives for Brazilian low carbon technological development in the energy sector. Renew. Sustain. Energy Rev. 2011, 15, 3432–3444. [Google Scholar] [CrossRef]
  7. Karvatte, N.; Klosowski, E.S.; de Almeida, R.G.; Mesquita, E.E.; de Oliveira, C.C.; Alves, F.V. Shading effect on microclimate and thermal comfort indexes in integrated crop-livestock-forest systems in the Brazilian Midwest. Int. J. Biometeorol. 2016, 60, 1933–1941. [Google Scholar] [CrossRef]
  8. Vieira, D.L.; Holl, K.D.; Peneireiro, F.M. Agro-successional restoration as a strategy to facilitate tropical forest recovery. Restor. Ecol. 2009, 17, 451–459. [Google Scholar] [CrossRef]
  9. Behling, M.; Wruck, F.J.; Antonio, D.; Meneguci, J.L.P.; Pedreira, B.C.; Carnevalli, R.A.; Cordeiro, L.A.M.; de Farias Neto, A.L.; Domit, L.A.; Silva, J. Integração Lavoura-Pecuária-Floresta (iLPF). In Embrapa Agrossilvipastoril-Capítulo em livro Científico (ALICE); Sede da Embrapa: Rondonópolis, Mato Grosso, Brazil, 2013. [Google Scholar]
  10. EMBRAPA. ILPF em Núm3r05. 2016. Sinop, MT: Embrapa. 2016. 12 p. 01 Folder. Available online: https://ainfo.cnptia.embrapa.br/digital/bitstream/item/158636/1/2016-cpamt-ilpf-em-numeros.pdf (accessed on 30 January 2020).
  11. Oliveira, P.P.A.; Pezzopane, J.R.M.; de Meo Filho, P.; Berndt, A.; Pedroso, A.D.F.; Bernardi, A.C.D.C. Balanço e emissões de gases de efeito estufa em sistemas integrados. In Congresso Brasileiro de Sistemas Integrados de Produção Agropecuária; 1º Encontro de Integração Lavoura-Pecuária no sul do Brasil. Intensificação com Sustentabilidade; UTFPR: Cascavel, Brazil, 2017; pp. 23–32. [Google Scholar]
  12. Liang, X.; Kankare, V.; Hyyppä, J.; Wang, Y.; Kukko, A.; Haggrén, H.; Yu, X.; Kaartinen, H.; Jaakkola, A.; Guan, F.; et al. Terrestrial laser scanning in forest inventories. ISPRS J. Photogramm. Remote Sens. 2016, 115, 63–77. [Google Scholar] [CrossRef]
  13. Aijazi, A.K.; Checchin, P.; Malaterre, L.; Trassoudaine, L. Automatic detection and parameter estimation of trees for forest inventory applications using 3D terrestrial lidar. Remote Sens. 2017, 9, 946. [Google Scholar] [CrossRef] [Green Version]
  14. Chang, A.; Eo, Y.; Kim, S.; Kim, Y.; Kim, Y. Canopy-cover thematic-map generation for Military Map products using remote sensing data in inaccessible areas. Landsc. Ecol. Eng. 2011, 7, 263–274. [Google Scholar] [CrossRef]
  15. West, P.W.; West, P.W. Tree and Forest Measurement; Springer: Heidelberg, Germany, 2009. [Google Scholar]
  16. Hyyppä, J.; Hyyppä, H.; Leckie, D.; Gougeon, F.; Yu, X.; Maltamo, M. Review of methods of small-footprint airborne laser scanning for extracting forest inventory data in boreal forests. Int. J. Remote Sens. 2008, 29, 1339–1366. [Google Scholar] [CrossRef]
  17. Van Leeuwen, M.; Nieuwenhuis, M. Retrieval of forest structural parameters using lidar remote sensing. Eur. J. For. Res. 2010, 129, 749–770. [Google Scholar] [CrossRef]
  18. Lefsky, M.A.; Cohen, W.B.; Harding, D.J.; Parker, G.G.; Acker, S.A.; Gower, S.T. lidar remote sensing of above-ground biomass in three biomes. Glob. Ecol. Biogeogr. 2002, 11, 393–399. [Google Scholar] [CrossRef] [Green Version]
  19. Lim, K.; Treitz, P.; Wulder, M.; St-Onge, B.; Flood, M. Lidar sensoriamento remoto da estrutura da floresta. Prog. Phys. Geogr. 2003, 27, 88–106. [Google Scholar] [CrossRef] [Green Version]
  20. Qin, Y.; Li, S.; Vu, T.T.; Niu, Z.; Ban, Y. Aplicação sinérgica de características geométricas e radiométricas dos dados lidar para o mapeamento da cobertura do solo urbano. Opt. Express 2015, 23, 13761–13775. [Google Scholar] [CrossRef]
  21. Hudak, A.T.; Strand, E.K.; Vierling, L.A.; Byrne, J.C.; Eitel, J.U.; Martinuzzi, S.; Falkowski, M.J. Quantifying aboveground forest carbon pools and fluxes from repeat lidar surveys. Remote Sens. Environ. 2012, 123, 25–40. [Google Scholar] [CrossRef] [Green Version]
  22. Lu, D.; Chen, Q.; Wang, G.; Moran, E.; Batistella, M.; Zhang, M.; Laurin, G.V.; Saah, D. Aboveground forest biomass estimation with Landsat and lidar data and uncertainty analysis of the estimates. Int. J. For. Res. 2012, 2012, 1–16. [Google Scholar] [CrossRef]
  23. Zolkos, S.G.; Goetz, S.J.; Dubayah, R. A meta-analysis of terrestrial aboveground biomass estimation using lidar remote sensing. Remote Sens. Environ. 2013, 128, 289–298. [Google Scholar] [CrossRef]
  24. Rex, F.E.; Corte AP, D.; Machado SD, A.; Silva, C.A.; Sanquetta, C.R. Estimating Above-Ground Biomass of Araucaria angustifolia (Bertol.) Kuntze Using lidar Data. Floresta E Ambiente 2019, 26. [Google Scholar] [CrossRef]
  25. Nilsson, M. Estimation of tree heights and stand volume using an airborne lidar system. Remote Sens. Environ. 1996, 56, 1–7. [Google Scholar] [CrossRef]
  26. Næsset, E. Determination of mean tree height of forest stands using airborne laser scanner data. ISPRS J. Photogramm. Remote Sens. 1997, 52, 49–56. [Google Scholar] [CrossRef]
  27. Andersen, H.E.; Reutebuch, S.E.; McGaughey, R.J. A rigorous assessment of tree height measurements obtained using airborne lidar and conventional field methods. Can. J. Remote Sens. 2006, 32, 355–366. [Google Scholar] [CrossRef]
  28. Silva, C.A.; Klauberg, C.; Hudak, A.T.; Vierling, L.A.; Liesenberg, V.; Bernett, L.G.; Scheraiber, C.F.; Schoeninger, E.R. Estimating Stand Height and Tree Density in Pinus taeda plantations using in-situ data, airborne lidar and k-Nearest Neighbor Imputation. Anais da Academia Brasileira de Ciências 2018, 90, 295–309. [Google Scholar] [CrossRef] [PubMed]
  29. Hyyppa, J.; Kelle, O.; Lehikoinen, M.; Inkinen, M. A segmentation-based method to retrieve stem volume estimates from 3-D tree height models produced by laser scanners. IEEE Trans. Geosci. Remote Sens. 2001, 39, 969–975. [Google Scholar] [CrossRef]
  30. Wallerman, J.; Holmgren, J. Estimating field-plot data of forest stands using airborne laser scanning and SPOT HRG data. Remote Sens. Environ. 2007, 110, 501–508. [Google Scholar] [CrossRef]
  31. Lefsky, M.A.; Harding, D.; Cohen, W.B.; Parker, G.; Shugart, H.H. Surface lidar remote sensing of basal area and biomass in deciduous forests of eastern Maryland, USA. Remote Sens. Environ. 1999, 67, 83–98. [Google Scholar] [CrossRef]
  32. Næsset, E. Predicting forest stand characteristics with airborne scanning laser using a practical two-stage procedure and field data. Remote Sens. Environ. 2002, 80, 88–99. [Google Scholar] [CrossRef]
  33. Chang, A.; Jung, J.; Kim, Y. Estimation of forest stand diameter class using airborne lidar and field data. Remote Sens. Lett. 2015, 6, 419–428. [Google Scholar] [CrossRef]
  34. Li, D.; Pang, Y.; Yue, C.; Zhao, D.; Xu, G. Extraction of individual tree dbh and height based on terrestrial laser scanner data. J. Beijing For. Univ. 2012, 34, 79–86. [Google Scholar]
  35. Liu, L.; Pang, Y.; Li, Z. Individual Tree dbh and Height Estimation Using Terrestrial Laser Scanning (TLS) in A Subtropical Forest. Sci. Silvae Sin. 2016, 52, 26–37. [Google Scholar]
  36. Liu, G.; Wang, J.; Dong, P.; Chen, Y.; Liu, Z. Estimating Individual Tree Height and Diameter at Breast Height (dbh) from Terrestrial Laser Scanning (TLS) Data at Plot Level. Forests 2018, 9, 398. [Google Scholar] [CrossRef] [Green Version]
  37. Henning, J.G.; Radtke, P.J. Detailed stem measurements of standing trees from ground-based scanning lidar. For. Sci. 2006, 52, 67–80. [Google Scholar]
  38. Maas, H.G.; Bienert, A.; Scheller, S.; Keane, E. Automatic forest inventory parameter determination from terrestrial laser scanner data. Int. J. Remote Sens. 2008, 29, 1579–1593. [Google Scholar] [CrossRef]
  39. de Conto, T.; Olofsson, K.; Görgens, E.B.; Rodriguez, L.C.E.; Almeida, G. Performance of stem denoising and stem modelling algorithms on single tree point clouds from terrestrial laser scanning. Comput. Electron. Agric. 2017, 143, 165–176. [Google Scholar] [CrossRef]
  40. Liu, K.; Shen, X.; Cao, L.; Wang, G.; Cao, F. Estimating forest structural attributes using UAV-lidar data in Ginkgo plantations. ISPRS J. Photogramm. Remote Sens. 2018, 146, 465–482. [Google Scholar] [CrossRef]
  41. Ravanel, L.; Bodin, X.; Deline, P. Using terrestrial laser scanning for the recognition and promotion of high-alpine geomorphosites. Geoheritage 2014, 6, 129–140. [Google Scholar] [CrossRef]
  42. Anderson, K.; Gaston, K.J. Lightweight unmanned aerial vehicles will revolutionize spatial ecology. Front. Ecol. Environ. 2013, 11, 138–146. [Google Scholar] [CrossRef] [Green Version]
  43. Vivoni, E.R.; Rango, A.; Anderson, C.A.; Pierini, N.A.; Schreiner-McGraw, A.P.; Saripalli, S.; Laliberte, A.S. Ecohydrology with unmanned aerial vehicles. Ecosphere 2014, 5, 1–14. [Google Scholar] [CrossRef] [Green Version]
  44. Sankey, T.; Donager, J.; McVay, J.; Sankey, J.B. UAV lidar and hyperspectral fusion for forest monitoring in the southwestern USA. Remote Sens. Environ. 2017, 195, 30–43. [Google Scholar] [CrossRef]
  45. GatorEye. Available online: http://www.speclab.org/gatoreye.html (accessed on 23 January 2020).
  46. Wulder, M.A.; White, J.C.; Nelson, R.F.; Næsset, E.; Ørka, H.O.; Coops, N.C.; Hilker, T.; Bater, C.W.; Gobakken, T. Lidar sampling for large-area forest characterization: A review. Remote Sens. Environ. 2012, 121, 196–209. [Google Scholar] [CrossRef] [Green Version]
  47. Alvares, A.C.; Stape, J.; Sentelhas, P.; Gonçalves, J.; Sparovek, G. Köppen’s climate classification map for Brazil. Meteorol. Z. 2013, 22. [Google Scholar] [CrossRef]
  48. Porfírio-da-Silva, V.; Medrado, M.J.S.; Nicodemo, M.L.F.; Dereti, R.M. Arborização de Pastagens com Espécies Florestais Madeiras: Implantação e Manejo; Embrapa Florestas: Colombo, Brazil, 2010; 48p. [Google Scholar]
  49. Wilkinson, B.; Lassiter, H.A.; Abd-Elrahman, A.; Carthy, R.R.; Ifju, P.; Broadbent, E.; Grimes, N. Geometric Targets for UAS Lidar. Remote Sens. 2019, 11, 3019. [Google Scholar] [CrossRef] [Green Version]
  50. Valbuena, R.; Hernando, A.; Manzanera, J.A.; Görgens, E.B.; Almeida, D.R.A.; Mauro, F.; García-Abril, A.; Coomesa, D.A. Enhancing of accuracy assessment for forest above-ground biomass estimates obtained from remote sensing via hypothesis testing and overfitting evaluation. Ecol. Model. 2017, 366, 15–26. [Google Scholar] [CrossRef] [Green Version]
  51. R Core Team. R: A Language and Environment for Statistical Computing, Version 3.6.1; R Foundation for Statistical Computing: Vienna, Austria, 2019. [Google Scholar]
  52. Isenburg, M. “LAStools—Efficient LiDAR Processing Software” (Version 1.8, Licensed). Available online: http://rapidlasso.com/LAStools (accessed on 11 November 2019).
  53. Almeida, D.R.A.; Broadbent, E.N.; Zambrano, A.M.A.; Wilkinson, B.E.; Ferreira, M.E.; Chazdon, R.; Meli, P.; Gorgens, E.; Silva, C.A.; Stark, S.; et al. Monitoring the structure of forest restoration plantations with a drone-lidar system. Int. J. Appl. Earth Obs. Geoinf. 2019, 79, 192–198. [Google Scholar] [CrossRef]
  54. Yu, X.; Hyyppä, J.; Vastaranta, M.; Holopainen, M.; Viitala, R. Predicting individual tree attributes from airborne laser point clouds based on the random forest technique. ISPRS J. Photogramm. Remote Sens. 2011, 66, 28–37. [Google Scholar] [CrossRef]
  55. Kato, A.; Moskal, L.M.; Schiess, P.; Swanson, M.E.; Calhoun, D.; Stuetzle, W. Capturing tree crown formation through implicit surface reconstruction using airborne lidar data. Remote Sens. Environ. 2009, 113, 1148–1162. [Google Scholar] [CrossRef]
  56. Jakubowski, M.K.; Guo, Q.; Kelly, M. Tradeoffs between lidar pulse density and forest measurement accuracy. Remote Sens. Environ. 2013, 130, 245–253. [Google Scholar] [CrossRef]
  57. Thomas, V.; Treitz, P.; McCaughey, J.H.; Morrison, I. Mapping stand-level forest biophysical variables for a mixedwood boreal forest using lidar: An examination of scanning density. Can. J. For. Res. 2006, 36, 34–47. [Google Scholar] [CrossRef]
  58. Næsset, E. Practical large-scale forest stand inventory using a small-footprint airborne scanning laser. Scand. J. For. Res. 2004, 19, 164–179. [Google Scholar] [CrossRef]
  59. Bouvier, M.; Durrieu, S.; Fournier, R.A.; Renaud, J.P. Generalizing predictive models of forest inventory attributes using an area-based approach with airborne lidar data. Remote Sens. Environ. 2015, 156, 322–334. [Google Scholar] [CrossRef]
  60. Persson, A.; Holmgren, J.; Soderman, U. Detecting and measuring individual trees using an airborne laser scanner. Photogramm. Eng. Remote Sens. 2002, 68, 925–932. [Google Scholar]
  61. Cao, L.; Liu, H.; Fu, X.; Zhang, Z.; Shen, X.; Ruan, H. Comparison of UAV LiDAR and digital aerial photogrammetry point clouds for estimating forest structural attributes in subtropical planted forests. Forests 2019, 10, 145. [Google Scholar] [CrossRef] [Green Version]
  62. Yao, W.; Krzystek, P.; Heurich, M. Tree species classification and estimation of stem volume and dbh based on single tree extraction by exploiting airborne full-waveform lidar data. Remote Sens. Environ. 2012, 123, 368–380. [Google Scholar] [CrossRef]
  63. Vauhkonen, J.; Korpela, I.; Maltamo, M.; Tokola, T. Imputation of single-tree attributes using airborne laser scanning-based height, intensity, and alpha shape metrics. Remote Sens. Environ. 2010, 114, 1263–1276. [Google Scholar] [CrossRef]
  64. Kaartinen, H.; Hyyppä, J. EuroSDR/ISPRS Project, Commission II “Tree Extraction”; Final Report; EuroSDR. European Spatial Data Research: Dublin, Ireland, 2008; Official Publication, 53. [Google Scholar]
  65. Silva, C.A.; Valbuena, R.; Pinagé, E.R.; Mohan, M.; de Almeida, D.R.; North Broadbent, E.; Jaafar, W.S.W.M.; Papa, D.A.; Klauberg, C. ForestGapR: An r Package for forest gap analysis from canopy height models. Methods Ecol. Evol. 2019, 10, 1347–1356. [Google Scholar] [CrossRef] [Green Version]
Figure 1. Study area: eucalyptus plantation with 17 hectares (357 individuals ha−1) at the Canguiri Site in Pinhais City, Paraná State, Brazil. DTM—digital terrain model; DSM—digital surface model; CHM—canopy height model.
Remotesensing 12 00863 g001
Figure 2. Procedure for processing the cloud point and estimation of forest inventory parameters mensuration.
Remotesensing 12 00863 g002
Figure 3. Automatic isolation of stems of isolated trees and taper extraction using TreeLS R package. (a) Extract tree map (positioning); (b) classification of stem points (classify stem points); (c) extraction of diameter measurements (extract measure); (d) interpolation algorithm, which locates the two closest diameters of the dbh to obtain the value at the height of 1.30 m. Where: dbh—diameter at breast height; d—two closest diameters of the dbh.
Remotesensing 12 00863 g003
Figure 4. Classes used in this work. (a) Classes used for tree dbh C1 and C2; (b) Classes used for tree height C1 and C2, minimum-height and maximum-height; (c) Total height tree.
Remotesensing 12 00863 g004
Figure 5. Linear relationship between Field-observed and derived UAV-lidar in the integrated crop-livestock-forest system (ICLF) in Brazil. (a) Field-observed dbh and derived UAV-lidar; (b) field-observed height and derived UAV-lidar. The dashed line represents the 1:1 correspondence.
Remotesensing 12 00863 g005
Figure 6. Example of stem segmentation for dbh measurement from the UAV-lidar 3D point cloud (white dots). (a) Error in measurement; (b) correct measurement.
Remotesensing 12 00863 g006
Figure 7. Boxplot of classes of the dbh (field and Lidar) and Height (field and Lidar) in Integrated Crop-Livestock-Forest System (ICLF) in Brazil. (a) Class 1 dbh; (b) Class 2 dbh; (c) Class 1 height; (d) Class 2 height.
Remotesensing 12 00863 g007
Table 1. Summary of the relationship between (a) field observed dbh and UAV-lidar derived dbh; (b) field observed tree total height and UAV-lidar total height derived in the integrated crop-livestock-forest system (ICLF) in Brazil.
(a) Diameter at Breast Height-dbh (cm)
ClassMeanStandardMeanStandard
Field-ObservedDeviationField-derived ALSDeviation
C126.23±2.5326.55±4.57
C232.65±2.5233.08±4.41
All30.58±3.9330.98±4.39
(b) Tree Height (m)
ClassMeanStandardMeanStandard
Field-ObservedDeviationField-derived ALSDeviation
C115.43±3.2615.74±3.56
C220.02±1.6320.80±2.15
All19.11±2.7419.80±3.19

