Article

A Regional Blended Precipitation Dataset over Pakistan Based on Regional Selection of Blending Satellite Precipitation Datasets and the Dynamic Weighted Average Least Squares Algorithm

State Key Laboratory of Hydroscience and Engineering, Department of Hydraulic Engineering, Tsinghua University, Beijing 100084, China
*
Author to whom correspondence should be addressed.
Remote Sens. 2020, 12(24), 4009; https://doi.org/10.3390/rs12244009
Submission received: 25 October 2020 / Revised: 28 November 2020 / Accepted: 4 December 2020 / Published: 8 December 2020
(This article belongs to the Special Issue Remote Sensing in Agricultural Hydrology and Water Resources Modeling)

Abstract

:
Substantial uncertainties are associated with satellite precipitation datasets (SPDs), which are further amplified over complex terrain and diverse climate regions. The current study develops a regional blended precipitation dataset (RBPD) over Pakistan from selected SPDs in different regions using a dynamic weighted average least squares (WALS) algorithm from 2007 to 2018 with 0.25° spatial resolution and one-day temporal resolution. Several SPDs, including Global Precipitation Measurement (GPM)-based Integrated Multi-Satellite Retrievals for GPM (IMERG), Tropical Rainfall Measurement Mission (TRMM) Multi-Satellite Precipitation Analysis (TMPA) 3B42-v7, Precipitation Estimates from Remotely Sensed Information Using Artificial Neural Networks-Climate Data Record (PERSIANN-CDR), ERA-Interim (reanalysis dataset), SM2RAIN-CCI, and SM2RAIN-ASCAT are evaluated to select appropriate blending SPDs in different climate regions. Six statistical indices, including mean bias (MB), mean absolute error (MAE), unbiased root mean square error (ubRMSE), correlation coefficient (R), Kling–Gupta efficiency (KGE), and Theil’s U coefficient, are used to assess the WALS-RBPD performance over 102 rain gauges (RGs) in Pakistan. The results showed that WALS-RBPD had assigned higher weights to IMERG in the glacial, humid, and arid regions, while SM2RAIN-ASCAT had higher weights across the hyper-arid region. The average weights of IMERG (SM2RAIN-ASCAT) are 29.03% (23.90%), 30.12% (24.19%), 31.30% (27.84%), and 27.65% (32.02%) across glacial, humid, arid, and hyper-arid regions, respectively. IMERG dominated monsoon and pre-monsoon seasons with average weights of 34.87% and 31.70%, while SM2RAIN-ASCAT depicted high performance during post-monsoon and winter seasons with average weights of 37.03% and 38.69%, respectively. Spatial scale evaluation of WALS-RPBD resulted in relatively poorer performance at high altitudes (glacial and humid regions), whereas better performance in plain areas (arid and hyper-arid regions). Moreover, temporal scale performance assessment depicted poorer performance during intense precipitation seasons (monsoon and pre-monsoon) as compared with post-monsoon and winter seasons. Skill scores are used to quantify the improvements of WALS-RBPD against previously developed blended precipitation datasets (BPDs) based on WALS (WALS-BPD), dynamic clustered Bayesian model averaging (DCBA-BPD), and dynamic Bayesian model averaging (DBMA-BPD). On the one hand, skill scores show relatively low improvements of WALS-RBPD against WALS-BPD, where maximum improvements are observed in glacial (humid) regions with skill scores of 29.89% (28.69%) in MAE, 27.25% (23.89%) in ubRMSE, and 24.37% (28.95%) in MB. On the other hand, the highest improvements are observed against DBMA-BPD with average improvements across glacial (humid) regions of 39.74% (36.93%), 38.27% (33.06%), and 39.16% (30.47%) in MB, MAE, and ubRMSE, respectively. It is recommended that the development of RBPDs can be a potential alternative for data-scarce regions and areas with complex topography.

Graphical Abstract

1. Introduction

Precipitation estimates with high precision is essential to amend the regional and global scale hydrological and climate processes, and their impact [1,2]. Precipitation, ranked first by the Global Climate Observing System (GCOS), is extremely difficult to measure with high precision over the complex mountainous terrain and diverse climate across Pakistan and other similar regions [1,2,3,4,5]. Moreover, the temporal and spatial variations of precipitation add to the complexities in its precise estimation [6,7], particularly in poorly or ungauged catchments.
Satellite precipitation datasets (SPDs) provide estimates of precipitation at a large scale as compared with rain gauges (RGs) and radars [8]. The performance of SPDs is significantly dependent on the retrieval algorithms and climatic regions [9,10]. Advancements in retrieval algorithms of SPDs and reanalysis precipitation products have been continuous [11,12,13]; however, there are still considerable sources and magnitude of errors [14,15,16]. Therefore, the assimilation of precipitation estimates from multiple sources SPDs into a blended dataset considering the weaknesses and strengths of an individual blending SPD is strongly recommended [2].
Considering a blended dataset, several efforts have been made in this regard, where the first blending was reported in the mid-1980s by merging radar-gauge precipitation [17]. The Global Precipitation Climatology Project (GPCP), an earlier attempt to blend satellite-gauge data, is a monthly temporal and 0.25° spatial resolutions dataset developed using a mean bias-corrected method and an inverse-error-variance weighting method [18]. Similarly, the Climate Prediction Center Merged Analysis of Precipitation (CMAP) having monthly temporal and 2.5° spatial resolutions with 17 years of availability period is developed by merging RGs, SPDs, and reanalysis datasets employing the maximum likelihood estimation method [19]. Since then, a number of approaches, such as improvements in calibration algorithms, adopting the relative weights techniques, reduction in sampling issues, application of dynamic methods to estimate SPDs weights, etc., have been employed to develop blended precipitation datasets (BPDs) having high-quality estimates [1,2,3,4,5,20,21,22,23,24,25]. Several studies have reported significantly improved performances of the BPDs in quantification and evaluation of precipitation estimates and also in hydrological and meteorological applications [26,27].
Several BPDs have been developed across different regions of the globe [2,5,23,28,29]. The methods used to develop BPDs include Bayesian model averaging [3,5,30], conditional merging [31,32], simple scaling method [32], data assimilation [12], variation approach [20], probability density function [21], simple model averaging [29], principal component analysis [24], neural network analysis [33], and the non-parametric kernel merging method [34]. A detailed description of techniques to blend SPDs is available in references [22,34,35,36].
Very limited studies have focused on the development and evaluation of BPDs across the complex topography and diverse climate of Pakistan. Muhammad et al. [37] developed a regional precipitation algorithm that incorporated the inconsistency issues and error of individual SPDs. The developed algorithm was based on regional performance weights augmented by the leave-one-out cross validation (LOOCV) and ensemble algorithm. They reported significant improvements in the developed regional precipitation algorithm as compared with individual SPDs. Rahman et al. [24] developed a BPD employing the sample t-test comparison and principal component analysis (PCA) to blend SPDs, i.e., Global Precipitation Measurement (GPM)-based Integrated Multi-Satellite Retrievals for GPM (IMERG) and Tropical Rainfall Measurement Mission (TRMM) Multi-Satellite Precipitation Analysis (TMPA) 3B43-v7. The analyses depicted that the PCA-BPD outperformed all the SPDs and proved to be superior to the regional precipitation algorithm developed by Waseem et al. [37]. Similarly, Rahman et al. [1,3] developed BPDs using the dynamic Bayesian model averaging (DBMA) and dynamic clustered Bayesian averaging (DCBA), by utilizing precipitation estimates from TMPA 3B42-v7, Precipitation Estimates from Remotely Sensed Information Using Artificial Neural Networks–Climate Data Record (PERSIANN-CDR), ERA-Interim (reanalysis dataset), and Climate Prediction Center morphing technique (CMORPH) at a daily temporal scale for 16 years (2000–2015). Very recently, Rahman et al. [4] developed BPD using the weighted average least squares (WALS) method using the same combination of SPDs from 2000 to 2015. Overall, the results presented a comprehensively improved performance of WALS-BPD and DCBA-BPD as compared with DBMA-BPD. However, there is a specific pattern of error distribution across Pakistan, both spatially (high error in glacial and humid regions) and temporally (high error in monsoon season). The error shows a decreasing trend from DBMA-BPD to DCBA-BPD and WALS-BPD, but there is still a considerable magnitude of errors, which must be addressed.
The above BPDs used the same set of SPDs in all climate regions. However, it is evident that different SPDs perform differently in diverse climate regions. The present study is an attempt to address the high magnitude of errors across glacial and humid regions by considering the spatial and temporal variations of SPDs, and develops a dynamic regional BPD (hereinafter, WALS-RBPD) by selecting appropriate blending SPDs for different climate regions and employing a robust and sophisticated method, the WALS algorithm [4]. The new insight in current research is the selection of an appropriate set of SPDs for a particular region using a predefined statistical criterion. The study emphasizes the role of selecting SPDs for the development of BPD, which is more robust and accurate as compared with previously developed BPDs. The experiment is conducted using different combinations of SPDs, depending on the climate region and performance of each SPD in the particular region. The SPDs considered in the current study include IMERG-V06, TMPA 3B42-v7, PERSIANN-CDR, ERA-Interim (re-analyses dataset), SM2RAIN-CCI, and SM2RAIN-ASCAT. The WALS-RBPD is first developed for a period of nine years (2007–2015), having spatial and temporal resolutions of 0.25° and one-day, respectively. Then, the estimated dynamic weights from the WALS algorithm (time series from 2007 to 2015) are extrapolated from 2016 to 2018, and the final developed RBPD covers the period 2007–2018.
The present study is organized into the following sections: study area, datasets, and method are described in Section 2; Section 3 presents the results and discussion; and Section 4 summarizes the essential findings of the current study.

2. Materials and Methods
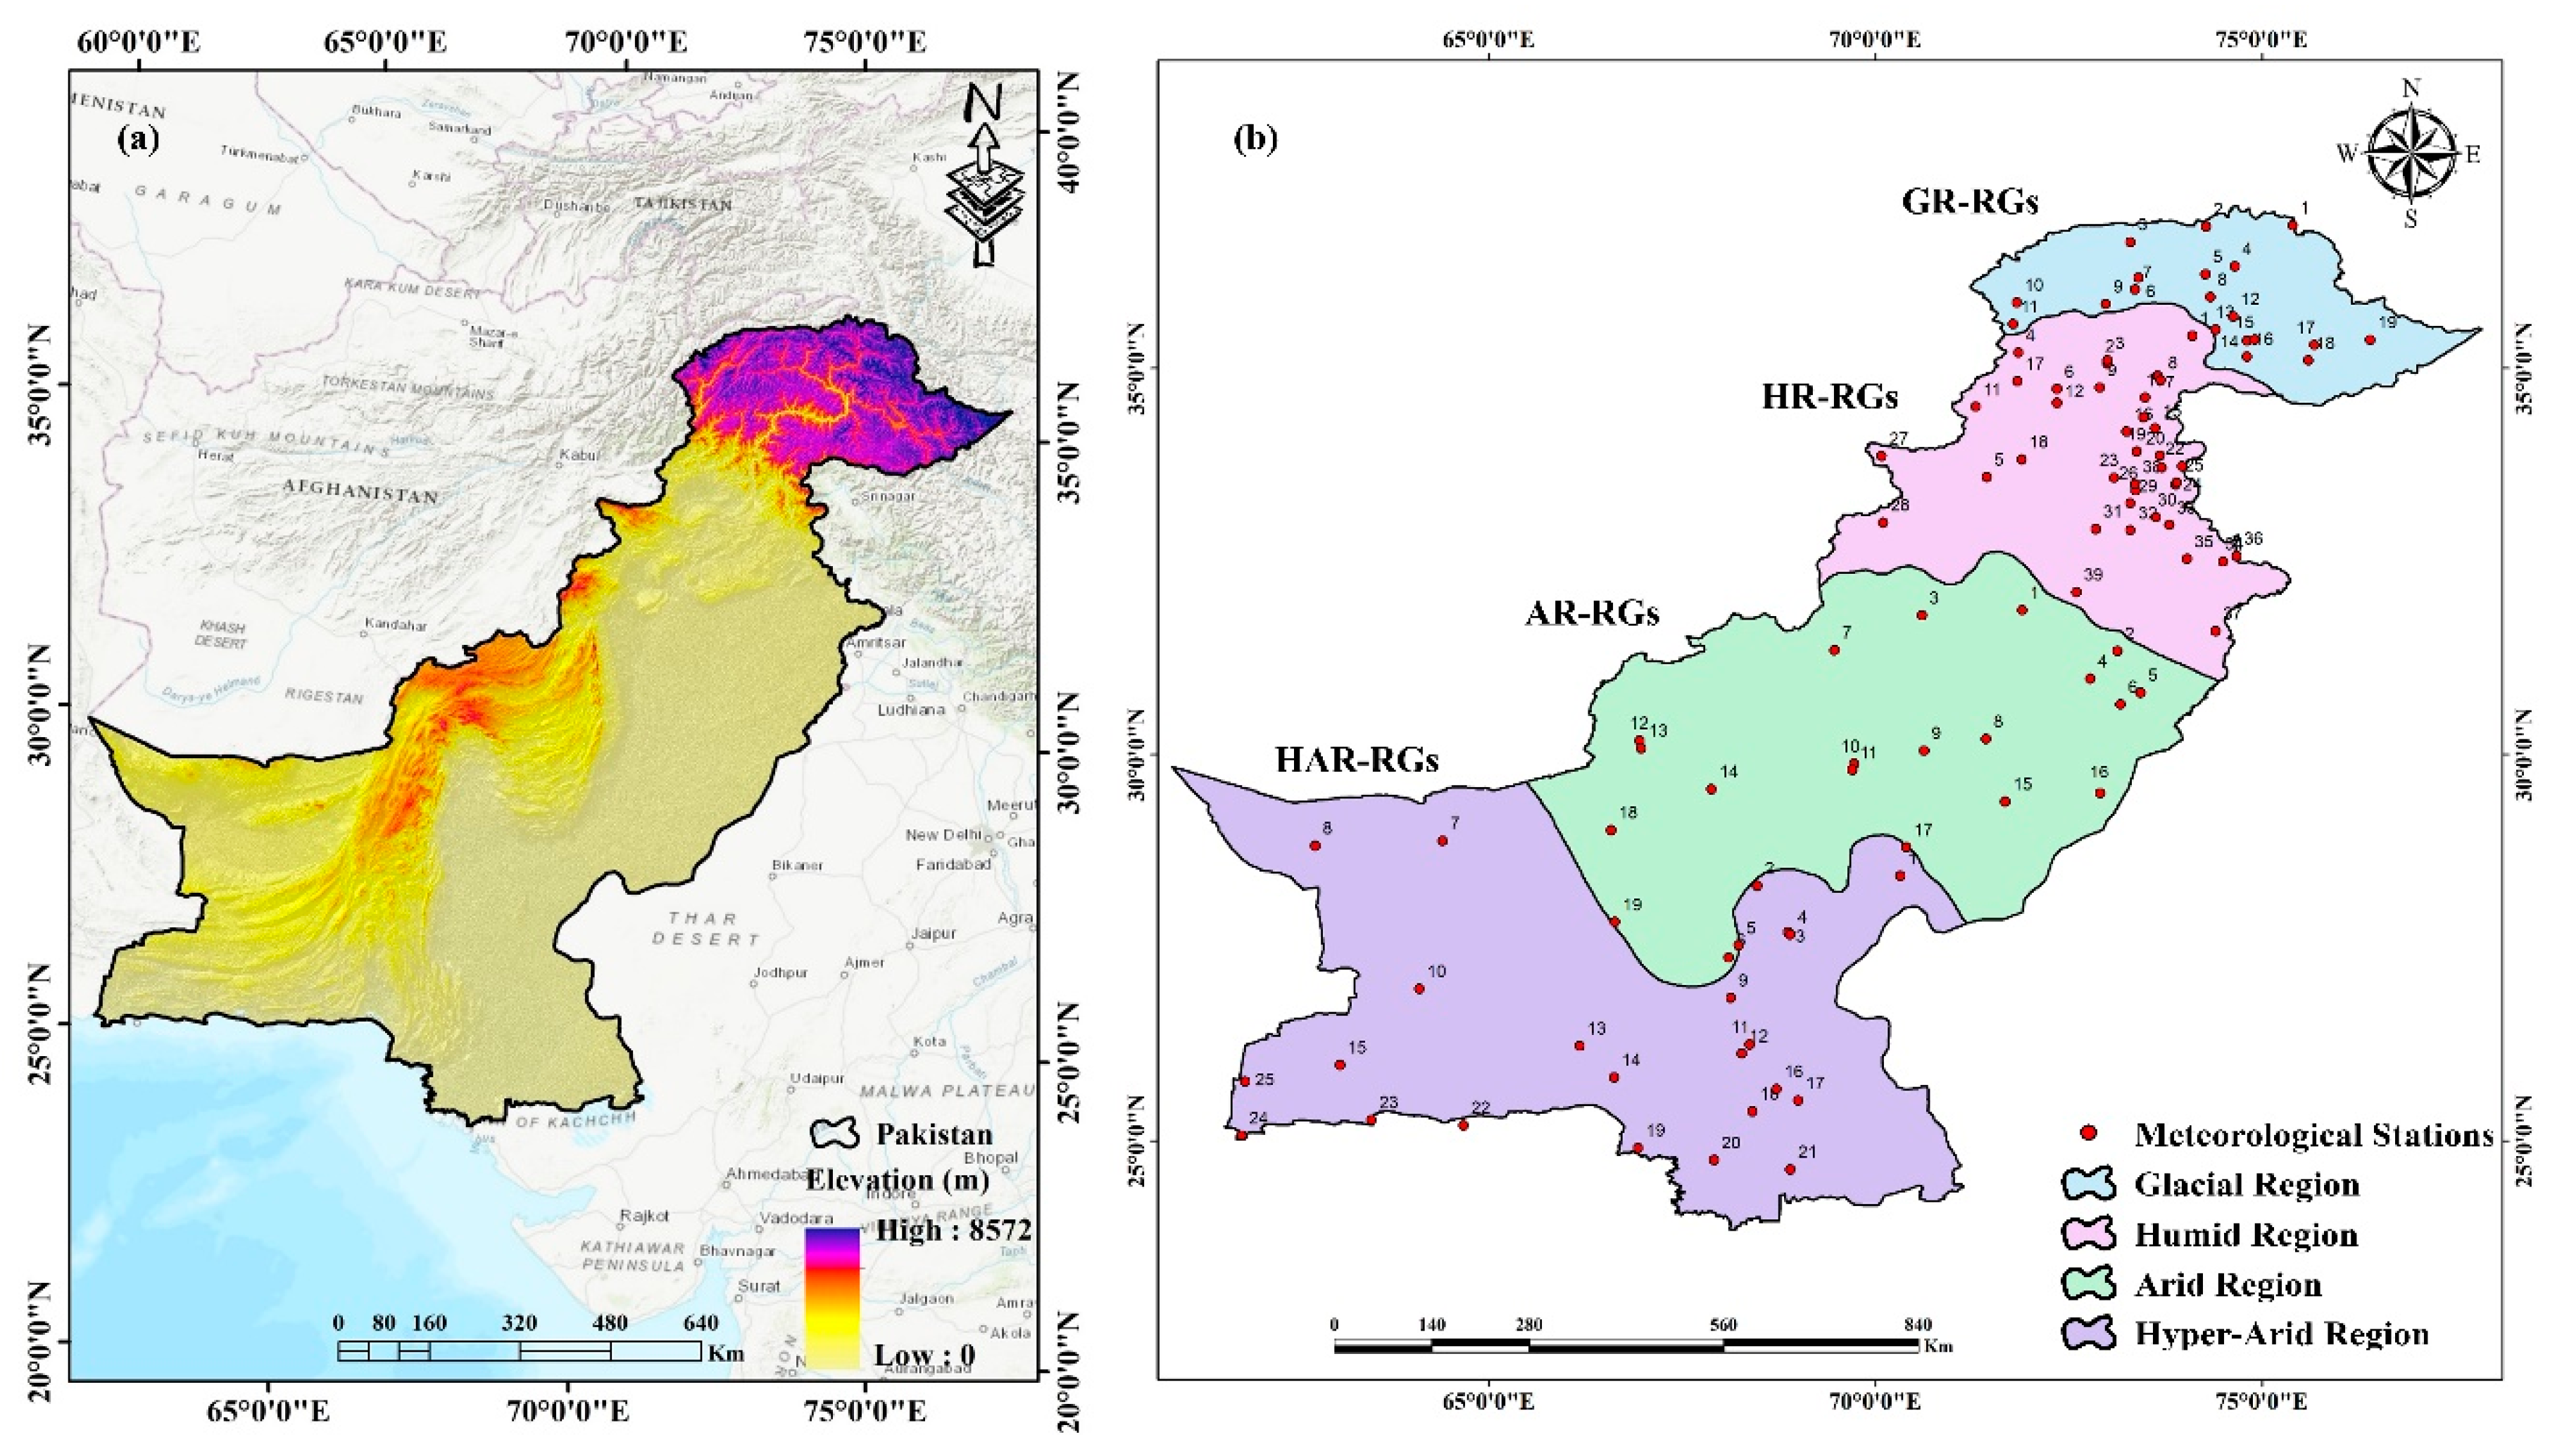
2.1. Study Area

The WALS-RBPD is developed over diverse climate regions of Pakistan. The study area (Figure 1a), Pakistan, is positioned geographically in western South Asia between 23.5° and 37.5° N latitude and between 62° and 75° E longitude with an area of 803,940 km2 [26,38]. The neighboring countries of Pakistan are China in the north, Afghanistan and Iran in the west, the Arabian Sea in south, and India in the east. Pakistan is characterized by complex topography with famous mountain ranges (Hindukush-Himalaya) at the extreme north with the highest elevation of 8600 m above mean sea level. The elevation decreases to 0 m towards the extreme south at the Arabian Sea [24,39]. Pakistan is blessed with a very diverse climate, which changes abruptly from glacial to humid, arid, and hyper-arid nature [40], while there are four dominant seasons, i.e., winter, autumn, spring, and summer. Therefore, Pakistan is divided into four main climate regions, i.e., glacial, humid, arid, and hyper-arid regions (Figure 1b), according to the climatic variations [1,3,4,40]. The RGs distributed in glacial, humid, arid, and hyper-arid regions are named as GR-RGs, HR-RGs, AR-RGs, HAR-RGs, respectively.

2.1.1. Glacial Region

The glacial region is mostly occupied by permanent glacier and snow cover, and is situated at the extreme north of Pakistan between latitude 34° N and 38° N. The mean annual precipitation and mean elevation of the glacial region are 348 mm/year and 4158 m, respectively. The famous mountain ranges (famous for glaciers after the polar region), i.e., Hindukush-Himalayas, are also situated in the glacial region. The melted water from these snow and glaciers is the primary source of water in the Indus River and its tributaries, which is used for domestic, agriculture, and industrial sectors. However, excessive melting of snow and glaciers have caused devastating flood events in the history of Pakistan, for example, the 2010 flood, which brutally damaged the economy and infrastructure of the country and took thousands of lives [40].

2.1.2. Humid Region

The northern part of the humid region belongs to Hindukush-Karakoram-Himalaya (HKH) mountain ranges. The mean annual precipitation and mean elevation of the humid region are 852 mm/year and 1286 m, respectively. The HKH ranges are the originating source of important rivers, i.e., Indus, Swat, Jhelum, Hunza, Gilgit, Panjkora, Kabul, and Kurram rivers. The humid region receives heavy precipitation, and thus is a hydraulically developed region of Pakistan. Therefore, the humid region is comprised of the largest reservoirs of the country, including the Tarbela and Mangla dams, which are constructed on the Indus and Jhelum rivers with hydropower capacities of 3500 MW and 1000 MW, respectively [41]. In addition to these dams, it is a built-up region with one of the largest integrated irrigation canal networks of the world, headworks, and barrages [40]. These hydraulic structures are used to support the agriculture sector of Pakistan as a secondary purpose.

2.1.3. Arid Region

The arid region is comprised of most parts of Punjab (which is considered as the agricultural hub of the country) and the Balochistan provinces of Pakistan. The agriculture in Punjab province is supported by the Indus and Jhelum rivers that drain through the arid region. The mean elevation and precipitation of the arid region are 633 m and 322 mm/year, respectively. The mildly elevated areas of Balochistan province (located at the extreme west of arid region) are semi-arid in nature, which receives snowfall mostly during the winter season (December and January) while the rest of the arid region is characterized by hot and dry climate [40,42].

2.1.4. Hyper-Arid Region

The hyper-arid region is comprised of Sindh, Balochistan, and southern parts of Punjab provinces. It is situated in the extreme south (at the coast of the Arabian Sea) of Pakistan, and mostly consists of barren land, deserts, dry mountains, and plateaus. The average elevation of the hyper-arid region is 444 m, and the region receives precipitation of 133 mm/year.

2.2. Precipitation Trend in Pakistan

The precipitation trends in Pakistan are consistent with climatic variability. Pakistan receives high mean annual precipitation across the humid region (>1500 mm) to less than or around 100 mm in the south. Monsoon is the season during which Pakistan receives heavy precipitation (55% to 60% of the total annual precipitation of Pakistan), followed by pre-monsoon season [43]. The monsoon precipitation originates from the Bay of Bengal from July to September, which enters Pakistan from its east and northeast sides. The typical distribution trend of precipitation in Pakistan during the monsoon season is given as follows: less than 100 mm (low magnitude) in the glacial region, more than 700 mm (high magnitude) in the humid region (more specifically northeast of the region), and again less than 100 (low magnitude) in the hyper-arid region [24]. The winter precipitation (moderate magnitude) from December to March originates from the Mediterranean Sea. The winter precipitation (30% of annual precipitation) enters the study area from Afghanistan and Iran (west and southwest) [44].

2.3. Datasets

2.3.1. Rain Gauges (RGs) Data

The in-situ precipitation data from 102 RGs are used to develop a WALS-RBPD (Figure 1b). The precipitation data of Pakistan are collected from two organizations, i.e., Pakistan Meteorology Department (PMD) and the Water and Power Development Authority (WAPDA) under the Snow and Ice Hydrology Project (SIHP). All the stations under the umbrella of SIHP-WAPDA operate at high altitude regions, which are mostly located in glacial and humid regions. All the RGs have daily precipitation observations from 2000 to 2015. Among the collected 102 RGs, the data from 79 and 23 RGs were collected from PMD and WAPDA, respectively. In the current study, these RGs are named after their associated climate regions, with GR-RGs, HR-RGs, AR-RGs, and HAR-RGs representing RGs in the glacial, humid, arid, and hyper-arid regions, respectively.
Since PMD and WAPDA collect the data manually, it may be subjected to errors, including instrumental, human-induced, and other external errors. Therefore, PMD and WAPDA follow the World Meteorological Organization standard code “WMO-N” to evaluate and remove the errors from the RGs’ data. Moreover, for the reasons mentioned above, the data are further checked carefully for its quality and missing data using different statistical tests such as skewness and kurtosis and zero-order method [24].

2.3.2. Satellite Precipitation Datasets (SPDs)

Six different sources of precipitation datasets (Table 1) including IMERG-V06 [45], TMPA 3B42-v7 [12], PERSIANN-CDR [46], ERA-Interim [11], SM2RAIN-CCI [47,48], and SM2RAIN-ASCAT [49,50] were considered for the current study. Readers are referred to Rahman et al. [3,40] for detailed descriptions of the selected SPDs. The spatial resolution of IMERG is 0.1° by 0.1°, while other SPDs have a spatial resolution of 0.25° by 0.25°. Therefore, IMERG is resampled to 0.25° from 0.1° to ensure the similar spatial resolution of all SPDs prior to its application in the final blending algorithm.

2.4. Methods

First, an appropriate set of SPDs was selected for each climate region based on the assessment of SPDs listed in Table 1. Then, the WALS-RBPD was developed from the selected SPDs using the WALS algorithm. To further extend the duration of developed WALS-RBPD, the autoregressive integrated moving average (ARIMA) model was used to extrapolate the time series of SPDs weights. Finally, the performance of WALS-RBPD was assessed as compared with rain gauges.

2.4.1. Selection of an Appropriate Set of SPDs for Each Climate Region

This study is focusing on developing the BPD on a regional scale, which considered the high magnitude of errors in precipitation estimates across glacial and humid regions (previously developed BPDs had the high magnitude of errors across these climate regions) and could give better results as compared with previously developed BPDs. Therefore, the selection of an appropriate set of SPDs that precisely estimate precipitation in each climate region was extremely vital. All SPDs, listed in Table 1, were initially evaluated against the RGs using mean absolute error (MAE) and correlation coefficient (R), and four SPDs that performed better in each climate region were selected to develop the WALS-RBPD.

2.4.2. Weighted Average Least Squares (WALS) Algorithm

The WALS algorithm is relatively new and superior to the traditional Bayesian model averaging (BMA). It addresses various deficiencies of BMA and is also more robust in terms of performance and computation time [51,52]. The WALS algorithm has a trivial computation burden (time and space) that increases linearly rather exponentially (as BMA) and performs better than BMA when no prior information is available. In addition, the WALS algorithm also deals with other problems of BMA, such as the different sets of priors for the same model parameter and difficulty with considering extensions to non-spherical disturbances [52]. The SPD observations for WALS algorithm are divided into two classes, i.e., explanatory variables or focus regressors and auxiliary regressors. Focus regressors are essential to run the WALS algorithm, while auxiliary regressors are less important additional variables. In the current research, the precipitation data of pixels containing RGs and the corresponding SPDs pixels were considered to be focus regressors, while pixels that did not accompany any RGs and surrounded the focus regressors were considered to be auxiliary regressors. Furthermore, the model averaging procedure was based on two essential steps. The model parameters conditional on the selected model were estimated in the first step, while estimators in terms of the weighted average of conditional estimated selected previously were considered in the second step. Finally, the obtained weights were dynamically varied using the method recommended by Rahman et al. [1,3]. Readers are referred to Rahman et al. [4] for an interpretation of the WALS algorithm for blending SPDs.

2.4.3. Time Series Forecasting of SPDs Weights

The ARIMA model was used to forecast the time series of SPDs weights (obtained through the dynamic WALS method) for the years 2016, 2017, and 2018. The weights of each SPD were arranged based on the DOY (day of the year) for each year before the application of the ARIMA model. The ARIMA model originated from autoregressive (AR), moving averaging (MA), and a combination of both AR and MA (ARMA) models [53,54]. The step-by-step methodology for the ARIMA model was provided by Box and Jenkins [55], who combined both AR (multiplied by the past values of time series data) and MA (multiplied by past random shocks) coefficients with an appropriate number of differencing to make the time series stationary [56,57]. The ARIMA model is applicable to time series without any missing records. Therefore, it is ensured that the data has no missing values.
There are three important parameters (p, d, and q) for the ARIMA model, which must be carefully calculated for the forecast with high precision [56]. The parameters p, d, and q represent the autoregressive lag order, the degree of difference to make the original data stationary, and the order of moving average for the independently and identically distributed (i.i.d) residuals, respectively. The forecast using the ARIMA model was performed by the maximum likelihood using the Kalman filter, because any model containing a moving averaging component needs nonlinear estimation techniques.

2.4.4. Performance Assessment of the Dynamic Regional Blended Precipitation Dataset (BPD) based on Weighted Average Least Squares (WALS-RBPD)

Six continuous statistical indices (listed in Table 2) were used to quantitatively assess the performance of WALS-RBPD. These indices included mean bias (MB), mean absolute error (MAE), unbiased root mean square error (ubRMSE), correlation coefficient (R), Kling–Gupta efficiency (KGE), and Theil’s U coefficient [58,59,60]. The positive and negative MB values indicate overestimation and underestimation of precipitation by the model, respectively, which represent the average tendency of WALS-RBPD estimated precipitation to be higher than RG precipitation and vice versa. The optimal value for MB is zero. The mean absolute difference between RG precipitation and WALS-RBPD estimated precipitation is represented by MAE. The squared difference between RG and WALS-RBPD precipitation is calculated using ubRMSE. The lower the MAE and ubRMSE, the better the results. “R” represents the agreement between WALS-RBPD and RGs, which ranges from −1 to 1, and 1 is the optimal value. KGE combines different statistical indices such as R, variability ratio (γ), and bias ratio (β) and is used to assess the overall performance of WALS-RBPD. The statistical metric “R” in the KGE score calculates the temporal dynamics of WALS-RBPD, while γ and β are used to measure the distribution and volume of precipitation, respectively. KGE ranges from to 1, with 1 as the optimal value. The accuracy of WALS-RBPD as compared with RGs is assessed using Theil’s U coefficient. The lower bound of Theil’s U is zero (a perfect forecast), the value of 1 indicates the same error as the naïve no-change extrapolation, while values larger than 1 should be rejected (depicting the worst forecast). Only hit cases (when both RGs and SPDs capture the precipitation event) are considered in the current study; therefore, the categorical indices are excluded from the analyses.
Furthermore, skill score (SS) is used to assess the performance of WALS-RBPD as compared with other blended precipitation datasets, including DBMA-BPD [3], DCBA-BPD [1], and WALS-BPD [4], which are developed and evaluated across Pakistan throughout four climate regions. The skill scores (SSs) for all the statistical indices (presented in Table 2) are calculated using the Equations (1) or (2).
Z s c o r e = 100 × ( 1 Z W A L S R B P D Z D B M A / D C B A / W A L S )
Z s c o r e = 100 × ( Z W A L S R B P D Z D B M A / D C B A / W A L S 1 )
where Z is an index in Table 2; Equation (1) is applicable to MB, MAE, ubRMSE, and Theil’s U that are preferable for smaller values with the perfect value of zero; while Equation (2) is applicable to R and KGE that are preferable for greater values with the perfect value of 1.

3. Results and Discussion

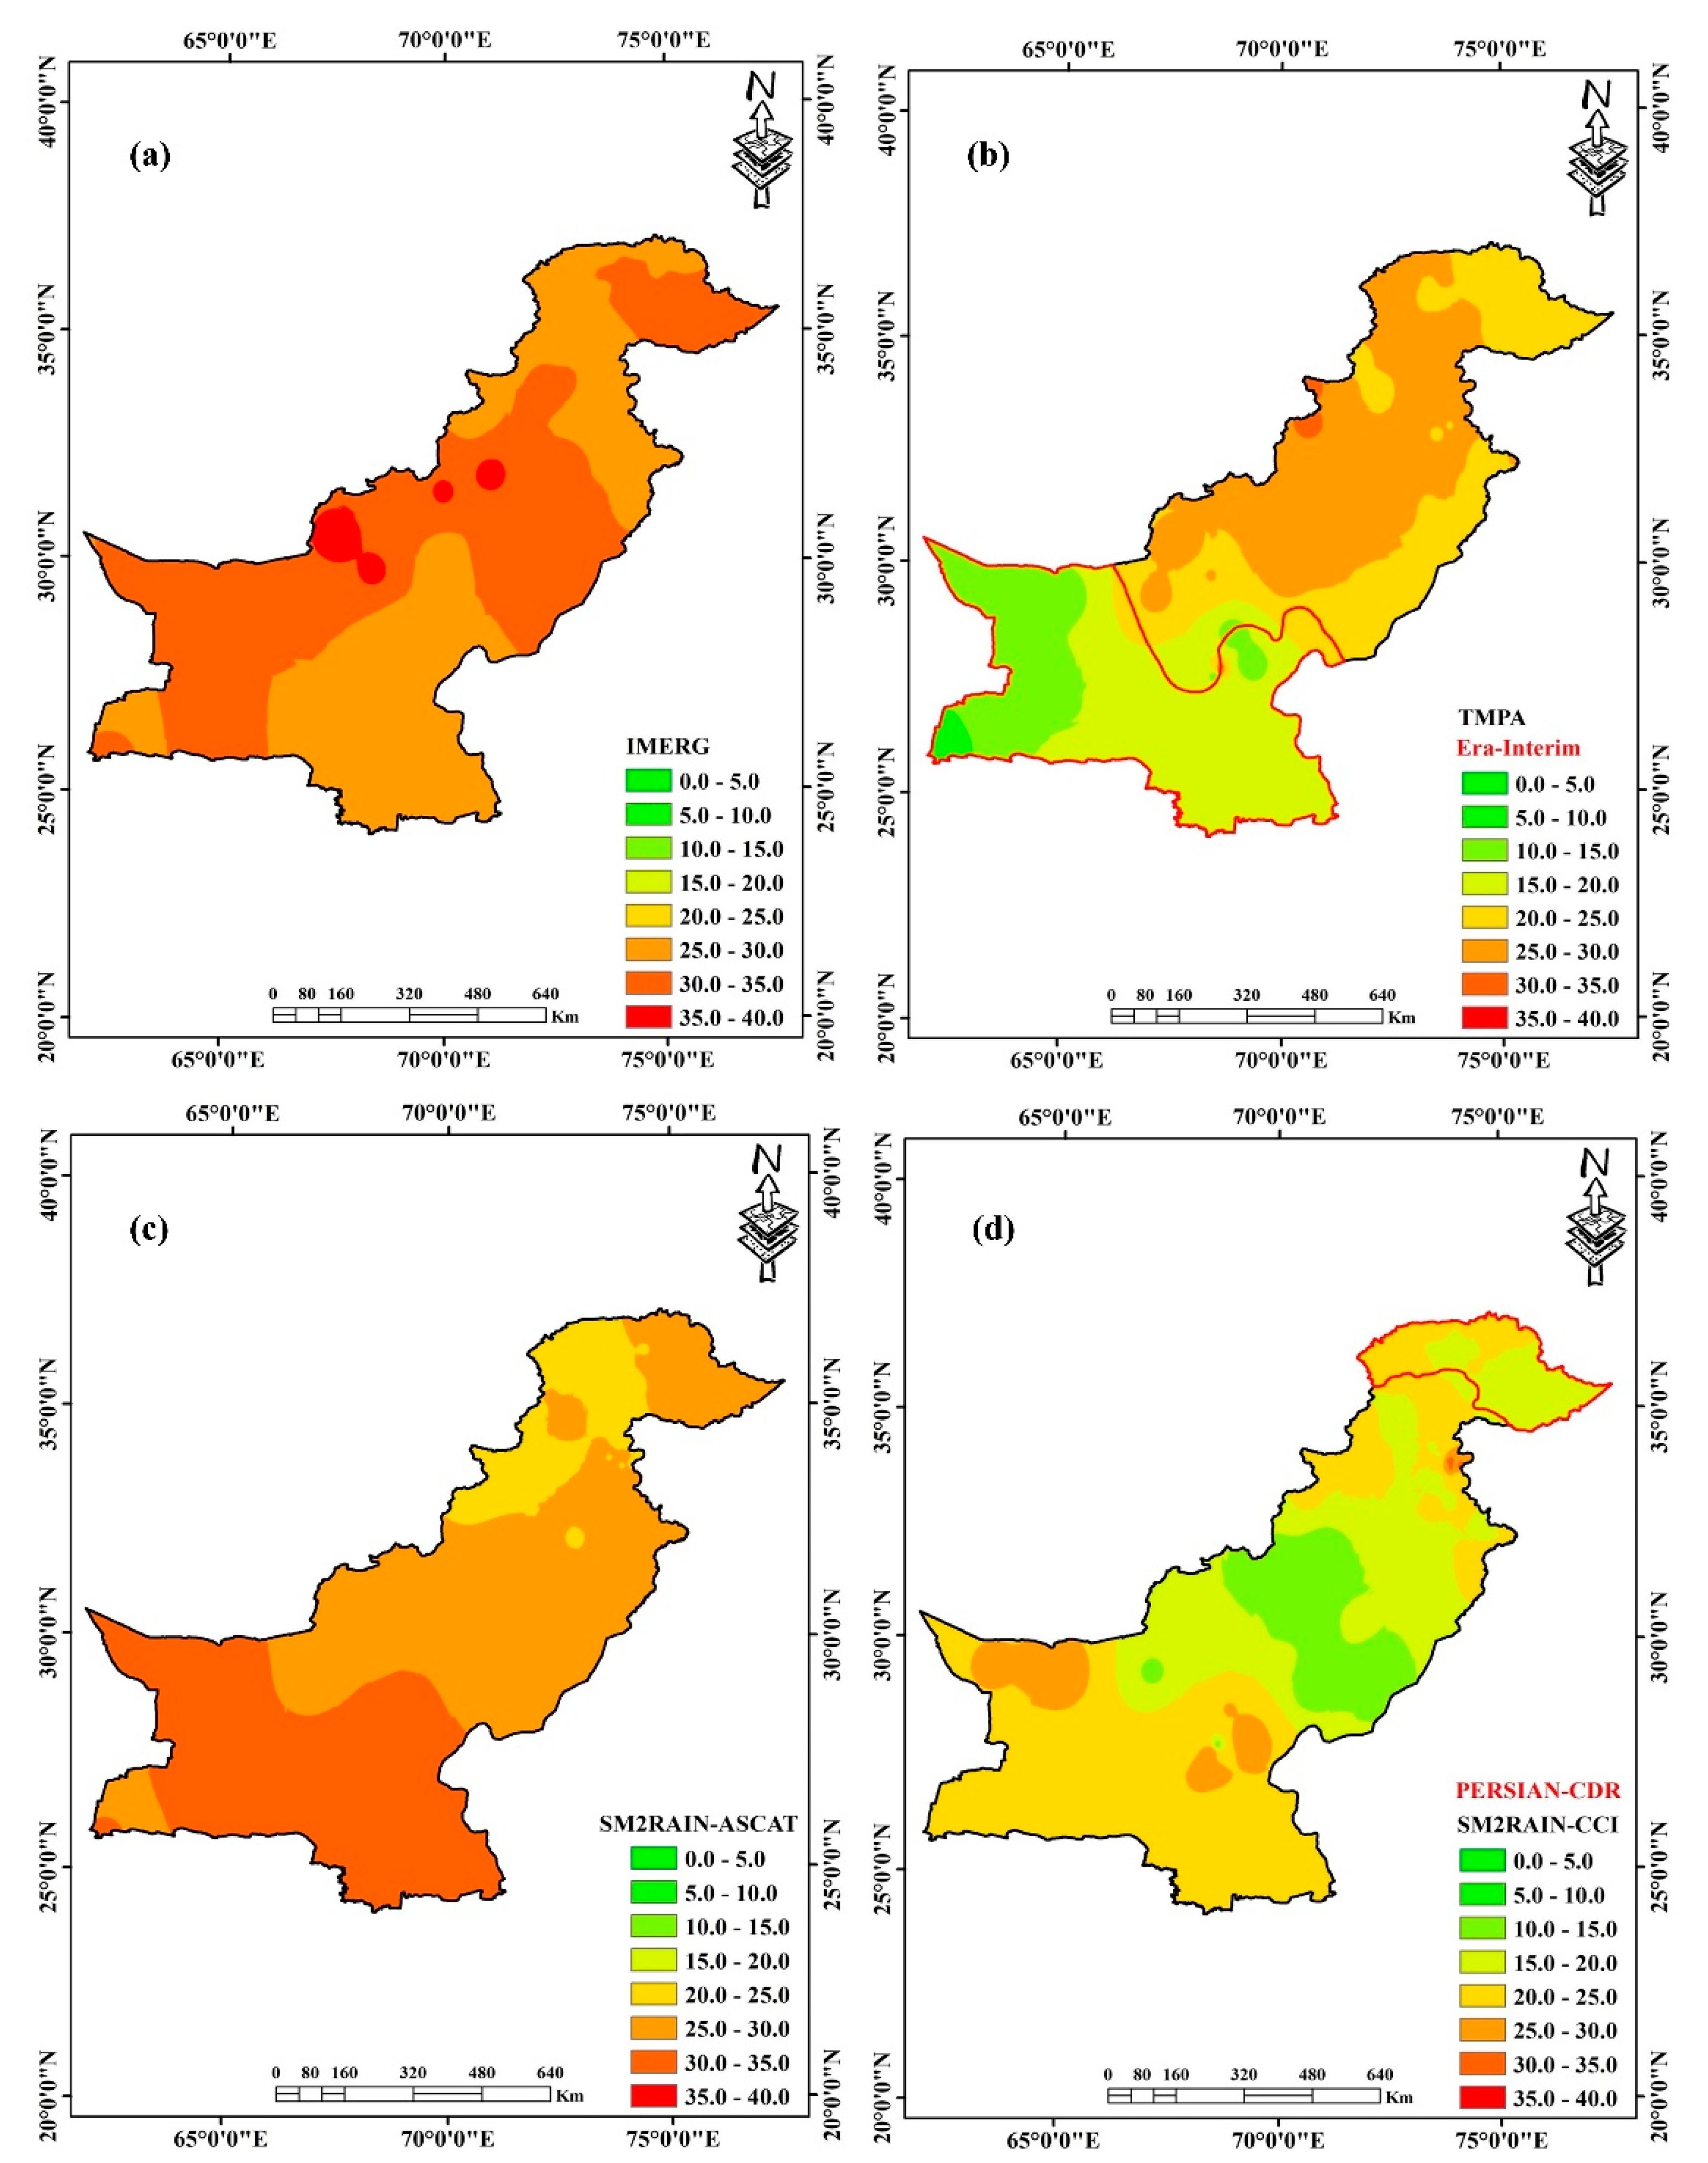
3.1. Appropriate Set of SPDs for Each Climate Region

The performance of SPDs shows time scale, topographic, elevation, and seasonal dependencies [1,61], and thus propagate into the blending algorithm, i.e., impact SPD weights and their spatial distribution. Therefore, the selection of appropriate SPDs for a particular region is extremely critical, and the limitations (biases) must be kept in mind before the application of blending algorithm and developing precise BPDs. In the current study, different combinations of SPDs are tested across each climate region based on their individual performance, and the ultimate combination with the most accurate precipitation estimates are presented in Table 3 and Table 4. Table 3 shows the regional average statistical index values of the SPDs (Table 1) assessed against rain gauges, where the values in bold format represent SPDs selected for developing the RBPD for a particular climate region. Table 4 summarizes the finally selected SPDs across each climate.
The reason for excluding TMPA in the hyper-arid region is the higher weights of the other three blending members and relatively better performance of ERA-Interim in the region (dominated the PERSIANN-CDR). Moreover, the inclusion of relatively poor performing blending member in the hyper-arid region will not affect the performance of BPD due to the better performance of all SPDs in the hyper-arid region as compared with other climate regions. Furthermore, SM2RAIN-based products have different behaviors as compared with other conventional SPDs. On the one hand, conventional SPDs overestimate precipitation across glacial, humid (most of the region), and elevated areas of arid region, while the SM2RAIN-based SPDs underestimate precipitation. On the other hand, SM2RAIN-based SPDs overestimate the precipitation in plain areas of the arid region and the hyper-arid region, while conventional (top-down) SPDs mostly underestimate the precipitation [40]. Previously developed BPDs used the conventional SPDs that amplified the errors across glacial and humid regions. Therefore, the inclusion of SM2RAIN data abates the amplified errors in glacial and humid regions.

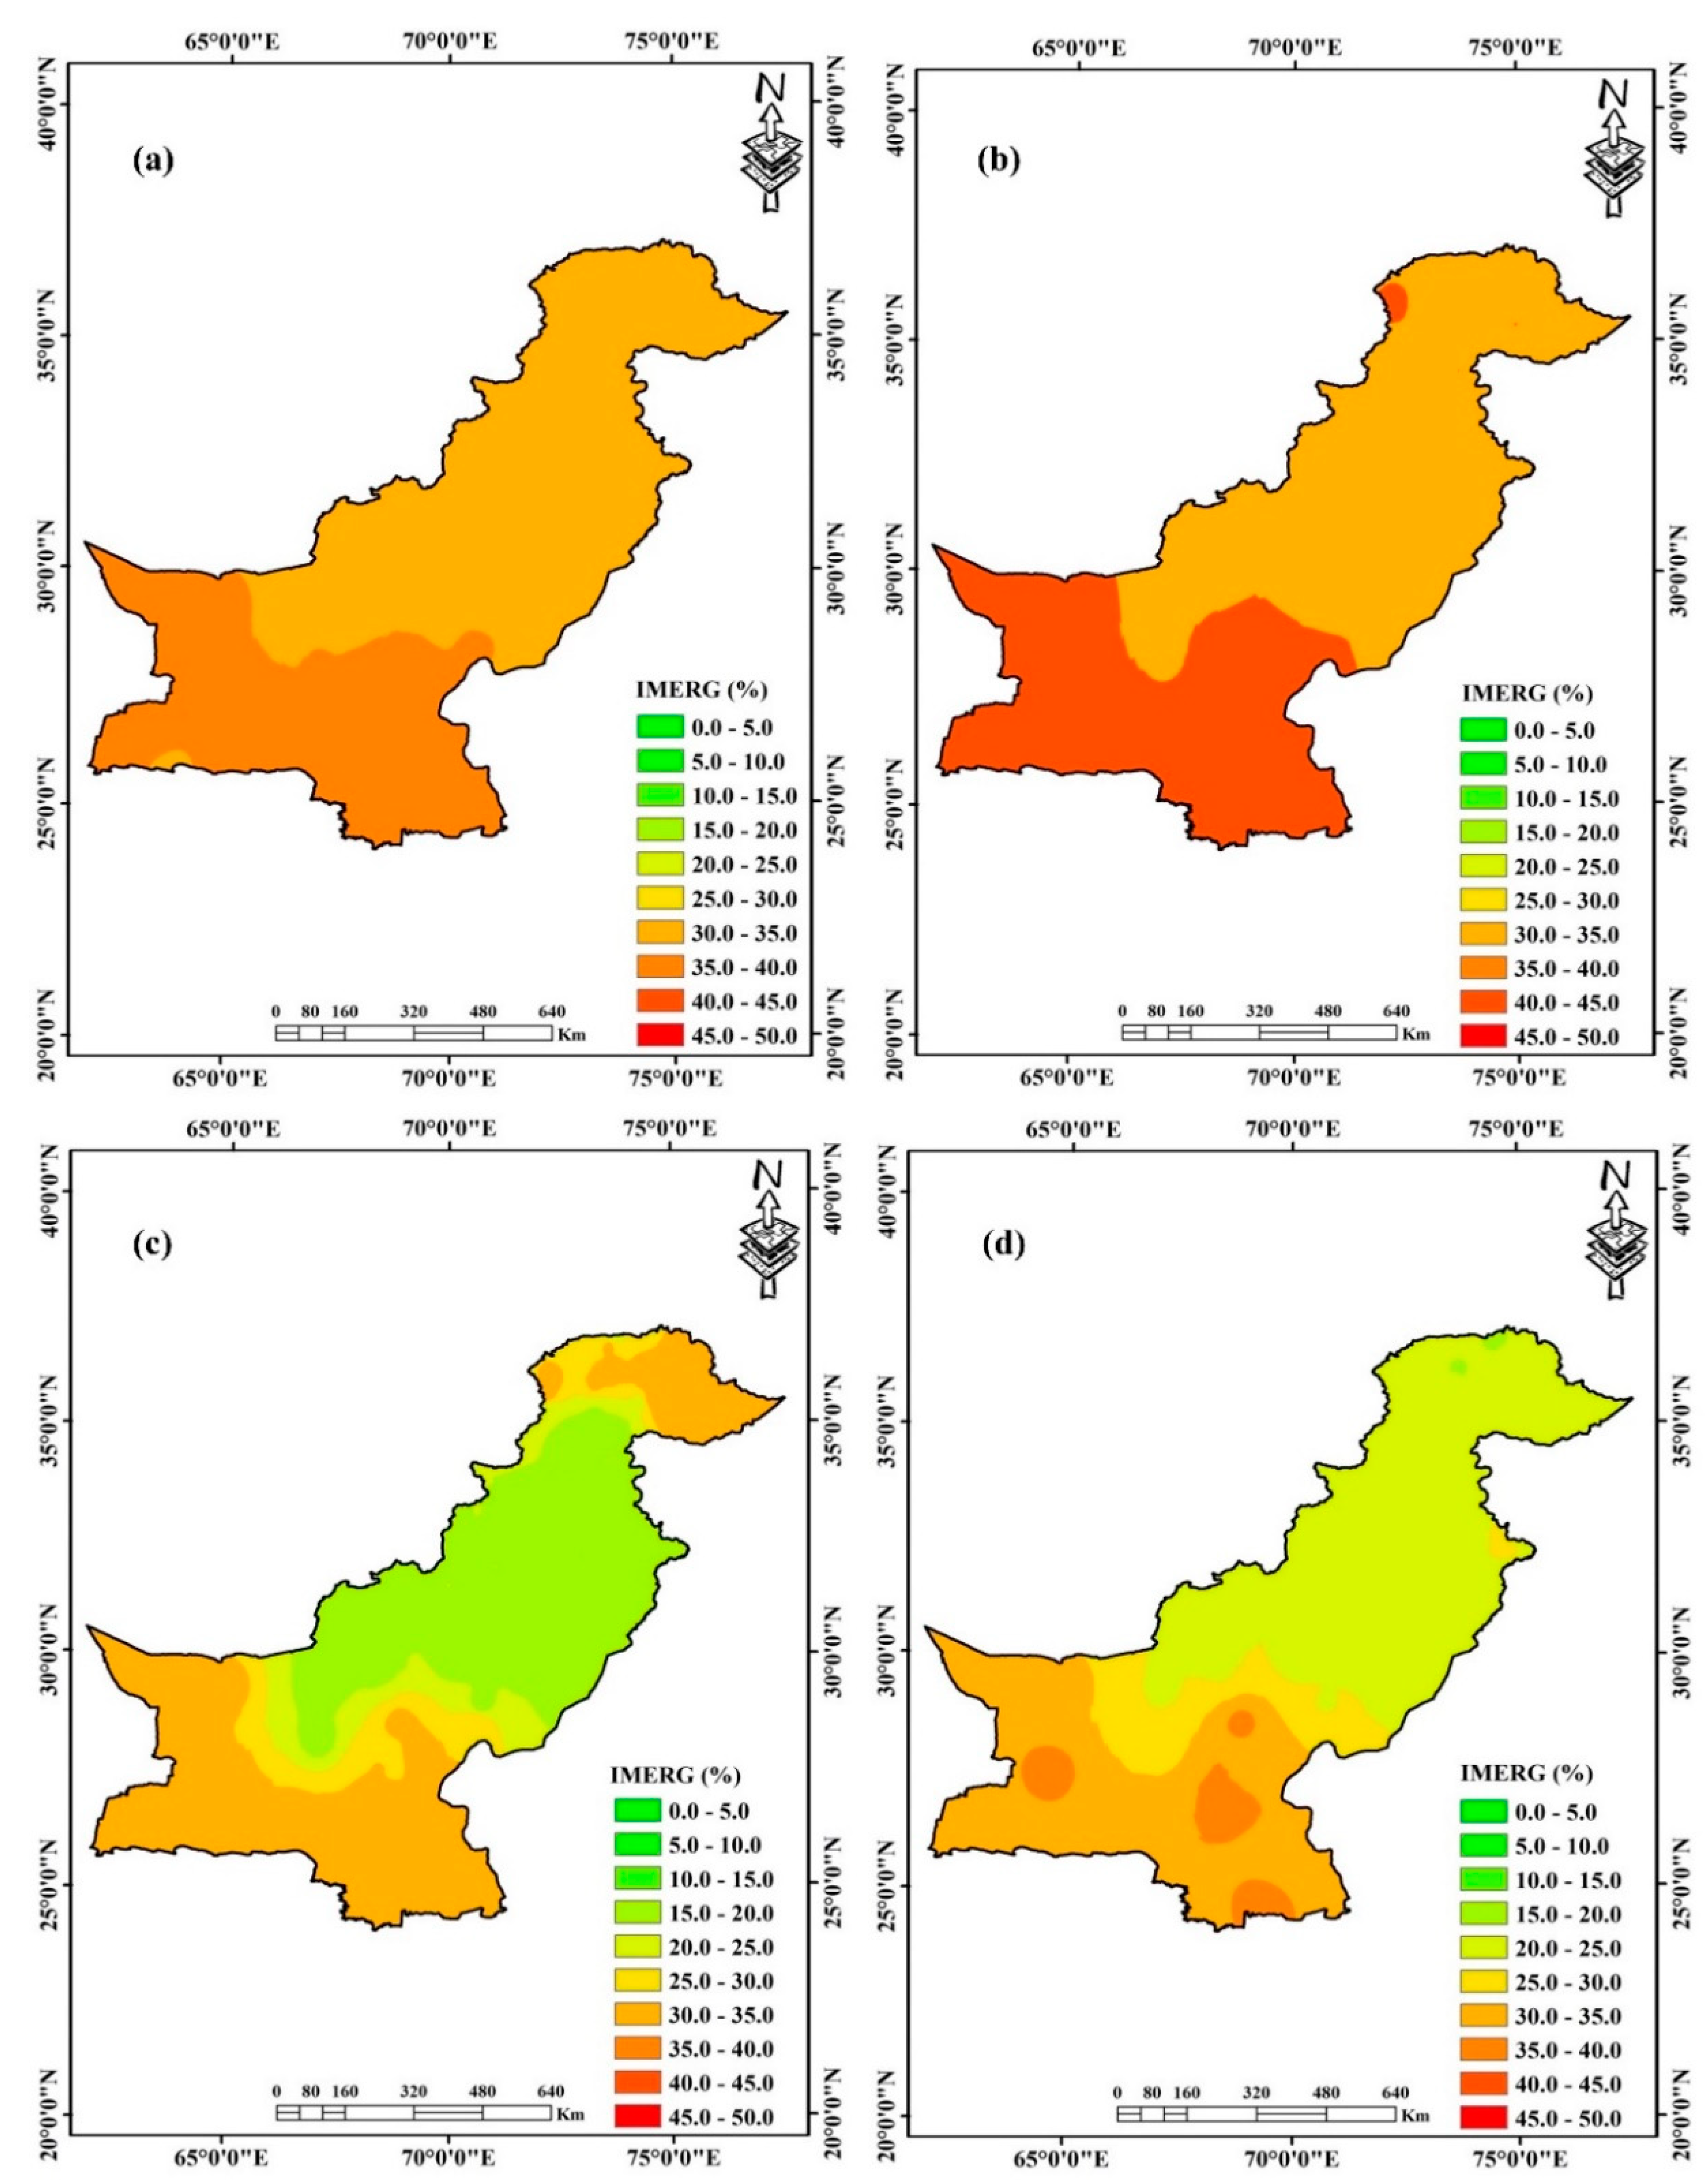
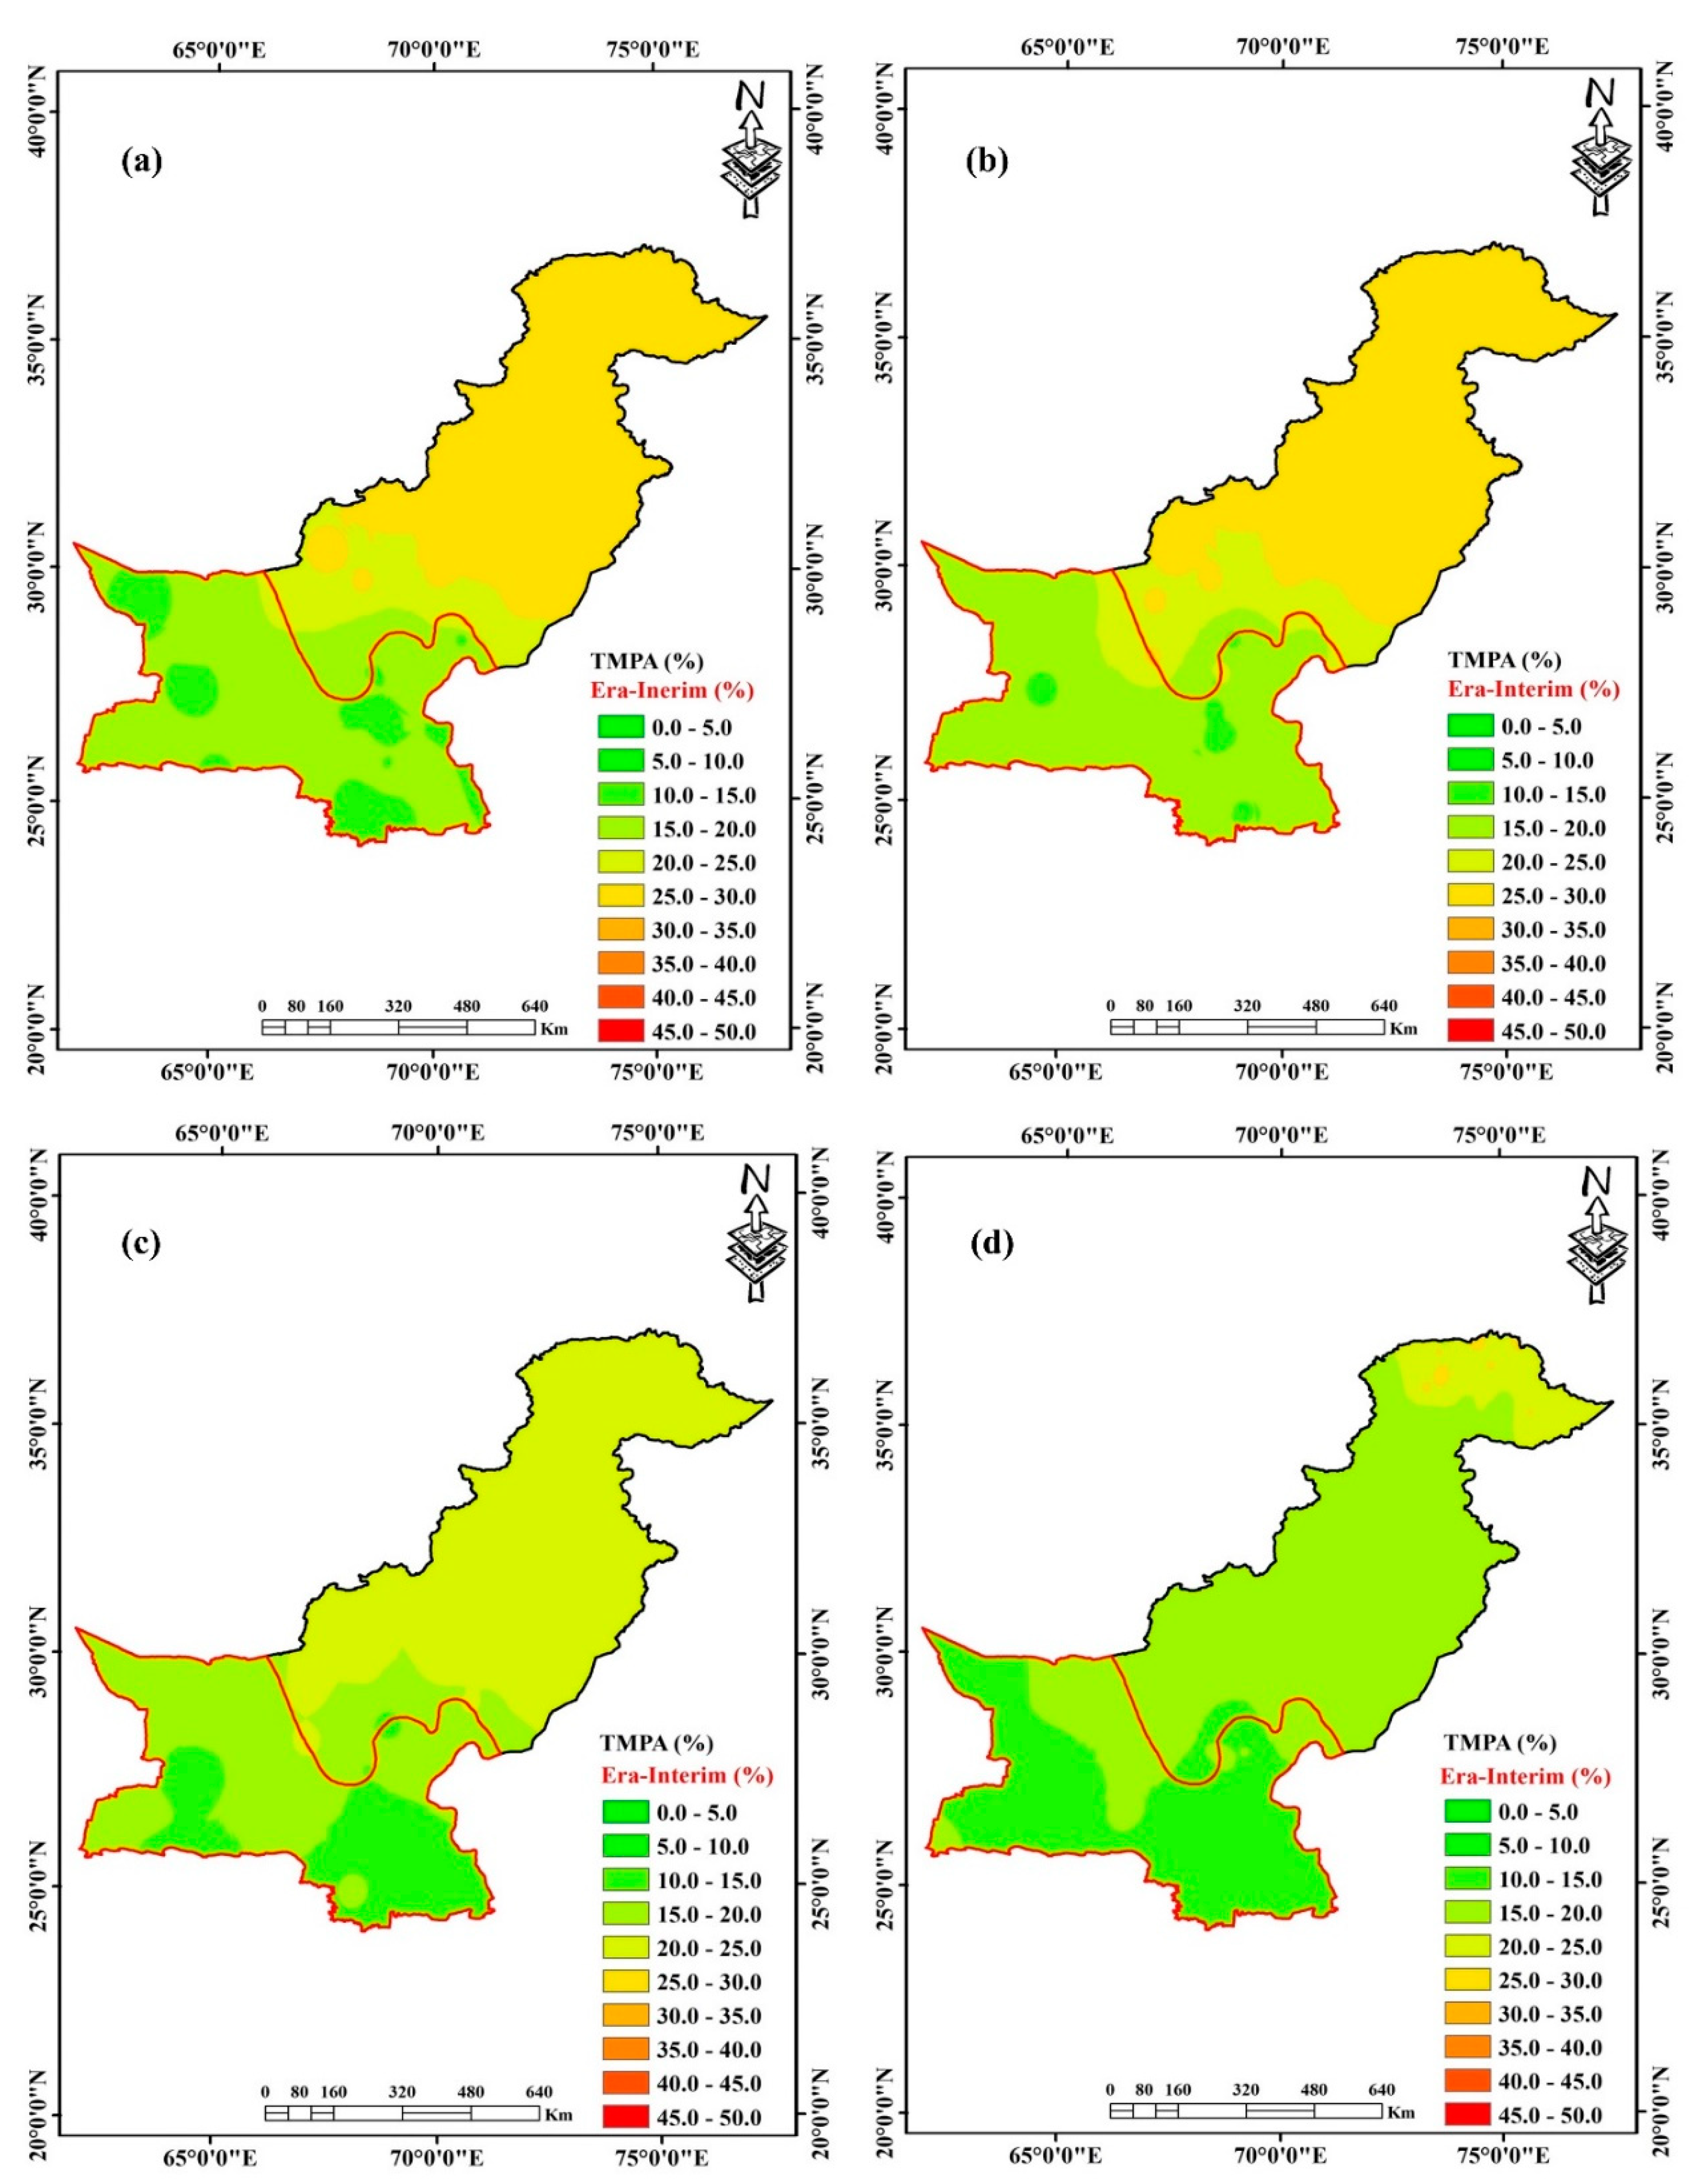
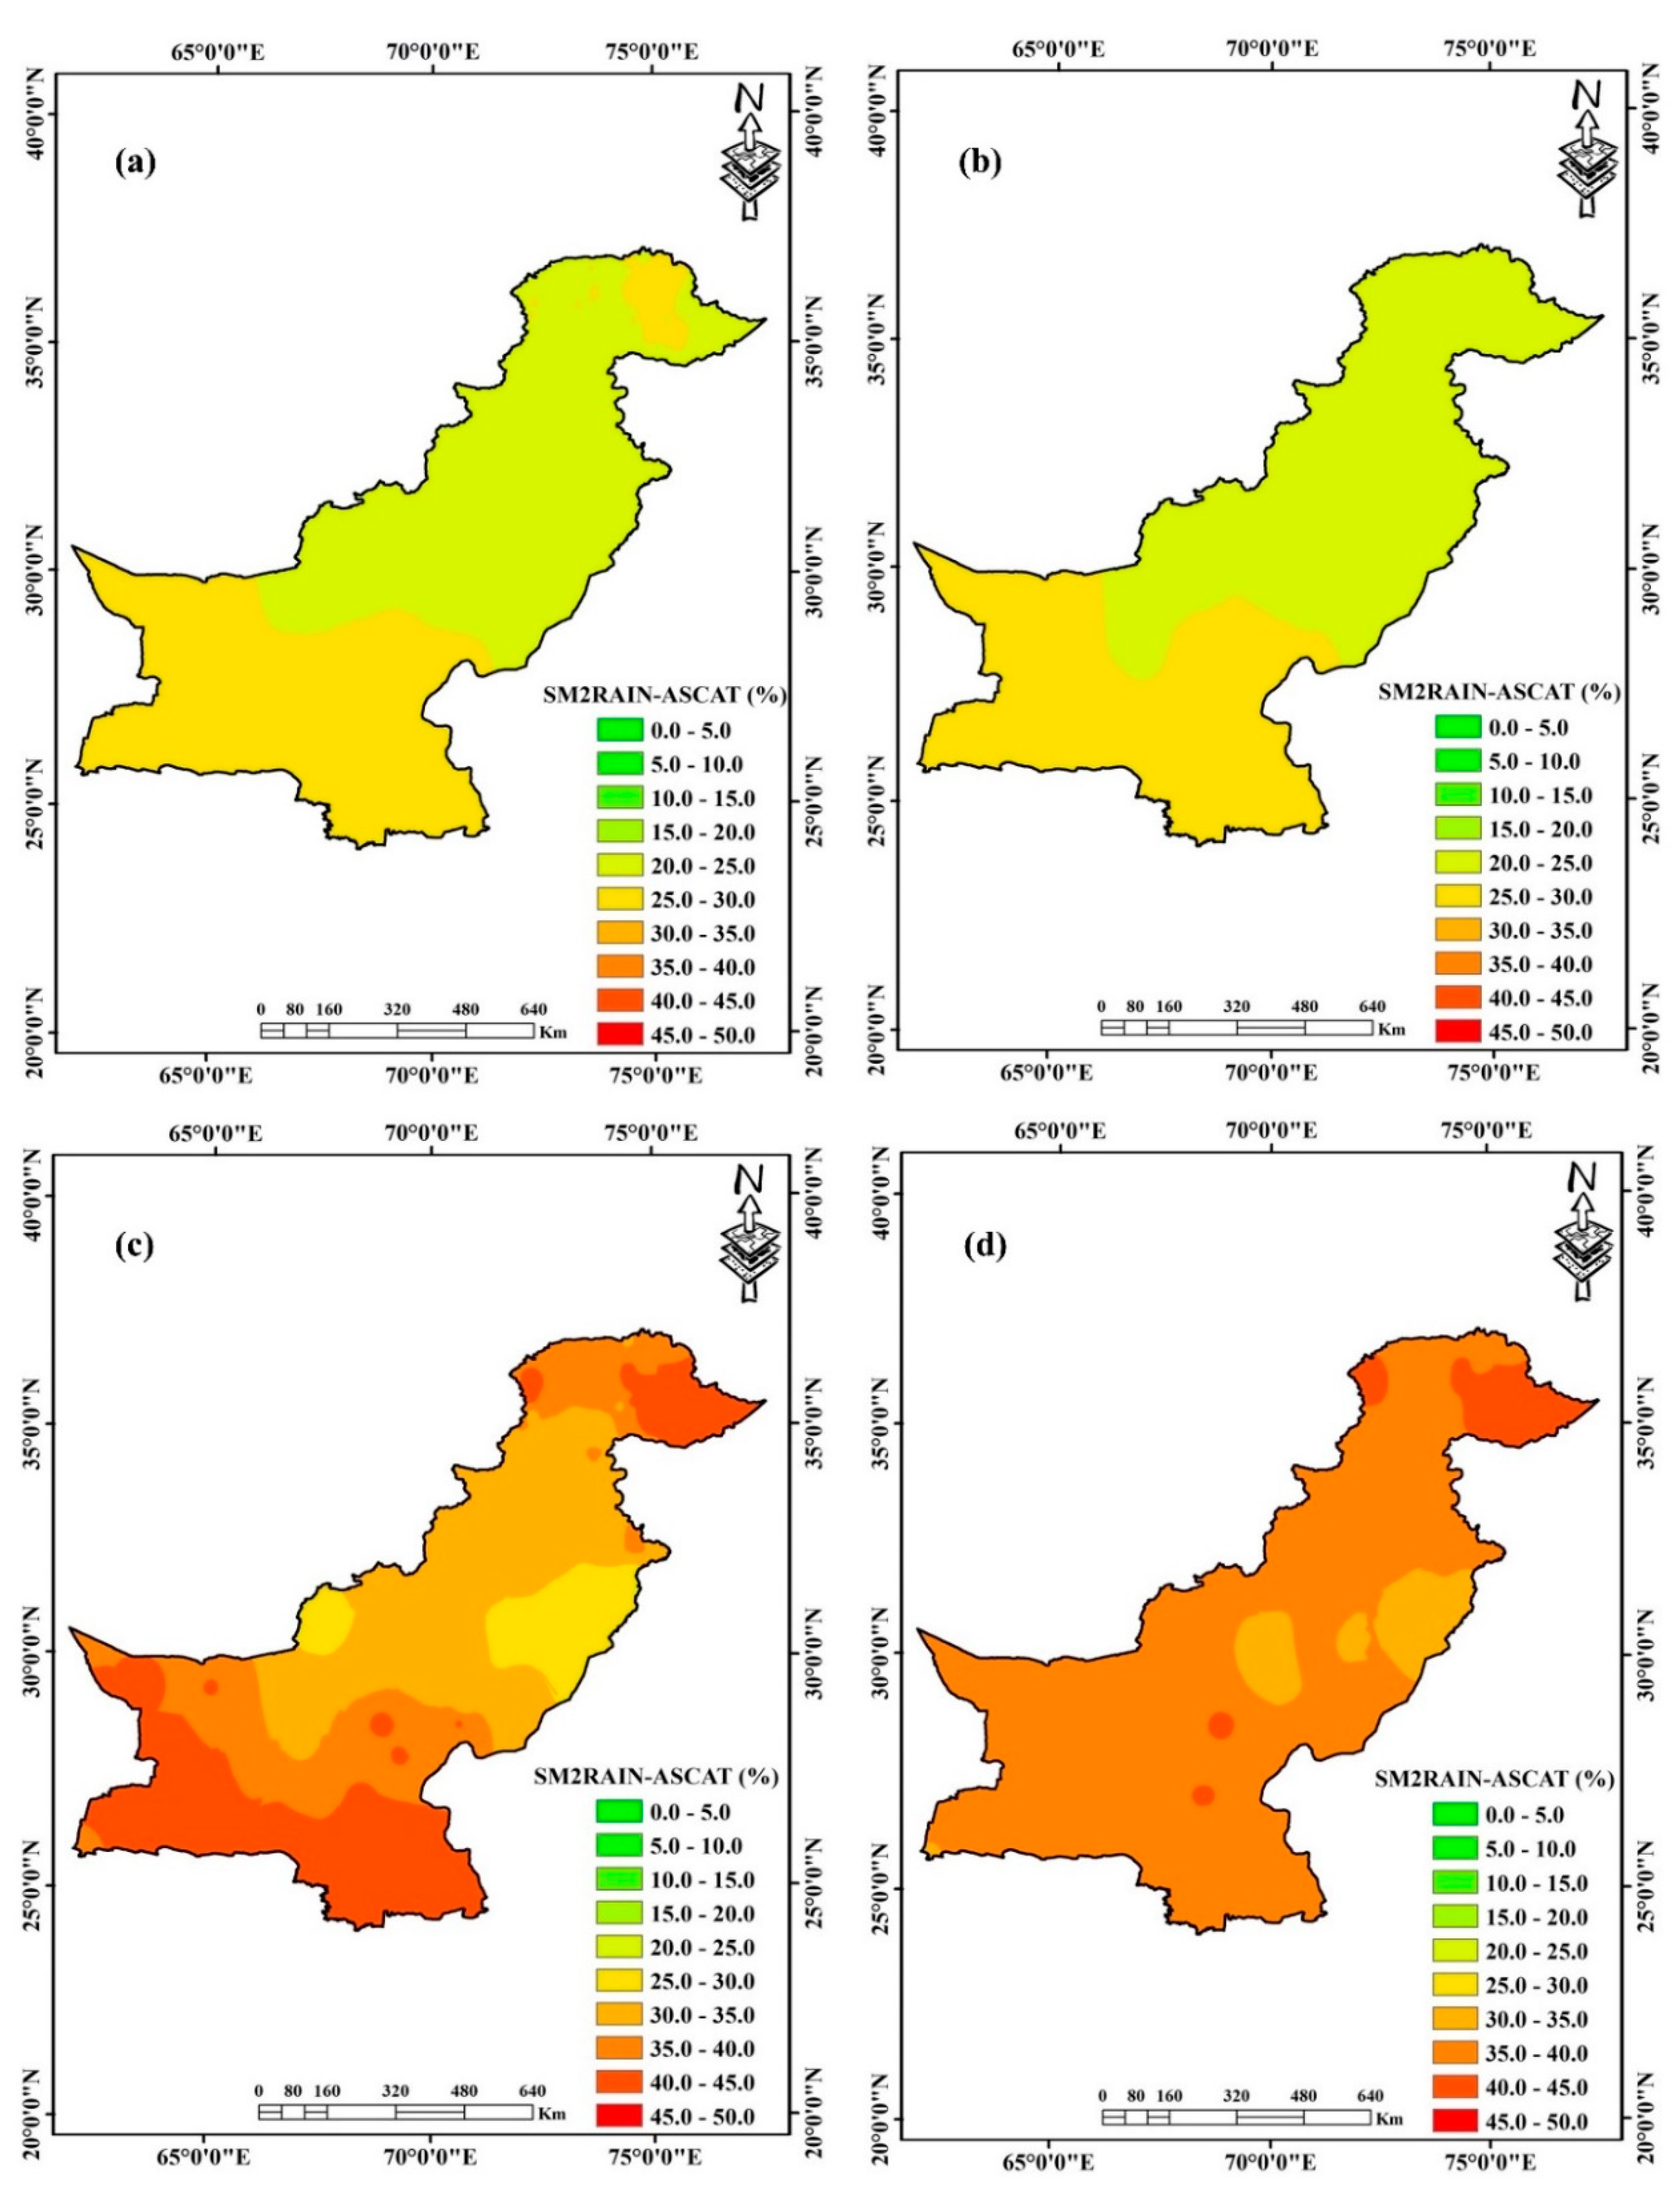
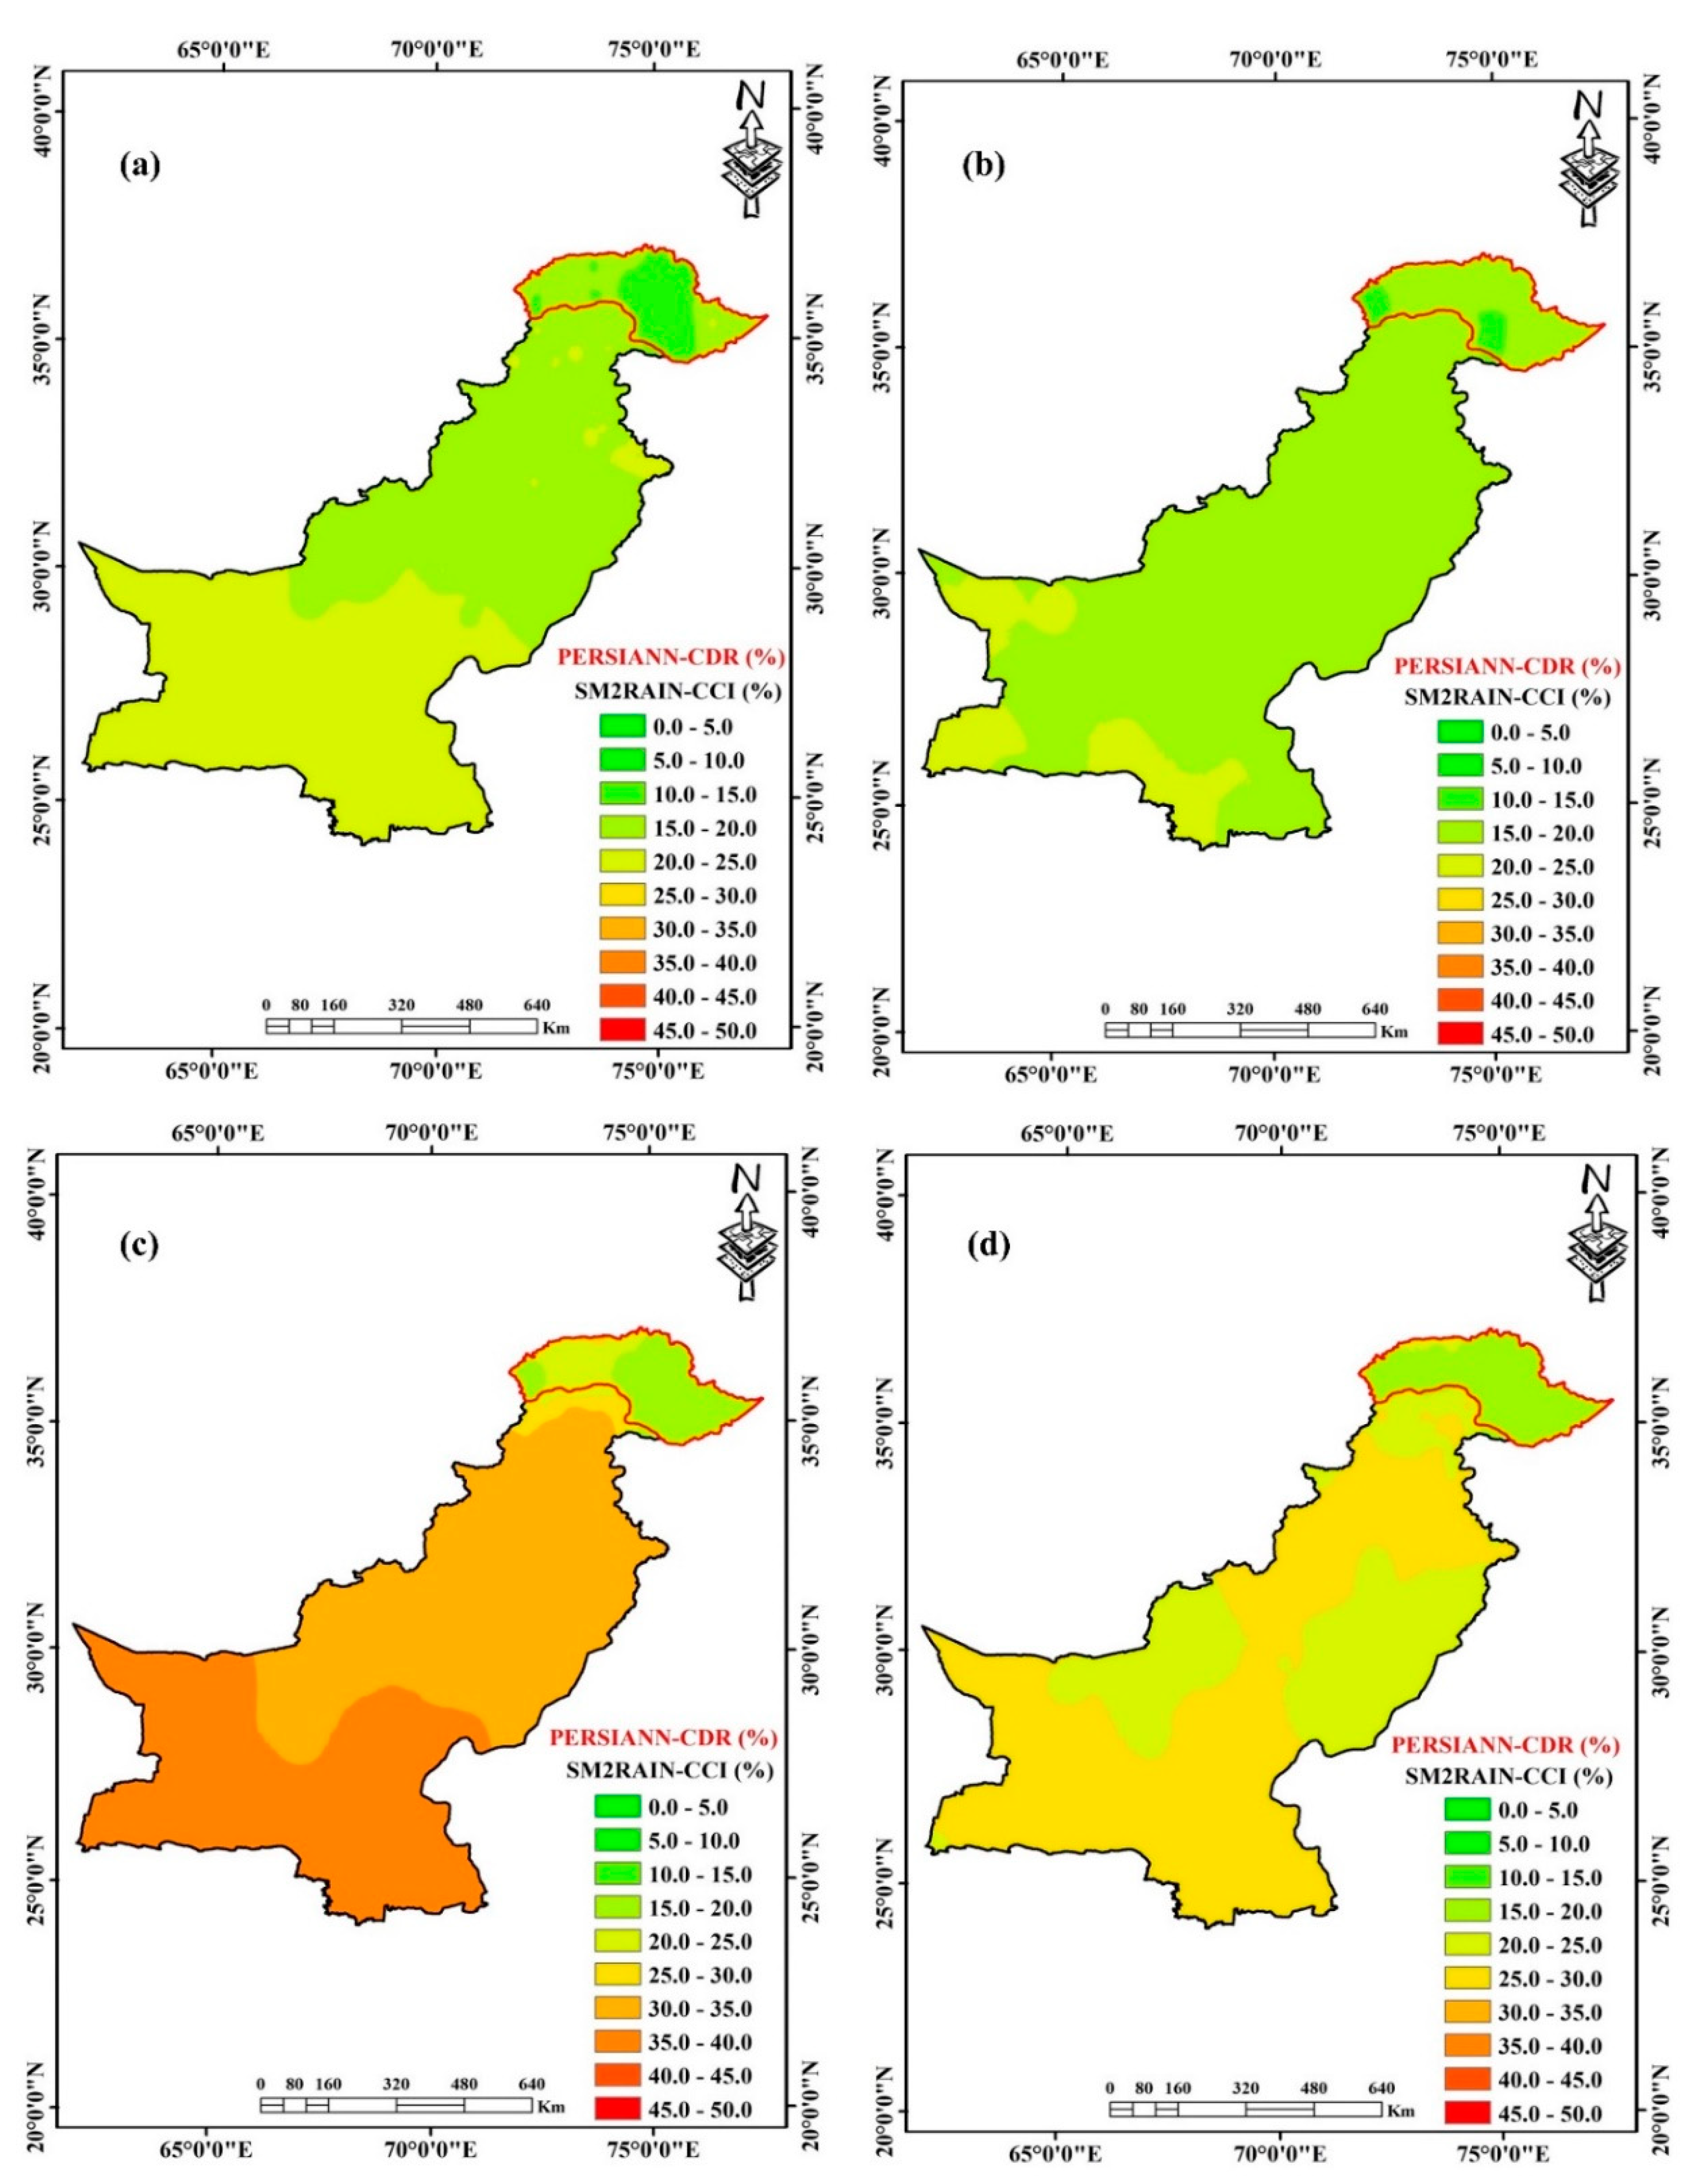
3.2. Spatial Distribution of WALS-RBPD Weights

Blending weights of SPDs and their associated standard error, t-test (hereinafter, t-values), and p-value statistics across all climate regions are presented in Table 5. The absolute values of the t-values, |t|, greater than 2.58, 1.96, or 1.64 represent that the comparison of SPDs with RGs is statistically significant at 0.01, 0.05, or 0.10 significance level, respectively, and vice versa.
The weights presented in Table 5 depict the dominance of IMERG and TMPA, followed by SM2RAIN-ASCAT in the glacial and humid regions, IMERG and SM2RAIN-ASCAT followed by TMPA in the arid region, while SM2RAIN-ASCAT and IMERG followed by SM2RAIN-CCI in the hyper-arid region. ERA-Interim is considered in combination with other SPDs because of its higher performance in the hyper-arid region as compared with PERSIANN-CDR, although ERA-Interim has relatively lower weights than the other three SPDs in the combination. The results depict that IMERG and TMPA are the best blending members depicting higher correlation with RGs, and hence higher performance in most climate regions (except the arid region where SM2RAIN-ASCAT has a higher weight than TMPA and the hyper-arid region where SM2RAIN-ASCAT outperforms IMERG and TMPA). IMERG dominated the glacial, humid, and arid regions, while SM2RAIN-ASCAT has higher weights across the hyper-arid region.
Figure 2 shows the spatial distribution of weights (during the period of 2007–2018) across different climate regions of Pakistan. Figure 2a shows that IMERG has higher weights (performance) across the arid and glacial regions. The maximum and minimum weights of IMERG are 37.38% and 24.97%, observed at AR-RG12 and GR-RG1, respectively. SM2RAIN-ASCAT (Figure 2c) is used across all four climate regions; therefore, it has the highest average weight (more than TMPA as TMPA is not used in the hyper-arid region) following the IMERG. SM2RAIN-ASCAT dominates the hyper-arid region with an average weight of 30.57% in the region. The maximum and minimum weights of 34.53% and 16.92% for SM2RAIN-ASCAT are depicted at HAR-RG2 and HR-RG14, respectively.
The weights for TMPA in combination with ERA-Interim (hyper-arid region with red boundary) are presented in Figure 2b. TMPA dominated the humid region (27.28%), followed by the arid region (25.92%). HR-RG27 and GR-RG14 received the maximum and minimum TMPA weights of 31.21% and 20.06%, respectively. ERA-Interim is used in combination with other SPDs across the hyper-arid region, which outperformed the PERSIANN-CDR and is the best fit with higher weights of IMERG and SM2RAIN-ASCAT in the hyper-arid region. The maximum and minimum weights for ERA-Interim are 18.94% and 8.17% at HAR-RG21 and HAR-RG24, respectively. Since the SM2RAIN-CCI data are not available for the glacial region; therefore, SM2RAIN-CCI is used in combination with PERSIANN-CDR (Figure 2d). The maximum and minimum weights of PERSIANN-CDR across the glacial region are 23.84% and 15.09%, respectively, observed at GR-RG9 and GR-RG15. Moreover, HR-RG22 and HAR-RG11 receive the minimum (21.95%) and maximum (29.22%) weights of SM2RAIN-CCI. It is evident from the figure that the performance of SM2RAIN-CCI is best across the hyper-arid and humid regions.
The distribution of average forecasted weights (2016 to 2018) across all climate regions of Pakistan is presented in violin plots shown in Figure 3. The ARIMA model is a univariate model that forecasts weights based on the past trend of WALS weights (in the current study from 2007 to 2015). The final calibrated parameters selected for the ARIMA model are p = 1, d = 0, and q = 1. Figure 3a shows that the ARIMA model has forecasted higher weights (in magnitude) for IMERG and TMPA, while high variations are observed for PERSIANN-CDR in the glacial region. Similarly, in the humid region (Figure 3b), TMPA and SM2RAIN-ASCAT have an almost similar range of weights (TMPA shows the high variations in forecasted weights). IMERG dominated the humid region while SM2RAIN-CCI was the member with a lower magnitude of weights (with high variations). In the arid region, a different pattern was observed, where SM2RAIN-ASCAT dominated the TMPA, while IMERG dominated all the blending members, and SM2RAIN-CCI had the poorest performance among all. ERA-Interim was the member with lower weights in the hyper-arid region. However, SM2RAIN-ASCAT dominated the hyper-arid region showing maximum forecasted weights with high variation. Interestingly, SM2RAIN-CCI and IMERG had weights in close proximity to each other.

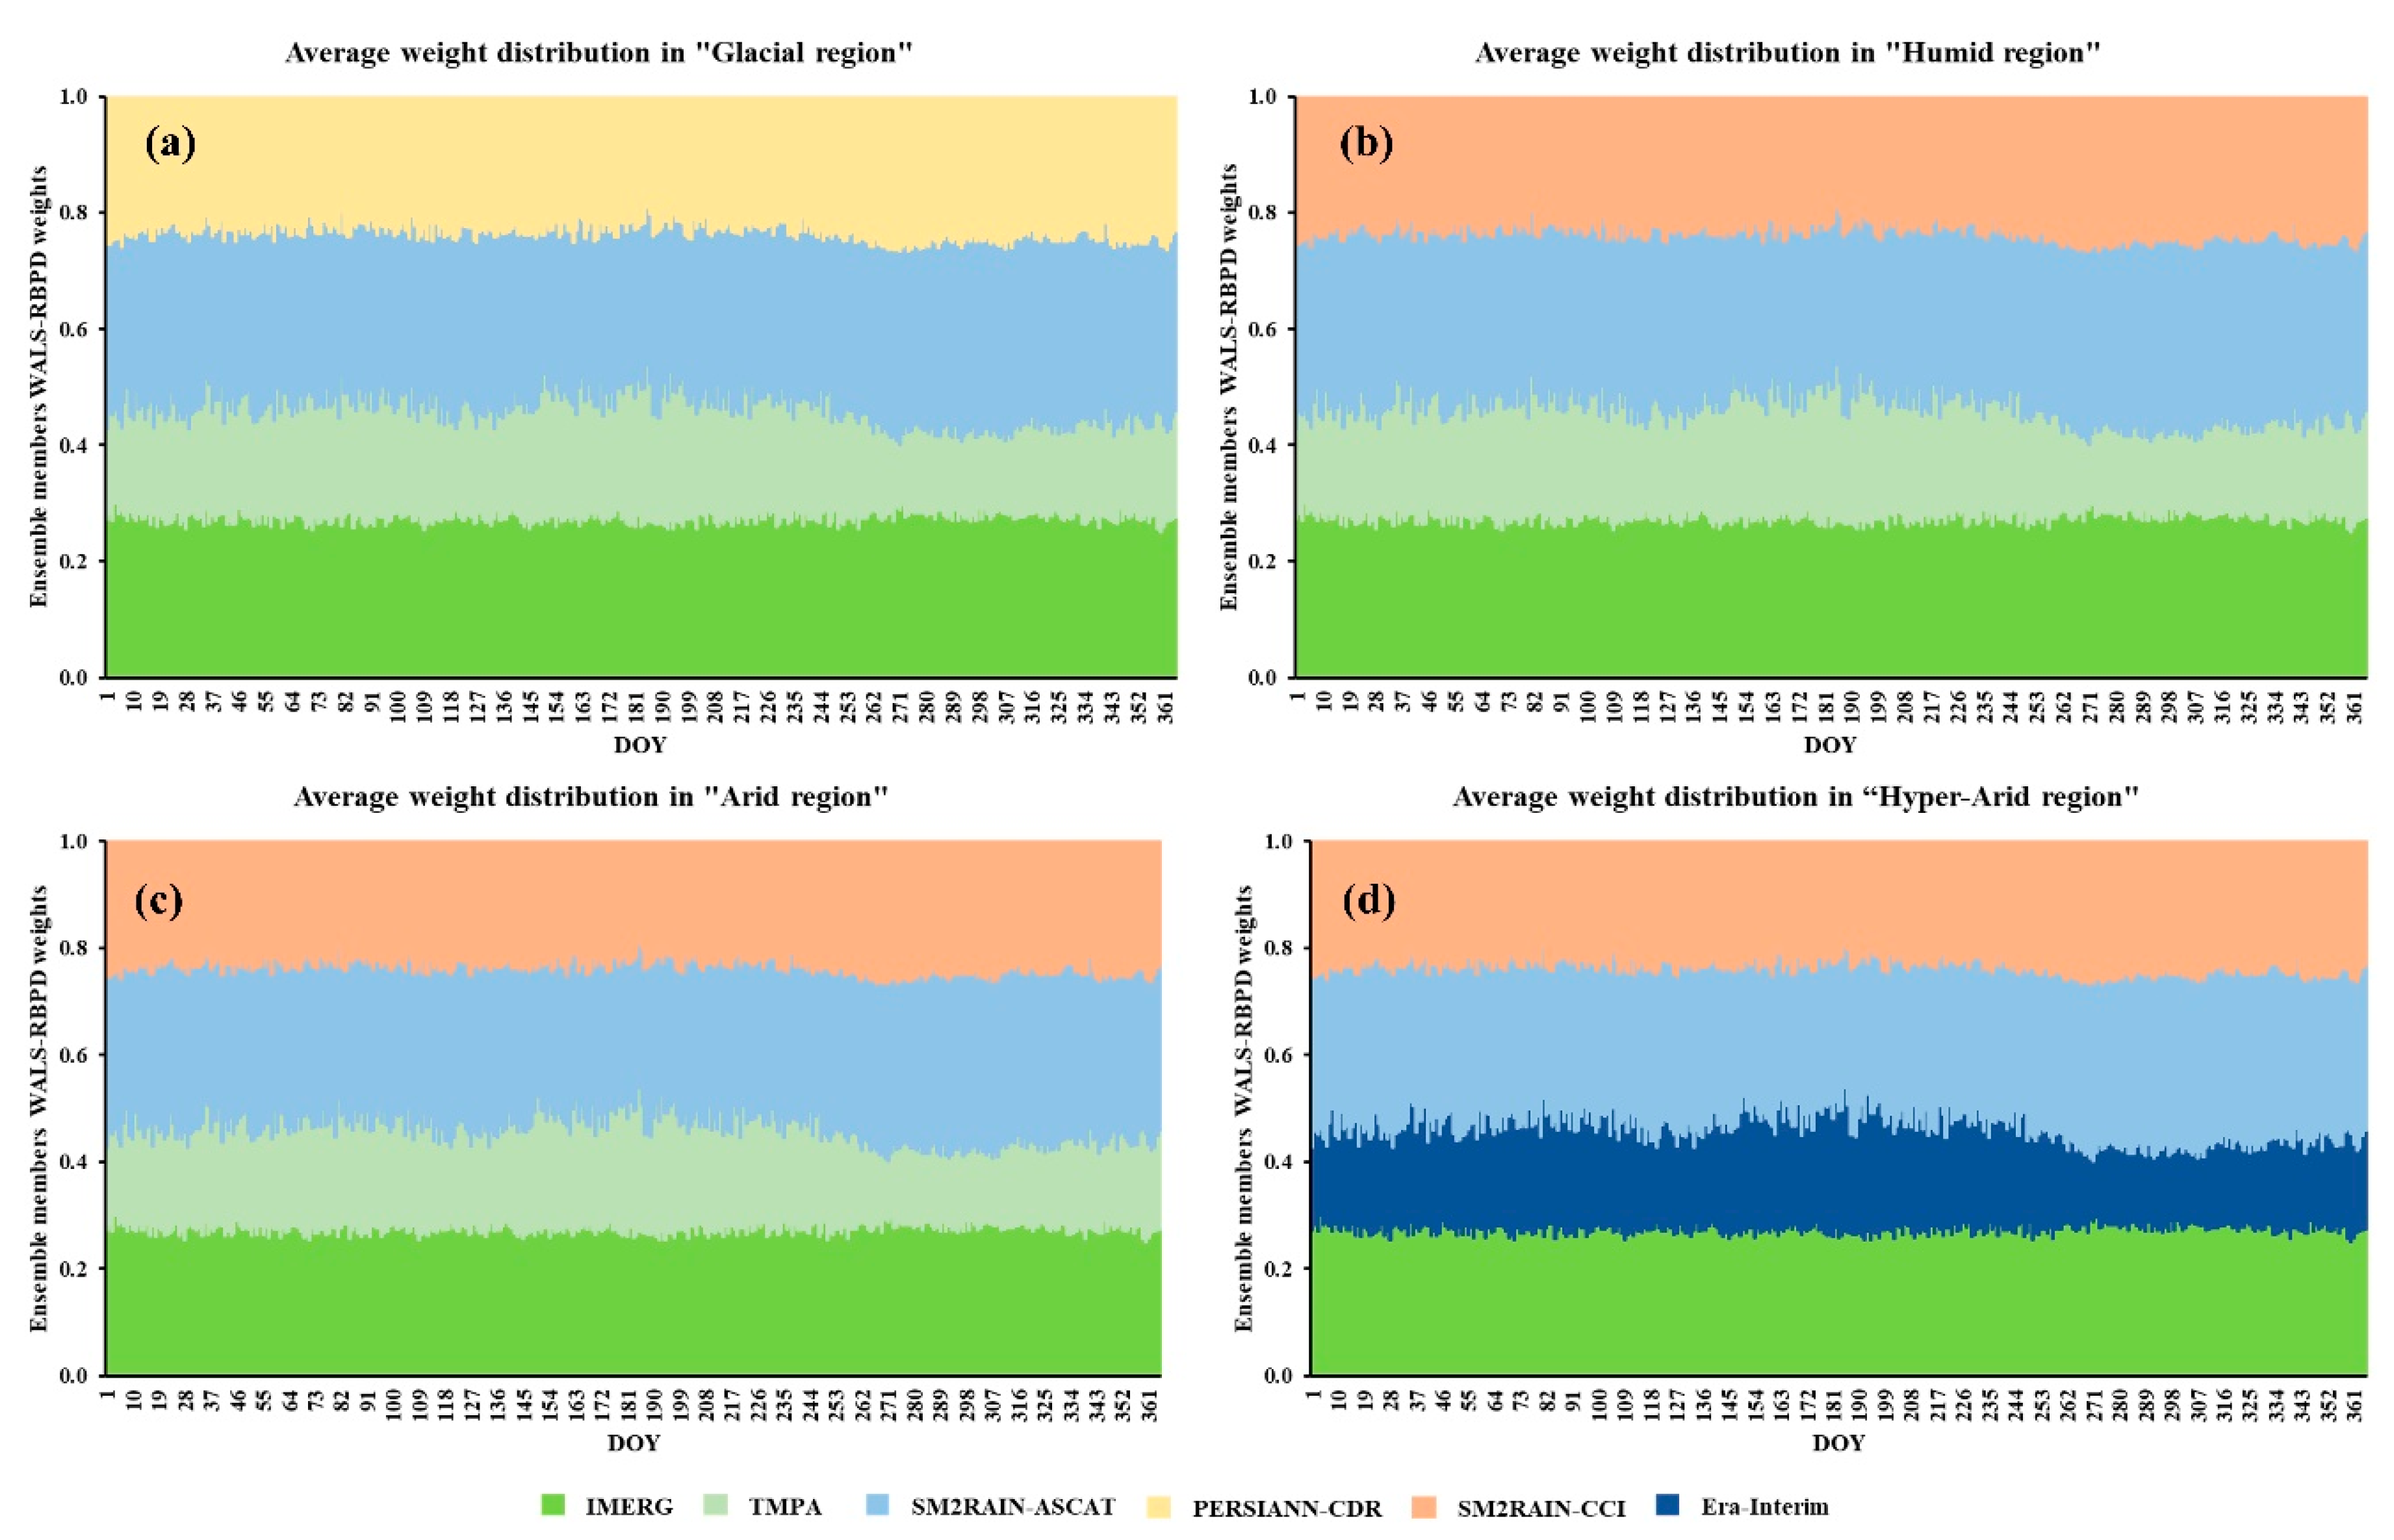
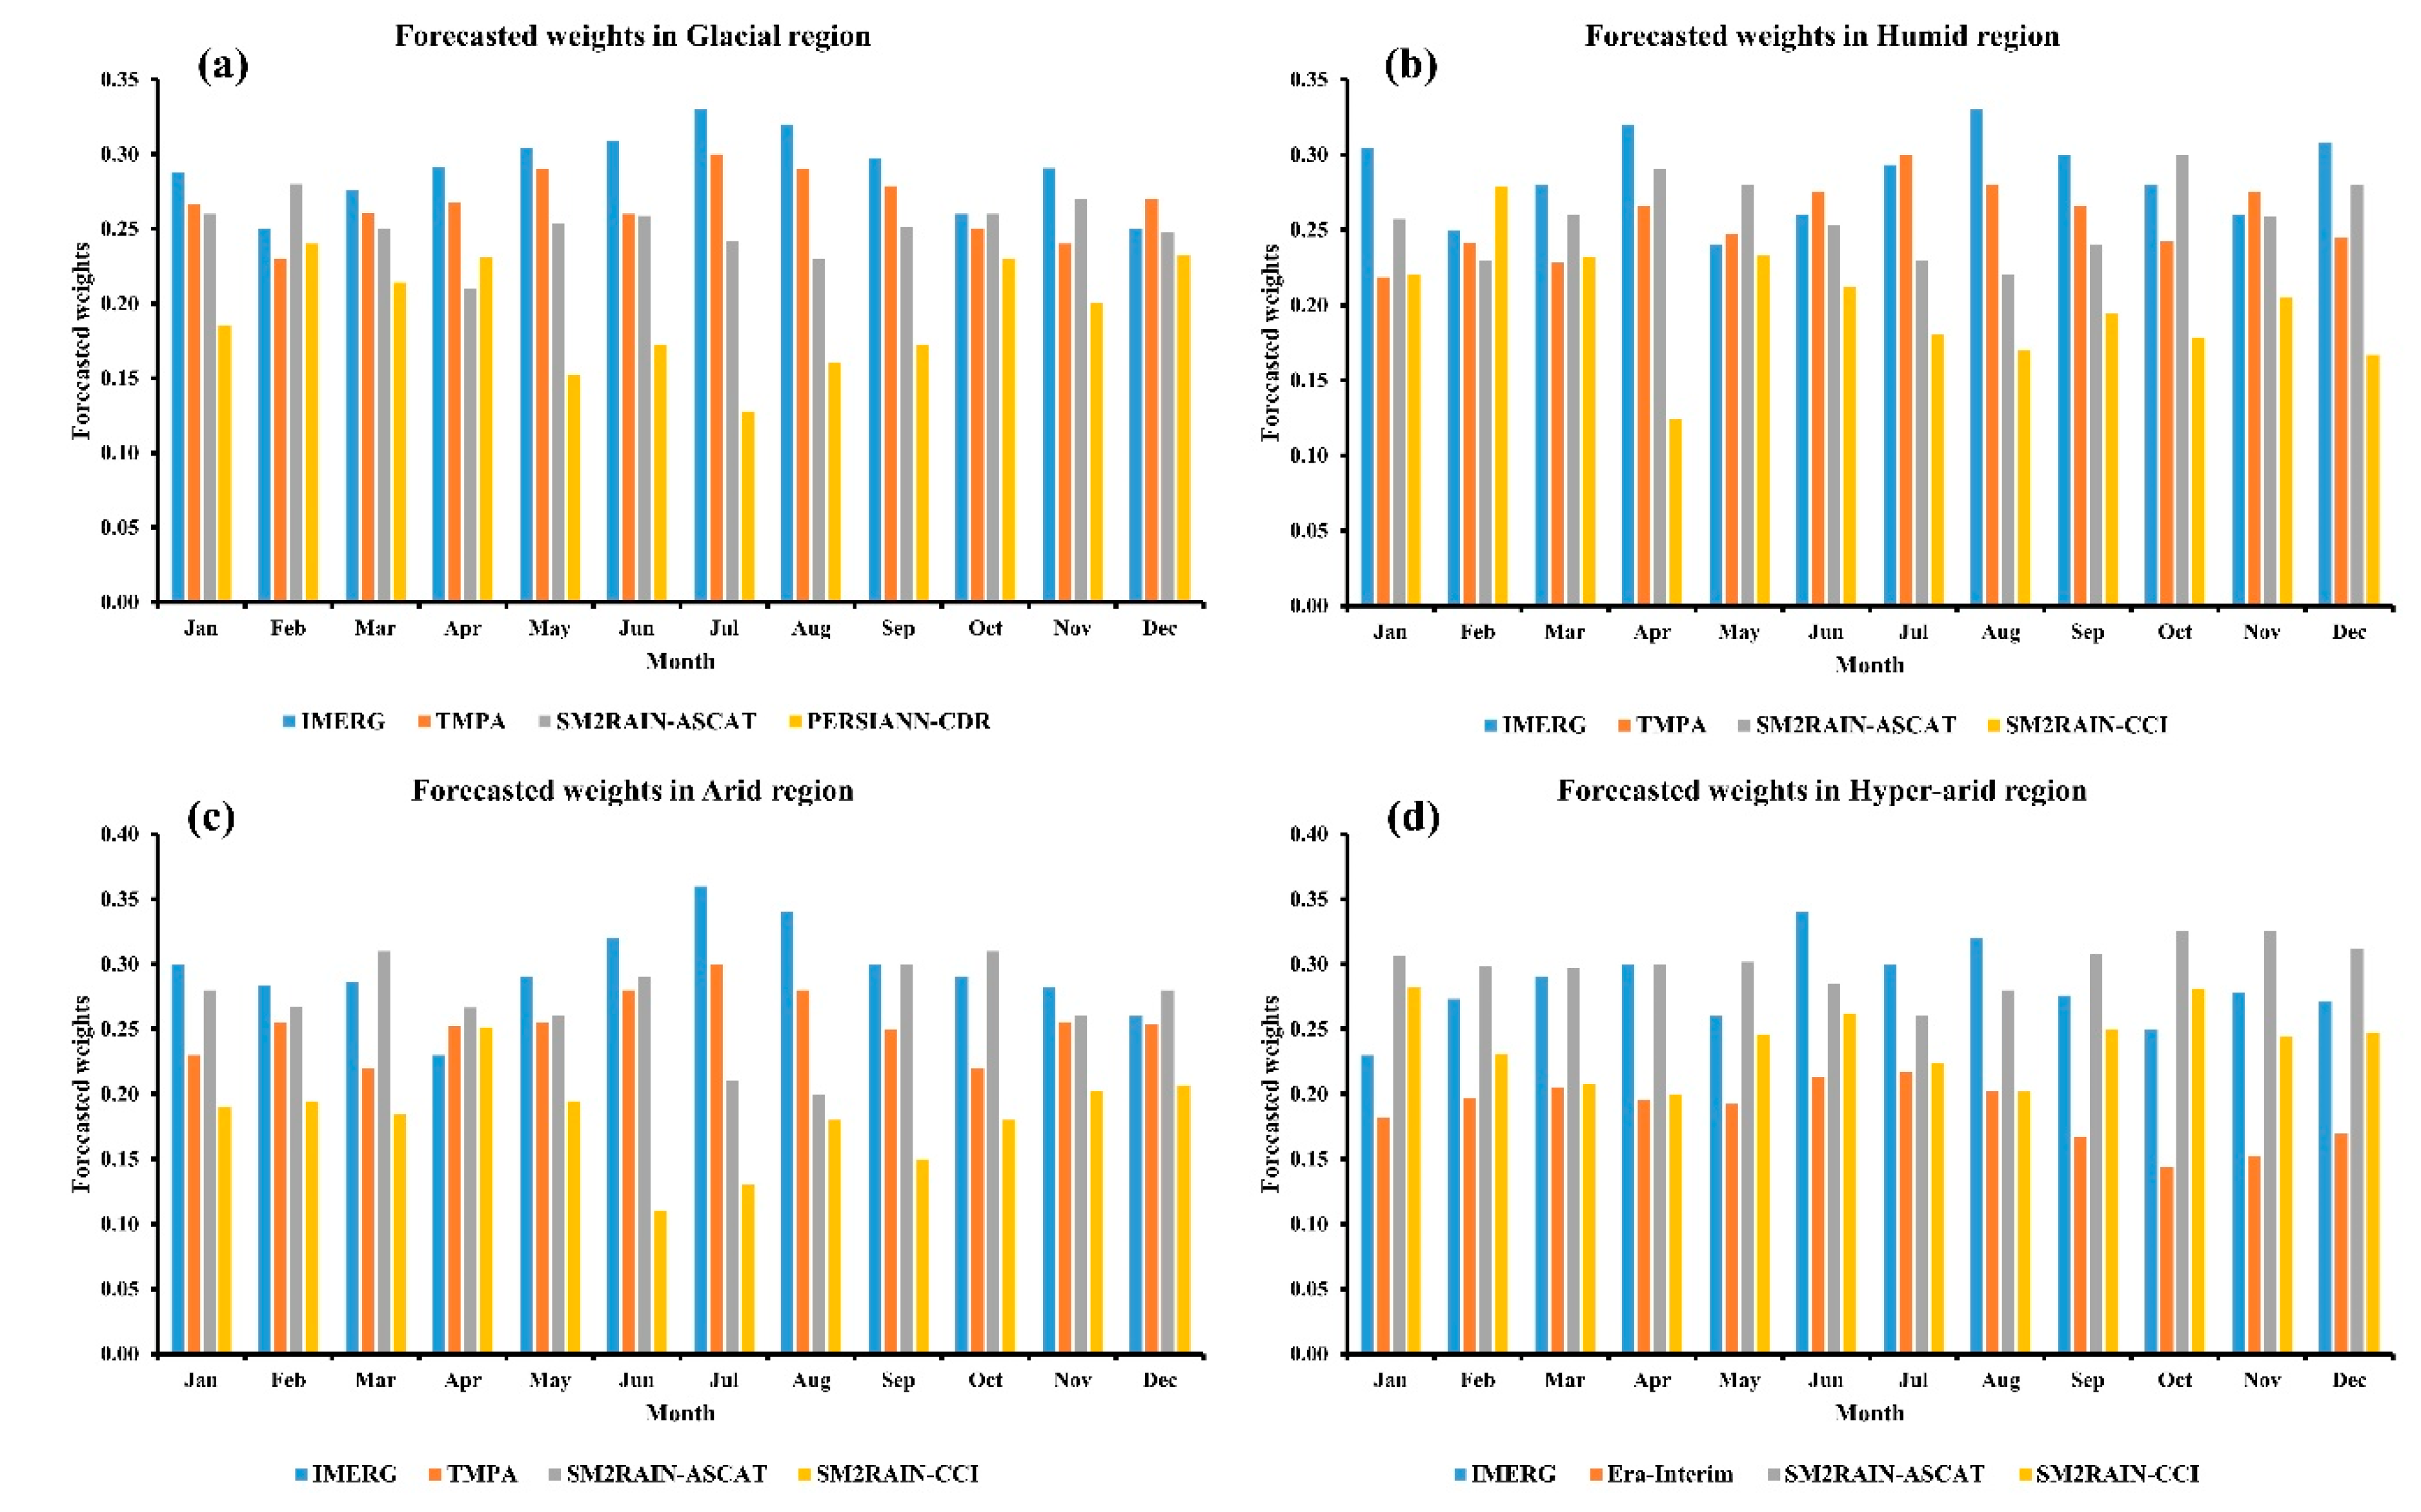
3.3. Temporal Distribution of WALS-RBPD Weights

Climate diversity (seasonality) and topographic complexities are two important drivers that significantly impact the precipitation estimation accuracy of SPDs, and passively affect the blended products [1,5,42,62,63]. Therefore, the WALS-RBPD is dynamically varied to encounter both climate diversity and topographic complexities (by trying different combinations of SPDs) [1]. The dynamic algorithm is far superior to fixed blending algorithms, because the dynamic algorithm considers both the topographic complexities and climate extremities at both local and regional scales [3]. However, the random selection of SPDs for blending rather than comparing all SPDs generally introduces high errors in the final dynamic blended datasets. The random selection of SPDs is the major drawback of dynamic algorithms and must be handled carefully [4,64].
Figure 4, Figure 5, Figure 6 and Figure 7 represents the temporal distribution of seasonal (pre-monsoon, monsoon, post-monsoon, and winter) WALS-RBPD weights, during 2007–2018, across Pakistan. Pre-monsoon season occurs during April, May, and June (AMJ), monsoon during July, August, and September (JAS), post-monsoon during October and November (ON), and winter during December, January, February, and March (DJFM). Maximum precipitation (55 to 60% of total annual precipitation) in Pakistan occurs during the monsoon season [43], originating from the Bay of Bengal during JAS and entering Pakistan at the northeast and east. Moreover, another cycle of moderate precipitation starts during the winter season (DJFM), originating from the Mediterranean Sea. Winter precipitation accounts for 30% of the total annual precipitation, which enters Pakistan from the west and southwest [44].
Figure 4 depicts the seasonal, i.e., pre-monsoon, monsoon, post-monsoon, and winter, distribution of WALS-RBPD weights of IMERG SPD. The results show that the distribution of IMERG weights is dependent on precipitation magnitude/intensity. Higher weights for IMERG are observed during the monsoon season followed by the pre-monsoon season with the average values of 34.87% and 31.70%, respectively (Figure 4a,b). However, there is a significant decrease in the distribution of weights during the post-monsoon (24.60%) and winter (25.49%) seasons (Figure 4c,d). This may be due to the higher performance of other SPDs (most probably SM2RAIN-ASCAT and SM2RAIN-CCI) during these seasons. On a regional scale, the maximum weights (37.44%) of IMERG are observed across the hyper-arid region during the monsoon season, while minimum weights (16.82%) are observed in the humid region during the post-monsoon season.
The seasonal distribution of TMPA in combination with ERA-Interim (hyper-arid region marked with red boundary) are presented in Figure 5. Similar to IMERG, TMPA dominated the pre-monsoon and monsoon seasons, while relatively poor weights were depicted during post-monsoon and winter seasons. The average weights of TMPA during the pre-monsoon and monsoon seasons are 26.24% and 27.92%, respectively. The maximum (28.36%) weight for TMPA is observed during the monsoon season across the glacial region, while the minimum (17.40%) weight is observed during the winter season across the humid region. The average weights of ERA-Interim in the hyper-arid region during the pre-monsoon and monsoon seasons are 18.32% and 19.09%, respectively. However, relative lower weights are observed during the post-monsoon and winter season with average values of 14.85% and 13.64%, respectively.
Figure 6 represents the seasonal distribution of SM2RAIN-ASCAT weights across Pakistan. SM2RAIN-based products are based on the “bottom-up” approach, which works under the principles of soil water balance (Brocca et al., 2014), and the mechanism is totally different from conventional “top-down” based SPDs. Therefore, in contrast to IMERG and TMPA, lower weights of SM2RAIN-ASCAT are observed during heavy and intense precipitation seasons. The average weights of SM2RAIN-ASCAT during the post-monsoon and winter seasons are 37.03% and 38.69%, respectively. The maximum (44.47%) weight is observed during the post-monsoon season across the hyper-arid region, while the minimum (23.36%) weight is observed during the pre-monsoon season across the humid region.
The seasonal distribution of PERSIANN-CDR (marked with red boundary) and SM2RAIN-CCI weights are presented in Figure 7. PERSIANN-CDR has high performance in the glacial region, after IMERG and SM2RAIN-ASCAT (current study) and TMPA [1,3,4]; therefore, it is considered in combination with other SPDs across the glacial region. The highest average weights of PERSIANN-CDR are observed during the post-monsoon (21.73%) and winter (18.83%) seasons (Figure 7c,d). A similar trend in the distribution of weights is observed for SM2RAIN-CCI, i.e., higher average weights during the post-monsoon (23.77%) and winter (26.18%) seasons. The maximum (30.73%) and minimum (23.34%) weights of SM2RAIN-CCI, on a regional scale, are observed across the hyper-arid and humid regions, respectively.
Figure 8 shows the distribution of average WALS-RBPD weights plotted against the day of the year (DOY) at the representative RGs (RRGs) across each climate region. The RRGs have weight values in close proximity with the average temporal distribution of WALS-RBPD weights. The considered RRGs are GR-RG10, HR-RG17, AR-RG13, and HAR-RG17 [1]. The cumulative weights of blended members are presented on the y-axis of Figure 8, i.e., sum of the weights at each RRG on each day is equal to 1. The thickness of each band represents the temporal distribution pattern of each blending member. The figure shows that the conventional “top-down” SPDs, particularly IMERG and TMPA, capture the high intense precipitation (monsoon and pre-monsoon seasons during DOY 90–180 and 181–273, respectively) more precisely than SM2RAIN-ASCAT and SM2RAIN-CCI across all climate regions. TMPA and SM2RAIN-ASCAT show relatively high variation of weights across all seasons in the humid and arid climate regions. SM2RAIN-ASCAT/CCI has higher weights during moderate to low precipitation events (DOY 1–90 and 335–365, and 273–334).
Figure 9 represents the forecasted weights of blended SPD members estimated using the ARIMA model. The forecasted weights (estimated from 2016 to 2018) are plotted against each month to understand the variation of weights in each season. The results have the same trend as compared with Figure 8, i.e., weights of the blending members are proportional to precipitation intensity/magnitude. Higher weights of IMERG/TMPA are forecasted during the pre-monsoon and monsoon seasons. Similarly, SM2RAIN-ASCAT and SM2RAIN-CCI have higher forecasted weights during the post-monsoon and winter seasons. Moreover, the SM2RAIN-based products have higher weights across the arid and hyper-arid regions, with the exception of SM2RAIN-ASCAT. Overall, the figure demonstrates the significant variation of weights across climate regions during different seasons and provides good agreement with the WALS-based estimated weights.

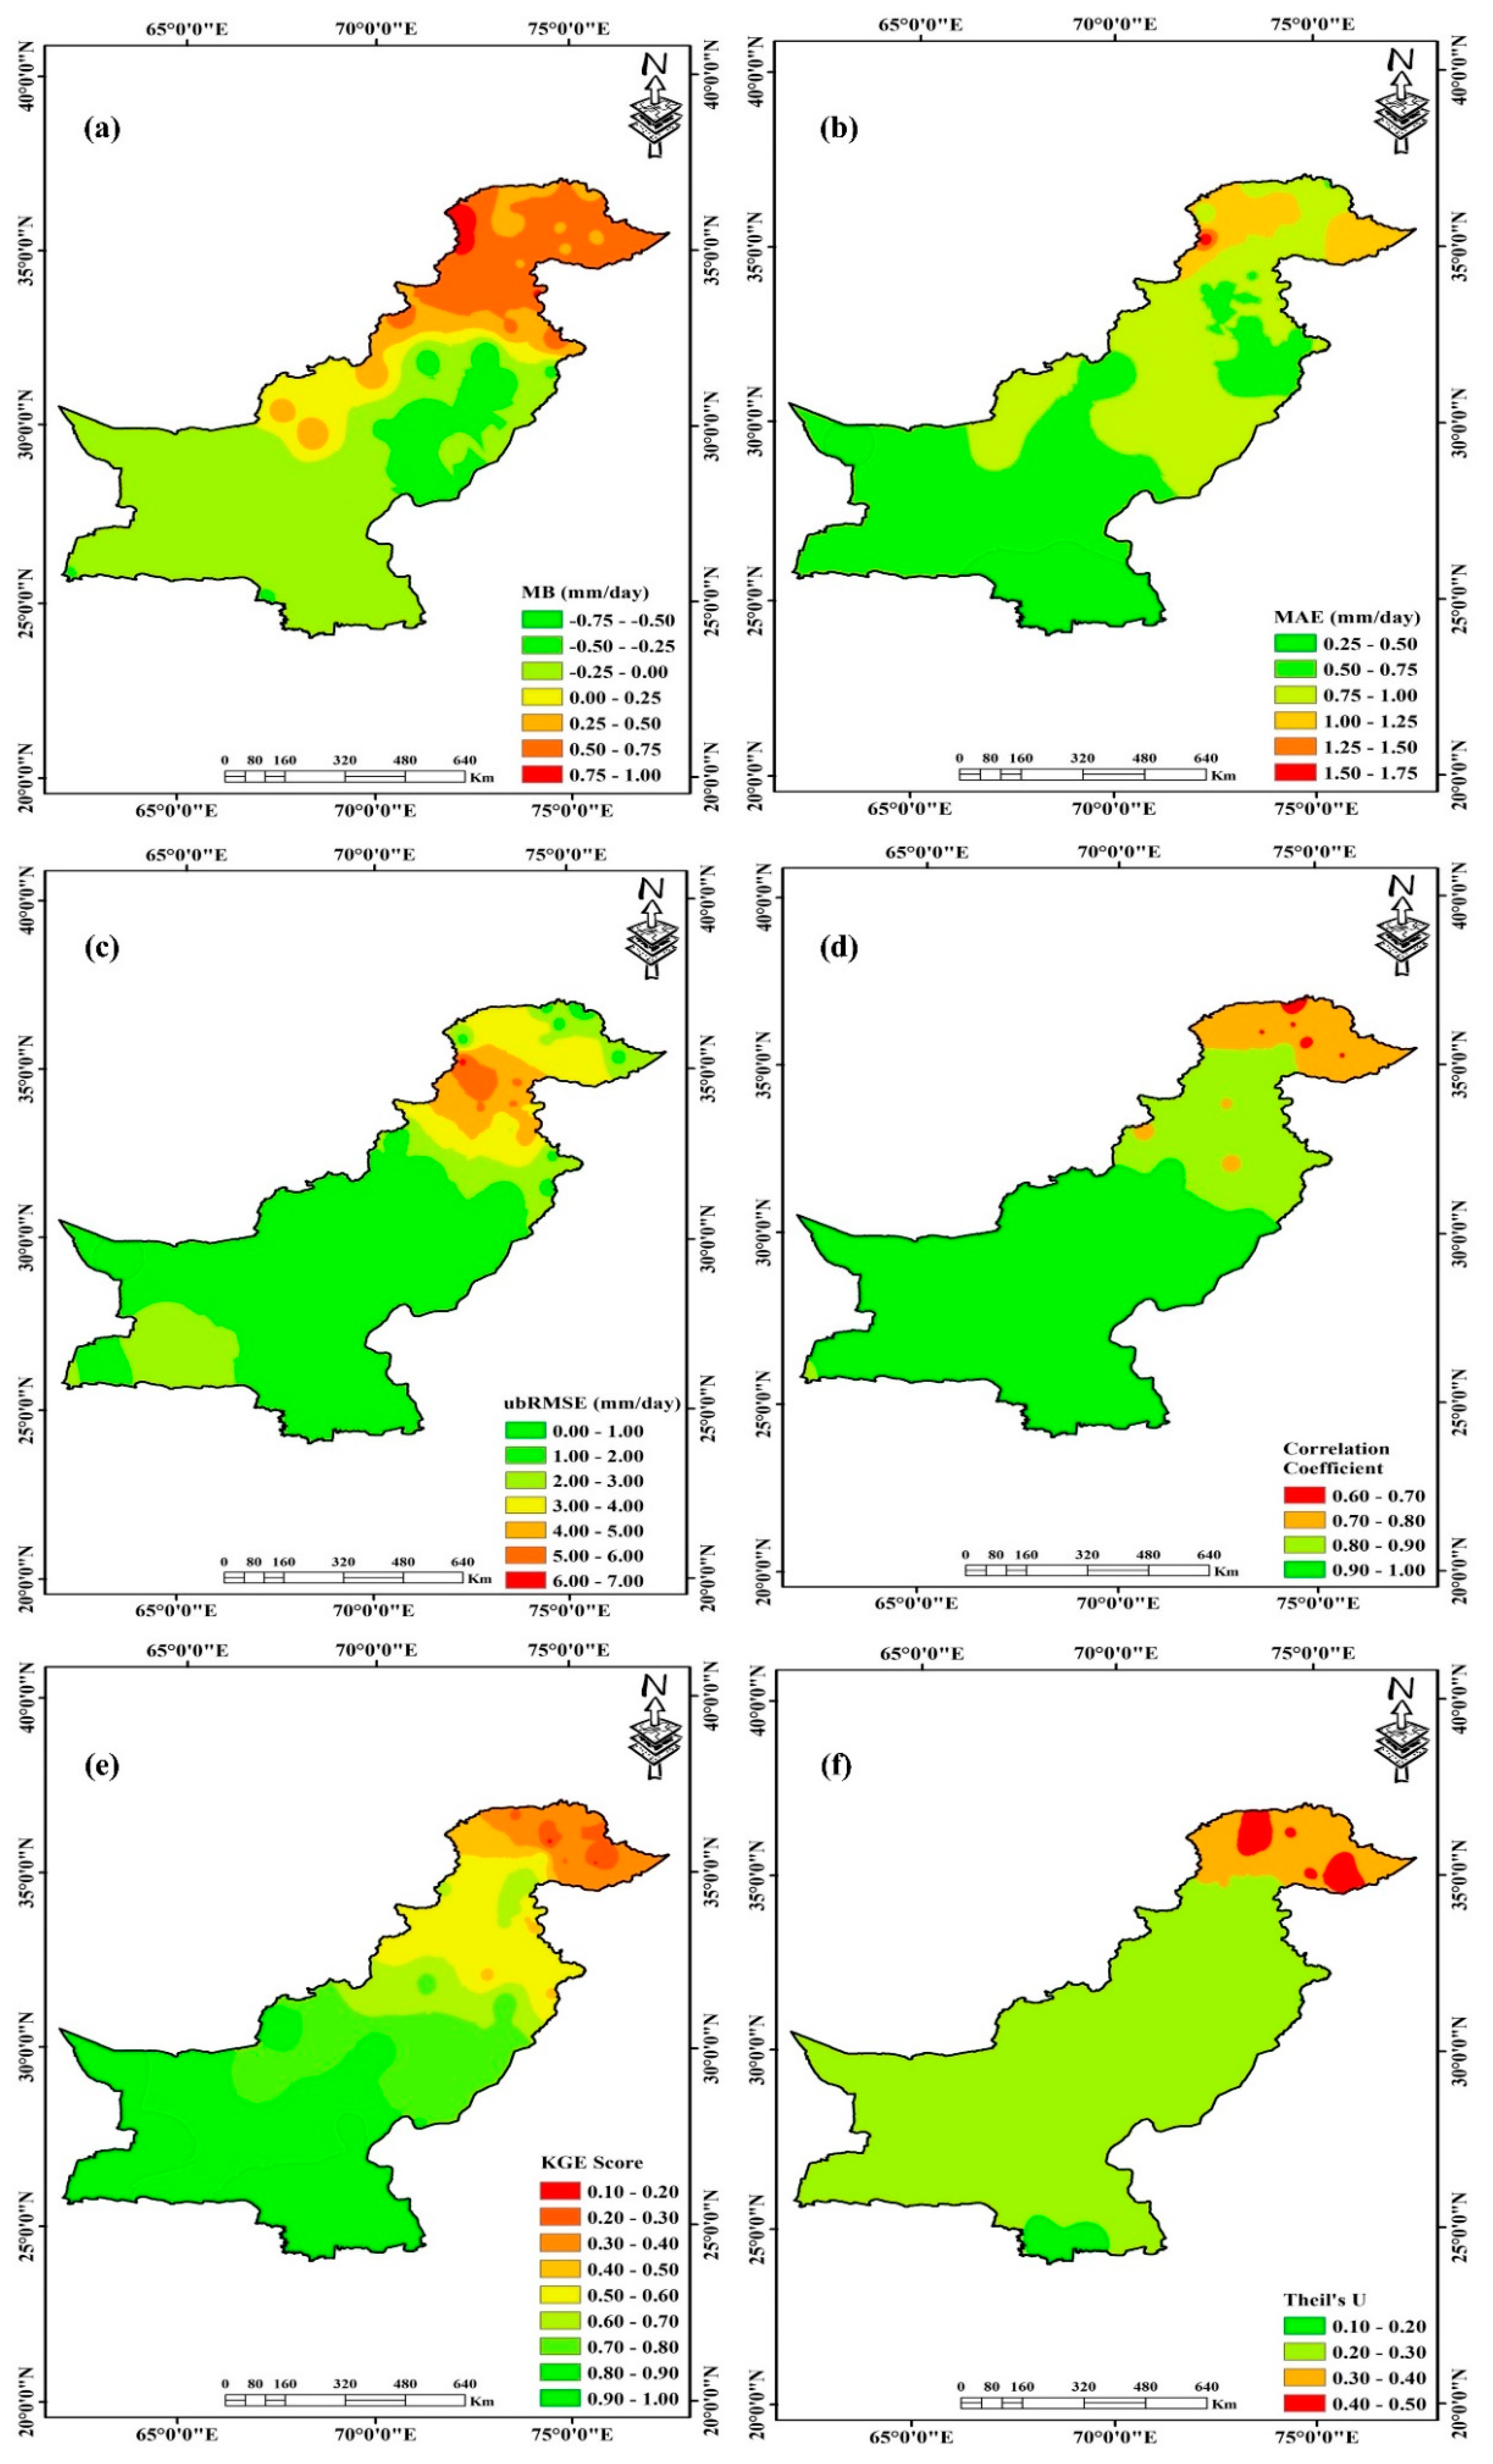
3.4. Performance Assessment of WALS-RBPD on the Spatial Scale

Results from the current study demonstrate that the development of RBPD is more effective than the previously developed blended datasets across Pakistan. On the one hand, the conventional SPDs (top-down), i.e., IMERG, TMPA, PERSIANN-CDR, ERA-Interim, etc., mostly overestimated the precipitation with a relatively high magnitude of errors across the glacial and humid regions [1,3]. The possible sources of the errors include the elevation dependency of SPDs, complex topography, diverse climate, retrieval algorithms, and impact of sensors used to estimate precipitation [65,66]. Moreover, the topographic complexities scatter the passive microwave (PMW) signals, specifically over the glacial regions and cold land surfaces [12,67]. On the other hand, the newly developed SM2RAIN-based SPDs (bottom-up) estimate the precipitation using different principles as compared with the “top-down” SPDs; therefore, the combination of both provide accurate enough estimates of precipitation across Pakistan. Previous studies evaluated SM2RAIN-based products across Pakistan and reported underestimation of precipitation by SM2RAIN-based SPDs across the glacial and humid regions that totally contrasted the behavior of the “top-down” SPDs [40]. The inclusion of SM2RAIN-based products in the current study has addressed the factors contributing to the poor performance of previously developed blended products across the glacial and humid regions of Pakistan.
The performance of WALS-RBPD is assessed against RGs by employing a pixel-to-pixel approach. The spatial distribution of calculated error (statistical) indices across all four climate regions is presented in Figure 10. The color composite of Figure 10 is explained as follows: for MB, dense red and green colors indicate poor performance of WALS-RBPD, and the yellowish-green color depicts higher performance, while the green color shows high and the red color represents poor performance for the rest of the indices. The pixel-based error observations are interpolated across Pakistan using the ordinary Kriging (OK) method, which is the most commonly used method for interpolation and belongs to the family of estimators employed to interpolate spatial data [68,69].

3.4.1. Glacial Region

Figure 10a depicts the slightly overestimated precipitation across the glacial region. Maximum overestimated (red color) precipitation with MB +0.86 mm/day and +0.83 mm/day is observed at GR-RG10 and GR-RG11 located in the extreme west of the glacial region. The minimum overestimated magnitudes across the glacial region are +0.31 mm/day and +0.32 mm/day at GR-RG17 and GR-RG9, respectively. The regional average MB value is +0.54 mm/day. Similarly, relatively higher MAE is observed at the extreme west of the glacial region with a maximum value of 1.54 mm/day at GR-RG11 (Figure 10b). Minimum and average MAE values across glacial region are 0.61 mm/day (at GR-RG14) and 0.87 mm/day.
Figure 10c shows the spatial distribution of ubRMSE across Pakistan. WALS-RBPD depicts the minimum ubRMSE in the east/northeast with an increasing trend of south/southwest of the glacial region. The maximum, minimum, and average ubRMSE values are 5.03 mm/day, 1.04 mm/day, and 3.00 mm/day, respectively. Almost a uniform correlation of WALS-RBPD against the RGs is observed across the glacial region with the exception of a few scattered RGs (Figure 10d). In comparison with other climate regions, R values are relatively lower in the glacial region (Figure 10d). R ranges from a maximum of 0.81 (GR-RG9) to a minimum of 0.62 (GR-RG12) with an average value of 0.73.
The distribution of KGE scores across Pakistan is spatially represented in Figure 10e. The figure shows comparatively poor performance of WALS-RBPD across the glacial region as indicated with lower KGE score values. The maximum, minimum, and average KGE scores across the glacial region are 0.47 (GR-RG9), 0.18 (GR-RG8), and 0.32. The precipitation forecasted accuracy of WALS-MSPD assessed using Theil’s U is shown in Figure 10f. Theil’s U reflects poor performance across the glacial region with maximum and minimum values of 0.43 (GR-RG5) and 0.29 (GR-RG10), with an average value of 0.38.
Several factors are contributing to the poor performance of SPDs across the glacial region. Since infrared (IR) and PMW sensors are employed in precipitation estimates, IR provides the information related to precipitation using the minimum temperature at the top of the cloud, while PMW sensors store information about the precipitation area rather than clouds itself [66]. However, warm clouds over the glacial region impede the precipitation detection capability of satellite sensors because warm clouds do not allow the IR thresholds to differentiate between precipitation and no-precipitation clouds [70,71]. These orographic clouds could cause a heavy downpour without much ice aloft, which is not considered by the PMW algorithm and may result in underestimation [66]. Other factors contributing to the poor performance of SPDs include high vegetation cover in mountainous areas and coarser spatial resolution of PMW as compared with IR. Moreover, the brightness temperature and polarization properties of IR are dependent on snow cover and its exposure, which in turn depends on the altitude of mountainous region [67].

3.4.2. Humid Region

Errors across the humid region have the general trend from extreme north (maximum) of the region towards the south (minimum). The spatial distribution of MB shows both overestimation (north and northwest) and underestimation (southeast) of precipitation across the humid region (Figure 10a). The maximum and minimum overestimation (underestimation) in the humid region is +0.87 mm/day at HR-RG22 (−0.59 mm/day at HR-RG39) and +0.31 mm/day at HR-RG34 (−0.32 mm/day at HR-RG37). An average MB value across the humid region is 0.53 mm/day. The east/southeast areas of the humid region have relatively lower MAE values as compared with the rest of the humid region (Figure 10b). The maximum and minimum MAE values of 1.66 mm/day and 0.51 mm/day are observed at HR-RG4 and HR-RG16, respectively. The regional average MAE value is 0.89 mm/day.
The ubRMSE has almost a similar spatial distribution pattern as compared with MB, i.e., high ubRMSE in the extreme north, which gradually reduces towards the south of the humid region (Figure 10c). The ubRMSE ranges from a maximum of 6.38 mm/day at HR-RG13 to a minimum of 1.55 mm/day at HR-RG28, with a regional average value of 4.06 mm/day. Figure 10d represents the spatial distribution of R and depicts almost a uniform distribution across humid region. There is a significant improvement of R in the humid region, as compared with the glacial region. The maximum, minimum, and average R values across the humid region are 0.93 (HR-RG38), 0.77 (HR-RG39), and 0.86, respectively.
The KGE score also exhibits an almost uniform pattern as R in the humid region (Figure 10e). The KGE score depicts better performance in the east of the humid region with few exceptions towards the southwest. The maximum, minimum, and average KGE scores are 0.66 (HR-RG16), 0.43 (HR-RG24), and 0.57, respectively. The forecasting precision of WALS-RBPD estimated using Theil’s U also represents a uniform pattern across the humid region. The best and poor forecasting with Theil’s U values of 0.19 and 0.39 are observed at HR-RG16 and HR-RG1. The regional average Theil’s U value is 0.26.
The factors involved in relative higher error across the humid region might include: the problems in signal attenuation due to intense precipitation, which is most frequent in humid regions [72]; errors due to precipitation retrieval algorithms [73,74]; problems associated with calibration of the precipitation retrieval algorithms based on local RGs [66]; and other external errors linked with RG observations such as wind effect splashing from RGs due to intense precipitation, the impact of snow on precipitation measurements, human-induced errors, and sparse distributed RGs network [75]. Precipitation nowadays is indirectly estimated from the IR brightness temperature on the top of the cloud using the retrieval algorithms that do not consider the impact of altitude and sub-cloud evaporation [66,67]. This phenomena, therefore, significantly affect the accuracy of precipitation estimates from SPDs [76]. Furthermore, the calibration procedure of these algorithms impacts the selection of an appropriate threshold for cloud temperature and also the determination of various other relevant variables [66].

3.4.3. Arid Region

Results in the arid region depict the significantly improved performance of WALS-RBPD as compared with previously developed blended datasets. Mild overestimations across mountainous areas and underestimations over plain areas of arid region have been observed (Figure 10a). The values for maximum and minimum overestimation (underestimation) are 0.47 mm/day at AR-RG14 (−0.42 mm/day at AR-RG3) and 0.21 mm/day at AR-RG12 (−0.23 mm/day at AR-RG15). The average regional MB value is −0.15 mm/day. The MAE is relatively low over the mountainous terrain in the west of the arid region, while it is moderate in the plain areas (Figure 10b). The maximum and minimum MAE values of WALS-RBPD across the arid region are 0.97 mm/day observed at AR-RG8 and 0.60 mm/day at AR-RG7, with a regional average value of 0.73 mm/day.
The ubRMSE has a uniform spatial distribution across the arid region (Figure 10c). A maximum ubRMSE of 2.55 mm/day is observed at AR-RG3, while a minimum of 0.94 mm/day is depicted at AR-RG12. The average regional ubRMSE is 1.54 mm/day. The R shows an increasing trend from the north toward the south of the arid region (Figure 10d). The R ranges from a maximum of 0.94 at AR-RG15 and AR-RG9 to a minimum of 0.91 at AR-RG3, AR-RG4, AR-RG12, and AR-RG14. The regional average R value is 0.92.
There is an increasing trend of the WALS-RBPD KGE score from the extreme north towards the south of the arid region (Figure 10e). The lower and higher bounds of the KGE score are 0.65, and 0.86 observed at AR-RG7 and AR-RG10, respectively. The regional average KGE score is 0.75. The Theil’s U presented a uniform range of values across the arid region (Figure 10e). On the one hand, high forecasting accuracy represented by lower Theil’s U values (0.21 at AR-RG16) is observed in the plain area of the arid region. On the other hand, the maximum Theil’s U value (poor forecasting) of 0.30 is observed at AR-RG14. The regional average Theil’s U value is 0.25.

3.4.4. Hyper-Arid Region

The performance of WALS-RBPD is in close proximity across the arid and hyper-arid regions. Figure 10a shows that WALS-RBPD mostly underestimated the precipitation across the hyper-arid region. The magnitudes of the maximum and minimum MB values are −0.28 mm/day (HAR-RG24) and −0.11 mm/day (HAR-RG18). The regional average MB value is −0.18 mm/day. The MAE is a minimum in the southeast, and increases towards the northwest of the hyper-arid region (Figure 10b). The maximum MAE of 0.73 mm/day is observed at HAR-RG9 and HAR-RG10, while the minimum MAE of 0.28 mm/day is depicted at HAR-RG18 and HAR-RG20. The regional average MAE is 0.53 mm/day.
There is an almost uniform trend in spatial distribution of ubRMSE across the hyper-arid region except for a few stations (with high and low ubRMSE values) in the extreme west. The maximum and minimum ubRMSE values of the hyper-arid region are 2.91 mm/day and 0.63 mm/day, respectively, observed at HAR-RG24 and HAR-RG8. The average ubRMSE value is 1.71 mm/day. The R is uniformly spatially distributed across the hyper-arid region with maximum and minimum values of 0.96 (HAR-RG11 and HAR-RG19) and 0.88 (HAR-RG2 and HAR-RG10). The regional average R value is 0.91.
The KGE score is high in the southeast, relatively low in the middle, and again high in the extreme west of the hyper-arid region. The KGE score confirms high performance of WALS-RBPD across the hyper-arid region (Figure 10e). The maximum KGE score of the region is 0.98 observed at HAR-RG11 and HAR-RG18, while the minimum is 0.86 depicted at HAR-RG6 and HAR-RG7. The average KGE score of the hyper-arid region is 0.92. Theil’s U presented almost a uniform distribution across the hyper-arid region except for a few stations at the extreme southeast (Figure 10f). The maximum, minimum, and average Theil’s U values of the region are 0.26 (HAR-RG24 and HAR-RG25), 0.17 (HAR-RG20 and HAR-RG21) and 0.22, respectively.
Comparatively, the highest performances of WALS-RBPD and other previously developed blended datasets in the arid and hyper-arid regions are linked with enhanced performance of individual SPDs in these regions. A number of studies have confirmed precise precipitation estimates over those regions as compared with high elevated glacial and humid regions of Pakistan [1,3,4,24,42,62]. Therefore, the blended datasets have improved performances and relatively lower errors across the arid and hyper-arid regions.
The current study showed improved results as compared with a blended dataset developed using the WALS algorithm, due to the addition of SM2RAIN-based products. On the one hand, the conventional “top-down” SPDs overestimated the precipitation across most of the glacial and humid regions [1,3,4,42,62], while, on the other hand, the SM2RAIN-ASCAT and SM2RAIN-CCI underestimated the precipitation across glacial, humid, and mountainous areas of the arid region [40]. Therefore, the development of RBPD by keeping in mind the strength and weaknesses of blending SPDs helped in getting more accurate results in the current study.

3.5. Performance Assessment of WALS-RBPD on the Temporal Scale

Precise estimation of intense and heavy precipitation is extremely important for hydrological investigations, for example, flood mitigation, early flood warning system, and drought analyses, etc. Therefore, the performance of WALS-RBPD was assessed on a temporal scale during the pre-monsoon, monsoon, post-monsoon, and winter seasons. Since Pakistan receives maximum precipitation during the monsoon season; therefore, it is of utmost importance to evaluate WALS-RBPD during the monsoon season. The performance of WALS-RBPD across all the climate regions using six statistical indices (listed in Table 2) is shown in Table 6.
In addition to the significant improvements by WALS-RBPD, the results listed in Table 6 confirm the precipitation intensity/magnitude and elevation dependency of WALS-RBPD. On the one hand, the results depict poorer performances during the monsoon and pre-monsoon seasons, which are characterized by intense and heavy precipitation. On the other hand, moderate (during post-monsoon) and best (during winter) performances are observed during moderate precipitation events. The MB results demonstrate that WALS-RBPD underestimated the precipitation across humid and arid regions during the pre-monsoon and monsoon seasons. This underestimation of precipitation might be due to the involvement of SM2RAIN-based products in those regions, which underestimate intense precipitation [40]. Moreover, WALS-RBPD underestimated the precipitation across the hyper-arid region during all climate seasons. Overall, all the statistical indices show the best performance of WALS-RBPD in low elevated climate regions during moderate to low precipitation seasons. However, the performance of WALS-RBPD is accurate enough to be considered for a number of hydrological applications and might be updated with regional requirements.

3.6. Comparison of WALS-RBPD with Previously Developed Blended Datasets across Pakistan

The improvements of WALS-RBPD against the previously developed blended datasets across Pakistan, i.e., WALS-BPD, DCBA-BPD, and DBMA-BPD were assessed using the skill scores (SSs). WALS-RBPD was considered as a reference to calculate the improvements using SSs during a common period (2007–2015). The improvements of WALS-RBPD against WALS-BPD are shown in Table 7. The results demonstrate the dominancy of WALS-RBPD in all climate regions. On the one hand, maximum improvements are observed in the glacial (humid) regions, for example, 29.89% (28.69%) in MAE, 27.25% (23.89%) in ubRMSE, and 24.37% (28.95%) in MB. On the other hand, the hyper-arid region experienced minimal improvements, i.e., 18.55% in MB, 17.82% in MAE, and 14.79% in ubRMSE. This might be due to the high performance of individual SPDs in the hyper-arid region, resulting in a precisely blended dataset.
Table 8 represents the performance comparison of WALS-RBPD against DCBA-BPD. The results show relatively high improvements as compared with WALS-BPD. Higher improvements are observed in the glacial region followed by the humid and arid regions. The maximum improvements across the glacial (humid) regions are 29.05% (30.28%) in MB, 36.96% (32.22%) in MAE, and 30.12% (26.25%) in ubRMSE. The Theil’s U also depicted relatively higher improvements with 22.99% and 20.58% in the glacial and humid regions. Moreover, improvements (minimal) across the hyper-arid region are 22.06%, 26.95%, 20.05% and 14.13% with MB, MAE, ubRMSE, and Theil’s U, respectively.
WALS-RBPD depicted maximum improvements against DBMA-BPD among all other blended datasets across the study area. Table 9 shows a similar trend as compared with Table 7 and Table 8, i.e., maximum improvements in the glacial and humid regions followed by the arid and hyper-arid regions. The average skill score across the glacial (humid) regions are 39.74% (36.93%), 38.27% (33.06%), and 39.16% (30.47%) with MB, MAE and ubRMSE. Higher improvements in the KGE score are also observed with 39.96% in the glacial and 33.52% in the humid region. Moreover, the average skill score of the hyper-arid region is 28.77% (MB), 24.98% (MAE), 23.87% (ubRMSE) and 15.3% (KGE score).
Overall, the comparison shows that the performance of WALS-RBPD has been significantly improved as compared with previously developed blended datasets. It is recommended from the comparison that besides the development of sophisticated blending algorithms, the selection of an appropriate set of SPDs plays an important role. In order to obtain accurate precipitation estimates, the SPDs that have a better performance for particular regions should be selected.

4. Conclusions

A dynamic regional blended precipitation dataset (RBPD) is developed across Pakistan, by selecting an appropriate set of SPDs in each climate region and employing the weighted average least squares (WALS) algorithm. Six satellite precipitation datasets (SPDs), including IMERG V6, TMPA 3B42-v7, PERSIANN-CDR, ERA-Interim (reanalysis dataset), SM2RAIN-ASCAT, and SM2RAIN-CCI are regionally assessed and selected (depending on climate regions) to develop WALS-RBPD during 2007–2018 with 0.25° and one-day spatial and temporal resolutions. The performance of WALS-RBPD is assessed on spatial (glacial, humid, arid, and hyper-arid regions) and temporal (pre-monsoon, monsoon, post-monsoon, and winter seasons) scales over 102 rain gauges (RGs). Six statistical indices/measures, including mean bias (MB), mean absolute difference (MAE), unbiased root mean square error (ubRMSE), correlation coefficient (R), Kling–Gupta efficiency (KGE), and Theil’s U are employed to assess the performance of WALS-RBPD. Furthermore, skill scores (SSs) are used to compare the WALS-RBPD against previously developed BPDs, i.e., dynamic weighted average least square (WALS), dynamic clustered Bayesian model averaging (DCBA), and dynamic Bayesian model averaging (DBMA). The main findings from the current study are summarized as:
(1)
The performance of IMERG was superior to all other blending members in the glacial, humid, and arid regions, while SM2RAIN-ASCAT had higher accuracy in the hyper-arid region. The average weights of IMERG (SM2RAIN-ASCAT) were 29.03% (23.90%), 30.12% (24.19%), 31.30% (27.84%), and 27.65% (32.02%) across glacial, humid, arid, and hyper-arid regions, respectively.
(2)
On the one hand, IMERG dominated the monsoon and pre-monsoon seasons with average weights of 34.87% and 31.70%. On the other hand, SM2RAIN-ASCAT depicted high performance during post-monsoon and winter seasons with average weights of 37.03% and 38.69%.
(3)
The performance assessment of WALS-RBPD on the spatial scale depicted considerable improvements and reduction in errors as compared with other previously developed BPDs, i.e., WALS-, DCBA-, and DBMA-BPDs. The results presented the topographic dependency of WALS-RBPD, i.e., relatively poorer performances at high elevation characterized by complex terrain, while better performances at low elevated plain regions.
(4)
WALS-RBPD revealed a dependency on precipitation magnitude and intensity. Relatively poorer performances were observed during the monsoon and pre-monsoon periods, which significantly improved during the post-monsoon to winter seasons.
(5)
The employment of SM2RAIN-ASCAT and SM2RAIN-CCI (bottom-up) added a significant contribution for improving the BPD performance, especially in the glacial and humid regions. The conventional “top-down” SPDs overestimated the precipitation across the glacial and humid regions, while the bottom-up SPDs contrarily underestimated the precipitation. This contrast did not amplify the errors in the glacial and humid regions and resulted in relatively better performances as compared with previous BPDs.
(6)
The SS values calculated based on comparing WALS-RBPD against WALS-BPD revealed considerable improvements across all climate regions. Maximum improvements were observed in glacial (humid) regions, for example, 29.89% (28.69%) in MAE, 27.25% (23.89%) in ubRMSE and 24.37% (28.95%) in MB. On the other hand, the hyper-arid region experienced minimal improvements, i.e., 18.55% in MB, 17.82% in MAE, and 14.79% in ubRMSE.
(7)
The SS values of WALS-RBPD against DCBA-BPD depicted significant improvements. The higher improvements observed across the glacial (humid) regions are 29.05% (30.28%) in MB, 36.96% (32.22%) in MAE, and 30.12% (26.25%) in ubRMSE. Theil’s U also depicted relatively higher improvements with 22.99% and 20.58% in the glacial and humid regions. Moreover, improvements (minimal) across the hyper-arid region were 22.06%, 26.95%, 20.05%, and 14.13% in MB, MAE, ubRMSE, and Theil’s U, respectively.
(8)
The highest SS values were observed between WALS-RBPD and DBMA-BPD with average improvements across the glacial (humid) regions of 39.74% (36.93%), 38.27% (33.06%), and 39.16% (30.47%) in MB, MAE, and ubRMSE. Higher improvements in KGE scores were also observed with 39.96% in the glacial region and 33.52% in the humid region. Moreover, the average skill scores of the hyper-arid region were 28.77% (MB), 24.98% (MAE), 23.87% (ubRMSE), and 15.3% (KGE score).
On the basis of the findings of the current study, it is recommended that the development of RBPDs can be a potential alternative for data-scarce regions and areas with complex topography.

Author Contributions

K.U.R. and S.S. conceived the research topic and formulated the methods; K.U.R. collected and arranged the data; K.U.R. performed data processing and analysis; K.U.R. and S.S. interpreted the results; K.U.R. wrote the paper; S.S. provided reviews and revised manuscript. All authors have read and agreed to the published version of the manuscript.

Funding

This study was supported by the National Natural Science Foundation of China (grant numbers 51779119 and 51839006).

Acknowledgments

The authors are thankful and extend their gratitude to the Pakistan Meteorology Department (PMD), the Water and Power Development Authority (WAPDA), and SPDs developers. The authors also cordially appreciate the efforts of anonymous reviewers who critically reviewed the manuscript.

Conflicts of Interest

The authors declare no conflict of interest.

Abbreviations

SPDSatellite precipitation dataset
RBPDRegional blended precipitation dataset
WALSWeighted average least squares
IMERGGlobal Precipitation Measurement (GPM)-based Integrated Multi-Satellite Retrievals for GPM
TRMMTropical Rainfall Measurement Mission
TMPAMulti-Satellite Precipitation Analysis
PERSIANN-CDRPrecipitation Estimates from Remotely Sensed Information Using Artificial Neural Networks-Climate Data Record
SM2RAINSoil moisture to RAIN
CCIClimate change initiative
ASCATAdvanced SCATterometer
MBMean bias
MAEMean absolute error
ubRMSEUnbiased root mean square error
RCorrelation coefficient
KGEKling–Gupta efficiency
DCBADynamic clustered Bayesian model averaging
DBMADynamic Bayesian model averaging
GCOSGlobal Climate Observing System
GPCPGlobal Precipitation Climatology Project
CMAPClimate Prediction Center Merged Analysis of Precipitation
PCAPrincipal component analysis
CMORPHClimate Prediction Center morphing technique
RGsRain gauges
HKHHindukush-Karakoram-Himalaya
GRGlacial region
HRHumid region
ARArid region
HARHyper-arid region
PMDPakistan Meteorology Department
WAPDAWater and Power Development Authority
SIHPSnow and Ice Hydrology Project
WMOWorld Meteorological Organization
ARIMAAutoregressive integrated moving average
BMABayesian model averaging
DOYDay of the year
ARAutoregressive
MAMoving averaging
SSSkill score
RRGRepresentative rain gauge
OKOrdinary Kriging

References

  1. Rahman, K.U.; Shang, S.; Shahid, M.; Wen, Y.; Khan, Z. Application of Dynamic Clustered Bayesian Model Averaging (DCBA) algorithm for merging multi-satellite precipitation products over Pakistan. J. Hydrometeorol. 2020, 21, 17–37. [Google Scholar] [CrossRef]
  2. Ma, Y.; Sun, X.; Chen, H.; Yang, H.; Zhang, Y. A flexible two-stage approach for blending multiple satellite precipitation estimates and rain gauge observations: An experiment in the northeastern Tibetan Plateau. Hydrol. Earth Syst. Sci. Discuss. 2020. in review. [Google Scholar] [CrossRef]
  3. Rahman, K.U.; Shang, S.; Shahid, M.; Wen, Y. An Appraisal of Dynamic Bayesian Model Averaging-based Merged Multi-Satellite Precipitation Datasets Over Complex Topography and the Diverse Climate of Pakistan. Remote Sens. 2020, 12, 10. [Google Scholar] [CrossRef] [Green Version]
  4. Rahman, K.U.; Shang, S.; Shahid, M.; Wen, Y.; Khan, A.J. Development of a novel weighted average least squares-based ensemble multi-satellite precipitation dataset and its comprehensive evaluation over Pakistan. Atmos. Res. 2020, 246, 105133. [Google Scholar] [CrossRef]
  5. Ma, Y.; Hong, Y.; Chen, Y.; Yang, Y.; Tang, G.; Yao, Y.; Long, D.; Li, C.; Han, Z.; Liu, R. Performance of optimally merged multisatellite precipitation products using the dynamic Bayesian model averaging scheme over the Tibetan Plateau. J. Geophys. Res. Atmos. 2018, 123, 814–834. [Google Scholar] [CrossRef]
  6. Kidd, C.; Huffman, G. Global precipitation measurement. Meteorol. Appl. 2011, 18, 334–353. [Google Scholar] [CrossRef]
  7. Miao, C.; Ashouri, H.; Hsu, K.-L.; Sorooshian, S.; Duan, Q. Evaluation of the PERSIANN-CDR daily rainfall estimates in capturing the behavior of extreme precipitation events over China. J. Hydrometeorol. 2015, 16, 1387–1396. [Google Scholar] [CrossRef] [Green Version]
  8. Hou, A.Y.; Kakar, R.K.; Neeck, S.; Azarbarzin, A.A.; Kummerow, C.D.; Kojima, M.; Oki, R.; Nakamura, K.; Iguchi, T. The global precipitation measurement mission. Bull. Am. Meteorol. Soc. 2014, 95, 701–722. [Google Scholar] [CrossRef]
  9. Yong, B.; Liu, D.; Gourley, J.J.; Tian, Y.; Huffman, G.J.; Ren, L.; Hong, Y. Global view of real-time TRMM multisatellite precipitation analysis: Implications for its successor global precipitation measurement mission. Bull. Am. Meteorol. Soc. 2015, 96, 283–296. [Google Scholar] [CrossRef]
  10. Prat, O.; Nelson, B. Evaluation of precipitation estimates over CONUS derived from satellite, radar, and rain gauge data sets at daily to annual scales (2002–2012). Hydrol. Earth Syst. Sci. 2015, 19, 2037. [Google Scholar] [CrossRef] [Green Version]
  11. Dee, D.P.; Uppala, S.; Simmons, A.; Berrisford, P.; Poli, P.; Kobayashi, S.; Andrae, U.; Balmaseda, M.; Balsamo, G.; Bauer, d.P. The ERA-Interim reanalysis: Configuration and performance of the data assimilation system. Q. J. R. Meteorol. Soc. 2011, 137, 553–597. [Google Scholar] [CrossRef]
  12. Huffman, G.J.; Bolvin, D.T.; Nelkin, E.J.; Wolff, D.B.; Adler, R.F.; Gu, G.; Hong, Y.; Bowman, K.P.; Stocker, E.F. The TRMM multisatellite precipitation analysis (TMPA): Quasi-global, multiyear, combined-sensor precipitation estimates at fine scales. J. Hydrometeorol. 2007, 8, 38–55. [Google Scholar] [CrossRef]
  13. Mo, K.C.; Chen, L.-C.; Shukla, S.; Bohn, T.J.; Lettenmaier, D.P. Uncertainties in North American land data assimilation systems over the contiguous United States. J. Hydrometeorol. 2012, 13, 996–1009. [Google Scholar] [CrossRef]
  14. Derin, Y.; Anagnostou, E.; Berne, A.; Borga, M.; Boudevillain, B.; Buytaert, W.; Chang, C.-H.; Delrieu, G.; Hong, Y.; Hsu, Y.C. Multiregional satellite precipitation products evaluation over complex terrain. J. Hydrometeorol. 2016, 17, 1817–1836. [Google Scholar] [CrossRef]
  15. Mei, Y.; Anagnostou, E.N.; Nikolopoulos, E.I.; Borga, M. Error analysis of satellite precipitation products in mountainous basins. J. Hydrometeorol. 2014, 15, 1778–1793. [Google Scholar] [CrossRef]
  16. Peña-Arancibia, J.L.; van Dijk, A.I.; Renzullo, L.J.; Mulligan, M. Evaluation of precipitation estimation accuracy in reanalyses, satellite products, and an ensemble method for regions in Australia and South and East Asia. J. Hydrometeorol. 2013, 14, 1323–1333. [Google Scholar] [CrossRef] [Green Version]
  17. Krajewski, W.F. Cokriging radar-rainfall and rain gage data. J. Geophys. Res. Atmos. 1987, 92, 9571–9580. [Google Scholar] [CrossRef]
  18. Huffman, G.J.; Adler, R.F.; Arkin, P.; Chang, A.; Ferraro, R.; Gruber, A.; Janowiak, J.; McNab, A.; Rudolf, B.; Schneider, U. The global precipitation climatology project (GPCP) combined precipitation dataset. Bull. Am. Meteorol. Soc. 1997, 78, 5–20. [Google Scholar] [CrossRef]
  19. Xie, P.; Arkin, P.A. Global precipitation: A 17-year monthly analysis based on gauge observations, satellite estimates, and numerical model outputs. Bull. Am. Meteorol. Soc. 1997, 78, 2539–2558. [Google Scholar] [CrossRef]
  20. Li, H.; Hong, Y.; Xie, P.; Gao, J.; Niu, Z.; Kirstetter, P.; Yong, B. Variational merged of hourly gauge-satellite precipitation in China: Preliminary results. J. Geophys. Res. Atmos. 2015, 120, 9897–9915. [Google Scholar] [CrossRef]
  21. Xie, P.; Xiong, A.Y. A conceptual model for constructing high-resolution gauge-satellite merged precipitation analyses. J. Geophys. Res. Atmos. 2011, 116. [Google Scholar] [CrossRef]
  22. Yang, Z.; Hsu, K.; Sorooshian, S.; Xu, X.; Braithwaite, D.; Zhang, Y.; Verbist, K.M. Merging high-resolution satellite-based precipitation fields and point-scale rain gauge measurements—A case study in Chile. J. Geophys. Res. Atmos. 2017, 122, 5267–5284. [Google Scholar] [CrossRef]
  23. Bhuiyan, M.A.E.; Nikolopoulos, E.I.; Anagnostou, E.N.; Quintana-Seguí, P.; Barella-Ortiz, A. A nonparametric statistical technique for combining global precipitation datasets: Development and hydrological evaluation over the Iberian Peninsula. Hydrol. Earth Syst. Sci. 2018, 22, 1371. [Google Scholar] [CrossRef] [Green Version]
  24. Rahman, K.; Shang, S.; Shahid, M.; Li, J. Developing an ensemble precipitation algorithm from satellite products and its topographical and seasonal evaluations over Pakistan. Remote Sens. 2018, 10, 1835. [Google Scholar] [CrossRef] [Green Version]
  25. Baez-Villanueva, O.M.; Zambrano-Bigiarini, M.; Beck, H.E.; McNamara, I.; Ribbe, L.; Nauditt, A.; Birkel, C.; Verbist, K.; Giraldo-Osorio, J.D.; Thinh, N.X. RF-MEP: A novel Random Forest method for merging gridded precipitation products and ground-based measurements. Remote Sens. Environ. 2020, 239, 111606. [Google Scholar] [CrossRef]
  26. Rahman, K.U.; Shang, S.; Shahid, M.; Wen, Y. Hydrological evaluation of merged satellite precipitation datasets for streamflow simulation using SWAT: A case study of Potohar Plateau, Pakistan. J. Hydrol. 2020, 125040. [Google Scholar] [CrossRef]
  27. Ma, Y.; Yang, Y.; Han, Z.; Tang, G.; Maguire, L.; Chu, Z.; Hong, Y. Comprehensive evaluation of ensemble multi-satellite precipitation dataset using the dynamic bayesian model averaging scheme over the Tibetan Plateau. J. Hydrol. 2018, 556, 634–644. [Google Scholar] [CrossRef]
  28. Chao, L.; Zhang, K.; Li, Z.; Zhu, Y.; Wang, J.; Yu, Z. Geographically weighted regression based methods for merging satellite and gauge precipitation. J. Hydrol. 2018, 558, 275–289. [Google Scholar] [CrossRef]
  29. Shen, Y.; Xiong, A.; Hong, Y.; Yu, J.; Pan, Y.; Chen, Z.; Saharia, M. Uncertainty analysis of five satellite-based precipitation products and evaluation of three optimally merged multi-algorithm products over the Tibetan Plateau. Int. J. Remote Sens. 2014, 35, 6843–6858. [Google Scholar] [CrossRef]
  30. Raftery, A.E.; Gneiting, T.; Balabdaoui, F.; Polakowski, M. Using Bayesian model averaging to calibrate forecast ensembles. Mon. Weather Rev. 2005, 133, 1155–1174. [Google Scholar] [CrossRef] [Green Version]
  31. Sinclair, S.; Pegram, G. Combining radar and rain gauge rainfall estimates using conditional merging. Atmos. Sci. Lett. 2005, 6, 19–22. [Google Scholar] [CrossRef]
  32. Vila, D.A.; De Goncalves, L.G.G.; Toll, D.L.; Rozante, J.R. Statistical evaluation of combined daily gauge observations and rainfall satellite estimates over continental South America. J. Hydrometeorol. 2009, 10, 533–543. [Google Scholar] [CrossRef]
  33. Long, Y.; Zhang, Y.; Ma, Q. A merging framework for rainfall estimation at high spatiotemporal resolution for distributed hydrological modeling in a data-scarce area. Remote Sens. 2016, 8, 599. [Google Scholar] [CrossRef] [Green Version]
  34. Li, M.; Shao, Q. An improved statistical approach to merge satellite rainfall estimates and raingauge data. J. Hydrol. 2010, 385, 51–64. [Google Scholar] [CrossRef]
  35. Ochoa-Rodriguez, S.; Wang, L.P.; Willems, P.; Onof, C. A review of radar-rain gauge data merging methods and their potential for urban hydrological applications. Water Resour. Res. 2019, 55, 6356–6391. [Google Scholar] [CrossRef]
  36. Sivasubramaniam, K.; Sharma, A.; Alfredsen, K. Merging radar and gauge information within a dynamical model combination framework for precipitation estimation in cold climates. Environ. Model. Softw. 2019, 119, 99–110. [Google Scholar] [CrossRef]
  37. Muhammad, W.; Yang, H.; Lei, H.; Muhammad, A.; Yang, D. Improving the regional applicability of satellite precipitation products by ensemble algorithm. Remote Sens. 2018, 10, 577. [Google Scholar] [CrossRef] [Green Version]
  38. Hanif, M.; Khan, A.H.; Adnan, S. Latitudinal precipitation characteristics and trends in Pakistan. J. Hydrol. 2013, 492, 266–272. [Google Scholar] [CrossRef]
  39. Asmat, U.; Athar, H. Run-based multi-model interannual variability assessment of precipitation and temperature over Pakistan using two IPCC AR4-based AOGCMs. Theor. Appl. Climatol. 2017, 127, 1–16. [Google Scholar] [CrossRef]
  40. Rahman, K.U.; Shang, S.; Shahid, M.; Wen, Y. Performance assessment of SM2RAIN-CCI and SM2RAIN-ASCAT precipitation products over Pakistan. Remote Sens. 2019, 11, 2040. [Google Scholar] [CrossRef] [Green Version]
  41. Balkhair, K.S.; Rahman, K.U. Sustainable and economical small-scale and low-head hydropower generation: A promising alternative potential solution for energy generation at local and regional scale. Appl. Energy 2017, 188, 378–391. [Google Scholar] [CrossRef]
  42. Iqbal, M.F.; Athar, H. Validation of satellite based precipitation over diverse topography of Pakistan. Atmos. Res. 2018, 201, 247–260. [Google Scholar] [CrossRef]
  43. Dimri, A.; Niyogi, D.; Barros, A.; Ridley, J.; Mohanty, U.; Yasunari, T.; Sikka, D. Western disturbances: A review. Rev. Geophys. 2015, 53, 225–246. [Google Scholar] [CrossRef]
  44. Asmat, U.; Athar, H.; Nabeel, A.; Latif, M. An AOGCM based assessment of interseasonal variability in Pakistan. Clim. Dyn. 2018, 50, 349–373. [Google Scholar] [CrossRef]
  45. Huffman, G.J.; Bolvin, D.T.; Braithwaite, D.; Hsu, K.; Joyce, R.; Kidd, C.; Nelkin, E.J.; Sorooshian, S.; Tan, J.; Xie, P. NASA Global Precipitation Measurement (GPM) Integrated Multi-satellitE Retrievals for GPM (IMERG); Algorithm Theoretical Basis Document (ATBD) Version 5.2; NASA/GSFC: Greenbelt, MD, USA, 2018.
  46. Ashouri, H.; Hsu, K.-L.; Sorooshian, S.; Braithwaite, D.K.; Knapp, K.R.; Cecil, L.D.; Nelson, B.R.; Prat, O.P. PERSIANN-CDR: Daily precipitation climate data record from multisatellite observations for hydrological and climate studies. Bull. Am. Meteorol. Soc. 2015, 96, 69–83. [Google Scholar] [CrossRef] [Green Version]
  47. Brocca, L.; Moramarco, T.; Melone, F.; Wagner, W. A new method for rainfall estimation through soil moisture observations. Geophys. Res. Lett. 2013, 40, 853–858. [Google Scholar] [CrossRef]
  48. Ciabatta, L.; Massari, C.; Brocca, L.; Gruber, A.; Reimer, C.; Hahn, S.; Paulik, C.; Dorigo, W.; Kidd, R.; Wagner, W. SM2RAIN-CCI: A new global long-term rainfall data set derived from ESA CCI soil moisture. Earth Syst. Sci. Data 2018, 10, 267. [Google Scholar] [CrossRef] [Green Version]
  49. Brocca, L.; Ciabatta, L.; Massari, C.; Moramarco, T.; Hahn, S.; Hasenauer, S.; Kidd, R.; Dorigo, W.; Wagner, W.; Levizzani, V. Soil as a natural rain gauge: Estimating global rainfall from satellite soil moisture data. J. Geophys. Res. Atmos. 2014, 119, 5128–5141. [Google Scholar] [CrossRef]
  50. Brocca, L.; Filippucci, P.; Hahn, S.; Ciabatta, L.; Massari, C.; Camici, S.; Schüller, L.; Bojkov, B.; Wagner, W. SM2RAIN-ASCAT (2007–2018): Global daily satellite rainfall from ASCAT soil moisture. Earth Syst. Sci. Data Discuss 2019, 11, 1–31. [Google Scholar] [CrossRef] [Green Version]
  51. Magnus, J.R.; De Luca, G. Weighted-average least squares (WALS): A survey. J. Econ. Surv. 2016, 30, 117–148. [Google Scholar] [CrossRef] [Green Version]
  52. Magnus, J.R.; Powell, O.; Prüfer, P. A comparison of two model averaging techniques with an application to growth empirics. J. Econom. 2010, 154, 139–153. [Google Scholar] [CrossRef] [Green Version]
  53. Brown, B.G.; Katz, R.W.; Murphy, A.H. Time series models to simulate and forecast wind speed and wind power. J. Clim. Appl. Meteorol. 1984, 23, 1184–1195. [Google Scholar] [CrossRef]
  54. Ediger, V.Ş.; Akar, S.; Uğurlu, B. Forecasting production of fossil fuel sources in Turkey using a comparative regression and ARIMA model. Energy Policy 2006, 34, 3836–3846. [Google Scholar] [CrossRef]
  55. Box, G.E.; Jenkins, G.M. Time Series Analysis: Forecasting and Control; Holden-Day: San Francisco, CA, USA, 1976. [Google Scholar]
  56. Box, G.E.; Jenkins, G.M.; Reinsel, G.C.; Ljung, G.M. Time Series Analysis: Forecasting and Control; John Wiley & Sons: Hoboken, NJ, USA, 2015. [Google Scholar]
  57. Melard, G.; Pasteels, J.-M. Automatic ARIMA modeling including interventions, using time series expert software. Int. J. Forecast. 2000, 16, 497–508. [Google Scholar] [CrossRef]
  58. Bliemel, F. Theil’s Forecast Accuracy Coefficient: A Clarification; SAGE Publications Sage CA: Los Angeles, CA, USA, 1973. [Google Scholar]
  59. Ebert, E.E. Methods for verifying satellite precipitation estimates. In Measuring Precipitation from Space; Springer: Berlin/Heidelberg, Germany, 2007; pp. 345–356. [Google Scholar]
  60. Kling, H.; Fuchs, M.; Paulin, M. Runoff conditions in the upper Danube basin under an ensemble of climate change scenarios. J. Hydrol. 2012, 424, 264–277. [Google Scholar] [CrossRef]
  61. Romilly, T.G.; Gebremichael, M. Evaluation of satellite rainfall estimates over Ethiopian river basins. Hydrol. Earth Syst. Sci. 2011, 15, 1505. [Google Scholar] [CrossRef] [Green Version]
  62. Hussain, Y.; Satgé, F.; Hussain, M.B.; Martinez-Carvajal, H.; Bonnet, M.-P.; Cárdenas-Soto, M.; Roig, H.L.; Akhter, G. Performance of CMORPH, TMPA, and PERSIANN rainfall datasets over plain, mountainous, and glacial regions of Pakistan. Theor. Appl. Climatol. 2018, 131, 1119–1132. [Google Scholar] [CrossRef]
  63. Ward, E.; Buytaert, W.; Peaver, L.; Wheater, H. Evaluation of precipitation products over complex mountainous terrain: A water resources perspective. Adv. Water Resour. 2011, 34, 1222–1231. [Google Scholar] [CrossRef]
  64. Wilson, L.J.; Beauregard, S.; Raftery, A.E.; Verret, R. Calibrated surface temperature forecasts from the Canadian ensemble prediction system using Bayesian model averaging. Mon. Weather Rev. 2007, 135, 1364–1385. [Google Scholar] [CrossRef] [Green Version]
  65. Beighley, R.E.; Ray, R.; He, Y.; Lee, H.; Schaller, L.; Andreadis, K.; Durand, M.; Alsdorf, D.; Shum, C. Comparing satellite derived precipitation datasets using the Hillslope River Routing (HRR) model in the Congo River Basin. Hydrol. Process. 2011, 25, 3216–3229. [Google Scholar] [CrossRef]
  66. Dinku, T.; Connor, S.J.; Ceccato, P. Comparison of CMORPH and TRMM-3B42 over mountainous regions of Africa and South America. In Satellite Rainfall Applications for Surface Hydrology; Springer: Berlin/Heidelberg, Germany, 2010; pp. 193–204. [Google Scholar]
  67. Scheel, M.; Rohrer, M.; Huggel, C.; Santos Villar, D.; Silvestre, E.; Huffman, G. Evaluation of TRMM Multi-satellite Precipitation Analysis (TMPA) performance in the Central Andes region and its dependency on spatial and temporal resolution. Hydrol. Earth Syst. Sci. 2011, 15, 2649–2663. [Google Scholar] [CrossRef] [Green Version]
  68. Hong, Y.; Hsu, K.-L.; Sorooshian, S.; Gao, X. Precipitation estimation from remotely sensed imagery using an artificial neural network cloud classification system. J. Appl. Meteorol. 2004, 43, 1834–1853. [Google Scholar] [CrossRef] [Green Version]
  69. Lark, R.; Cullis, B.; Welham, S. On spatial prediction of soil properties in the presence of a spatial trend: The empirical best linear unbiased predictor (E-BLUP) with REML. Eur. J. Soil Sci. 2006, 57, 787–799. [Google Scholar] [CrossRef]
  70. Bitew, M.M.; Gebremichael, M. Evaluation through independent measurements: Complex terrain and humid tropical region in Ethiopia. In Satellite Rainfall Applications for Surface Hydrology; Springer: Berlin/Heidelberg, Germany, 2010; pp. 205–214. [Google Scholar]
  71. Hong, Y.; Gochis, D.; Cheng, J.-T.; Hsu, K.-L.; Sorooshian, S. Evaluation of PERSIANN-CCS rainfall measurement using the NAME event rain gauge network. J. Hydrometeorol. 2007, 8, 469–482. [Google Scholar] [CrossRef] [Green Version]
  72. Villarini, G.; Krajewski, W.F. Review of the different sources of uncertainty in single polarization radar-based estimates of rainfall. Surv. Geophys. 2010, 31, 107–129. [Google Scholar] [CrossRef]
  73. AghaKouchak, A.; Nasrollahi, N.; Habib, E. Accounting for uncertainties of the TRMM satellite estimates. Remote Sens. 2009, 1, 606–619. [Google Scholar] [CrossRef] [Green Version]
  74. Yan, J.; Gebremichael, M. Estimating actual rainfall from satellite rainfall products. Atmos. Res. 2009, 92, 481–488. [Google Scholar] [CrossRef]
  75. Tapiador, F.; Navarro, A.; Levizzani, V.; García-Ortega, E.; Huffman, G.; Kidd, C.; Kucera, P.; Kummerow, C.; Masunaga, H.; Petersen, W. Global precipitation measurements for validating climate models. Atmos. Res. 2017, 197, 1–20. [Google Scholar] [CrossRef]
  76. Li, X.; Zhang, Q.; Xu, C.-Y. Assessing the performance of satellite-based precipitation products and its dependence on topography over Poyang Lake basin. Theor. Appl. Climatol. 2014, 115, 713–729. [Google Scholar] [CrossRef]
Figure 1. (a) Elevation map of the study area from Shuttle Radar Topography Model (SRTM); (b) Rain gauges denoted by GR-RGs, HR-RGs, AR-RGs, and HAR-RGs located in four climate regions, i.e., glacial, humid, arid, and hyper-arid regions, respectively.
Remotesensing 12 04009 g001
Figure 2. Spatial distribution of average WALS-RBPD weights of blending members, (a) IMERG, (b) TMPA and Era-Interim, (c) SM2RAIN-ASCAT, and (d) PERSIANN-CDR and SM2RAIN-CCI across Pakistan during 2007–2018.
Remotesensing 12 04009 g002
Figure 3. Violin plots showing the probability density of the autoregressive integrated moving average (ARIMA) model forecasted weights across the regions. (a) Glacial; (b) Humid; (c) Arid; (d) Hyper-arid regions. Three lines inside the violin plots represent three quartiles.
Remotesensing 12 04009 g003
Figure 4. Spatial distribution of average Global Precipitation Measurement (GPM)-based Integrated Multi-Satellite Retrievals for GPM (IMERG) seasonal weights, across Pakistan from 2007 to 2018. (a) Pre-monsoon; (b) Monsoon; (c) Post-monsoon; (d) Winter.
Remotesensing 12 04009 g004
Figure 5. Spatial distribution of average Tropical Rainfall Measurement Mission (TRMM) Multi-Satellite Precipitation Analysis (TMPA) and ERA-Interim (reanalysis dataset) seasonal weights, across Pakistan from 2007 to 2018. (a) Pre-monsoon; (b) Monsoon; (c) Post-monsoon; (d) Winter.
Remotesensing 12 04009 g005
Figure 6. Spatial distribution of average SM2RAIN-ASCAT seasonal weights across Pakistan from 2007 to 2018. (a) Pre-monsoon; (b) Monsoon; (c) Post-monsoon; (d) Winter.
Remotesensing 12 04009 g006
Figure 7. Spatial distribution of average Precipitation Estimates from Remotely Sensed Information Using Artificial Neural Networks-Climate Data Record (PERSIANN-CDR) and SM2RAIN-CCI seasonal weights, across Pakistan from 2007 to 2018. (a) Pre-monsoon; (b) Monsoon; (c) Post-monsoon; (d) Winter.
Remotesensing 12 04009 g007
Figure 8. Temporal distribution of WALS-RBPD weights against the day of the year (DOY) across the regions. (a) Glacial; (b) Humid; (c) Arid; (d) Hyper-arid.
Remotesensing 12 04009 g008
Figure 9. Temporal distribution of ARIMA forecasted weights on a monthly scale across the regions. (a) Glacial; (b) Humid; (c) Arid; (d) Hyper-arid.
Remotesensing 12 04009 g009
Figure 10. Performance assessment of WALS-RBPD using six statistical indices. (a) Mean bias (MB); (b) Mean absolute error (MAE); (c) Unbiased root mean square error (ubRMSE); (d) Correlation coefficient (R); (e) Kling–Gupta efficiency (KGE) score; (f) Theil’s U.
Remotesensing 12 04009 g010
Table 1. Description of satellite precipitation datasets (SPDs)/reanalysis dataset.
Precipitation DatasetsSpatial ResolutionTemporal ResolutionRetrieval AlgorithmReferences
IMERG0.10°1-dayGoddard profiling algorithmHuffman et al. [45]
TMPA0.25°1-dayGPCC monthly gauge observation to correct the bias of 3B42RTHuffman et al. [12]
PERSIANN-CDR0.25°1-dayAdaptive artificial neural networkAshouri et al. [46]
ERA-Interim (reanalysis dataset)0.25°1-day4D-Var analysisDee et al. [11]
SM2RAIN-CCI0.25°1-daySoil moisture to RAIN algorithmCiabatta et al. [48]
SM2RAIN-ASCAT0.25°1-daySoil moisture to RAIN algorithmBrocca et al. [50]
Table 2. Statistical indices used to assess the performance of the dynamic regional blended precipitation dataset (RBPD) based on weighted average least squares (WALS-RBPD). E i indicates the precipitation estimated using WALS-RBPD, M i depicts the measured (RGs) precipitation data, E ¯ i and M ¯ i denotes the mean estimated and measured precipitation, and N represents the number of data pairs. Moreover, ( C V ) E and ( C V ) M denotes the coefficient of variation of estimated and measured precipitation.
Statistical IndicesFormulaOptimal Value
Mean bias (MB) MB = 1 N i = 1 N ( E i M i ) 0
Mean absolute error (MAE) MAE = 1 N i = 1 N | E i M i | 0
Unbiased root mean square error (ubRMSE) ubRMSE = RMSE 2 MB 2
where RMSE = 1 N i = 1 N ( E i M i ) 2
0
Correlation coefficient (R) R = i = 1 N [ ( E i E ¯ ) ( M i M ¯ ) ] i = 1 N ( E i E ¯ ) 2 i = 1 N ( M i M ¯ ) 2 1
Kling–Gupta efficiency (KGE) score KGE = 1 ( R 1 ) 2 + ( β 1 ) 2 + ( γ 1 ) 2
Where β = E ¯ M ¯ and γ = ( C V ) E ( C V ) M
( C V ) E = 1 N i = 1 N ( E i E ¯ ) / E ¯ ,
( C V ) M = 1 N i = 1 N ( M i M ¯ ) / M ¯
1
Theil’s U U = i = 1 N ( E i M i ) 2 / i = 1 n E i 2 0
Table 3. Average mean absolute error (MAE) and correlation coefficient (R) values for the selected SPDs evaluated against rain gauges (RGs) across each climate region.
SPDsGlacialHumidAridHyper-Arid
MAE
(mm/day)
RMAE
(mm/day)
RMAE
(mm/day)
RMAE
(mm/day)
R
IMERG1.890.772.340.841.770.931.130.95
TMPA2.320.652.790.762.050.891.620.92
PERSIANN-CDR4.260.464.710.543.060.692.260.77
ERA-Interim4.930.395.330.473.430.611.980.80
SM2RAIN-ASCAT3.150.583.540.682.490.821.520.94
SM2RAIN-CCINilNil3.980.632.740.771.750.92
Table 4. Combination of selected SPDs for blending across all climate regions.
Climate RegionsSelected SPDs
GlacialIMERG, TMPA, SM2RAIN-ASCAT, PERSIANN-CDR
HumidIMERG, TMPA, SM2RAIN-CCI, SM2RAIN-ASCAT
AridIMERG, TMPA, SM2RAIN-CCI, SM2RAIN-ASCAT
Hyper-aridIMERG, SM2RAIN-CCI, SM2RAIN-ASCAT, ERA-INTERIM
Table 5. Average blending weights, standard error, t-values, and p-values of the selected SPDs across all climate regions.
Climate RegionSPsWeight (%)Standard Errort-Valuep-Value
GlacialIMERG29.030.06313.77300.0000
TMPA27.480.08233.33870.0008
SM2RAIN-ASCAT23.900.09463.26190.0011
PERSIANN-CDR19.590.06073.22750.0013
HumidIMERG30.120.08433.35730.0003
TMPA25.310.09293.72440.0002
SM2RAIN-ASCAT24.190.07243.34270.0008
SM2RAIN-CCI20.380.06183.29990.0010
AridIMERG31.300.08513.44460.0006
TMPA23.830.09202.69930.0070
SM2RAIN-ASCAT27.840.07253.70270.0002
SM2RAIN-CCI17.030.05733.32020.0009
Hyper-aridIMERG27.650.08743.31880.0009
SM2RAIN-ASCAT32.020.09393.40970.0007
SM2RAIN-CCI23.080.08293.26920.0011
ERA-Interim17.250.03753.17400.0015
Table 6. Seasonal performance assessment of WALS-RBPD across all climate regions during 2007–2018.
SeasonClimate RegionMB (mm/day)MAE (mm/day)ubRMSE (mm/day)RKGE ScoreTheil’s U
Pre-monsoonGlacial0.731.264.180.680.530.39
Humid−0.151.234.730.800.510.30
Arid0.200.601.940.880.730.25
Hyper-arid−0.210.581.860.920.900.20
MonsoonGlacial0.851.515.030.620.490.45
Humid−0.511.605.980.740.440.38
Arid−0.330.822.490.830.670.29
Hyper-arid−0.260.662.320.900.810.24
Post-monsoonGlacial0.560.923.150.750.590.34
Humid0.440.963.660.870.570.25
Arid0.280.712.230.910.790.22
Hyper-arid−0.160.441.600.930.930.18
WinterGlacial0.350.681.970.800.810.31
Humid0.270.511.780.910.670.21
Arid−0.090.550.900.940.840.20
Hyper-arid−0.130.320.680.960.960.15
Table 7. Comparison of WALS-RBPD performance with blended precipitation dataset based on weighted average least squares (WALS-BPD) using skill score during a common period of 2007–2015.
Climate Region MB (%)MAE (%)ubRMSE (%)R (%)KGE Score (%)Theil’s U (%)
GlacialMaximum37.3334.8437.6314.5223.7521.62
Minimum12.0511.7912.575.4513.378.16
Average24.3729.8927.2510.1815.9913.09
Median25.3428.8127.4210.5214.4312.19
HumidMaximum41.4343.0438.728.6426.3224.48
Minimum18.0610.4217.083.489.179.67
Average28.9528.6923.896.3713.1916.06
Median32.1827.5922.356.4913.5427.43
AridMaximum38.8633.7429.398.0413.4324.48
Minimum16.3215.6211.452.227.4611.76
Average20.8718.1419.964.4710.6714.57
Median20.0219.7519.204.4910.6613.59
Hyper-aridMaximum33.3330.6822.377.068.4329.28
Minimum13.7511.749.142.252.179.68
Average18.5517.8214.795.616.0415.94
Median18.0117.3514.015.716.1315.96
Table 8. Comparison of WALS-RBPD performance with blended precipitation dataset based on dynamic clustered Bayesian model averaging (DCBA-BPD) using skill score during a common period of 2007–2015.
Climate Region MB (%)MAE (%)ubRMSE (%)R (%)KGE Score (%)Theil’s U (%)
GlacialMaximum41.4548.3945.7126.2127.5934.54
Minimum14.1722.5218.098.6310.1714.06
Average29.0536.9630.1215.6416.5722.99
Median29.9235.7129.3114.4216.0322.91
HumidMaximum47.9340.9743.1923.9224.0529.10
Minimum21.2326.4016.267.479.1612.25
Average30.2832.2226.2513.0615.2320.58
Median30.9133.8226.9813.6715.9420.25
AridMaximum41.4241.7334.1518.1819.7925.27
Minimum20.3020.4116.724.597.2810.28
Average26.3228.0723.109.7511.6717.17
Median25.8628.1324.668.3312.0716.28
Hyper-aridMaximum35.7639.0332.7212.5212.2623.41
Minimum18.2019.7214.184.325.777.27
Average22.0626.9520.057.638.6514.13
Median22.9227.3720.538.089.6013.24
Table 9. Comparison of WALS-RBPD performance with the blended precipitation dataset based on dynamic Bayesian model averaging (DBMA-BPD) using skill score during a common period of 2007–2015.
Climate Region MB (%)MAE (%)ubRMSE (%)R (%)KGE Score (%)Theil’s U (%)
GlacialMaximum56.5961.3656.9235.1251.8730.17
Minimum22.6827.4125.9319.2525.8813.25
Average39.7438.2739.1626.0739.9618.23
Median39.3437.8940.8928.6240.4718.07
HumidMaximum53.5744.5841.7128.3845.2927.79
Minimum20.2921.6721.7514.5120.9312.12
Average36.9333.0630.4720.2433.5216.09
Median35.8232.3332.4521.0332.2117.78
AridMaximum49.7240.8937.3821.0339.4423.46
Minimum18.5818.6718.6610.3316.499.67
Average31.4430.3726.8215.0224.2813.92
Median30.0030.5325.0516.2323.5913.05
Hyper-aridMaximum46.9233.2830.1916.6426.4520.49
Minimum17.1116.4215.457.6410.226.46
Average28.7724.9823.8711.9915.7310.31
Median28.6924.4321.4110.6116.329.15
Publisher’s Note: MDPI stays neutral with regard to jurisdictional claims in published maps and institutional affiliations.

