Article

Multi-Temporal Satellite Interferometry for Fast-Motion Detection: An Application to Salt Solution Mining

1
Centre Tecnològic de Telecomunicacions de Catalunya (CTTC/CERCA), Division of Geomatics, Avenida Gauss, 7, 08860 Castelldefels, Spain
2
TRE Altamira, Carrer de Còrsega, 381, 08037 Barcelona, Spain
3
Department of Earth Sciences, University of Firenze, Via La Pira, 4 50121 Firenze, Italy
*
Author to whom correspondence should be addressed.
Remote Sens. 2020, 12(23), 3919; https://doi.org/10.3390/rs12233919
Submission received: 19 October 2020 / Revised: 12 November 2020 / Accepted: 25 November 2020 / Published: 29 November 2020
(This article belongs to the Special Issue Remote Sensing Analysis of Geologic Hazards)

Abstract

:
Underground mining is one of the human activities with the highest impact in terms of induced ground motion. The excavation of the mining levels creates pillars, rooms and cavities that can evolve in chimney collapses and sinkholes. This is a major threat where the mining activity is carried out in an urban context. Thus, there is a clear need for tools and instruments able to precisely quantify mining-induced deformation. Topographic measurements certainly offer very high spatial accuracy and temporal repeatability, but they lack in spatial distribution of measurement points. In the past decades, Multi-Temporal Satellite Interferometry (MTInSAR) has become one of the most reliable techniques for monitoring ground motion, including mining-induced deformation. Although with well-known limitations when high deformation rates and frequently changing land surfaces are involved, MTInSAR has been exploited to evaluate the surface motion in several mining area worldwide. In this paper, a detailed scale MTInSAR approach was designed to characterize ground deformation in the salt solution mining area of Saline di Volterra (Tuscany Region, central Italy). This mining activity has a relevant environmental impact, depleting the water resource and inducing ground motion; sinkholes are a common consequence. The MTInSAR processing approach is based on the direct integration of interferograms derived from Sentinel-1 images and on the phase splitting between low (LF) and high (HF) frequency components. Phase unwrapping is performed for the LF and HF components on a set of points selected through a “triplets closure” method. The final deformation map is derived by combining again the components to avoid error accumulation and by applying a classical atmospheric phase filtering to remove the remaining low frequency signal. The results obtained reveal the presence of several subsidence bowls, sometimes corresponding to sinkholes formed in the recent past. Very high deformation rates, up to −250 mm/yr, and time series with clear trend changes are registered. In addition, the spatial and temporal distribution of velocities and time series is analyzed, with a focus on the correlation with sinkhole occurrence.

1. Introduction

Subsidence is a common ground deformation where underground mining activities are carried out. The surface displacements, usually characterized by high deformation rates, are triggered by the excavation of new mining levels which creates cavities, redistributes the stresses, or modifies the groundwater circulation [1]. Among the many different types of underground mining activities, salt solution is one of the most impactful on the environment [2]. The extraction of saturated brines through the dissolution of deep salt levels commonly produces high subsidence rates [2,3,4,5]. The forced circulation of water in the salt levels leaves back cavities that in the long-term evolve in surface effects as subsidence bowls, collapse chimneys and sinkholes. Some examples of such processes include: the Old Belvedere Spinello brinefield in Southern Italy [6,7], the Barycz and Lezkowice salt mines in Poland [8,9], the Tuzla brinefield in Bosnia Herzegovina [10,11,12], the Gallenoncourt and Vauvert salt mines in France [13,14], the Ocnele Mari mining area in Romania [15,16,17], and various sites in the United States of America [2,18,19].
Remote sensing techniques can offer a useful support to studies on the ground effects of natural or anthropogenic subsidence, including mining-related motion. In the past decade, remote sensing techniques have become a reliable alternative to classical geotechnical investigations and measurements. Among many, Differential and Multi-temporal satellite interferometry (DInSAR and MTInSAR) techniques (e.g., [20,21,22]), terrestrial and airborne laser scanning (e.g., [23,24,25]), global navigation satellite system data (e.g., [26,27,28]) provided the best results. Focusing on satellite interferometry (InSAR), mining-induced subsidence is one of the common fields of application of this technique. Some of the most recent works have been presented by various authors, as [28,29,30,31,32,33,34]. InSAR can also provide useful information for sinkholes detection and monitoring, as demonstrated in the case of the Wink sinkholes in Texas (USA, [35]), along the Dead Sea shorelines in Israel and Jordan [36] or in the Ebro Valley (Spain, [37]). A review of sinkhole hazard assessment using satellite interferometry has been presented by Theron and Engelbrecht [38]. A review of MTInSAR techniques is given in Crosetto et al. [39].
Salt dissolution mining is not a common target for interferometric analysis; just a few bibliographic examples exist. The first example is provided by Raucoles et al. [14]. These authors analyzed ERS 1/2 radar images by means of a DInSAR approach to measure the subsidence induced by the dissolution of deep salt levels (1900 to 2800 m b.s.l.) in the Vauvert mine (southern France). The presence of cavities that tend to close, induce the creation of a network of fracture propagating to the surface. This results in a large subsidence bowl, 8-km wide, with velocities up to 2 cm/yr. Samieie-Esfahan et al. [40] performed a MTInSAR analysis to characterize a subsidence area in the Friesland Region (northern Netherlands). Subsidence was related to solution mining activities in addition to the presence of a gas field. The author demonstrated the usefulness of velocity decomposition methods to detect the presence of horizontal components of motions and avoid under-/over-estimation of the results. Recently, Gee et al. [41] confirmed the presence of a subsidence bowl in the same area, with maximum velocities up to 13 mm/yr. Another example is provided by Liu et al. [42] who investigated land subsidence in the solution mine of Changde, China. The interferometric analysis of Sentinel-1 images between June 2015 and January 2017 highlighted the presence of a maximum accumulated deformation of 200 mm. It is worth mentioning the attempt made by these authors to correlate the atmospheric conditions and the solvent temperature with the seasonality of the InSAR-derived time series.
InSAR is nowadays a well-recognized ground monitoring tool in mining areas, thanks to the millimeter accuracy, the relatively short revisiting time and the ability to provide a high number of measurement points, higher than any other ground-based point-like technique (e.g., levelling). Despite the clear advantages, InSAR suffers some well-known limitations when analyzing mining areas. There are two common sources of decorrelation that prevent the detection of reliable measurement points: phase aliasing, due to non-linear motions with displacements higher than a quarter of wavelength between two acquisitions, and coherence loss, related to frequent surface changes produced by the mining activity. The latter is particularly relevant in case of open pit mines. Such limitations can be partly overcome by adopting ad hoc local scale processing strategies, e.g., applying a non-linear of hybrid phase unwrapping approach (e.g., [43]) or using specific coherence thresholding (e.g., [44]).
In this paper, the results of a detailed scale MTInSAR approach applied in the Saline di Volterra brine field in the Volterra municipality (Tuscany, Central Italy) are presented. The area is characterized by a long-term solution mining activity that has a considerable environmental impact in terms of ground motion, i.e., creation of hundreds of sinkholes, and depletion of the water resource, e.g., salinization. A target-oriented MTInSAR processing method is used to squeeze as much as possible the information contained in the Sentinel-1 images. The analysis revealed the presence of several subsidence bowls, sometimes corresponding to sinkholes formed in the recent past. The subsidence bowls have a common deformation pattern, with line of sight (LOS) velocities increasing forward the center of the bowl and reaching, in some cases, peaks of over -200 mm/yr. A detailed velocity- and time series-based analysis was performed to highlight the differences in the temporal evolution of sinkholes formed at various stages of the mining activity. According to this analysis, different deformation regimes were identified for the sinkholes of two high deformation areas in the neighboring of Saline di Volterra. This is the first time ground deformation is quantified in this area; thus, the results obtained can increase the awareness of local entities on the ground effects induced by the mining activity. Moreover, the evaluation of the motion triggered by salt dissolution mining has been rarely investigated by means of satellite interferometry.

2. Study Area

The area of interest is located a few kilometers south of the cities of Volterra and Montecatini Val di Cecina in the Tuscany Region (central Italy) within a hilly landscape dominated by gentle slopes and moderate reliefs. The village of Saline di Volterra is surrounded by five different mining concessions where the two deformation targets of this research are located (red contours in Figure 1). The name of the village “Saline” (salt mine in English) reflects the long-term mining activity of this area. The mining concessions cover a total of 28.5 km2; the biggest one, Buriano, spreads for 10 km2, whereas the smallest one, Casanova, has a surface of only 1 km2 (black contours in Figure 1). An overview on the solution mining activity in this area is provided in Section 2.1.
In addition to mining-related phenomena (i.e., sinkholes) the slopes surrounding the study area are characterized by intense denudation processes and superficial erosion phenomena that reach their maximum evolution forming badlands areas whose presence creates a peculiar landscape [45].
The following three chapters introduce (i) the local geological context, which facilitated and promoted the mining activities, (ii) the history of the Saline di Volterra brine fields with an overview on the mining activity, and (iii) the ground effects registered in the area.

2.1. Geological Context

On a geological point of view, the area of interest is located in the Volterra basin, a NW-SE-oriented Miocene-Pliocene extensional basin developed in response to the eastward migration of the Apennine thrust-belt [47]. The basin is filled by a sedimentary succession ~2500 m thick [48] that includes an evaporitic Messinian succession composed of gypsum and halite layers alternated with conglomerates, sandstone, and claystone [49]. The upper part of this Messinian sequence, known as “Saline di Volterra formation,” hosts laminitic gypsum, turbiditic gypsarenite, microcrystalline gypsum, and halite with intercalations of clay, silt, and sandstones [48]. The Saline di Volterra formation has a variable thickness ranging from a few meters to 200 m, depending on the position within the Volterra basin [49]. The whole sequence is unconformably overlaid by Pliocene marine clays (“Blue Clays”), which represent the closing sedimentation of the basin and widely outcrop in the investigated area (Figure 2).
Little information is available to reconstruct the subsurface setting of the Messinian sequence in the area of interest. Nicolich et al. [50] investigated the area of the Buriano mining concession through high resolution 3D seismic surveys, discovering the presence of cavities in the saline layer at a depth of 150 m to 300 m. Burgalassi et al. [51] stated that the productive salt levels are 10 to 40 m thick and are found at a depth ranging from 60 to 400 m. Speranza et al. [49,52] analyzed the rheological properties of the salt levels in the mining area of Saline di Volterra. The salt samplings were collected from deep cores which intersected the salt deposit between 122 and 165 m below surface, for a total thickness of 43 m. These authors recognized four salt facies, with variable percentage of halite and gypsum layers and variable grain size of the crystals. Speranza et al. [49] estimated that halite represents the 40% of the total volume of the Messinian series.

2.2. Mining Activity in the Area of Interest

The presence of exploitable salt levels in Saline di Volterra was already known during the Roman Empire. The Romans called the area “moje” from the Latin word “muriae” (brine in English). The real exploitation of the salt layers started in the Middle Ages when the saturated water that gushed out from several springs was left to evaporate naturally [54]. The intensive industrial extraction of the salt levels started at the beginning of the twentieth century (1910) by the Saline di Stato, a company ruled by the central government, and by the private company Solvay [54]. In the area of interest, five mining concessions are present (Figure 1): Buriano and Casanova in the Montecatini Val di Cecina municipality, Cecina, Poppiano, and Volterra in the Volterra municipality.
Salt solution is the mining technique applied here, following the Trump method. This method is rather simple: A dissolving fluid, typically water, is pumped into the depth of interest to dissolve the salt level; the saturated brine is then pumped back to the surface [2,55]. The process is subdivided in two phases. First, the water is pumped through the boreholes into the depth of interest and starts to dissolve the salt level. Compressed air is used to constrict and contain the fluid within the salt level, creating a flow that allows connecting the multiple cavities created by adjacent boreholes. Then, some boreholes are equipped with pumps to extract the produced semi-saturated brines; other boreholes continue to reinject new fresh water. After multiple cycles, the final saturation value of 300 g/L is reached [50] and the brine is extracted and channeled, through a system of pipes, to the treatment plant of Rosignano, along the coast (38 km western than Saline di Volterra). In the treatment plant, the sodium chloride is finally extracted from the brine trough a chemical process. The injection/extraction boreholes are disposed in the mining concessions in a regular grid with spacing between the boreholes of 40–45 m. Every mining panel counts 60 to 360 boreholes [51]. The actual production rate requires to drill 50–60 additional boreholes per year [56].
Burglassi et al. [51] estimated that the total amount of salt deposits in the subsurface of this area is 466 million tons; however, considering an extraction ratio of 65% [57], the effective amount of mineable material is 300 million tons. The time needed for the total consumption of this resource has been estimated in about 200 years. The main environmental impacts of the mining activity are three: (i) overexploitation of fresh water, (ii) salinization of streams and aquifers, and (iii) subsidence/sinkholes [58].

2.3. Sinkhole Database

As previously said, subsidence is one of the main environmental impacts of the mining activity in Saline di Volterra. Sinkholes are the clearest evidence of this process. In this work, aerial orthophotos are exploited to create a multi-temporal inventory of sinkhole occurrence for the two target areas. Digital orthophotos were made available through the web map service of the Tuscany Region [46]. Sinkholes were manually mapped using a database of 9 orthophotos acquired in different years, i.e., ranging between 1954 and 2018 (Table 1). The manual mapping of sinkholes in the area is straightforward; the vegetation cover is sparse, and the sinkholes can be easily detected once formed because of their contrast with the surroundings. Such activity has been carried out by a remote sensing expert using a geographical information system.
Figure 3 presents the results of the orthophoto analysis for the mining concessions of Buriano-Casanova (Figure 3A) and Poppiano-Volterra (Figure 3B). It is worth noting that the definition of the sinkhole contours can be affected by the quality of the oldest images and by the not perfect alignment of some of the WMS services used. This is acceptable since the contours are only used to testify the surface effects of the mining activity.
The total number of mapped sinkholes is 105, with a maximum of 22 and 19 phenomena for the periods 1954–1978 and 1978–1988, respectively. The age of the sinkholes is clearly connected to the activity of the salt dissolution wells. Buriano-Casanova was the oldest area where the mining activity took place; thus, it is the area where the oldest sinkholes are recorded. On the contrary, Poppiano-Volterra is the most recent concession to be exploited for salt extraction. Figure S1 presents the contours of the mining sectors active in different times, as derived from the interpretation of the set of digital orthophotos. As said before, salt dissolution mining began in 1910 and, until 1978, it was mainly localized in the south-western sector of the Buriano concession. Then, the mining activity expanded to the north, involving the Casanova concession as well. In Poppiano-Volterra a small sector of the Volterra concession was active already before 1978. The expansion of the mining activity to the Poppiano concession took place at the beginning of the 2000s. The oldest sector seems to be nowadays inactive, as testified by the migration of the sinkhole occurrence in the two areas of interest. Two graphic interchange format (gif) files are proposed as supplementary files to highlight the sinkholes’ occurrence over time in the mining areas of Buriano-Casanova and Poppiano-Volterra (Figures S2 and S3).
The raise and decrease of the number of sinkholes for comparable time periods, e.g., 1978–1988 and 1988–1999 or 2007–2010 and 2010–2013, is probably related to different rates of extraction. Of course, the development of sinkholes is not instantaneous and there can be a lag time of years between their formation and the mining exploration of a salt level in a certain area. Moreover, considering the fact that not the entire water pumped underground is extracted, the dissolution of the underground holes and chambers can continue for years [2].

3. InSAR Processing

A detailed scale processing approach, based on the direct integration of interferograms, is carried out to retrieve the deformation occurred in the mining area of Saline di Volterra. The workflow of the methodology is presented in Figure 4. The processing chain developed by the Geomatics Division of the Centre Tecnològic de Telecomunicacions de Catalunya was exploited to perform the analysis [59].
Data processing starts with the generation of the full-resolution interferogram stack, following the classical differential interferometry approach [60]. Interferograms (ITFs) are generated starting from a stack of 127 coregistered Sentinel-1 images (both 1A and 1B), acquired in descending orbit and C-band (wavelength of ~5.6 cm). The first image of the stack is set as master (19/09/2016). The images cover the period between September 2016 and November 2018. ITFs are generated with the shorter temporal baseline possible, i.e., 6 or 12 days. A 30-m Shuttle Radar Topographic Mission Digital Elevation Model (SRTM 1 Arc-Second Global – version 3, [61]) is used to remove the topographic contribution from the interferograms. The precise orbits provided by the European Space Agency are used as well [62].
Phase splitting is performed on the stack of wrapped ITFs to extract the low (LF) and high (HF) frequency components. A spatial filter is applied to every ITF to do so. A Butterworth filter is used in this work, in the form:
G ( Ω ) = 1 1 + ( Ω Ω C ) 2 N
where G is the gain, Ω is the frequency, ΩC is the cut-off frequency, and N is the order. The spatial filtering generates the LF interferograms, whose residuals represent the HF component. The LF component is assumed to be almost completely formed by the atmospheric contribution [63] although some fast movements with high spatial correlation can still be present. The HF component contains the slow movements (few mm/yr to several cm/yr), the fast local movements (below 2 mm/day), and the residual topographic errors [64]. The analysis of LF and HF ITFs is performed by following two parallel paths (Figure 4).
The HF path is composed of three steps: (i) pixel selection, (ii) phase unwrapping, and (iii) direct integration. Pixel selection is based on an approach called “triplets closure.” As the name suggests, the method is based on triplets of radar images (i, j, and k) and interferograms generated with different temporal baselines, in this case 6 and 12 days (ΔΦi−j, ΔΦj−k, ΔΦi−k). The error (ε) is:
ε = Δ Φ i j + Δ Φ j k Δ Φ i k
In case of low noise ITFS, ε is close to zero. The error increases along to the level of noise. The standard deviation of ε calculated with (2) over the whole interferograms stack for each pixel is used to select the points reliable enough to unwrap the phase. The pixels with standard deviation values below the threshold are selected as phase unwrapping candidates. Phase unwrapping is performed by means of the minimum cost flow method [65]. Finally, a point-wise direct integration of the unwrapped interferograms is performed. In a second step, the unwrapped interferograms and thus the final result of direct integration, are all referred to a stable reference point. The direct integration is expressed in the form:
n = 0 ÷ N   { Φ n = Φ n 1 + Δ Φ ( n 1 ) n Φ 0 = 0
where Φn is the accumulated phase at the acquisition time n, Φn−1 is the accumulated phase at the acquisition time n−1, and Φ(n−1)n is the unwrapped interferometric phase of the interferogram calculated using the images acquired at the times n−1 and n. The first image is set to zero (Φ0). The output of the direct integration is, for each point, the temporal evolution of the phase with respect to the first acquisition. Each point is then referred to a stable reference point. The phase is converted in LOS displacement by following:
D i s p n = Φ n 4 π λ  
where Dispn is the accumulated displacement of the point at the acquisition time n, Φn is the accumulated phase at the acquisition time n (in radians), and λ is the wavelength of the satellite. Each point is then characterized by n values of displacement, forming the time series, and by a value of velocity calculated over the reference period.
The LF path is composed by three steps: (i) network generation, (ii) pixel selection, (iii) 2+1D phase unwrapping. The LF analysis begins with the set of short baseline LF ITFs which were previously generated. In order to increase the redundancy of the network, the LF ITFs are crossed to derive synthetic ITFs with longer temporal baselines. The measurement point candidates are then selected by applying the triplets closure concept (2) to the newest LF network of interferograms. The 2+1D unwrapping method is finally applied to derive the time series of deformation [59]. Through this method it is possible to check the consistency of the spatial unwrapping in time, owing the redundant ITFs network, and on a pixel-wise basis, i.e., on the points selected with the triplets closure method.
The final products of the two parallel processing paths are time series and deformation maps for the low and high frequency components. The two products are then combined again in order to avoid error accumulation related to the LF-HF split. This error accumulation results in residual trends, with opposite sign between the LF and HF results. Finally, a classical atmospheric phase filtering is applied to remove the remaining low frequency signal not due to the ground deformation. The final deformation map is then georeferenced in a geographic reference system.

4. Results

The obtained deformation map is presented in Figure 5. A total of ~24,000 points cover the mining area of Saline di Volterra with an average density of ~800 measurement points/km2 (MP/km2). This high density is due to the fact that the thresholding applied during the InSAR processing allowed maximizing the MP coverage within the two target areas, where the sinkholes are present and where the highest deformation rates are likely to be found. This implies to have a noisier deformation map outside of the high displacement areas. This is acceptable since the targets of this paper are exactly these “fast” moving pixels.
The deformation map is classified on the basis of the average velocity values, expressed in mm/yr. A stability threshold of ±20 mm/yr was defined to highlight the subsidence bowls within the two mining areas. This threshold is defined depending on the standard deviation of the velocities, here equal to 2.5 times such value. A classical red-green-blue scale bar is used to classify the deformation map; yellow to dark red points refer to movements away from the sensor with negative sign, light blue points refer to movements through the sensor whereas green points fall within the stability threshold. All the measurements are referred to the LOS and are differential values, i.e., referred to a reference point assumed as stable. The reference point was selected in the urban area of Volterra in correspondence of the main road crossing the hamlet, where the oldest edifices are built. To the knowledge of the authors, the area is stable as confirmed also by other interferometric data available for the whole Tuscany Region [46,66].
The deformation map clearly highlights the presence of several subsidence bowls within the contours of the two areas of interest that are part of the mining concessions around Saline di Volterra. Some of the bowl reach in their central portion LOS velocities higher than −200 mm/yr. The characterization of the two mining areas, Buriano-Casanova and Poppiano-Volterra, is presented in the following sections. It is worth noting that there are some other moving areas (with positive or negative LOS velocity values) outside the mining areas that may be linked to the motion of complex landslides and small earthflows, which characterize the clayey slopes around Volterra [67].

4.1. Buriano-Casanova Mining Area

The northwestern portion of the Buriano-Casanova mining area presents at least five well-defined subsidence bowls with LOS velocities higher than 80 mm/yr. Among these, the bowl A and B (Figure 6a) are the ones with the highest deformation rates, up to −250 and −230 mm/yr, respectively. This implies that the two subsidence bowls reach in their central portion an accumulated displacement higher than 500 mm in a period a little longer than two years. The isolated points showing an uplift are far from the subsidence bowls and from the mapped sinkholes; they are supposed to be related to pixel-scale errors (e.g., LF residuals) that have to be taken into account in this kind of target-oriented processing approach.
The subsidence bowls are located in the most recent mining expansion of this area, at the border between the Buriano and Casanova concessions, where some of the most recent sinkholes are found (Figure 3). Bowls A and B occupy a surface of ~0.04 km2 and ~0.03 km2, respectively. In the first case, the orthophotographic analysis did not highlight the presence of any formed sinkholes, whereas in the area of bowl B a sinkhole is evident from the 2013’ orthophoto and it is expanding in the last years (see Figure 6b).
Figure 6c shows the time series of deformation for the bowl A. The time series extracted from the center of the bowl (point 1) has a purely linear trend with minor oscillations of the displacement values. The deformation rate for point 1 is equal to −210 mm/yr. Point 2 is located in the southern border of the subsidence bowl and it is characterized by a lower deformation rate (−122 mm/yr), as expected moving away from the center of the subsidence area. The time series is again linear with a minor acceleration event between May and July 2018 (point 2). During this period, the velocity is ~200 mm/yr. This behavior is shared by several points in the same sector of the bowl. The northern portion of the bowl presents the lowest velocities, up to 40 mm/yr and linear trends with no significant accelerations (point 3).
Figure 6d presents the time series of deformation for the bowl B. The time series analysis is focused on the points around the mapped sinkholes. Points 4 and 5 are extracted from the southern and northern border of the sinkhole, respectively. The time series referred to as point 4 shows a linear trend with a strong acceleration between August and November 2017, with LOS velocities passing from ~−200 mm/yr to ~−420 mm/yr. Such acceleration is not evident in the time series of point 5 whose deformation rate (−137 mm/yr) is constant over time with minor order oscillations. It is interesting to notice that moving away from the sinkhole the time series tend to stabilize in the last 6 months (point 6 is an example of this trend).

4.2. Poppiano-Volterra Mining Area

The central portion of the Poppiano-Volterra area presents a distribution of the measurement points within the subsidence bowls slightly different than the previous example. In fact, only the external border of the moving areas is well-defined. In fact, the loss of coherence is so strong that a large part of what it is supposed to be the main subsidence area is not covered by any measurement point, even considering the specific data processing applied. The loss of coherence can have a triple interpretation: (i) land cover characteristics; (ii) high surface changes between the images of the stack, and (iii) presence of fast motions that create decorrelation. It is worth noting that the land cover is basically the same as the Buriano-Casanova mining concession and surface changes induced by salt dissolution mining are not as big as in the case of e.g., open pit mining. Considering this, the hypothesis of the presence of fast deformation rates exceeding the ~2 mm/day unwrapping threshold seems the most reasonable.
Because of the lack of measurement points, the subsidence bowls are less defined as it is for the Buriano-Casanova area. One clear bowl can be identified in the area of point 1 (Figure 7a). The low point density prevents further visual interpretation of the deformation map. In general terms, LOS velocities greatly increase forward the low coherence areas, passing from less than ±10 mm/yr to more than 100 mm/yr, in some cases exceeding −220 mm/yr.
The time series of deformation extracted for the points with the highest deformation rates along the internal border of the high deformation areas are presented in Figure 7b (points 1,2,4,5, and 6). All these time series highlight an acceleration with different magnitudes in the last months of the monitored period. The breaking point is located between June and August 2018.
Point 1 is the one showing the most evident acceleration. Although having already an accumulated deformation of 250 mm in less than 2 years (LOS velocity of -152 mm/yr), this point triplicated its deformation trend after the beginning of June 2018. In the second part of the time series the accumulated deformation is equal to 220 mm in a ~6 months period (the estimated LOS velocity is equal to ~450 mm/yr). Such acceleration is not as evident in the other time series, but the velocity change is still relevant, ranging between 120 and 180 mm/yr. The behavior of the time series in the last six months supports the previous hypothesis, i.e., the presence of very high deformation rates where measurement points could not be obtained.

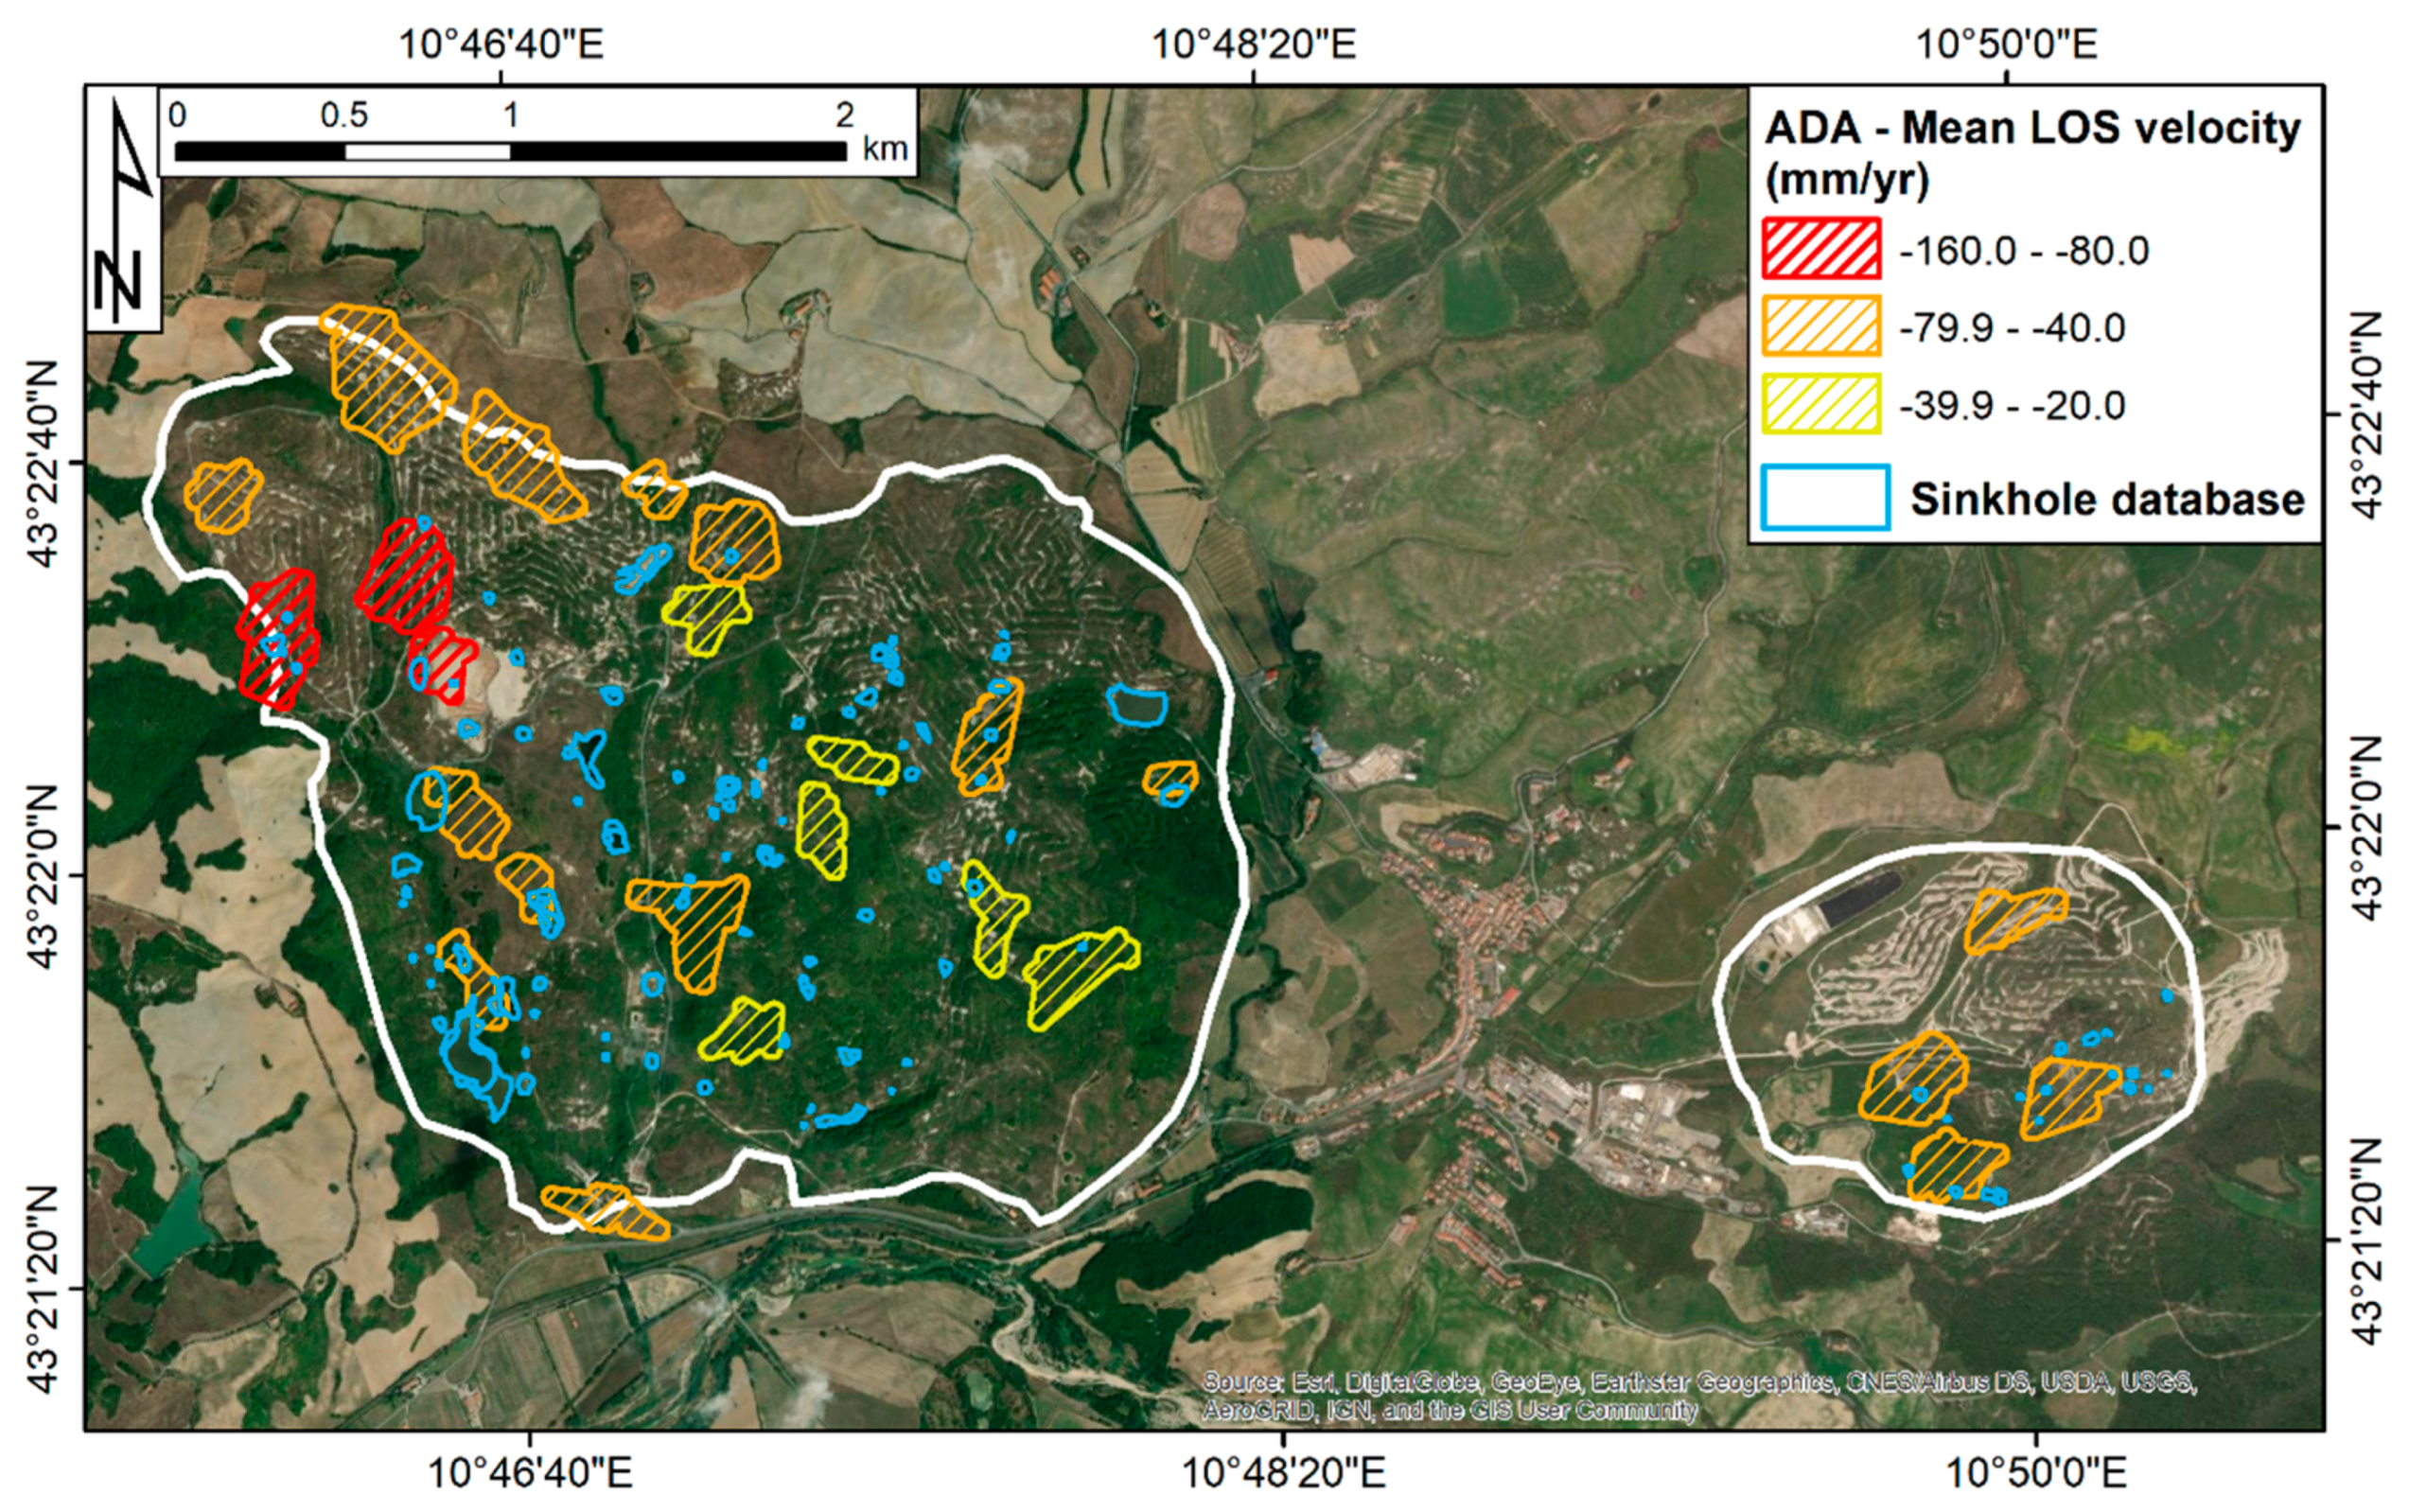
4.3. Comparison between the Spatial Distribution of Sinkholes and the Deformation Map

A hot-spot like analysis is performed to extract the biggest subsidence bowls from the deformation map presented in Figure 5 and to compare their spatial distribution with the sinkhole database. Such analysis is based on the concept of active deformation areas (ADA) defined by Barra et al. [68]. An ADA defines a moving area composed of a certain number of moving measurement points that are aggregated on the basis of neighboring criteria. Moving means that the LOS velocity of a measurement point is above a threshold defined by the user. The software tools developed by Navarro et al. [69] are used to perform the ADA extraction.
In this paper, a LOS velocity threshold equal to 2.5 times the standard deviation of the deformation map (±20 mm/yr) is used to select the moving measurement points. Every ADA is composed of a minimum of 10 points and the clustering distance is set to 28 m. The analysis allows highlighting 25 ADA in the two mining areas, 21 for Buriano-Casanova, and 4 for Poppiano-Volterra. Average LOS velocity values range between -25 mm/yr and -109 mm/yr.
The visual comparison between the ADA distribution and the sinkhole database is shown in Figure 8. Considering a search radius of 50 m, the ADA associated to one or more mapped sinkholes are 18, 15 for Buriano-Casanova and 3 for Poppiano-Volterra. The number of sinkholes found within a subsidence bowl is 64 (almost half of the total).

4.4. Sinkhole-Scale Analysis of the LOS Velocity Values

A further analysis is performed at sinkhole scale. The deformation map is filtered by using the polygons of the 105 sinkholes mapped in the areas of Buriano-Casanova and Poppiano-Volterra. A 10-m buff is created around each polygon to define an area of influence. The average, maximum, minimum, and standard deviation values of the LOS velocities of the measurement points within each sinkhole are extracted. This information is available for more than half of the sinkholes, 58 in the Buriano-Casanova area and 9 in the Poppiano-Volterra concession. For the remaining sinkholes, no measurement points are available.
The analysis of the velocity values allows discovering that sixty percent of the sinkholes (including the areas of influence) present average velocities within the ±10 mm/yr interval. Twenty-eight percent of the sinkholes have average LOS velocities smaller than −20 mm/yr. Only 10% of the sinkholes show average deformation rates smaller than −40 mm/yr; 3 of them exceed −80 mm/yr.
In order to assist the interpretation of the results, the pure evaluation of the average velocity values is associated to the information regarding the age of formation of the sinkholes. The results are presented in Figure 9. The box plot is showing the median, minimum, and maximum values of the LOS velocities of all the measurement points included in the sinkholes of each temporal interval. The graph shows an evident increase of the deformation rates for the most recent sinkholes. The oldest temporal intervals (before 1988) show very similar velocity distributions, with median values around −10 mm/yr. LOS velocities regularly increase until the period 2010–2013, when a strong increase of the maximum velocities is recorded.

5. Discussion

Nowadays, multi-temporal satellite interferometry is a reliable and recognized tool for the assessment of mining-induced ground motion. In this work, MTInSAR was applied for the first time to detect and characterize subsidence in a salt-dissolution mining area in southern Tuscany. Such anthropic activity has a significant impact on the water resources of Saline di Volterra and triggers the formation of several sinkholes that, fortunately, do not affect any built-up area.
Although the impact of ground deformation is, for now, not directly interfering with any human activity, the quantification of the deformation triggered by this mining activity is certainly of interest for the local entities and land planners, considering that only part of the mining concessions is currently exploited. To do so, a target-oriented MTInSAR approach was used to squeeze as much as possible the information contained in the Sentinel-1 images. The processing methodology is “target-oriented” since its goal is to detect in the best way fast deformation, within the technical and intrinsic limitations of the technique. This assumes that sinkholes are likely connected to very high subsidence rates (e.g., [14]), well recognizable from other slow-moving phenomena that characterize the area (i.e., landslides). It is important to maximize the spatial sampling of measurement points and to reduce the temporal baseline of interferograms in order to decrease the aliasing error. The result is a deformation map involving low-coherence radar target where the fast moving areas are well-detected (see Figure 6) or detected as much as technically possible (see Figure 7). The tradeoff is a higher standard deviation of the velocity estimation and the presence of measurement points with uncorrelated signal. It is worth noting that such local-scale approach is clearly not suitable for small-scale mapping activities, where the high point density would negatively impact on the definition of the moving areas, creating too many false positives.
The availability of data for one single orbit can lead to an underestimation of the real velocity vector since the horizontal component cannot be calculated. Anyway, past experiences indicate that the main component of deformation connected to sinkhole formation is vertical [70,71] although other authors report the presence of anomalous strong horizontal component before the sinkhole collapse [72].
The processing approach allowed deriving a high density of measurement points covering the mining concessions around Saline di Volterra. The analysis of the deformation map revealed the presence of several subsidence bowls which are in some cases correspondent to areas where sinkholes have been already formed in the recent past (Figure 8). The formation of sinkholes is quite common where salt dissolution mining is carried out. The high number of phenomena mapped in this area is probably linked to the fact that the salt level is relatively shallow, with cavities formed 150–200 m below surface. This is consistent with other mining areas worldwide. As stated by Warren [2], the presence of caverns below 150 m can “lead to catastrophic chimneying and stoping in sediments above cavity.” The same author adds that “with deeper operations the land surface tends to subside into a bowl of subsidence.” The temporal occurrence of sinkholes is certainly linked to the mining expansion over time. Figure 3 and Figure S1 well visualize the relationship between sinkhole formation and mining activity, assuming the existence of a lag time between the end of the salt extraction at a certain depth and the formation of the sinkhole. Such lag time is difficult to estimate without the availability of additional subsurface data.
A detailed analysis of the distribution of LOS velocities and time series of selected measurement points was carried out within some selected subsidence bowls. As it is expected, the spatial pattern of the LOS velocity is common for all the bowl. LOS velocities greatly increase through the center of the subsidence area. What differ on a case basis is the deformation trend of the measurement points within each bowl (Figure 6 and Figure 7). The time series can be classified in (i) linear, (ii) bilinear with an acceleration in the last part of the monitored period, and iii) bilinear with a deceleration in the last part of the monitored period. The first case is consistent with subsidence bowls where no sinkholes have been formed yet (area A in Figure 6), whereas a deceleration in the last part of the monitored period is registered where well-developed sinkholes have been formed in the last 10 years (area B in Figure 6). A bilinear trend with a final (and sometimes strong) acceleration is registered by the measurement points of the Poppiano-Volterra concession, where the mining activity is the most recent and where just a few small sinkholes were mapped. It is worth mentioning that the older the sinkhole, the lower the deformation rates in its surroundings (Figure 9). We postulate that the oldest sinkholes have reached the maximum expansion allowed by the local hydrogeological and geological conditions, also following the abandonment of the oldest mining concessions. Unfortunately, the availability of subsurface data is extremely limited and the access to the area is restricted, preventing the possibility to perform field surveys or to collect ground monitoring data useful for interferometric data validation.

6. Conclusions

This paper presented a local-scale application of multi-temporal satellite interferometry targeting a solution mining area in southern Tuscany. The surroundings of Saline di Volterra host several brine wells that pump water into a salt level at a depth ranging between 60 and 400 m below surface. The mining activity has a relevant environmental impact in terms of depletion of the water resources and in terms of ground motion, creating several sinkholes which were mapped through multi-temporal analysis of orthophotos.
The deformation map, obtained through the analysis of Sentinel-1 images, revealed the presence of several subsidence bowls, sometimes corresponding to sinkholes formed in the recent past. The subsidence bowls have a common deformation pattern, with LOS velocities increasing forward the center of the bowl. The temporal evolution of the measurement points can vary a lot on case basis. Finally, a correlation between LOS velocities and age of formation of sinkholes is found.
Although with some uncertainties, the processing approach presented in this paper was able to detect fast deformation rates that are usually puzzling to solve in mining areas. This detailed scale and target-oriented approach demonstrated its capability to provide useful information in terms of density of measurement points and quality of the time series. A future evolution of this work could be further analyses that involve the decrease of the temporal frequency of data processing and its application in other mining contexts, going forward to the creation of a monitoring system based on satellite interferometric data.

Supplementary Materials

The following are available online at https://www.mdpi.com/2072-4292/12/23/3919/s1, Figure S1: Multi-temporal mining expansion in the area of Saline di Volterra. Figure S2: sinkhole evolution in the area of Buriano-Casanova. Figure S3: sinkhole evolution in the area of Poppiano-Volterra.

Author Contributions

Conceptualization, L.S. and R.M.; methodology, A.B. and O.M.; software, A.B., O.M. and M.C.; writing—original draft preparation, L.S.; writing—review and editing, R.M, A.B., O.M., S.B., M.C.; supervision, M.C. All authors have read and agreed to the published version of the manuscript.

Funding

This research received no external funding.

Acknowledgments

This work was partially funded by the Spanish Ministry of Economy and Competitiveness through the DEMOS project “Deformation monitoring using Sentinel-1 data” (Ref: CGL2017-83,704-P).

Conflicts of Interest

The authors declare no conflict of interest.

References

  1. Bell, F.G.; Stacey, T.R.; Genske, D.D. Mining subsidence and its effect on the environment: Some differing examples. Environ. Geol. 2000, 40, 135–152. [Google Scholar] [CrossRef]
  2. Warren, J.K. Solution mining and salt cavern usage. In Evaporites; Warren, J.K., Ed.; Springer International Publishing: Cham, Switzerland, 2016; Volume 1, pp. 1303–1374. [Google Scholar]
  3. Neal, J.T. Prediction of subsidence resulting from creep closure of solutioned-mined caverns in salt domes. In Proceedings of the 4th International Symposium on Land Subsidence, Houston, TX, USA, 12–17 May 1991; Johnson, I.A., Ed.; LAHS Publications: Houston, TX, USA, 1991; pp. 225–234. Available online: http://hydrologie.org/redbooks/a200/iahs_200_0225.pdf (accessed on 28 April 2020).
  4. Martínez, J.D.; Johnson, K.S.; Neal, J.T. Sinkholes in evaporite rocks. Am. Sci. 1998, 86, 39–52. [Google Scholar] [CrossRef]
  5. Whyatt, J.; Varley, F. Catastrophic failures of underground evaporite mines. In Proceedings of the 27th International Conference on Ground Control in Mining, Morgantown, WV, USA, 29–31 July 2008; Peng, S.S., Mark, C., Finfinger, G.L., Tadolini, S.C., Khair, A.W., Heasley, K., Luo, Y., Eds.; West Virginia University: Morgantown, WV, USA, 2008; pp. 29–31. [Google Scholar]
  6. Gisotti, G. Case of induced subsidence for extraction of salt by hydrosolution. In Proceedings of the 4th International Symposium on Land Subsidence, Houston, TX, USA, 12–17 May 1991; Johnson, I.A., Ed.; LAHS Publications: Houston, TX, USA, 1991; pp. 225–234. Available online: http://hydrologie.org/redbooks/a200/iahs_200_0235.pdf (accessed on 28 April 2020).
  7. Guarascio, M. Microseismic monitoring of solution mining cavities. In Proceedings of the Twentieth International Symposium on the Application of Computers and Mathematics in the Mineral Industries, Johannesburg, South Africa, 19–23 October 1987; Lemmer, I.C., Schaum, H., Camisani-Calzolari, F.A.G.M., Eds.; South African Institute of Mining and Metallurgy: Johannesburg, South Africa, 1987; Volume 1, pp. 49–54. [Google Scholar]
  8. Garlicki, A. Solution mining of Miocene salts in Poland and its environmental impact. In Proceedings of the Seventh Symposium on Salt, Kyoto, Japan, 6–9 April 1992; Kakihana, H., Hoshi, T., Eds.; Elsevier Science Publisher BV: Amsterdam, The Netherlands, 1993; Volume 1, pp. 419–424. [Google Scholar]
  9. Perski, Z.; Hanssen, R.; Wojcik, A.; Wojciechowski, T. InSAR analyses of terrain deformation near the Wieliczka Salt Mine, Poland. Eng. Geol. 2009, 106, 58–67. [Google Scholar] [CrossRef]
  10. Mancini, F.; Stecchi, F.; Gabbianelli, G. GIS-based assessment of risk due to salt mining activities at Tuzla (Bosnia and Herzegovina). Eng. Geol. 2009, 109, 170–182. [Google Scholar] [CrossRef]
  11. Mancini, F.; Stecchi, F.; Zanni, M.; Gabbianelli, G. Monitoring ground subsidence induced by salt mining in the city of Tuzla (Bosnia and Herzegovina). Environ. Geol. 2009, 58, 381–389. [Google Scholar] [CrossRef]
  12. Stecchi, F.; Antonellini, M.; Gabbianelli, G. Curvature analysis as a tool for subsidence-related risk zones identification in the city of Tuzla (BiH). Geomorphology 2009, 107, 316–325. [Google Scholar] [CrossRef]
  13. Buffet, A. The collapse of Compagnie des Salins SG4 and SG5 drillings. In Proceedings of the Solution Mining Research Institute Fall Meeting, Rome, Italy, 4–7 October 1998; pp. 79–105. [Google Scholar]
  14. Raucoules, D.; Maisons, C.; Carnec, C.; Le Mouelic, S.; King, C.; Hosford, S. Monitoring of slow ground deformation by ERS radar interferometry on the Vauvert salt mine (France): Comparison with ground-based measurement. Remote Sens. Environ. 2003, 88, 468–478. [Google Scholar] [CrossRef]
  15. Zamfirescu, F.; Mocuta, M.; Constantinecu, T.; Medves, E.; Danchiv, A. The main causes of a geomechanical accident of brine caverns at field II of Ocnele Mari-Romania. Mater. Geoenviron. 2003, 50, 431–434. [Google Scholar]
  16. Balteanu, D.; Enciu, P.; Deak, G. A large scale collapse in the Ocnele Mari salt mine field, Getic Subcarpathians, Romania. Studia Geomorphol. Carpatho Balc. 2006, 40, 119–126. [Google Scholar]
  17. Poenaru, V.D.; Badea, A.; Savin, E.; Teleaga, D.; Poncos, V. Land degradation monitoring in the Ocnele Mari salt mining area using satellite imagery. In Earth Resources and Environmental Remote Sensing/GIS Applications II; Michel, U., Civco, D.L., Eds.; International Society for Optics and Photonics: Bellingham, WA, USA, 2011; Volume 8181, p. 81810. [Google Scholar]
  18. Galloway, D.; Jones, D.R.; Ingebritsen, S.E. Land Subsidence in the United States; US Geological Survey: Denver, CO, USA, 1999; pp. 1–177.
  19. Johnson, K.S. Subsidence hazards due to evaporite dissolution in the United States. Environ. Geol. 2005, 48, 395–409. [Google Scholar] [CrossRef]
  20. Amelung, F.; Galloway, D.L.; Bell, J.W.; Zebker, H.A.; Laczniak, R.J. Sensing the ups and downs of Las Vegas: InSAR reveals structural control of land subsidence and aquifer-system deformation. Geology 1999, 27, 483–486. [Google Scholar] [CrossRef]
  21. Chaussard, E.; Wdowinski, S.; Cabral-Cano, E.; Amelung, F. Land subsidence in central Mexico detected by ALOS InSAR time-series. Remote Sens. Environ. 2014, 140, 94–106. [Google Scholar] [CrossRef]
  22. Qu, F.; Zhang, Q.; Lu, Z.; Zhao, C.; Yang, C.; Zhang, J. Land subsidence and ground fissures in Xi’an, China 2005–2012 revealed by multi-band InSAR time-series analysis. Remote Sens. Environ. 2014, 155, 366–376. [Google Scholar] [CrossRef]
  23. Palamara, D.R.; Nicholson, M.; Flentje, P.; Baafi, E.; Brassington, G.M. An evaluation of airborne laser scan data for coalmine subsidence mapping. Int. J. Remote Sens. 2007, 28, 3181–3203. [Google Scholar] [CrossRef]
  24. Zhou, D.; Wu, K.; Chen, R.; Li, L. GPS/terrestrial 3D laser scanner combined monitoring technology for coal mining subsidence: A case study of a coal mining area in Hebei, China. Nat. Hazards 2014, 70, 1197–1208. [Google Scholar] [CrossRef]
  25. Ge, Y.; Tang, H.; Gong, X.; Zhao, B.; Lu, Y.; Chen, Y.; Lin, Z.; Chen, H.; Qiu, Y. Deformation monitoring of earth fissure hazards using terrestrial laser scanning. Sensors 2019, 19, 1463. [Google Scholar] [CrossRef] [Green Version]
  26. Jing-Xiang, G.; Hong, H. Advanced GNSS technology of mining deformation monitoring. Procedia Earth Planet Sci. 2009, 1, 1081–1088. [Google Scholar] [CrossRef] [Green Version]
  27. Ustun, A.; Tusat, E.; Yalvac, S. Preliminary results of land subsidence monitoring project in Konya Closed Basin between 2006–2009 by means of GNSS observations. Nat. Hazards Earth Syst. Sci. 2010, 10, 1151. [Google Scholar] [CrossRef] [Green Version]
  28. Argyrakis, P.; Ganas, A.; Valkaniotis, S.; Tsioumas, V.; Sagias, N.; Psiloglou, B. Anthropogenically induced subsidence in Thessaly, central Greece: New evidence from GNSS data. Nat. Hazards 2020, 102, 1–22. [Google Scholar] [CrossRef]
  29. Przyłucka, M.; Herrera, G.; Graniczny, M.; Colombo, D.; Béjar-Pizarro, M. Combination of conventional and advanced DInSAR to monitor very fast mining subsidence with TerraSAR-X Data: Bytom City (Poland). Remote Sens. 2015, 7, 5300–5328. [Google Scholar] [CrossRef] [Green Version]
  30. Yang, Z.; Li, Z.; Zhu, J.; Yi, H.; Hu, J.; Feng, G. Deriving dynamic subsidence of coal mining areas using InSAR and logistic model. Remote Sens. 2017, 9, 125. [Google Scholar] [CrossRef] [Green Version]
  31. Du, Z.; Ge, L.; Ng, A.H.M.; Li, X. Investigation on mining subsidence over Appin–West Cliff Colliery using time-series SAR interferometry. Int. J. Remote Sens. 2018, 39, 1528–1547. [Google Scholar] [CrossRef]
  32. Malinowska, A.A.; Witkowski, W.T.; Hejmanowski, R.; Chang, L.; Van Leijen, F.J.; Hanssen, R.F. Sinkhole occurrence monitoring over shallow abandoned coal mines with satellite-based persistent scatterer interferometry. Eng. Geol. 2019, 262, 105336. [Google Scholar] [CrossRef]
  33. López-Vinielles, J.; Ezquerro, P.; Fernández-Merodo, J.A.; Béjar-Pizarro, M.; Monserrat, O.; Barra, A.; Blanco, P.; García-Robles, J.; Filatov, A.; García-Davalillo, J.C.; et al. Remote analysis of an open-pit slope failure: Las Cruces case study, Spain. Landslides 2020, 1–16. [Google Scholar] [CrossRef]
  34. Pawluszek-Filipiak, K.; Borkowski, A. Monitoring mining-induced subsidence by integrating differential radar interferometry and persistent scatterer techniques. Eur. J. Remote Sens. 2020, 1–13. [Google Scholar] [CrossRef]
  35. Kim, J.W.; Lu, Z.; Degrandpre, K. Ongoing deformation of sinkholes in Wink, Texas, observed by time-series Sentinel-1a SAR interferometry (preliminary results). Remote Sens. 2016, 8, 313. [Google Scholar] [CrossRef] [Green Version]
  36. Baer, G.; Magen, Y.; Nof, R.N.; Raz, E.; Lyakhovsky, V.; Shalev, E. InSAR measurements and viscoelastic modeling of sinkhole precursory subsidence: Implications for sinkhole formation, early warning, and sediment properties. J. Geophys. Res. Earth Surf. 2018, 123, 678–693. [Google Scholar] [CrossRef]
  37. Galve, J.P.; Castañeda, C.; Gutiérrez, F. Railway deformation detected by DInSAR over active sinkholes in the Ebro Valley evaporite karst, Spain. Nat. Hazards Earth Syst. Sci. 2015, 15, 2439–2448. [Google Scholar] [CrossRef] [Green Version]
  38. Theron, A.; Engelbrecht, J. The role of Earth observation, with a focus on SAR interferometry, for sinkhole hazard assessment. Remote Sens. 2018, 10, 1506. [Google Scholar] [CrossRef] [Green Version]
  39. Crosetto, M.; Monserrat, O.; Cuevas-González, M.; Devanthéry, N.; Crippa, B. Persistent scatterer interferometry: A review. ISPRS J. Photogramm. Remote Sens. 2016, 115, 78–89. [Google Scholar] [CrossRef] [Green Version]
  40. Samieie-Esfahany, S.; Hanssen, R.; Van Thienen-Visser, K.; Muntendam-Bos, A. On the effect of horizontal deformation on InSAR subsidence estimates. In Proceedings of the Fringe 2009 Workshop, Frascati, Italy, 30 November–4 December 2009; Lacoste-Francis, H., Ed.; ESA Communications ESTEC: Noordwijk, The Netherlands, 2009; Volume 30. [Google Scholar]
  41. Gee, D.; Sowter, A.; Grebby, S.; De Lange, G.; Athab, A.; Marsh, S. National geohazards mapping in Europe: Interferometric analysis of The Netherlands. Eng. Geol. 2019, 256, 1–22. [Google Scholar] [CrossRef]
  42. Liu, X.; Xing, X.; Wen, D.; Chen, L.; Yuan, Z.; Liu, B.; Tan, J. Mining-induced time-series deformation investigation based on SBAS-InSAR technique: A case study of drilling water solution rock salt mine. Sensors 2019, 19, 5511. [Google Scholar] [CrossRef] [PubMed] [Green Version]
  43. Mura, J.C.; Paradella, W.R.; Gama, F.F.; Silva, G.G.; Galo, M.; Camargo, P.O.; Silva, A.Q.; Silva, A. Monitoring of non-linear ground movement in an open pit iron mine based on an integration of advanced DInSAR techniques using TerraSAR-X data. Remote Sens. 2016, 8, 409. [Google Scholar] [CrossRef] [Green Version]
  44. Wang, S.; Lu, X.; Chen, Z.; Zhang, G.; Ma, T.; Jia, P.; Li, B. Evaluating the feasibility of illegal open-pit mining identification using insar coherence. Remote Sens. 2020, 12, 367. [Google Scholar] [CrossRef] [Green Version]
  45. Bianchini, S.; Del Soldato, M.; Solari, L.; Nolesini, T.; Pratesi, F.; Moretti, S. Badland susceptibility assessment in Volterra municipality (Tuscany, Italy) by means of GIS and statistical analysis. Environ. Earth Sci. 2016, 75, 1–14. [Google Scholar] [CrossRef]
  46. Tuscany Region WMS Service. Available online: http://www502.regione.toscana.it/geoscopio/servizi/wms/OFC.htm (accessed on 8 September 2020).
  47. Patacca, E.; Sartori, R.; Scandone, P. Tyrrhenian basin and Apenninic arcs: Kinematic relations since late Tortonian times. Mem. Soc. Geol. It. 1990, 45, 425–451. [Google Scholar]
  48. Testa, G.; Lugli, S. Gypsum–anhydrite transformations in Messinian evaporites of central Tuscany (Italy). Sediment Geol. 2000, 130, 249–268. [Google Scholar] [CrossRef]
  49. Speranza, G.; Vona, A.; Vinciguerra, S.; Romano, C. Relating natural heterogeneities and rheological properties of rocksalt: New insights from microstructural observations and petrophyisical parameters on Messinian halites from the Italian Peninsula. Tectonophysics 2016, 666, 103–120. [Google Scholar] [CrossRef] [Green Version]
  50. Nicolich, R.; Primiero, A.; Zgur, F.; Di Marzo, N. 3D seismic imaging and numerical modelling of subsidence in solution mining of rocksalt. In Proceedings of the 64th EAGE Conference & Exhibition, Florence, Italy, 27–30 May 2002; European Association of Geoscientists & Engineers: Houton, The Netherlands, 2002. [Google Scholar]
  51. Burgalassi, D.; Cheli, B.; Luzzati, T.; Del Soldato, V.; Freschi, E. Analisi delle ricadute ambientali della Solvay sul territorio della Val di Cecina. In La Solvay e in Val di Cecina: Ricadute Socio-Economiche e Ambientali di Una Grande Industria Chimica sul Suo Territorio; Cheli, B., Luzzati, T., Eds.; Edizioni Plus srl: Pisa, Italy, 2010; pp. 145–217. (In Italian) [Google Scholar]
  52. Speranza, G.; Cosentino, D.; Tecce, F.; Faccenna, C. Paleoclimate reconstruction during the Messinian evaporative drawdown of the Mediterranean Basin: Insights from microthermometry on halite fluid inclusions. Geochem. Geophys. Geosyst. 2013, 14, 5054–5077. [Google Scholar] [CrossRef]
  53. Italian Geological Map (1:50000 Nominal Scale). Available online: https://www.isprambiente.gov.it/Media/carg/note_illustrative/295_Pomarance.pdf (accessed on 1 September 2020).
  54. Nannoni, R.; Capperi, M. Miniere e Minerali della Val di Cecina; Gruppo Mineralogico Cecinese, Tipografie Grafiche Favillini: Livorno, Italy, 1989; p. 68. (In Italian) [Google Scholar]
  55. Johnson, K.S. Land subsidence above man-made salt-dissolution cavities. In Land Subsidence Case Studies and Current Research: Proceedings of the Dr. Joseph, F. Poland Symposium on Land Subsidence; Borcher, J.W., Ed.; Association of Engineering Geologists Special Publication: Belmont, CA, USA, 1998; Volume 8, pp. 385–392. [Google Scholar]
  56. Tuscany Region Environmental Agency (ARPAT). Quadro Conoscitivo Ambientale degli Insediamenti Solvay Nelle Province di Pisa e Livorno (2000–2005); Technical Report; Tuscany Region Environmental Agency (ARPAT): Firenze, Italy, 2006. (In Italian) [Google Scholar]
  57. Pinna, S. Rischi Ambientali e Difesa del Territorio; Franco Angeli Edizioni: Milan, Italy, 2002; p. 176. (In Italian) [Google Scholar]
  58. Tuscany Region Environmental Agency. The Environmental Impact of Salt Dissolution Mining in Saline di Volterra. Available online: http://www.arpat.toscana.it/notizie/arpatnews/2013/174-13/174-13-gli-impatti-ambientali-nelle-attivita-minerarie-connesse-alla-coltivazione-del-salgemma (accessed on 20 August 2020).
  59. Devanthéry, N.; Crosetto, M.; Monserrat, O.; Cuevas-González, M.; Crippa, B. An approach to persistent scatterer interferometry. Remote Sens. 2014, 6, 6662–6679. [Google Scholar] [CrossRef] [Green Version]
  60. Rosen, P.A.; Hensley, S.; Joughin, I.R.; Li, F.K.; Madsen, S.N.; Rodriguez, E.; Goldstein, R.M. Synthetic aperture radar interferometry. Proc. IEEE 2000, 88, 333–382. [Google Scholar] [CrossRef]
  61. Shuttle Radar Topography Mission (SRTM) 1 Arc-Second Global, Product Description. Available online: https://www.usgs.gov/centers/eros/science/usgs-eros-archive-digital-elevation-shuttle-radar-topography-mission-srtm-1-arc?qt-science_center_objects=0#qt-science_center_objects (accessed on 6 November 2020).
  62. Sentinels-POD-team. Sentinels POD Service File Format Specifications; Technical Report nº GMES-GSEGEOPGFS-10-0075; European Space Agency: Paris, France, 2013. [Google Scholar]
  63. Gomba, G.; Parizzi, A.; De Zan, F.; Eineder, M.; Bamler, R. Toward operational compensation of ionospheric effects in SAR interferograms: The split-spectrum method. IEEE Trans. Geosci. Remote 2015, 54, 1446–1461. [Google Scholar] [CrossRef] [Green Version]
  64. Crosetto, M.; Monserrat, O.; Cuevas, M.; Crippa, B. Spaceborne differential SAR interferometry: Data analysis tools for deformation measurement. Remote Sens. 2011, 3, 305–318. [Google Scholar] [CrossRef] [Green Version]
  65. Costantini, M. A novel phase unwrapping method based on network programming. IEEE Trans. Geosci. Remote. 1998, 36, 813–821. [Google Scholar] [CrossRef]
  66. Raspini, F.; Bianchini, S.; Ciampalini, A.; Del Soldato, M.; Solari, L.; Novali, F.; Del Conte, S.; Rucci, A.; Ferretti, A.; Casagli, N. Continuous, semi-automatic monitoring of ground deformation using Sentinel-1 satellites. Sci Rep. 2018, 8, 1–11. [Google Scholar] [CrossRef] [Green Version]
  67. Bianchini, S.; Solari, L.; Casagli, N. A gis-based procedure for landslide intensity evaluation and specific risk analysis supported by persistent scatterers interferometry (PSI). Remote Sens. 2017, 9, 1093. [Google Scholar] [CrossRef] [Green Version]
  68. Barra, A.; Solari, L.; Béjar-Pizarro, M.; Monserrat, O.; Bianchini, S.; Herrera, G.; Crosetto, M.; Sarro, R.; González-Alonso, E.; Mateos, R.M.; et al. A methodology to detect and update active deformation areas based on sentinel-1 SAR images. Remote Sens. 2017, 9, 1002. [Google Scholar] [CrossRef] [Green Version]
  69. Navarro, J.A.; Tomás, R.; Barra, A.; Pagán, J.I.; Reyes-Carmona, C.; Solari, L.; Vinnieles, J.L.; Falco, S.; Crosetto, M. ADAtools: Automatic detection and classification of active deformation areas from PSI displacement maps. ISPRS Int. J. Geo Inf. 2020, 9, 584. [Google Scholar] [CrossRef]
  70. Paine, J.G.; Buckley, S.M.; Collins, E.W.; Wilson, C.R. Assessing collapse risk in evaporite sinkhole-prone areas using microgravimetry and radar interferometry. J. Environ. Eng. Geophys. 2012, 17, 75–87. [Google Scholar] [CrossRef] [Green Version]
  71. Nof, R.N.; Baer, G.; Ziv, A.; Raz, E.; Atzori, S.; Salvi, S. Sinkhole precursors along the Dead Sea, Israel, revealed by SAR interferometry. Geology 2013, 41, 1019–1022. [Google Scholar] [CrossRef]
  72. Jones, C.E.; Blom, R.G. Bayou Corne, Louisiana, sinkhole: Precursory deformation measured by radar interferometry. Geology 2014, 42, 111–114. [Google Scholar] [CrossRef]
Figure 1. Localization of the area of interest and of the mining concessions in the surroundings of Saline di Volterra in the Volterra Municipality. The background image is a 20 cm AGEA orthophoto (from [46]).
Remotesensing 12 03919 g001
Figure 2. Geological map of the study area. From the Geological Map of Italy, 1:50.000 scale, Sheet 295-Pomarance [53].
Remotesensing 12 03919 g002
Figure 3. Sinkholes catalogue for the mining concessions of Buriano-Casanova (a) and Poppiano-Volterra (b). The background image is an AGEA 2018 orthophoto (Table 1). The distribution of boreholes for temporal periods is presented in inset c. Sinkholes with contour variations are counted as their first appearance.
Remotesensing 12 03919 g003
Figure 4. Workflow of the processing approach. ITFs, interferograms; HF, high frequency; LF, low frequency.
Remotesensing 12 03919 g004
Figure 5. Sentinel-1-derived deformation map for the area of interest. The black dot is the reference point, located in the stable area of the Saline di Volterra village. The white contours are the two target areas. The two black square represent the two areas with the highest deformation rates (1, Buriano-Casanova, part of the Buriano deformation area; 2, Poppiano-Volterra, part of the Poppiano deformation area) which are the focus of the next two sections. The background image is an ESRI World Image.
Remotesensing 12 03919 g005
Figure 6. (a) Deformation map for the high deformation area of Buriano-Casanova. A and B are the two subsidence bowls with the highest deformation rates: the first with no signs of sinkhole development, the second with a well-developed sinkhole expanding over time (see inset b, whose location is indicated by the blue square). Numbers 1 to 6 indicate areas where the time series of insets (c) and (d) have been extracted. The background image of inset (a) is an ESRI World Image. Inset (b) image is a Google Earth imagery.
Remotesensing 12 03919 g006
Figure 7. (a) Deformation map for the mining area of Poppiano-Volterra. Numbers 1 to 6 indicate areas where the time series of inset (b) have been extracted. The background image of inset (a) is an ESRI World Image.
Remotesensing 12 03919 g007
Figure 8. Spatial distribution of sinkholes with respect to the deformation areas extracted from the deformation map presented in Figure 5. The background image is an ESRI World Image.
Remotesensing 12 03919 g008
Figure 9. Box plot showing the variability of the velocity values depending on the time of formation of the sinkholes in the mining concession around Saline di Volterra. The solid line represents the mean value, the stroke within each box plot the median value.
Remotesensing 12 03919 g009
Table 1. Digital orthophotos used to create the multi-temporal sinkhole database.
YearNominal ScaleImage AcquisitionData Owner
19541:10’000Italian Aeronautical Group (GAI)Italian Geographic Military Institute (IGM)
19781:10’000Rossi Brescia AerophotogrammetryTuscany Region
19881:10’000CGR ParmaTuscany Region
19991:10’000CGR ParmaAgricultural Payments Agency (AGEA)
20031:10’000CGR ParmaAgricultural Payments Agency (AGEA)
20071:10’000BLOM-C.G.R.BLOM-C.G.R.
20101:10’000Rossi Brescia AerophotogrammetryAgricultural Payments Agency (AGEA)
20131:10’000BLOM-C.G.R.Agricultural Payments Agency (AGEA)
20181:5’000BLOM-C.G.R.Agricultural Payments Agency (AGEA)
Publisher’s Note: MDPI stays neutral with regard to jurisdictional claims in published maps and institutional affiliations.

