Article

Detection of Undocumented Building Constructions from Official Geodata Using a Convolutional Neural Network

1
Signal Processing in Earth Observation (Sipeo), Technical University of Munich (TUM), 80333 Munich, Germany
2
Remote Sensing Technology Institute (IMF), German Aerospace Center (DLR), 82234 Wessling, Germany
3
Remote Sensing Technology (LMF), Technical University of Munich (TUM), 80333 Munich, Germany
4
Bavarian Agency for Digitization, High-Speed Internet and Surveying (LDBV), 80538 Munich, Germany
5
Department of Geoinformatics, Munich University of Applied Sciences, 80333 Munich, Germany
*
Author to whom correspondence should be addressed.
Remote Sens. 2020, 12(21), 3537; https://doi.org/10.3390/rs12213537
Submission received: 27 September 2020 / Revised: 21 October 2020 / Accepted: 23 October 2020 / Published: 28 October 2020
(This article belongs to the Special Issue Optical Remote Sensing Applications in Urban Areas)

Abstract

:
Undocumented building constructions are buildings or stories that were built years ago, but are missing in the official digital cadastral maps (DFK). The detection of undocumented building constructions is essential to urban planning and monitoring. The state of Bavaria, Germany, uses two semi-automatic detection methods for this task that suffer from a high false alarm rate. To solve this problem, we propose a novel framework to detect undocumented building constructions using a Convolutional Neural Network (CNN) and official geodata, including high resolution optical data and the Normalized Digital Surface Model (nDSM). More specifically, an undocumented building pixel is labeled as “building” by the CNN but does not overlap with a building polygon of the DFK. The class of old or new undocumented building can be further separated when a Temporal Digital Surface Model (tDSM) is introduced in the stage of decision fusion. In a further step, undocumented story construction is detected as the pixels that are “building” in both DFK and predicted results from CNN, but shows a height deviation from the tDSM. By doing so, we have produced a seamless map of undocumented building constructions for one-quarter of the state of Bavaria, Germany at a spatial resolution of 0.4 m, which has proved that our framework is robust to detect undocumented building constructions at large-scale. Considering that the official geodata exploited in this research is advantageous because of its high quality and large coverage, a transferability analysis experiment is also designed in our research to investigate the sampling strategies for building detection at large-scale. Our results indicate that building detection results in unseen areas at large-scale can be improved when training samples are collected from different districts. In an area where training samples are available, local training sampless collection and training can save much time and effort.

Graphical Abstract

1. Introduction

The creation and maintenance of databases of buildings have numerous applications, which involve urban planning and monitoring as well as three-dimensional (3D) city modeling. In particular, the complete documentation of buildings in official cadastral maps is essential to the transparent management of land properties, which can guarantee the legal and secure acquisition of properties. In Germany, the boundary of a building is acquired through a terrestrial survey by the official authority and then a two-dimensional (2D) ground plan of buildings is documented in the official cadastral map, which is known as the digital cadastral map (DFK).
However, due to the lack of information from owners about some building construction projects, some building constructions are never recorded via terrestrial surveying and are thus missing in the DFK. These building constructions are called undocumented building constructions, and include both undocumented buildings and undocumented story construction. Undocumented buildings have two types, old undocumented buildings and new undocumented buildings. Old undocumented buildings are buildings that were constructed many years ago but never recorded in the cadastral maps. New undocumented buildings are buildings that have only recently been erected. In this regard, the building ground plans of both old and new undocumented buildings are missing in the DFK. Both old and new undocumented buildings should be terrestrially surveyed by the official authority, but they may only charge the terrestrial survey fee for new undocumented buildings, due to Germany’s regulations. In undocumented story construction, there are some changes on site, such as a newly built story or story demolition, that were not documented in the records of the official authority. Undocumented story construction will not lead to changes in the DFK, but this information is crucial to updating 3D building models. Therefore, collecting this undocumented building constructions is necessary to continue and complete these databases.
The technologies of airborne imaging and laser scanning show great potential in the task of building detection for nationwide 3D building model derivation [1,2]. The high resolution airborne data sets make detailed analysis of the geospatial targets more convenient and efficient. In the past, identifying undocumented buildings entailed a visual comparison of aerial images from different flying periods with DFK, enabling a comprehensive and timely interactive survey of changes in buildings. However, the visual interpretation of the aerial photos required a great amount of workforce and time.
In order to reduce the amount of work, two semi-automatic strategies are currently used by the state of Bavaria, Germany for the detection of undocumented buildings: the filter-based method [3] and the comparison-based method [4]. Both of these methods first detect buildings in remote sensing data. In the filter-based method, various filters, including a height filter, color filter, noise filter, and geometry filter, are applied to the data to detect the buildings. The comparison-based method detects all buildings with the aid of heuristically defined threshold values for the colors of buildings in the representative RGB color space and for the height in the Normalized Digital Surface Model (nDSM). Then both methods overlay the building detection results on the DFK to identify undocumented buildings. With the help of a Temporal Digital Surface Model (tDSM) derived from two Digital Surface Models (DSMs) in different epochs, new undocumented buildings can be discriminated from old undocumented buildings. Both methods are based on heuristic methods [
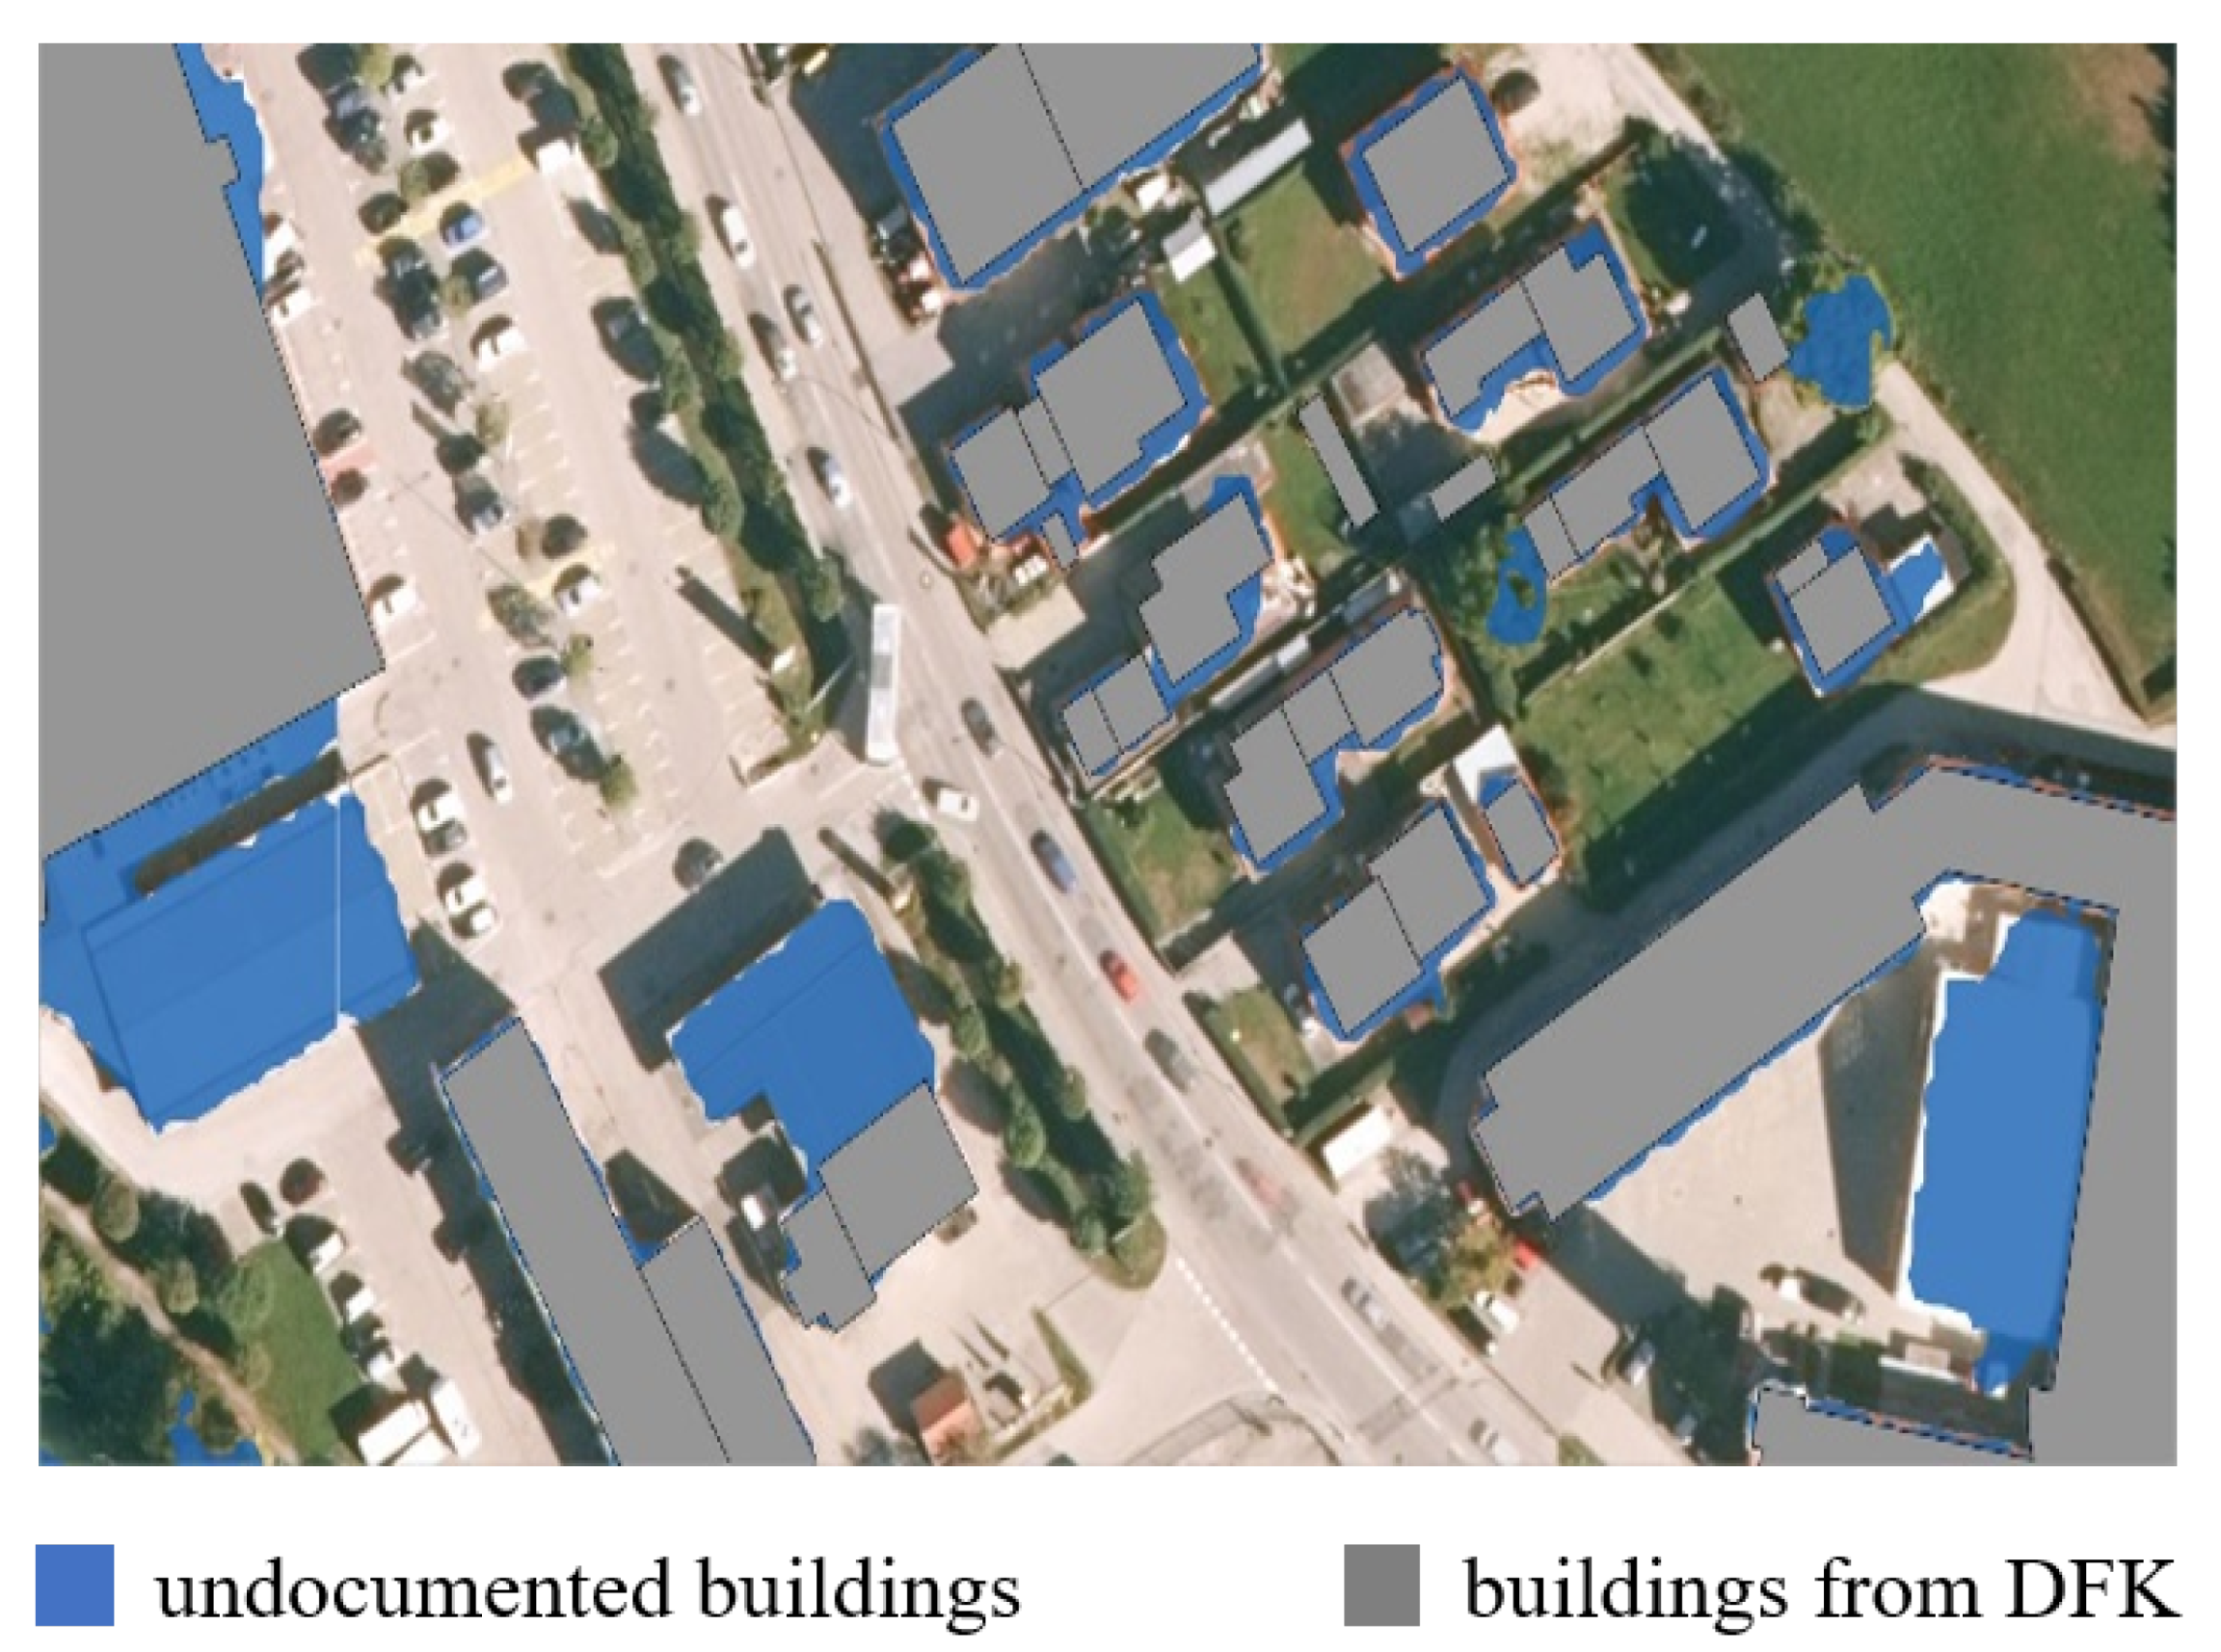
3]. However, the heuristic definition of threshold values is not standardized, and have to be determined individually for different flight campaigns. Therefore, the data covering a large area cannot be processed in a uniform and standardized manner. Moreover, there are many false alarms in the results obtained from these two methods, where vegetation is frequently misclassified as buildings. For instance, the results of undocumented buildings obtained from the filter-based method also involve isolated vegetation (see Figure 1). In addition, these two methods do not provide any evidence of undocumented story construction.
Recently, deep learning methods such as the Convolutional Neural Network (CNN) have been favored by the remote sensing community [5,6] in applications such as land cover classification [7,8], change detection [9,10], multi-label classification [11,12], and human settlement extraction [13,14]. CNN comprises multiple processing layers, which can learn hierarchical feature representations from the input without any prior knowledge. For the task of building detection from remote sensing data, CNN has also proven to achieve remarkable performances that far exceed those of traditional methods [15,16,17]. This is due to their superiority in generalization and accuracy without hand-crafted features. A key ingredient of CNN is training data. The amount of training data can be reduced if the pretrained transferable model is applicable in another unseen area [18], a property that is called transferability [19,20]. However, due to the limited size and quality of existing publicly available data sets, transferability cannot be well investigated in the task of building detection.
In this paper, our unique contributions are three-fold:
(1)
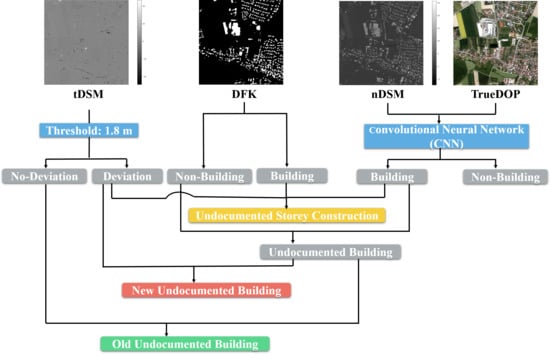
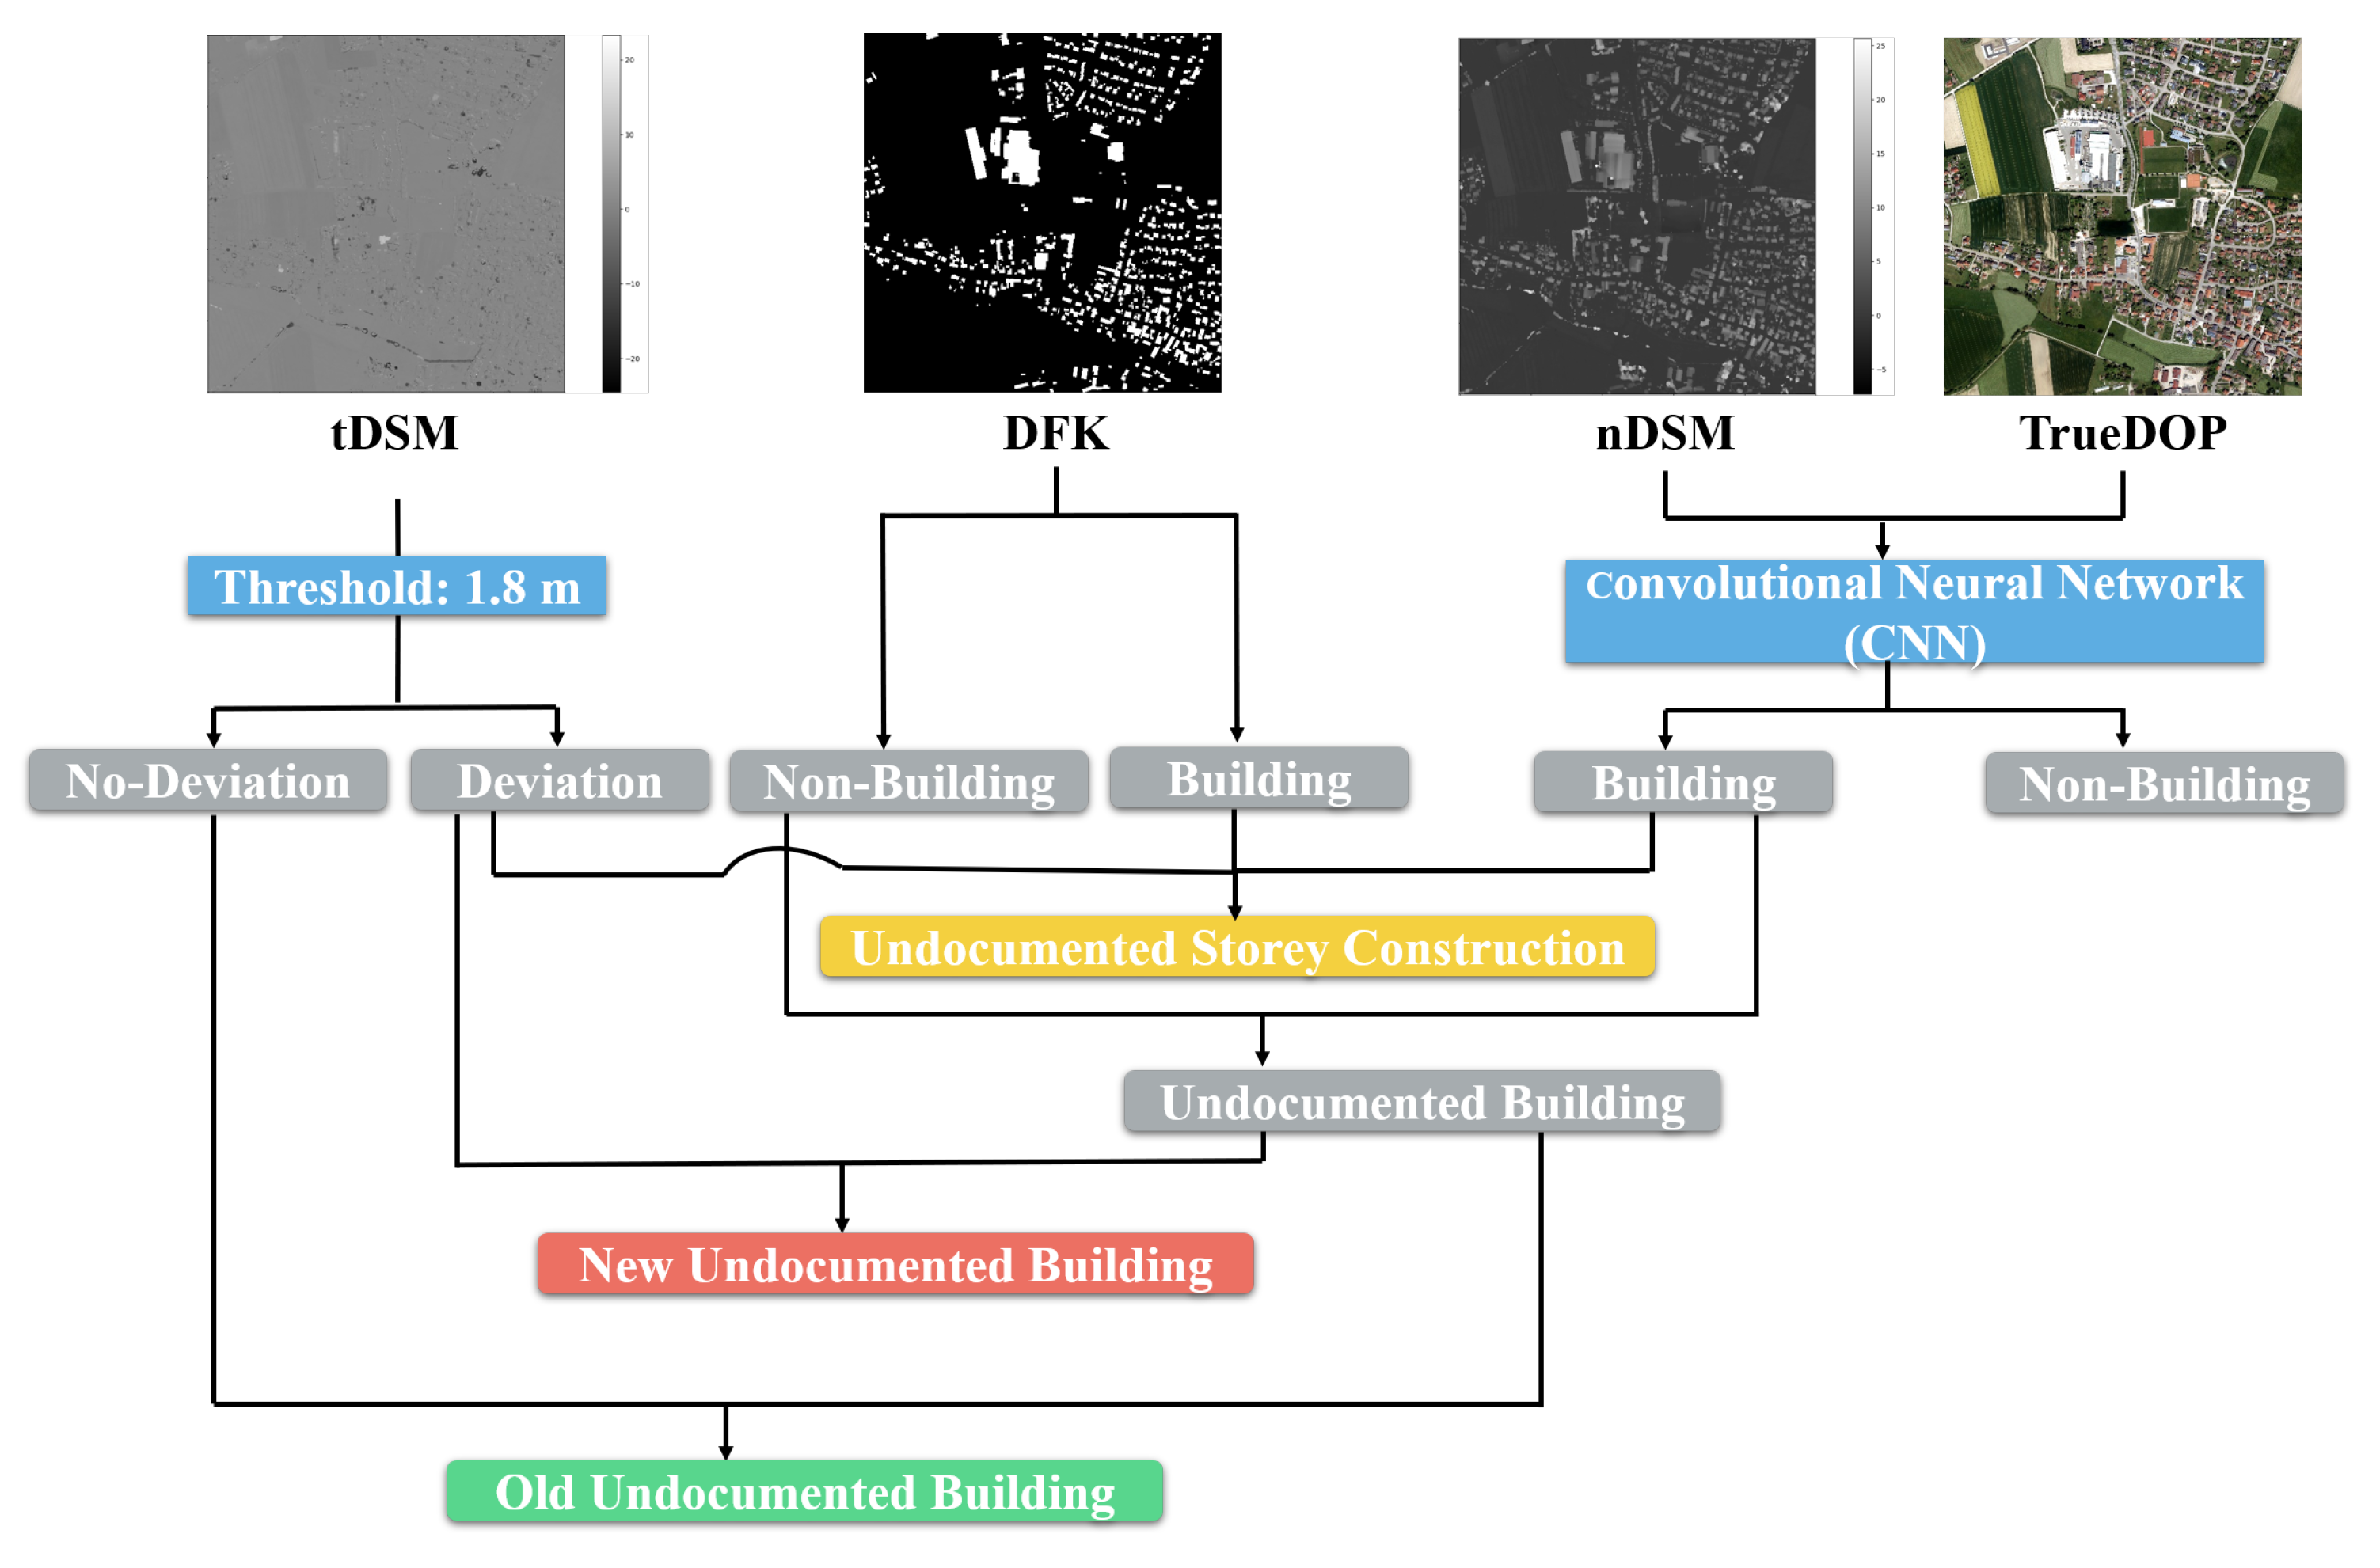
A new framework for the automatic detection of undocumented building constructions is proposed, which has integrated the state-of-the-art CNNs and fully harnessed official geodata. The proposed framework can identify old undocumented buildings, new undocumented buildings, and undocumented story construction according to their year and type of construction. Specifically, a CNN model is firstly exploited for the semantic segmentation of stacked nDSM and orthophoto with RGB bands (TrueDOP) data. Then, this derived binary map of “building” and “non-building” pixels is utilized to identify different types of undocumented building constructions through automatic comparison with the DFK and tDSM.
(2)
Our building detection results are compared with those obtained from two conventional solutions utilized in the state of Bavaria, Germany. With a large collection of reference data, this comparison has statistical sense. Our method can significantly reduce the false alarm rate, which has demonstrated the use of CNN for the robust detection of buildings at large-scale.
(3)
In order to offer insights for similar large-scale building detection tasks, we have investigated the transferability issue and sampling strategies further by using reference data of selected districts in the state of Bavaria, Germany and employing CNNs. It should be noted that this work is in an advanced position to study the practical strategies for the task of large-scale building detection, as we implement such high quality and resolution official geodata at large-scale.
The remainder of the paper is organized as follows: Related work is reviewed in Section 2. The study area and official geodata utilized in this work are described in Section 3. Section 4 details the proposed framework for the detection of undocumented building constructions. The experiments are described in Section 5. The results and discussion are provided in Section 6 and Section 7, respectively. Eventually, Section 8 summarizes this work.

2. Related Work

2.1. Two Conventional Strategies for the Detection of Undocumented Buildings

In the state of Bavaria, Germany, there are two conventional strategies utilized to detect undocumented buildings, the filter-based method [3] and the comparison-based method [4]. For both methods, the detection of undocumented buildings is carried out by first detecting all buildings in the remote sensing data and then identifying undocumented buildings within the DFK by overlaying the results with the DFK. Finally, the detected undocumented buildings are separated into two classes by introducing a tDSM, i.e., they are classified as old undocumented buildings and new undocumented buildings.
The filter-based method detects buildings from remote sensing data based on multiple filters, which include height, color, and geometric filters. Considering that buildings are elevated objects, a “height filter” is first applied in an nDSM, in order to remove all points with height less than an empirically determined threshold. Then, the second filter “color filter” takes the color values of the individual points into account. It is assumed that all pixels belonging to the class “building” are normally distributed in an individual color channels. Thus, the values of the individual color channel from the TrueDOP for each building are calculated to derive a confidence range for the buildings. If the color values of the examined pixel are beyond this confidence range, it will be removed. The Normalized Difference Vegetation Index (NDVI) is then calculated to remove vegetation. The third filter, the “noise filter”, is implemented by comparing its height with neighboring points in a defined area. This is a further separation of those vegetation points. The last filter, the “geometry filter”, recognizes buildings according to their area, the number of breakpoints, the ratio of area to circumference, and elongation (angularity).
In the comparison-based method, all buildings at present are delineated by setting heuristic threshold values based on color and height information. The building footprints from the DFK are first intersected with the TrueDOP to derive the training areas of buildings. Then, the RGB color values from the training areas are collected from the TrueDOP as a reference [4], where the frequency and distribution of the individual RGB combination are utilized in order to separate buildings from vegetation with an empirically chosen threshold. Finally, with the help of the nDSM, incorrect classifications between buildings and other objects such as streets are avoided by an empirically determined height threshold.
In order to minimize the incorrect detection of non-building cases that can be caused by the height noise of the nDSM or by vegetation, the filter-based method utilizes “color filters” and the comparison-based method exploits a RGB cube. However, aerial imaging is carried out with different airplanes and opposite trajectory directions at different times and with different lighting conditions, where the color channels for the same objects can also have varied values. The color values for each individual building are also largely dependent on the amount of current sunlight. Therefore, the confidence range or thresholds are not sufficient to identify buildings. For these two methods, buildings can only be identified through different heuristic thresholds for different districts, which is still not a fully automatic strategy. Furthermore, these two methods do not provide a more detailed type of undocumented building construction case–undocumented story construction.

2.2. Shallow Learning Methods for Building Detection

Building detection is a favored topic in the remote sensing community. Over the past decades, a large number of shallow learning methods have been proposed, which can be summarized into four general types [15]: (1) edge-based, (2) region-based, (3) index-based, and (4) classification-based methods.
The edge-based methods recognize the buildings based on geometric details of buildings. In [21], the edges of buildings are first detected using the edge operator, and then are grouped based on perceptual groupings to construct the boundary of the buildings. In the region-based methods, the region of buildings is identified based on image segmentation methods, using a two-level graph theory framework enhanced by shadow information [22]. The index-based methods indicate the presence of buildings by a number of proposed indices to depict the building features. The morphological building index (MBI) [23] is a building index that extracts buildings automatically, and describes the characteristics of buildings by using multiscale and multidirectional morphological operators. In the classification-based methods, buildings are extracted by feeding the spectral information and spatial features into a classifier to make a prediction. In [24], automatic recognition of buildings is achieved through a Support Vector Machine (SVM) classification of a great quantity of geometric image features.
The shallow learning methods have shown some good results in the task of building detection by combining different spectral, spatial, or auxiliary information or assuming building hypotheses. However, the prior information and hand-crafted features of shallow learning methods make it difficult to achieve generic, robust, and scalable building detection results at large-scale. Moreover, the optimization of parameters in the shallow learning-based methods also leads to inefficiency in processing.

2.3. Deep Learning Methods for Building Detection

Recently, the emergence of deep learning methods, which are based on artificial neural networks, have made strong contributions to the task of building detection. The use of multiple layers in the network allows the automatic learning of representations from raw data. Prior information is not required in deep learning methods for hand-crafted feature design, which indicates that deep learning methods can generalize well over large areas. CNNs are deep learning architectures, that are commonly used and have been exploited as a preferred framework for the task of building detection, as they have demonstrated more powerful generalization capability and better performance than traditional methods [25]. The task of building detection using CNNs is related to the task of semantic segmentation in computer vision, which aims at performing pixel-wise labelling in an image [26]. This indicates that a CNN can assign a class label to every pixel in the image. Different CNN architectures, such as fully convolutional networks (FCN) [27] and encoder-decoder based architectures (e.g., U-Net [28], SegNet [29] and others), are commonly used for the task of semantic segmentation, which outperform shallow learning approaches marginally [30].
FCN is a pioneer work for semantic segmentation that effectively converts popular classification CNN models to generate pixel-level prediction maps with the transposed convolutions. In [31], the spectral and height information from different data sets are combined as the input for FCN to generate building footprints. In addition to FCN, the encoder-decoder based architectures are another popular variant. Spatial resolution has been gradually reduced for highly efficient feature mapping in the encoder, while feature representations are recovered into a full-resolution segmentation map in the decoder. In U-Net, the skip connections, which links the encoder and the decoder, is beneficial to the preservation of the spatial details. Considering that the results of FCN-based methods are sensitive to the size of buildings, the U-Net structure implemented in [32] increases scale invariance of algorithms for the task of building detection. SegNet is another encoder-decoder based architecture, where the max-pooling indices from the encoders are transferred to the corresponding decoders. By reusing max-pooling indices, SegNet requires less memory than U-Net. In [25], SegNet is exploited to produce the first seamless building footprint map of America at the spatial resolution of 1 m. Currently, FC-DenseNet [33] is a favoured method among different CNN architectures for the semantic segmentation of geospatial scenes, and is superior to many other networks in accuracy [17,34] due to its better feature extraction capability [16].

3. Study Area and Official GeoData

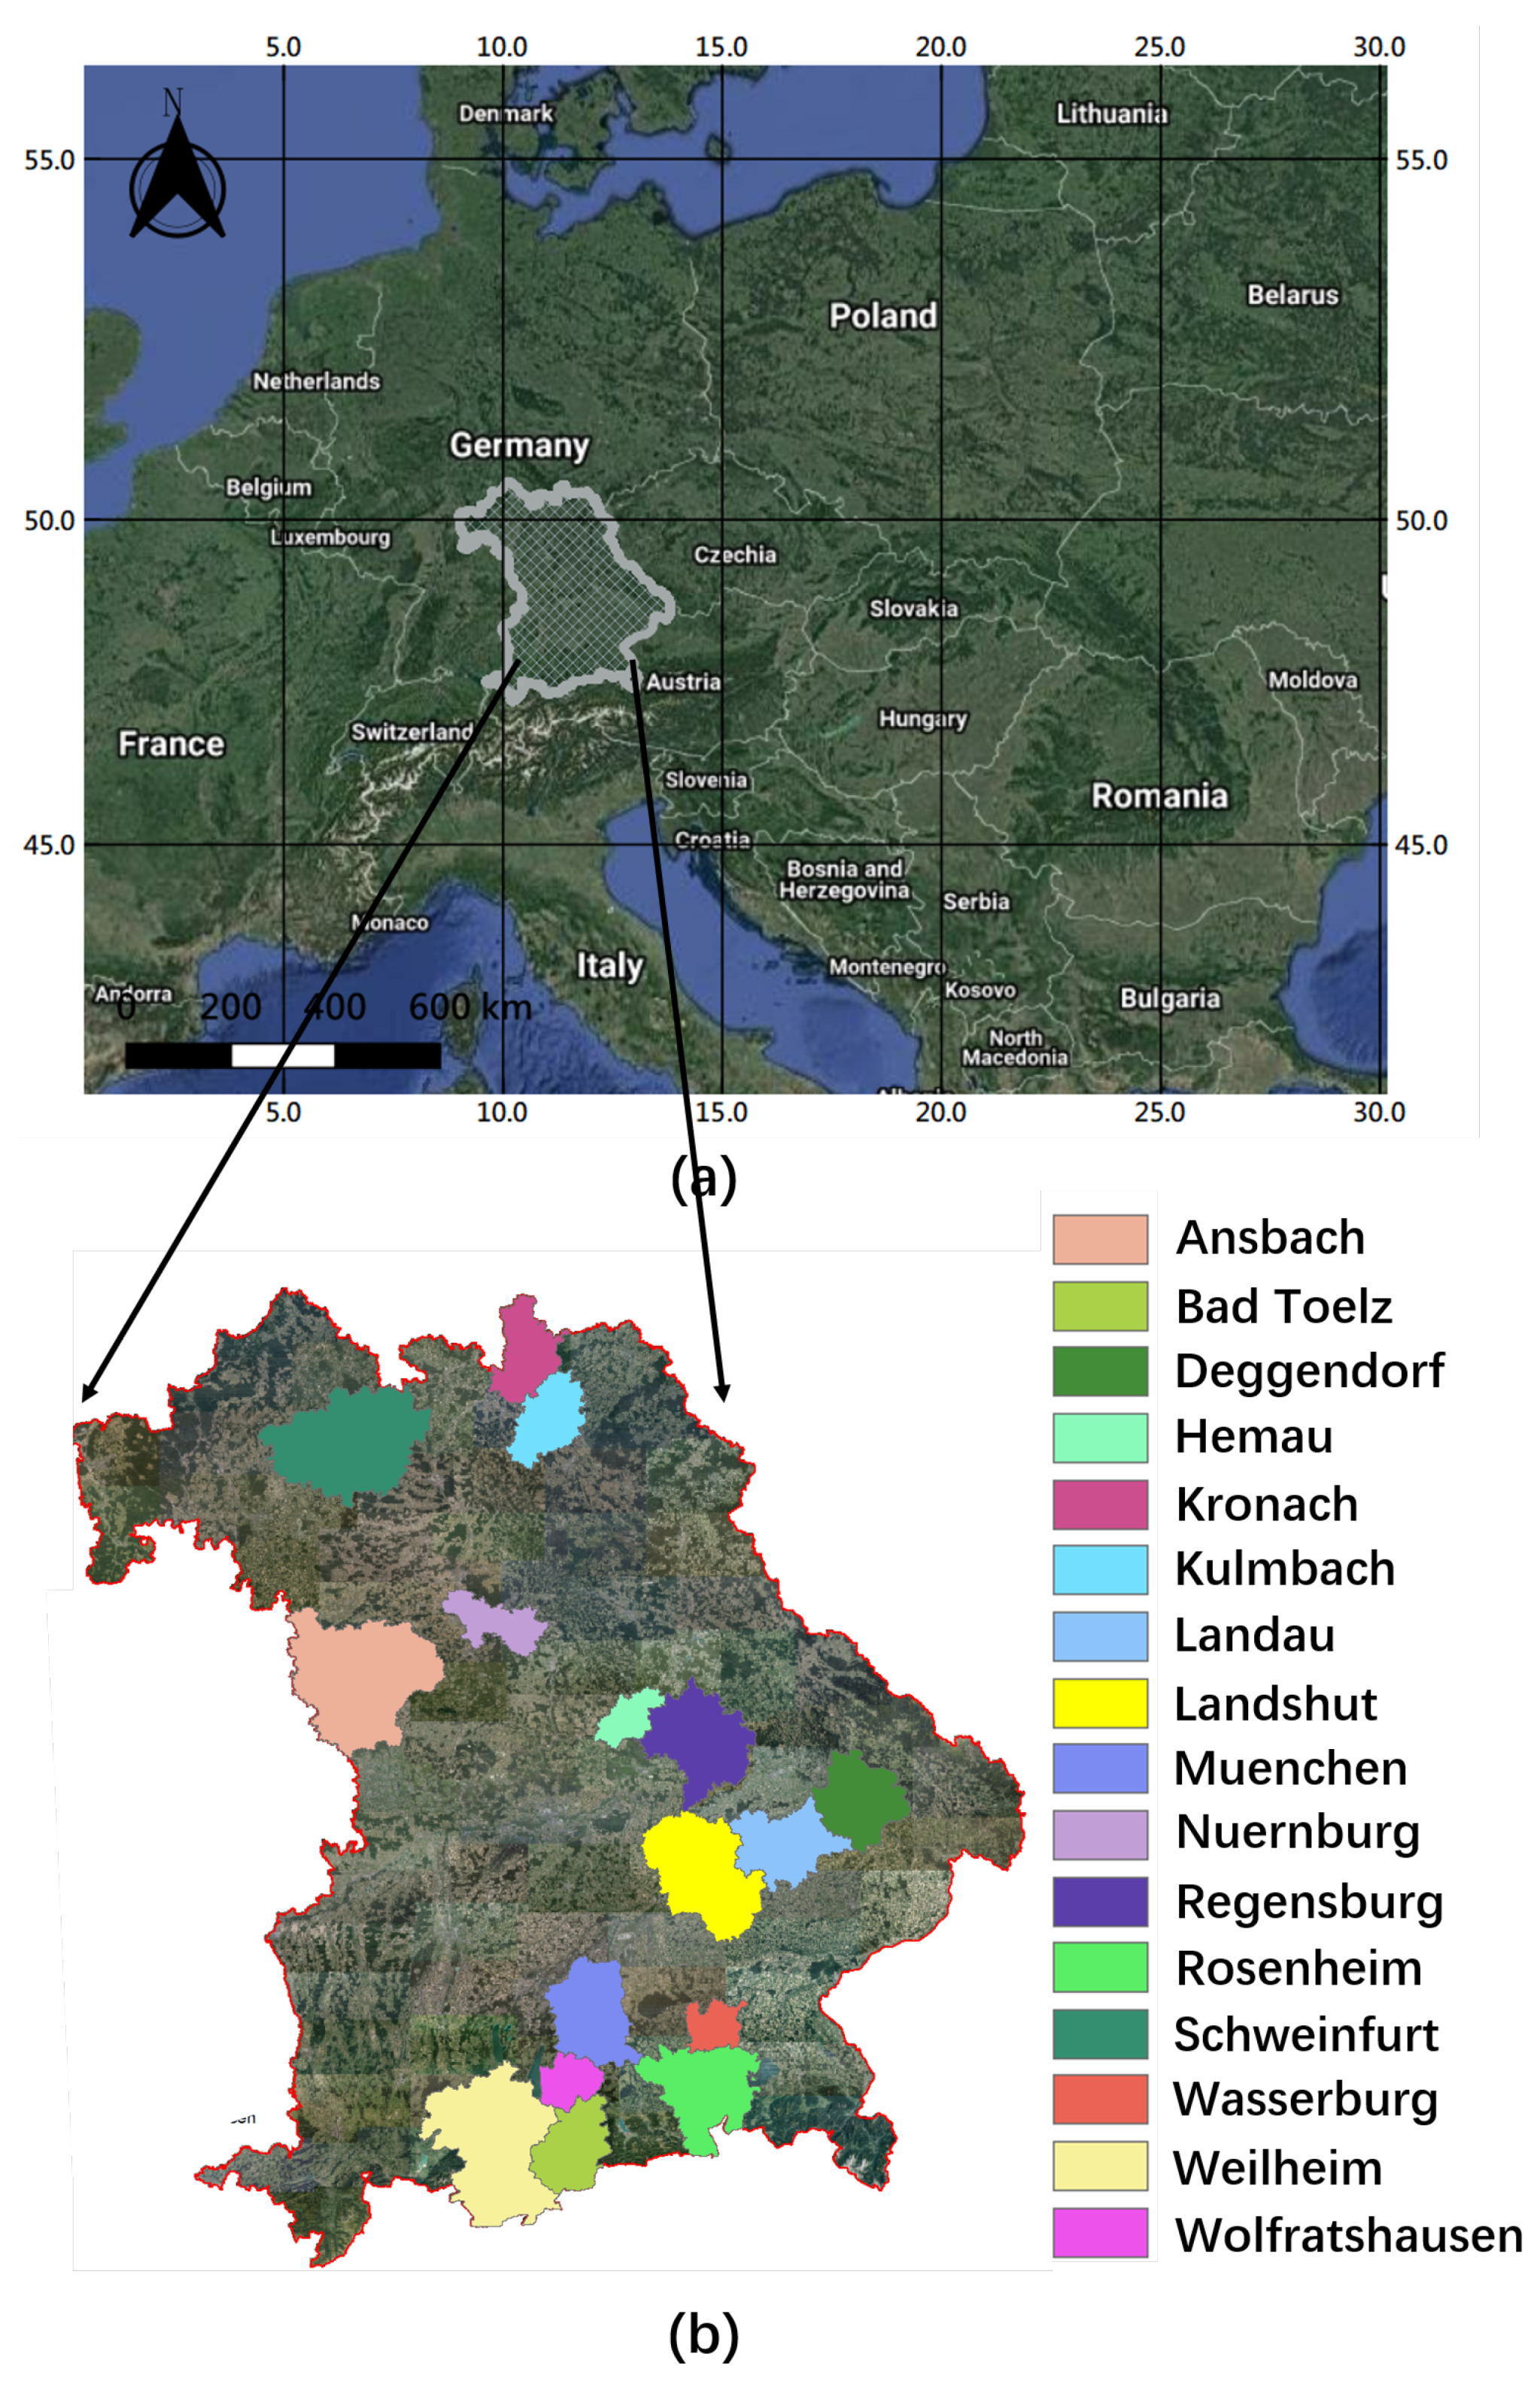
In our research, the study area covers one-quarter of the state of Bavaria, Germany (see Figure 2), which includes 16 districts: Ansbach, Bad Toelz, Deggendorf, Hemau, Kulmbach, Kronach, Landau, Landshut, Muenchen, Nuernburg, Regensburg, Rosenheim, Wasserburg, Schweinfurt, Weilheim, and Wolfratshausen. Bavaria is a federal state of Germany located in the southeast of the country. It is the state with the largest land area and the second most populous state in Germany. The 16 selected districts include both urban and rural areas, where different types of buildings are covered.
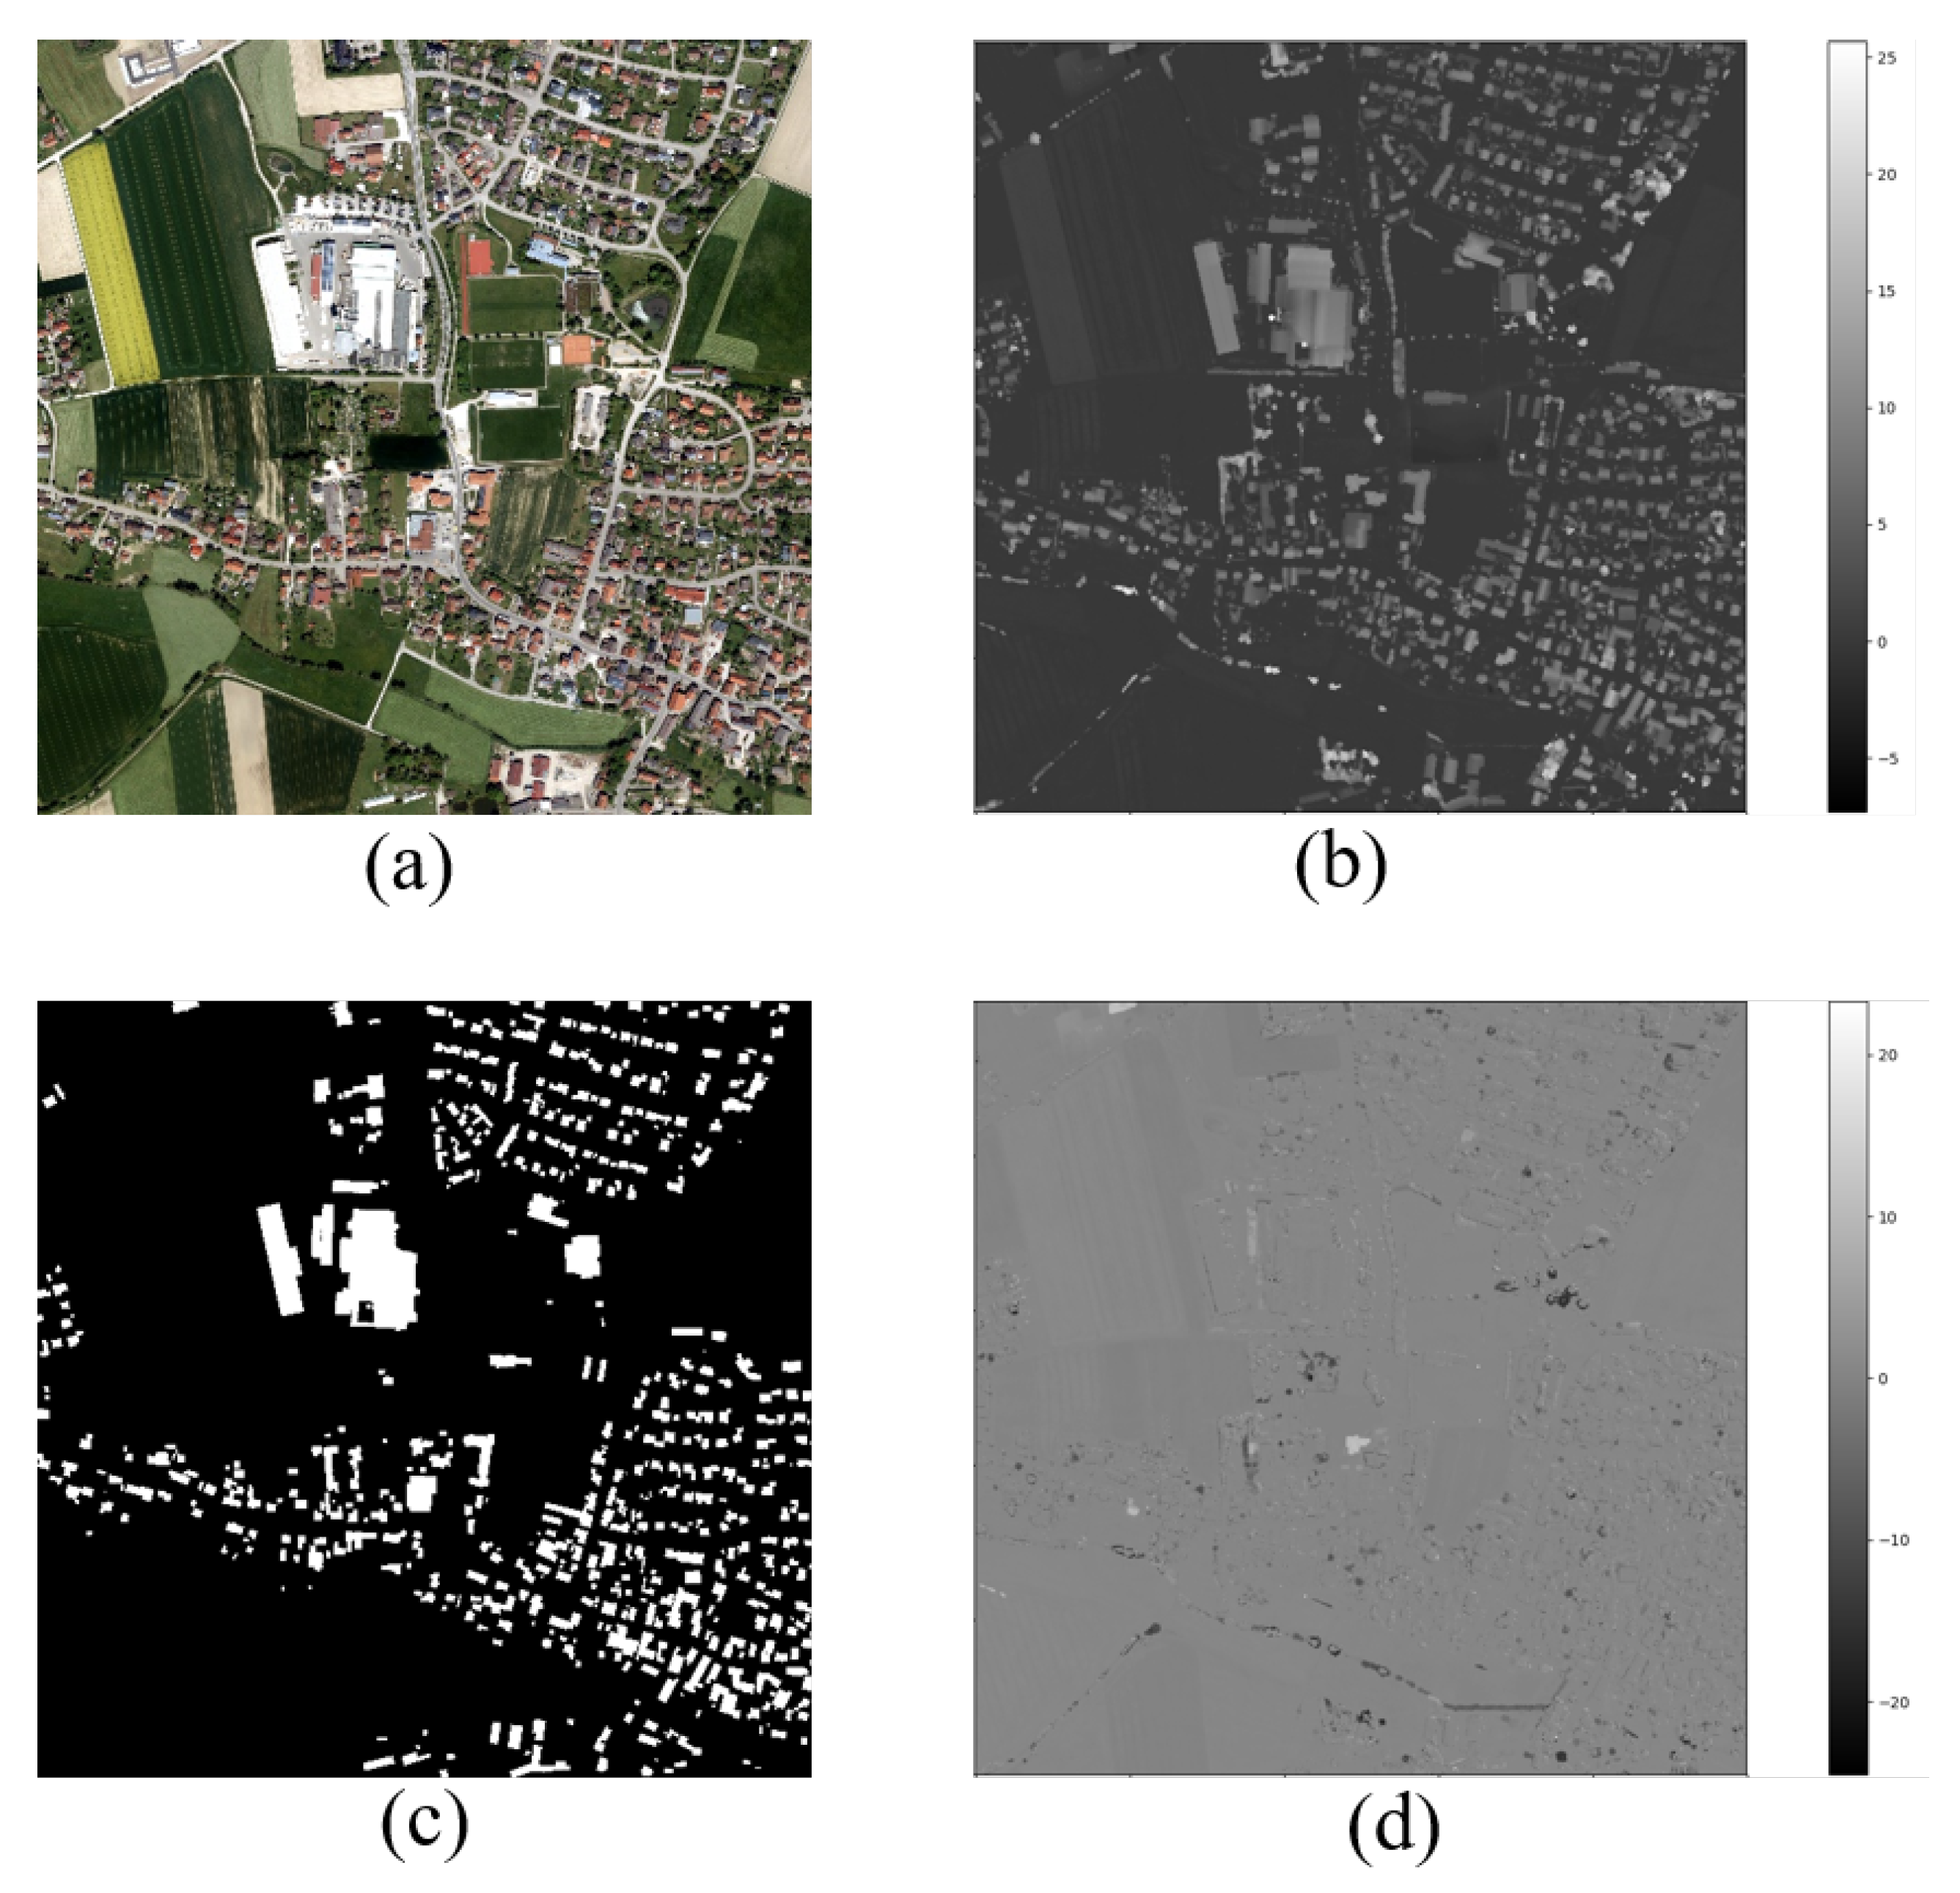
Four types of official geodata are used in this study: nDSM, tDSM, TrueDOP, and DFK. The sample data sets are illustrated in Figure 3 and their related details are shown in Table 1. In the state of Bavaria, Germany, aerial flight compaigns are acquired through both aerial photographs and Airborne Laser Scanning (ALS). A regular point grid from ALS can be derived as the Digital Terrain Model (DTM). The DSM is obtained from a point cloud generated from optical data with the dense matching method [35]. The nDSM utilized in this research is a difference model between a current DSM at time point 2 (year 2017) and the DTM of the scene, which highlights elevated objects above the ground, such as buildings and trees. In this research, the tDSM is the difference model of two DSMs captured at two time points, i.e., time points 1 (year 2014) and 2 (year 2017). The TrueDOP is an orthophoto with RGB bands acquired in time point 2 (year 2017); ortho projection and geo-localization has been achieved corresponding to the DSM. Thus, all buildings and elevated objects in TrueDOP lie in position without geometric distortion. Each district is covered by a large number of tiles of TrueDOP, nDSM, and tDSM, where each tile has a size of 2500 × 2500 pixel at 0.4 m. The DFK is the cadastral 2D ground plan where the footprint of buildings is delineated. It is acquired via a terrestrial surveying in the field with accuracy in the range of cm. One of the limitations of a publicly available data set is the lack of high quality ground truth data [36], where inaccurate locations of building annotations lead to the misalignment between the building footprint and the data used for analysis [37]. It should be noted that, the DFK exploited as ground reference in our research is accurate: the buildings shown in a TrueDOP coincide the corresponding building footprint in the DFK.

4. Methodology

4.1. The Proposed Framework for the Detection of Undocumented Building Constructions

Undocumented building constructions comprise two cases: undocumented buildings and undocumented story construction. Undocumented buildings are the buildings that exist in airborne survey data (nDSM and TrueDOP), but are not recorded in the cadastral 2D ground plan (DFK). Undocumented story construction represents buildings that exist in both airborne survey data (nDSM and TrueDOP) and the cadastral 2D ground plan (DFK), but show a signal of height deviation in the tDSM due to story buildup or demolition. We propose a framework to detect undocumented building constructions that is able to identify both undocumented buildings and undocumented story construction. This proposed framework is carried out based on CNN and decision fusion, and can be implemented as a routine strategy in large-scale object detection works.
An overview of the proposed framework is illustrated in Figure 4. The framework proposed in this study consists of three main tasks: (1) detection of undocumented buildings, (2) discrimination between old and new undocumented buildings, and (3) detection of undocumented story construction.
In the proposed framework, TrueDOP stacked with the nDSM are utilized as the two main data sources in the first stage, building detection. These were chosen because that individual data sources may lead to biased building detection results. In the TrueDOP, the buildings share very similar spectral and texture characteristics with other areas, such as sidewalks. Moreover, varied light intensities due to atmospheric and seasonal effects, as well as shadow, can result in the variation in the appearance of buildings [38], which is largely dependent on the time of data acquisition. The nDSM data derived from the DSM and ALS data can directly inference the scene geometry, avoiding the influence of environmental variables. However, some issues emerge when relying solely on the nDSM, including marked occluded surfaces and planar surfaces that are split up [36]. In this case, buildings and other elevated objects above the ground can not be discriminated well by purely nDSM methods. Therefore, in order to make full use of both data sets, we stack the TrueDOP and the nDSM as input of the CNN model, which assigns the class label “building” or “non-building” to each pixel. The undocumented building pixels can then be identified when we overlay the predicted results with DFK, highlighting those pixels that are assigned the class label of “building” from the CNN model but belongs to the “non-building” class in the DFK.
In order to further distinguish between different types of undocumented buildings, the temporal information is essential to identifying the time window of the constructions. In this regard, the tDSM, which is the difference between two DSMs acquired at two time points, is introduced as an additional source of information. New constructions can be identified with an empiric value (1.8 m) applied to the tDSM, which indicates that there is a height deviation for this pixel within the period between two time points (from year 2014 to year 2017 in this research). This is due to the fact that a story or a building is usually higher than 1.8 m. If there is a height deviation within this period, the obtained undocumented building pixels from the previous stage will be assigned to the class as new undocumented building. It indicates that this undocumented building was constructed after time point 1 (year 2014). Otherwise it will be assigned the class of old undocumented building, which indicates that there was an undocumented building constructed before time point 1 (in this case, the year 2014).
Another case of building construction that can lead to a height deviation in two DSMs, is the undocumented story construction, which refers to story buildup or demolition on an existing building. The predicted results from the CNN model are first overlaid with the DFK. When the pixel in both data sources corresponds to the class “building” and if there is a height deviation identified in the tDSM, this pixel is placed in the class of undocumented story construction.

4.2. A CNN Model for Building Detection

Considering that the spatial resolution of airborne data is relatively high, massive quantities of data can be collected within the area of one-quarter of the state of Bavaria, Germany. CNNs, the most favored methods for many large-scale tasks [39], are therefore implemented as the most essential part of our proposed framework. FC-DenseNet is exploited as the base semantic segmentation network for building detection in the proposed framework, the goal of which is to assign the class label of “building” or “non-building” to each pixel.

Network Architecture

FC-DenseNet is also an encoder-decoder architecture, where the key ingredient is the DenseNet block. DenseNet [40] is a network that has proven to achieve superior performance for scene classification tasks [41]. In this regard, FC-DenseNet (see Figure 5) is proposed in [33], where the DenseNet is extended to a fully convolutional network for semantic segmentation tasks. The DenseNet block has introduced a new connective pattern between layers, where the input of each layer is all preceding features, and the output features from this layer are then transferred to all subsequent layers. Instead of ResNet [42], which combines features by summation, DenseNet combines features using iterative concatenation. This provides a more efficient flow of information through the network. The feature concatenation in the DenseNet block reuses all features, which makes the connections within layers shorter. In this regard, the intermediate layers will be enforced to learn distinguished feature maps for easier training. Another important design element of FC-DenseNet is the skip connections [43] between the encoder and the decoder, where higher resolution information can be passed. The spatial details can be well recovered in the decoder from the encoder with the help of the skip connection.

5. Experiment

5.1. Data Preprocessing

The crucial element of our proposed framework is the CNN method that can predict buildings at current state. Training data is essential for CNN learning, and thus all the official geodata are preprocessed to collect training patches as input. DFK is provided as shape files, and first converted to the raster format at 0.4 m, which is the same spatial resolution as TrueDOP, nDSM, and tDSM. Then, all the tiles of TrueDOP, nDSM, and the DFK as corresponding ground reference are clipped into patches with a size of 256 × 256 pixels, where each patch has an overlap of 124 pixels with its neighboring patches.
Then, we collect the patches from 14 districts in the state of Bavaria, Germany, except the districts of Bad Toelz and Nuernburg. And for each district among the 14 selected districts, we split the collected patches into the train and validation subset. Table 2 shows the number of training and validation patches for the 14 selected districts.

5.2. Experiment Setup

Using the training and validation data collected from the 14 selected districts, we have firstly trained a FC-DenseNet model to get building detection results. Then, with the aid of tDSM, we have generated a seamless map of undocumented detection for one-quarter of the state of Bavaria, Germany.
To validate our building detection results, we choose the district “Bad Toelz” as the test area. Firstly, we compare our results in the district of Bad Toelz with those obtained from two conventional solutions (filter-based method and comparison-based method) utilized in the state of Bavaria, Germany. Furthermore, we also make a comparison among different CNNs. Thus, we implement another two commonly used networks (FCN-8s [27] and U-Net [28]) in the remote sensing community for building detection.
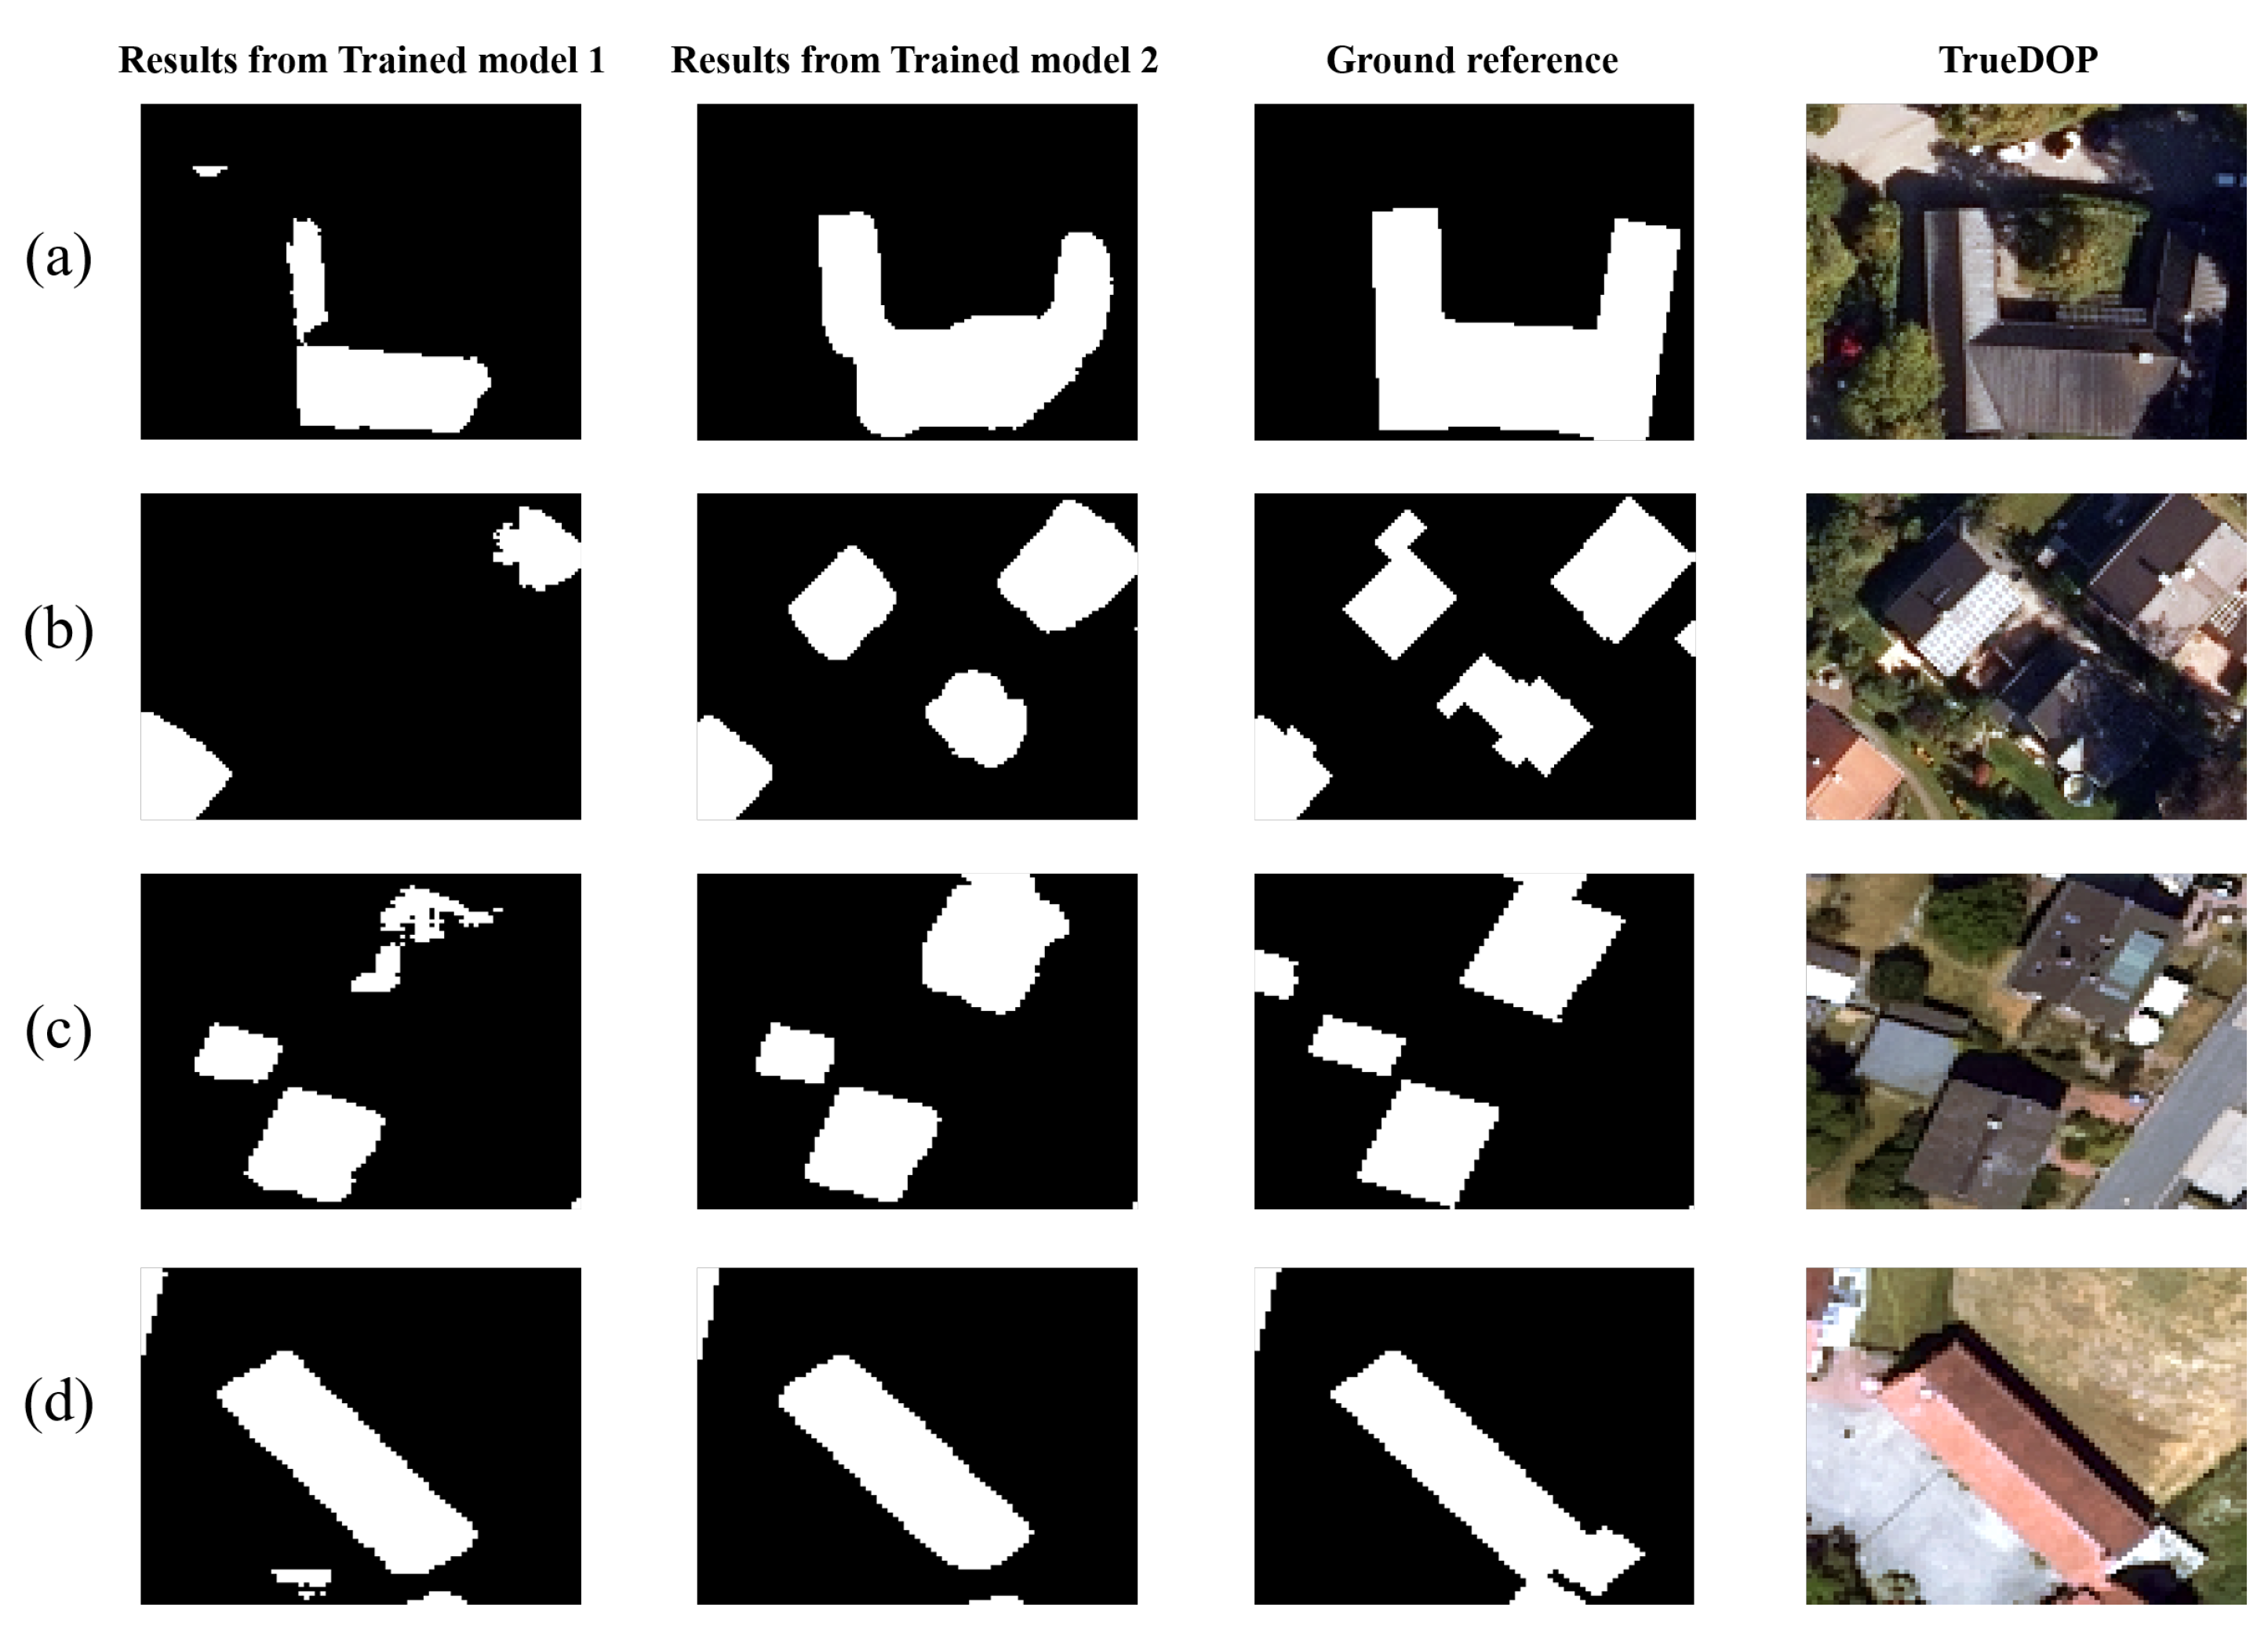
As one contribution of our work, the transferability issues with training data from selected districts around the state of Bavaria, Germany are explored. In this regard, transferability is examined by training another FC-DenseNet model with the training and validation data only from the district of Ansbach. Then we evaluate the two FC-DenseNet models on the districts of Bad Toelz and Nuernburg, respectively. Note that the districts of Bad Toelz and Nuernburg are not included from the 14 selected districts, which is helpful to investigate the transferability of these two trained models.
In order to investigate the sampling strategy in a local area where training samples are available, we also test the two trained FC-DenseNet models on the district of Ansbach, since the district of Ansbach is included in training and validation data of both trained models.

5.3. Training Details

In this study, all networks are applied under a Pytorch framework and trained for 100 epochs. All models are trained from scratch by a stochastic gradient descent (SGD) optimizer with a learning rate of 0.000001. The cross entropy loss is utilized as the loss function, and the batch size is 5. A Tesla P100 GPU with 16 G memory is used to train our models.
The configurations of CNNs included in experiments are listed as follows;
(1)
FC-DenseNet is composed of four DenseNet blocks in both encoder and decoder, and one bottleneck block connecting them, which is also a DenseNet block. In each DenseNet block, we utilize 5 convolutional layers.
(2)
FCN-8s adopts a VGG16 architecture [44] as the backbone.
(3)
U-Net is composed of five blocks in both the encoder and decoder. Each block in the encoder has two convolution layers, and in the decoder it has one transposed convolution layer.

5.4. Evaluation Metrics

For building detection, the model performance is evaluated by calculating the accuracy metrics, which include overall accuracy, precision, recall, F1 score, and intersection over union (IoU), which are defined as:
Overall accuracy = T P + T N T P + F P + F N + T N
precision = T P T P + F P
recall = T P T P + F N
F 1 score = 2 * precision * recall precision + recall
IoU = T P T P + F P + F N
where T P (true positive) is the number of pixels correctly identified with the class label “building”, F N (false negative) denotes the number of omitted pixels with the class label of “building”. F P (false positive) represents the number of “non-building” pixels in the ground reference, but are mislabeled as “building” by the model. T N (true negative) is the number of the correctly detected pixels with the class label of “non-building”. Precision denotes the fraction of identified “building” pixels that are correct with ground reference, and recall represents how many “building” pixels in the ground reference are correctly predicted. The F1 score denotes a harmonic mean between precision and recall.

6. Results

6.1. Results of Undocumented Building Constructions from Proposed Framework

In our research, we have generated a seamless map of undocumented building constructions for one-quarter of the state of Bavaria, Germany. Due to the limited space, the zoom-in visual examples of the large-scale undocumented building constructions can only be presented at block level here (see Figure 6).
To evaluate the undocumented detections in a more targeted manner, we collected all the undocumented buildings in the district of Bad Toelz. Each undocumented building was reevaluated by manual photo interpretation to determine the correctness. Among the 1545 undocumented buildings from our results in the district of Bad Toelz, 1271 undocumented buildings were correctly detected.
A detailed visual analysis of undocumented building constructions in the district of Bad Toelz is given as an example in Figure 7, including (a) old undocumented building, (b) new undocumented building, (c) undocumented story construction. Note that the training data set excludes the data for the district of Bad Toelz, but it can still provide satisfying results in this district. Case (a) represents old undocumented buildings (green), which are clearly distinguishable in the TrueDOP and are shown as elevated objects in the nDSM. However, they are not contained in the DFK. Considering that no height deviation is present in the tDSM, these undocumented buildings belong to the class of old undocumented building, which indicates that they were built before time point 1 (year 2014). In case (b), a new undocumented building (red) is depicted well in our detection results. From the TrueDOP and nDSM, it can be clearly seen that this is a building, however, it is not present in the DFK. Since there is an obvious signal of height deviation from tDSM, this new undocumented building was built in the period covered by the tDSM (from year 2014 to year 2017). For the undocumented story construction illustrated in case (c), a strong signal of height deviation is present in the tDSM. This site corresponds to a building that has been recorded in the DFK; thus, we can conclude that this height deviation results from story buildup.

6.2. Results of Building Detections from Proposed Framework

In our proposed framework, the module of CNN plays a vital role, and its performance has an impact on the final undocumented building detections results. In order to evaluate the CNN performance of the proposed framework, we compare our building detection results in the district of Bad Toelz with those acquired from two conventional solutions (filter-based method and comparison-based method) utilized in the state of Bavaria, Germany. A comparison among different CNNs (FC-DenseNet, FCN-8s, and U-Net) is also presented in this section.

6.2.1. Comparison with Two Conventional Solutions

The visual building detection results from the proposed framework and two other conventional solutions (the filter-based method and the comparison-based method) are shown in Figure 8. For further verification, a statistical analysis of the results from these three methods on the district of Bad Toelz is carried out (see Table 3). As a comparative measure, the F1 score is clearly more objective here, since it takes both false alarms and omitted detections into consideration.
For the filter-based method, the low precision rate results from some false detection. One reason is that the nDSM naturally delivers all elevated objects, such as vegetation and trucks, in addition to buildings. The other reason is that the color filter is mostly affected by aerial imaging conditions, which means that vegetation can be also misclassified as buildings under some uncertainties. Some omission errors in the results also reduce the recall value, which may be due to the confidence intervals of the color filter. This interval may be insufficient to identify buildings, since the RGB values for an individual building are significantly dependent on the amount of sunlight. In this case, there are some buildings whose colors are in the peripheral areas, e.g., very bright white roofs or very dark roofs, which can not be identified as buildings.
In the results obtained from the comparison-based method, the precision value is much lower than the other two methods, which indicates that many non-building pixels are mislabeled as buildings. After a further detailed visual check, we have found that there is a lot of confusion between trees and buildings. Since some trees grow above the roofs, the RGB color cube in TrueDOP collected from reference buildings also involve RGB color values of vegetation. In this regard, the reference for buildings in the RGB color cube will be distorted by these vegetation components, and thus vegetation can be wrongly classified as buildings. Moreover, the color values of vegetation and dark roofs are also similar in shadow areas, which produces misclassifications between vegetation and buildings.
The CNN method yields the highest precision values, which indicates that it can suppress false alarms well. The CNN model clearly outperforms the other two methods with respect to accuracy (F1 score). This proves that, in a comparison of the building detectors examined, reliable building detection and a good separation from vegetation are only possible with the CNN model. This is due to the powerful generalization capability of CNNs, which are independent from prior knowledge and hand-crafted features.

6.2.2. Comparison with Other CNNs

In order to compare with other CNNs, two networks including FCN-8s, and U-Net are also trained with the training and validation samples collected from 14 districts. Their respective performance is then tested on the district of Bad Toelz.
Statistical results of three networks are shown in Table 4. It is demonstrated that FC-DenseNet outperforms other two methods in terms of both F1 score and IoU. Specifically, comparisons with FCN-8s and U-Net, where FC-DenseNet obtain increments of 3.9% and 3.2% in F1 score, respectively, validates its superiority in the task of building detection. Compared to U-Net, FC-DenseNet reaches improvements of 3.2% and 4.6% in F1 score and IoU, which indicates that the DenseNet block is more effective than the normal block.
Figure 9 shows a few examples of building detection results of three networks. In all these three scenes, FC-DenseNet is able to capture more buildings, whereas U-Net and FCN-8s suffer from more omission errors. This is mainly because, in FC-DenseNet, the DenseNet block reuses features, which leads to a better judgment of buildings. Thanks to the architecture of skip connection, FC-DenseNet is capable of preserving sharper building boundaries than FCN-8s.

7. Discussion

The collection of training samples for large-scale building detection takes a large quantity of time and manual work. Therefore, the investigation of transferability issues and sampling strategies for building detection at large-scale is vital in practical use. In this regard, we have trained two FC-DenseNet models with different training and validation sets, and named them as the trained model 1 and 2, respectively. In the trained model 1, the training samples are only collected from the district of Ansbach. In the trained model 2, the training samples are collected not only from the district of Ansbach, but also another 13 districts.

7.1. Transferability Investigation

The transferability of trained models is examined by evaluating the performances of the two trained models in the districts of Bad Toelz and Nuernburg, respectively. For both trained models, neither training data nor validation data include the data from these two districts, which is considered as a more realistic test for the task of large-scale building detection, since training data can only be collected from limited areas. Table 5 proves that the trained model 2 has superior transferability. In the district Bad Toelz, F1 score and IoU of the trained model 2 shows a large improvement of 12.8% and 17.4% in comparison to the trained model 1, respectively. In the district of Nuernburg, the trained model 2 surpasses the trained model 1 by 3.9% and 5.8% in the F1 score and IoU score, respectively.
Some visual examples of these two trained models in the districts of Bad Toelz and Nuernburg are illustrated in Figure 10 for comparison. The visual results are consistent with the statistical results of Table 5, where the trained model 2 shows higher increments of precision and recall than the trained model 1. This indicates that when the evaluation data is unseen by both the training and the validation set, the optimal sampling strategy is to collect training data from different districts rather than from only one. This improvement is due to the fact that the trained model 2 collects the training samples from 14 different districts in the state of Bavaria, Germany, where the variety in the types of buildings facilitates the learning of CNN. This again confirms that a diverse training set is beneficial to the generalization capability of CNN. Since CNN is focused on learning location-specific building patterns, a diverse training set can mitigate this effect and enable the CNN to learn more generic patterns, where the semantic segmentation in an unseen area can be improved [45].

7.2. Sampling Strategy Investigation

In order to investigate the sampling strategy in a local area where training samples are available, we test the two trained models on the district of Ansbach. This is due to the fact that the district of Ansbach is included in both two trained models. The evaluation data in the district of Ansbach is the same as the validation data in the trained model 1 (18,077 patches). Table 6 presents a comparison of the statistical accuracy of two trained models. An interesting finding is that, statistical metrics of the two trained models only show slight differences, which indicates that local training sample collection and training can achieve comparative performance as collecting extensive training samples from different districts. This is because training data in the trained model 1 share a similar data distribution with evaluation data in the district of Ansbach, which can also lead to a good fit of the model. This provides a sampling strategy in a local area where the training samples are available, so that we can just use only local training samples to obtain the building detection results in this area rather than collecting extensive training samples from multiple districts. This sampling strategy can save much more effort and time in a local area with available training samples.

8. Conclusions

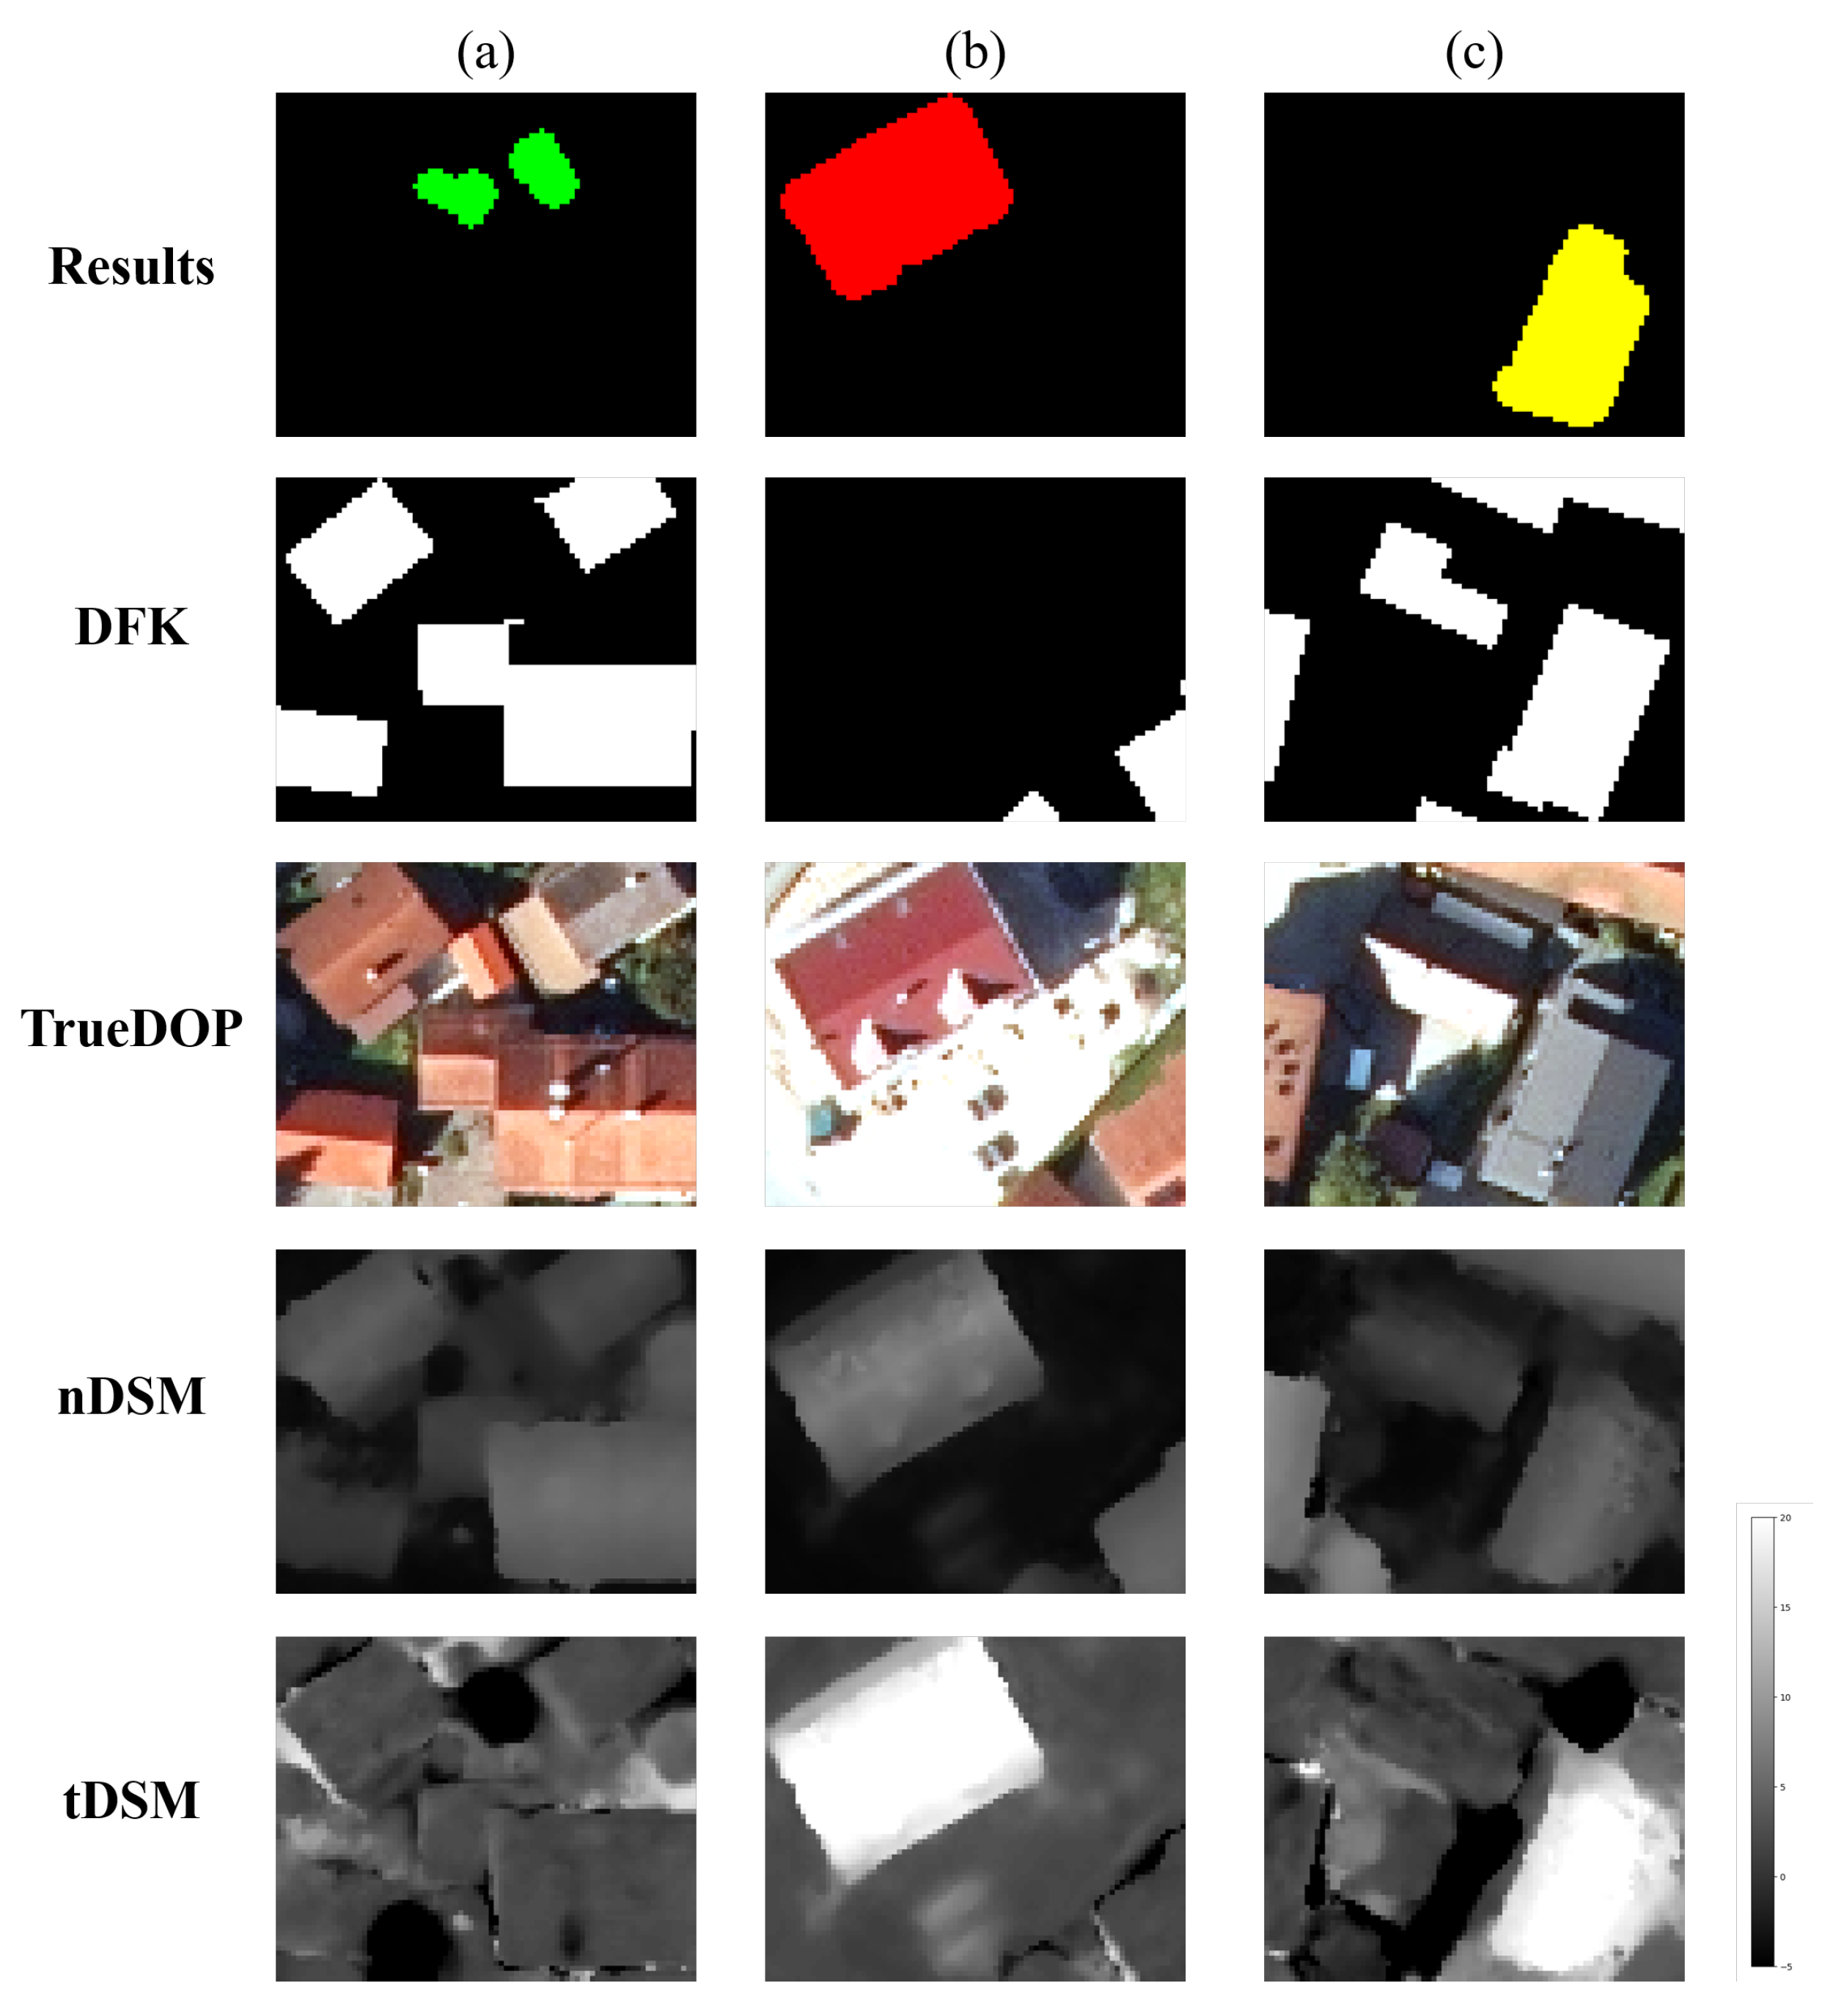
In order to ensure the transparent management of land properties, buildings as vital terrestrial objects, need an official terrestrial survey to be documented in the cadastral maps. For this purpose, we have proposed a framework for the detection of undocumented building constructions from official geodata, which includes nDSM, TrueDOP, and DFK. Moreover, the proposed framework categorizes detected undocumented building constructions into three types: old undocumented building, new undocumented building, and undocumented story construction with the aid of tDSM. This can contribute to the management of different construction cases.
Our framework is based on a CNN and decision fusion, and has shown greater potential for updating the building model in geographic information system than two strategies used so far in the state of Bavaria, Germany.
We investigated the transferability issue and sampling strategies for building detection at large-scale. In an unseen area, the model that collects diverse training samples from multiple districts has better transferability than the model that collects training data from only one district. However, in a local area where training samples are already available, the local samples collection and training can achieve comparative performance as the model that collects extensive training samples from different districts. These practical strategies are beneficial to other large-scale object detection works that use remote sensing data.
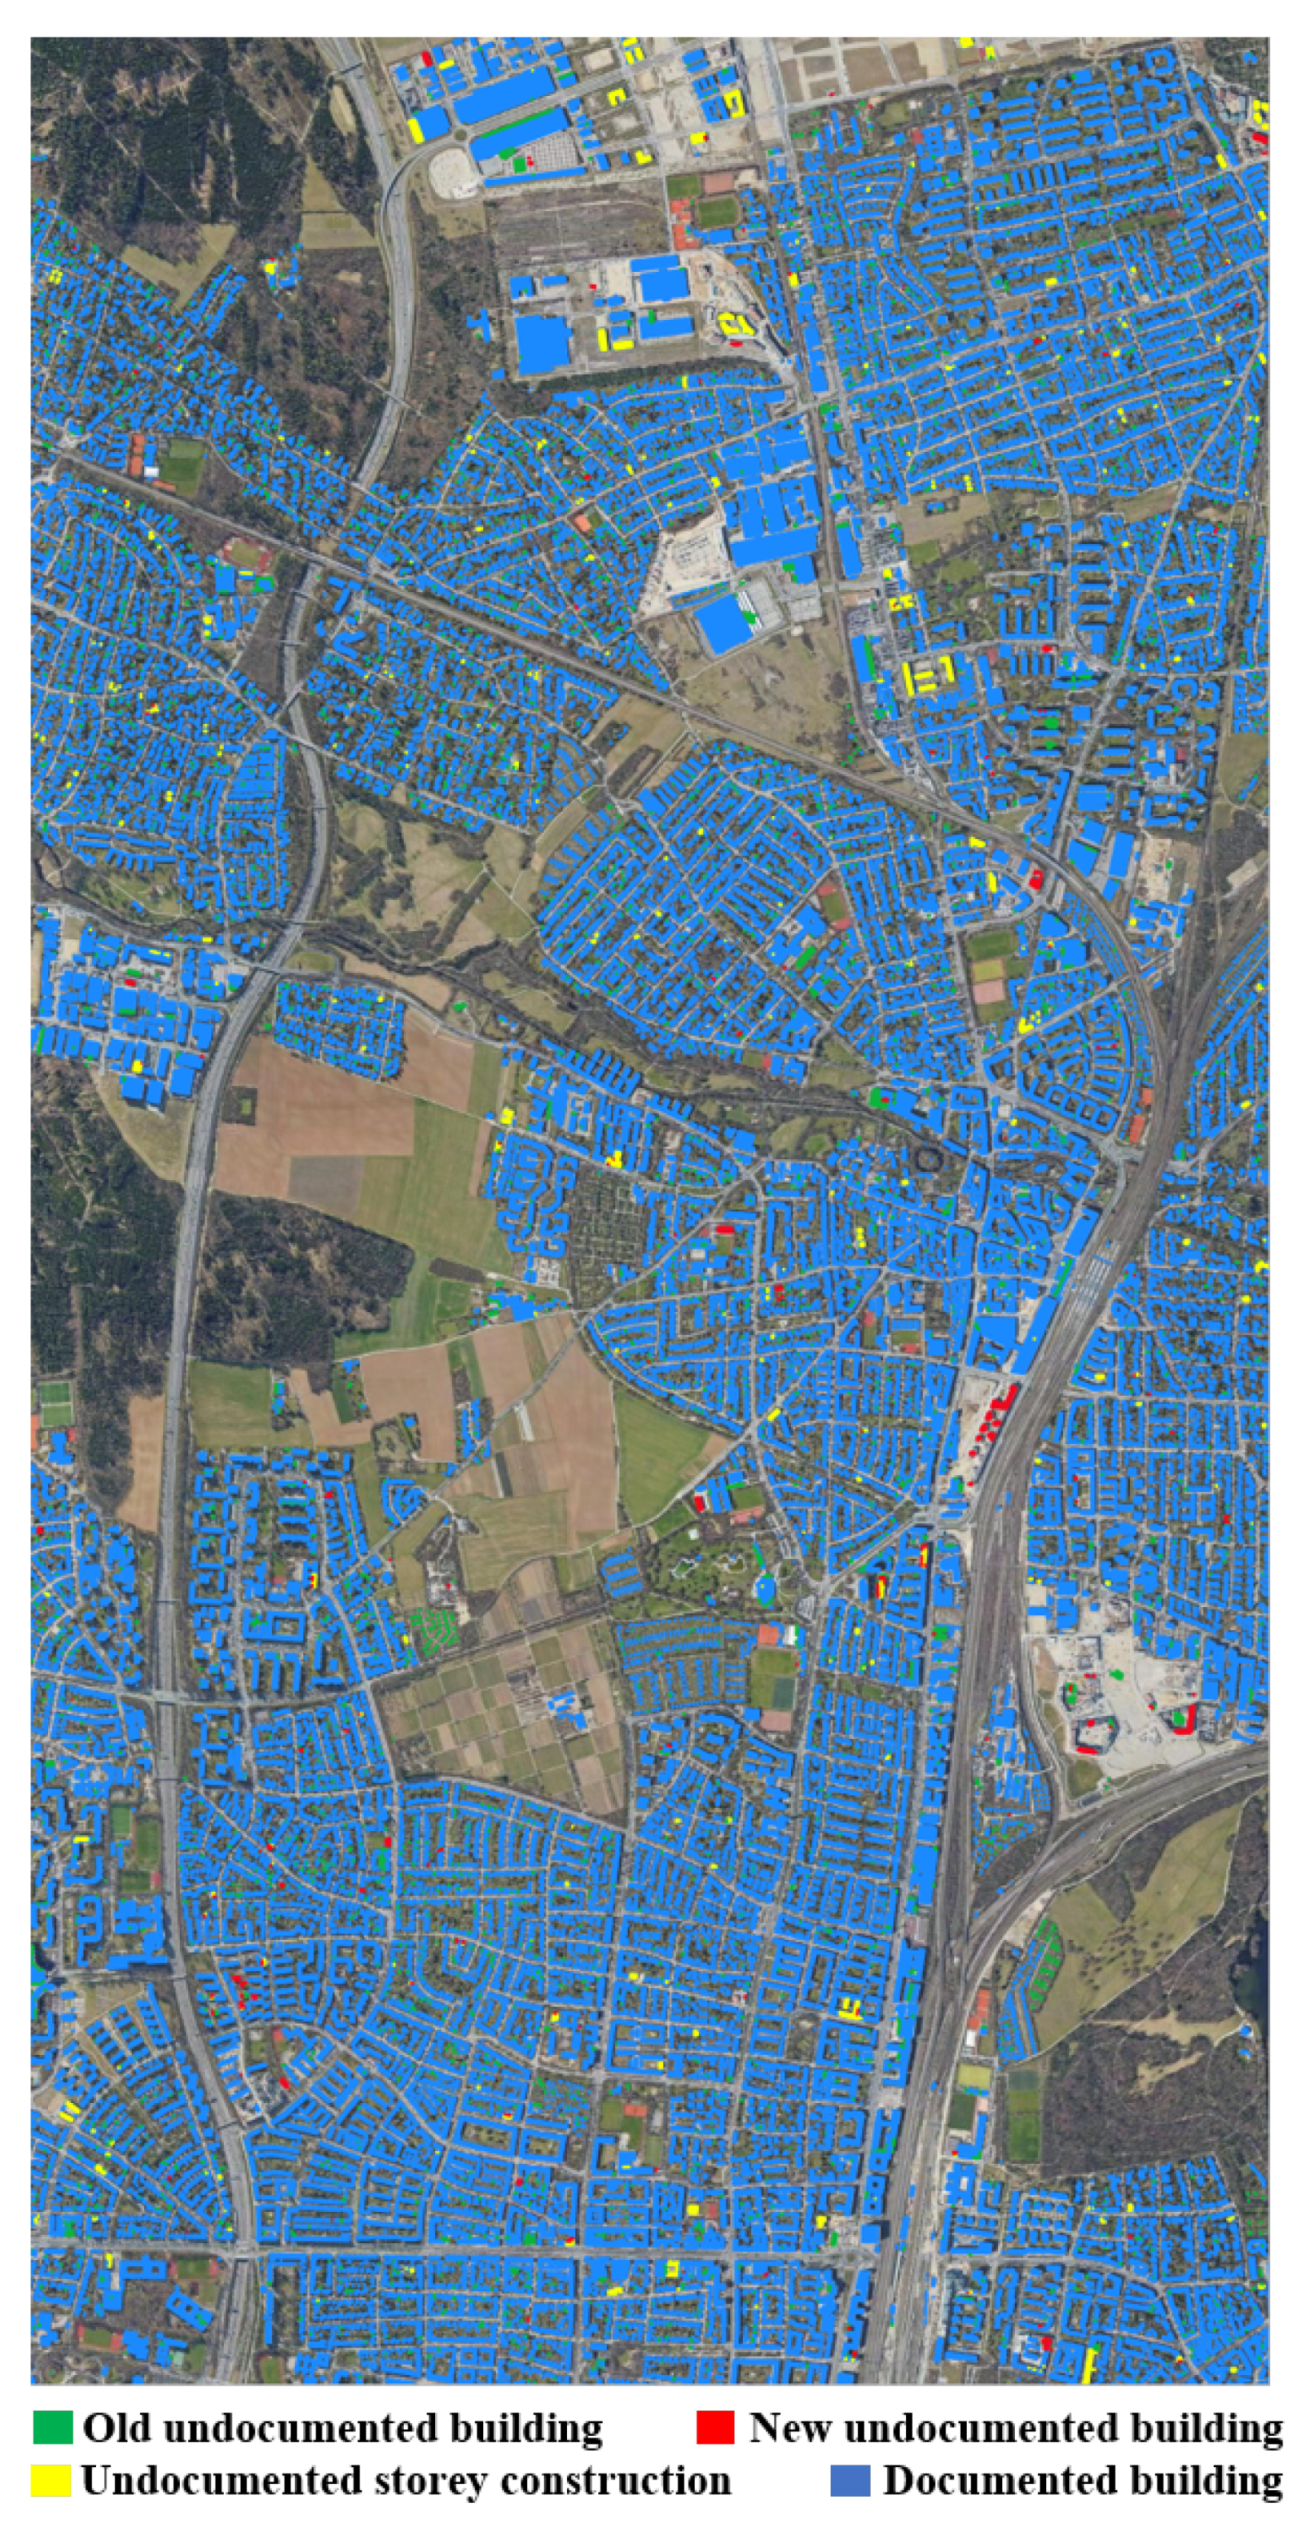
Furthermore, the seamless map of undocumented building constructions generated in our research covers one-quarter of the state of Bavaria, Germany at a spatial resolution of 0.4 m, and is beneficial to efficient land resource management and sustainable urban development.

Author Contributions

Conceptualization, X.Z., R.R., S.A. and M.S.; methodology, Q.L. and Y.S.; software, Q.L. and K.M.; validation, Q.L. and K.M.; formal analysis, Q.L.; investigation, Q.L.; resources, X.Z. and R.R.; data curation, Q.L. and K.M.; writing—original draft preparation, Q.L.; writing—review and editing, Q.L., Y.S., S.A., R.R., K.M., M.S., C.G. and X.Z.; visualization, Q.L. and K.M.; supervision, X.Z.; project administration, X.Z.; funding acquisition, X.Z. All authors have read and agreed to the published version of the manuscript.

Funding

This work is supported by the European Research Council (ERC) under the European Union’s Horizon 2020 research and innovation program (grant agreement no. ERC-2016-StG-714087, acronym: So2Sat, www.so2sat.eu), the Helmholtz Association under the framework of the Young Investigators Group “SiPEO” (VH-NG-1018, www.sipeo.bgu.tum.de) and Helmholtz Excellent Professorship “Data Science in Earth Observation-Big Data Fusion for Urban Research”. This work is also part of the project “Investigation of building cases using AI” funded by Bavarian State Ministry of Finance and Regional Identity (StMFH) and the Bavarian Agency for Digitization, High-Speed Internet and Surveying.

Conflicts of Interest

The authors declare no conflict of interest. The founding sponsors had no role in the design of the study; in the collection, analyses, or interpretation of data; in the writing of the manuscript, and in the decision to publish the results.

References

  1. Arlinger, K.; Roschlaub, R. Calculation and update of a 3D building model of Bavaria using LiDAR, image matching and cadastre information. In Proceedings of the 8th International 3D GeoInfo Conference, Istanbul, Turkey, 27–29 November 2013; pp. 28–29. [Google Scholar]
  2. Aringer, K.; Roschlaub, R. Bavarian 3D building model and update concept based on LiDAR, image matching and cadastre information. In Innovations in 3D Geo-Information Sciences; Springer: Berlin/Heidelberg, Germany, 2014; pp. 143–157. [Google Scholar]
  3. Geßler, S.; Krey, T.; Möst, K.; Roschlaub, R. Mit Datenfusionierung Mehrwerte schaffen—Ein Expertensystem zur Baufallerkundung. DVW Mitt. 2019, 2, 159–187. [Google Scholar]
  4. Roschlaub, R.; Möst, K.; Krey, T. Automated Classification of Building Roofs for the Updating of 3D Building Models Using Heuristic Methods. PFG J. Photogramm. Remote Sens. Geoinf. Sci. 2020, 88, 85–97. [Google Scholar] [CrossRef] [Green Version]
  5. Zhu, X.X.; Tuia, D.; Mou, L.; Xia, G.S.; Zhang, L.; Xu, F.; Fraundorfer, F. Deep learning in remote sensing: A comprehensive review and list of resources. IEEE Geosci. Remote Sens. Mag. 2017, 5, 8–36. [Google Scholar] [CrossRef] [Green Version]
  6. Li, J.; Huang, X.; Gong, J. Deep neural network for remote-sensing image interpretation: Status and perspectives. Natl. Sci. Rev. 2019, 6, 1082–1086. [Google Scholar] [CrossRef]
  7. Mou, L.; Zhu, X.X. Learning to Pay Attention on Spectral Domain: A Spectral Attention Module-Based Convolutional Network for Hyperspectral Image Classification. IEEE Trans. Geosci. Remote Sens. 2019, 58, 110–122. [Google Scholar] [CrossRef]
  8. Qiu, C.; Mou, L.; Schmitt, M.; Zhu, X.X. Local climate zone-based urban land cover classification from multi-seasonal Sentinel-2 images with a recurrent residual network. ISPRS J. Photogramm. Remote Sens. 2019, 154, 151–162. [Google Scholar] [CrossRef]
  9. Mou, L.; Bruzzone, L.; Zhu, X.X. Learning spectral-spatial-temporal features via a recurrent convolutional neural network for change detection in multispectral imagery. IEEE Trans. Geosci. Remote Sens. 2018, 57, 924–935. [Google Scholar] [CrossRef] [Green Version]
  10. Caye Daudt, R.; Le Saux, B.; Boulch, A.; Gousseau, Y. Guided anisotropic diffusion and iterative learning for weakly supervised change detection. In Proceedings of the IEEE Conference on Computer Vision and Pattern Recognition Workshops, Long Beach, CA, USA, 16–20 June 2019. [Google Scholar]
  11. Hua, Y.; Mou, L.; Zhu, X.X. Relation Network for Multilabel Aerial Image Classification. IEEE Trans. Geosci. Remote. Sens. 2020. [Google Scholar] [CrossRef] [Green Version]
  12. Hua, Y.; Mou, L.; Zhu, X.X. Recurrently exploring class-wise attention in a hybrid convolutional and bidirectional LSTM network for multi-label aerial image classification. ISPRS J. Photogramm. Remote Sens. 2019, 149, 188–199. [Google Scholar] [CrossRef]
  13. Qiu, C.; Schmitt, M.; Geiß, C.; Chen, T.H.K.; Zhu, X.X. A framework for large-scale mapping of human settlement extent from Sentinel-2 images via fully convolutional neural networks. ISPRS J. Photogramm. Remote Sens. 2020, 163, 152–170. [Google Scholar] [CrossRef]
  14. He, C.; Liu, Z.; Gou, S.; Zhang, Q.; Zhang, J.; Xu, L. Detecting global urban expansion over the last three decades using a fully convolutional network. Environ. Res. Lett. 2019, 14, 034008. [Google Scholar] [CrossRef]
  15. Shi, Y.; Li, Q.; Zhu, X.X. Building Footprint Generation Using Improved Generative Adversarial Networks. IEEE Geosci. Remote Sens. Lett. 2018, 16, 603–607. [Google Scholar] [CrossRef] [Green Version]
  16. Shi, Y.; Li, Q.; Zhu, X.X. Building segmentation through a gated graph convolutional neural network with deep structured feature embedding. ISPRS J. Photogramm. Remote Sens. 2020, 159, 184–197. [Google Scholar] [CrossRef] [PubMed]
  17. Li, Q.; Shi, Y.; Huang, X.; Zhu, X.X. Building Footprint Generation by Integrating Convolution Neural Network With Feature Pairwise Conditional Random Field (FPCRF). IEEE Trans. Geosci. Remote Sens. 2020. [Google Scholar] [CrossRef]
  18. Wurm, M.; Stark, T.; Zhu, X.X.; Weigand, M.; Taubenböck, H. Semantic segmentation of slums in satellite images using transfer learning on fully convolutional neural networks. ISPRS J. Photogramm. Remote Sens. 2019, 150, 59–69. [Google Scholar] [CrossRef]
  19. Demuzere, M.; Bechtel, B.; Mills, G. Global transferability of local climate zone models. Urban Clim. 2019, 27, 46–63. [Google Scholar] [CrossRef]
  20. Li, Q.; Qiu, C.; Ma, L.; Schmitt, M. Mapping the Land Cover of Africa at 10 m Resolution from Multi-Source Remote Sensing Data with Google Earth Engine. Remote Sens. 2020, 12, 602. [Google Scholar] [CrossRef] [Green Version]
  21. San, D.K.; Turker, M. Building extraction from high resolution satellite images using Hough transform. Int. Arch. Photogramm. Remote Sens. Spat. Inf. Sci. 2010, 38, 1063–1068. [Google Scholar]
  22. Ok, A.O. Automated detection of buildings from single VHR multispectral images using shadow information and graph cuts. ISPRS J. Photogramm. Remote Sens. 2013, 86, 21–40. [Google Scholar] [CrossRef]
  23. Huang, X.; Zhang, L. A multidirectional and multiscale morphological index for automatic building extraction from multispectral GeoEye-1 imagery. Photogramm. Eng. Remote Sens. 2011, 77, 721–732. [Google Scholar] [CrossRef]
  24. Inglada, J. Automatic recognition of man-made objects in high resolution optical remote sensing images by SVM classification of geometric image features. ISPRS J. Photogramm. Remote Sens. 2007, 62, 236–248. [Google Scholar] [CrossRef]
  25. Yang, H.L.; Yuan, J.; Lunga, D.; Laverdiere, M.; Rose, A.; Bhaduri, B. Building extraction at scale using convolutional neural network: Mapping of the united states. IEEE J. Sel. Top. Appl. Earth Obs. Remote Sens. 2018, 11, 2600–2614. [Google Scholar] [CrossRef] [Green Version]
  26. Garcia-Garcia, A.; Orts-Escolano, S.; Oprea, S.; Villena-Martinez, V.; Garcia-Rodriguez, J. A review on deep learning techniques applied to semantic segmentation. arXiv 2017, arXiv:1704.06857. [Google Scholar]
  27. Long, J.; Shelhamer, E.; Darrell, T. Fully convolutional networks for semantic segmentation. In Proceedings of the IEEE Conference on Computer Vision and Pattern Recognition, Boston, MA, USA, 7–12 June 2015; pp. 3431–3440. [Google Scholar]
  28. Ronneberger, O.; Fischer, P.; Brox, T. U-net: Convolutional networks for biomedical image segmentation. In Proceedings of the International Conference on Medical Image Computing and Computer-Assisted Intervention, Munich, Germany, 5–9 October 2015; Springer: Berlin/Heidelberg, Germany, 2015; pp. 234–241. [Google Scholar]
  29. Badrinarayanan, V.; Kendall, A.; Cipolla, R. Segnet: A deep convolutional encoder-decoder architecture for image segmentation. IEEE Trans. Pattern Anal. Mach. Intell. 2017, 39, 2481–2495. [Google Scholar] [CrossRef] [PubMed]
  30. Bischke, B.; Helber, P.; Folz, J.; Borth, D.; Dengel, A. Multi-task learning for segmentation of building footprints with deep neural networks. In Proceedings of the 2019 IEEE International Conference on Image Processing (ICIP), Taipei, Taiwan, 22–25 September 2019; pp. 1480–1484. [Google Scholar]
  31. Bittner, K.; Adam, F.; Cui, S.; Körner, M.; Reinartz, P. Building footprint extraction from VHR remote sensing images combined with normalized DSMs using fused fully convolutional networks. IEEE J. Sel. Top. Appl. Earth Obs. Remote Sens. 2018, 11, 2615–2629. [Google Scholar] [CrossRef] [Green Version]
  32. Ji, S.; Wei, S.; Lu, M. Fully convolutional networks for multisource building extraction from an open aerial and satellite imagery data set. IEEE Trans. Geosci. Remote Sens. 2018, 57, 574–586. [Google Scholar] [CrossRef]
  33. Jégou, S.; Drozdzal, M.; Vazquez, D.; Romero, A.; Bengio, Y. The one hundred layers tiramisu: Fully convolutional densenets for semantic segmentation. In Proceedings of the IEEE Conference on Computer Vision and Pattern Recognition Workshops, Honolulu, HI, USA, 21–26 July 2017; pp. 11–19. [Google Scholar]
  34. Li, X.; Yao, X.; Fang, Y. Building-A-Nets: Robust Building Extraction from High-Resolution Remote Sensing Images with Adversarial Networks. IEEE J. Sel. Top. Appl. Earth Obs. Remote Sens. 2018, 11, 3680–3687. [Google Scholar] [CrossRef]
  35. Ressl, C.; Brockmann, H.; Mandlburger, G.; Pfeifer, N. Dense Image Matching vs. Airborne Laser Scanning—Comparison of two methods for deriving terrain models. Photogramm. Fernerkund. Geoinf. 2016, 2016, 57–73. [Google Scholar] [CrossRef]
  36. Griffiths, D.; Boehm, J. Improving public data for building segmentation from Convolutional Neural Networks (CNNs) for fused airborne lidar and image data using active contours. ISPRS J. Photogramm. Remote Sens. 2019, 154, 70–83. [Google Scholar] [CrossRef]
  37. Vargas-Muñoz, J.E.; Lobry, S.; Falcão, A.X.; Tuia, D. Correcting rural building annotations in OpenStreetMap using convolutional neural networks. ISPRS J. Photogramm. Remote Sens. 2019, 147, 283–293. [Google Scholar] [CrossRef] [Green Version]
  38. Sirmacek, B.; Unsalan, C. Building detection from aerial images using invariant color features and shadow information. In Proceedings of the 2008 23rd International Symposium on Computer and Information Sciences, Istanbul, Turkey, 27–29 October 2008; pp. 1–5. [Google Scholar]
  39. Maggiori, E.; Tarabalka, Y.; Charpiat, G.; Alliez, P. Convolutional neural networks for large-scale remote-sensing image classification. IEEE Trans. Geosci. Remote Sens. 2016, 55, 645–657. [Google Scholar] [CrossRef] [Green Version]
  40. Huang, G.; Liu, Z.; Van Der Maaten, L.; Weinberger, K.Q. Densely connected convolutional networks. In Proceedings of the IEEE Conference on Computer Vision and Pattern Recognition, Honolulu, HI, USA, 21–26 July 2017; pp. 4700–4708. [Google Scholar]
  41. Gu, J.; Wang, Z.; Kuen, J.; Ma, L.; Shahroudy, A.; Shuai, B.; Liu, T.; Wang, X.; Wang, G.; Cai, J.; et al. Recent advances in convolutional neural networks. Pattern Recognit. 2018, 77, 354–377. [Google Scholar] [CrossRef] [Green Version]
  42. He, K.; Zhang, X.; Ren, S.; Sun, J. Deep residual learning for image recognition. In Proceedings of the IEEE Conference on Computer Vision and Pattern Recognition, Las Vegas, NV, USA, 27–30 June 2016; pp. 770–778. [Google Scholar]
  43. Drozdzal, M.; Vorontsov, E.; Chartrand, G.; Kadoury, S.; Pal, C. The importance of skip connections in biomedical image segmentation. In Deep Learning and Data Labeling for Medical Applications; Springer: Berlin/Heidelberg, Germany, 2016; pp. 179–187. [Google Scholar]
  44. Simonyan, K.; Zisserman, A. Very deep convolutional networks for large-scale image recognition. arXiv 2014, arXiv:1409.1556. [Google Scholar]
  45. Kaiser, P.; Wegner, J.D.; Lucchi, A.; Jaggi, M.; Hofmann, T.; Schindler, K. Learning aerial image segmentation from online maps. IEEE Trans. Geosci. Remote Sens. 2017, 55, 6054–6068. [Google Scholar] [CrossRef]
Figure 1. Building detection results obtained from the filter-based method overlaid on the DFK (gray) to identify undocumented buildings (blue).
Remotesensing 12 03537 g001
Figure 2. (a) The location of the state of Bavaria, Germany, (b) The study sites in this research, which cover 16 districts in the state of Bavaria, Germany.
Remotesensing 12 03537 g002
Figure 3. Sample data from (a) TrueDOP, (b) nDSM, (c) rasterized DFK, and (d) tDSM.
Remotesensing 12 03537 g003
Figure 4. Flowchart of the proposed approach for the detection of undocumented building constructions.
Remotesensing 12 03537 g004
Figure 5. The implemented CNN architectures: FC-DenseNet.
Remotesensing 12 03537 g005
Figure 6. Zoomed-in results of undocumented building constructions for one-quarter of the state of Bavaria, Germany at block level.
Remotesensing 12 03537 g006
Figure 7. Example of detection results of undocumented building reconstructions for (a) old undocumented building, (b) new undocumented building, and (c) undocumented story construction.
Remotesensing 12 03537 g007
Figure 8. Building detection results from (a) filter-based method, (b) comparison-based method, and (c) CNN model.
Remotesensing 12 03537 g008
Figure 9. Three examples (ac) represent the building detection results from three CNNs: FCN-8s, U-Net, and FC-DenseNet.
Remotesensing 12 03537 g009
Figure 10. Two examples (a,b) represent the buildings detection results in the district of Bad Toelz obtained from trained model 1 and trained model 2, respectively. Two examples (c,d) represent the buildings detection results in the district of Nuernburg obtained from trained model 1 and trained model 2, respectively.
Remotesensing 12 03537 g010
Table 1. Detailed information of data sets utilized in this research.
Data SetTemporal InformationSpatial ResolutionSizeChannels
Normalized Digital Surface Model (nDSM)year 20170.4 m2500 × 25001
Temporal Digital Surface Model (tDSM)from year 2014 to year 20170.4 m2500 × 25001
Orthophoto with RGB bands (TrueDOP)year 20170.4 m2500 × 25003
Digital Cadastral Map (DFK)year 20170.4 m2500 × 25001
Table 2. The numbers of training and validation patches for the 14 selected districts.
DistrictNumber of Training PatchesNumber of Validation Patches
Ansbach67,96518,077
Wolfratshausen14,9823671
Kulmbach24,9985679
Kronach19,9875112
Landau34,9648733
Deggendorf38,4549763
Landshut60,95715,090
Muenchen88,36422,213
Regensburg47,94711,941
Hemau94812243
Rosenheim59,14114,789
Wasserburg14,1503567
Schweinfurt54,95113,759
Weilheim76,95919,202
Table 3. Statistical accuracy of building detection results among different methods.
MethodOverall AccuracyPrecisionRecallF1 ScoreIoU
Filter-based method97.6%59.7%82.3%69.3%53.0%
Comparison-based method90.4%24.1%89.0%37.9%23.4%
CNN method99.0%84.6%85.5%85.1%74.0%
Table 4. Statistical accuracy of building detection results among different CNNs.
MethodOverall AccuracyPrecisionRecallF1 ScoreIoU
FCN-8s98.8%82.5%80.1%81.2%68.4%
U-Net98.8%81.5%82.3%81.9%69.4%
FC-DenseNet99.0%84.6%85.5%85.1%74.0%
Table 5. Accuracy of two different trained models evaluated in the districts of Bad Toelz and Nuernburg.
Trained ModelTrain and Validation DistrictTest DistrictOverall AccuracyPrecisionRecallF1 ScoreIoU
1AnsbachBad Toelz98.2%75.3%69.4%72.3%56.6%
214 districtsBad Toelz99.0%84.6%85.5%85.1%74.0%
1AnsbachNuernburg92.4%86.9%78.0%82.2%69.8%
214 districtsNuernburg94.6%87.6%84.7%86.1%75.6%
Table 6. Accuracy of two different trained models evaluated in the district of Ansbach.
Trained ModelTrain and Validation DistrictTest DistrictOverall AccuracyPrecisionRecallF1 ScoreIoU
1AnsbachAnsbach98.9%90.9%90.3%90.5%82.7%
214 districtsAnsbach98.8%91.3%89.3%90.3%82.3%
Publisher’s Note: MDPI stays neutral with regard to jurisdictional claims in published maps and institutional affiliations.

