Estimation of Seasonal Evapotranspiration for Crops in Arid Regions Using Multisource Remote Sensing Images


Key Laboratory of Spatial Data Mining and Information Sharing of Ministry of Education, National & Local Joint Engineering Research Centre of Satellite Geospatial Information Technology, Academy of Digital China (Fujian), Fuzhou University, Fuzhou 350108, China
*
Author to whom correspondence should be addressed.
Remote Sens. 2020, 12(15), 2398; https://doi.org/10.3390/rs12152398
Submission received: 19 June 2020
/
Revised: 20 July 2020
/
Accepted: 21 July 2020
/
Published: 26 July 2020
(This article belongs to the Special Issue Remote Sensing of Evapotranspiration (ET) II)
Abstract
:An accurate estimation of evapotranspiration (ET) from crops is crucial in irrigation management, crop yield assessment, and optimal allocation of water resources, particularly in arid regions. This study explores the estimation of seasonal evapotranspiration for crops using multisource remote sensing images. The proposed estimation framework starts with estimating daily evapotranspiration (ETd) values, which are then used to calculate ET estimates during the crop growing season (ETs). We incorporated Landsat images into the surface energy balance algorithm over land (SEBAL) model, and we used the trapezoidal and sinusoidal methods to estimate the seasonal ET. The trapezoidal method used multitemporal ETd images, while the sinusoidal method employs time-series Moderate Resolution Imaging Spectroradiometer (MODIS) images and multitemporal ETd images. Experiments were implemented in the agricultural lands of the Kai-Kong River Basin, Xinjiang, China. The experimental results show that the obtained ETd estimates using the SEBAL model are comparable with those from the Penman–Monteith method. The ETs obtained using the trapezoidal and sinusoidal methods both have a relatively high spatial resolution of 30 m. The sinusoidal method performs better than the trapezoidal method when using low temporal resolution Landsat images. We observed that the omission of Landsat images during the middle stage of crop growth has the greatest impact on the estimation results of ETs using the sinusoidal method. Based on the results of the study, we conclude that the proposed sinusoidal method, with integrated multisource remote sensing images, offers a useful tool in estimating seasonal evapotranspiration for crops in arid regions.

1. Introduction
Water is an essential resource, especially for agriculture in arid and semiarid regions [1,2]. One vital component to describe the hydrological cycle in ecological systems and to estimate water balance is evapotranspiration (ET). ET is the process by which water is transported from the earth’s surface to the atmosphere by the evaporation from surfaces (soils and wet vegetation) and by the transpiration from plants through the stomata present in the plant leaves [3,4]. Crop evapotranspiration is a fundamental variable in the hydrological cycle and is thus significant for the management of irrigation and water resources [5]. However, accurately assessing ET for crops is challenging because of its high spatial and temporal variability.
Many studies have been conducted to estimate ET using methods such as sap flow [6], lysimeters [7,8], the Bowen ratio [9], and eddy covariance [10,11]. These traditional methods rely on field surveys and are limited to small areas. For larger areas, directly applying traditional approaches is often difficult due to the complexity of hydrological processes and land surface factors. An observation network is generally required to measure ET for vast regions, which is labor-intensive and costly. In recent years, numerous approaches have been developed that allow for the dynamic estimation of ET using satellite images [12]. Remote sensing has been considered as an effective means to obtain ET over various spatial and temporal scales [13,14,15,16,17,18,19]. In the literature, increasing attention has been given towards the estimation of ET using remote sensing technology [20,21,22]. Several ET products and models have been proposed (e.g., ETMonitor with a spatial resolution of 1 km and a temporal resolution of one day [23,24,25], Moderate Resolution Imaging Spectroradiometer (MODIS) MOD16 with 1 km/8 day [26,27,28], EUMETSAT Satellite Application Facility on Land Surface Analysis (LSA-SAF) MSG ET with 5 km/30 min [29], Global Land Evaporation Amsterdam Model (GLEAM) with 25 km/1 day [30,31,32], and FLUXCOM with 50 km/1 month [33]). References [34,35,36] reviewed the available methods for ET estimation based on different structural complexities, theories, and assumptions. These methods can be grouped into four categories: (1) empirical methods using statistically-derived relationships between ET and vegetation indices; (2) residual surface energy balance models, such as single and dual-source models, the Surface Energy Balance System (SEBS) [37], Surface Energy Balance Index (SEBI) [38], and the surface energy balance algorithm over land (SEBAL) [39]; (3) physically-based methods based on the Penman–Monteith (PM) [40,41] and Priestley–Taylor (PT) [42] equations; and (4) data assimilation methods with heat diffusion equation and radiometric surface temperature sequences. The spatial resolution of remote sensing images affects the accuracy of ET estimates. Since most ET products offer a coarse spatial resolution at either the national, continental, or global scales, the accuracy of their estimates is significantly constrained [27]. In order to improve the accuracy of ET estimates, new approaches would have to be developed that utilize remote sensing images with a high spatial resolution at a regional scale.
Among existing models, SEBAL is one of the most widely used models for arid and semiarid regions because of its flexibility in different vegetation types and climatic characteristics and its strong physical foundation. The applicability of the SEBAL model has been evaluated in many different regions. For example, the SEBAL model has been used to estimate ET in various studies areas in China, India, Spain, and Pakistan, and results have shown that the accuracy of estimated ET is about 85% compatible with the field measurements without calibration [39,43]. Researchers have conducted studies estimating ET with the SEBAL model by using Landsat [44,45,46,47] and MODIS satellite images [48,49]. Compared with lysimetric measurements, eddy correlation, and Penman–Monteith methods, the ET estimated by incorporating the Landsat images into the SEBAL model performed better than when incorporating the MODIS images. An existing study showed that Landsat ET can be better than MODIS ET due to its high spatial resolution [50]. Most of the SEBAL-related studies estimated ET on a daily scale; few studies have estimated ET for crops using Landsat remote sensing images during the growing season. Linear and spline interpolation are the most popular methods to estimate seasonal ET (ETs) in existing studies [51,52,53]. The ET, however, does not change linearly with time during the crop growing season. A possible practice to improve the estimation of ETs is to combine the change curve of ET with time. In addition, an alternative is to derive monthly ET based on the monthly average crop coefficient, for which the ETs can be obtained using the monthly ET [54,55], but this strategy is data-intensive. The estimation of evapotranspiration for crops during the growing season is essential for scientific irrigation. Therefore, it is necessary to explore more effective methods to estimate the ETs for crops.
This study aims to develop more efficient methods to estimate seasonal evapotranspiration for crops with a relatively high spatial resolution and only based upon multisource remote sensing images within one year. We propose a trapezoidal method and a sinusoidal method to achieve this objective. The novelty and innovation of this study are as follows:
- (1)
- The SEBAL model is used to obtain ETd for crops in arid regions from Landsat images;
- (2)
- A trapezoidal method is employed to extend ETd to ETs using multitemporal ETd data; and,
- (3)
- A sinusoidal method is proposed to derive ETs from ETd using multisource remote sensing images.
The remainder of this paper is structured as follows. Section 2 describes the study area and datasets. Section 3 discusses the proposed methodology for ETd and ETs estimation. Section 4 presents the experimental results, followed by the discussion and conclusions in Section 5 and Section 6, respectively.
2. Study Area and Data
2.1. Study Area
The agricultural land of the Kai-Kong River Basin in Xinjiang, China, was selected as the study area (Figure 1). Located in Northwestern China, Xinjiang is characterized as having an extreme arid climate [56] and is considered as an important region for crop production. The agricultural lands of the Kai-Kong River Basin are important planting regions for crops in Xinjiang. The Kai-Kong River Basin is located at 40°48′–43°20′N and 82°56′–88°12′E, covering an area of around 5.7 × 10⁴ km2. It includes the Kaidu River Basin in the upstream and the Kongque River Basin in the downstream. The terrain is characterized as rugged in the northwest and flat in the southeast, and the altitude ranges from 600 to 4800 m [57]. Figure 1 shows the agricultural land of the Kai-Kong River Basin, which is delineated by a red line. The area includes 1.02 × 10³ km2 agricultural lands of Bosten Lake, 2.46 × 10³ km2 agricultural lands of the Kaidu River, and 2.79 × 10³ km2 agricultural lands of the Kongque River [58]. The study area is characterized by an arid continental climate with a long sunshine time, a large temperature difference between day and night, frequent climate fluctuations, sparse rainfall, and severe evaporation. The precipitation in this area is concentrated from April to July, with maximum precipitation at 20–40 mm. The agricultural land of the Kai-Kong River Basin provides a representative area for research on crop evapotranspiration in arid regions. The major crops in the study area are wheat, corn, cotton, chili, and pear, and the cropping period runs from March to October. The cropping system is one crop per annum, and the crop phenology includes the following: wheat and pear are cultivated and turn green in mid-March and mature in July and October; chili is planted in mid-April and harvested in late September; corn and cotton emerge in early May and mature in September and October.
2.2. Study Data
Three kinds of data were used in this study: remote sensing images, meteorological data, and ancillary data. Remote sensing data include Landsat and MODIS images acquired in 2016. The Landsat images were obtained from Landsat 7 Enhanced Thematic Mapper Plus (ETM+) and Landsat-8 Operational Land Imager and Thermal Infrared Sensor (OLI/TIRS) (Path = 143, Row = 31). In total, we collected 13 cloud-free multitemporal Landsat images during the 2016 cropping season with a level correction 1T (terrain corrected) from the USGS Earth Explorer site (https://earthexplorer.usgs.gov/). The spatial resolution of visible bands is 30 m, and the spatial resolution of the thermal infrared bands of Landsat 7 ETM+ and Landsat-8 OLI/TIRS is 60 and 100 m, respectively. Details of the Landsat images are presented in Table 1. The Landsat images were preprocessed by applying radiometric calibration, atmospheric correction, and clipping. Due to the banding phenomenon caused by the failure of the satellite scan line corrector for the Landsat 7 ETM+ images acquired after 31 May 2003, stripping processing was required for Landsat 7 ETM+ images. For the MODIS data, we downloaded 46 time-series MOD16A2 images, with the spatial and temporal resolutions of 500 m over 8 days, for 2016 from the NASA Earth Data site (http://earthdata.nasa.gov). We preprocessed the MODIS data by applying project transformation (sinusoidal projection to UTM_Zone_45N), format conversion (HDF to TIF), band extraction (ET band), real value calculation (valid_data × scale_factor), image clipping, and S-G filtering [59,60]. For the digital elevation model (DEM), we downloaded 18 ASTER Global Digital Elevation Model 2 (ASTGTM2) images with 30 m resolution from the website (http://www.gscloud.cn/), whose processing consisted of image mosaic and clipping operations.
For the meteorological dataset, we obtained data for wind speed, air temperature, average air pressure, precipitation, air humidity (vapor pressure or dew point temperature), solar radiation, and meteorological station characteristics (height of wind measurement and vegetation height). The daily meteorological dataset was downloaded from the China Meteorological Data Sharing Service Network (http://data.cma.cn/). Ancillary data, which include crop sample points, planting structure, and phenology information, were also collected for the study. A detailed description of these data can be found in our previous study [61].
3. Methods
The proposed framework for ETs estimation is shown in Figure 2. The SEBAL model was applied to obtain instantaneous evapotranspiration values (ETinst) using multitemporal Landsat images, meteorological data, and DEM data, which were then converted into ETd. A trapezoidal method and a sinusoidal method were then used to upscale the ETd to the ETs. The trapezoidal method estimates ETs based only on the multitemporal ETd images derived by SEBAL, while the sinusoidal method estimates ETs using multisource remote sensing images. For the trapezoidal method, the formula for the trapezoidal area was applied to estimate ETs for crops. For the sinusoidal method, we used time-series MOD16A2 images to obtain the change in the crops’ ET between phenological dates (day of year, DOY). Multitemporal ETd images were then used to calculate the ETs for crops.
3.1. ETd Estimation Based on the SEBAL Model
SEBAL is a flux algorithm based on a complete radiation and energy balance, along with resistances for momentum, heat, and water vapor transport for every pixel [62,63]. It estimates ET through a simplified land surface energy balance method. When using SEBAL, the values for albedo, normalized difference vegetation index (NDVI), land surface temperature (TS), and emissivity from Landsat images are calculated first. Together with meteorological and DEM data, these values are used to estimate key variables in the energy balance equation, including net radiation flux (Rn), soil heat flux (G), and the sensible heat flux (H). We can obtain the latent heat flux (LE) as a residual using the equation:
Based on the latent heat flux (LE), the instantaneous evapotranspiration (ETinst) is defined as follows [64,65,66]:
where λ indicates the latent evaporation heat. Previous studies have shown the effectiveness of the sine method to convert ETinst to ETd using this expression [67,68]:
where N is the number of daily ET hours, and t is the time interval between sunrise and data-collecting time of the Landsat satellite. This equation is inspired by the ETinst change curve on a clear day, which closely conforms to a sine relation. In this paper, we use the same method to convert ETinst into ETd.
3.2. Validation of the SEBAL Algorithm Performance
We used the Penman–Monteith (PM) model proposed by the Food and Agriculture Organization (FAO) in 1998 [69] to verify the accuracy of the ETd obtained by the SEBAL model. The actual evapotranspiration (ETc, mm·day−1) of the crops is calculated using the formula:
where Kc is the crop coefficient, and ET0 is the reference evapotranspiration (mm·day−1). The ETc obtained by the PM model has generally been used to verify the accuracy of ETd estimated by other models [3,70], which is why the PM model was selected to validate the results of this study.
3.3. ETs Estimation Based on the Trapezoidal Method
We propose a trapezoidal method to estimate the ET of crops using multitemporal ETd images derived by SEBAL. Suppose that multitemporal Landsat images are acquired during the crop growing season. Let Dm, , be the acquired time (DOY) of the mth Landsat image, and n is the total number of the acquired images. Let ETk be the ETd estimated at different periods, ETm as the ETd of Landsat image on the mth period, and as the time difference between adjacent images. The ETd change curves with the DOY of crops during the growing season are shown in Figure 3. The blue trapezoid area in Figure 3 is bounded by the ETd curve of crop 1 between two adjacent dates Dm and Dm+1. The default value of ET0 is 0, and the area of the trapezoid is then (ETm+ETm+1) × Δdm/2. The calculated area is regarded as the cumulative ET for Dm to Dm+1. To obtain the ETs, the areas of all trapezoids during the crop growing season were aggregated for the crops. The formula of the trapezoidal method is given in Equation (6), as follows:
According to the definition, the estimation accuracy of the trapezoidal method is dependent on the intensity of the ETd time-series. Th e ETs can be derived with a high estimation accuracy when a sufficient number of Landsat images is used.
3.4. ETs Estimation Based on the Sinusoidal Method
Acquiring over 15 Landsat images with satisfactory quality for a specific area within a year is usually difficult due to low temporal resolution and meteorological factors, such as cloud and rain. To deal with this problem, we propose a new method to estimate the ET of crops during the growing season using multisource remote sensing images. MOD16A2 images have high temporal resolution, i.e., eight days, and can reflect the change of crop ET during the year and crop growing season, while Landsat images have a relatively high spatial resolution, i.e., 30 m, and can estimate ET at a finer level. The proposed method, referred to as the sinusoidal method in this paper, estimates the ETs of crops using time-series MOD16A2 images and the ETd images produced by SEBAL. The workflow of the sinusoidal method is shown in Figure 4.
We first randomly selected ten sample points from each crop as the training points and the remaining sample points as testing points. We used the training points to extract the ET from 46 time-series MOD16A2 images and obtain the ET change curve of the five main crops, which intuitively, is similar to the shape of a trigonometric curve. Based on the conversion method (ETinst to ETd) discussed in Section 3.1, we assumed that the ETd change meets the form of a sine function (Equation (7)) within a year and is given by the expression:
where y is the ETd of crops, and x represents the image acquisition date (DOY). The coefficients y0, A, xc, and w were then determined by the time-series ETd for every pixel. To verify our assumption, we used the testing points to extract the ET from 46 time-series (MOD16A2) images and obtained the ET values for the five crops. We applied the sine function (Equation (7)) to the ET data and obtained the y0, A, xc, w, and the coefficient of determination (R2) for each crop. If the R2[0.60, 1], we considered that the pattern of the change of the ETd can be formulated as a sine function. We then applied the sine function form to the multitemporal ETd images and obtained the fitted sine function for each pixel at the same coordinate. Finally, we integrated the fitted sine function to obtain ETs for each pixel and acquired the distribution of ETs by calculating every pixel in the multitemporal ETd images.
4. Results
4.1. Temporal-Spatial Variation of ETinst and ETd Obtained by the SEBAL Model
We used the SEBAL model to obtain ETinst and ETd using Landsat images (Figure 5). The figure shows high consistency for both the ETinst and ETd, ranging between 0–1.20 mm·h−1 and 0–8.00 mm·d−1, respectively. We then used sample points for the five main crops to extract the ET from the ETd images, and we obtained the change curve of ETd, as shown in Figure 6.
Based on the phenological information of the five main crops in the study area, we divided the DOY into three stages: the initial stage of growth from 97 to 137, the middle stage from 137 to 249, and the late stage from 249 to 305. In Figure 5, the ETinst and ETd values gradually increased with the growth of crops in the initial stage and reached their peaks in the middle stage. The range of the ETinst and ETd values are similar to that in the initial stage but gradually decreased at the late stage. Based on the crop planting structure in the study area, the high ETinst and ETd values were concentrated in the pear fields, while the low values were concentrated in the cotton fields. Wheat was the first to be planted and the earliest to mature. The ETd associated with wheat started to increase on DOY 79 and began to decrease on DOY 177 (see Figure 6). Pear had the longest growing period, which was sown the earliest and was the last to mature. The ETd of pear started to increase on DOY 97 and had the slowest rate of decrease among the five main crops. Chili was sown after wheat and pear, which was then followed by corn and cotton. The ETd of chili started to increase on DOY 105 while the ETd of corn and cotton started to rise on DOY 113.
4.2. Accuracy Assessment of ETd Obtained by the SEBAL Model
In this study, we referred to existing studies to obtain the crop coefficients of cotton for accuracy assessment because of the difficulty in the acquisition of field data of Kc. Cotton is the most widely planted crop in Xinjiang. Most of the related studies focused on cotton but few on the derivation of crop coefficients for other crops. It is therefore hard to obtain the validation data of other crops for the accuracy assessment. Here, we referred to the Kc of cotton from related studies and used the FAO model to verify the accuracy of ETd derived from the SEBAL model. We estimated ETc using meteorological data and the crop coefficient (Kc) for cotton, where the Kc of cotton was provided by [71]. The estimation accuracy of the SEBAL model is defined as 1-(|ETc-ETd|/ETc). Accuracy verification for cotton’s ETd was obtained using the SEBAL model, as summarized in Table 2. This table shows that the difference between the ETd obtained using the SEBAL model and the actual evapotranspiration (ETc) derived using the PM model was within one mm·day−1, and the accuracy of ETd was more than 80%.
4.3. Validation Results of the Sinusoidal Method
We used the testing points to extract the ET from 46 time-series MOD16A2 images and obtain the ET values for the five main crops. We also used the MOD16A2 images covering the crop growing season to extract the ET values during the crop growth period based on crop phenology. We then applied the sine function (Equation (7)) to obtain the ET change curves for the entire year (Figure 7a) and the growing season (Figure 7b). The function fitting formula and the coefficient of determination (R2) for each crop are shown in Table 3.
The results show that the coefficients of determination (R2) for the main crops during the entire year are greater than 0.80, while the R2 values of the fitting functions during the crop growing season were over 0.85 except for cotton in both cases. The sinusoidal function of cotton had low fitting accuracy, and the shape of the fitted curve was different from other crops. This is mainly due to some missing pixels in the cotton region of the MODIS images, which resulted from the low image quality. When using the sample points of cotton to extract ET values from the time-series MOD16A2 images, there were about 47% null values in the missing pixels. These missing pixels may affect the accuracy of function fitting for cotton.
4.4. Distribution of ET during Crop Growing Season
The use of the trapezoidal method in estimating ETs is dependent on the date of acquisition (DOY) of the Landsat images and requires that the estimation interval is discrete. In contrast, the sinusoidal method is not constrained by the image acquisition date and has the advantage of continuous estimation interval. In this study, we designed three experiments to test the estimation results using the trapezoidal and sinusoidal methods. To estimate the ETs for five main crops, we used the ETd images covering the growth period of each crop to estimate the ETs based on their different phenological information. In Experiments A and B, the estimation intervals were set up using similar acquisition dates and crop phenology to compare the ETs results using the two methods. The discrete estimation intervals (DOY) of the trapezoidal method were set as follows: wheat (97, 105, 113, 137, 153, 177, 209, 217, 249, 265, 281), corn (113, 137, 153, 177, 209, 217, 249, 265, 281), cotton (113, 137, 153, 177, 209, 217, 249, 265, 281, 289, 305), chili (105, 113, 137, 153, 177, 209, 217, 249, 265, 281), and pear (97, 105, 113, 137, 153, 177, 209, 217, 249, 265, 281, 289, 305). The distribution of ETs by the trapezoidal method is shown in Figure 8a. For the sinusoidal method, the continuous estimation intervals were set as follows: wheat (97,281) corn (113,281) cotton (113,305) chili (105,281) and pear (97,305) The spatial distribution of ETs is shown in Figure 8b. In Experiment C, we changed the estimation intervals from Experiment B based on the growth period mentioned in Section 4.3. This was to evaluate the influence of the estimation interval on the ETs estimates from the sinusoidal method. The estimation intervals were set as follows: wheat (81,281) corn (121,281), cotton (121,313) chili (105,281) and pear (81,313) The distribution of ETs is shown in Figure 8c. The calculation process of ETs was implemented through Interactive Data Language (IDL) programming, and the frequency distribution of ETs is shown in Figure 9.
The distribution shape of the ETs obtained by the trapezoidal method was consistent with that of the sinusoidal method, as shown in Figure 8 and Figure 9. In both methods, ETs values in pear fields were found with relatively high values, mainly because it had the longest growing period. There were some noticeable differences between the ETs obtained from the trapezoidal and sinusoidal methods. Under the same estimation intervals, the ETs estimates from the trapezoidal method are higher than that of the sinusoidal method, as presented in Figure 8a,b. Based on the results of Experiments B and C, the ETs estimates change when the estimation intervals are modified. When estimation intervals are set based on the crop phenology, more accurate ETs estimates can be obtained.
4.5. ET of Five Main Crops during the Growing Season
Figure 10 presents the box plots of ETs values for wheat, corn, cotton, chili, and pear, while the average ETs for the five crops are shown in Table 4. The results show pear had the highest evapotranspiration during the growing season, followed by chili. The ETs of wheat, corn, and cotton were found to be similar. Under the same estimation interval, the ETs estimates derived using the trapezoidal method were higher than those obtained using the sinusoidal method. Comparing the average ETs values from Experiments B and C, the change in the estimation interval resulted in different ETs estimates using the sinusoidal method. For wheat, the estimation interval expanded from (97,281) in Experiment B to (81,281) in Experiment C, and its average ETs increased from 634.57 to 660.18 mm. Similarly, the estimation interval for pear was extended from (97,305) to (81,313), and its average ETs increased from 891 to 943.81 mm. For corn, the contraction of the estimation interval by eight days, from (113,281) to (121,281), caused a slight decrease in the average ETs from 645.53 to 641.43 mm. For chili, the estimation interval in Experiments B and C was identical, and the average ETs were almost the same.
4.6. Performance of the Proposed Methods for Different Acquisition Frequency of Landsat Images
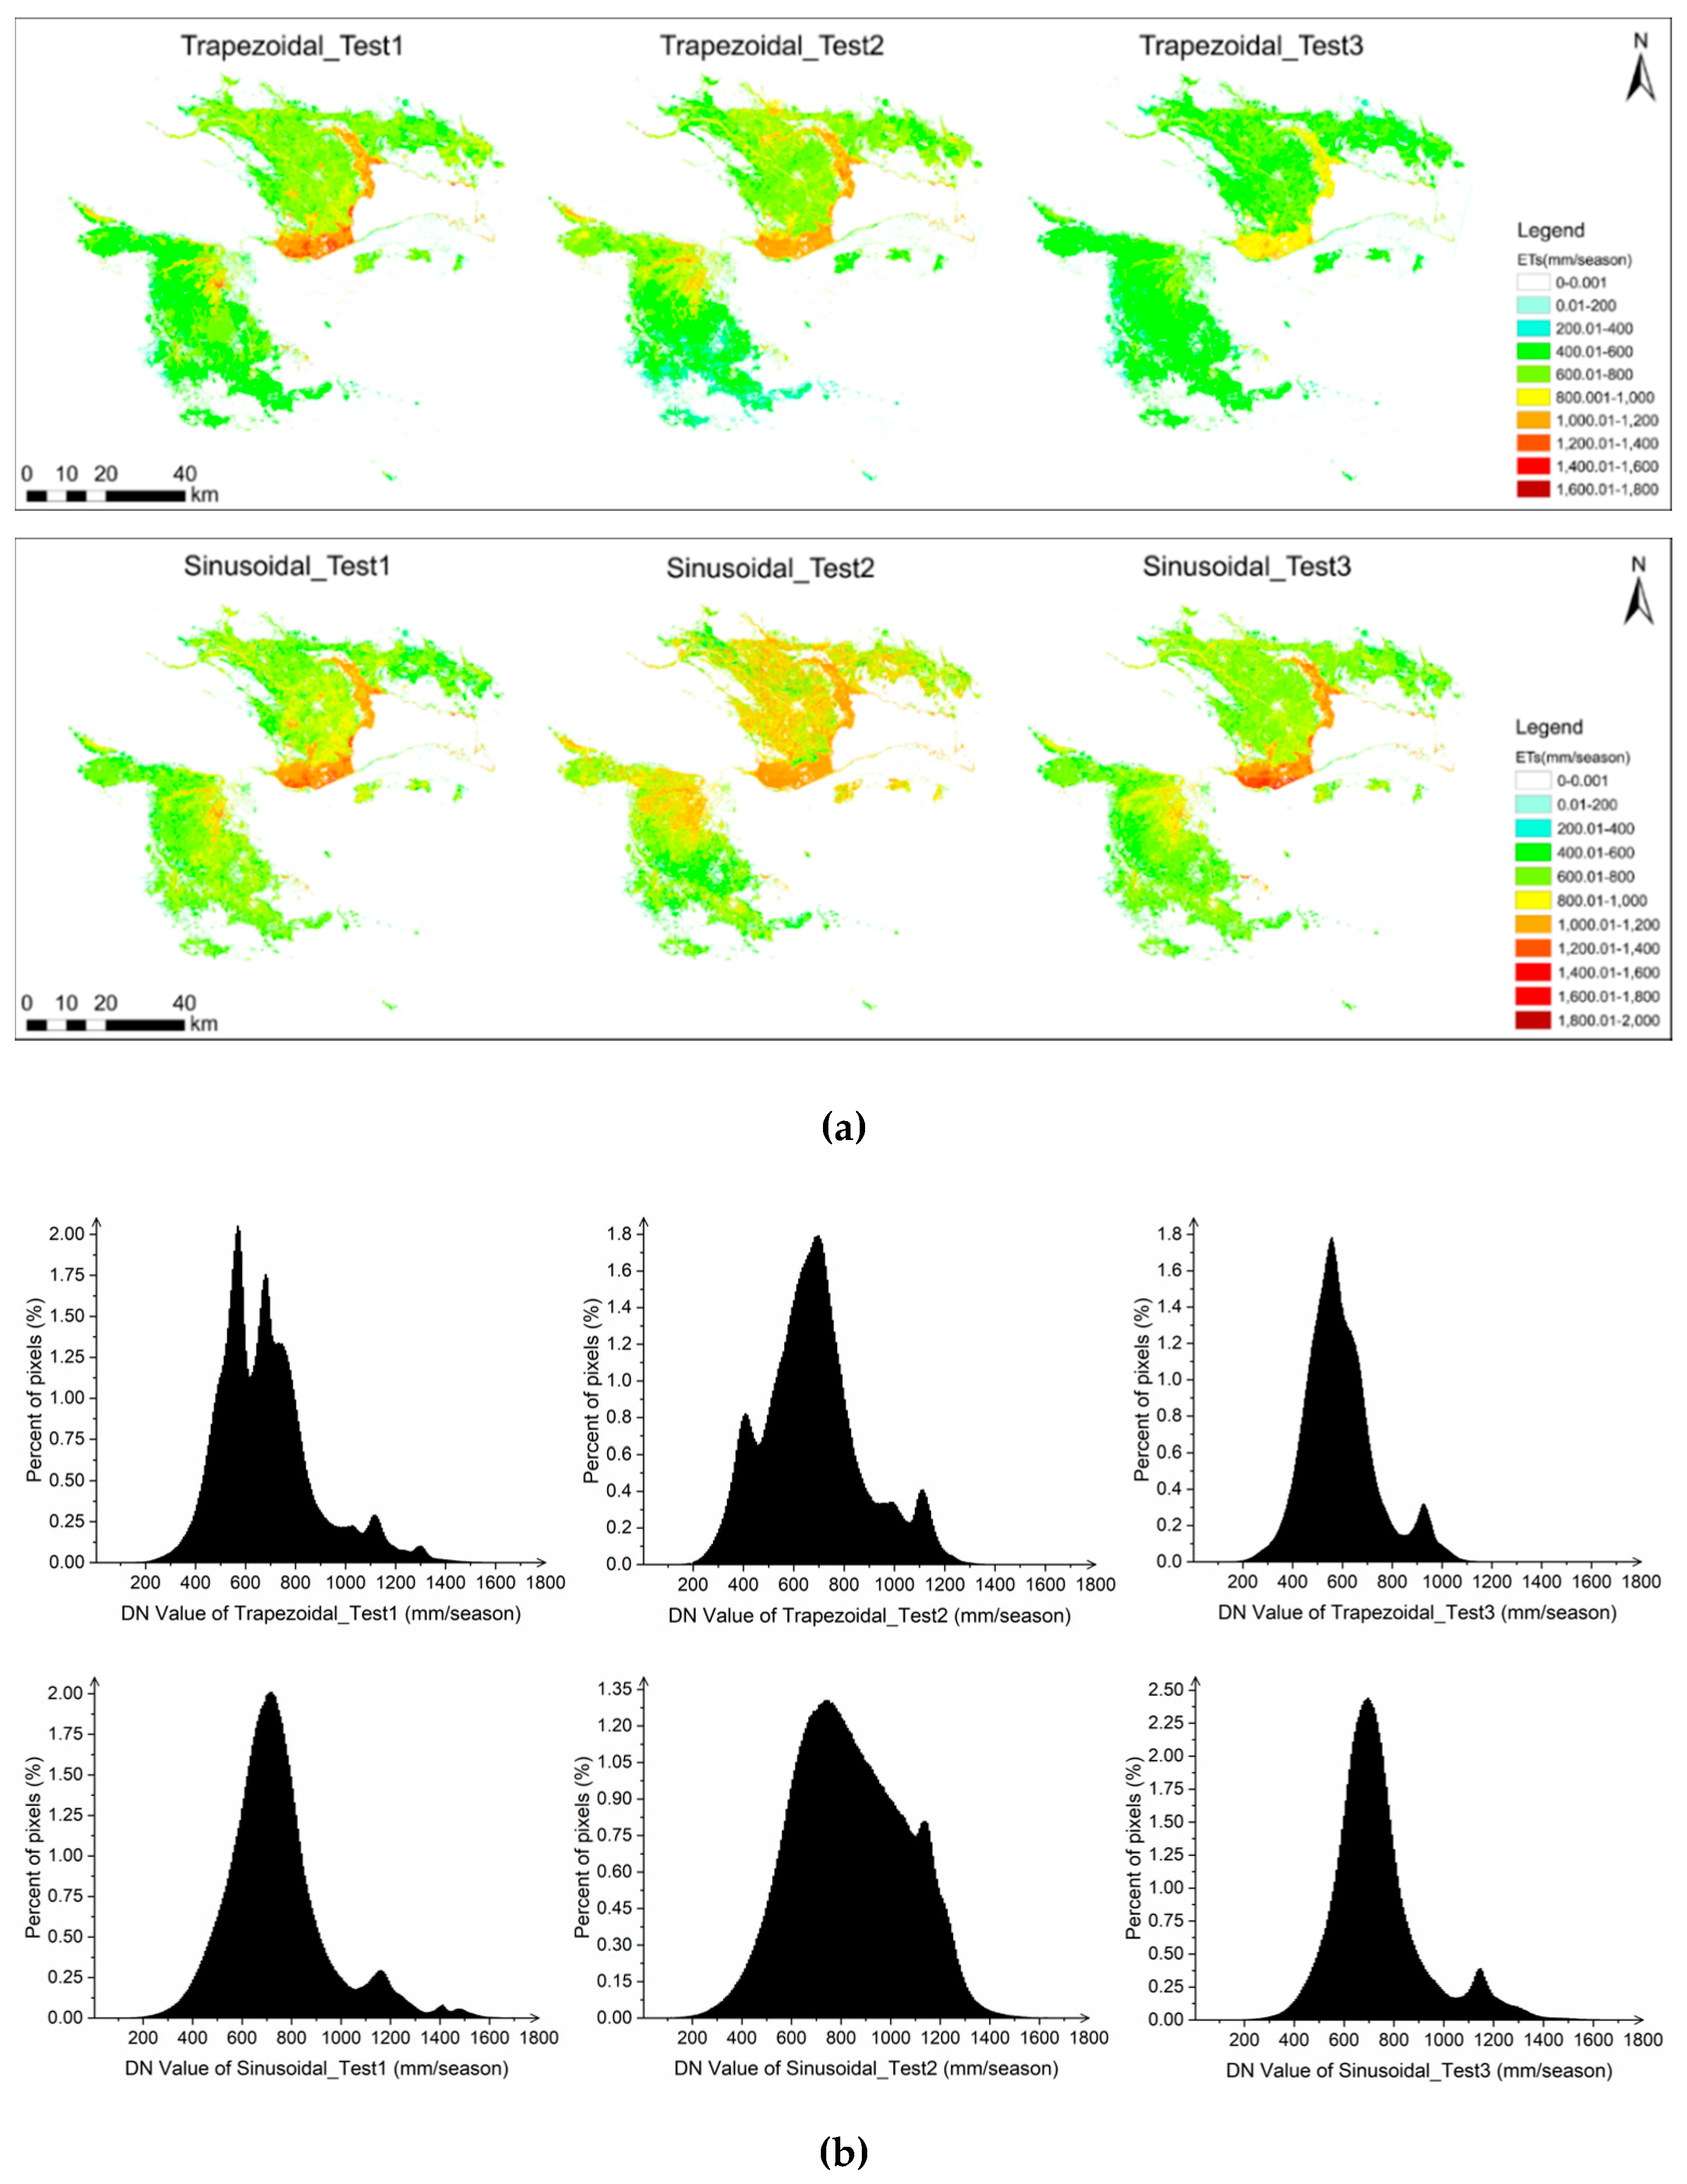
Obtaining time-intensive Landsat images is often challenging for areas with high precipitation and frequent cloud cover. To explore the impact of missing images at various stages of growth on the accuracy of ETs estimates, the trapezoidal and sinusoidal methods proposed in this paper were used to estimate ETs using different combinations of multitemporal Landsat images. The experimental design is shown in Table 5.
Three sets of experiments were implemented: (1) the early stage of crop growth was excluded (DOY: 97, 105, 113, 137); (2) the middle stage of crop growth was excluded (DOY: 153, 177, 209, 217); and (3) the final stage of growth was excluded (DOY: 249, 265, 281, 289). We set the intersection of the estimation interval in Section 4.4 Experiment A and the involved images in each test as the estimation interval for each crop because the estimation interval is discrete for the trapezoidal method. Taking the wheat in Test 1 as an example, the discrete estimation interval (DOY) of wheat in Section 4.4 Experiment A is (97, 105, 113, 137, 153, 177, 209, 217, 249, 265, 281), images involved in Test 1 are (DOY: 153, 177, 209, 217, 249, 265, 281), and the intersection of the two datasets is (DOY: 153, 177, 209, 217, 249, 265, 281). Then, we set the estimation interval of wheat as (DOY: 153, 177, 209, 217, 249, 265, 281). We used a similar method to set estimation intervals for other crops in the three experiments. The estimation interval is continuous for the sinusoidal method, and the setting of the integration interval was the same as that in Section 4.4 Experiment C. Figure 11a shows the distributions of ETs for the three experiments, while the frequency distributions are presented in Figure 11b.
The tests with excluded images showed lower ETs results compared with the estimates using all 13 Landsat images (see Figure 8a) using the trapezoidal method, whereas higher ETs results were found using the sinusoidal method compared with the estimates using all 13 Landsat images (see Figure 8c). Results showed that the frequency of ETs estimated using 9 Landsat images had a significant difference from the frequency using 13 Landsat images (Figure 9) for the trapezoidal method. The frequency of estimated ETs, however, was similar for the sinusoidal method when using either 13 or 9 Landsat images covering the early stage (Test 1) and final stage (Test 3) of crop growth period. This indicates that the sinusoidal method performed better than the trapezoidal method when using Landsat images with low temporal resolution. Moreover, in Test 2 using the sinusoidal method, the ETs of wheat, corn, and chili were higher, as indicated by vast areas of land shown in orange and red (Figure 11a). This suggests that the effect of missing images at the middle stage of crop growth on ETs estimation is more significant than that of missing images at the early or final stages.
5. Discussion
In this study, we investigated the estimation of seasonal evapotranspiration for crops in the arid region using multisource remote sensing images. We applied the SEBAL model to estimate the ETd and proposed a trapezoidal method and a sinusoidal method to estimate evapotranspiration of crops during the growing season. We found that the estimation results from the SEBAL model using Landsat images can reasonably reflect the ETd of cotton in the study area. We also learned that the sinusoidal method performed better than the trapezoidal method when using Landsat images with low temporal resolution. When we tried excluding images in the analysis, we found that the omission of images during the middle stage of crop growth has the greatest impact on the estimation results of ETs using the sinusoidal method. Based on these results, we found that the sinusoidal method integrated with multisource remote sensing images offers a useful tool to estimate ETs with a spatial resolution of 30 m.
The change of ETd is related to the stages of growth and phenology of the crops (see Figure 6). In the initial stage of growth, while the crops grow fast, the ETd steadily increases. In the middle stage, when the crops reach their maximum growth, the ETd reaches its peak. In the late stage, the crops mature and are harvested, resulting in the decrease of ETd values. Estimated ET values of cotton derived from the SEBAL model were close to the actual ET values obtained using the Penman–Monteith model (see Table 2). This means that the results derived from the SEBAL model were able to properly estimate the ETd of cotton in the agricultural lands of the Kai-Kong River Basin. However, this study validated the accuracy of the ETd that is only based on one crop due to the lack of Kc data for other crops. Future research can be conducted to further assess the estimation accuracy of the SEBAL model by using the crops coefficients for other crops. In addition, we used the Gapfill extension tool implemented in the ENVI software to deal with the stripping errors of Landsat 7 ETM+ images. Nevertheless, some error pixels still exist in the strips. Since these pixels only account for a small portion (i.e., less than 10%) of the total image pixels, the estimated ETd and ETs might be influenced only slightly by stripping errors.
The actual ETd is generally difficult to measure due to the high spatial and temporal variability. During the crop growing season, obtaining field measurements of evapotranspiration is often highly problematic. In the absence of actual measurements, previous studies validated their ETd estimates by comparing them with the data provided in the literature [72]. Similarly, we also used the results from related studies to verify the accuracy of our ETs estimates, due to the lack of actual field data. Previous studies showed that the average annual water requirement for cotton was 679.00 mm in the Tarim River Basin in Xinjiang from 1989 to 2010, and the average annual effective rainfall was 63.00 mm [73]. Thus, the average annual evapotranspiration for cotton is about 743.00 mm in the Tarim River Basin, which is composed of nine river systems, including the Kai-Kong River Basin. The average annual water requirement for cotton in the Kai-Kong River Basin ranges from 555.70 to 810.20 mm from 1963 to 2012 in another research [74], where the average annual evapotranspiration was about 618.70–873.20 mm. The estimated ETs of cotton were 725.18, 638.52, and 690.61 mm all within the range, indicating that the estimated results are reasonable. Future work can be conducted to further evaluate the accuracy of the proposed methods using actual measurements from lysimeters.
In this paper, we used 13 Landsat images to estimate ETs, and we achieved good results via both the trapezoidal and sinusoidal methods. To evaluate the performance of the proposed methods for the different acquisition frequencies of the Landsat images, we designed three sets of experiments that excluded images in the early stage, the middle stage, and the final stage of crop growth. The results indicate that the trapezoidal method is suitable when using Landsat images with high temporal resolution, while the sinusoidal method is suitable when using Landsat images with low temporal resolution. Furthermore, the middle stage of crop growth is an important integral component of ET estimation for the sinusoidal method. When obtaining time-intensive Landsat images is difficult, the sinusoidal method can still be used to estimate ETs even with the absence of some images in the early or final stages of the crop growing season. The sinusoidal method, integrated with multisource remote sensing images, offers a useful tool to estimate ETs with a spatial resolution of 30 m for crops in the study area. Moreover, we used the sine function to fit the time-series ET data, extracted from MOD16A2 images, mainly inspired by the method of extending ETinst to ETd estimates in this paper. In future endeavors, we will apply the polynomial function and other functional forms to the time-series ET data, and we will compare the fitting accuracy of the sine function.
Compared with other methods for estimating ETs, the main advantage of the proposed sinusoidal method is that it estimates ETs for crops using remote sensing images only covering the crop growth period within one year. In this paper, we applied the sinusoidal method to estimate the ETs in the arid region of the agricultural land of the Kai-Kong River Basin in Xinjiang. This method also has the potential to be applied in semiarid or temperate regions. The ETd derived from the SEBAL serves as an input for the estimation of ETs by the sinusoidal method. Since the SEBAL has been widely used in arid and semiarid regions, as well as temperate regions [75], we believe that the sinusoidal model can also be used to estimate ETs in semiarid and temperate regions based on the multitemporal ETd images derived from the SEBAL model and time-series of MOD16A2 images. Nonetheless, future research can be conducted to further test the applicability of the sinusoidal method in these regions. In addition, the spatial resolution of the ETs obtained for crops depends on the resolution of the input of multitemporal ETd images, i.e., 30 m resolution in this paper. Theoretically, the proposed method can also be used to obtain ETs with different resolutions when using ETd images with different resolutions, leading to our future work.
6. Conclusions
This study investigated the estimation of seasonal evapotranspiration for crops in an arid region using multisource remote sensing images. We applied the SEBAL model to estimate the ETd in the agricultural lands of the Kai-Kong River Basin, Xinjiang, China. We proposed a trapezoidal and a sinusoidal method to upscale ETd values to ETs. Based on the results of the study, we conclude the following:
- (1)
- The SEBAL model is effective in estimating the ETd of cotton using Landsat images in the agricultural lands of the Kai-Kong River Basin, Xinjiang, China.
- (2)
- Compared with the trapezoidal method, the sinusoidal method can obtain more accurate ETs when using Landsat images with low temporal resolution.
- (3)
- The sinusoidal method integrated with multisource remote sensing images offers a useful tool to estimate ETs with a spatial resolution of 30 m for crops in the arid area.
Author Contributions
M.C. and X.W. conceived and designed the experiments; M.C. and M.L. performed the experiments; M.C., M.L., and X.W. analyzed the results; M.C. and M.L. wrote the paper; M.C., M.L., and X.W. revised the paper. All authors have read and agreed to the published version of the manuscript.
Funding
This research was funded by National Key Research and Development Project (2017YFB0504203) and the Central Guide Local Science and Technology Development Project (2017L3012).
Acknowledgments
The authors thank Yali Li, Wuhan University, for her support in the collection and preprocessing of Landsat satellite images, and thank the funding for financical support.
Conflicts of Interest
The authors declare no conflict of interest.
References
- Duarte, R.; Yang, H. Input–Output and Water: Introduction to the Special Issue. Econ. Syst. Res. 2011, 23, 341–351. [Google Scholar] [CrossRef]
- Yu, O.; Raichle, B.; Sink, S. Impact of biochar on the water holding capacity of loamy sand soil. Int. J. Energy Environ. Eng. 2013, 4. [Google Scholar] [CrossRef] [Green Version]
- Rawat, K.S.; Singh, S.K.; Bala, A.; Szabó, S. Estimation of crop evapotranspiration through spatial distributed crop coefficient in a semi-arid environment. Agric. Water Manag. 2019, 213, 922–933. [Google Scholar] [CrossRef]
- Allen, R.G.; Pereira, L.S.; Raes, D.; Smith, M. Crop Evapotranspiration-Guidelines for Computing Crop Water Requirements-FAO Irrigation and Drainage Paper 56; FAO: Rome, Italy, 1998; Volume 300, p. D05109. [Google Scholar]
- Guo, E.W.; Zhang, L.J. Estimating Evapotranspiration Using SEBAL Model and Landsat-8 RS Data. J. Irrig. Drain. 2019, 38, 83–89. [Google Scholar]
- Wilson, K.B.; Hanson, P.J.; Mulholland, P.J.; Baldocchi, D.D.; Wullschleger, S.D. A comparison of methods for determining forest evapotranspiration and its components: Sap-flow, soil water budget, eddy covariance and catchment water balance. Agric. For. Meteorol. 2001, 106, 153–168. [Google Scholar] [CrossRef]
- Tyagi, N.; Sharma, D.; Luthra, S. Determination of evapotranspiration and crop coefficients of rice and sunflower with lysimeter. Agric. Water Manag. 2000, 45, 41–54. [Google Scholar] [CrossRef]
- Young, M.H.; Wierenga, P.J.; Mancino, C.F. LARGE WEIGHING LYSIMETERS FOR WATER USE AND DEEP PERCOLATION STUDIES. Soil Sci. 1996, 161, 491–501. [Google Scholar] [CrossRef]
- Dugas, W.; Fritschen, L.; Gay, L.; Held, A.; Matthias, A.; Reicosky, D.; Steduto, P.; Steiner, J. Bowen ratio, eddy correlation, and portable chamber measurements of sensible and latent heat flux over irrigated spring wheat. Agric. For. Meteorol. 1991, 56, 1–20. [Google Scholar] [CrossRef]
- Massman, W.J. A simple method for estimating frequency response corrections for eddy covariance systems. Agric. For. Meteorol. 2000, 104, 185–198. [Google Scholar] [CrossRef]
- Wagle, P.; Gowda, P.H.; Neel, J.P.; Northup, B.K.; Zhou, Y. Integrating eddy fluxes and remote sensing products in a rotational grazing native tallgrass prairie pasture. Sci. Total. Environ. 2020, 712. [Google Scholar] [CrossRef] [PubMed]
- Yinglan, A.; Wang, G.; Liu, T.; Xue, B.; Kuczera, G. Spatial variation of correlations between vertical soil water and evapotranspiration and their controlling factors in a semi-arid region. J. Hydrol. 2019, 574, 53–63. [Google Scholar] [CrossRef]
- Su, Z.; Yacob, A.; Wen, J.; Roerink, G.; He, Y.; Gao, B.; Boogaard, H.; Van Diepen, C. Assessing relative soil moisture with remote sensing data: Theory, experimental validation, and application to drought monitoring over the North China Plain. Phys. Chem. Earth, Parts A/B/C 2003, 28, 89–101. [Google Scholar] [CrossRef]
- Kang, S.Z.; Wang, P.X.; Ling, T. Comparative Analysis of Regional Evapotranspiration Estimation Models Using Remotely Sensed Data. Trans. Chin. Soc. Agric. Eng. 2006, 7, 6–13. [Google Scholar]
- Zhang, X.D.; Yang, X.G.; Li, H.Y. Model to Compute the Actual Evapo-Transpiration in the Field of Rainfed Wheat. Agric. Res. Arid Areas 2005, 1, 34–38. [Google Scholar]
- Wang, J.; Li, H.P.; Li, H.Y. Review of Regional Evapotranspiration Estimation Models Basing on the Remote Sensing. Water Sav. Irrig. 2016, 8, 195–199. [Google Scholar]
- Xu, X.; Zhang, L.; Chen, L.; Liu, C. The Role of Soil N2O Emissions in Agricultural Green Total Factor Productivity: An Empirical Study from China around 2006 when Agricultural Tax Was Abolished. Agriculture 2020, 10, 150. [Google Scholar] [CrossRef]
- Xu, X.; Chen, L. Projection of Long-Term Care Costs in China, 2020–2050, Based on the Bayesian Quantile Regression Method. Sustainability 2019, 11, 3530. [Google Scholar] [CrossRef] [Green Version]
- Xu, X.; Xu, Z.; Chen, L.; Li, C. How Does Industrial Waste Gas Emission Affect Health Care Expenditure in Different Regions of China: An Application of Bayesian Quantile Regression. Int. J. Environ. Res. Public Heal. 2019, 16, 2748. [Google Scholar] [CrossRef] [Green Version]
- Jahangir, M.H.; Arast, M. Remote Sensing Products for Predicting Actual Evapotranspiration and Water Stress Footprints under Different Land Cover. J. Clean. Prod. 2020, 266. [Google Scholar] [CrossRef]
- Xue, J.Y.; Bali, K.M.; Light, S. Evaluation of Remote Sensing-Based Evapotranspiration Models Against Surface Renewal in Almonds, Tomatoes and Maize. Agric. Water Manag. 2020, 238. [Google Scholar] [CrossRef]
- Jin, X.; Zhu, X.; Xue, Y. Satellite-based analysis of regional evapotranspiration trends in a semi-arid area. Int. J. Remote. Sens. 2019, 40, 3267–3288. [Google Scholar] [CrossRef]
- Zheng, C.; Jia, L.; Hu, G.; Lu, J. Earth Observations-Based Evapotranspiration in Northeastern Thailand. Remote. Sens. 2019, 11, 138. [Google Scholar] [CrossRef] [Green Version]
- Hu, G.; Jia, L. Monitoring of Evapotranspiration in a Semi-Arid Inland River Basin by Combining Microwave and Optical Remote Sensing Observations. Remote. Sens. 2015, 7, 3056–3087. [Google Scholar] [CrossRef] [Green Version]
- Zheng, C.; Jia, L.; Hu, G.; Menenti, M.; Lu, J.; Zhou, J.; Wang, K.; Li, Z. Assessment of Water Use in Pan-Eurasian and African Continents by ETMonitor with Multi-Source Satellite Data. In Proceedings of the International Symposium on Earth Observation for One Belt and One Road (EOBAR), Beijing, China, 16–17 May 2016; Volume 57. [Google Scholar] [CrossRef] [Green Version]
- Zhang, Y.; Hao, X.M.; Ding, H. A Simplified Mthod and Its Application for Estimating Potential Evapotranspiration. Arid Zone Res. 2019, 6, 1431–1439. [Google Scholar]
- Hu, G.; Jia, L.; Menenti, M. Comparison of MOD16 and LSA-SAF MSG evapotranspiration products over Europe for 2011. Remote. Sens. Environ. 2015, 156, 510–526. [Google Scholar] [CrossRef]
- Song, J.; Xu, C.C.; Yang, Y.Y. Temporal and Spatial Variation Characteristics of Evapotranspiration and Dry-Wet Climate in Xinjiang Based on MODIS16. Res. Soil Water Conserv. 2019, 5, 210–214. [Google Scholar]
- Ghilain, N.; De Roo, F.; Gellens-Meulenberghs, F. Evapotranspiration monitoring with Meteosat Second Generation satellites: Improvement opportunities from moderate spatial resolution satellites for vegetation. Int. J. Remote. Sens. 2014, 35, 2654–2670. [Google Scholar] [CrossRef]
- Ren, L.L.; Wei, L.Y.; Hu, J.S. Drought Monitoring Utility Assessment of CHIRPS and GLEAM Satellite Products in China. Trans. Chin. Soc. Agric. Eng. 2019, 15, 146–154. [Google Scholar]
- Yang, X.Q.; Wang, G.J.; Pan, X. Spatio-Temporal Variability of Terrestrial Evapotranspiration in China from 1980 to 2011 Based on GLEAM Data. Trans. Chin. Soc. Agric. Eng. 2015, 21, 132–141. [Google Scholar]
- Martens, B.; De Jeu, R.; Verhoest, N.E.C.; Schuurmans, H.; Kleijer, J.; MirallesiD, D.G. Towards Estimating Land Evaporation at Field Scales Using GLEAM. Remote. Sens. 2018, 10, 1720. [Google Scholar] [CrossRef] [Green Version]
- Martin, J.; Sujan, K.; Ulrich, W. The Fluxcom Ensemble of Global Land-Atmosphere Engery Fluxes. Scientific Data 2019, 6, 74–88. [Google Scholar]
- Courault, D.; Séguin, B.; Olioso, A. Review on estimation of evapotranspiration from remote sensing data: From empirical to numerical modeling approaches. Irrig. Drain. Syst. 2005, 19, 223–249. [Google Scholar] [CrossRef]
- Song, Y.; Wang, J.; Yang, K.; Ma, M.; Li, X.; Zhang, Z.; Wang, X. A revised surface resistance parameterisation for estimating latent heat flux from remotely sensed data. Int. J. Appl. Earth Obs. Geoinformation 2012, 17, 76–84. [Google Scholar] [CrossRef]
- Kool, D.; Agam, N.; Lazarovitch, N.; Heitman, J.; Sauer, T.; Ben-Gal, A. A review of approaches for evapotranspiration partitioning. Agric. For. Meteorol. 2014, 184, 56–70. [Google Scholar] [CrossRef]
- Su, Z. The Surface Energy Balance System (SEBS) for estimation of turbulent heat fluxes. Hydrol. Earth Syst. Sci. 2002, 6, 85–100. [Google Scholar] [CrossRef]
- Maniruzzaman, M.; Boateng, J.S.; Chowdhry, B.Z.; Snowden, M.; Douroumis, D. A review on the taste masking of bitter APIs: Hot-melt extrusion (HME) evaluation. Drug Dev. Ind. Pharm. 2013, 40, 145–156. [Google Scholar] [CrossRef]
- Bastiaanssen, W.G.M.; Menenti, M.; Feddes, R.A.; Holtslag, A.A.M. A Remote Sensing Surface Energy Balance Algorithm for Land (SEBAL) 1. Formulation. J. Hydrol. 1998, 212–213, 198–212. [Google Scholar] [CrossRef]
- Penman, H.L. Natural evaporation from open water, bare soil and grass. Proc. R. Soc. London. Ser. A Math. Phys. Sci. 1948, 193, 120–145. [Google Scholar] [CrossRef] [Green Version]
- Monteith, J.L. Evaporation and environment. Symp. Soc. Exp. Boil. 1965, 19, 205–234. [Google Scholar]
- Priestley, C.H.B.; Taylor, R.J. On the Assessment of Surface Heat Flux and Evaporation Using Large-Scale Parameters. Mon. Weather Rev. 1972, 100, 81–92. [Google Scholar] [CrossRef]
- Bastiaanssen, W.; Pelgrum, H.; Wang, J.; Ma, Y.; Moreno, J.; Roerink, G.; Van Der Wal, T. A remote sensing surface energy balance algorithm for land (SEBAL). J. Hydrol. 1998, 212, 213–229. [Google Scholar] [CrossRef]
- Rawat, K.S.; Bala, A.; Singh, S.K.; Pal, R.K. Quantification of wheat crop evapotranspiration and mapping: A case study from Bhiwani District of Haryana, India. Agric. Water Manag. 2017, 187, 200–209. [Google Scholar] [CrossRef] [Green Version]
- Bala, A.; Rawat, K.S.; Misra, A.K.; Srivastava, A. Assessment and Validation of Evapotranspiration using SEBALalgorithm and Lysimeter data of IARI Agricultural Farm, India. Geocarto Int. 2015, 31, 1–29. [Google Scholar] [CrossRef]
- Rahimzadegan, M.; Janani, A. Estimating evapotranspiration of pistachio crop based on SEBAL algorithm using Landsat 8 satellite imagery. Agric. Water Manag. 2019, 217, 383–390. [Google Scholar] [CrossRef]
- Bhattarai, N.; Quackenbush, L.; Im, J.; Shaw, S.B. A new optimized algorithm for automating endmember pixel selection in the SEBAL and METRIC models. Remote. Sens. Environ. 2017, 196, 178–192. [Google Scholar] [CrossRef]
- Ruhoff, A.L.; Paz, A.R.; Collischonn, W.; Aragão, L.E.; Rocha, H.R.; Malhi, Y. A MODIS-Based Energy Balance to Estimate Evapotranspiration for Clear-Sky Days in Brazilian Tropical Savannas. Remote. Sens. 2012, 4, 703–725. [Google Scholar] [CrossRef] [Green Version]
- Du, J.; Song, K.; Wang, Z.; Zhang, B.; Liu, D. Evapotranspiration estimation based on MODIS products and surface energy balance algorithms for land (SEBAL) model in Sanjiang Plain, Northeast China. Chin. Geogr. Sci. 2013, 23, 73–91. [Google Scholar] [CrossRef]
- Simaie, E.; Homaee, M.; Norouzi, A.A. Evaluating SEBAL Model to Estimate Evapotranspiration Using MODIS and TM Sensors Data. J. Soil Water Resour. Conserv. 2013, 2, 29–40. [Google Scholar]
- Singh, R.K.; Liu, S.; Tieszen, L.L.; Suyker, A.E.; Verma, S.B. Estimating seasonal evapotranspiration from temporal satellite images. Irrig. Sci. 2011, 30, 303–313. [Google Scholar] [CrossRef] [Green Version]
- Bhattarai, N.; Quackenbush, L.J.; Dougherty, M.; Marzen, L.J. A simple Landsat–MODIS fusion approach for monitoring seasonal evapotranspiration at 30 m spatial resolution. Int. J. Remote. Sens. 2014, 36, 115–143. [Google Scholar] [CrossRef]
- Wagle, P.; Bhattarai, N.; Gowda, P.H.; Zhou, Y. Performance of five surface energy balance models for estimating daily evapotranspiration in high biomass sorghum. ISPRS J. Photogramm. Remote. Sens. 2017, 128, 192–203. [Google Scholar] [CrossRef] [Green Version]
- Allen, R.G.; Tasumi, M.; Morse, A.; Trezza, R.; Wright, J.L.; Bastiaanssen, W.; Kramber, W.J.; Lorite, I.J.; Robison, C.W. Satellite-Based Energy Balance for Mapping Evapotranspiration with Internalized Calibration (METRIC)—Applications. J. Irrig. Drain. Eng. 2007, 133, 395–406. [Google Scholar] [CrossRef]
- Elnmer, A.; Khadr, M.; Kanae, S.; Tawfik, A. Mapping daily and seasonally evapotranspiration using remote sensing techniques over the Nile delta. Agric. Water Manag. 2019, 213, 682–692. [Google Scholar] [CrossRef]
- Zhang, P.; Long, A.H.; Hai, Y. The Spatiotemporal Variations and the Driving Forces of Agricultural Water Consumption in Xinjiang (1988-2015): Based on the Statistical Analysis of Crop Water Footprint. J. Glaciol. Geocryol. 2019. Available online: http://kns.cnki.net/kcms/detail/62.1072.P.20190918.1456.002.Html (accessed on 18 September 2019).
- Wang, W.H.; Huang, Y.; Liu, T. Optimized Redistribution of Water Resources in the Kaidu-Kongque River Basin. Arid Zone Res. 2018, 5, 1030–1039. [Google Scholar]
- Chen, Z.S.; Li, B.F.; Fu, A.H. Analysis of Water Demand and Stability for Oasis in Kaidu-Kongque River Basin, Southern Xinjiang. J. Glaciol. Geocryol. 2012, 6, 1470–1477. [Google Scholar]
- Krishnan, S.R.; Seelamantula, C.S. On the Selection of Optimum Savitzky-Golay Filters. IEEE Trans. Signal. Process. 2013, 61, 380–391. [Google Scholar] [CrossRef]
- Wang, X.-J. Participatory geographic information system review. Chin. J. Eco-Agric. 2010, 18, 1138–1144. [Google Scholar] [CrossRef]
- Cha, M.X.; Wang, X.Q.; Li, Y.L. Crop Planting Structure Extraction Based on Remote Sensing Data in Kai-Kong River Basin, Xinjiang. Arid Zone Res. 2020, 37, 532–540. [Google Scholar] [CrossRef]
- Yang, X.; Ren, L.; Jiao, D.; Yong, B.; Jiang, S.; Song, S. Estimation of Daily Actual Evapotranspiration from ETM+ and MODIS Data of the Headwaters of the West Liaohe Basin in the Semiarid Regions of China. J. Hydrol. Eng. 2013, 18, 1530–1538. [Google Scholar] [CrossRef]
- Allen, R.G.; Irmak, A.; Trezza, R.; Hendrickx, J.M.H.; Bastiaanssen, W.; Kjaersgaard, J. Satellite-based ET estimation in agriculture using SEBAL and METRIC. Hydrol. Process. 2011, 25, 4011–4027. [Google Scholar] [CrossRef]
- Gao, X.; Sun, M.; Luan, Q.; Zhao, X.; Wang, J.; He, G.; Zhao, Y.; Miao, S. The spatial and temporal evolution of the actual evapotranspiration based on the remote sensing method in the Loess Plateau. Sci. Total. Environ. 2020, 708. [Google Scholar] [CrossRef] [PubMed]
- Senkondo, W.; Munishi, S.E.; Tumbo, M.; Nobert, J.; Lyon, S.W. Comparing Remotely-Sensed Surface Energy Balance Evapotranspiration Estimates in Heterogeneous and Data-Limited Regions: A Case Study of Tanzania’s Kilombero Valley. Remote. Sens. 2019, 11, 1289. [Google Scholar] [CrossRef] [Green Version]
- Sun, H.; Yang, Y.; Wu, R.; Gui, D.; Xue, J.; Liu, Y.; Yan, D. Improving Estimation of Cropland Evapotranspiration by the Bayesian Model Averaging Method with Surface Energy Balance Models. Atmosphere 2019, 10, 188. [Google Scholar] [CrossRef] [Green Version]
- Jackson, R.; Hatfield, J.; Reginato, R.; Idso, S.; Pinter, P. Estimation of daily evapotranspiration from one time-of-day measurements. Agric. Water Manag. 1983, 7, 351–362. [Google Scholar] [CrossRef]
- Xie, X.Q. Estimation of Daily Evapo-Transpiration (ET) From One Time-of-Daily Remotely Sensed Canopy Temperature. J. Remote Sens. 1991, 4, 253–260. [Google Scholar]
- Vörösmarty, C.; Federer, C.; Schloss, A. Potential evaporation functions compared on US watersheds: Possible implications for global-scale water balance and terrestrial ecosystem modeling. J. Hydrol. 1998, 207, 147–169. [Google Scholar] [CrossRef]
- Grosso, C.; Manoli, G.; Martello, M.; Chemin, Y.; Pons, D.; Teatini, P.; Piccoli, I.; Morari, F. Mapping Maize Evapotranspiration at Field Scale Using SEBAL: A Comparison with the FAO Method and Soil-Plant Model Simulations. Remote. Sens. 2018, 10, 1452. [Google Scholar] [CrossRef] [Green Version]
- Lv, N.N.; Bai, J.; Chang, C. Spatial-Temporal Changes in Evapotranspiration Based on Planting Patterns of Major Crops in the Xinjiang Oasis During 1960–2010. Geograph. Res. 2017, 8, 1443–1454. [Google Scholar]
- Kamali, M.I.; Nazari, R. Determination of maize water requirement using remote sensing data and SEBAL algorithm. Agric. Water Manag. 2018, 209, 197–205. [Google Scholar] [CrossRef]
- Shen, Y.J.; Li, S.; Chen, Y.; Qi, Y.; Zhang, S. Estimation of regional irrigation water requirement and water supply risk in the arid region of Northwestern China 1989–2010. Agric. Water Manag. 2013, 128, 55–64. [Google Scholar] [CrossRef]
- Wang, M.; Yang, Q.; Zheng, J.H.; Liu, Z.H. Spatial and Temporal Distribution of Water Requirement of Cotton in Xinjiang from 1963 to 2012. Acta Ecologica Sinica 2016, 36, 4122–4130. [Google Scholar] [CrossRef]
- Jin, K.L.; Hao, L. Evapotranspiration Estimation in the Jiangsu-Zhejiang-Shanghai Area Baed on Remote Sensing Data and SEBAL Model. Remote Sens. Land. Res. 2020, 32, 204–212. [Google Scholar]
Figure 1.
Overview of the study area. The location of the Kai-Kong River Basin in Xinjiang is highlighted shown in the left picture (a), and the agricultural land in the Kai-Kong River Basin is surrounded by the red boundary in the right picture (b).
Figure 1.
Overview of the study area. The location of the Kai-Kong River Basin in Xinjiang is highlighted shown in the left picture (a), and the agricultural land in the Kai-Kong River Basin is surrounded by the red boundary in the right picture (b).
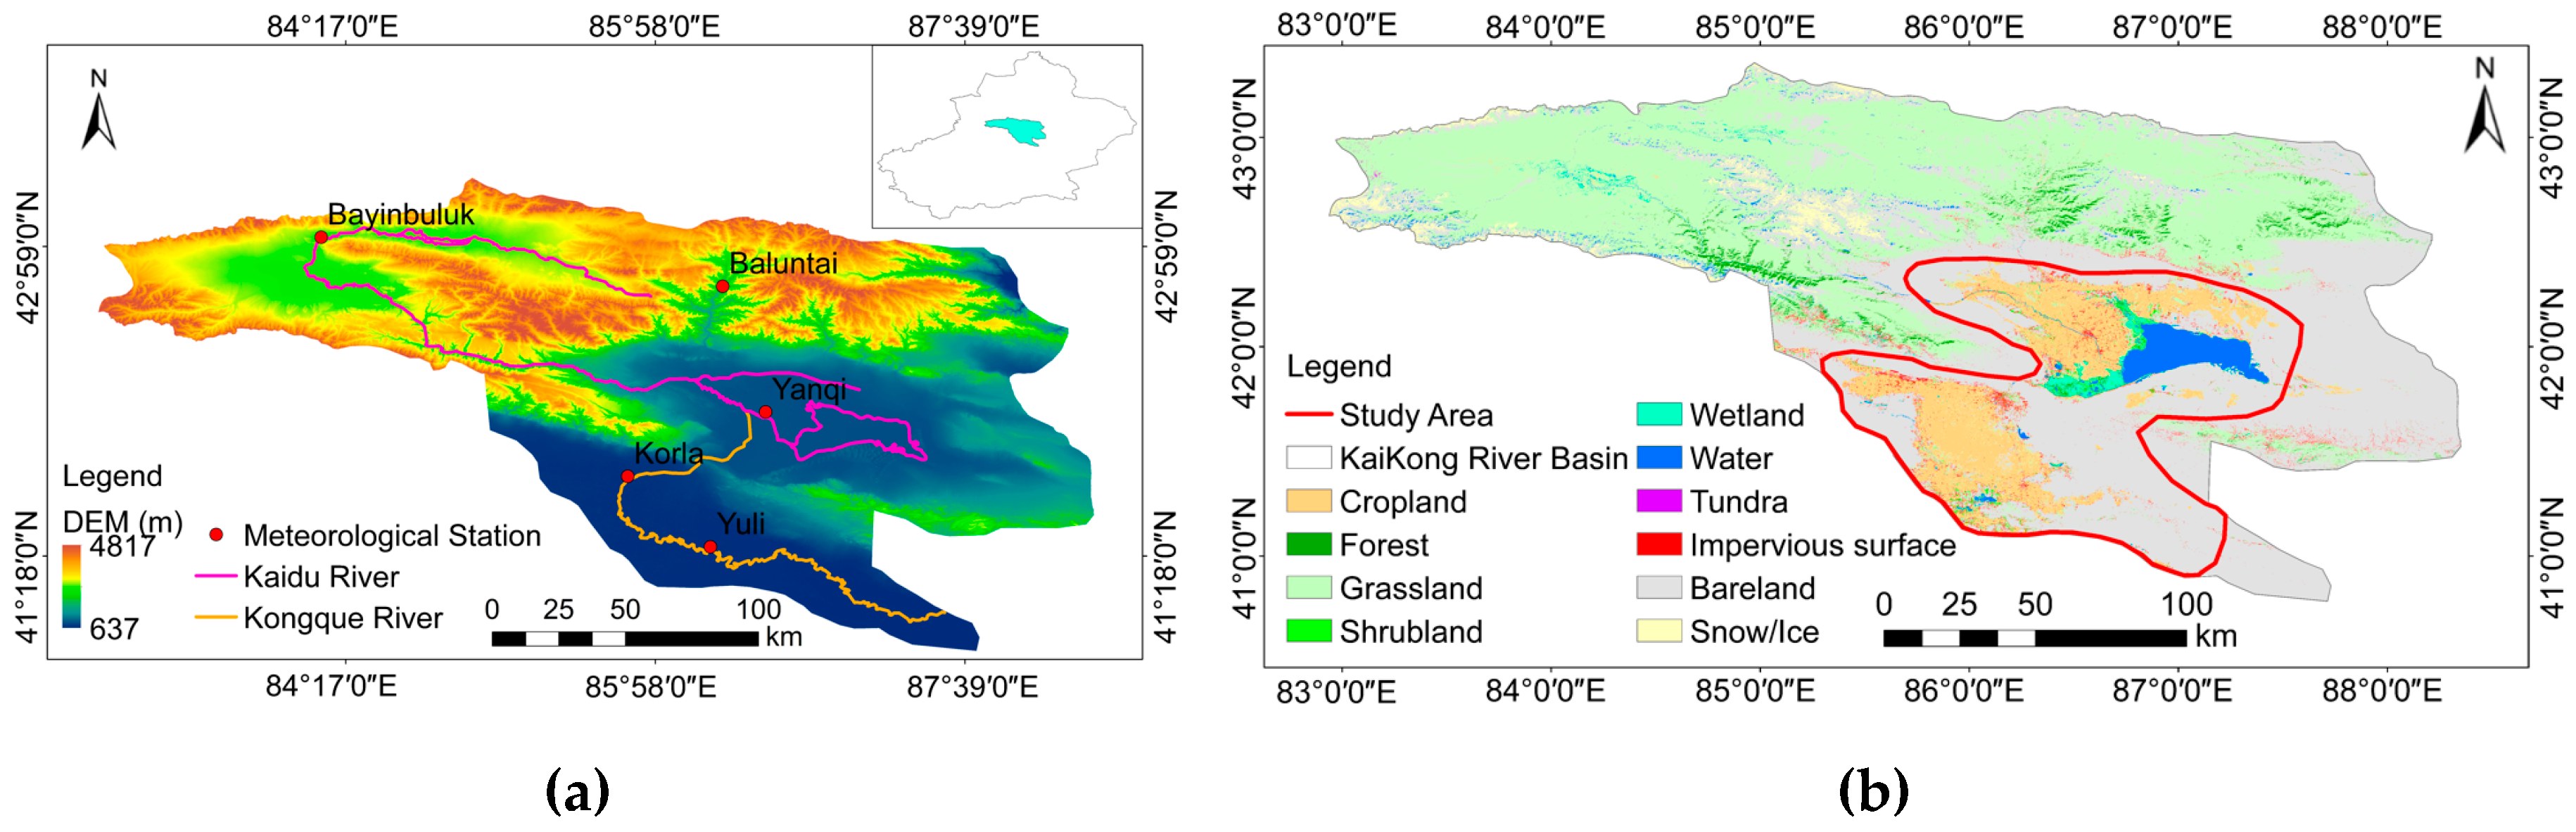
Figure 2.
The proposed framework of the ETs (seasonal evapotranspiration) estimation for crops using multisource remote sensing images.
Figure 2.
The proposed framework of the ETs (seasonal evapotranspiration) estimation for crops using multisource remote sensing images.
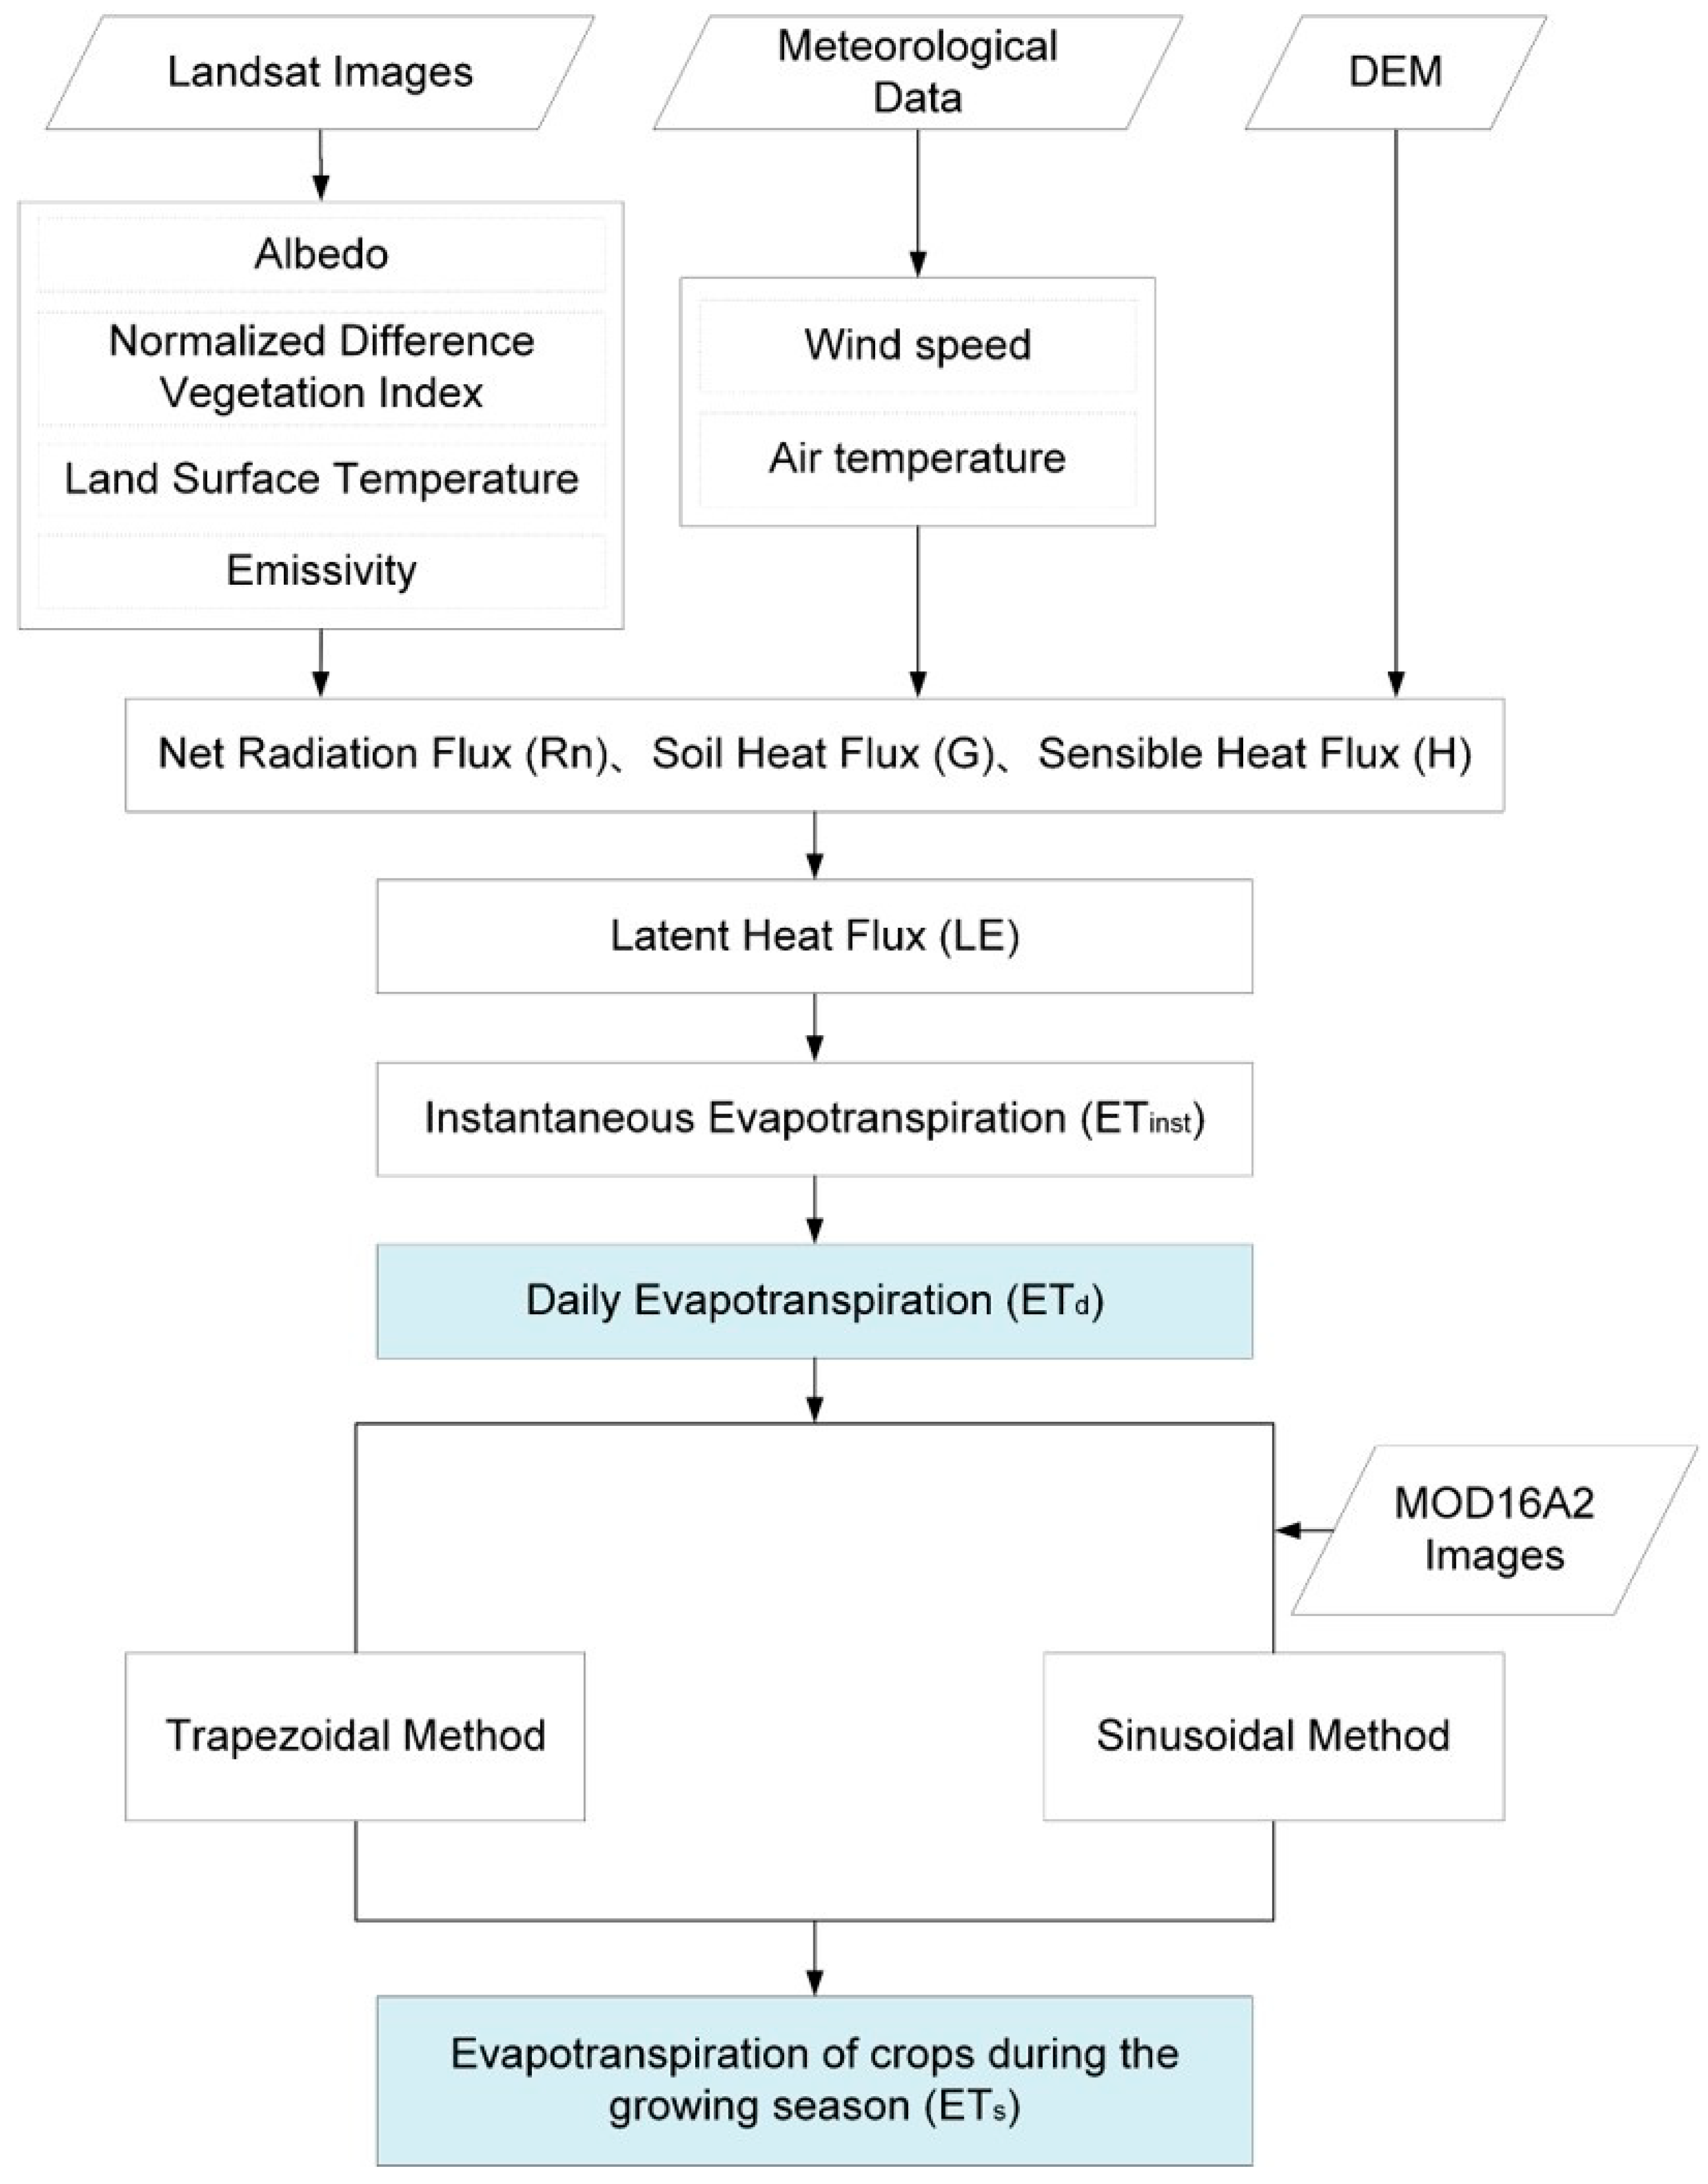
Figure 3.
Daily evapotranspiration (ETd) change curves with the DOY (day of the year) of crops during the growing season. The horizontal axis represents the acquired time (day of the year, DOY) of Landsat images and the vertical axis represents the ETd.
Figure 3.
Daily evapotranspiration (ETd) change curves with the DOY (day of the year) of crops during the growing season. The horizontal axis represents the acquired time (day of the year, DOY) of Landsat images and the vertical axis represents the ETd.
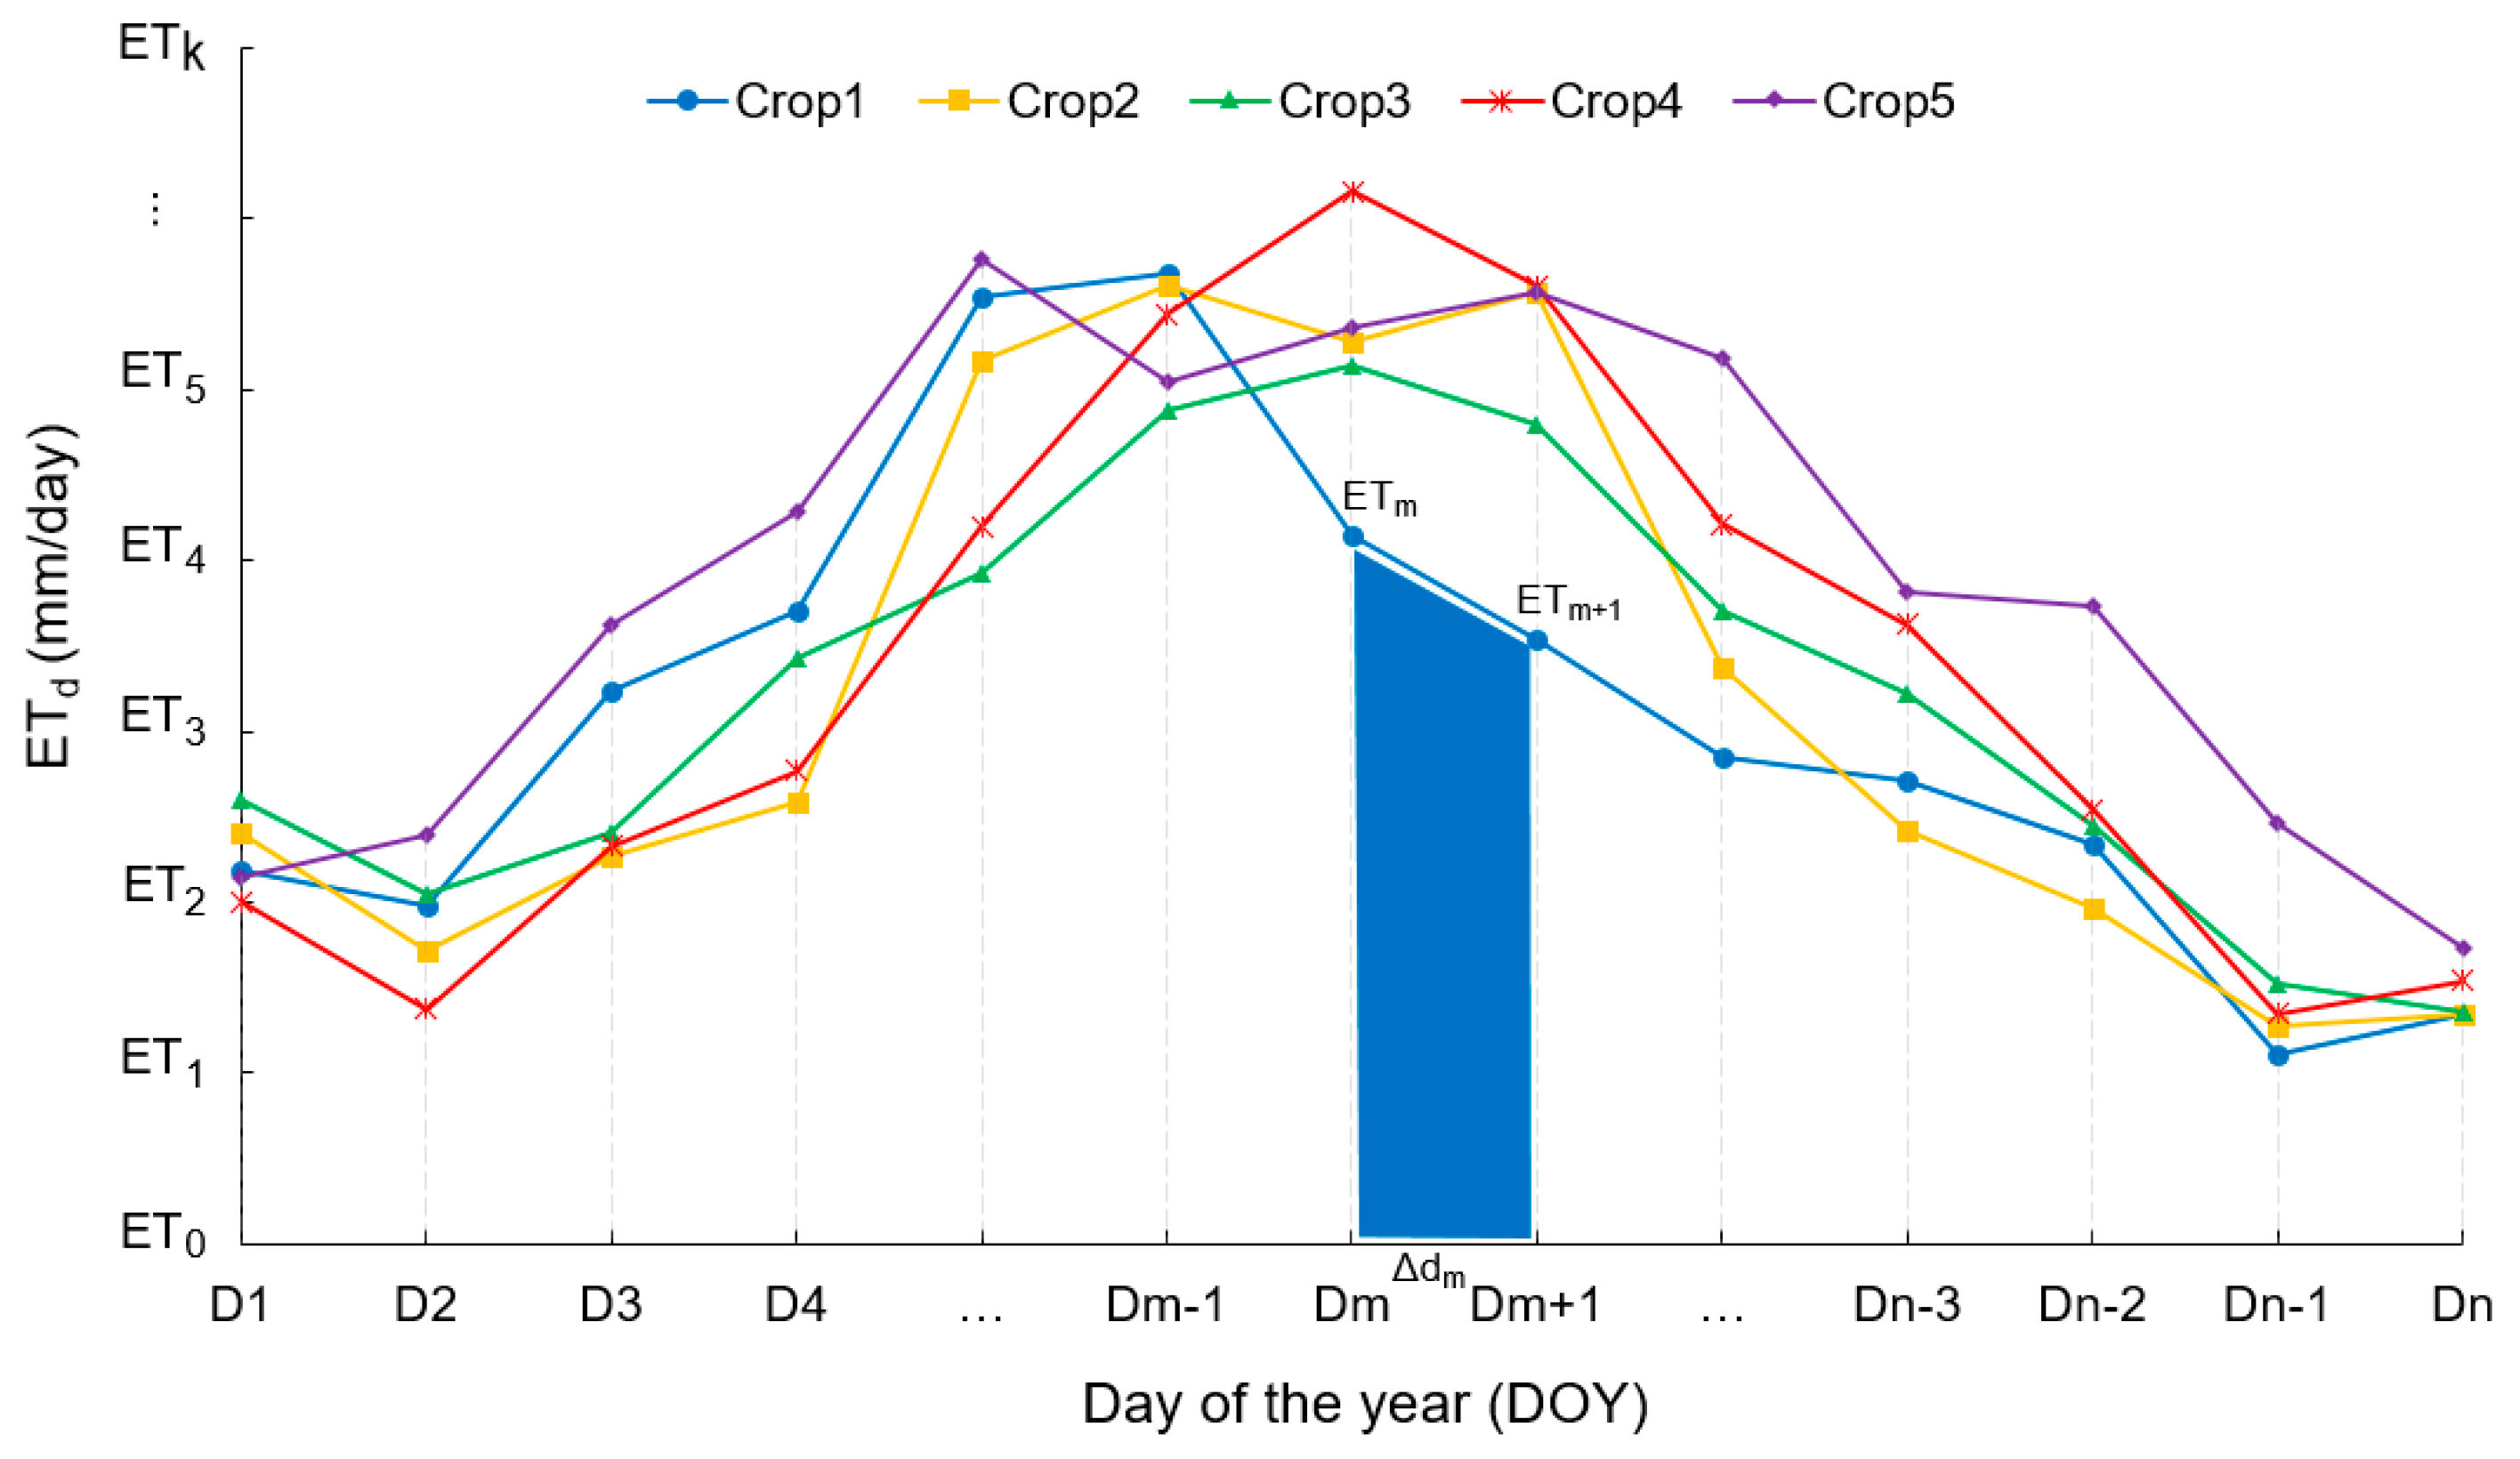
Figure 4.
The workflow of the proposed sinusoidal method. Time-series MOD16A2 images used to obtain ET change with DOY and multitemporal ETd images used to estimate ETs for crops.
Figure 4.
The workflow of the proposed sinusoidal method. Time-series MOD16A2 images used to obtain ET change with DOY and multitemporal ETd images used to estimate ETs for crops.
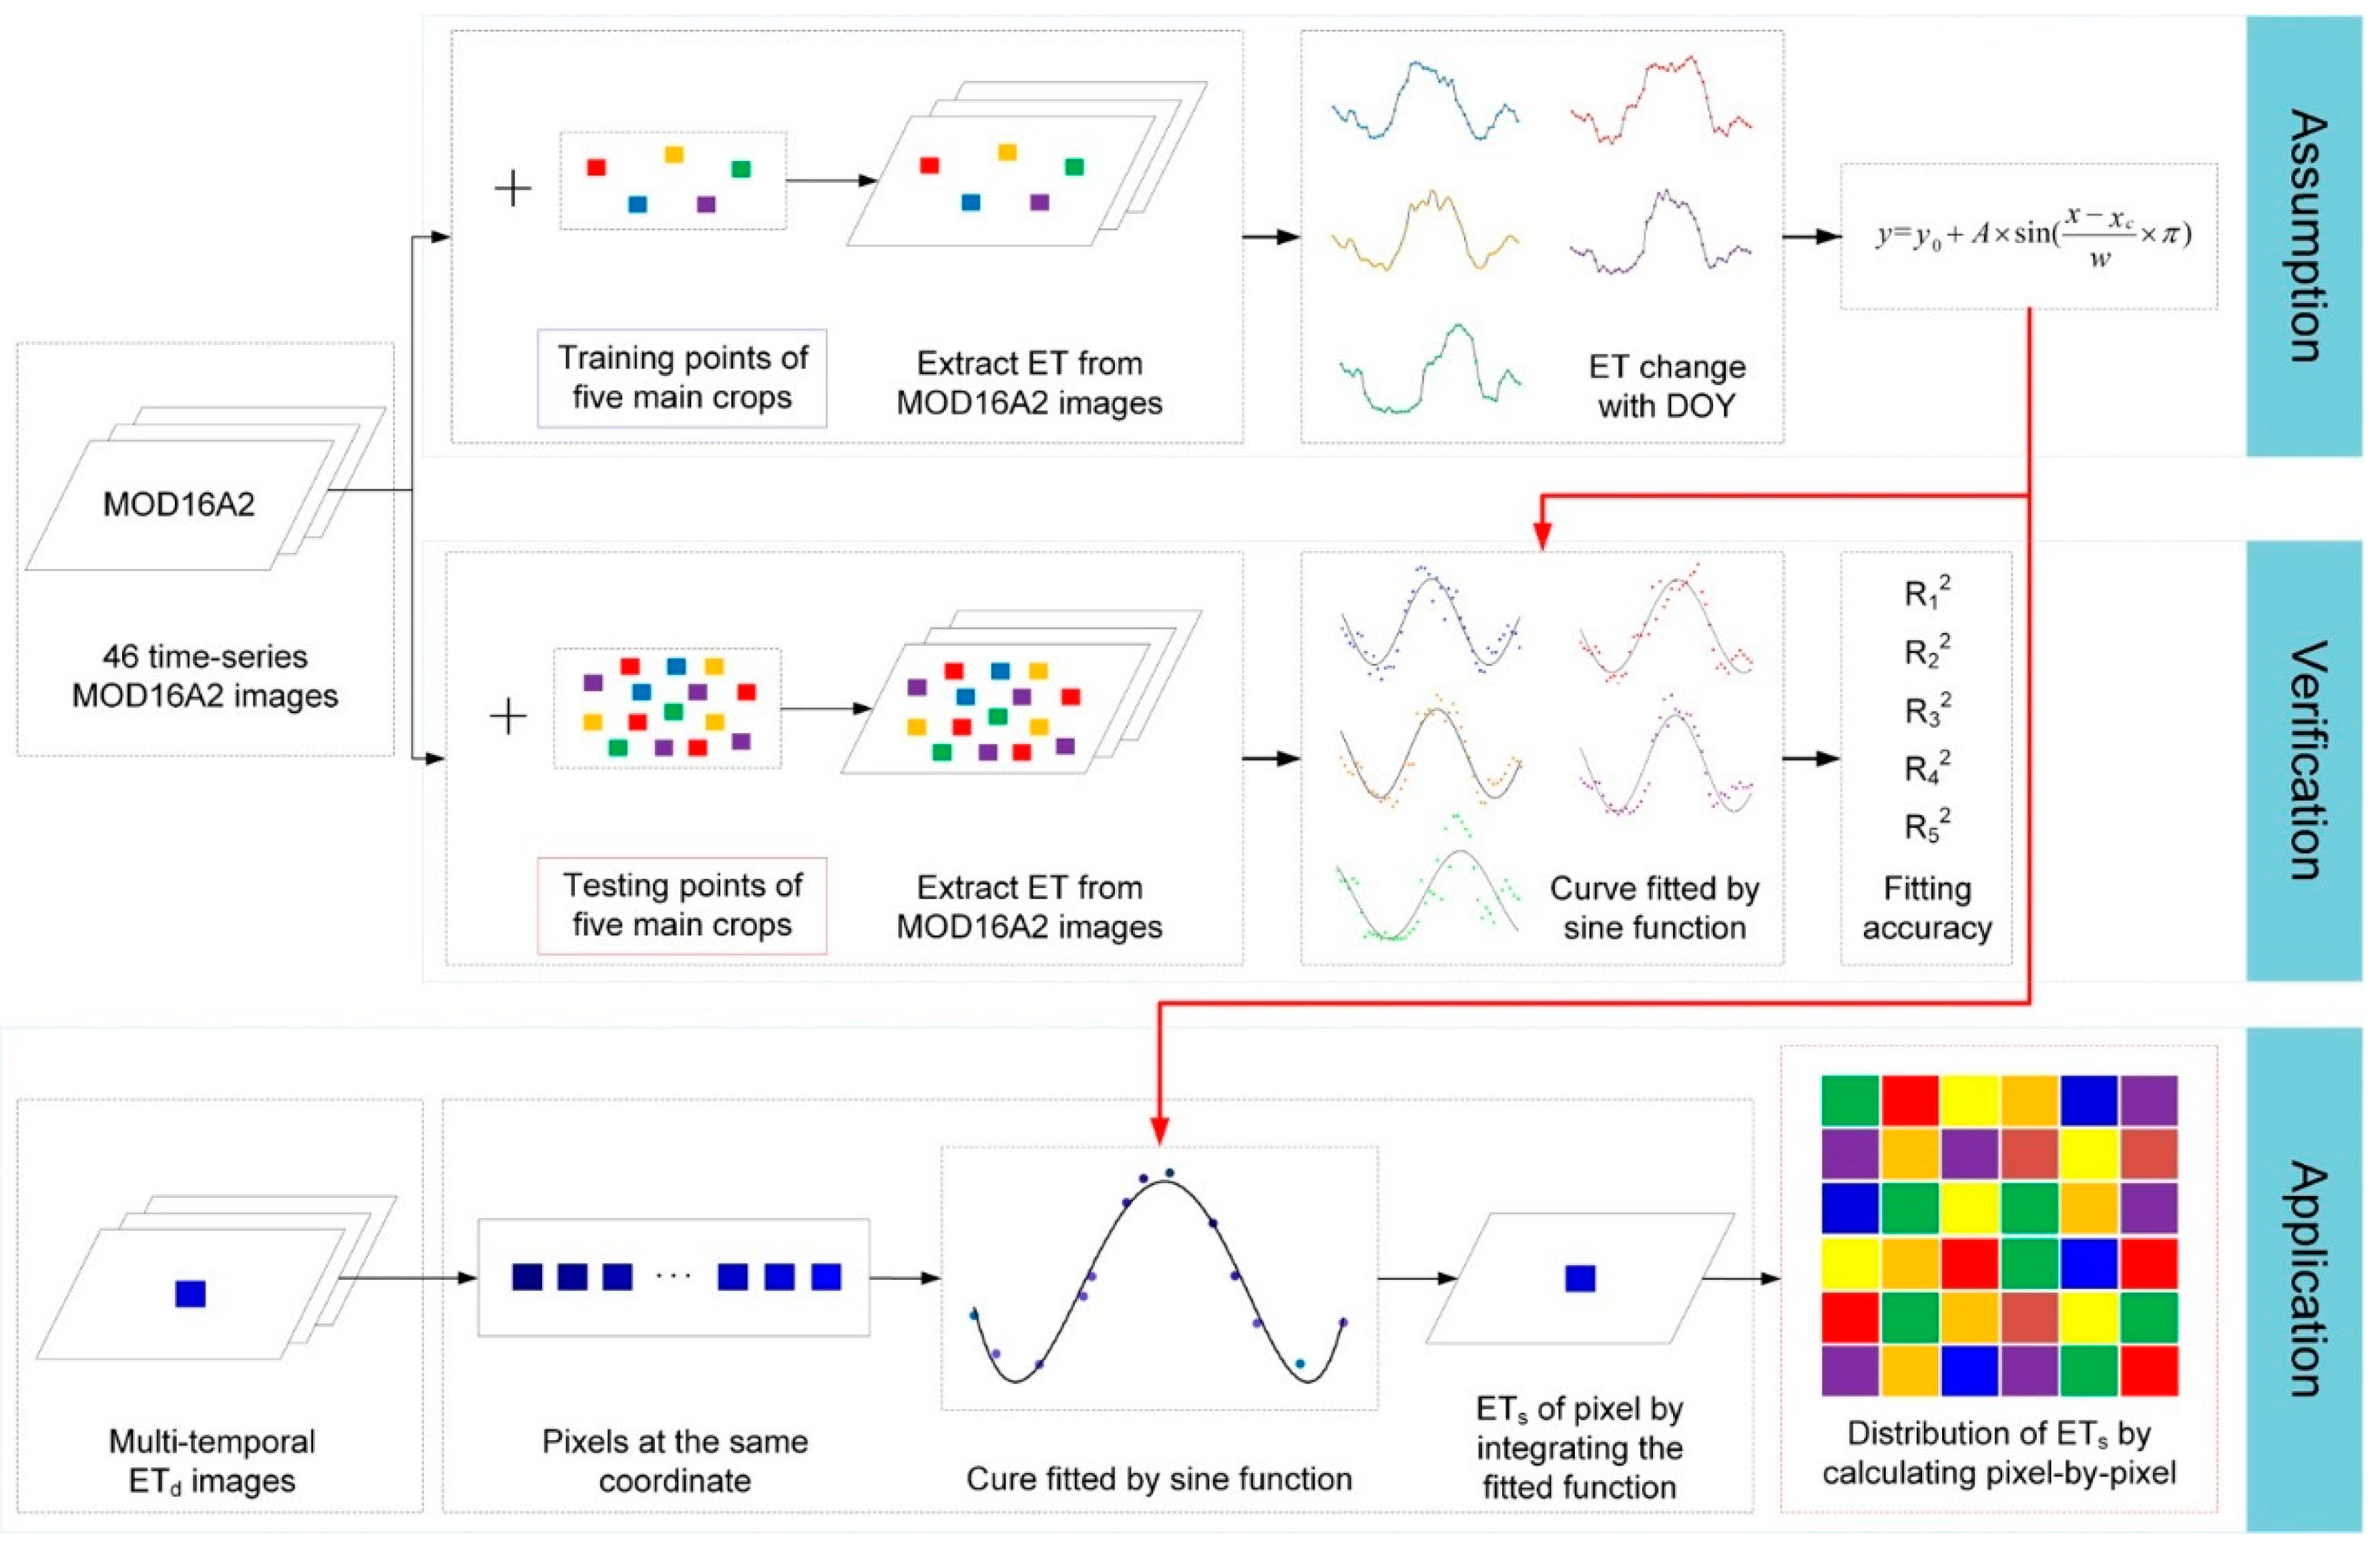
Figure 5.
Temporal-spatial variation of (a) instantaneous ET (ETinst) and (b) ETd obtained by the surface energy balance algorithm over land (SEBAL) model.
Figure 5.
Temporal-spatial variation of (a) instantaneous ET (ETinst) and (b) ETd obtained by the surface energy balance algorithm over land (SEBAL) model.
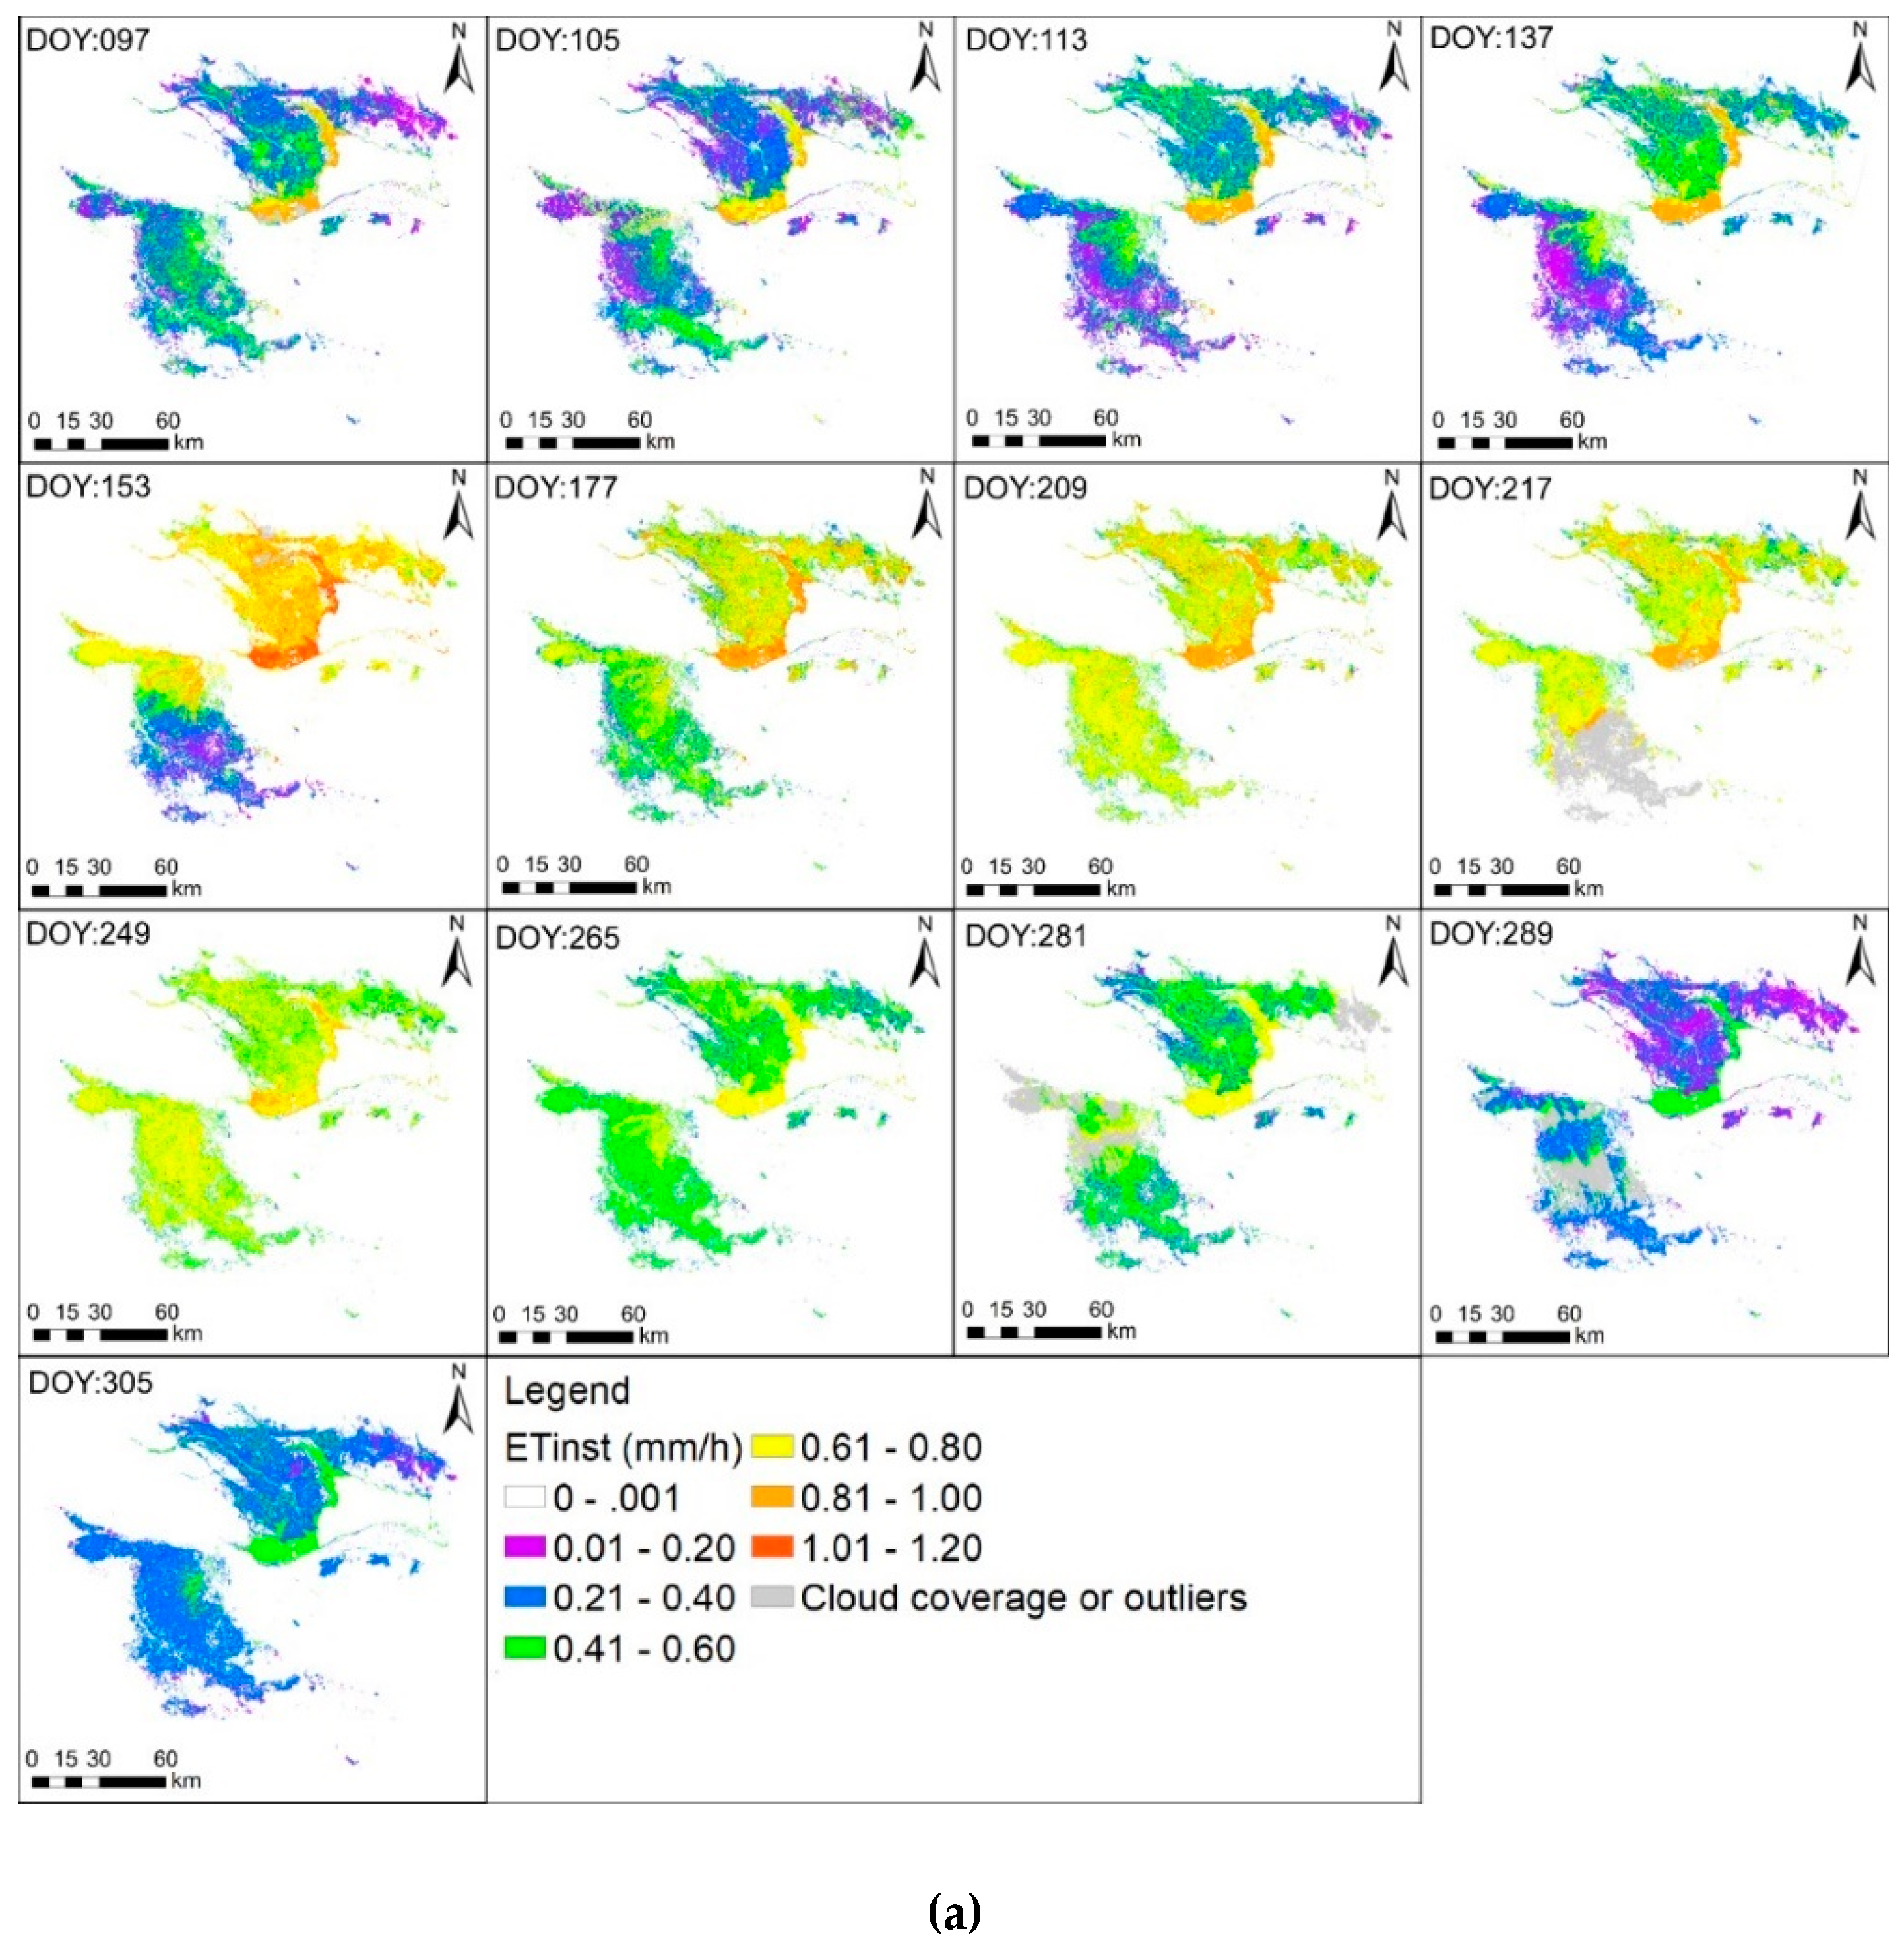
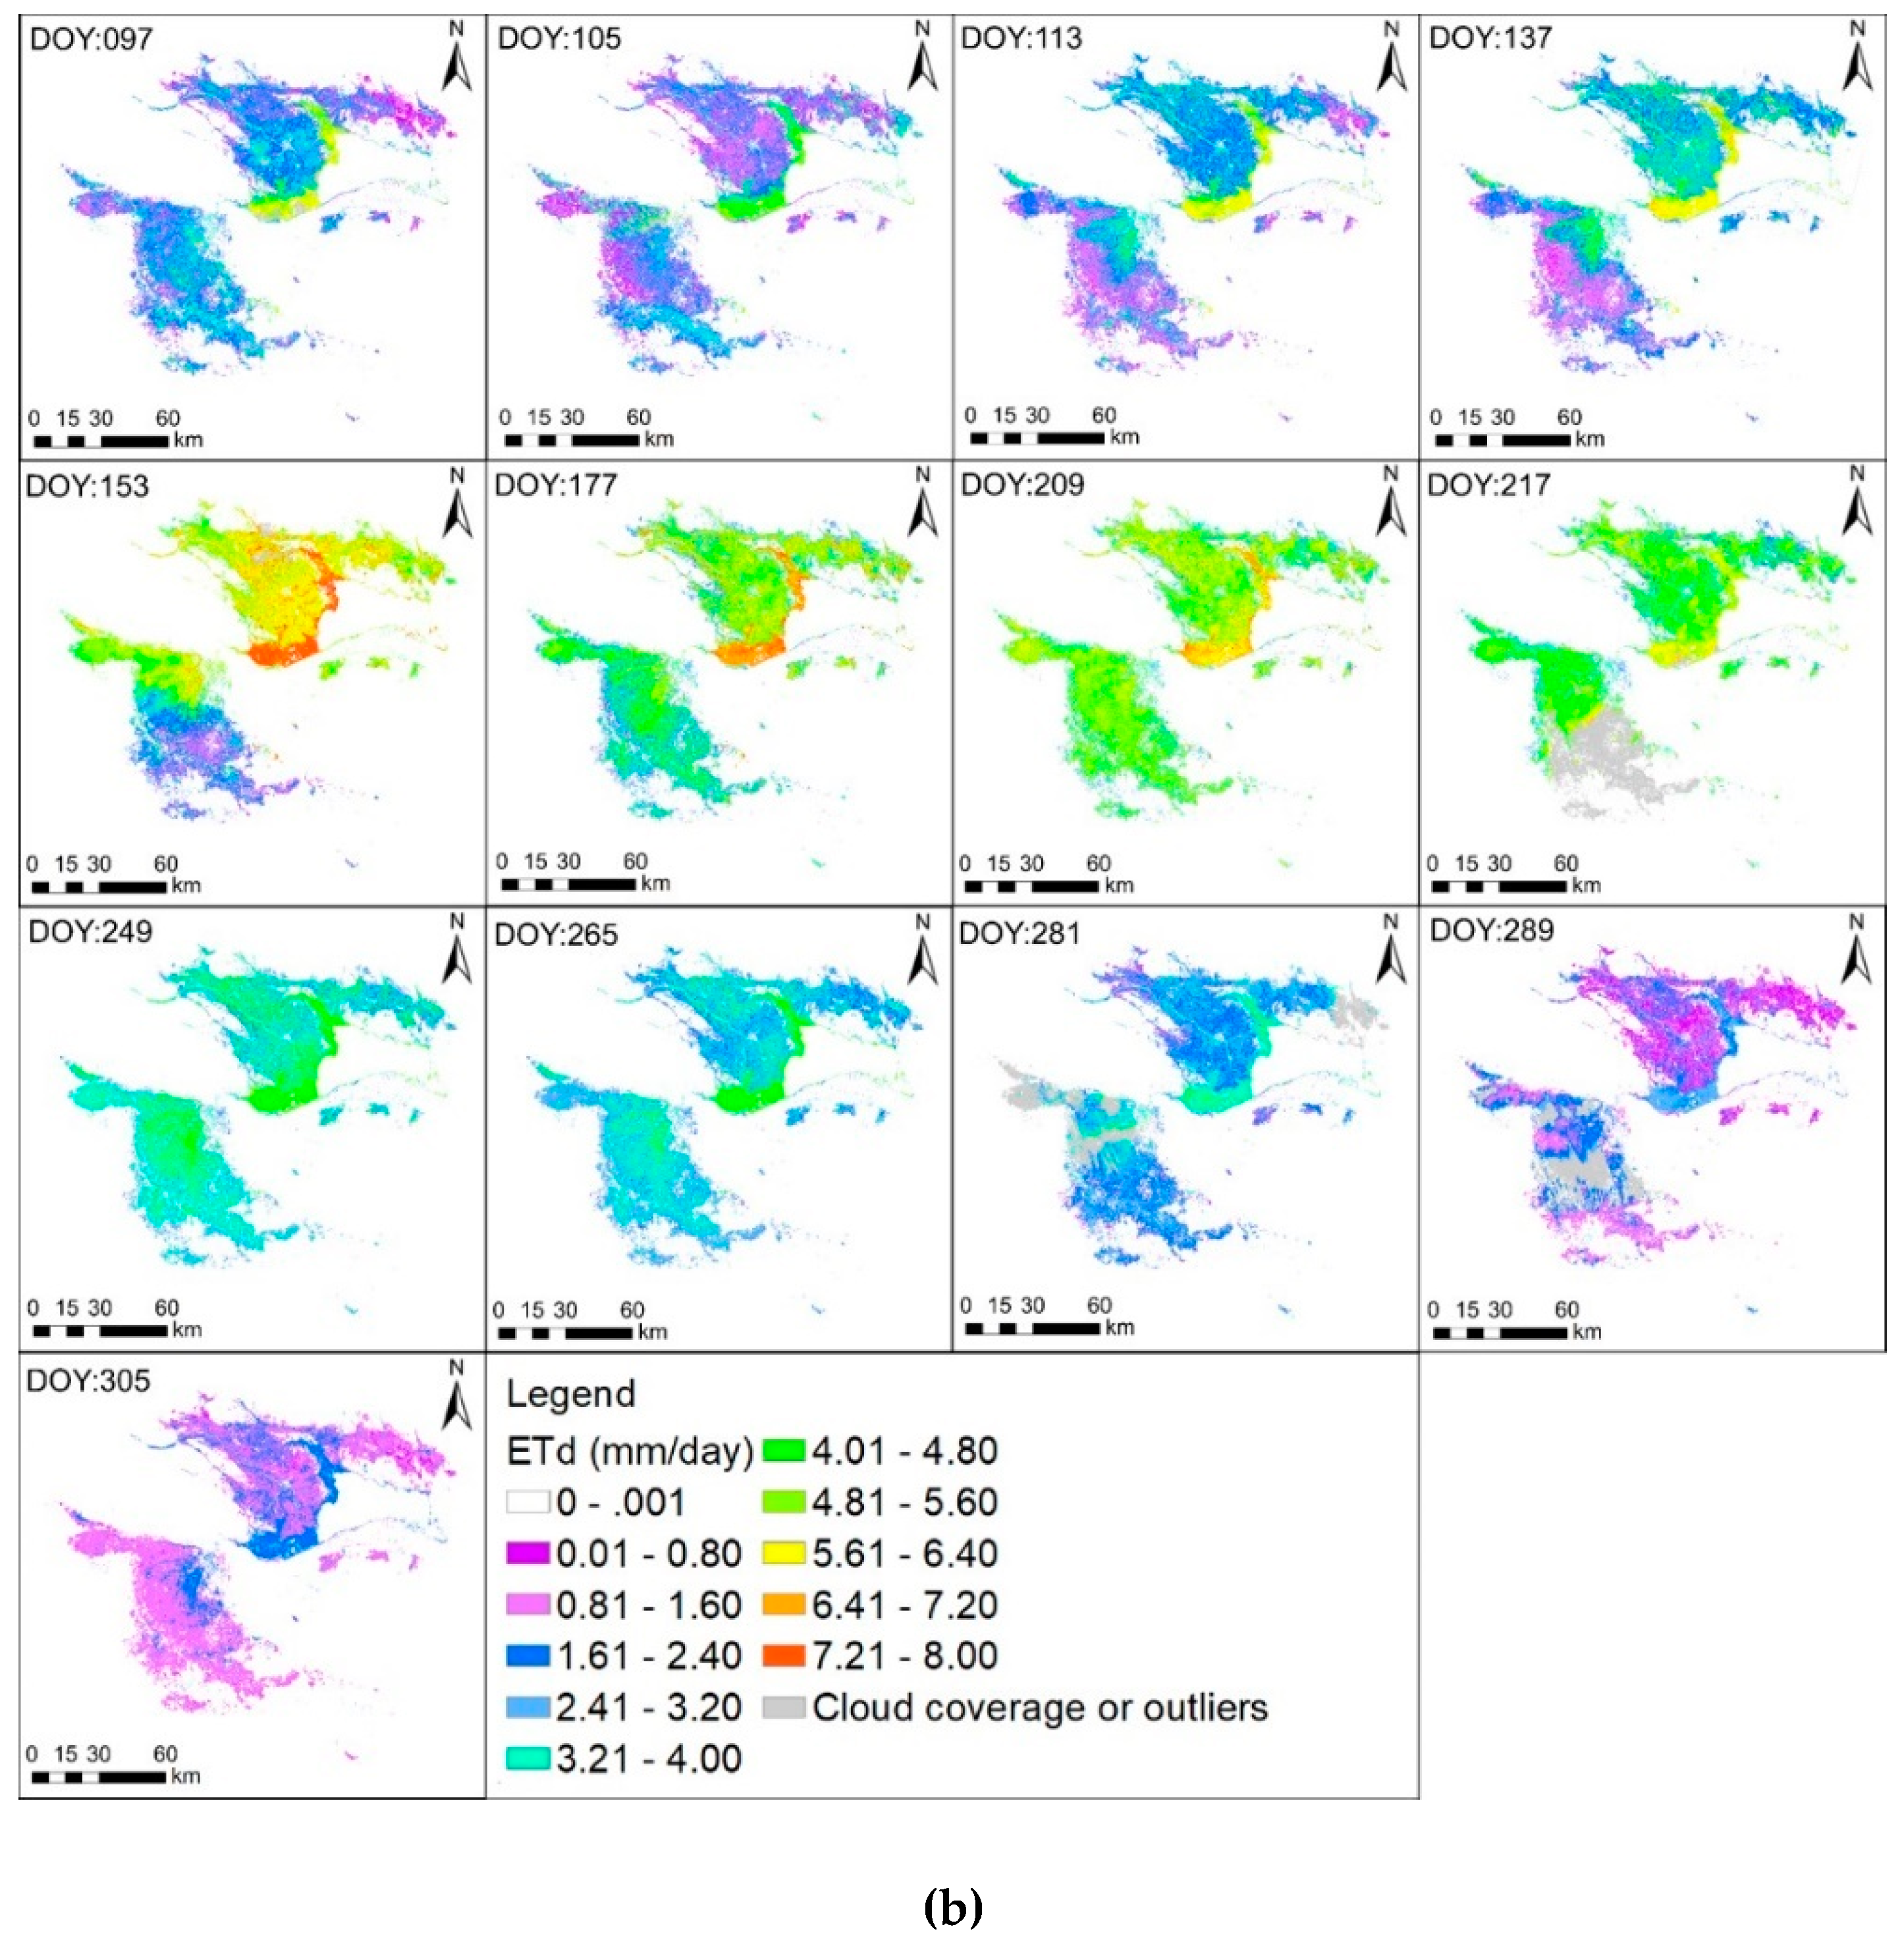
Figure 6.
The change curves of ETd at a given DOY for five main crops.
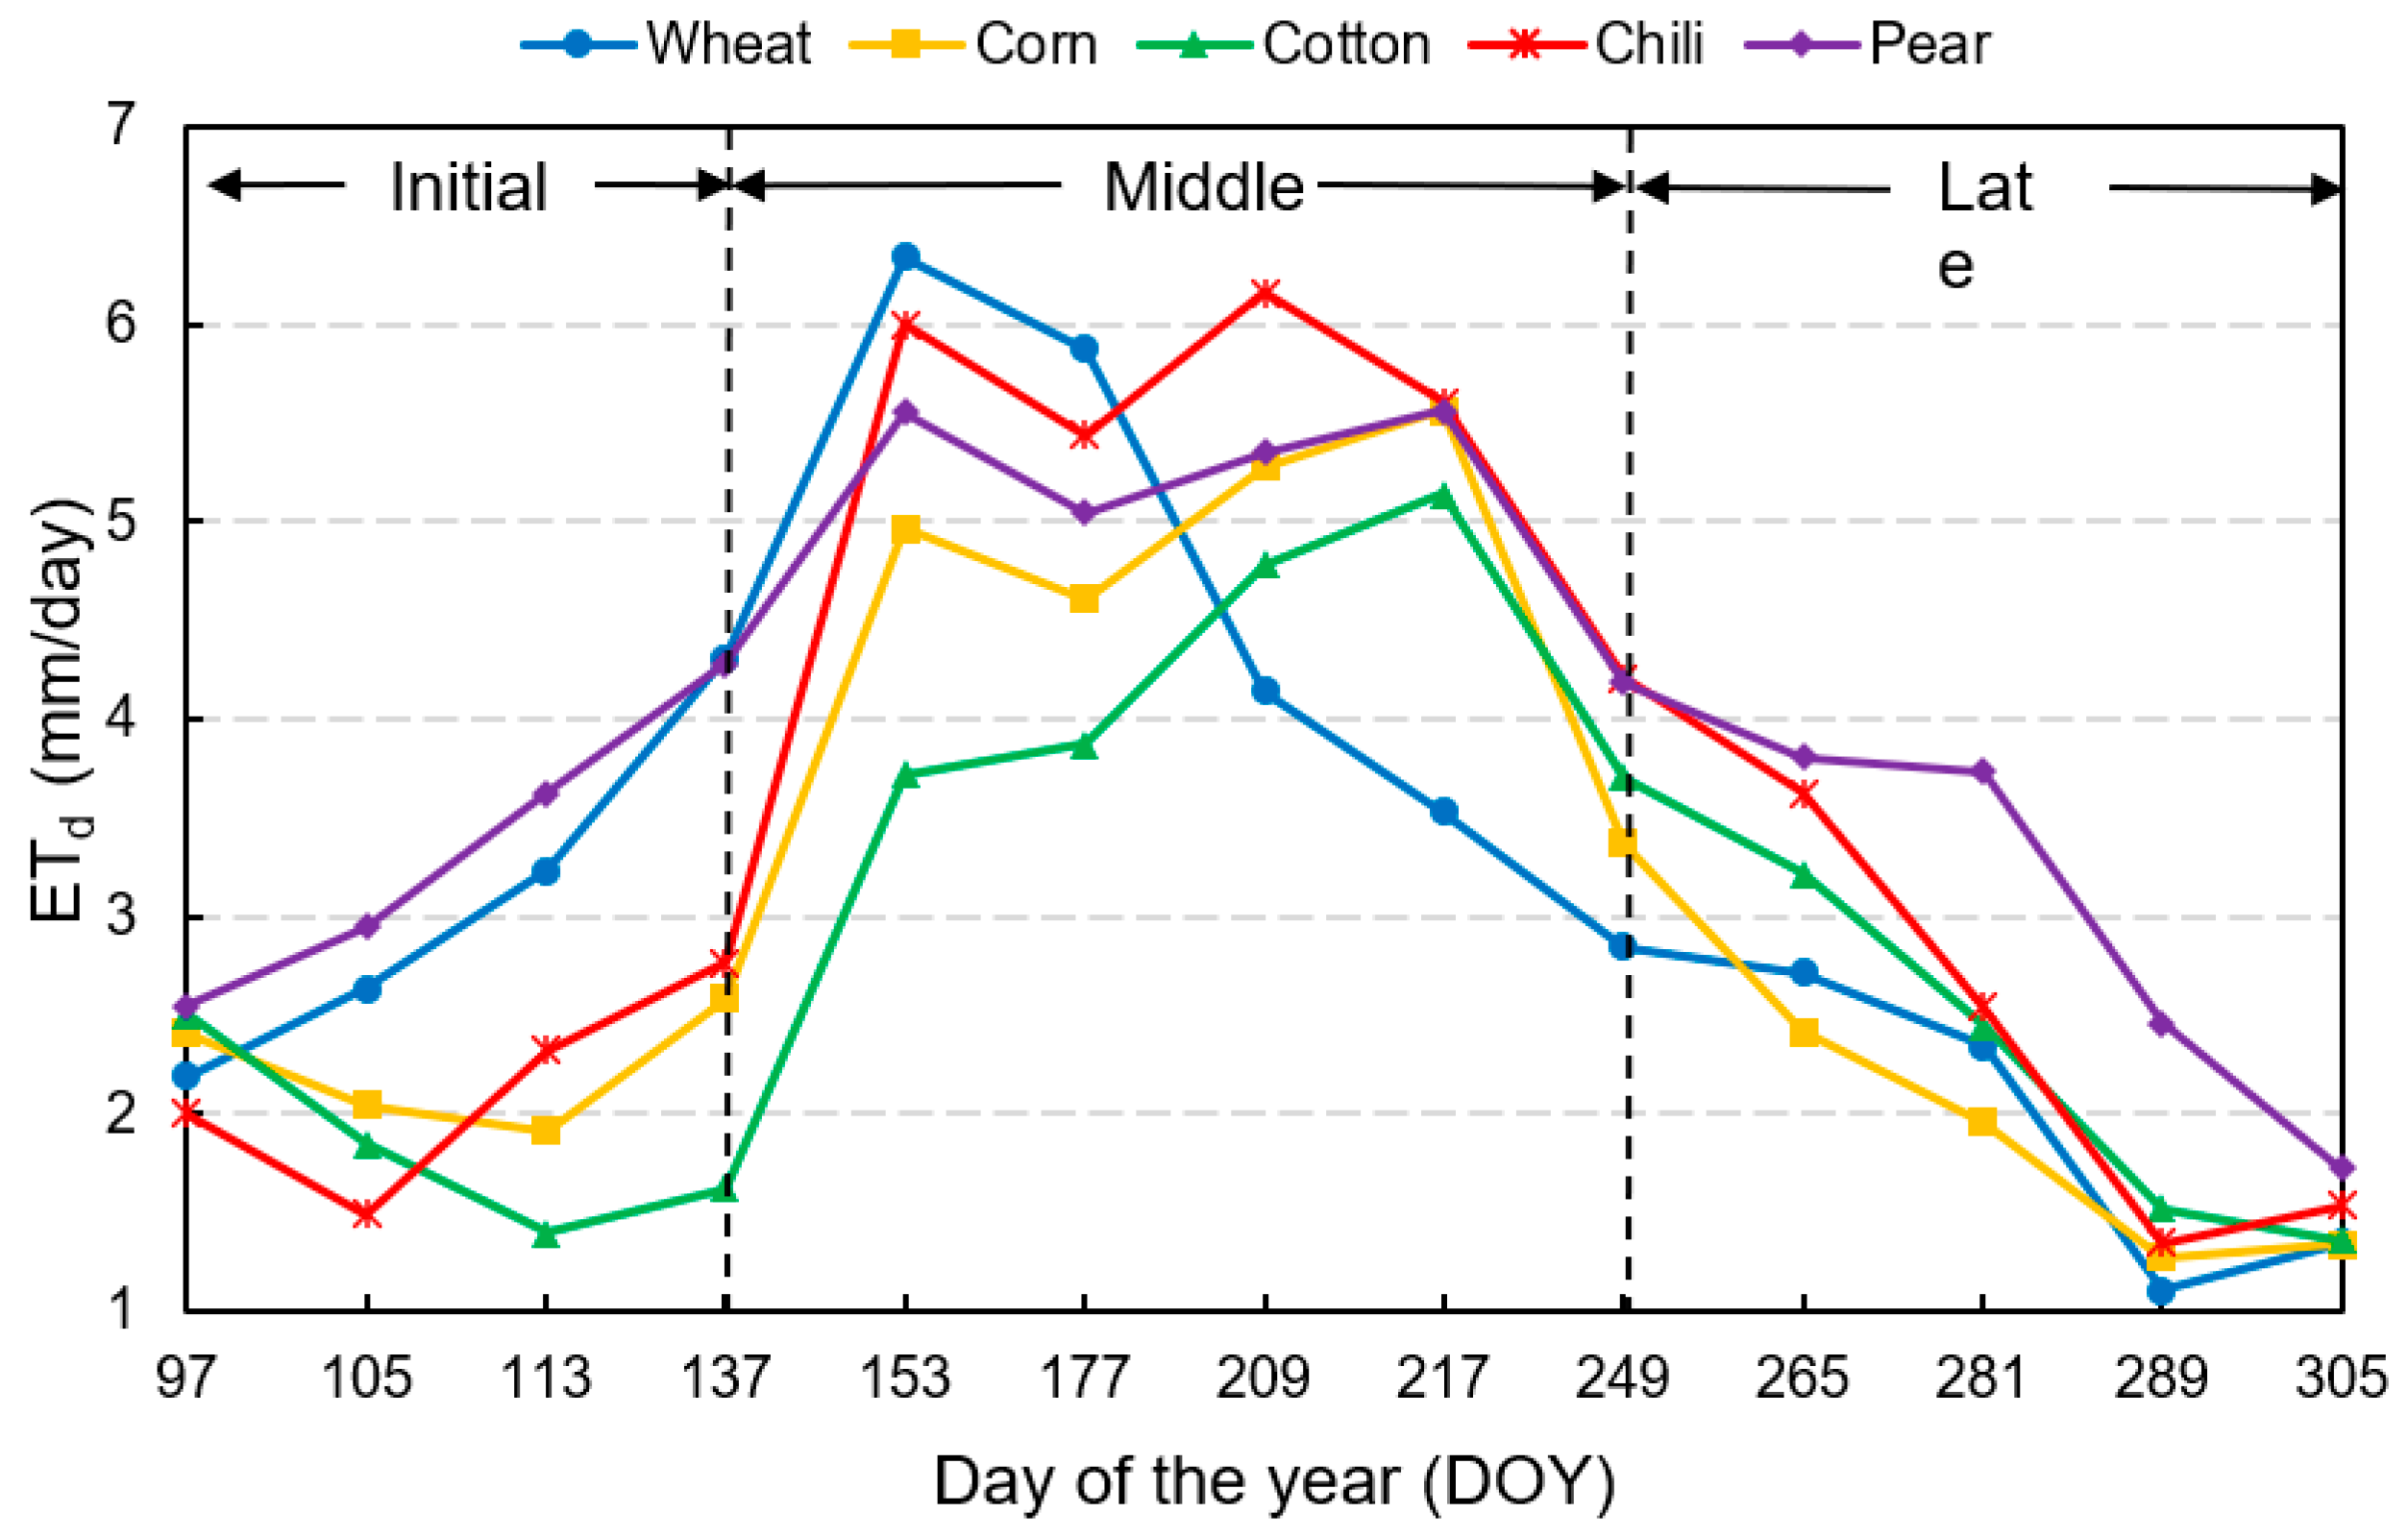
Figure 7.
(a) ET change curve with DOY of crops during the whole year; (b) ET change curve with the DOY of crops during the growing season. DOY during the crop growth stage of wheat, corn, cotton, chili, and pear are 81 to 281, 121 to 281, 121 to 313, 105 to 281, and 81 to 313, respectively.
Figure 7.
(a) ET change curve with DOY of crops during the whole year; (b) ET change curve with the DOY of crops during the growing season. DOY during the crop growth stage of wheat, corn, cotton, chili, and pear are 81 to 281, 121 to 281, 121 to 313, 105 to 281, and 81 to 313, respectively.
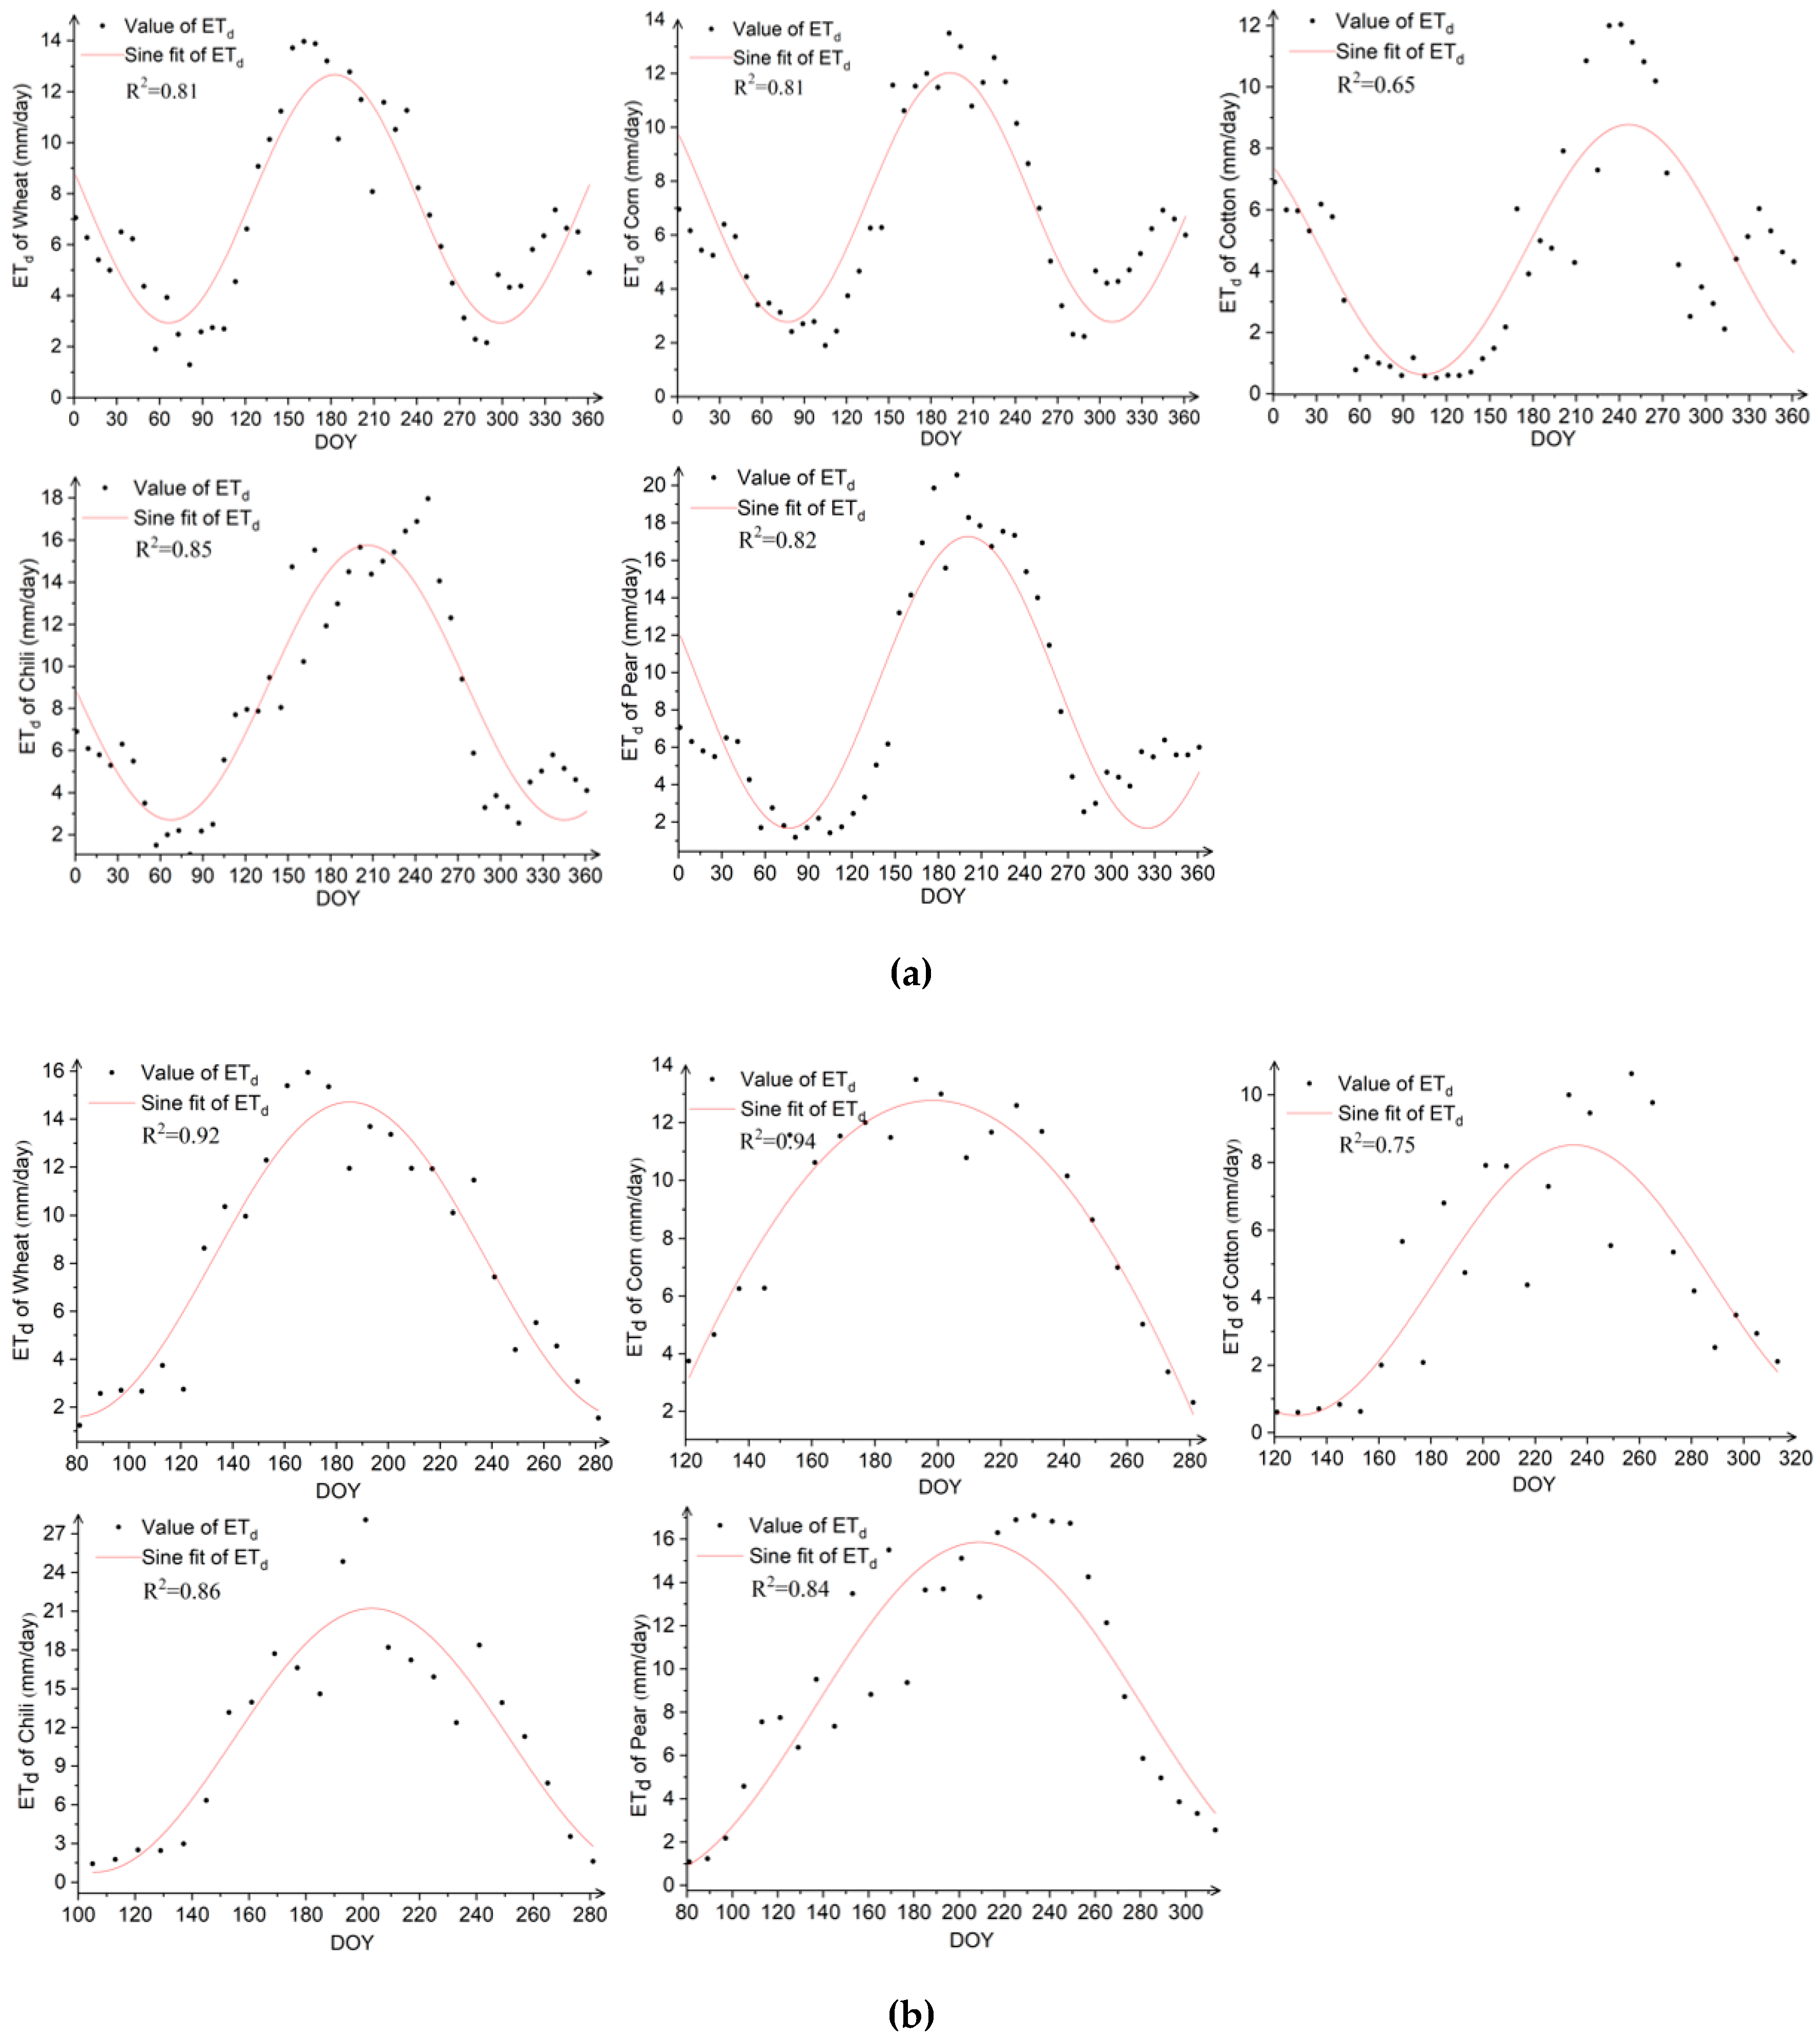
Figure 8.
Distribution of ET during crop growing season. (a), (b), and (c) refer to the three experiments A, B, and C, respectively.
Figure 8.
Distribution of ET during crop growing season. (a), (b), and (c) refer to the three experiments A, B, and C, respectively.
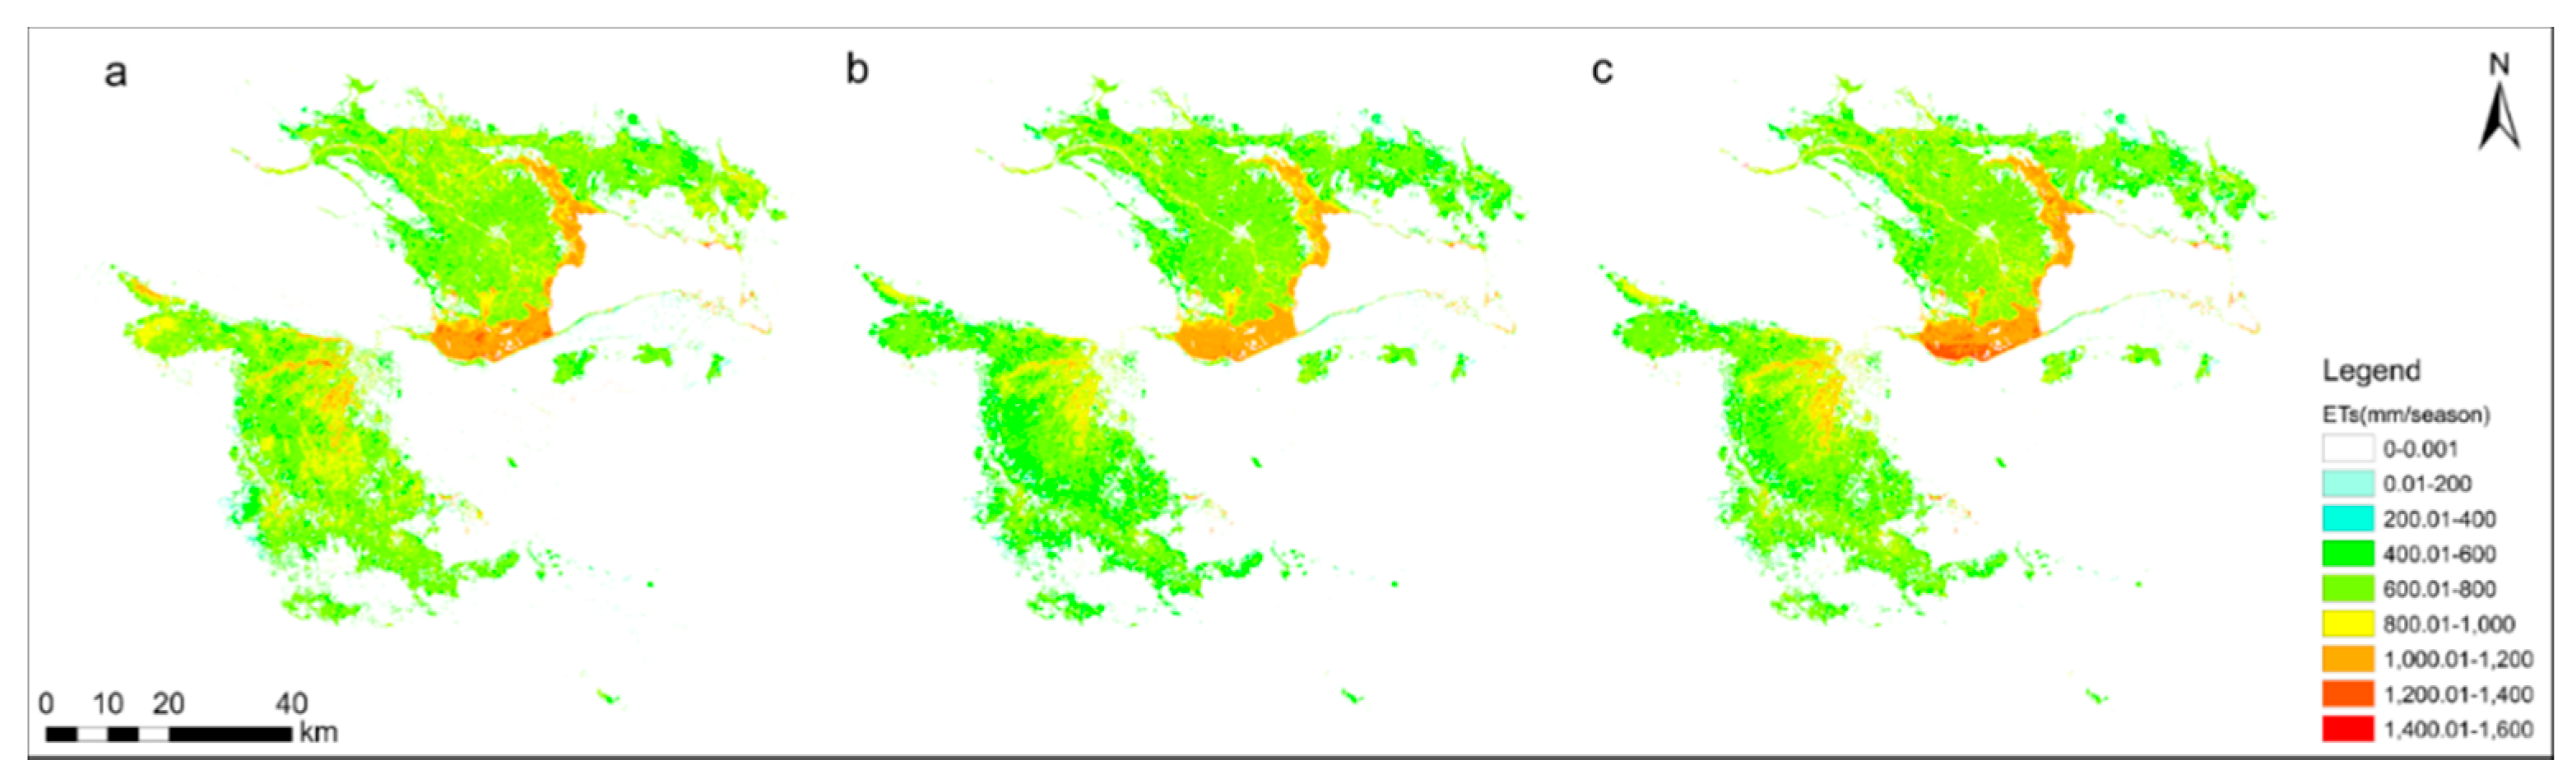
Figure 9.
The frequency of ETs. (a), (b), and (c) refer to the three experiments A, B, and C, respectively.
Figure 9.
The frequency of ETs. (a), (b), and (c) refer to the three experiments A, B, and C, respectively.
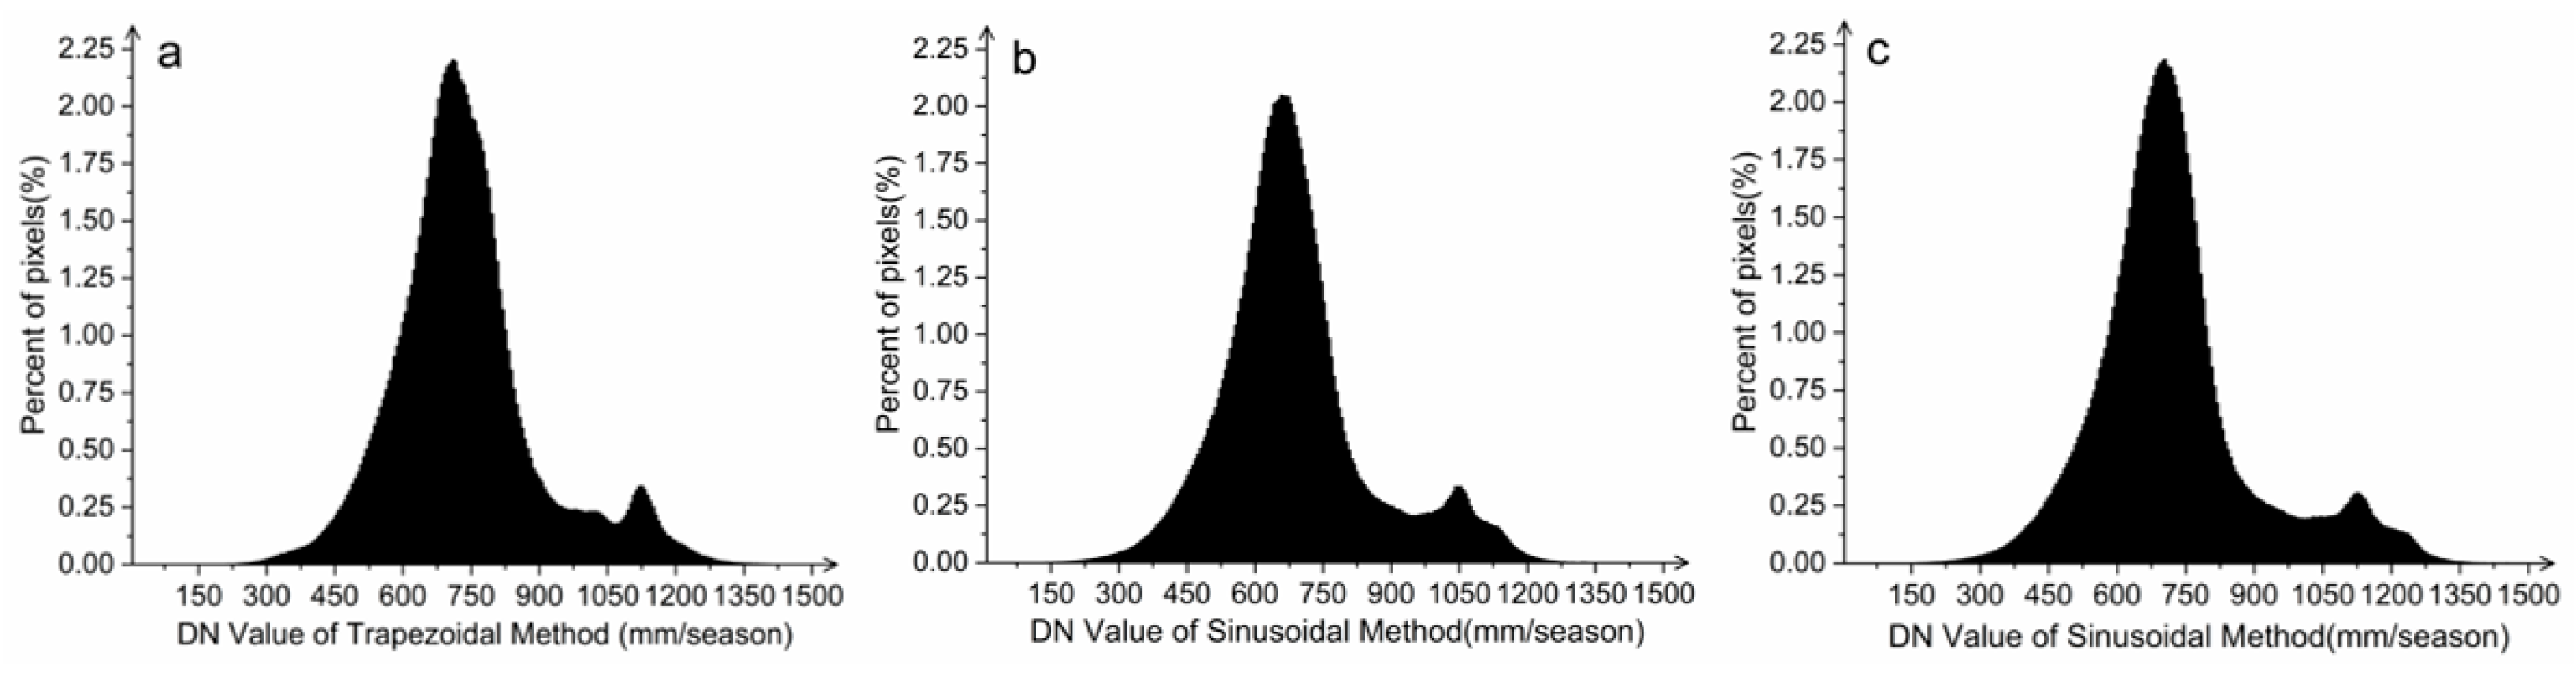
Figure 10.
ET of five main crops during the growing season. (a), (b), and (c) refer to the three experiments A, B, and C, respectively.
Figure 10.
ET of five main crops during the growing season. (a), (b), and (c) refer to the three experiments A, B, and C, respectively.
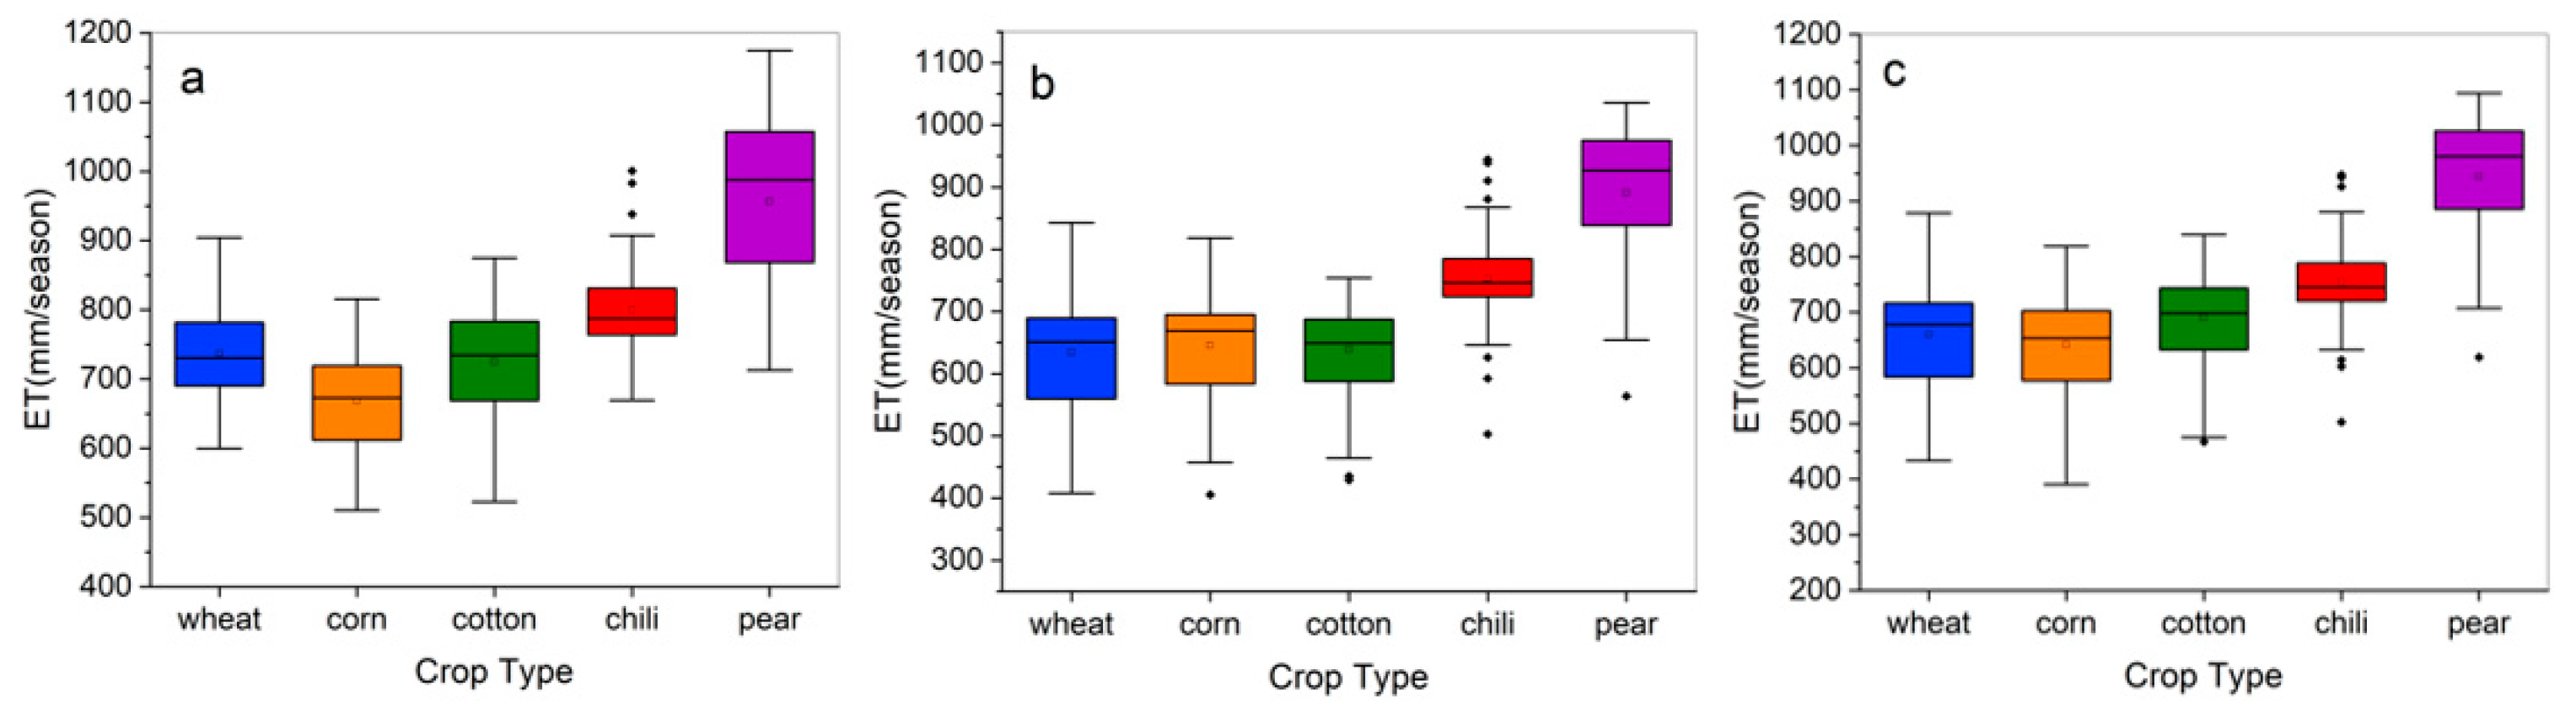
Figure 11.
(a) The distribution of ET during the growing season and (b) the frequency of ETs.

Table 1.
Details of the collected Landsat images.
| Date | DOY | Satellite and Sensors |
|---|---|---|
| 6 April | 97 | Landsat 7 ETM+ |
| 14 April | 105 | Landsat-8 OLI/TIRS |
| 22 April | 113 | Landsat 7 ETM+ |
| 16 May | 137 | Landsat-8 OLI/TIRS |
| 1 June | 153 | Landsat-8 OLI/TIRS |
| 25 June | 177 | Landsat 7 ETM+ |
| 27 July | 209 | Landsat 7 ETM+ |
| 4 August | 217 | Landsat-8 OLI/TIRS |
| 5 September | 249 | Landsat-8 OLI/TIRS |
| 21 September | 265 | Landsat-8 OLI/TIRS |
| 7 October | 281 | Landsat-8 OLI/TIRS |
| 15 October | 289 | Landsat-8 OLI/TIRS |
| 31 October | 305 | Landsat-8 OLI/TIRS |
Table 2.
Accuracy of ETd estimated by the SEBAL model.
| Date | ETd (mm/day) | ET0 (mm/day) | Kc | ETc (mm/day) | Difference (mm/day) | Accuracy |
|---|---|---|---|---|---|---|
| 22 April | 1.28 | 4.38 | 0.26 | 1.14 | −0.14 | 0.88 |
| 27 July | 5.14 | 5.01 | 1.20 | 6.01 | 0.87 | 0.86 |
| 15 October | 1.52 | 2.46 | 0.70 | 1.72 | 0.20 | 0.88 |
Table 3.
Function fitting formula and the coefficient of determination.
| Crop Type | During the Interannual | During Crop Growing Season | ||
|---|---|---|---|---|
| Fitting Formula | R2 | Fitting Formula | R2 | |
| Wheat | 0.81 | 0.92 | ||
| Corn | 0.81 | 0.94 | ||
| Cotton | 0.65 | 0.75 | ||
| Chili | 0.85 | 0.86 | ||
| Pear | 0.82 | 0.84 | ||
Table 4.
The average ETs of five main crops.
| Crop Type | Average ETs (mm) | |||||
|---|---|---|---|---|---|---|
| a | b | c | a-b | a-c | c-b | |
| Wheat | 736.63 | 634.57 | 660.18 | 102.06 | 76.45 | 25.61 |
| Corn | 668.18 | 645.53 | 641.43 | 22.65 | 26.75 | −4.10 |
| Cotton | 725.18 | 638.52 | 690.61 | 86.66 | 34.57 | 52.09 |
| Chili | 800.33 | 753.29 | 755.08 | 47.04 | 45.25 | 1.79 |
| Pear | 956.37 | 891.00 | 943.81 | 65.37 | 12.56 | 52.81 |
Table 5.
The design table of three comparative experiments.
| Test | Acquisition Date of Landsat Images (DOY) | ||||||||||||
|---|---|---|---|---|---|---|---|---|---|---|---|---|---|
| 97 | 105 | 113 | 137 | 153 | 177 | 209 | 217 | 249 | 265 | 281 | 289 | 305 | |
| 1 | √ | √ | √ | √ | √ | √ | √ | √ | √ | ||||
| 2 | √ | √ | √ | √ | √ | √ | √ | √ | √ | ||||
| 3 | √ | √ | √ | √ | √ | √ | √ | √ | √ | ||||
Note: √ refers to images that need to be involved in the estimation.
© 2020 by the authors. Licensee MDPI, Basel, Switzerland. This article is an open access article distributed under the terms and conditions of the Creative Commons Attribution (CC BY) license (http://creativecommons.org/licenses/by/4.0/).
Share and Cite
MDPI and ACS Style
Cha, M.; Li, M.; Wang, X. Estimation of Seasonal Evapotranspiration for Crops in Arid Regions Using Multisource Remote Sensing Images. Remote Sens. 2020, 12, 2398. https://doi.org/10.3390/rs12152398
AMA Style
Cha M, Li M, Wang X. Estimation of Seasonal Evapotranspiration for Crops in Arid Regions Using Multisource Remote Sensing Images. Remote Sensing. 2020; 12(15):2398. https://doi.org/10.3390/rs12152398
Chicago/Turabian StyleCha, Mingxing, Mengmeng Li, and Xiaoqin Wang. 2020. "Estimation of Seasonal Evapotranspiration for Crops in Arid Regions Using Multisource Remote Sensing Images" Remote Sensing 12, no. 15: 2398. https://doi.org/10.3390/rs12152398
Note that from the first issue of 2016, this journal uses article numbers instead of page numbers. See further details here.