Application of the GPM-IMERG Products in Flash Flood Warning: A Case Study in Yunnan, China
by
 ,
,
Meihong Ma
1,2,3, 
Huixiao Wang
1,3,*,
Pengfei Jia
4,†,
Guoqiang Tang
5,6,
Dacheng Wang
7,
Ziqiang Ma
8,9 and
Haiming Yan
10 1
College of Water Sciences, Beijing Normal University, Beijing 100875, China
2
School of Geographic and Environmental Sciences, Tianjin Normal University, Tianjin 300387, China
3
Beijing Key Laboratory of urban hydrologic cycle and sponge City Technology, Beijing 100875, China
4
CITIC Construction Co., Ltd., Beijing 100027, China
5
Center for Hydrology, University of Saskatchewan, Saskatoon, SK S7N 1K2, Canada
6
Coldwater Laboratory, University of Saskatchewan, Canmore, AL T1W 3G1, Canada
7
Lab of Spatial Information Integration, Institute of Remote Sensing and Digital Earth, Chinese Academy of Sciences, Beijing 100101, China
8
School of Earth and Space Sciences, Peking University, Beijing 100871, China
9
State Key Laboratory of Resources and Environmental Information System, Beijing 100871, China
10
School of Land Resources and Urban & Rural Planning, Digital Territory Experiment Center, Hebei GEO University, Shijiazhuang 050031, China
*
Author to whom correspondence should be addressed.
†
Co-first author: Pengfei Jia.
Remote Sens. 2020, 12(12), 1954; https://doi.org/10.3390/rs12121954
Submission received: 26 April 2020
/
Revised: 15 June 2020
/
Accepted: 15 June 2020
/
Published: 17 June 2020
(This article belongs to the Special Issue Using Remote Sensing Techniques to Improve Hydrological Predictions in a Rapidly Changing World)
Abstract
:NASA’s Integrated Multi-Satellite Retrievals for Global Precipitation Measurement (IMERG) is a major source of precipitation data, having a larger coverage, higher precision, and a higher spatiotemporal resolution than previous products, such as the Tropical Rainfall Measuring Mission (TRMM). However, there rarely has been an application of IMERG products in flash flood warnings. Taking Yunnan Province as the typical study area, this study first evaluated the accuracy of the near-real-time IMERG Early run product (IMERG-E) and the post-real-time IMERG Final run product (IMERG-F) with a 6-hourly temporal resolution. Then the performance of the two products was analyzed with the improved Rainfall Triggering Index (RTI) in the flash flood warning. Results show that (1) IMERG-F presents acceptable accuracy over the study area, with a relatively high hourly correlation coefficient of 0.46 and relative bias of 23.33% on the grid, which performs better than IMERG-E; and (2) when the RTI model is calibrated with the gauge data, the IMERG-F results matched well with the gauge data, indicating that it is viable to use MERG-F in flash flood warnings. However, as the flash flood occurrence increases, both gauge and IMERG-F data capture fewer flash flood events, and IMERG-F overestimates actual precipitation. Nevertheless, IMERG-F can capture more flood events than IMERG-E and can contribute to improving the accuracy of the flash flood warnings in Yunnan Province and other flood-prone areas.
1. Introduction
Flash floods, triggered by heavy rainfall (i.e., short duration, high intensity), are the rapid flooding of water within minutes up to several hours in small basins (hundred square kilometers or less) [1]. It is one of the most devastating floods in the world, which can cause great economic losses and casualties. From 1 October 2007 to 1 October 2015, the National Weather Service (NWS) of the U.S. reported that 278 people died from flash floods, 10% of which resulted in an average property loss of over $100,000 [2]. China is also suffering from severe flash floods, where 984 people have died from flash floods every year on average since 1950 [3]. With the increase in global precipitation and rapid economic development, the frequency and impacts of flash floods will be further exacerbated [4]. The most crucial approach to adapt to flash floods is accurate warnings, which can leave people with more time to respond to these emergencies. However, flash flood early warning remains challenging, especially given the conditions of a short lead time (less than 1–3 h). Accurate and continuous precipitation datasets with high spatial (i.e., 1–4 km) and temporal resolutions (i.e., 5 min to hourly) are critical to the success of flood warnings [5]. Considering climate change and land degradation processes, new tools for flood disaster monitoring and reduction are strongly required. Satellite precipitation products have wide coverage, a high spatiotemporal resolution, and easy data acquisition, and are not restricted by terrain conditions. These products are extremely important to flood warnings in mountainous areas prone to flash floods, where there is scarcely measured rainfall data, and some satellite precipitation products have been used to assess the floods over the basins. However, satellite precipitation products may underestimate extremely strong precipitation, and the accuracy of the satellite precipitation products in catching flash floods remains poorly understood [6,7].
Nowadays, numerous satellite precipitation products, such as the Tropical Rainfall Measuring Mission (TRMM) and Integrated Multi-Satellite Retrievals for Global Precipitation Measurement (GPM) Mission (IMERG), are available for providing post-real-time (PRT) estimation and near-real-time (NRT) estimation. PRT products generally undergo ground-based gauge adjustments while NRT products do not, indicating the former is usually more accurate than the latter [8]. These satellite precipitation products generally have high spatiotemporal resolutions (finer than a 0.25° spatial resolution and shorter than the daily temporal interval) with a wide quasi-global coverage (broader than the 50° N–50° S latitude band); these products are very useful for hydrological studies, especially in data-sparse or ungauged basins [9]. GPM is a new generation of satellite products inheriting TRMM satellite products, with more comprehensive data and higher spatiotemporal accuracy. IMERG is the Level 3 precipitation estimation algorithm of GPM, which can combine gauged rainfall data and satellite data to obtain global rainfall data. IMERG provides three types of products, including the NRT IMERG Early run (hereafter IMERG-E), Late run (hereafter IMERG-L) and the PRT IMERG Final run (hereafter IMERG-F) [10]. Previous studies have proclaimed that IMERG-F has higher accuracy, especially on land, while the IMERG-E and IMERG-L products have better timeliness, which is attractive for flood prediction and monitoring. However, due to the limitations in observation position, density, topography, etc., it is difficult to directly analyze the actual spatial distribution of rainfall with gauged rainfall data [11]. Meanwhile, satellite products also contain uncertainties from instruments, sampling, and retrieval algorithms, and therefore should be comprehensively validated using local gauge data [12].
An appropriate flash flood warning method is another key factor to ameliorate the flash flood warning accuracy. Typical examples include Flash Flood Guidance (FFG), Soil Water Index (SWI), Rainfall Triggering Index (RTI), etc. [13]. FFG is one of the most widely used methods developed by the US River Forecasting Center in the early 1970s, and it calculates the rainfall required to produce bank-full flood conditions associated with flash floods in a given time and area. The calculation steps of the FFG are as follows: (1) gaining the current soil moisture with the hydrological model; (2) reversing the flood peak flow of the basin outlet section; and (3) obtaining the critical rainfall required when the flow reaches the early warning flow [14]. However, FFG has more data requirements since it considers almost all influencing factors. For example, the soil moisture index is an indicator that can accurately describe the trend in soil moisture in the aeration zone, which is mainly calculated from the total water depth of a three-layer tank model with fixed parameters, and FFG has only one parameter related to the infiltration time; however, it is difficult to obtain this parameter regardless of concentration calculation or distribution calculation [15]. The RTI comprehensively considers the effective accumulated rainfall and rainfall intensity in the prediction of flash floods. It focuses on antecedent conditions and has been put into practice for over 10 years in Taiwan [13]. However, this method relies too much on rainfall stations, fails to fully consider intermittent rainfall, and is greatly affected by rainfall field segmentation. Meanwhile, using the deduction coefficient of “t” days in the RTI model for the antecedent rainfall calculation will result in a higher false alert rate under some rainfall patterns. Therefore, Chen et al. (2017) proposed an improved RTI to calculate the antecedent rainfall and effective accumulated rainfall to solve the abovementioned problems, which achieved good practical application effects in Taiwan’s 2017 disaster warning [16].
As satellite precipitation data is widely used in large-scale watershed hydrological simulation or land surface process simulation, it is still difficult to meet the needs of flash flood prediction in small and medium-sized watersheds. Most of the existing research focus on the corrected products, but there scarcely has been application verification for real-time products. Most of the satellite products are applied on a large scale, and little attention has been paid to their applicability in small-scale flash flood warnings. Additionally, flash floods generally occur in small and medium-sized river basins with poor economic conditions, low station network coverage density, and there is great difficulty in obtaining data. Given that IMERG products have high spatiotemporal precision, it is therefore of great practical significance to evaluate the applicability of these products to flash flood warnings. Moreover, regional studies are also very common and popular because precipitation exhibits strong spatial variations and different products show varying performance over different regions. Meanwhile, there are still few studies on the inter-comparison of the IMERG products, especially in China, where the superiority of its application in flash flood warnings still needs further exploration [17]. Therefore, taking Yunnan Province in China as the study area, based on two fifth-generation IMERG products (IMERG-E, IMERG-F) and China Meteorological Administration (CMA) data, this study first evaluated these two products with particular attention paid to their systematic and random errors. Then, the empirical RTI method was utilized to evaluate the applicability of the different IMERG products in flash flood warnings. This paper is further organized as follows: Section 2 describes the materials and data; Section 3 presents an assessment of IMERG-E and IMERG-F based on locally measured data and analyzes the effects of flash flood warnings based on satellite precipitation data; and the conclusions are summarized in Section 4.
2. Materials and Data
2.1. Study Area
Yunnan Province is located at the low latitude plateau of southwest China, with an area of 390,000 km2, accounting for 4.1% of China’s total area [18]. The terrain in Yunnan Province is very complex, coupled with the low economic level of remote mountain areas, resulting in the lack of early disaster data. For example, the main terrains are mountains (84%), plateaus and hills (10%), and basins and valleys (6%). The altitude is high in the northwest and low in the southeast, descending stepwise from north to south in this region, and the average altitude is 1980 m, and 87.21% of the land is located in middle-latitude areas (1000–3500 m). The area with a slope below 25° accounts for 56.46% of the national total area. Besides, Yunnan Province is characterized by the most widely distributed karst topography, accounting for 28.9% of the province’s area; this results in low water retention and frequent flood disasters. Yunnan is rich in water resources, but unevenly distributed in time and space, where more than 70% of the water resources are concentrated in remote mountainous areas. The total population is 47.1 million in 2014, accounting for 3.5% of the national total population. Yunnan has a typical monsoon climate, mainly dominated by the east Asian monsoon and southwest monsoon, and 90% of the precipitation is concentrated from May to October, especially in the flood season (June to August). For example, long-term studies have shown that the critical rainfall is 35–200 mm in northwest Yunnan, 50–200 mm in southwest Yunnan, and 100–300 mm in eastern Yunnan [19]. The above reasons led to frequent flash flood disasters, which has caused extremely serious disasters. For example, 72 people died from flash floods in Yunnan Province in 2014, accounting for 22.2% of the national total deaths from flash floods. All the preliminary works have promoted the development of flash flood prevention in Yunnan Province [20], but further exploration is still needed, and therefore Yunnan Province was selected as the study area in this study. Figure 1 shows the map of the topography and flash flood disaster distribution in Yunnan Province.
2.2. Data
2.2.1. Satellite Data
TRMM Multi-Satellite Precipitation Analysis (TMPA) (50° N–50° S) can retrieve microwave–infrared satellite precipitation estimates with gauge adjustments and can generate rational precipitation estimates at fine spatiotemporal scales (0.25° × 0.25° and 3-hourly temporal intervals) within the global scope (60° N–60° S) [21,22]. As the successor of TRMM, the GPM constellation consists of a core observation platform and 10 cooperative satellites to observe global precipitation through inter-satellite cooperation. The GPM program offers three different levels of data products, all of which are available on the NASA website (http://www.nasa.gov/mission_pages/GPM). This study focuses on the GPM Level 3 products based on the IMERG algorithm. IMERG not only has a high spatial resolution (0.1° × 0.1°, 0.5 h) and fully global coverage (60° S~60° N), but also predicts flood disasters by reducing the uncertainty associated with short-term precipitation accumulation. At present, IMERG data has been developed from the first version to the sixth version, and IMERG-V06B is the latest version of the satellite rainfall data. However, Mohammad et al. (2019) verified that IMERG V05 performs better than V06, and therefore this study has employed IMERG V05 to estimate the precipitation data [23].
IMERG has three different products: Early, Late, and Final. In the real-time phase, the IMERG data generation system generates Early products after running once and then generates Late products after running again. The main difference between them is that the Early product is generated only by the forward propagation algorithm in the cloud mobile vector propagation algorithm, while the Late product is added with the backpropagation algorithm. The time-lag product Final introduces more sensor data sources based on the Late product. Meanwhile, the time of the extracted satellite data is matched with the station’s data (08:00 a.m.) [24]. Table 1 shows the detailed information of the three IMERG products, with a study period of 2015–2018. Since IMERG-E and IMERG-L products are NRT products, they are released after 4 h and 12 h after observation, respectively; in turn, the IMERG-F is a PRT product, which has been calibrated for the deviation of the ground rainfall station, so it has a high accuracy and is usually released after two months of observation. Therefore, this study has adopted CMA data as calibration data, pays attention to the accuracy of the IMERG rainfall data to capture flash flood disasters, and combines the precipitation data estimated by IMERG-E and IMERG-F to discuss the accuracy of capturing flash flood, and thereby contributes to obtaining the static early warning thresholds.
2.2.2. Ground Observation Precipitation Data
The regional hourly precipitation integration products of the CMA (http://cdc.cma.gov.cn) is a reference product, which is based on the hourly precipitation observed by more than 30,000 automatic weather stations nationwide and the Climate Prediction Center morphing (CMORPH) satellite. Using the probability density function and optimal interpolation method, the precipitation fusion products with a high spatiotemporal resolution (0.1° × 0.1° and 1-h interval) have been generated in China. Among them, the optimal interpolation method is to combine the semi-hourly infrared data of the Geostationary Earth Orbit (GEO) satellite to interpolate the Passive microwave (PMW) inversion data, and then obtain the relatively fine precipitation. The gauge data involved in the CMA are subject to extreme quality control, including consistency checks, both internal and spatiotemporal. Meanwhile, the complex terrain, the low economic level in remote mountainous areas, and the sparse distribution of the ground stations have led to large errors in the measured data. The CMA data has a wide coverage and high spatiotemporal resolution; the overall error of this product is within 10%, and the error for heavy precipitation and site sparse areas is within 20%, which is more accurate than other similar products in China. Therefore, CMA products are suitable as the calibration data for product evaluation, but their scale should be consistent with the IMERG product in the calibration process [25]. Besides, when using CMA data to estimate the rainfall distribution, we should consider that the dataset may have a delayed phenomenon since it is actually a fusion of measured data and CMORPH satellite rainfall data.
The rainfall level is defined by the CMA, for example, the intraday rainfall is categorized into the rain and light-moderate rain (0–25 mm), heavy rain (25–50 mm), and rainstorm (>50 mm). Meanwhile, the minimum amount of precipitation that the gauges can measure is 0.1 mm. The critical rainfall in Yunnan Province mainly comes from the China rainstorm parameters atlas, which describes the statistical characteristics and laws of China’s rainstorms. Based on the study period 2015–2018, the flash flood data were mainly from officially published data. In this study, a total of 120 flash flood events were analyzed, all of which resulted in deaths or missing of people. Additionally, some other data were also employed; for example, the topographic data came from a 1:250,000 digital elevation model (DEM) of the Yunnan Province.
2.3. Methodology
2.3.1. RTI Method
Since 2005, the RTI model has been widely applied in flash flood warnings, which effectively reduced the casualties caused by flash floods. Considering that flash floods are mainly caused by hourly peak rainfall, this method is used to predict flash flood by multiplying the effective cumulative rainfall (Rt) and rainfall intensity (I). Among them, the effective accumulated rainfall mainly uses the accumulated rainfall in the previous 7 days before the flash flood occurs. Based on historical rainfall, this method obtains the flash flood probability under different rainfall conditions by calculating the RTI, and then divides the critical rainfall map into three regions for early warning (low possible, medium, and high) [13]. Meanwhile, it also defines how to segment the rainfall events, i.e., the start time is defined as the rainfall per hour exceeding 4 mm, and the end time is the rainfall per hour falling below 4 mm for six consecutive hours. A single day refers to the period from yesterday at 08:00 a.m. to today at 08:00 a.m. Rainfall data were selected according to the flash flood disaster events. If the flash flood disaster occurs in an area without a monitoring station, calculations are performed using data from the nearest rainfall stations (within a radius of 50 mm). The RTI equations are as follows:
where is the RTI calculated at time t; I is the rainfall intensity; Rt is the effective cumulative rainfall; i means the antecedent day number from one to n; α is the rainfall attenuation coefficient, mainly taken from the measured value of 0.78 by Cui Peng in Jiangjiagou, Yunnan Province [26]; αi is the reduction factor of the previous i day; and Ri is the 24-h cumulative rainfall of the previous i-day, where the initial cumulative rainfall R0 is 50 mm, which is mainly obtained through actual statistical analysis.
Since the previous rainfall was calculated using “t” days of accumulated rainfall, the false alarms rate is higher in certain rainfall patterns (e.g., long-term duration and low rainfall intensity). Besides, this method does not consider the effects of intermittent rainfall and rainfall segmentation, etc.; all of the above results in low accuracy. Therefore, based on the reduction period and the reduction coefficient being unchanged, Chen et al. (2018) proposed an improved RTI method and provides a detailed flowchart describing the method [16]. The specific equation of this method is
where It is the current rainfall intensity at time t (mm/h); and Rt−1 is the effective cumulative rainfall one hour earlier. In Formula (2), each operation needs to calculate Ri separately, multiply it by αi, and then accumulate; however, in Formula (3), it has only one rainfall intensity and one accumulated rainfall, which greatly reduces the calculation amount and contributes to the future subsequent large-scale grid operations.
2.3.2. Evaluation Metrics
Six indicators were employed to evaluate the accuracy of the satellite precipitation products. Table 2 shows the formulas and optimal values of these indexes. CC (correlation coefficient) represents the correlation between the satellite precipitation data and site precipitation data, the greater the better; BIAS (Relative Bias) and RMSE (Root Mean Square Error) are quantitative indicators, representing the deviation degree between the satellite precipitation data and ground station precipitation data. The method also includes three classification indicators: Probability Of Detection (POD), False Alarm Ratio (FAR), and Critical Success Index (CSI), which can comprehensively reflect the ability of the precipitation products to estimate the probability of precipitation event occurrence. Among them, POD is the correct forecast rate, while FAR is the wrong forecast rate. The critical success index (CSI) is the function of POD and FAR that provides a more balanced estimate of the satellite products [27].
2.3.3. Systematic or Random Error
Random error is an avoidable error caused by measurement or calculation. Systematic error is the unavoidable error caused by the experimental instrument or accuracy. Systematic and random errors are determined by objective and subjective factors, respectively, both of which can be reduced but not eliminated [28]. The spatiotemporal variability of precipitation, measurement error, and the uncertainty of sampling affects the satellite precipitation data accuracy, where the uncertainties include systematic and random errors (hereafter Syst and Rand), mainly from (1) sensor observation; (2) the algorithm used to estimate rainfall; and (3) sampling error. Reference [29] developed a method for estimating Syst and Rand for satellite precipitation products. The system of mean square error (MSE) and the formula for random error are
where x is the satellite precipitation; y is the CMA precipitation; and n is the time steps number (here days); the formula for calculating is as follows:
where a and b are the slope and intercept parameters that need to be calibrated, respectively. The calculation formula is
3. Results and Discussion
3.1. Spatial Distribution of Precipitation
Figure 2 shows the spatial distributions of the daily average precipitation in Yunnan Province captured by IMERG-E, IMERG-F, and CMA from March 2015 to December 2018. Using CMA data as the reference calibration data, the rainfall distribution in Yunnan Province is shown in Figure 2a. In Yunnan Province, the precipitation increases from northeast to southwest, with the largest precipitation occurring in the western border region. Referring to Figure 1, Yunnan’s terrain is complex and changeable, with a high northwest and low southeast, descending stepwise from north to south. Moreover, flash floods are mainly concentrated in the southwest region and densely distributed in parts of the northeast, reflecting that the flash flood disaster is mainly affected by multiple factors with heavy rainfall as the main trigger. Meanwhile, there is a clear precipitation zone in the western region, with the smallest precipitation in the northwest and more precipitation in the central-western region. Figure 2b,c presents the distribution of the estimated precipitation in Yunnan Province using IMERG-E and IMERG-F, respectively. The overall trend is consistent with the precipitation distribution measured by CMA; that is, the estimated precipitation is relatively large in the southwest area, while low in the northeast relatively. Among them, the estimated rainfall of IMERG-E is less in the northeast region and has a larger coverage area, which is lower than that of CMA. The estimated maximum rainfall area is consistent with the CMA, but its coverage area is much smaller than the CMA. Therefore, IMERG-E underestimates the precipitation, especially in the southwest region. IMERG-F is the opposite of IMERG-E; its estimated rainfall covers a larger area, and the minimum and maximum rainfall are higher than the CMA. IMERG-F overestimates precipitation, especially in the central and western regions.
3.2. Evaluation of IMERG-E and IMERG-F
Figure 3 presents the spatial patterns of six indicators obtained from IMERG-E and the CMA using hourly data over the Yunnan Province. Generally, CC was relatively low, changing from 0.2 to 0.5, especially over the northwest regions (CC < 0.2) with the highest altitudes. As for the RMSE and BIAS, their spatial patterns are similar, with an increasing trend for the RMSE and BIAS and a decreasing trend for relative error from northwest to southeast. Many previous studies have confirmed that satellite precipitation estimates are usually low with large errors in mountainous areas. For example, compared with the highest regions in the Northwest, IMERG-E’s BIAS is underestimated by about 50% [30]. As for satellite-based precipitation metrics, there is also a significant trend; that is, POD and CSI are increasing, while FAR is decreasing, which is in harmony with the overall trend of the IMERG-E data. Table 3 shows the evaluation metrics for IMERG calculated with the mean value at hourly and daily timescales; the evaluation index calculated by the mean is larger on a daily scale than that on an hourly scale. Given the relatively low accuracy of IMERG-E, the differences between the IMERG-E and CMA were relatively obvious.
The spatial patterns of the six metrics derived from IMERG-F and CMA (Figure 4) exhibited similar trends as those from IMERG-E and CMA. Table 2 revealed the four indicators CC, BIAS, POD, and CSI of NRL IMERG-E products are lower than these for PRL IMERG-F, regardless of daily and hourly data, while the two indicators RMSE and FAR are higher than that for IMERG-F. Therefore, IMERG-F indicated a better performance in this region. For instance, the POD and CSI of IMERG-F and CMA were also overall higher than those of IMERG-F and CMA, especially for CSI. Besides, in both Figure 3 and Figure 4, the POD and CSI in these two figures show significant differences inside and outside of the Yunnan Province, which is mainly due to the complex and changeable terrain that induces large systematic errors in satellite precipitation. Besides, there is no actual rainfall measurement site outside the Yunnan border, and the rainfall distribution obtained only by interpolation appears discontinuous.
The following is a further analysis of the error source (i.e., systematic error or random error) of EMERG-E. The spatial patterns of systematic and random errors in IMERG-E at the 1 and 24 h temporal scales in Yunnan Province, respectively, demonstrated almost the same spatial patterns (Figure 5). Overall, the system error is mainly distributed in the northwest region of Yunnan Province with a high altitude (about 80%), and the coverage area is relatively small. Meanwhile, except for the northwestern part of Yunnan Province, the systematic error at 1 h is significantly higher than that at 24 h, especially the error at 24 h mostly disappeared. Random error mainly occurs in the southern region of Yunnan Province with relatively high rainfall (about 80%), but a relatively low in the northwest region. Besides, the random error is higher at 24 h than at 1 h. Therefore, for the IMERG-E data, the estimated error in the high-altitude and low-precipitation areas of Yunnan Province is mainly determined by the systematic error; the southern area of Yunnan Province with a low elevation and high precipitation is dominated by random errors.
As for IMERG-F, systematic errors accounted for less than 20% of the total errors across the whole study area at both the 1 and 24 h temporal scales. Compared with IMERG-E, IMERG-F has been significantly improved because the systematic errors were effectively reduced, especially in mountainous areas with the complex terrain. Figure 6 shows that the IMERG-F data error (≥80%) is primarily a random error, independent of the underlying surface features. Besides, Figure 6 and Figure 7 behave differently inside and outside the Yunnan border. This phenomenon is mainly due to the complex and changeable terrain of Yunnan Province, which further triggers the discontinuous changes in satellite precipitation errors. It is a discontinuous problem in the original satellite’s precipitation error, rather than using different spatiotemporal resolution rainfall. Therefore, the overall IMERG-F data is better than the IMERG-E data.
3.3. Applicability Analysis of IMERG in Flash Flood Warning
Based on historical flash flood disaster events, combined with three types of rainfall products (IMERG-E and -F, and CMA), the multi-period rainfall (1 h, 3 h, 6 h, and 24 h) is obtained. The resultant effective accumulated multi-period rainfall is calculated by the improved RTI method. Meanwhile, combined with the flash floods’ actual frequency and the rainstorm statistical parameter atlas of China, the multi-period critical rainfall (1 h, 3 h, 6 h, and 24 h) (hereafter, CR1, CR3, CR6, and CR24) is obtained; the G (x) early warning model is constructed for effective cumulative rainfall (Rt) and corresponding period critical rainfall (CRt). Since this model does not take into account the potential multiple influencing factors, such as slope, vegetation, and human activity, when issuing the flash flood warning, we should make a comprehensive analysis regarding the flash flood risk distribution to determine whether a flash flood event has been captured. Considering the flash flood risk map obtained by Ma et al. (2019), the obtained results are shown in Figure 7 and Figure 8 [31].
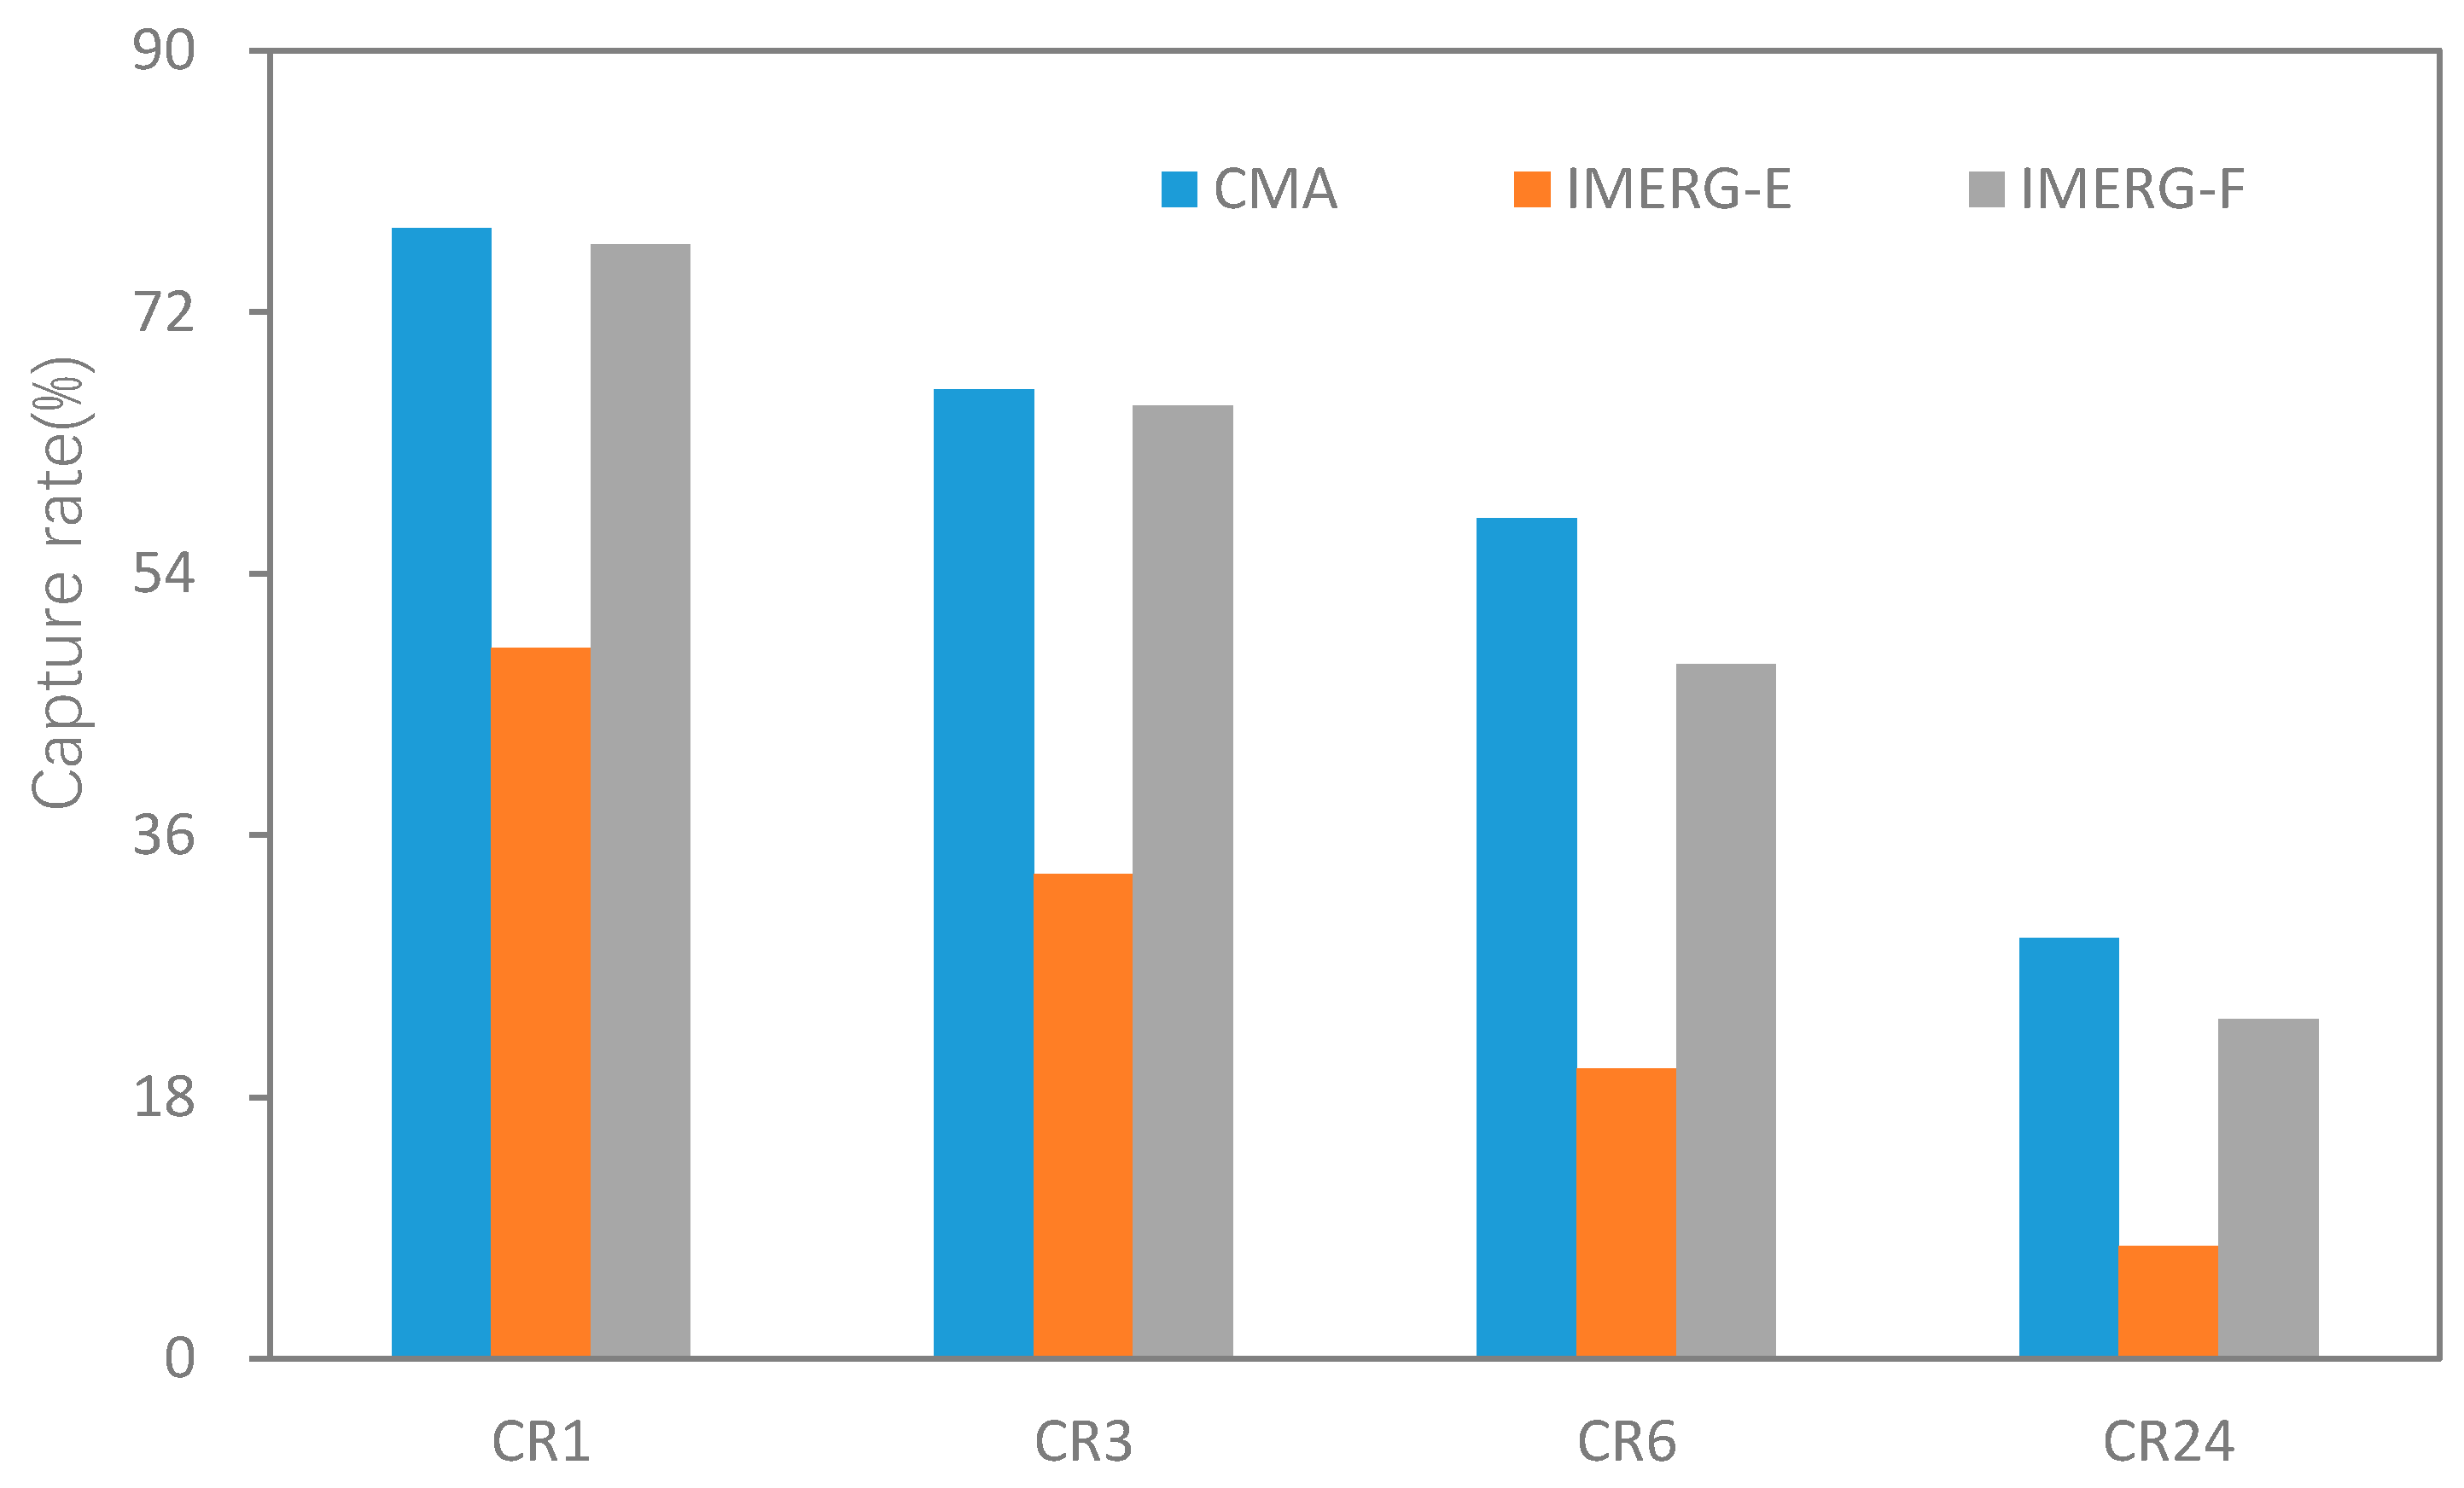
Obviously, for the same product, the captured flash flood events has decreased over time, where the hit rate of both CR6 and CR24 is less than 60%. Among them, the flash floods events captured by these three rainfall products are concentrated in western Yunnan, while there are fewer flash flood events in the relatively flat southwest and central Yunnan. In general, if a flash flood event cannot be captured in a short period, it will not be anyhow captured. Moreover, the effect of IMERG-E products on capturing disasters is significantly lower than that of IMERG-F, and the capture rate in each period is less than 50%. However, the capture accuracy of IMERG-F at CR1 and CR3 is almost comparable to the CMA—only a 1% difference—and the capture rate of CR1 is nearly 80%, with an extremely high accuracy. Nonetheless, with the time marching, the capture effect decreased significantly. Meanwhile, if the flash flood events cannot be captured by IMERG-F and CMA, the same phenomenon occurs in IMERG-F; but, as time goes on, there is an out-of-sync phenomenon in the catching flash flood events by IMERG-F and CMA. Besides, the CMA data is a fusion of measured data and CMORPH, leading to possible delays in data acquisition. Therefore, the hit rate is decreasing with an increasing temporal resolution or increasing the averaging time of the satellite images.
4. Conclusions
This study first quantitatively evaluated the IMERG-E and IMERG-F satellite precipitation products, and then combined the improved RTI method to analyze its application effects in flash flood warnings, which has three major contributions:
- (i)
- Flash flood warning aspects are integrated, for the first time, with satellite precipitation to account for the applicability of satellite data in flash flood warnings. The result shows that the early warning effect of IMERG-F products is better at the 1 h and 3 h scale than that at the daily scale;
- (ii)
- the study area has not been documented in previous studies. Yunnan Province is characterized by a low latitude but high altitude where satellite precipitation exhibited some new characteristics, including that precipitation in Yunnan Province has increased from northeast to southwest, where the largest precipitation occurred in the flood-prone area in the southwest part;
- (iii)
- this study reveals some interesting phenomena that were not reported in related research [32]. For example, the systematic error of IMERG-E is mainly distributed in areas with high altitudes and low precipitation, and the random error is mainly distributed in areas with low altitudes and high precipitation. The most important thing is that as for the same satellite rainfall product, the flash flood disaster events that can be captured decreases with time. For different satellite rainfall products, the flash flood events captured by the IMERG-E products are significantly lower than IMERG-F. Meanwhile, the capture rate of each period is less than 50%.
To sum up, the above research results will contribute to the application of satellite remote sensing data in flash flood warnings.
Author Contributions
Conceptualization, M.M. and P.J.; methodology, M.M., P.J. and G.T.; software, G.T.; validation, P.J., G.T., and Z.M.; formal analysis, M.M.; investigation, D.W.; resources, M.M. and G.T.; data curation, P.J.; writing—original draft preparation, M.M., P.J. and Z.M.; writing—review and editing, M.M., P.J., H.W. and H.Y.; visualization, G.T. and P.J.; supervision, H.W.; project administration, H.W.; funding acquisition, H.W. All authors have read and agreed to the published version of the manuscript.
Funding
This work was supported by the National Key R&D Program of China (2018YFC1508105) and National Natural Science Foundation of China (NSFC. General Projects: (Grant No. 41471430), the Young Scientists Fund of the National Natural Science Foundation of China ((No. 51909052), Natural Science Foundation of Tianjin (18JCQNJC08800), Research on Key Technologies of Flash Flood Prevention Based on Multi-machine Learning Model (2019KJ086), the National Natural Science Foundation of China (Grant No. 41901343), the Key R&D Program of Ministry of Science and Technology (Grant No. 2018YFC1506500), the State Key Laboratory of Resources and Environmental Information System, the China Postdoctoral Science Foundation (No. 2018M630037, and 2019T120021), the Open Fund of the State Key Laboratory of Remote Sensing Science (Grant No. OFSLRSS201909), and Research on Flash Flood Warning Based on Machine Learning: A Case Study of Yunnan Province (52XB1903).
Acknowledgments
The authors wish to thank the anonymous reviewers for their comments and suggestions.
Conflicts of Interest
The authors declare no potential conflict of interests.
Abbreviations
| Acronyms | Full Name |
|---|---|
| NASA | National Aeronautics and Space Administration |
| NWS | National Weather Service |
| DEM | Digital Elevation Model |
| GEO | Geostationary Earth Orbit |
| PMW | Passive Microwave |
| CMORPH | Climate Prediction Center morphing |
| IMERG | Integrated Multi-Satellite Retrievals for Global Precipitation Measurement |
| TRMM | Tropical Rainfall Measuring Mission |
| IMERG-E | IMERG Early run product |
| IMERG-F | IMERG Final run product |
| PRT | Post-real-time |
| NRT | Near-real-time |
| GPM | Global Precipitation Measurement |
| TMPA | TRMM Multi-Satellite Precipitation Analysis |
| FFG | Flash Flood Guidance |
| RTI | Rainfall Triggering Index |
| SWI | Soil Water Index |
| CC | Correlation Coefficient |
| RMSE | Root Mean Square Error |
| BIAS | Relative Bias |
| POD | Probability of Detection |
| FAR | False Alarm Ratio |
| CSI | Critical Success Index |
| CMA | Regional hourly precipitation integration products of the China Meteorological Administration |
References
- Hong, Y.; Adhikari, P.; Gourley, J. Flash Flood. Encycl. Earth Sci. 2013, 18, 324–325. [Google Scholar]
- Gourley, J.J.; Flamig, Z.L.; Vergara, H.; Kirstetter, P.E.; Clark, R.A., III; Argyle, E.; Hong, Y. The flooded locations and simulated hydrographs (flash) project: Improving the tools for flash flood monitoring and prediction across the united states. Bulletin of the American Meteorological Society. Bull. Am. Meteorol. Soc. 2017, 98, 361–372. [Google Scholar] [CrossRef]
- Guo, L.; He, B.; Ma, M.; Chang, Q.; Li, Q.; Zhang, K.; Hong, Y. A comprehensive flash flood defense system in China: Overview, achievements, and outlook. Nat. Hazards 2018, 92, 727–740. [Google Scholar] [CrossRef]
- Gourley, J.J.; Arthur, A. Rainfall Rate, Use in the Hydrological Sciences; Encyclopedia of GIS: Norman, OK, USA, 2017. [Google Scholar]
- Borga, M.; Boscolo, P.; Zanon, F.; Sangati, M. Hydrometeorological Analysis of the 29 August 2003 Flash Flood in the Eastern Italian Alps. J. Hydrometeorol. 2007, 8, 1049–1067. [Google Scholar] [CrossRef]
- Belabid, N.; Zhao, F.; Brocca, L.; Huang, Y.; Tan, Y. Near-Real-Time Flood Forecasting Based on Satellite Precipitation Products. Remote Sens. 2019, 11, 252. [Google Scholar] [CrossRef] [Green Version]
- Aminyavari, S.; Saghafian, B.; Sharifi, E. Assessment of Precipitation Estimation from the NWP Models and Satellite Products for the Spring 2019 Severe Floods in Iran. Remote Sens. 2019, 11, 2741. [Google Scholar] [CrossRef] [Green Version]
- Tang, G.; Wen, Y.; Gao, J.; Long, D.; Ma, Y.; Wan, W.; Hong, Y. Similarities and differences between three coexisting spaceborne radars in global rainfall and snowfall estimation. Water Resour. Res. 2017, 53, 3835–3853. [Google Scholar] [CrossRef]
- Yuan, F.; Wang, B.; Shi, C.; Cui, W.; Zhao, C.; Liu, Y.; Ren, L.; Zhang, L.; Zhu, Y.; Chen, T.; et al. Evaluation of hydrological utility of IMERG Final run V05 and TMPA 3B42V7 satellite precipitation products in the Yellow River source region, China. J. Hydrol. 2018, 567, 696–711. [Google Scholar] [CrossRef]
- Huffman, G.J.; Bolvin, D.T.; Nelkin, E.J.; Wolff, D.B.; Adler, R.F.; Gu, G.; Hong, Y.; Bowman, K.P.; Stocker, E.F. The TRMM Multi-satellite Precipitation Analysis (TMPA). In Satellite Rainfall Applications for Surface Hydrology; Springer: Dordrecht, The Netherlands, 2010. [Google Scholar]
- Tang, G.; Zeng, Z.; Ma, M.; Liu, R.; Wen, Y.; Hong, Y. Can Near-Real-Time Satellite Precipitation Products Capture Rainstorms and Guide Flood Warning for the 2016 Summer in South China? IEEE Geosci. Remote Sens. Lett. 2017, 14, 1208–1212. [Google Scholar] [CrossRef]
- Tyralis, H.; Dimitriadis, P.; Koutsoyiannis, D.; O’Connell, P.E.; Tzouka, K.; Iliopoulou, T. On the long-range dependence properties of annual precipitation using a global network of instrumental measurements. Adv. Water Resour. 2018, 111, 301–318. [Google Scholar] [CrossRef]
- Jan, C.D.; Li, M.H. A Debris-Flow Rainfall-Based Warning Model. J. Chin. Soil Water Conserv. 2004, 35, 275–285. (In Chinese) [Google Scholar]
- Clark, R.A.; Gourley, J.J.; Flamig, Z.L.; Hong, Y.; Clark, E. CONUS-Wide Evaluation of National Weather Service Flash Flood Guidance Products. Weather Forecast. 2014, 29, 377–392. [Google Scholar] [CrossRef] [Green Version]
- Zhao, G.; Pang, B.; Xu, Z.; Yue, J.; Tu, T. Mapping flood susceptibility in mountainous areas on a national scale in china. Sci. Total Environ. 2018, 615, 1133–1142. [Google Scholar] [CrossRef]
- Chen, Y.; Wei, Z.; Chia, H. A Rainfall-based Warning Model for Predicting Landslides Using QPESUMS Rainfall Data. J. Chin. Soil Water Conserv. 2017, 48, 44–55. [Google Scholar]
- Zubieta, R.; Getirana, A.; Espinoza, J.C.; Lavado-Casimiro, W.; Aragon, L. Hydrological modeling of the Peruvian–Ecuadorian Amazon Basin using GPM-IMERG satellite-based precipitation dataset. Hydrol. Earth Syst. Ences Discuss. 2017, 21, 3543–3555. [Google Scholar] [CrossRef] [Green Version]
- Zhang, K.; Xue, X.; Hong, Y.; Gourley, J.J.; Lu, N.; Wan, Z.; Wooten, R. iCRESTRIGRS: A coupled modeling system for cascading flood-landslide disaster forecasting. Hydrol. Earth Syst. Sci. 2016, 20, 1–23. [Google Scholar] [CrossRef] [Green Version]
- Tian, Y.; Peters-Lidard, C.D.; Eylander, J.B.; Joyce, R.J.; Huffman, G.J.; Adler, R.F.; Zeng, J. Component analysis of errors in satellite-based precipitation estimates. J. Geophys. Res. Atmos. 2009, 114. [Google Scholar] [CrossRef] [Green Version]
- Zeng, Z.; Tang, G.; Long, D.; Zeng, C.; Ma, M.; Hong, Y.; Xu, J. A cascading flash flood guidance system: Development and application in Yunnan Province, China. Nat. Hazards 2016, 84, 2071–2093. [Google Scholar] [CrossRef]
- Ma, M.; Zhang, J.; Su, H.; Wang, D.; Wang, Z. Update of early warning indicators of flash floods: A case study of hunjiang district, northeastern china. Water 2019, 11, 314. [Google Scholar] [CrossRef] [Green Version]
- Hou, A.Y.; Kakar, R.K.; Neeck, S.; Azarbarzin, A.A.; Kummerow, C.D.; Kojima, M.; Iguchi, T. The Global Precipitation Measurement Mission. Bull. Am. Meteorol. Soc. 2014, 95, 701–722. [Google Scholar] [CrossRef]
- Mohammad, S.; Hosseini, M.; Tang, Q. Validation of GPM IMERG V05 and V06 Precipitation Products over Iran. J. Hydrometeorol. 2020, 5, 1011–1037. [Google Scholar] [CrossRef] [Green Version]
- Sungmin, O.; Foelsche, U.; Kirchengast, G.; Fuchsberger, J.; Tan, J.; Petersen, W.A. Evaluation of GPM IMERG Early, Late, and Final rainfall estimates using WegenerNet gauge data in southeastern Austria. Hydrol. Earth Syst. Sci. 2017, 21, 6559–6572. [Google Scholar]
- Shen, Y.; Zhao, P.; Pan, Y.; Yu, J. A high spatiotemporal gauge-satellite merged precipitation analysis over China. J. Geophys. Res. Atmos. 2014, 119, 3063–3075. [Google Scholar] [CrossRef]
- Cui, P.; Yang, K.; Cui, P. Relationship Between Occurrence of Debris Flow and Antecedent Precipitation: Taking the Jiangjia Gully as an Example. Sci. Soil Water Conserv. 2003, 1, 11–15. [Google Scholar]
- Ma, M.; He, B.; Wan, J.; Jia, P.; Guo, X.; Gao, L.; Maguire, L.; Hong, Y. Characterizing the Flash Flooding Risks from 2011 to 2016 over China. Water 2018, 10, 704. [Google Scholar] [CrossRef] [Green Version]
- Maggioni, V.; Sapiano MAdler, R.F. Estimating Uncertainties in High-Resolution Satellite Precipitation Products: Systematic or Random Error? J. Hydrometeorol. 2016, 17, 1119–1129. [Google Scholar] [CrossRef]
- Ayugi, B.; Tan, G.; Ullah, W.; Boiyo, R.; Ongoma, V. Inter-comparison of remotely sensed precipitation datasets over Kenya during 1998-2016. Atmos. Res. 2019, 225, 96–109. [Google Scholar] [CrossRef]
- Palomino-Angel, S.; Anaya-Acevedo, J.A.; Botero, B.A. Evaluation of 3B42V7 and IMERG daily-precipitation products for a very high-precipitation region in northwestern South America. Atmos. Res. 2018, 217, 37–48. [Google Scholar] [CrossRef]
- Ma, M.; Liu, C.; Zhao, G.; Xie, H.; Jia, P.; Wang, D.; Hong, Y. Flash Flood Risk Analysis Based on Machine Learning Techniques in the Yunnan Province, China. Remote Sens. 2019, 11, 170. [Google Scholar] [CrossRef] [Green Version]
- Rivera, J.A.; Marianetti, G.; Hinrichs, S. Validation of chirp’s precipitation dataset along the central Andes of Argentina. Atmos. Res. 2018, 213, 437–449. [Google Scholar] [CrossRef]
Figure 1.
Topographical map and locations of flash flood disasters in Yunnan Province (2011–2018).
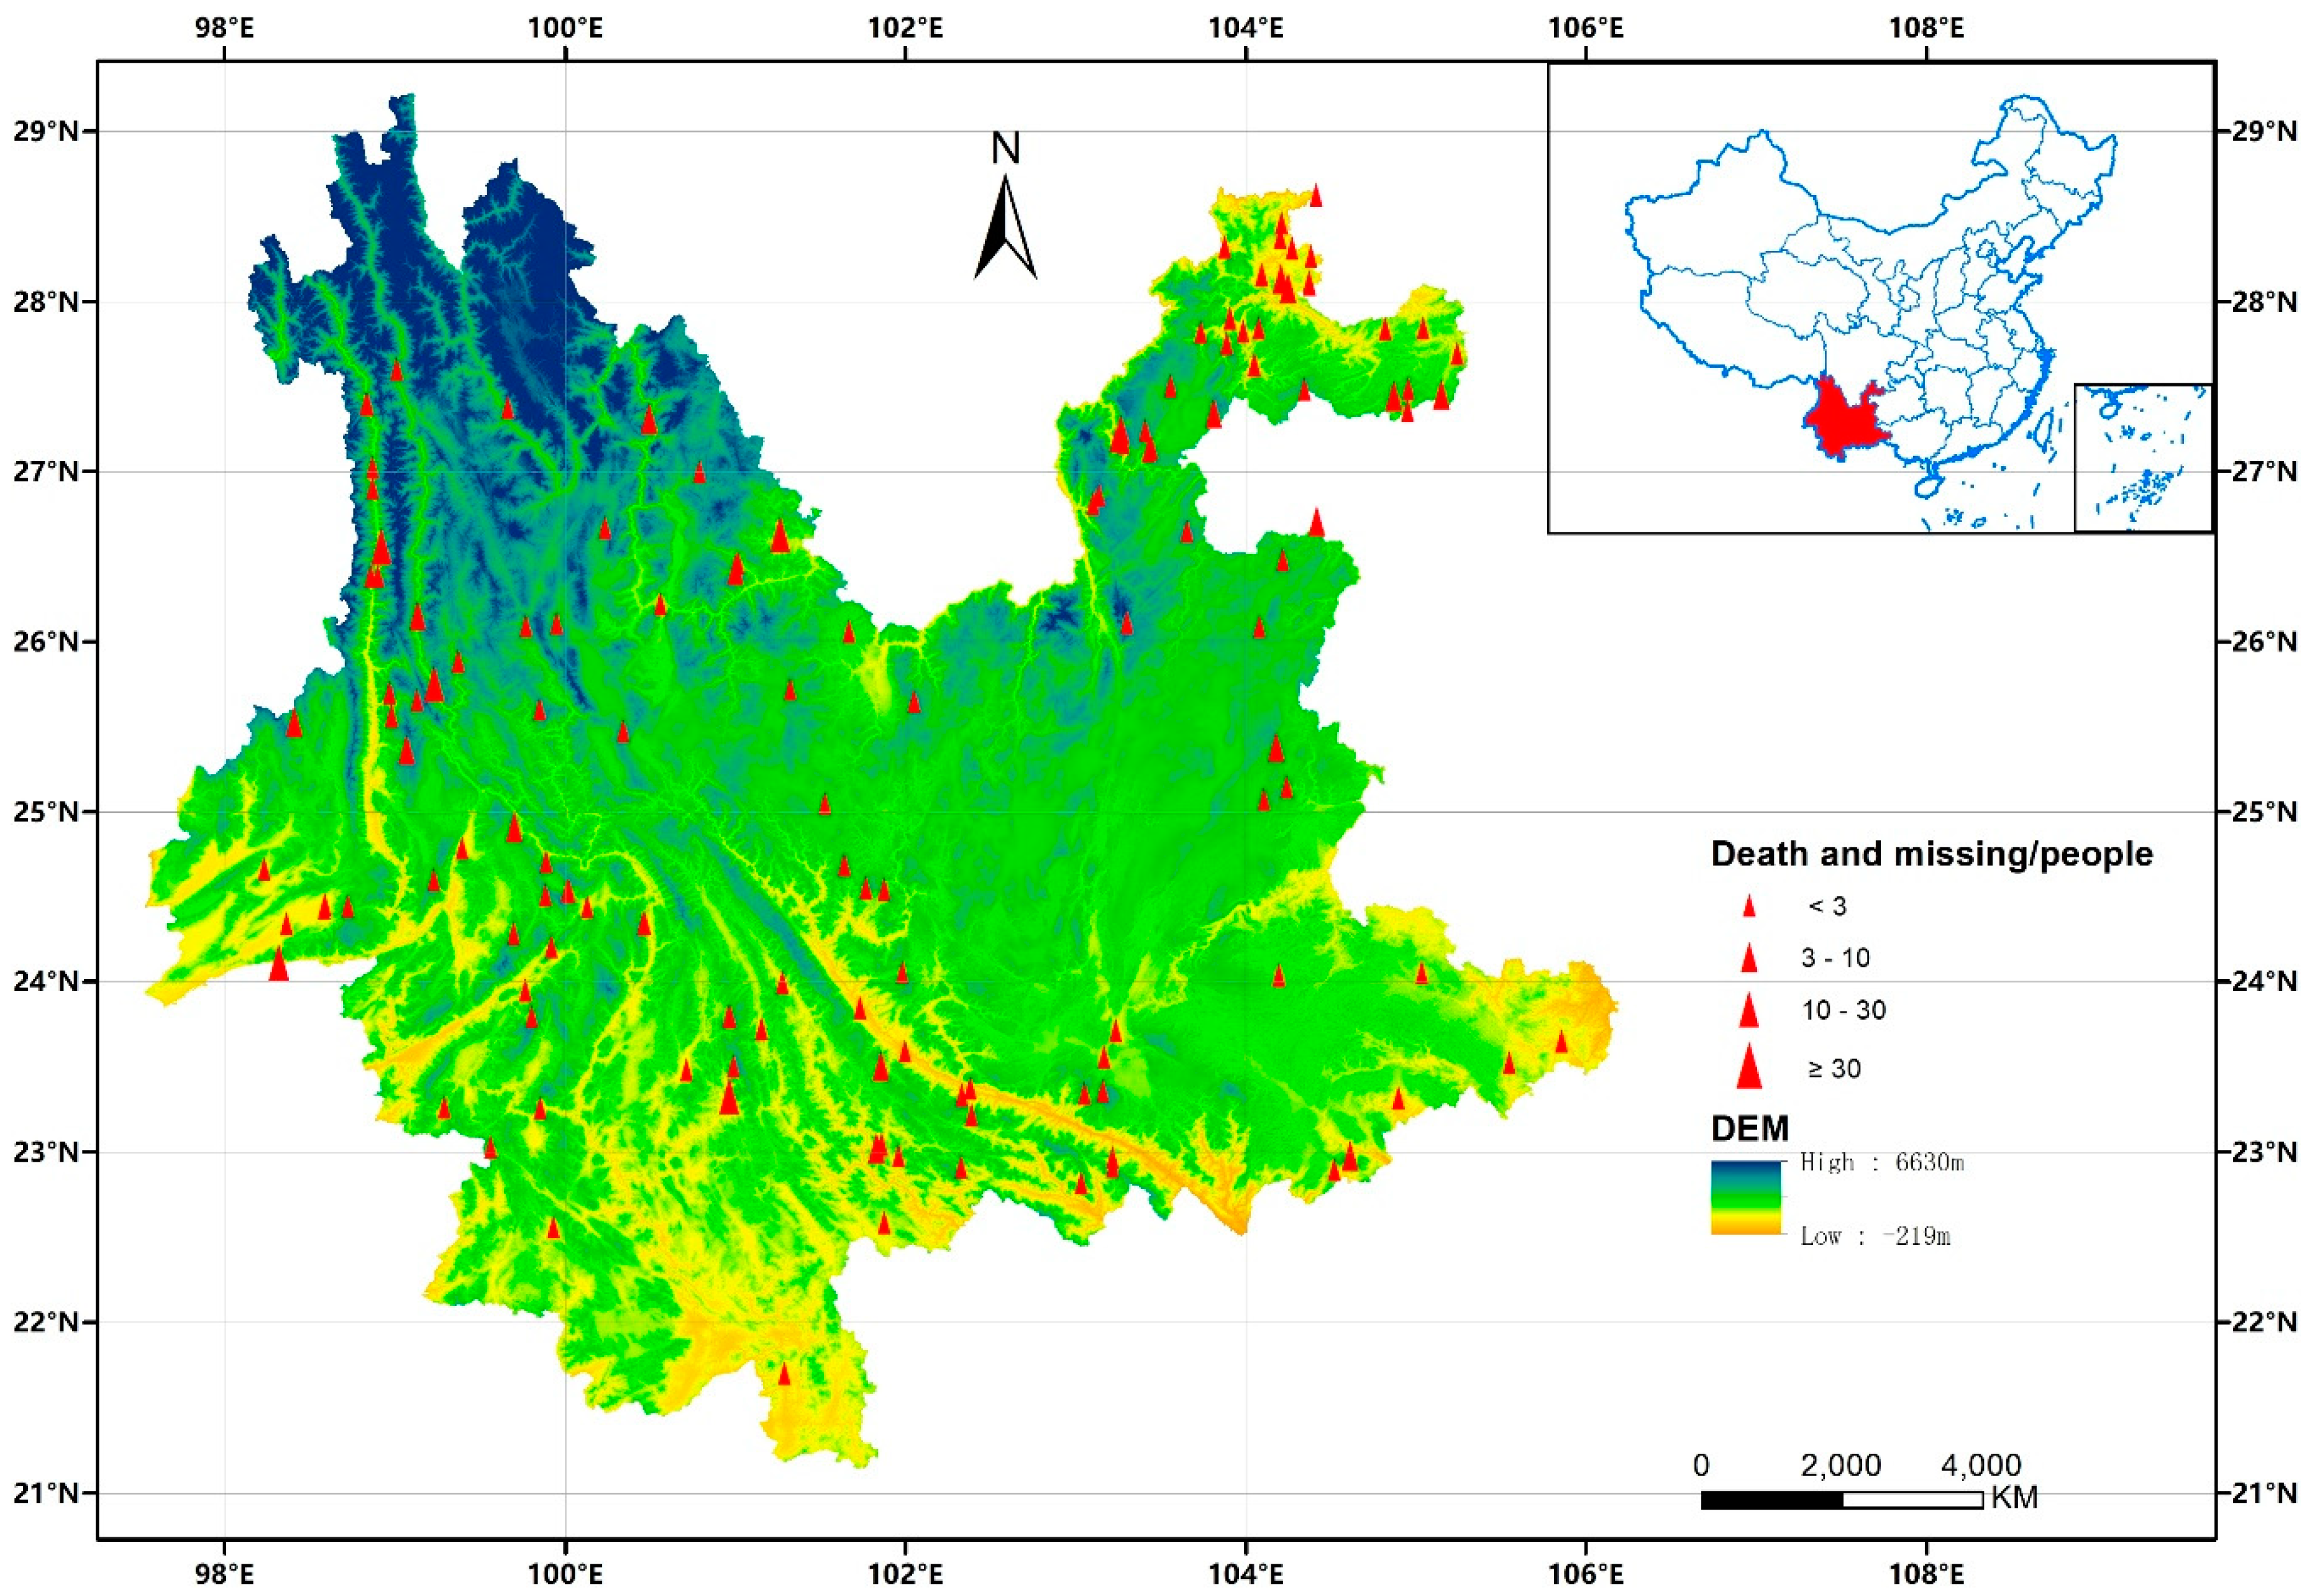
Figure 2.
Spatial distributions as per the CMA (a), IMERG-E (b), and IMERG-F (c).
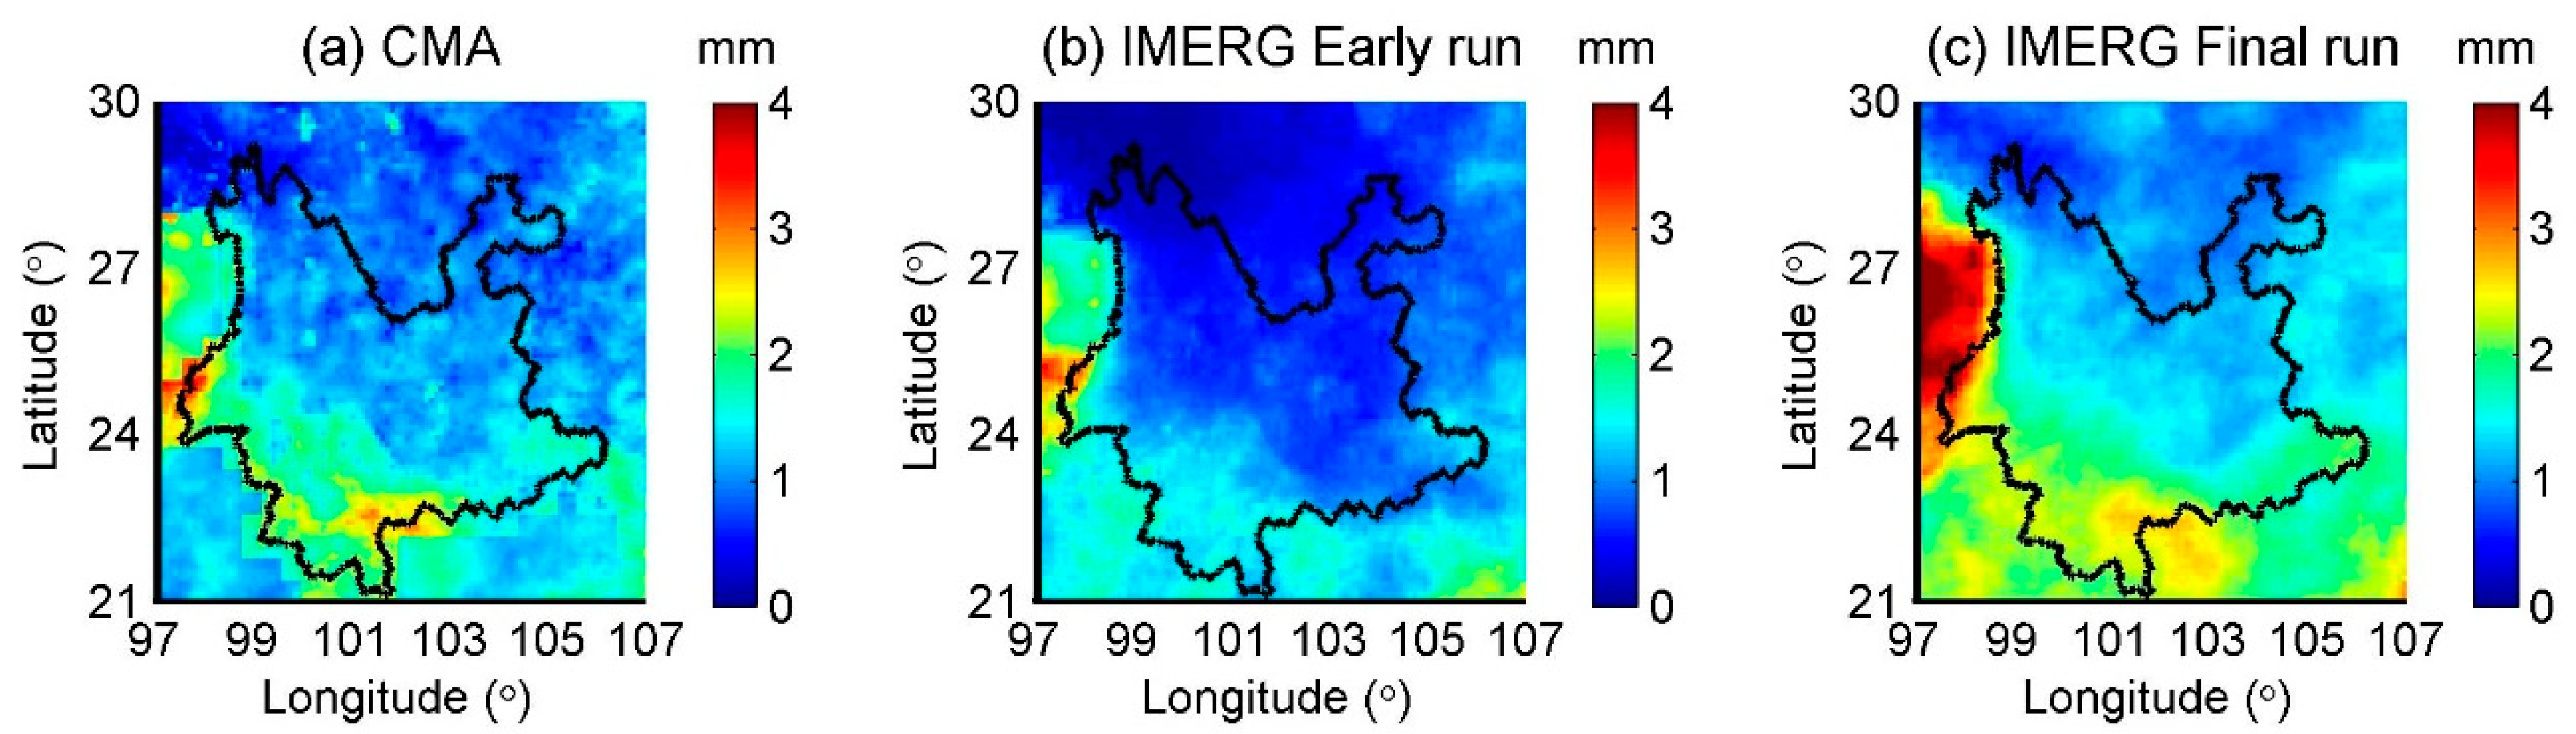
Figure 3.
The spatial patterns of six metrics (CC (a), RMSE (b), BIAS (c), POD (d), FAR (e), and CSI (f)) generated from IMERG-E and CMA using hourly data in Yunnan Province.
Figure 3.
The spatial patterns of six metrics (CC (a), RMSE (b), BIAS (c), POD (d), FAR (e), and CSI (f)) generated from IMERG-E and CMA using hourly data in Yunnan Province.
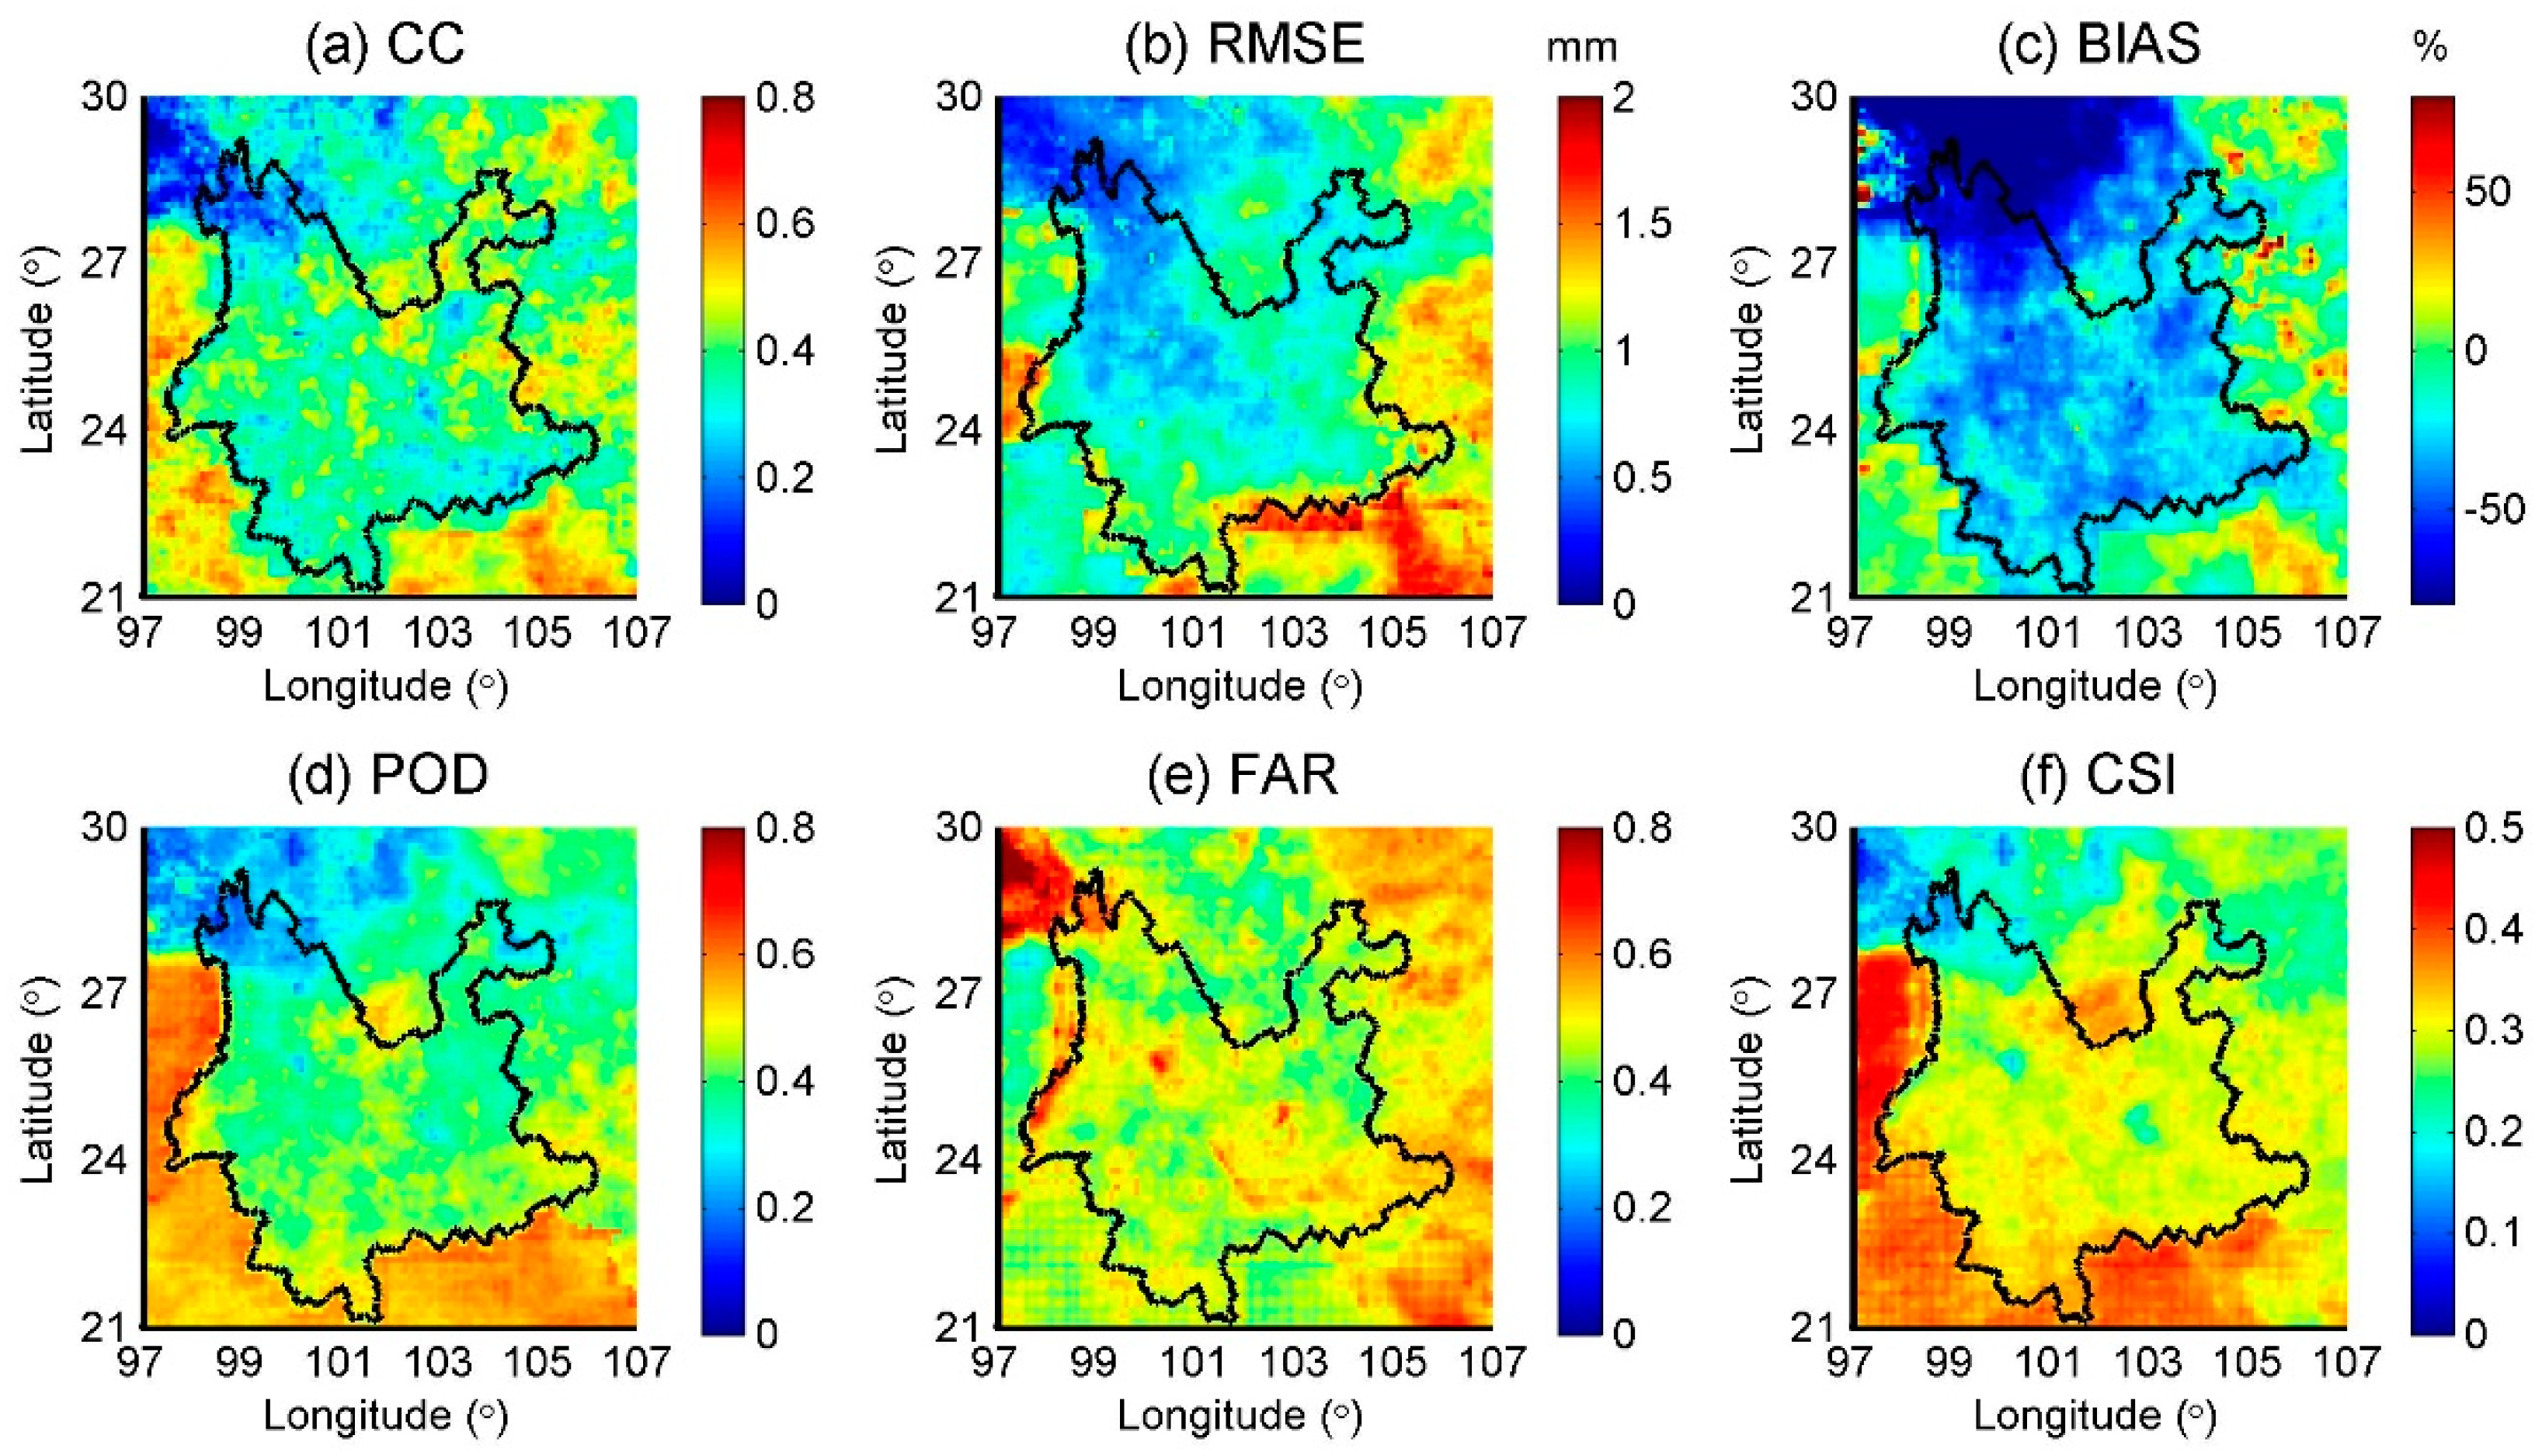
Figure 4.
The spatial pattern of six indicators generated from hourly data of IMERG-F and CMA in Yunnan, where the indicators indicated by (a), (b), (c), (d), (e), and (f) are CC, RMSE, BIAS, POD, FAR, CSI.
Figure 4.
The spatial pattern of six indicators generated from hourly data of IMERG-F and CMA in Yunnan, where the indicators indicated by (a), (b), (c), (d), (e), and (f) are CC, RMSE, BIAS, POD, FAR, CSI.
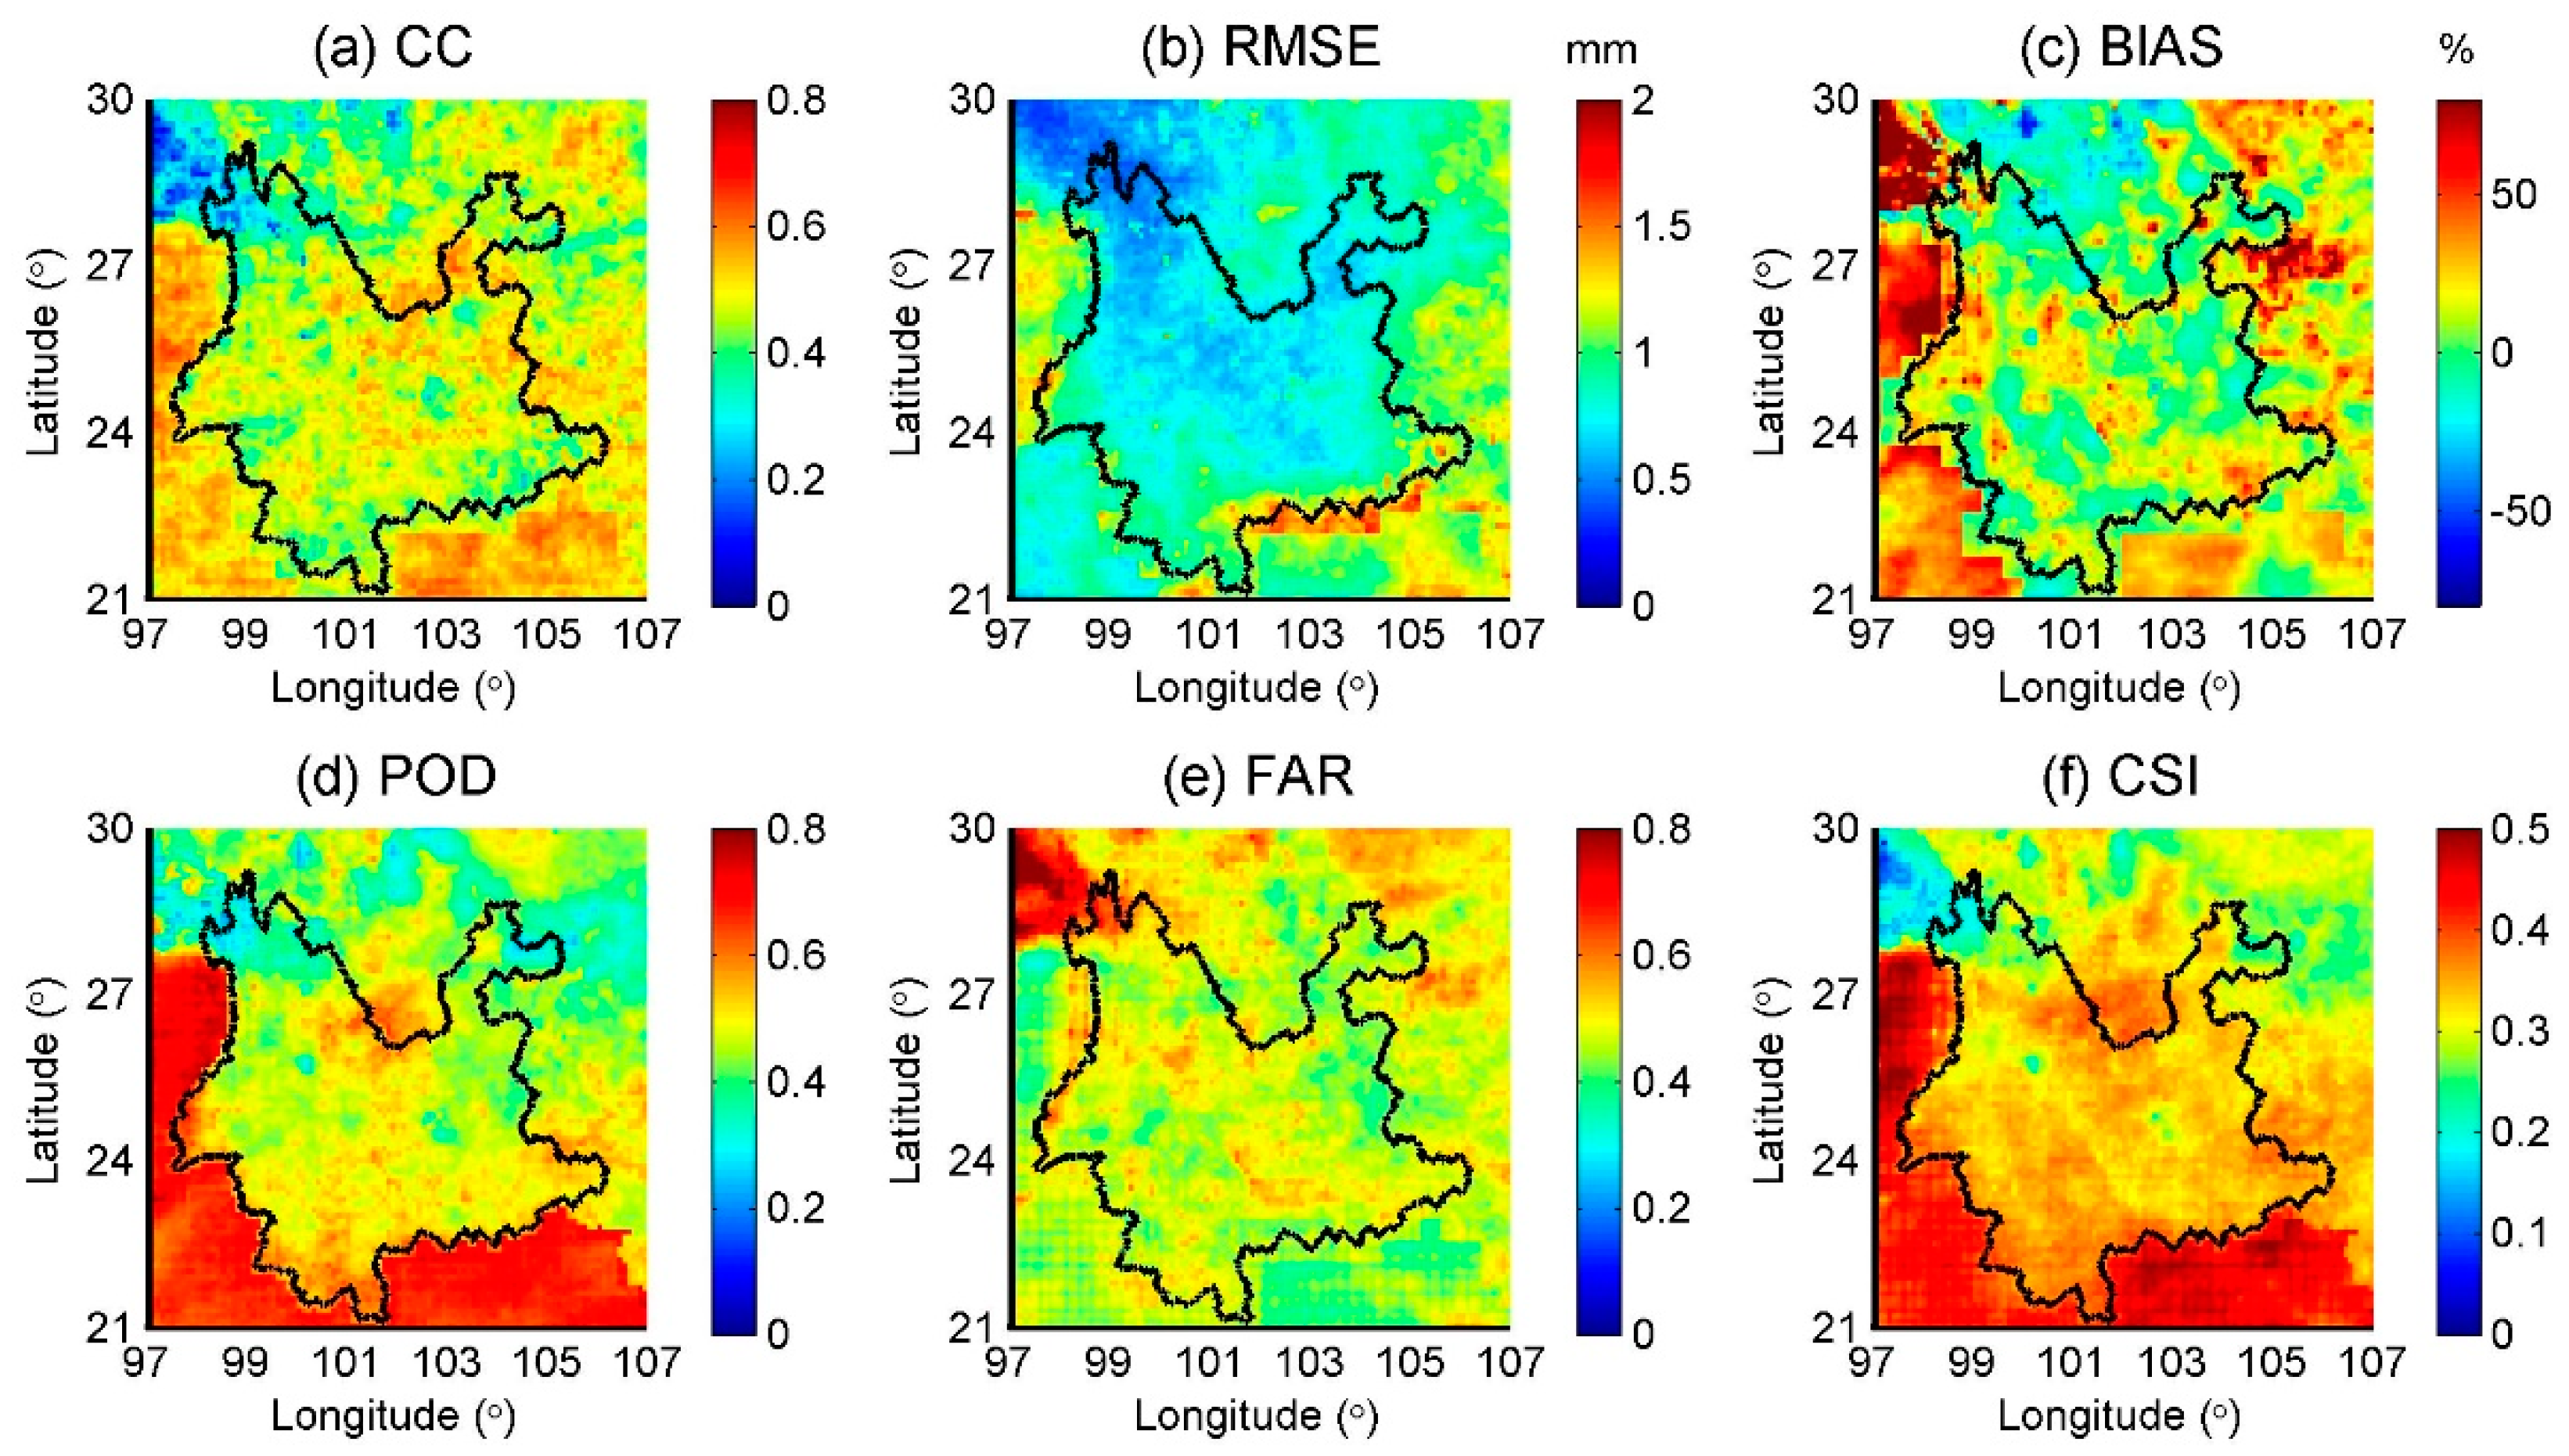
Figure 5.
The spatial patterns of the system and random errors for IMERG-E at the 1 h and 24 h temporal scales in Yunnan Province, respectively, where (a) and (b) are the systematic errors of 1 h and 24 h, respectively; (c) and (d) are random error of 1 h and 24 h.
Figure 5.
The spatial patterns of the system and random errors for IMERG-E at the 1 h and 24 h temporal scales in Yunnan Province, respectively, where (a) and (b) are the systematic errors of 1 h and 24 h, respectively; (c) and (d) are random error of 1 h and 24 h.
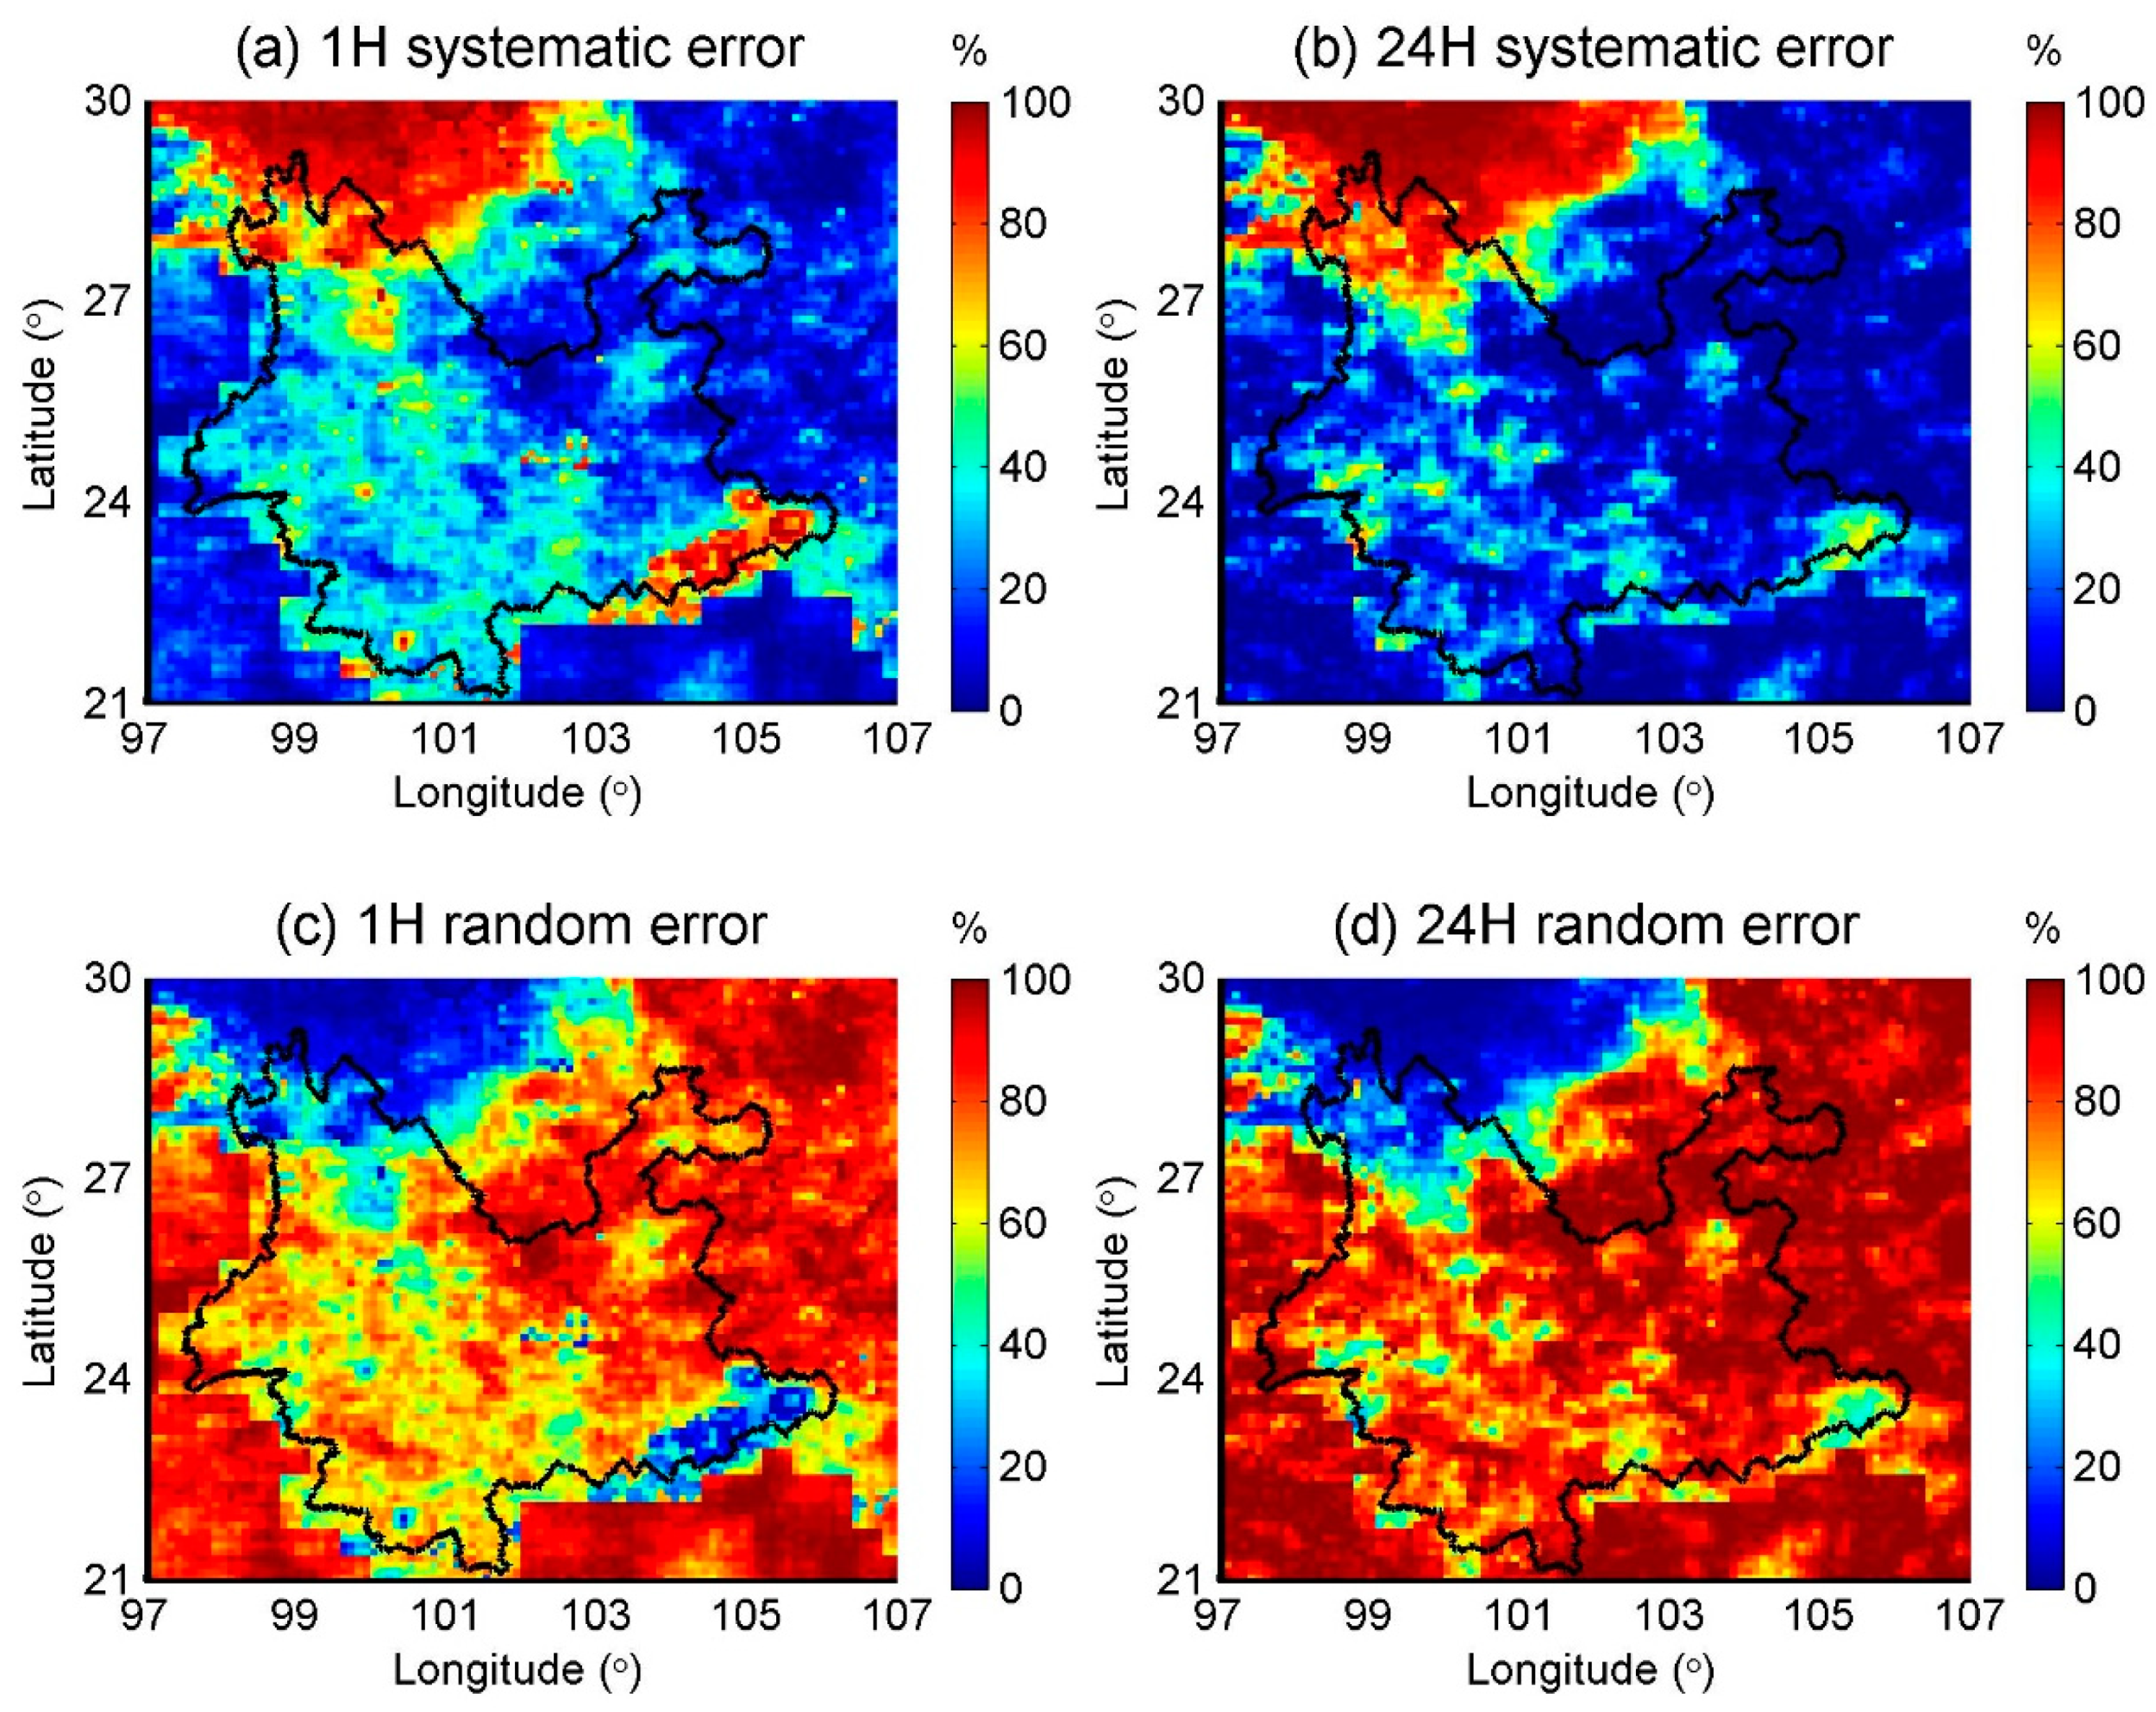
Figure 6.
The spatial patterns of the system and random errors in IMERG-F at the 1 and 24 h temporal scales, respectively; where (a) and (b) are the systematic errors of 1 h and 24 h, respectively; (c) and (d) are random error of 1 h and 24 h.
Figure 6.
The spatial patterns of the system and random errors in IMERG-F at the 1 and 24 h temporal scales, respectively; where (a) and (b) are the systematic errors of 1 h and 24 h, respectively; (c) and (d) are random error of 1 h and 24 h.
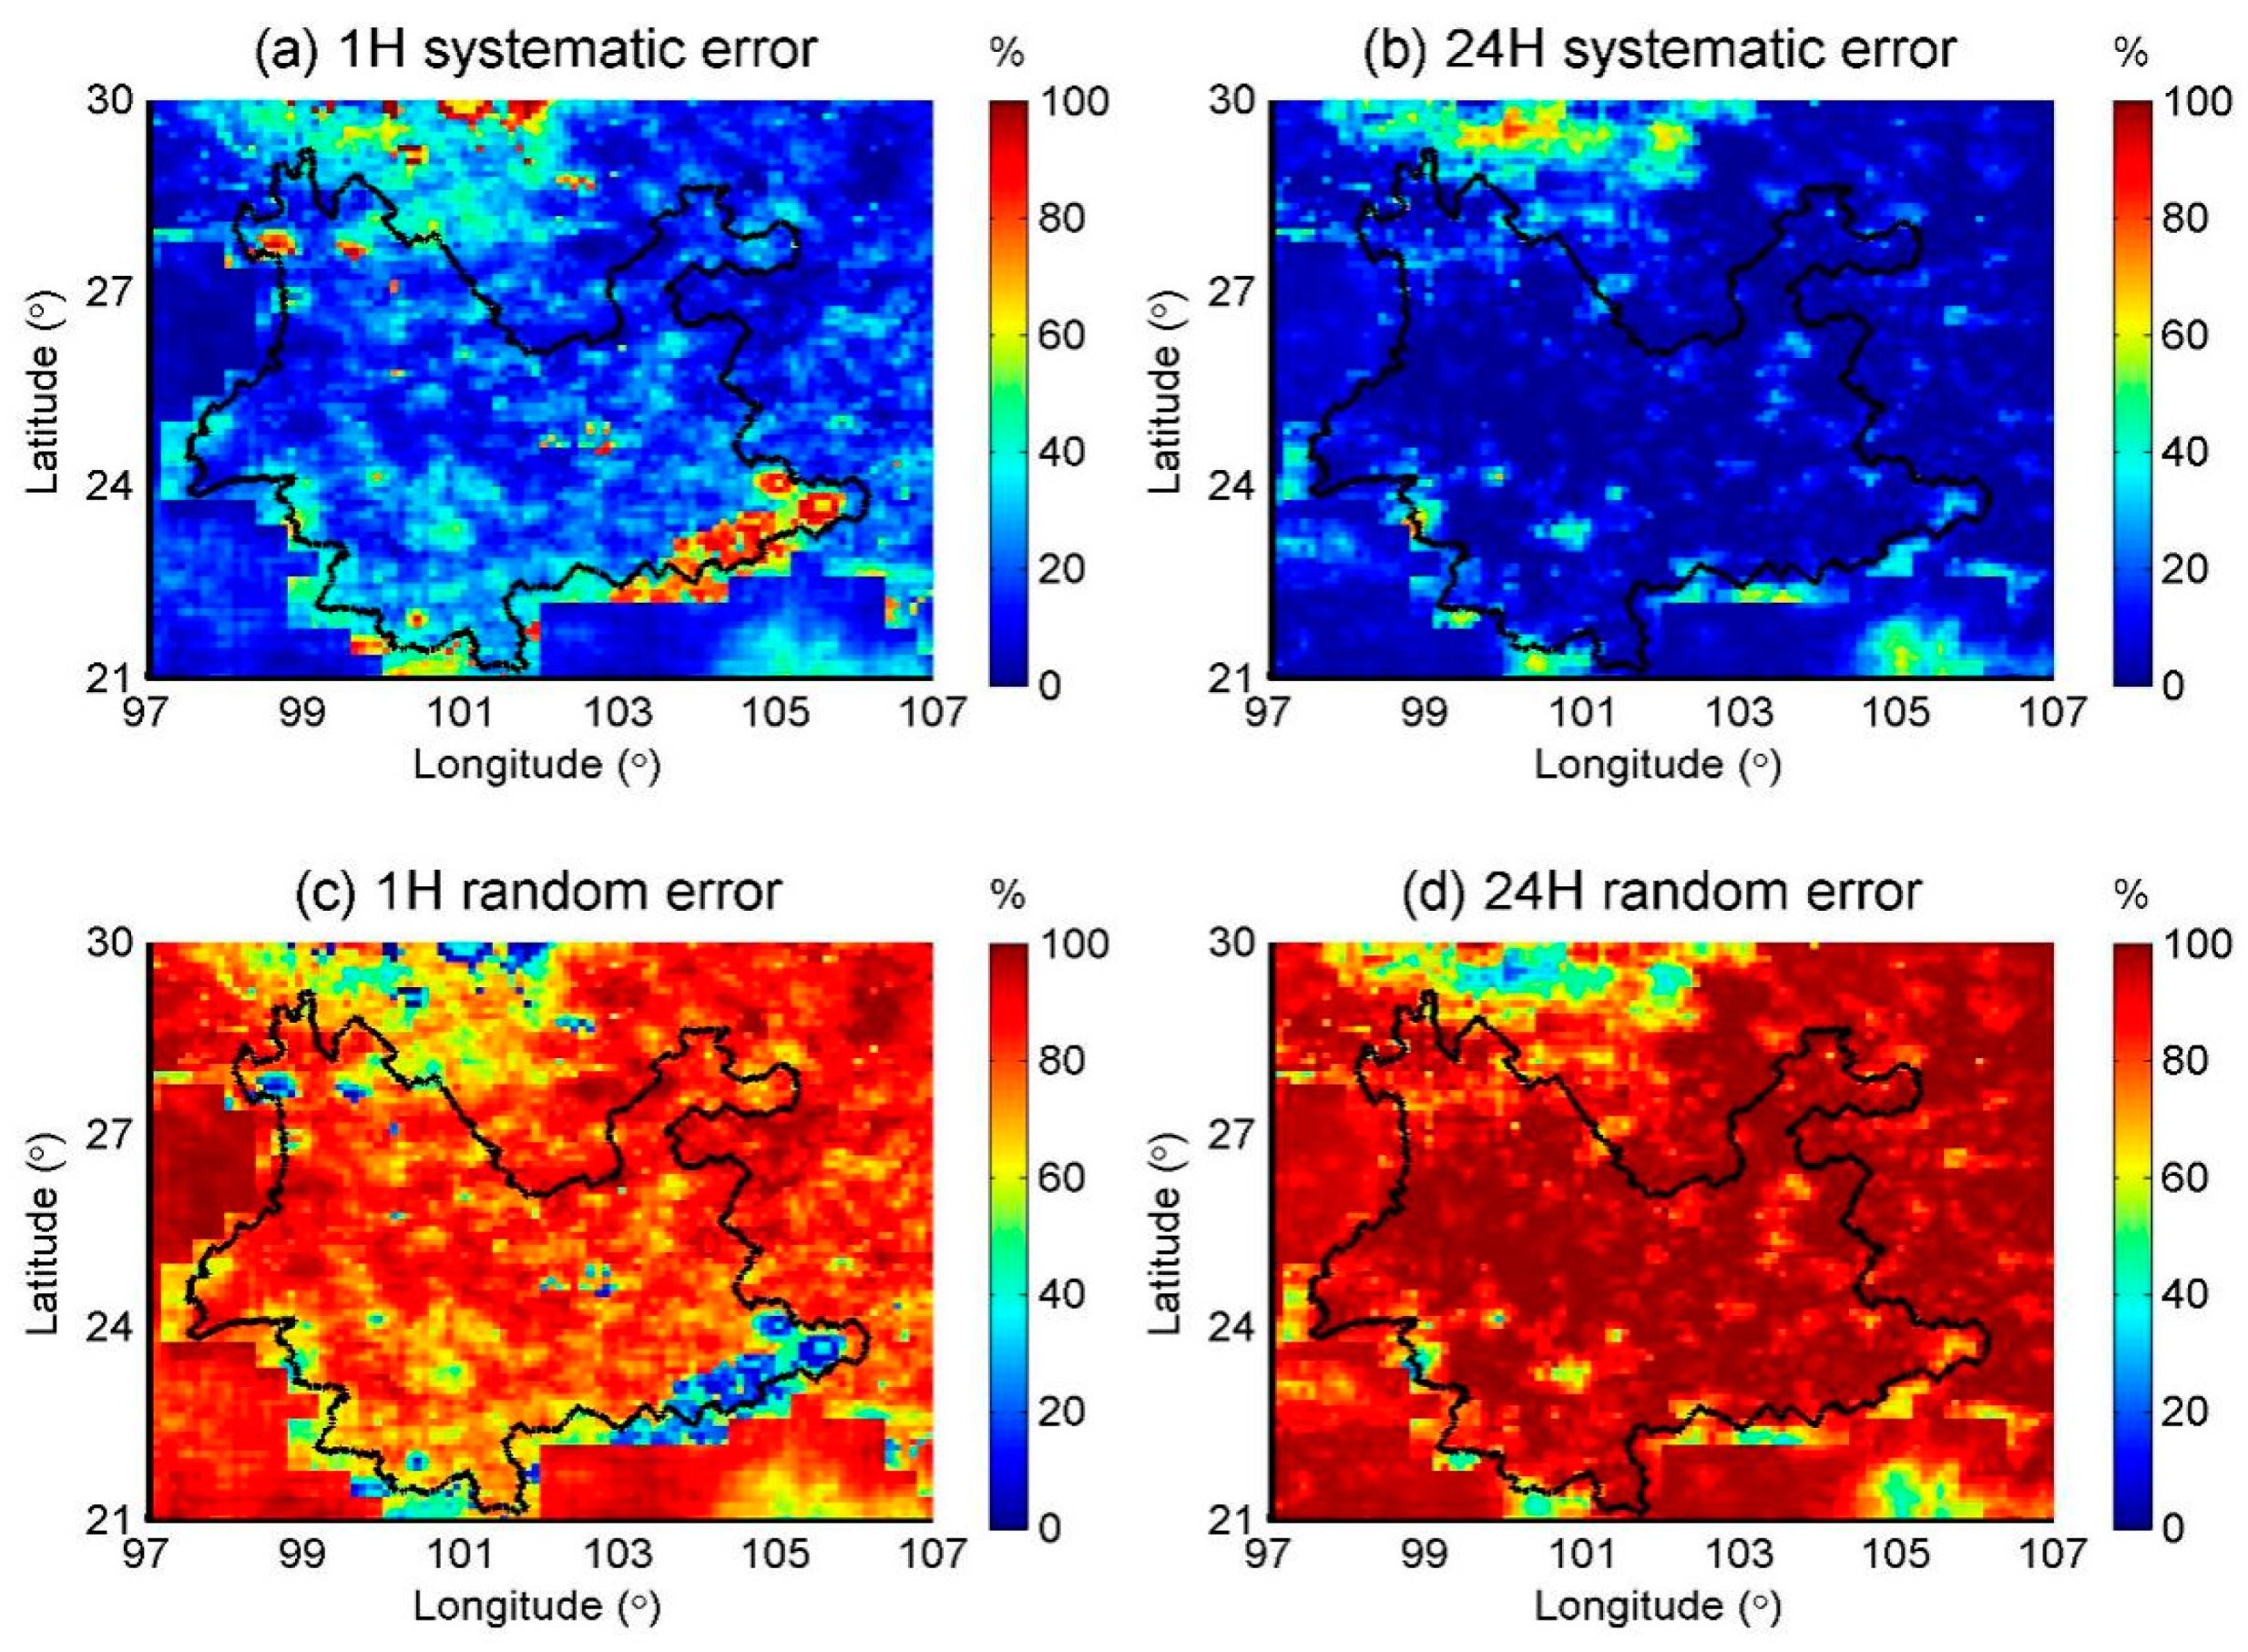
Figure 7.
The performance of the flash floods captured by the three products (IMERG-F, EMERGE, and CMA) for different times (1 h, 3 h, 6 h, and 24 h). Note: Red indicates that the warning issued has captured the flash flood event; blue indicates that the issued warning has not captured the flash flood event, where (a), (b), (c), and (d) are the distribution of IMERG-E products in 1 h, 3 h, 6 h and 24 h to capture flash flood disasters; (e), (f), (g), and (h) are the distribution of IMERG-F products in 1 h, 3 h, 6 h and 24 h to capture flash flood disasters; (i), (j), (k), and (l) are the distribution of CMA products in 1 h, 3 h, 6 h and 24 h to capture flash flood disasters.
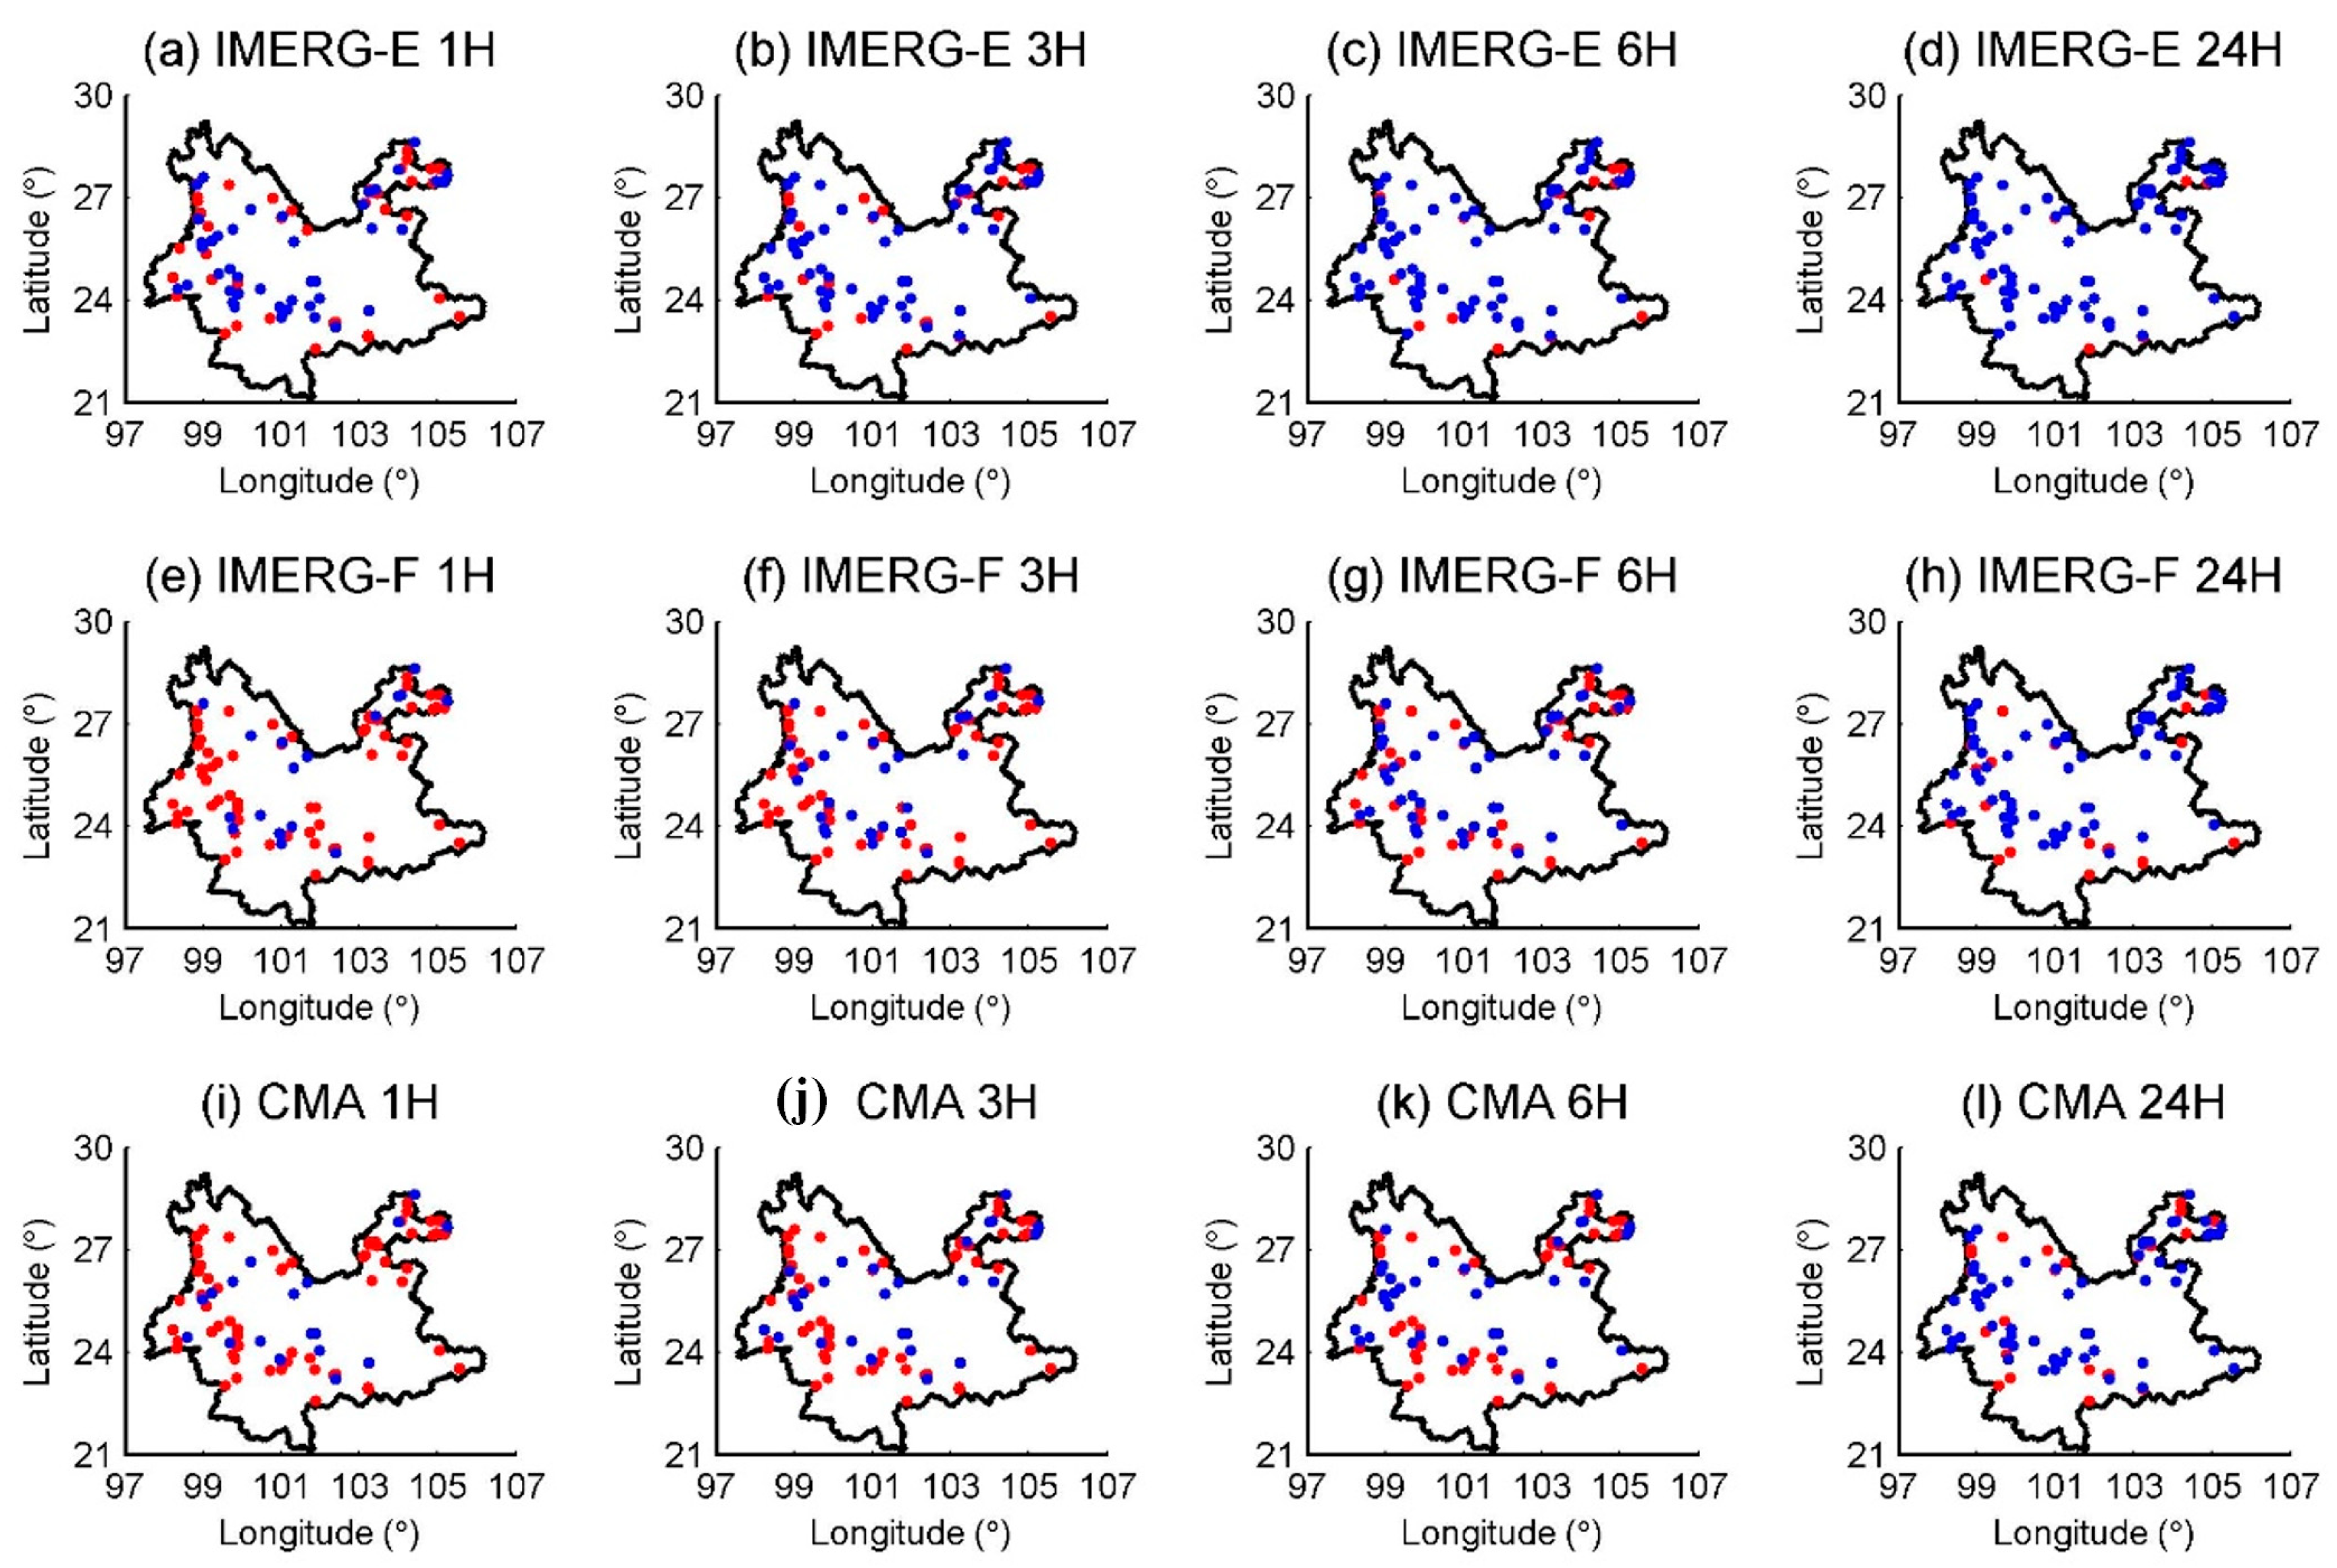
Figure 8.
Percentage of flash floods caught by CMA, IMERG-E, and IMERG-F. Note: CRt represents the critical rainfall at time t.
Figure 8.
Percentage of flash floods caught by CMA, IMERG-E, and IMERG-F. Note: CRt represents the critical rainfall at time t.

Table 1.
List of Integrated Multi-Satellite Retrievals for Global Precipitation Measurement (IMERG) products.
Table 1.
List of Integrated Multi-Satellite Retrievals for Global Precipitation Measurement (IMERG) products.
| IMERG-E | IMERG-L | IMERG-F | |
|---|---|---|---|
| Spatiotemporal resolution | 0.1°, 0.5 h | 0.1°, 0.5 h | 0.1°, 0.5 h |
| Lag time | 6 h | 18 h | 4 Month |
| Monitoring range | 90° N~90° S | 90° N~90° S | 90° N~90° S |
| Data period | Mar. 2015–Dec. 2018 | Mar. 2015–Dec. 2018 | Mar. 2015–Dec. 2018 |
Table 2.
List of the formulas and optimal values of the indexes.
| Diagnostic Statistics | Equation | Optimum Value | Value Ranges | Unit |
|---|---|---|---|---|
| CC | 1 | (−1,1) | - | |
| RMSE | 0 | (0, Inf) | mm | |
| BIAS | 0 | (−Inf, Inf) | % | |
| POD | 1 | (0,1) | - | |
| FAR | 0 | (0,1) | - | |
| CSI | 1 | (0,1) | - |
Variables: n, total number of flash floods; Di, the i-th of the evaluated; Mi, the i-th of the reference data; , mean of Di; , mean of Mi; O, number of hits; U, number of misses; P, number of false positive.
Table 3.
Calculation results for evaluating IMERG.
| Timescale | Product | CC | RMSE (mm) | BIAS (%) | POD | FAR | CSI |
|---|---|---|---|---|---|---|---|
| Hourly | IMERG-E | 0.41 | 1.1 | −0.69 | 0.39 | 0.53 | 0.27 |
| IMERG-F | 0.46 | 0.97 | 23.33 | 0.43 | 0.51 | 0.29 | |
| Daily | IMERG-E | 0.63 | 7.59 | −1.18 | 0.63 | 0.38 | 0.45 |
| IMERG-F | 0.73 | 5.74 | 28.24 | 0.66 | 0.34 | 0.48 |
© 2020 by the authors. Licensee MDPI, Basel, Switzerland. This article is an open access article distributed under the terms and conditions of the Creative Commons Attribution (CC BY) license (http://creativecommons.org/licenses/by/4.0/).
Share and Cite
MDPI and ACS Style
Ma, M.; Wang, H.; Jia, P.; Tang, G.; Wang, D.; Ma, Z.; Yan, H. Application of the GPM-IMERG Products in Flash Flood Warning: A Case Study in Yunnan, China. Remote Sens. 2020, 12, 1954. https://doi.org/10.3390/rs12121954
AMA Style
Ma M, Wang H, Jia P, Tang G, Wang D, Ma Z, Yan H. Application of the GPM-IMERG Products in Flash Flood Warning: A Case Study in Yunnan, China. Remote Sensing. 2020; 12(12):1954. https://doi.org/10.3390/rs12121954
Chicago/Turabian StyleMa, Meihong, Huixiao Wang, Pengfei Jia, Guoqiang Tang, Dacheng Wang, Ziqiang Ma, and Haiming Yan. 2020. "Application of the GPM-IMERG Products in Flash Flood Warning: A Case Study in Yunnan, China" Remote Sensing 12, no. 12: 1954. https://doi.org/10.3390/rs12121954
Note that from the first issue of 2016, this journal uses article numbers instead of page numbers. See further details here.