Adaptive Contrast Enhancement of Optical Imagery Based on Level of Detail (LOD)


1
Global Earth Observation and Data Analysis Centre, National Cheng Kung University, 70101 Tainan, Taiwan
2
Department of Earth Sciences, National Cheng Kung University, No 1, Ta-Hsueh Road, 70101 Tainan, Taiwan
Remote Sens. 2020, 12(10), 1555; https://doi.org/10.3390/rs12101555
Submission received: 29 April 2020
/
Revised: 5 May 2020
/
Accepted: 11 May 2020
/
Published: 14 May 2020
(This article belongs to the Special Issue The Quality of Remote Sensing Optical Images from Acquisition to Users)
Abstract
:The viewing and sharing of remote sensing optical imagery through the World Wide Web is an efficient means for providing information to the general public and decision makers. Since clouds and hazes inevitably limit the contrast and deteriorate visual effects, only cloudless scenes are usually included and presented in existing web mapping services. This work proposes a level-of-detail (LOD) based enhancement approach to present satellite imagery with an adaptively enhanced contrast determined by its viewing LOD. Compared to existing web mapping services, this new approach provides a better visual effect as well as spectral details of satellite imagery for cases partially covered with clouds or cirrocumulus clouds. The full archive of global satellite imagery, either the existing one or the one collected in the future, can be utilized and shared through the Web with the processing proposed in this new approach.
1. Introduction
Exchanging geospatial information and particularly large amounts of remote sensing imagery through the World Wide Web is an efficient approach to providing such information to the general public and decision makers. For examples, commercial companies like Microsoft and Google are providing web mapping services to the general public through their Bing and Google Map or Google Earth platforms, respectively. Government agencies, such as the European Space Agency (ESA) and the United States Geological Survey (USGS), are sharing their satellite images to registered users through web-based systems powered by OpenLayers, Google Maps, or Google Earth application program interfaces. Since everyone around the world can freely access these platforms via a web browser without purchasing or installing expensive software, there is an increasing number of data owners who would like to distribute their geospatial data or remote sensing optical imagery through these systems.
To share such data through the World Wide Web, one important common procedure is to convert a large remote sensing image to a set of pyramid tiles, referred to as a superoverlay. All tiles are stored in a cloud-based server, and the user can browse any region of this image at different levels of detail (LOD) on the World Wide Web following a standard technical approach proposed more than a decade ago. Since only a few tiles have to be transmitted and no calculations are actually conducted at the server end, one machine can serve many users simultaneously. It should be noted that these tiles can be distributed and browsed via devices including mobile phones, tablets, and desktop computers as well.
The most intuitive and direct impression when quickly browsing image tiles on the World Wide Web is related to their visual effect, where better contrast makes it possible to retrieve more information from the image. Since approximately 52% of the Earth is covered by clouds at any moment [1], the contrast in satellite imagery is usually not ideal. Consequently, the surface features are not presented with the optimized visual effect, and the situation is even worse in cases where there are cirrocumulus clouds. Only cloudless scenes are included and presented in the existing Google Maps or Google Earth. Most of the acquired satellite images with partial cloud cover are not fully utilized either. Since clouds and hazes often contaminate optical remote sensing imagery, degrade image quality, and significantly affect remote sensing applications [2], a lot of works have reported on removing clouds and hazes in the past few years [2,3,4,5,6,7,8,9,10,11,12,13,14,15,16,17,18,19,20,21,22,23,24,25], which can be divided into two categories: image restoration-based methods and image enhancement-based methods.
Image restoration-based methods establish a degradation model or employ a radiative transfer model, such as the S6 and MORTRAN, to compute the atmospheric interference from hazes and clouds mathematically. Although the physical processes can be considered in great detail and the recovered ground information can be used by quantitative applications, the amount of calculation is usually rather significant, and many model parameters need to be estimated using a variety of prior knowledge. The most available information is the cloudless image of the same region taken on the other dates. For example, the cloud-contaminated portions of a satellite image can be reconstructed by use of the temporal correlation of multitemporal images, under the assumption that land covers change insignificantly over a short period of time [13]. With similar assumptions, Tseng et al. [23] proposed a three-step approach to generate cloud-free mosaic images from multitemporal SPOT (French: Satellite Pour l’Observation de la Terre) images. Gu et al. [6] pointed out that these multitemporal methods are not practical in real life since the acquisition of several images from the same scenery under different conditions is rather difficult. Therefore, haze removal from a single image is of scientific interest as well as of practical importance [18]. Jiang et al. [9] and Gu et al. [6] provided two detailed reviews on different priors and assumptions that have been made to tackle the single image haze removal problem. For example, Liang et al. [11,12] assumed that each land cover cluster has the same visible reflectance in both clear and hazy regions. Based on this assumption, they proposed a cluster matching technique for Landsat TM data. Zhang et al. [24] developed a haze optimized transformation (HOT) method for haze evaluation by assuming that digital numbers of bands red and blue are highly correlated for pixels within the clearest portions of a scene and valid for all surface classes; Moro et al. [19] combined HOT with dark object subtraction (DOS) and proposed an operational technique for haze removal of Landsat TM and high-resolution satellite data. Liu et al. [14] were able to remove spatially varying haze contamination, but thick haze and clear regions need to be outlined manually, and some parameters need to be set during subsequent processing as well. He et al. [7] assumed at least one color-channel has some pixels with a quite low intensity to estimate a transition matrix from the original hazy image to restore a clear image; Zhu et al. [25] developed a color attenuation approach prior to recovering the depth information of original hazy images. Makarau et al. [18] removed both haze and cirrus by calculating a haze thickness map (HTM) from visible bands and a cirrus band, based on the assumption of an additive model of the haze influence; this approach was improved by Jiang et al. [10] to gain accurate haze thickness maps and prevent underestimation, but this algorithm was only effective for local operations rather than a whole satellite image, for a considerable number of experiments on a wide variety of selected images are required. To summarize, all available restoration-based methods are still dependent on some prior knowledge or assumptions, despite the rapid development in recent years [16].
Instead of restoring the true ground information, image enhancement-based methods aim at rapidly recovering clear scenes from hazy images under some simple assumptions. Since no detailed mechanism of image degradation is taken into account, these approaches usually lead to common overestimation, underestimation, and color shift problems [6]. However, they are preferable for applications that are more suitable for human visual observation or machine recognition [16], such as image interpretation, target recognition, and feature detection. It should be noted that the contrasts of the remote sensing imagery of Earth are usually poor, even after removing all clouds and hazes carefully. Image enhancement is still a prerequisite process for further applications. Liu et al. [17] and Gu et al. [6] reviewed assumptions that have been made by some image enhancement-based methods. For example, Richter et al. [21] assumed that histograms of clear and hazy regions are the same and proposed a histogram matching method; Narasimhan et al. [20] described the appearances of scenery under uniform bad weather conditions and employed a quick algorithm to recover the scene contrast. Du et al. [5] assumed that haze effects resided in low-frequency parts of the image; they used wavelet transform fusion to replace this part with data from a reference haze-free image. With the same assumption, Shen et al. [22] proposed a homomorphic filter-based method. Liu et al. [26] employed the adaptive contrast enhancement technique and demonstrated that near-real time Landsat-8 imagery can be browsed with clear contrast enhancement regardless of the cloud condition. As summarized by Liu et al. [17], most enhancement-based methods are mainly concentrated on low-resolution multispectral data. These assumptions may not be valid for high-resolution images. In addition, the global operations of image enhancement-based methods can inevitably lead to the distortion of the clear regions on a hazy image.
In recent years, haze removal methods were developed in the machine learning framework, such as the works by [3,4,6,8,15]. Because more high-level, hierarchical, and abstract features can be extracted by deep learning architectures, these new methods are believed to be more robust to remove clouds and hazes [8]. However, to the best of our knowledge, no operational system based on machine learning methods has been proposed for the haze removal of remote sensing imagery. Considering the tremendous amount of resources and efforts that have been spent and planned for making more observations of Earth from space, the development of an approach to make the best use of all collected images, regardless of the cloud coverage, is equally important but has been typically overlooked. Therefore, apart from refining and perfecting the image restoration-based methods, it is worthwhile to reflect on the fundamental need of exchanging large amounts of remote sensing imagery through the World Wide Web, and to follow the concept of enhancement-based methods to provide optical imagery with clear contrast enhancement regardless of the cloud condition on an operational basis.
In this work, an innovative approach called LOD-based enhancement is proposed to present satellite imagery with an adaptively enhanced contrast determined by its viewing LOD. Comparing to existing web mapping services, this new approach indeed provides a much better visual effect as well as spectral details of satellite imagery. The limitations of cloud coverage associated with viewing and sharing satellite optical imagery through the Web are therefore removed. The full archive of global satellite imagery, either the existing images or those to be acquired in the future, can be utilized and shared through the Web through processing using this new approach. All commercial software of remote sensing image processing with a variety of contrast enhancement functions and build-in pyramid creation for large image display, such as ArcGIS®, ERDAS®, and ENVI®, can benefit from employing this new approach as well.
2. Preliminaries and the Previous Works
Contrast enhancement is a widely-used digital image processing technique for applications where the subjective quality of images is important for human interpretation. It is also a crucial processing method for ensuring the quality of visual effects for remote sensing optical images from acquisition to users. Although the general, straightforward linear contrast enhancement (LCE) approach can provide clear contrast for most land use and land cover situations, clouds and hazes that are frequently found on remote sensing optical images inevitably limit the dynamic range of contrast and deteriorate the quality of visual effects. Unless it can be masked out completely, a small patch of cloud or haze will render the LCE approach invalid. As demonstrated by Liu et al. [26], this problem can be tackled by masking out clouds and applying the adaptive contrast enhancement (ACE) technique [27] to those regions without cloud masking, and then adding back the cloud mask with a saturated value. The ACE technique assigns each pixel to an intensity proportional to its rank within the surrounding neighborhood. Even though the clouds and hazes cannot be masked out completely, the contrast can be stretched well by considering the rank of each pixel. The noise overenhancement in nearly homogeneous regions can be reduced by setting the size of the overlapped tiles as a fraction of the largest dimensions of the image size, as well as by limiting the slope of the histogram. This method has proven to be broadly applicable to a wide range of images and to have demonstrated effectiveness. As illustrated in Figure 1 by a standard Level-1C true color image (TCI) product for granule T51QTF taken by Sentinel-2 on 15 June 2019, the TCI with LCE (Figure 1a) is adaptively equalized after applying the ACE technique, and better contrast is attained (Figure 1b), regardless of the cloud coverage and distribution. It should be noted that the required parameters of ACE are determined by ensuring the darker, homogeneous pixels, such as a water body (red box in Figure 1a,b) or vegetated regions (yellow box in Figure 1a,b), are not overenhanced into artificial colorful strips. Compared to the LCE results (Figure 1c,e), the visual effect is significantly improved by ACE when viewed at its full resolution (Figure 1d,f). However, the distortion of the overall spectral information also becomes apparent when viewing the overall ACE image (Figure 1b). As a result, the ACE image looks a little bit unrealistic due to its equalized histogram, even though the contrast is fairly well enhanced at full resolution.
As remote sensing optical images are browsed through a web mapping service, the current LOD and region are determined on-the-fly from the client end. Since the actions of zoom in and zoom out are equivalent to flipping between tiles with different LODs, and only the related tiles falling within the current region are required for transmission and display, the remote sensing optical image can be browsed smoothly through the Web, regardless of its original size. When the image is zooming across different LODs, users are aware of changes in spatial resolution only, rather than the contrast. Because the entire set of pyramid tiles is prepared from the same image, the contrasts are all kept the same. This motivates the idea of introducing different levels of enhancement for different LODs, namely, the concept of LOD-based enhancement.
3. Methods
The LOD is defined as the size of the projected region on the screen that is required for the region to be considered active. As one remote sensing optical image is browsed through a web mapping service, it is zoomed from the lowest LOD (L), where the entire image is projected within the screen, and then moved across different LODs until reaching the highest LOD (H) in its full resolution. To introduce different levels of enhancement for different LODs, the image at any LOD (i) between L and H, namely (), can be treated as a transition from the image with a standard LCE () to the image with ACE (). The TCI of granule T51QTF taken by Sentinel-2 on 15 June 2019, as shown in Figure 1, is employed as an example to evaluate various types of transition.
3.1. Linear Transition
The simple and most direct approach is to calculate as a linear transition from to using
where the ratio at LOD i is defined as
The effect of LOD-based enhancement is illustrated in Figure 2 using the water body region, annotated as the red box in Figure 1a,b. The standard Level-1C TCI product is zoomed from LOD 9 to 14 with the original LCE (left panel) and LOD-based enhancement (Equation (1)) with a linear transition (Equation (2)) (central panel), respectively. This image is a typical case of remote sensing optical imagery contaminated by cirrocumulus clouds and haze. Even with the standard Level-1C TCI product provided by Sentinel Hub, the dynamic range of contrast is limited, and the visual effect is poor. As for the case of LOD-based enhancement (Equation (1)) with a linear transition (Equation (2)) (central panel), by contrast, the water body becomes increasingly clearer as the LOD is increased to its full resolution (Figure 2f). It should be noted that the visual effect of contrast enhancement from LOD 9 to LOD 11 is not as apparent as the one from LOD 12 to LOD 14, although the same linear transition equation (Equation (2)) is employed to calculate the weight of . This suggests that the weight of should be adjustable at different LODs.
3.2. Power Transition
To increase the weight of in the lower LOD range and decrease the weight of in the higher LOD range, the ratio at LOD i is modified as
where n can be any floating number less than 1.0. As shown in the right panel of Figure 2, the same TCI is zoomed from LOD 9 to 14 using LOD-based enhancement (Equation (1)) with a power transition (Equation (3)) by setting n at a value of 0.5. Comparing the right panel (power transition) to the central panel (linear transition), the visual effect of contrast enhancement from LOD 9 (Figure 2a) to LOD 11 (Figure 2c) is indeed improved. The deviations become increasingly less from LOD 12 (Figure 2d) to LOD 14 (Figure 2f) because the value of Equation (3) approaches the value of Equation (2) as i approaches H. It should be noted that the linear transition (Equation (2)) is valid and good enough for most images with partial clouds. The power transition (Equation (3)) is suitable for extreme cases of images contaminated by cirrocumulus clouds and haze. The less the value of power n, the stronger the enhancement in the lower LOD and the weaker the enhancement in the higher LOD, and vice versa. Other forms of transition, such as logarithm or square root transitions, are also applicable, as long as the concept of LOD-based enhancement (Equation (1)) is followed.
The LOD-based enhancement approach is written in Interactive Data Language (IDL®) using some of the built-in routines from the Environment for Visualizing Images (ENVI®) library. It is currently installed on an ordinary PC-based server equipped with an Intel® Core™ i7-4790K (4.0-GHz) CPU (ASUS, Taipei, Taiwan), as well as a regular solid state disk. This new approach has been employed to assist the Soil and Water Conservation Bureau (SWCB) of Taiwan to process various sources of remote sensing optical imagery. Using the standard Level-1C TCI product of granule T51QTF taken by Sentinel-2 as an example (Figure 1 and Figure 2), it has 10980 × 10980 pixels, and the extra computational time required for calculating and is merely 7.516 and 0.937 seconds, respectively. Once and have been calculated and stored in the beginning of image processing, Equations (1) and (2) are simply linear combinations of and at each LOD, which take negligible time comparing to the time of preparing image tiles.
4. Results
As reviewed in the Introduction section, all available restoration-based methods are still dependent on some prior knowledge or assumptions, and the global operations of image enhancement-based methods can inevitably lead to the distortion of the clear regions on a hazy image. This work aims at providing optical imagery with clear contrast enhancement regardless of the cloud condition on an operational basis. Instead of making a scene-to-scene comparison with images shown in published papers that have not been implemented in a fully operated system, results of the LOD-based enhancement approach are compared directly to the same images provided by existing web mapping services to demonstrate superior visual quality, including BigGIS (https://gis.swcb.gov.tw/), LandsatLook Viewer (https://landsatlook.usgs.gov/viewer.html), Landsat Explorer (http://landsatexplorer.esri.com/), and Sentinel Explorer (https://sentinel2explorer.esri.com/).
Figure 3 shows the annual mosaic of SPOT-6/7 cloudless images of Taiwan taken in 2017. The left and right panels are the original mosaic and the one processed using LOD-based enhancement (Equation (1)) with a linear transition (Equation (2)), respectively. Even though the original image is a cloudless mosaic with an ideal contrast (left panel), the visual effect of LOD-based enhancement (Equation (1)) with a linear transition (Equation (2)) is significant (right panel). As the LOD is increased from 14 to 17, both the spatial resolution and the spectral contrast of the target area become increasingly clearer. Therefore, the LOD-based enhancement approach benefits the cloudless remote sensing optical imagery as well. However, the most significant improvement in the LOD-based enhancement approach is for cases with partial cloud cover or cirrocumulus clouds.
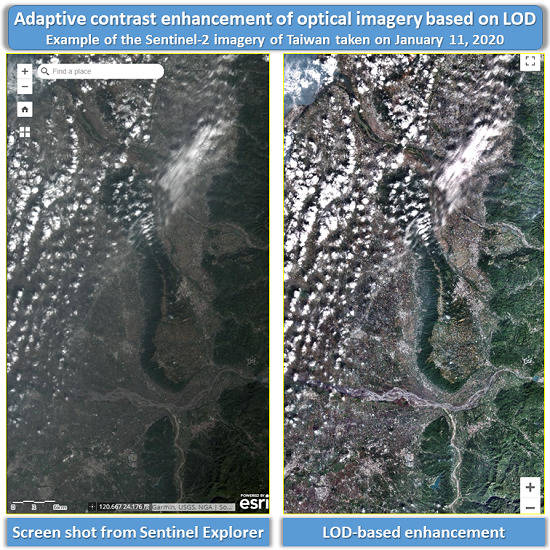
Figure 4 shows a Sentinel-2 imagery of Taiwan taken on 3 September 2018 (LOD = 7–11) and 11 January 2020 (LOD = 12–14). Both are ideal images with low cloud coverage values over land (approximately 11% and 14% calculated from the standard Sentinel-2 scene classification map product, respectively). However, the characteristics of cirrocumulus clouds limit the dynamic range of contrast and deteriorate the quality of the visual effect, as shown on the left panels of Figure 4. It should be noted that these are screen shots from Sentinel Explorer, a web application powered by ArcGIS for the purpose of accessing Sentinel-2 imagery layers updated on a daily basis (https://sentinel2explorer.esri.com/; browsed on 16 January 2020). The default Sentinel-2 imagery layer of Taiwan for LODs less than 11 is the one taken on 3 September 2018. This layer can be switched to the other date, 11 January 2020 in this case, as the image is zoomed to LODs equal to or higher than 12. To make a pixel-to-pixel comparison, both the Sentinel-2 imagery of Taiwan taken on 3 September 2018 and the one on 11 January 2020 are processed using LOD-based enhancement (Equation (1)) with a linear transition (Equation (2)). Taking the left panels as a reference, the same region with the same processed imagery LOD is shown on the right panels of Figure 4. It should be noted that the region annotated in the colored box in each LOD is enlarged in the next LOD. Likewise, as the LOD is increased from 7 to 14, both the spatial resolution and the spectral contrast of the target area become increasingly clearer. For cases with partial cloud cover or cirrocumulus clouds, the improvement in the visual effect for the LOD-based enhancement approach is apparent.
To enable rapid online viewing and access to the USGS Landsat image archives, the USGS developed a web-based tool called the LandsatLook Viewer. Similar to Sentinel Explorer, there is also a web application, Landsat Explorer, powered by ArcGIS for accessing Landsat imagery layers that are updated on a daily basis. Figure 5 shows a Landsat-8 image of Taiwan taken on 28 July 2019 with approximately 34% cloud coverage as calculated from the USGS mask algorithm function. The left panels are screen shots from the LandsatLook Viewer (https://landsatlook.usgs.gov/viewer.html; browsed on 16 January 2020), which are regarded as natural color images but should be false color composites (Red: band 6 / SWIR 1 / 1.57–1.65 μm; Green: band 5 / Near infrared / 0.85–0.88 μm; Blue: band 4 / Red / 0.64–0.67 μm). This type of band combination is not as sensitive to clouds and hazes as the true color composite is. However, the spatial resolution is limited to 30 m, and there is no spectral information for true color image (Red–Green–Blue) either. The middle panels are screen shots from Landsat Explorer (http://landsatexplorer.esri.com/; browsed on 16 January 2020). Similar to the discussion on the Sentinel Explorer, cirrocumulus clouds and haze limit the dynamic range of contrast and deteriorate the quality of the visual effect. The right panels are pansharpened using a spectral summation intensity modulation technique [26] and then LOD-based enhancement (Equation (1)) with a linear transition (Equation (2)). As a result, the improvements in the visual effect and the spatial details are apparent when comparing the right panels to the middle and left panels. It should be noted that the region annotated in the colored box in each LOD is enlarged in the next LOD.
5. Discussion
Dynamically adjusting the image contrast based on its current viewing region is not a new concept. It has already been implemented in some commercial software programs such as ENVI® as one option for viewing an image. Some web mapping services, including Sentinel Explorer and Landsat Explorer, also provide this function to adjust the image contrast dynamically (as illustrated in the left panel of Figure 4 and the middle panel of Figure 5). As mentioned before, however, the visual effect of a general contrast enhancement approach will be limited if a small patch of cloud or haze falls within its current viewing region. The LOD-based enhancement approach proposed in this work tackles this problem by applying the adaptive contrast enhancement (ACE) technique [27], as demonstrated and explained by Liu et al. [26]. By introducing different levels of enhancement for different LODs, the LOD-based enhancement avoids the distortion of overall spectral information when viewing from the lower LODs. It also leads to a much better visual effect when viewing from higher LODs.
Among various global datasets, the Landsat program is the longest running project that acquires space-based moderate-resolution optical imagery and can be traced back to 1972. Zhu et al. [28] described how the free and open data policy has allowed researchers to harness nearly half a century of information contained in the Landsat archive to do robust, global time series analyses, where data use has increased 20-fold, and Landsat-based scientific publications have increased four-fold. However, currently, only scientists and specialists who are familiar with image processing and applications of Landsat imagery benefit from the free and open data policy. To initiate and broaden more possible applications of the Landsat archive, all Landsat imagery should be easily viewed and shared by the general public, particularly images with partial cloud cover or cirrocumulus clouds. The existing free and open web mapping services, such as Microsoft Bing and Google Maps or Google Earth, should include and present the full Landsat archive and the other satellite image archives that also support the free and open data policy. Since the limitations of cloud coverage on viewing and sharing satellite optical imagery through the Web is removed by this LOD-based enhancement approach, the full archive of global satellite imagery, either the existing imagery or the one collected in the future, can be utilized and shared through the Web.
Implementation of the LOD-based enhancement approach consumes significantly fewer computing resources as compared to the process of preparing image tiles. As described by Equation (1), both and are prepared from a remote sensing optical image, which takes only a few seconds in the cases shown in Figure 4 and Figure 5. The only processing difference is that for each LOD i, all tiles are prepared from the calculated at this LOD as a linear transition from to , which takes negligible time comparing to the time of preparing image tiles. The LOD-based enhancement approach is currently written in IDL® using some of the ENVI® library’s built-in routines. It can be added to other software that prepare image tiles. For example, Google Earth Enterprise (GEE) was sold as a commercial software program until 2015. It is now open sourced and available on GitHub. The GEE software consists of Google Earth Fusion Pro, which allows users to convert a large remote sensing image to a set of pyramid tiles and combine them into a Google Maps or Google Earth platform. Therefore, the LOD-based enhancement approach can be added to Google Earth Fusion Pro as well.
6. Conclusions
In this work, an LOD-based enhancement approach is proposed, where after processing with this new approach, satellite imagery can be presented with an adaptive enhanced contrast determined by its viewing LOD, regardless of the degree of cloud coverage. Compared to the same images presented on several web mapping service platforms, including Sentinel Explorer, Landsat Explorer, and LandsatLook Viewer, this new approach indeed provides a much better visual satellite imagery effect and removes the limitations associated with cloud coverage. Implementation of the LOD-based enhancement approach consumes much fewer computing resources, and it can be added to other software that prepare image tiles. The full archive of global satellite imagery, either those already in existence or those to be obtained in the future, can be utilized and shared through the Web through processing using this new LOD-based enhancement approach.
Funding
This research received no external funding.
Acknowledgments
The author acknowledges support from the USGS for providing Landsat-8 imagery, the ESA for providing Sentinel-2 imagery, and the SWCB for providing SPOT-6/7 imagery.
Conflicts of Interest
The authors declare no conflict of interest.
References
- Downs, R.M.; Day, F.A. National Geographic Almanac of Geography; National Geographic Society: Washington, DC, USA, 2005. [Google Scholar]
- Sun, L.; Latifovic, R.; Pouliot, D. Haze removal based on a fully automated and improved haze optimized transformation for landsat imagery over land. Remote Sens. 2017, 9, 972. [Google Scholar]
- Cai, B.; Xu, X.; Jia, K.; Qing, C.; Tao, D. Dehazenet: An end-to-end system for single image haze removal. IEEE Trans. Image Process. 2016, 25, 5187–5198. [Google Scholar] [CrossRef] [Green Version]
- Dong, C.; Loy, C.C.; He, K.; Tang, X. Image super-resolution using deep convolutional networks. IEEE Trans. Pattern Anal. Mach. Intell. 2015, 38, 295–307. [Google Scholar] [CrossRef] [Green Version]
- Du, Y.; Guindon, B.; Cihlar, J. Haze detection and removal in high resolution satellite image with wavelet analysis. IEEE Trans. Geosci. Remote Sens. 2002, 40, 210–217. [Google Scholar]
- Gu, Z.; Zhan, Z.; Yuan, Q.; Yan, L. Single remote sensing image dehazing using a prior-based dense attentive network. Remote Sens. 2019, 11, 3008. [Google Scholar] [CrossRef] [Green Version]
- He, K.; Sun, J.; Tang, X. Single image haze removal using dark channel prior. IEEE Trans. Pattern Anal. Mach. Intell. 2010, 33, 2341–2353. [Google Scholar] [PubMed]
- Jiang, H.; Lu, N. Multi-scale residual convolutional neural network for haze removal of remote sensing images. Remote Sens. 2018, 10, 945. [Google Scholar] [CrossRef] [Green Version]
- Jiang, H.; Lu, N.; Yao, L. A high-fidelity haze removal method based on hot for visible remote sensing images. Remote Sens. 2016, 8, 844. [Google Scholar] [CrossRef] [Green Version]
- Jiang, H.; Lu, N.; Yao, L.; Zhang, X. Single image dehazing for visible remote sensing based on tagged haze thickness maps. Remote Sens. Lett. 2018, 9, 627–635. [Google Scholar] [CrossRef]
- Liang, S.; Fang, H.; Chen, M. Atmospheric correction of landsat etm+ land surface imagery. I. Methods. IEEE Trans. Geosci. Remote Sens. 2001, 39, 2490–2498. [Google Scholar] [CrossRef]
- Liang, S.; Fang, H.; Morisette, J.T.; Chen, M.; Shuey, C.J.; Walthall, C.L. Atmospheric correction of landsat etm+ land surface imagery. Ii. Validation and applications. IEEE Trans. Geosci. Remote Sens. 2002, 40, 2736–2746. [Google Scholar] [CrossRef] [Green Version]
- Lin, C.-H.; Tsai, P.-H.; Lai, K.-H.; Chen, J.-Y. Cloud removal from multitemporal satellite images using information cloning. IEEE Trans. Geosci. Remote Sens. 2012, 51, 232–241. [Google Scholar] [CrossRef]
- Liu, C.; Hu, J.; Lin, Y.; Wu, S.; Huang, W. Haze detection, perfection and removal for high spatial resolution satellite imagery. Int.J. Remote Sens. 2011, 32, 8685–8697. [Google Scholar] [CrossRef]
- Liu, C.-C.; Zhang, Y.-C.; Chen, P.-Y.; Lai, C.-C.; Chen, Y.-H.; Cheng, J.-H.; Ko, M.-H. Clouds classification from sentinel-2 imagery with deep residual learning and semantic image segmentation. Remote Sens. 2019, 11, 119. [Google Scholar] [CrossRef] [Green Version]
- Liu, J.; Wang, X.; Chen, M.; Liu, S.; Zhou, X.; Shao, Z.; Liu, P. Thin cloud removal from single satellite images. Optics Express 2014, 22, 618–632. [Google Scholar] [CrossRef] [PubMed]
- Liu, Q.; Gao, X.; He, L.; Lu, W. Haze removal for a single visible remote sensing image. Signal Process. 2017, 137, 33–43. [Google Scholar] [CrossRef]
- Makarau, A.; Richter, R.; Schläpfer, D.; Reinartz, P. Combined haze and cirrus removal for multispectral imagery. IEEE Geosci. Remote Sens. Lett. 2016, 13, 379–383. [Google Scholar] [CrossRef]
- Moro, G.D.; Halounova, L. Haze removal for high-resolution satellite data: A case study. Int. J. Remote Sens. 2007, 28, 2187–2205. [Google Scholar] [CrossRef]
- Narasimhan, S.G.; Nayar, S.K. Contrast restoration of weather degraded images. IEEE Trans. Geosci. Remote Sens. 2003, 25, 713–724. [Google Scholar] [CrossRef] [Green Version]
- Richter, R. Atmospheric correction of satellite data with haze removal including a haze/clear transition region. Comput. Geosci. 1996, 22, 675–681. [Google Scholar] [CrossRef]
- Shen, H.; Li, H.; Qian, Y.; Zhang, L.; Yuan, Q. An effective thin cloud removal procedure for visible remote sensing images. ISPRS J. Photogramm. Remote Sens. 2014, 96, 224–235. [Google Scholar] [CrossRef]
- Tseng, D.-C.; Tseng, H.-T.; Chien, C.-L. Automatic cloud removal from multi-temporal spot images. Appl. Math. Comput. 2008, 205, 584–600. [Google Scholar] [CrossRef]
- Zhang, Y.; Guindon, B.; Cihlar, J. An image transform to characterize and compensate for spatial variations in thin cloud contamination of landsat images. Remote Sens. Environ. 2002, 82, 173–187. [Google Scholar] [CrossRef]
- Zhu, Q.; Mai, J.; Shao, L. A fast single image haze removal algorithm using color attenuation prior. IEEE Trans. Image Process. 2015, 24, 3522–3533. [Google Scholar]
- Liu, C.-C.; Nakamura, R.; Ko, M.-H.; Matsuo, T.; Kato, S.; Yin, H.-Y.; Huang, C.-S. Near real-time browsable landsat-8 imagery. Remote Sens. 2017, 9, 79. [Google Scholar] [CrossRef] [Green Version]
- Pizer, S.; Amburn, E.; Austin, J.; Cromartie, R.; Geselowitz, A.; Greer, T.; Romeny, B.; Zimmerman, J.; Zuiderveld, K. Adaptive histogram equalization and its variations. Comput. Vision Graph. Image Process. 1987, 39, 355–368. [Google Scholar] [CrossRef]
- Zhu, Z.; Wulder, M.A.; Roy, D.P.; Woodcock, C.E.; Hansen, M.C.; Radeloff, V.C.; Healey, S.P.; Schaaf, C.; Hostert, P.; Strobl, P.; et al. Benefits of the free and open landsat data policy. Remote Sens Environ. 2019, 224, 382–385. [Google Scholar] [CrossRef]
Figure 1.
The standard Level-1C true color image (TCI) product for granule T51QTF taken by Sentinel-2 on 15 June 2019 enhanced using (a) linear contrast enhancement (LCE) and (b) adaptive contrast enhancement (ACE), respectively, where the water body region (red box) is enlarged to its full resolution in (c) LCE and (d) ACE, respectively, and the vegetation region (yellow box) is enlarged to its full resolution in (e) LCE and (f) ACE, respectively.

Figure 2.
Illustration of the effect of level-of-detail (LOD) based enhancement. The standard Level-1C TCI product is zoomed from LOD 9 to 14 with the original LCE (left panel), LOD-based enhancement (Equation (1)) with a linear transition (Equation (2)) (central panel), and LOD-based enhancement (Equation (1)) with a power transition (Equation (3)) by setting n at a value of 0.5 (right panel). LOD = (a) 9, (b) 10, (c) 11, (d) 12, (e) 13, (f) 14. The region annotated in the colored box in each LOD is enlarged in the next LOD.

Figure 3.
Example of the annual SPOT-6/7 cloudless imagery mosaic of Taiwan taken in 2017. The left and right panels are the original mosaic and the one processed by LOD-based enhancement (Equation (1)) with a linear transition (Equation (2)), respectively. (a) LOD = 14, (b) LOD = 15, (c) LOD = 16, (d) LOD = 17. The region annotated in the colored box in each LOD is enlarged in the next LOD. (Image source: Center for Space and Remote Sensing Research, National Central University)

Figure 4.
Example of Sentinel-2 imagery of Taiwan taken on 3 September 2018 (a) LOD = 7, (b) LOD = 9, (c) LOD = 10; and on January 11, 2020 (d) LOD = 11, (e) LOD = 13, (f) LOD = 14. The left panels are screen shots from Sentinel Explorer (https://sentinel2explorer.esri.com/; browsed on 16 January 2020). Taking the left panels as a reference, the right panels are the same region with the same LOD of the imagery processed by LOD-based enhancement (Equation (1)) with a linear transition (Equation (2)). The region annotated in the colored box in each LOD is enlarged in the next LOD.

Figure 5.
Example of Landsat-8 imagery of Taiwan taken on 29 July 2019. (a) LOD = 10, (b) LOD = 12, (c) LOD = 14. Left panels: LandsatLook Viewer; Middle panels: Landsat Explorer; Right panels: LOD-based enhancement (Equation (1)) with a linear transition (Equation (2)). The region annotated in the colored box in each LOD is enlarged in the next LOD.

© 2020 by the author. Licensee MDPI, Basel, Switzerland. This article is an open access article distributed under the terms and conditions of the Creative Commons Attribution (CC BY) license (http://creativecommons.org/licenses/by/4.0/).
Share and Cite
MDPI and ACS Style
Liu, C.-C. Adaptive Contrast Enhancement of Optical Imagery Based on Level of Detail (LOD). Remote Sens. 2020, 12, 1555. https://doi.org/10.3390/rs12101555
AMA Style
Liu C-C. Adaptive Contrast Enhancement of Optical Imagery Based on Level of Detail (LOD). Remote Sensing. 2020; 12(10):1555. https://doi.org/10.3390/rs12101555
Chicago/Turabian StyleLiu, Cheng-Chien. 2020. "Adaptive Contrast Enhancement of Optical Imagery Based on Level of Detail (LOD)" Remote Sensing 12, no. 10: 1555. https://doi.org/10.3390/rs12101555
Note that from the first issue of 2016, this journal uses article numbers instead of page numbers. See further details here.