Spatial Non-Uniformity of Surface Temperature of the Dead Sea and Adjacent Land Areas


1
Department of Geophysics, Tel Aviv University, Tel-Aviv 69978, Israel
2
Department of Atmospheric and Oceanic Science, University of Maryland, College Park, MD 20742, USA
*
Author to whom correspondence should be addressed.
Remote Sens. 2020, 12(1), 107; https://doi.org/10.3390/rs12010107
Submission received: 25 November 2019
/
Revised: 18 December 2019
/
Accepted: 26 December 2019
/
Published: 28 December 2019
(This article belongs to the Special Issue Lake Remote Sensing)
Abstract
:Pronounced spatial non-uniformity has been obtained of daytime sea surface temperature (SST) of the Dead Sea and of land surface temperature (LST) over areas adjacent to the Dead Sea. This non-uniformity was observed in the summer months, under uniform solar radiation. Our findings are based on Moderate Resolution Imaging Spectroradiometer (MODIS) data (2002–2016) on board the Terra and Aqua satellites. MODIS data showed that, on average for the 15-year study period, daytime SST over the eastern part of the lake (Te) exceeded by 5 °C that over the western part (Tw). This SST non-uniformity (observed in the absence of surface heat flow from land to sea at the eastern side) was accompanied by spatial non-uniform distribution of land surface temperature (LST) over areas adjacent to the Dead Sea. Specifically, LST over areas adjacent to the eastern side exceeded by 10 °C that over areas adjacent to the western side. Our findings of spatial non-uniformity of SST/LST based on MODIS data were supported by Meteosat Second Generation LST records. Regional atmospheric warming led to a decrease in spatial non-uniformity of SST during the study period. Temperature difference between Te and Tw steadily decreased at the rate of 0.32 °C decade−1, based on MODIS/Terra data, and 0.54 °C decade−1, based on MODIS/Aqua data. Our simulations of monthly skin temperature distribution over the Dead Sea by the Weather Forecast and Research (WRF) model contradict satellite observations. The application to modeling of the observed SST/LST spatial non-uniformity will advance our knowledge of atmospheric dynamics over hypersaline lakes.
1. Introduction
The Dead Sea is a terminal hypersaline lake with a depth of ~300 m, at a unique location approximately 430 m below sea level. The lake is flanked by relatively high mountains of ~1000 m height: the Judean Mountains to the west and the Moab Mountains to the east. Because of high salinity of ~300 PSU of Dead Sea water [1], the non-linear absorption of solar radiation is greater than that in fresh-water lakes such as the Sea of Galilee, located in the same climatic zone. Specifically, in the Dead Sea, at a depth of 2 m, solar radiation is only ~10% of its surface value [2]. As a result, in the daytime in the summer months, a thermocline (thermal layering) is created from the water surface down to a depth of 3–4 m, based on buoy measurements in the Dead Sea [3,4]. For comparison, in the fresh-water Sea of Galilee (with the same level of solar radiation) water temperature hardly changes even to a depth of 15 m [5,6]. In the absence of vertical water mixing under weak winds, solar radiation leads to significant warming of Dead Sea surface water. This warming of Dead Sea surface water could be non-uniformly distributed because of a possible inhomogeneous distribution of surface winds in the daytime. Little is known about the patterns of Dead Sea surface temperature. Nehorai et al. [3] discussed that the SST field is heterogeneous in the daytime and homogeneous in the nighttime. Kishcha et al. [7] showed that, in the summer months, the spatial distribution of daytime Dead Sea surface temperature was non-uniform with maximal SST observed near the coastline, while minimal SST was observed in the middle of the Dead Sea. Further investigation of spatial non-uniformity of SST will advance the general understanding of SST-related atmospheric processes not only over the Dead Sea but also over other hypersaline lakes.
Buoy measurements of temperature vertical profiles in the Dead Sea provide information about water temperature at different depths [3,8,9,10,11]. There are several studies on the Dead Sea SST [3,7,12,13,14]. Kishcha et al. [7] showed that increasing warming of steadily shrinking Dead Sea surface water was observed during the period of 2000–2016. They found that a positive feedback loop between steady shrinking of the Dead Sea and positive sea surface temperature trends causes the acceleration of Dead Sea evaporation and water level drop [7].
Available remote sensing observations of skin surface temperature from MODIS on board the two satellites—Terra and Aqua [15,16]—provided us with an opportunity to monitor specific features of sea surface temperature of the Dead Sea and of land surface temperature (LST) over areas adjacent to the lake at the times when the two satellites cover the Dead Sea. Our study is aimed at investigating the patterns of spatial non-uniformity of SST/LST using the 17-year period of MODIS/Terra records (2000–2016) and the 15-year period of MODIS/Aqua records (2002–2016). The resulting information is important for a better understanding of the SST/LST effects on the behavior of the atmosphere above the sea surface and on regional climate variability. In our study, we used 5 × 5 km satellite LST data products. Data of higher spatial resolution are also available, such as Visible Infrared Imaging Radiometer Suite (VIIRS) nighttime data and MODIS data [17].
2. Materials and Methods
Monthly data of Collections-6 (C6) of MODIS/Terra and MODIS/Aqua products Level 3 of Land Surface Temperature (LST) were used in the current study. Wan [16] showed that the mean C6 LST error is within ± 0.6 °C. The MODIS instrument on board the two satellites has a viewing swath width of 2330 km. Both MODIS/Terra and MODIS/Aqua monthly data are available at 5 × 5 km spatial resolution, twice a day: 1) at 10:30 LT (08:30 UTC) and 22:30 LT (20:30 UTC) when Terra covers the Dead Sea, and 2) at 13:30 LT (11:30 UTC) and 01:30 LT (23:30 UTC) when Aqua covers the lake. Hereafter, only local time is used. The use of data from the two satellites allowed us to analyze the spatial non-uniformity of Dead Sea SST at four times. Note that MODIS measures sea surface temperature in the sea skin layer of 10–20 µm [18,19].
As shown in Figure 1 of the region under study, columns 1 and 2 represent pixels covering land areas to the west of the Dead Sea, while columns 6 and 7 represent pixels covering land areas to the east of the lake. Columns 3 to 5 show pixels covering the west, middle and east parts of the Dead Sea respectively. Hereafter TLw1, TLw2, TLe1, TLe2 designate land surface temperature averaged over the land areas to the west and east of the lake, while Tw, Tm, Te designate sea surface temperature over the west, middle, and east parts of the Dead Sea respectively.
Furthermore, we investigated the patterns of spatial distribution of daytime SST/LST in the summer months using the 5-year period of Meteosat LST records (2011–2015). These records were derived from the Spinning Enhanced Visible and InfraRed Imager (SEVIRI) onboard the geostationary Meteosat Second Generation satellites [20]. We used the physical LST monthly product based on radiative transfer calculations. This Meteosat LST product is presented as hourly data and as monthly averaged diurnal cycle composites on a 0.05° x 0.05° grid [20]. The in-situ calibration of Meteosat Dead Sea SST records was carried out by Nehorai et al. [3].
In order to find out how up-to-date regional atmospheric models describe skin temperature distribution over the Dead Sea valley, we used the high-resolution Weather Forecast and Research (WRF) mesoscale atmospheric model daily simulations of skin temperature [21]. The Unified Noah Land Surface Model [22] was chosen as a land-surface scheme for the WRF simulations. This scheme provides lower boundary conditions (such as skin surface temperature, surface sensible and latent heat fluxes, etc.) for the WRF model. A series of sensitivity simulations was performed by Kunin et al. [21] in order to calibrate and validate the WRF model runs over the Dead Sea valley. This was carried out using available observations of near surface and atmospheric variables [21]. As a result of the above-mentioned sensitivity study, the best model configuration was found. This configuration consisted of four nested domains over the Eastern Mediterranean region with horizontal resolutions of 30, 10, 3.3, and 1.1 km grid respectively. The inner domain with the 1.1 km grid space was focused on the Dead Sea and surrounding land areas (Kunin et al. [21], their Figure 2). The model configuration included 40 vertical levels up to 50 hPa (with 20 of these vertical levels within the lowest 1.5 km above the surface); land use/vegetation provided by the 15-s resolution MODIS dataset; NCEP Global Analysis and Forecast (GFS) data for the atmospheric and soil initial and boundary conditions [21]. The same configuration of the WRF model was used in the current study. To estimate monthly-averaged skin temperature distribution over the Dead Sea valley for each hour, the model was run daily from 1–31 August 2014.
3. Results
3.1. Spatial Non-Uniformity of Daytime Dead Sea SST in the Summer Months
We investigated the spatial non-uniformity of Dead Sea SST in the summer months. These months were chosen for the following reasons: (1) precipitation does not occur, and (2) cloud cover over the Dead Sea is insignificant and does not influence solar radiationFigure 2a,b represent two maps: one (Figure 2a) is the 15-year mean spatial distribution of daytime SST at 10:30 LT based on MODIS/Terra data, and the second (Figure 2b) is the 15-year mean spatial distribution of daytime SST at 13:30 LT based on MODIS-Aqua data. On these maps, SST, averaged over the JAS summer months (July, August, and September), is shown separately for each of the 16 pixels covering the east, middle, and west parts of the Dead Sea. As seen, the main feature of the spatial SST distribution, averaged over the summer months, is that daytime SST over the east part of the Dead Sea (Te) exceeded SST over the middle (Tm) and west (Tw) parts. In particular, based on MODIS/Terra data, at 10:30 LT, the 15-year mean Te exceeded Tw by 2 °C (Figure 2a and Table 1). Based on MODIS-Aqua data, we found that the spatial non-uniformity of SST from east to west of the lake at 13:30 LT was even greater than that at 10:30 LT: the 15-year averaged Te exceeded Tw by ~5 °C (Figure 2b and Table 1).
MODIS data from the Terra and Aqua satellites indicate a similar pattern of spatial non-uniformity of daytime Dead Sea SST: exceedance of Te over Tw was observed in each of the summer months at both 10:30 LT and 13:30 LT (Table 1).
3.2. Spatial Uniformity of Nighttime SST in the Summer Months
Satellite MODIS data showed that, during nighttime, spatial distribution of SST in each of the summer months was approximately uniform (Table 1). Based on the 15-year record of MODIS/Terra data, we found that, at 22:30 LT, over the JAS summer months, sea surface temperature was equal to 30.6 °C, 31.1 °C, and 31.1 °C for nighttime Te, Tm, and Tw respectively. Based on the 15-year record of MODIS/Aqua data, at 01:30 LT, on average over the JAS summer months, SST was equal to 30.4 °C, 31.0 °C, and 30.9 °C for Te, Tm, and Tw respectively (Table 1). This spatial uniformity is the result of vertical water mixing under strong nighttime winds in the Dead Sea valley [3,21].
We found that, when the Terra satellite crosses the Dead Sea, the increase in SST from nighttime (22:30 LT) to daytime (10:30 LT) was non-uniform over the east, middle, and west parts of the lake. In particular, Figure 3a,c,e represent histograms of the temperature difference between daytime and nighttime SST over the east, middle, and west parts of the Dead Sea, based on MODIS/Terra monthly data during the 15-year study period. One can see that, over the east part of the lake, the temperature difference between daytime (10:30 LT) and nighttime (22:30 LT) sea surface temperature was 4 °C, on average for the JAS summer months (Figure 3a). This difference was higher than that over the west and middle parts of the lake: 1.0 °C and 0.5 °C respectively (Figure 3c,e).
Based on MODIS/Aqua data during the 15-year study period, we found that the temperature difference between daytime (13:30 LT) and nighttime (01:30 LT) sea surface temperature over the east part was ~8 °C, on average for the JAS summer months (Figure 3b). This difference was essentially higher than those over the west and middle parts of the lake: 2.2 °C and 1.9 °C respectively (Figure 3d,f).
3.3. Surface Temperature Difference between Land Areas Adjacent to the East and West Sides of the Dead Sea
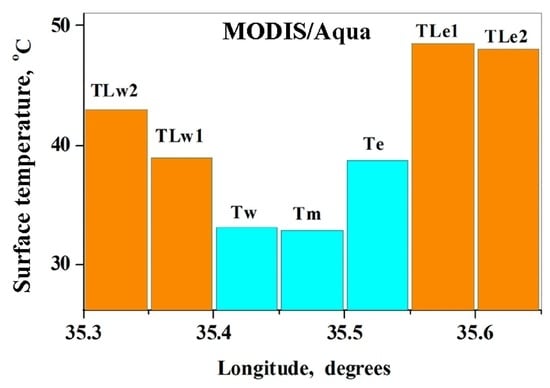
MODIS data from the two satellites—Terra and Aqua, showed a similar pattern of spatial non-uniformity of daytime Dead Sea SST, characterized by the exceedance of Te over Tw. Moreover, satellite measurements showed that the surface temperature over the land area adjacent to the east side is higher than the surface temperature over the land area adjacent to the west side. Based on MODIS/Terra data (2002–2016), at 10:30 LT, TLe1 exceeded TLw1 by ~5 °C. Based on MODIS/Aqua data (2002–2016), at 13:30 LT this exceedance was even greater: TLe1 exceeded TLw1 by ~10 °C (Figure 4 and Table 2). It is important to note that the above-mentioned strong exceedance up to 10 °C of TLe1 over TLw1 was obtained under the same solar radiation over the land areas adjacent to the east and west sides of the lake. This strong exceedance indicates an essential difference between surface heat flow from land to sea at the west side and at the east side of the lake.
We compared surface heat flow from land to sea at the west side and at the east side of the Dead Sea. This was carried out using temperature differences between land surface temperature (LST) over the adjacent (TLw1 and TLe1) and remote land areas (TLw2 and TLe2) to the west and to the east of the Dead Sea. Our comparison was based on 15-year average MODIS/Terra and MODIS/Aqua measurements (Figure 4 and Table 2). MODIS/Terra and MODIS/Aqua data showed that the temperature difference between TLw2 and TLw1 was equal to ~6 °C at 10:30 LT, and ~4 °C at 13:30 LT. This exceedance of TLw2 over TLw1 indicates the presence of daytime surface heat flow from land to sea. The full sequence of surface heat transfer from land to sea at the west side is characterized by the following temperature conditions: at 10:30 LT, TLw2 (44.3 °C) > TLw1 (38.7 °C) > Tw (32.2 °C), while, at 13:30 LT, TLw2 (42.9 °C) > TLw1 (38.9 °C) > Tw (33.1 °C).
By contrast to the west side, over the east side there is almost no temperature difference between TLe2 and TLe1. In particular, at 10:30 LT, TLe2 (43.6 °C) ≈ TLe1 (43.1 °C) > Te (34.6 °C), while at 13:30 LT, TLe2 (48.0 °C) ≈ TLe1 (48.5 °C) > Te (38.7 °C) (Figure 4 and Table 2). The fact that there is no temperature difference between TLe2 and TLe1 implies the absence of surface heat flow from land to sea at the east side. This is despite the fact that TLe1 exceeded Te. One could suggest that, in the close proximity of the eastern coastline, sea surface temperature was close to TLe1. If not, surface heat flow from land to sea at the east side would be observed.
The absence of surface heat flow from land to sea at the east side explains why TLe1 exceeded TLw1. This is because the heat flow from land to sea at the west side decreases land surface temperature TLw1, by contrast to TLe1 at the east side. As a result, TLe1 exceeded TLw1 by 10 °C at 13:30 LT, based on MODIS/Aqua records (Table 2). These satellite observations highlight a significant point that, in the hypersaline Dead Sea, spatial non-uniformity of SST causes spatial non-uniformity of LST over adjacent land areas.
In the nighttime (when cooling of land surface is faster than that of seawater surface) satellite data showed the presence of surface heat flow from sea to land over both the west and east sides of the Dead Sea. The full sequence of nighttime surface heat transfer from sea to land is characterized by the following temperature conditions: at 22:30 LT, based on MODIS/Terra data, at the west side: Tw (31.1 °C) > TLw1 (30.2 °C) > TLw2 (28.7 °C), while at the east side: Te (30.7 °C) > TLe1 (28.3 °C) > TLe2 (26.4 °C) (Figure 5 and Table 2). Similarly, based on MODIS/Aqua data at 01:30 LT, at the west side Tw (30.9 °C) > TLw1 (28.0 °C) > TLw2 (21.7 °C), while at the east side Te (30.4 °C) > TLe1 (26.8 °C) > TLe2 (23.7 °C) (Figure 5 and Table 2).
3.4. Decrease in Spatial Non-Uniformity of Dead Sea SST during the Study Period
Long-term changes in spatial non-uniformity of Dead Sea SST are determined by long-term trends in the temperature difference between Te and Tw. Our analysis showed that, in the presence of spatial non-uniformity of SST, regional atmospheric warming leads to a decrease in spatial non-uniformity of surface water heating year on year.
To obtain long-term trends in spatial non-uniformity of Dead Sea SST during the period under investigation, we use the slope of a linear fit. To estimate the significance level (p) value of the obtained surface temperature trends, normally distributed residuals of the linear fit were used in a t-test [23,24]. The obtained p-values less than 0.05 correspond to statistically significant surface temperature trends at the 95% confidence level.
Positive trends have been detected in air temperature over Israel, over the past several decades [25,26]. Over a limited area of the Dead Sea valley, the regional atmospheric warming is uniform. However, satellite MODIS data showed that the spatial distribution of daytime SST trends was non-uniform in the JAS summer months (July, August, September). Figure 6a represents the spatial distribution of daytime SST trends during the 15-year study period (2002–2016) at 10:30 LT based on MODIS-Terra records, and Figure 6b represents the spatial distribution of daytime SST at 13:30 LT based on the MODIS/Aqua records. On these maps, SST trends, averaged over the JAS summer months, are shown separately for each of the 16 pixels covering the east, middle, and west parts of the Dead Sea. One can see that, despite the uniformly distributed atmospheric warming, satellite SST measurements showed non-uniformity in daytime SST trends over various parts of the lake. Based on both MODIS/Terra data (Figure 6a) and MODIS/Aqua data (Figure 6b), positive SST trends over the pixels covering the west part of the lake are higher than those over the pixels covering the middle and east parts. The obtained positive trends in Dead Sea SST were observed in the absence of any positive trend in surface solar radiation [7].
To quantify trends in daytime SST, averaged separately over the east, middle, and west areas of the Dead Sea, we analyzed year-to-year variations of Te, Tm, and Tw during the study period (Figure 7). At 10:30 LT, MODIS/Terra showed statistically significant trends in SST over the west (~0.5 °C decade−1) and middle (~0.3 °C decade−1) parts of the lake, while the trend over the east part was statistically insignificant (~0.2 °C decade−1) (Figure 7a and Table 3). At 13:30 LT, MODIS/Aqua showed statistically significant trends in SST over the west (~0.6 °C decade−1) and middle (~0.3 °C decade−1) parts of the lake, while the trend over the east part was statistically insignificant and close to zero (~0.04 °C decade−1) (Figure 7b and Table 3).
In Figure 7a,b, the existing atmospheric warming in the Dead Sea valley was illustrated by the year-to-year variations of air temperature measured at the Sdom meteorological station (Tsdom) (31.03°N, 35.39°E) at the specified times when Terra and Aqua cover the Dead Sea. We found statistically significant increasing trends of 0.5 °C decade−1 at 10:30 LT (Figure 7a) and 0.6 °C decade−1 at 13:30 LT (Figure 7b), on average for the JAS summer months. We consider that atmospheric warming is the main factor contributing to the increasing trends in Dead Sea SST in the summer months. From year to year in the summer months, atmospheric warming, characterized by an increasing trend in air temperature, is expected to heat surface water at the west, middle, and east areas of the Dead Sea. If air temperature is higher than Dead Sea SST, this temperature difference creates heat flow from the atmosphere to the sea surface, consequently heating the surface water. The higher the temperature difference between air temperature and sea surface temperature, the stronger the heat flow from the atmosphere to the sea surface. This explains the obtained higher SST trends over the west side than over the east side, because the temperature difference between Tsdom and Tw was higher than the temperature difference between Tsdom and Te. The obtained zero trend in Te (based on MODIS/Aqua data at 13:30 LT) indicates that SST over the east part (Te) exceeded air temperature above the sea surface (Figure 7b).
With respect to changes in spatial non-uniformity of Dead Sea SST during the study period, temperature difference between daytime SST over the east and over the west parts steadily decreased during the study period at the rate of 0.32 °C decade−1, based on MODIS/Terra data (Figure 8a), and 0.54 °C decade−1, based on MODIS/Aqua data (Figure 8b). This is because trends in daytime SST over the west part of the Dead Sea were higher than trends over the east part of the lake.
3.5. Comparing Satellite-Based SST/LST Distribution with that Used in the WRF Atmospheric Model
For better understanding of regional atmospheric dynamics over the complex topography of the Dead Sea valley, model calculations are essential, as available observations are normally limited in space and time [21,27,28]. It is important to know how up-to-date regional atmospheric models describe skin temperature distribution over the Dead Sea valley. In this study, we used the high-resolution Weather Forecast and Research (WRF) mesoscale model daily simulations, conducted during August 2014. This WRF model with grid spacing of 1.1 km was used over the Dead Sea valley by Kunin et al. [21]. The WRF model skin temperature monthly distribution in August 2014 was obtained over land and sea in the Dead Sea valley at 10:30 LT and 13:30 LT, when Terra and Aqua cover the Dead Sea respectively (Figure 10). One can see that, at midday over the sea, WRF was incapable of reproducing the non-uniformity in SST (Figure 10). Moreover, over land areas adjacent to both the west and east sides of the lake, WRF incorrectly showed that modeled skin temperature increases with its approach to the coastline (Figure 10). This does not correspond to the satellite observations showing that: LST over land areas adjacent to the west side decreases with its approach to the coastline (TLw2 > TLw1 > Tw), while LST over land areas adjacent to the east side does not change with its approach to the coastline (TLe2 ≈ TLe1) (Figure 4). The application to modeling of the observed non-uniformity of SST/LST will improve modeling of atmospheric dynamics over the Dead Sea valley.
4. Discussion
Under uniform solar radiation, in the summer months, MODIS data on board the two satellites —Terra and Aqua—showed the pronounced spatial non-uniformity of daytime sea surface temperature (SST) of the Dead Sea, and of land surface temperature (LST) over areas adjacent to the Dead Sea. In Section 3.3, we compared temperature differences between land surface temperature over the adjacent (TLw1 and TLe1) and remote land areas (TLw2 and TLe2) to the west and to the east of the Dead Sea. This comparison implies the absence of surface heat flow at the east side and its presence at the west side. However, Te exceeded Tw by 5 °C. To explain this unexpected phenomenon, we assume the presence of spatial non-uniformity of surface wind speed over the Dead Sea.
As mentioned in the Introduction, because of the strong non-linear absorption of solar radiation, thermal layering is created from the water surface down to a depth of 3–4 m in the hypersaline Dead Sea. Consequently, the wind speed over the Dead Sea influences sea surface temperature. To explain the obtained spatial non-uniformity of daytime SST (Te > Tw), we assume that strong winds over the west part cause water mixing and sea surface cooling, whereas weak winds over the east part of the Dead Sea cannot create sea surface cooling (as they cannot create vertical water mixing similar to that over the west side). Note that there are no near-surface wind measurements over the whole area of Dead Sea water.
Over the east part of the lake, in the absence of both factors—cooling due to water mixing and surface heat flow from land to sea, daytime Te is determined mainly by solar radiation. By contrast to Te, Tw is determined not only by solar radiation but also by water mixing and cooling. As a result, Tw is lower than Te, even in the presence of daytime surface heat flow from land to sea at the west part of the lake.
In the absence of vertical water mixing under weak winds, strong solar radiation in the summer months leads to significant warming of sea surface water at the east side. This is supported by the fact that daytime SST could reach LST over the land area adjacent to the lake: at 13:30 LT, Te (38.7 °C) became close to TLw1 (38.9 °C) (Table 2). Such a phenomenon is rare and it has not been discussed in previous publications.
We found additional evidence that Te is determined mainly by solar radiation, based on a comparison between daytime Te in July and August during the study period. In particular, both MODIS/Terra and MODIS/Aqua data showed that Te in July was mainly higher than in August (Figure 11). This is in line with month-to-month variations of daily-averaged solar radiation, based on long-term pyranometer measurements taken at the Dead Sea buoy, during the 9-year period from 2005 to 2013 (Figure 12). It is seen that solar radiation in July was higher than in August, producing stronger solar heating of Dead Sea surface water in July than in August (Figure 12).
As mentioned in Section 2, in addition to MODIS data on board the Terra and Aqua satellites, we investigated the patterns of spatial distribution of daytime SST/LST in the summer months (July, August, September) using the 5-year period of Meteosat Second Generation LST records (2011–2015). The in-situ calibration of Meteosat Dead Sea SST measurements was carried out by Nehorai et al. [3]. Meteosat records showed that, at 11:00 LT, the 5-year average Te (39.5 °C) exceeded Tw (34.9 °C) by ~4.5 °C (Figure 13a). At 14:00 LT, Te (41.5 °C) exceeded Tw (35.4 °C) by ~6 °C (Figure 13b). Moreover, Meteosat records showed that the surface temperature over the land area adjacent to the east side of the lake (TLe1) was higher than the surface temperature over the land area adjacent to the west side (TLw1): at 11:00 LT, TLe1 (44.5 °C) exceeded TLw1 (39.0 °C) by 5.5 °C (Figure 13). At 14:00 LT, this exceedance was greater: TLe1 (47.4 °C) exceeded TLw1 (39.7 °C) by ~8 °C. Therefore, in addition to MODIS data on board the two orbital satellites—Terra and Aqua, Meteosat records (on board the geostationary satellite) proved the presence of pronounce spatial non-uniformity of daytime surface temperature of the Dead Sea and adjacent land areas (Figure 13). Our findings, based on LST measurements from the three satellites: Terra, Aqua, and Meteosat, support each other by showing similar results.
Our findings of similar spatial non-uniformity of surface temperature of the Dead Sea and adjacent land areas, based on measurements onboard the three above mentioned satellites, highlight the following essential point: under evenly distributed solar radiation, spatial non-uniformity of surface water temperature of this hypersaline lake was pronounced. This non-uniformity was clearly observed using LST data products of even 5 × 5 km spatial resolution.
Similarly to the Dead Sea, over other hypersaline lakes comparable in size with the Dead Sea (such as Lake Assal in Djibouti, Lake Urmia in Iran, and the Aral Sea between Kazakhstan and Uzbekistan), the spatial inhomogeneity of wind speed could cause spatial non-uniformity of water surface temperature (WST) accompanied by spatial non-uniformity of land surface temperature over adjacent land areas. The investigation of such phenomena and its application to modeling will advance the general understanding of WST-related atmospheric processes over all hypersaline lakes including the Dead Sea.
5. Conclusions
Pronounced spatial non-uniformity has been obtained of daytime sea surface temperature (SST) of the Dead Sea, and of land surface temperature (LST) over areas adjacent to the Dead Sea. This spatial non-uniformity was obtained in the summer months, under uniform solar radiation.
Our findings are based on MODIS data (2002–2016) on board the Terra and Aqua satellites. MODIS data showed that, on average for the 15-year study period, daytime SST over the east part of the lake exceeded by 5 °C that over the west part. This spatial non-uniformity in SST was accompanied by spatial non-uniform distribution of land surface temperature over areas adjacent to the Dead Sea. Based on MODIS data, LST over areas adjacent to the east side exceeded by 10 °C that over areas adjacent to the west side. The presence of pronounced spatial non-uniformity of SST/LST, based on MODIS data, was supported by Meteosat Second Generation LST records. Our findings, based on LST measurements from the three satellites: Terra, Aqua, and Meteosat, support each other.
We found that daytime SST could reach LST over the land area adjacent to the Dead Sea: at 13:30 LT, Te (38.7 °C) became close to TLw1 (38.9 °C) (Table 2). Such a phenomenon is rare, and it has not been discussed in previous publications.
We compared temperature differences between land surface temperature over the adjacent (TLw1 and TLe1) and remote land areas (TLw2 and TLe2) to the west and to the east of the Dead Sea. This comparison implies the absence of surface heat flow at the east side and its presence at the west side. This explains why daytime LST over land areas adjacent to the east side exceeded by 10 °C that over land areas adjacent to the west side of the Dead Sea, based on MODIS/Aqua records. These satellite observations highlight the following essential point: in the hypersaline Dead Sea, spatial non-uniformity of SST causes spatial non-uniformity of LST over adjacent land areas.
By contrast to the daytime, in the nighttime, when cooling of land surface is faster than that of seawater surface, satellite data showed the presence of surface heat flow from sea to land, over both the east and west sides of the Dead Sea. At night, spatial uniformity of SST was observed.
Our analysis showed that, in the presence of spatial non-uniformity of Dead Sea SST, regional atmospheric warming leads to a decrease in spatial non-uniformity of SST, year on year. Temperature difference between daytime SST over the east and over the west parts steadily decreased during the study period (2002–2016) at the rate of 0.32 °C decade−1, based on MODIS/Terra data, and 0.54 °C decade−1, based on MODIS/Aqua data.
It is important to know how up-to-date regional atmospheric models describe skin temperature distribution over the Dead Sea valley. We found that the WRF modeled distribution of skin temperature over land and sea does not correspond to satellite observations. At midday, over the sea, WRF was incapable of reproducing SST non-uniformity. Over land areas adjacent to both the west and east sides of the lake, WRF incorrectly showed that modeled skin temperature increases with its approach to the coastline. The application to modeling of the observed non-uniformity of SST/LST in existing regional models will improve modeling of atmospheric dynamics over the complex topography of the Dead Sea valley.
Our findings of spatial non-uniformity of daytime Dead Sea SST are essential for the better understanding of SST-related atmospheric processes, not only over the Dead Sea but also over other hypersaline lakes. Similarly to the Dead Sea, over other hypersaline lakes, comparable in size with the Dead Sea, the spatial inhomogeneity of wind speed could cause spatial non-uniformity of water surface temperature (WST) accompanied by spatial non-uniformity of land surface temperature over adjacent land areas. The investigation of such phenomena and its application to modeling will advance our knowledge of WST-related atmospheric processes over all hypersaline lakes including the Dead Sea.
Author Contributions
All co-authors equally contributed to methodology and writing of the current research article, P.K., B.S., R.T.P., P.K., and P.A.; WRF modeling, P.K. All authors have read and agreed to the published version of the manuscript.
Funding
This research received no external funding.
Acknowledgments
We thank the MODIS teams (PI Name: Zhengming Wan) that produced the data used in this study: Collections-6 of MODIS/Terra [29] and MODIS/Aqua [30] Level 3 LST data products. We thank Israel Oceanographic and Limnological Research (Isaac Gertman) for monthly data of surface solar radiation, based on pyranometer measurements taken at the Dead Sea buoy: these data were published by Kishcha et al. [7] as the supplement available online at https://doi.org/10.5194/nhess-18-3007-2018-supplement. We thank the Satellite Application Facility on Climate Monitoring (CM SAF) team for Meteosat LST records [20]. The current study was carried out in the framework of the DESERVE (DEad SEa Research VEnue) project (https://www.deserve-vi.net/) aimed at studying coupled lithospheric, hydrological, and atmospheric processes in the Dead Sea region [31]. We thank the Editors (Jean-Francois Crétaux, Rodrigo Abarca Del Rio, and Claude Duguay) and all reviewers for their helpful comments.
Conflicts of Interest
The authors declare no conflict of interest.
References
- Kiro, Y.; Weinstein, Y.; Starinsky, A.; Yechieli, Y. Groundwater ages and reaction rates during seawater circulation in the Dead Sea aquifer. Geochim. Cosmochim. Acta 2013, 122, 17–35. [Google Scholar] [CrossRef]
- Oren, A.; Shilo, M. Population dynamics of Dunaliella parva in the Dead Sea. Limnol. Oceanogr. 1982, 27, 201–211. [Google Scholar] [CrossRef]
- Nehorai, R.; Lensky, I.M.; Lensky, N.G.; Shiff, S. Remote sensing of the Dead Sea surface temperature. J. Geophys. Res. Ocean 2009, 114, C05021. [Google Scholar] [CrossRef]
- Mor, Z.; Assouline, S.; Tanny, J.; Lensky, I.M.; Lensky, N.G. Effect of water surface salinity on evaporation: The case of a diluted buoyant plume over the Dead Sea. Water Resour. Res. 2018, 54, 1460–1475. [Google Scholar] [CrossRef]
- Rimmer, A. Empirical classification of stratification patterns in warm monomictic lakes. Int. Ver. Theor. Angew. Limnol. Verh. 2006, 29, 1773–1776. [Google Scholar] [CrossRef]
- Rimmer, A.; Gal, G.; Opher, T.; Lechinsky, Y.; Yacobi, Y.Z. Mechanisms of long-term variations in the thermal structure of a warm lake. Limnol. Oceanogr. 2011, 56, 974–988. [Google Scholar] [CrossRef]
- Kishcha, P.; Pinker, R.; Gertman, I.; Starobinets, B.; Alpert, P. Observations of positive sea surface temperature trends in the steadily shrinking Dead Sea. Nat. Hazards Earth Syst. Sci. 2018, 18, 3007–3018. [Google Scholar] [CrossRef] [Green Version]
- Kishcha, P.; Starobinets, B.; Gertman, I.; Ozer, T.; Alpert, P. Observations of unexpected short-term heating in the uppermost layer of the Dead Sea after a sharp decrease in solar radiation. Int. J. Oceanogr. 2017. [Google Scholar] [CrossRef]
- Gertman, I.; Hecht, A. The Dead Sea hydrography from 1992 to 2000. J. Mar. Syst. 2002, 35, 169–181. [Google Scholar] [CrossRef] [Green Version]
- Hecht, A.; Gertman, I. Dead Sea meteorological climate. In Book Fungal Life in the Dead Sea; Nevo, E., Oren, A., Wasser, S.P., Eds.; A.R.G. Ganter: Ruggell, Liechtenstein, 2003; pp. 68–114. [Google Scholar]
- Stanhill, G. Changes in the surface temperature of the Dead Sea and its heat storage. Int. J. Climatol. 1990, 10, 519–536. [Google Scholar] [CrossRef]
- Nehorai, R.; Lensky, N.; Brenner, S.; Lensky, I. The Dynamics of the Skin Temperature of the Dead Sea. Adv. Meteorol. 2013. [Google Scholar] [CrossRef]
- Arnon, A.; Lensky, N.G.; Selker, J.S. High-resolution temperature sensing in the Dead Sea using fiber optics. Water Resour. Res. 2014, 50, 1756–1772. [Google Scholar] [CrossRef]
- O’Reilly, C.M.; Sharma, S.; Gray, D.K.; Hampton, S.E.; Read, J.S.; Rowley, R.J.; Schneider, P.; Lenters, J.D.; McIntyre, P.B.; Kraemer, B.M.; et al. Rapid and highly variable warming of lake surface waters around the globe. Geophys. Res. Lett. 2015, 42, 10773–10781. [Google Scholar] [CrossRef] [Green Version]
- Wan, Z.; Dozier, J. A generalized split-window algorithm for retrieving land-surface temperature from space. IEEE Trans. Geosci. Remote Sens. 1996, 34, 892–905. [Google Scholar] [CrossRef] [Green Version]
- Wan, Z. New refinements and validation of the Collection-6 MODIS land-surface temperature/emissivity products. Remote Sens. Environ. 2014, 140, 36–45. [Google Scholar] [CrossRef]
- Crosman, E.; Vazquez-Cuervo, J.; Chin, T.M. Evaluation of the multi-scale ultra-high resolution (MUR) analysis of lake surface temperature. Remote Sens. 2017, 9, 723. [Google Scholar] [CrossRef] [Green Version]
- Emery, W.J.; Castro, S.; Wick, G.A.; Schluessel, P.; Donlon, C. Estimating sea surface temperature from infrared satellite and in situ temperature data. Bull. Am. Meteorol. Soc. 2001, 82, 2773–2785. [Google Scholar] [CrossRef] [Green Version]
- CERSAT Defining Sea Surface Temperature. Available online: http://cersat.ifremer.fr/oceanography-from-space/our-domains-of-research/sea-surface-temperature/what-is-sst (accessed on 27 December 2019).
- Duguay–Tetzlaff, A.; Stöckli, R.; Bojanowski, J.; Hollmann, R.; Fuchs, P.; Werscheck, M. CM SAF Land SUrface Temperature Dataset from METeosat First and Second Generation—Edition 1 (SUMET Ed. 1); Satellite Application Facility on Climate Monitoring, EUMETSAT: Darmstadt, Germany, 2017; Available online: https://doi.org/10.5676/EUM_SAF_CM/LST_METEOSAT/V001 (accessed on 27 December 2019).
- Kunin, P.; Alpert, P.; Rostkier-Edelstein, D. Investigation of sea-breeze/foehn in the Dead Sea valley employing high resolution WRF and observations. Atmos. Res. 2019, 229, 240–254. [Google Scholar] [CrossRef]
- Tewari, M.; Chen, F.; Wang, W.; Dudhia, J.; LeMone, M.A.; Mitchell, K.; Ek, M.; Wegiel, J.; Cuenca, R.H. Numerical Experiments with Upgraded WRF/NOAHLSM Model. Available online: https://ams.confex.com/ams/Annual2005/techprogram/paper_87342.htm (accessed on 27 December 2019).
- Shapiro, S.S.; Wilk, M.B. An analysis of variance test for normality (complete samples). Biometrika 1965, 52, 591–611. [Google Scholar] [CrossRef]
- Razali, N.M.; Wah, Y.B. Power comparisons of Shapiro-Wilks, Kolmogorov-Smirnov, Lilliefors and Anderson-Darling tests. J. Stat. Modeling Anal. 2011, 2, 21–33. [Google Scholar]
- Yosef, Y.; Aguilar, E.; Alpert, P. Detecting and adjusting artificial biases of long-term temperature records in Israel. Int. J. Climatol. 2018, 38, 3273–3289. [Google Scholar] [CrossRef]
- Salameh, A.; Gámiz-Fortis, S.; Castro-Díez, Y.; Abu-Hammad, A.; Esteban-Parra, M. Spatio-temporal Analysis for Extreme Temperature Indices over Levant region. Int. J. Climatol. 2019, 1–27. [Google Scholar] [CrossRef]
- Vüllers, J.; Mayr, G.J.; Corsmeier, U.; Kottmeier, C. Characteristics and evolution of diurnal foehn events in the Dead Sea valley. Atmos. Chem. Phys. 2018, 18, 18169–18186. [Google Scholar] [CrossRef] [Green Version]
- Kishcha, P.; Starobinets, B.; Savir, A.; Alpert, P.; Kaplan, A. Foehn-induced effects on dust pollution, frontal clouds and solar radiation in the Dead Sea valley. Meteorol. Atmos. Phys. 2017, 130, 295–309. [Google Scholar] [CrossRef]
- LP DAAC Land Processes Distributed Active Archive Center: MOD11C3.006 MODIS/Terra Land Surface Temperature/Emissivity Monthly L3 Global 0.05Deg CMG V006, USGS Earth Resources Observation and Science (EROS) Center, Sioux Falls, South Dakota. Available online: https://e4ftl01.cr.usgs.gov/MOLT/MOD11C3.006/ (accessed on 27 December 2019).
- LP DAAC Land Processes Distributed Active Archive Center: MYD11C3.006 MODIS/Aqua Land Surface Temperature/Emissivity Monthly L3 Global 0.05Deg CMG V006, USGS Earth Resources Observation and Science (EROS) Center, Sioux Falls, South Dakota. Available online: https://e4ftl01.cr.usgs.gov/MOLA/MYD11C3.006/ (accessed on 27 December 2019).
- Kottmeier, C.; Agnon, A.; Al-Halbounib, D.; Alpert, P.; Corsmeier, U.; Dahm, T.; Eshel, A.; Geyer, S.; Haas, M.; Holohan, E.; et al. New perspectives on interdisciplinary earth science at the Dead Sea: The DESERVE project. Sci. Total Environ. 2015, 544, 1045–1058. [Google Scholar] [CrossRef] [PubMed] [Green Version]
Figure 1.
Map of the region under study. Columns 1 and 2 represent pixels covering land areas to the west of the Dead Sea, while columns 6 and 7 represent pixels covering land areas to the east of the lake. Columns 3 to 5 show pixels covering the west, middle and east parts of the Dead Sea respectively. TLw1, TLw2, TLe1, and TLe2 designate land surface temperature averaged over the land areas to the west and east of the lake, while Tw, Tm, and Te designate sea surface temperature averaged over the western, middle, and eastern Dead Sea respectively. The black triangle shows the location of the Sdom meteorological station (31.03°N, 35.39°E).

Figure 2.
Maps of the 15-year mean spatial distribution of daytime SST at (a) 10:30 LT based on MODIS-Terra data (2002–2016), and (b) 13:30 LT based on MODIS-Aqua data (2002–2016), averaged over the JAS summer months. On these maps, SST is shown separately for each of the 16 pixels covering the west, middle and east parts of the Dead Sea. Tw, Tm, and Te designate daytime SST averaged over the west, middle, and east parts of the Dead Sea respectively (Table 1).

Figure 3.
Histograms of the temperature difference between daytime and nighttime SST over the east, middle, and west parts of the Dead Sea in the JAS summer months. The left panel represents histograms based on the 15-year record of MODIS-Terra monthly data (2002–2016), while the right panel represents histograms based on the 15-year record of MODIS-Aqua monthly data (2002–2016). The height of each column represents frequency of the events when the temperature difference appeared in the corresponding interval of 0.5 degrees on the x-axis.

Figure 4.
The 15-year averaged MODIS-Terra (a) and MODIS-Aqua (b) monthly means (2002–2016) of daytime sea surface temperature (in blue) over the east (Te), middle (Tm), and west (Tw) parts of the Dead Sea, together with land surface temperature over the land areas (in brown) to the west (TLw1, TLw2) and to the east (TLe1, TLe2) sides of the Dead Sea. The same designations are used for the temperatures as in Figure 1.

Figure 5.
The 15-year averaged MODIS-Terra (a) and MODIS-Aqua (b) monthly means (2002–2016) of nighttime sea surface temperature (in blue) over the east (Te), middle (Tm), and west (Tw) parts of the Dead Sea, together with land surface temperature over the land areas (in brown) to the west (TLw1, TLw2) and to the east (TLe1, TLe2) sides of the Dead Sea.

Figure 6.
Maps of spatial distribution of daytime SST trends (°C decade−1) during the 15-year study period (2002–2016) at (a) 10:30 LT based on MODIS-Terra records, and (b) 13:30 LT based on MODIS-Aqua records, averaged over the JAS summer months. On these maps, SST trends are shown separately for each of the 16 pixels covering the west, middle and east parts of the Dead Sea. aw, am, and ae designate daytime SST trends over the west, middle, and east areas of the Dead Sea respectively.

Figure 7.
Year-to-year variations during the study period (2002–2016) of daytime Dead Sea SST averaged over the east (Te), middle (Tm), and west (Tw) parts of the Dead Sea in the JAS summer months at (a) 10:30 LT (based on MODIS/Terra data) and (b) 13:30 LT (based on MODIS/Aqua data). The black lines represent year-to-year variations in near-surface air temperature measured at the Sdom meteorological station at 10:30 LT and 13:30 LT, respectively. The straight lines designate linear fits.

Figure 8.
Year-to-year variations during the study period (2002–2016) of the temperature difference between daytime SST over the east and west parts of the Dead Sea (Te - Tw) in the JAS summer months at (a) 10:30 LT (based on MODIS-Terra data) and (b) 13:30 LT (based on MODIS-Aqua data). The straight lines designate a linear fit.

Figure 9.
Year-to-year variations during the study period (2002–2016) of nighttime Dead Sea SST averaged over the east (Te), middle (Tm), and west (Tw) parts of the Dead Sea in the JAS summer months at (a) 22:30 LT (based on MODIS/Terra data) and (b) 01:30 LT (based on MODIS/Aqua data). The straight lines designate linear fits.

Figure 10.
The WRF model skin temperature monthly distribution in August 2014 obtained over land and sea in the Dead Sea valley at (a) 10:30 LT and (b) 13:30 LT, when Terra and Aqua cover the Dead Sea respectively.
Figure 10.
The WRF model skin temperature monthly distribution in August 2014 obtained over land and sea in the Dead Sea valley at (a) 10:30 LT and (b) 13:30 LT, when Terra and Aqua cover the Dead Sea respectively.

Figure 11.
Comparison between changes in daytime sea surface temperature over the eastern Dead Sea (Te) in July and August, based on (a) MODIS/Terra data at 10:30 LT, and (b) MODIS/Aqua data at 13:30 LT, during the 15-year study period (2002–2016).
Figure 11.
Comparison between changes in daytime sea surface temperature over the eastern Dead Sea (Te) in July and August, based on (a) MODIS/Terra data at 10:30 LT, and (b) MODIS/Aqua data at 13:30 LT, during the 15-year study period (2002–2016).

Figure 12.
Seasonal variations of the 9-year mean (2005–2013) surface solar radiation (SR), based on pyranometer measurements taken at the Dead Sea buoy. The vertical lines designate the standard deviation.
Figure 12.
Seasonal variations of the 9-year mean (2005–2013) surface solar radiation (SR), based on pyranometer measurements taken at the Dead Sea buoy. The vertical lines designate the standard deviation.

Figure 13.
The 5-year averaged Meteosat monthly means of daytime sea surface temperature (in blue) over the east (Te), middle (Tm), and west (Tw) parts of the Dead Sea, together with land surface temperature over the land areas (in brown) adjacent to the west (TLw1, TLw2) and to the east (TLe1, TLe2) sides of the Dead Sea at (a) 11:00 LT and (b) 14:00 LT.


Table 1.
The 15-year averaged MODIS-Terra and MODIS-Aqua monthly means of sea surface temperature data (°C) over the east (Te), middle (Tm), and west (Tw) parts of the Dead Sea together with their standard deviation (SD) in each of the summer months (July, August, and September), as well as average for the JAS summer months.
| Area | Parameter | July | August | September | JAS | ||||
|---|---|---|---|---|---|---|---|---|---|
| Day | Night | Day | Night | Day | Night | Day | Night | ||
| MODIS–Terra (2002–2016) | |||||||||
| 31.4°N–31.7°N; 35.5°E–35.55°E | Te ± SD | 35.5 ± 0.5 | 31.2 ± 0.5 | 35.2 ± 0.5 | 31.5 ± 0.5 | 33.1 ± 0.4 | 29.4 ± 0.4 | 34.6 ± 0.4 | 30.7 ± 0.4 |
| 31.4°N–31.65°N; 35.45°E–35.5°E | Tm ± SD | 32.1 ± 0.5 | 31.5 ± 0.5 | 32.3 ± 0.5 | 32.0 ± 0.5 | 30.8 ± 0.4 | 30.2 ± 0.4 | 31.7 ± 0.4 | 31.2 ± 0.4 |
| 31.35°N–31.6°N; 35.4°E–35.45°E | Tw ± SD | 32.7 ± 0.5 | 31.5 ± 0.5 | 32.7 ± 0.5 | 32.0 ± 0.5 | 31.2 ± 0.4 | 30.0 ± 0.5 | 32.2 ± 0.4 | 31.1 ± 0.4 |
| MODIS–Aqua (2002–2016) | |||||||||
| 31.4°N–31.7°N; 35.5°E–35.55°E | Te ± SD | 39.8 ± 0.5 | 30.8 ± 0.5 | 39.2 ± 0.5 | 31.1 ± 0.5 | 36.9 ± 0.4 | 29.4 ± 0.5 | 38.7 ± 0.4 | 30.4 ± 0.5 |
| 31.4°N–31.65°N; 35.45°E–35.5°E | Tm ± SD | 33.3 ± 0.4 | 31.3 ± 0.5 | 33.5 ± 0.4 | 31.8 ± 0.5 | 31.9 ± 0.6 | 30.1 ± 0.5 | 32.9 ± 0.4 | 31.0 ± 0.4 |
| 31.35°N–31.6°N; 35.4°E–35.45°E | Tw ± SD | 33.6 ± 0.5 | 31.2 ± 0.5 | 33.7 ± 0.5 | 31.6 ± 0.5 | 32.1 ± 0.5 | 29.9 ± 0.5 | 33.1 ± 0.5 | 30.9 ± 0.4 |
Table 2.
The 15-year averaged MODIS-Terra and MODIS-Aqua monthly means (2002–2016) of the following surface temperature data: (1) sea surface temperature (°C) over the east (Te), middle (Tm), and west (Tw) parts of the Dead Sea; and (2) land surface temperature over the land areas to the west (TLw1, TLw2) and to the east (TLe1, TLe2). together with their standard deviation (SD) (°C) on average for the JAS summer months.
| Area | Parameter | JAS | |
|---|---|---|---|
| 10:30 LT | 22:30 LT | ||
| MODIS–Terra | |||
| 31.4°N–31.7°N; 35.6°E–35.65°E | TLe2 ± SD | 43.6 ± 0.4 | 26.4 ± 0.5 |
| 31.4°N–31.7°N; 35.55°E–35.6°E | TLe1 ± SD | 43.1 ± 0.4 | 28.3 ± 0.5 |
| 31.4°N–31.7°N; 35.5°E–35.55°E | Te ± SD | 34.6 ± 0.4 | 30.7 ± 0.4 |
| 31.4°N–31.65°N; 35.45°E–35.5°E | Tm ± SD | 31.7 ± 0.4 | 31.2 ± 0.4 |
| 31.35°N–31.6°N; 35.4°E–35.45°E | Tw ± SD | 32.2 ± 0.4 | 31.1 ± 0.4 |
| 31.35°N–31.6°N; 35.35°E–35.4°E | TLw1 ± SD | 38.7 ± 0.4 | 30.2 ± 0.4 |
| 31.35°N–31.6°N; 35.3°E–35.35°E | TLw2 ± SD | 44.3 ± 0.4 | 28.7 ± 0.5 |
| MODIS–Aqua | |||
| 13:30 LT | 01:30 LT | ||
| 31.4°N–31.7°N; 35.6°E–35.65°E | TLe2 ± SD | 48.0 ± 0.5 | 23.7 ± 0.6 |
| 31.4°N–31.7°N; 35.55°E–35.6°E | TLe1 ± SD | 48.5 ± 0.4 | 26.8 ± 0.5 |
| 31.4°N–31.7°N; 35.5°E–35.55°E | Te ± SD | 38.7 ± 0.4 | 30.4 ± 0.5 |
| 31.4°N–31.65°N; 35.45°E–35.5°E | Tm ± SD | 32.9 ± 0.4 | 31.0 ± 0.4 |
| 31.35°N–31.6°N; 35.4°E–35.45°E | Tw ± SD | 33.1 ± 0.5 | 30.9 ± 0.4 |
| 31.35°N–31.6°N; 35.35°E–35.4°E | TLw1 ± SD | 38.9 ± 0.4 | 28.0 ± 0.4 |
| 31.35°N–31.6°N; 35.3°E–35.35°E | TLw2 ± SD | 42.9 ± 0.5 | 21.7 ± 0.5 |
Table 3.
The slope (α) of the obtained linear fit during the 15-year study period (2002-2016) of the following parameters: (1) near-surface air temperature taken at the meteorological station Sdom (Tsdom); (2) SST over the east (Te), middle (Tm), and west (Tw) sides of the Dead Sea; (3) temperature difference (dT) between daytime Te and Tw at 10:30 LT (based on MODIS-Terra records). In addition, the slope (α) of the obtained linear fit during the 15-year study period of Te, Tm, Tw, and dT at 13:30 LT (based on MODIS-Aqua records) are presented. The decision based on the Shapiro–Wilk normality test for residuals (SW Test) and the significance level (p) are also displayed. If the p-value was too high as compared with the 0.05 significance level, the obtained linear fit was considered as statistically insignificant.
| Parameter (°C) | Months | α (°C decade−1) | SW Test | p |
|---|---|---|---|---|
| Tsdom ; 10:30 LT | JAS | 0.54 | Normal | 0.050 |
| Tsdom ; 13:30 LT | IAS | 0.58 | Normal | 0.050 |
| Te ; 10:30 LT, Terra | JAS | 0.22 | Normal | Not significant |
| Tm ; 10:30 LT, Terra | JAS | 0.36 | Normal | 0.050 |
| Tw ; 10:30 LT, Terra | JAS | 0.52 | Normal | 0.020 |
| dT = Te - Tw ; 10:30 LT, Terra | JAS | −0.32 | Normal | 0.001 |
| Te ; 22:30 LT, Terra | JAS | 0.16 | Normal | Not significant |
| Tm ; 22:30 LT, Terra | JAS | 0.07 | Normal | Not significant |
| Tw ; 22:30 LT, Terra | JAS | 0.01 | Normal | Not significant |
| Te ; 13:30 LT, Aqua | JAS | 0.04 | Normal | Not significant |
| Tm ; 13:30 LT, Aqua | JAS | 0.35 | Normal | 0.050 |
| Tw ; 13:30 LT, Aqua | JAS | 0.58 | Normal | 0.006 |
| dT = Te - Tw ; 13:30 LT, Aqua | JAS | −0.54 | Normal | 0.001 |
| Te ; 01:30 LT, Aqua | JAS | 0.27 | Normal | Not significant |
| Tm ; 01:30 LT, Aqua | JAS | 0.40 | Normal | Not significant |
| Tw ; 01:30 LT, Aqua | JAS | 0.35 | Normal | Not significant |
© 2019 by the authors. Licensee MDPI, Basel, Switzerland. This article is an open access article distributed under the terms and conditions of the Creative Commons Attribution (CC BY) license (http://creativecommons.org/licenses/by/4.0/).
Share and Cite
MDPI and ACS Style
Kishcha, P.; Starobinets, B.; Pinker, R.T.; Kunin, P.; Alpert, P. Spatial Non-Uniformity of Surface Temperature of the Dead Sea and Adjacent Land Areas. Remote Sens. 2020, 12, 107. https://doi.org/10.3390/rs12010107
AMA Style
Kishcha P, Starobinets B, Pinker RT, Kunin P, Alpert P. Spatial Non-Uniformity of Surface Temperature of the Dead Sea and Adjacent Land Areas. Remote Sensing. 2020; 12(1):107. https://doi.org/10.3390/rs12010107
Chicago/Turabian StyleKishcha, Pavel, Boris Starobinets, Rachel T. Pinker, Pavel Kunin, and Pinhas Alpert. 2020. "Spatial Non-Uniformity of Surface Temperature of the Dead Sea and Adjacent Land Areas" Remote Sensing 12, no. 1: 107. https://doi.org/10.3390/rs12010107
Note that from the first issue of 2016, this journal uses article numbers instead of page numbers. See further details here.