Crop Sensor-Based In-Season Nitrogen Management of Wheat with Manure Application


NEIKER-Basque Institute for Agricultural Research and Development, Berreaga 1, 48160 Derio, Biscay, Spain
*
Author to whom correspondence should be addressed.
Remote Sens. 2019, 11(9), 1094; https://doi.org/10.3390/rs11091094
Submission received: 4 April 2019
/
Revised: 2 May 2019
/
Accepted: 6 May 2019
/
Published: 8 May 2019
(This article belongs to the Special Issue Remote Sensing for Precision Nitrogen Management)
Abstract
:It is difficult to predict the crop-available nitrogen (N) from farmyard manures applied to soil. The aim of this study was to assess the usefulness of the proximal sensors, Yara N-TesterTM and RapidScan CS-45, for diagnosing the N nutritional status of wheat after the application of manures at sowing. Three annual field trials were established (2014–2015, 2015–2016 and 2016–2017) with three types of fertilizer treatments: dairy slurry (40 t ha−1 before sowing), sheep manure (40 t ha−1 before sowing) and conventional treatment (40 kg N ha−1 at tillering). For each treatment, five different mineral N fertilization doses were applied at stem elongation: 0, 40, 80, 120, and 160 kg N ha−1. The proximal sensing tools were used at stem elongation before the application of mineral N. Normalized values of the proximal sensing look promising for adjusting mineral N application rates at stem elongation. For dairy slurry, when either proximal sensor readings were 60–65% of the reference plants with non-limiting N, the optimum N rate for maximizing yield was 118–128 kg N ha−1. When the readings were 85–90%, the optimum N rate dropped to 100–110 kg N ha−1 for both dairy slurry and conventional treatments. It was difficult to find a clear relationship between sensor readings and yield for sheep manure treatments. Measurements taken with RapidScan C-45 were less time consuming and better represent the spatial variation, as they are taken on the plant canopy. Routine measurements throughout the growing season are particularly needed in climates with variable rainfall. The application of 40 kg N ha−1 at the end of winter is necessary to ensure an optimal N status from the beginning of wheat crop development. These research findings could be used in applicator-mounted sensors to make variable-rate N applications.

1. Introduction
Few cereal agroecosystems supply enough nitrogen (N) to sustain satisfactory crop production without fertilizers. To ensure that the potential yield is reached each year, fertilizers are often applied in excessive quantities, causing N loss to the atmosphere and water. In agricultural systems, mineral N is mainly lost through ammonia volatilization, denitrification and leaching [1]. Correct dose and application timing of N fertilizer is important so that crops make best use of the N applied with minimum risk of losses and adverse environmental impacts.
Agronomic decisions in cereals are implemented by using a growth-stage key which provides a common reference for describing crop development. Management by growth stage is critical to optimize N fertilization strategies. The Zadoks Cereal Growth-Stage Key [2] is the most commonly used growth-stage key for cereals, in which the development of the cereal plant is divided into 10 distinct development phases covering 100 individual growth stages. Individual growth stages are denoted by the prefix GS (growth stage). The principle Zadoks growth stages used in relation to N management are the beginning of tillering (GS21) and beginning of stem elongation (GS30). GS21 is the stage when tillers (lateral shoots emerging at the base of the main stem of the plant) start emerging. Each tiller has the potential to produce a spike. GS30 is the stage in which the final spikelet can be observed within the stem of the main tiller.
The application of fertilizers consists of two methods, basal application and topdressing application. In the former, fertilizers are distributed over the field and mixed with soil before sowing. In the latter, fertilizers are applied in the soil surface. In cereal crops, local farmers commonly apply organic manures as basal fertilizers rotationally every two or three years. Organic manures are typically applied as a basal dressing before sowing due to the humid climate in winter and spring that usually hinders the entrance of machinery to fields. The application of organic fertilizers is generally combined with the application of mineral fertilizers. Conversely, when organics are not applied as initial fertilizers, mineral N is applied in two topdressing applications: 40 kg N ha−1 at GS21 to encourage tillering and a second and greater application at GS30.
Organic manure is a heterogeneous material collected from livestock raising facilities. The manure’s physical status depends on farm practice and storage conditions. Farmyard manures are solids that are commonly mixed with lignocellulosic bedding materials. Slurries are liquids generated by mixing the solid manures with wastewater, washing water or urine. In recent decades, with the rise in livestock industry, the disposal of these farmyard manures and slurries has increased [3]. There is an excess of manure in many regions around the world, and the amount of manure available for land application is increasing [4]. The application of these manures into agricultural soil allows the recycling of their nutrient value for fertilizing crops and increasing soil fertility, making better use of resources and economic sense [5]. However, organic manures can pose a considerable environmental risk if they are not carefully treated and applied. It is important to point out that the N applied with the organic manures is generally less available to crops than N in mineral fertilizers [5]. In addition, it is difficult to predict the amount of available N from organic manures for crops since nutrient mineralization from manures is influenced by manure characteristics, soil and environmental temperature, soil moisture, soil properties and microbial activity [1]. The capacity of the soil itself must be taken into account in order to provide N to crops and to improve cereal N fertilizer recommendations. In this sense, soil organic matter (SOM) is one of the most relevant soil compounds, as it has been reported that SOM accounted for 78% of the variation in mineralizable N, whereas other soil properties only accounted for 8% [6]. N mineralization in SOM is enhanced by increasing temperature [7] and when soil moisture is near field capacity [8]. It must not be forgotten that the weather varies considerably from year to year, causing large differences in yield potential in the same site [9,10]; consequently, crop N fertilizer demand widely varies.
In Western Europe, a soil test for estimating available mineral N (ammonium plus nitrate) in the soil profile has been widely used to measure the quantity of N fertilizer which needs to be applied. The technique is called Nmin-method. Generally, for winter wheat (as for many other crops), crop N need is calculated at the end of winter or early spring based on a target yield. The recommended rate of N fertilizer is calculated by the predicted N demand for the target yield minus the measured soil Nmin value at the end of winter, where the rapid period of crop growth starts. Even if soil analysis should give reliable information, it is often perceived as imprecise for several reasons [11]. In fact, translating a few values of the soil samplings to a heterogeneous field makes the method imprecise. Apart from that, both the sampling and the determination of Nmin require time-consuming procedures.
The plant itself is considered a relevant indicator of N availability from any origin (organic manure, soil N supply or mineral fertilizer) within the growing season. Strategies based on plant indicators have been developed for the adjustment of N fertilizer application during the growing season. Ravier et al. [11] showed some decision rules for determining N fertilizer application on the basis of the crop Nitrogen Nutrition Index (NNI). The NNI is calculated relative to the critical N concentration of the aerial parts of the crop defined as the minimal concentration required for the maximum production of aerial dry matter [12]. However, NNI determination requires destructive and time-consuming procedures of the plant N content and crop biomass which make it impractical for farmers.
Various types of optical sensing tools have been developed for assessing the N status of plants within the growing season [13,14]. However, these tools are unable to measure N content of the crop directly [15], therefore they are based on the measurement of compounds, such as chlorophyll [12]. Optical crop sensing is relatively easy to perform, and a range of sensing techniques and sensors are commercially available [13]. Regarding transmission or absorption sensors, hand-held chlorophyll meters such as Yara N-TesterTM can provide rapid results for diagnostic purposes [14,16]. Chlorophyll meter readings have been widely proven to be well correlated with leaf chlorophyll and N concentrations in wheat; therefore, chlorophyll content can be used to diagnose the N status of plants [17,18,19], making them interesting tools for modulating the N rate. Furthermore, they can be used to decide whether a supplementary dose is to be applied in order to increase grain N content [8,20]. The use of chlorophyll meter measurements as an alternative to the NNI has been tested [21,22,23].
When considering reflectance sensors, ground-based active crop canopy reflectance sensors have been identified as potentially valuable tools for site-specific N management in cereals [24,25,26], because these sensors are not affected by clouds, unlike aerial or satellite sensing. Ground-based sensors have been developed to assess the plant nutritional status and guide variable-rate N application for different grain crops [15,23,27]. Spectral data collected by RapidScan CS-45 is converted into canopy green area measurements by calculating vegetation indices such as the Normalized Difference Vegetation Index (NDVI) or Normalized Difference Red Edge (NDRE). Marti et al. [28] found significant correlations between the NDVI, yield and biomass in wheat. Lu et al. [29] determined that RapidScan CS-45 was useful for non-destructively estimating the NNI of rice and Li et al., 2018 [30] showed a great potential for monitoring rice leaf N status. Similarly, Bonfil et al., 2017 [31] showed that the use of RapidScan CS-45 allows rapid and accurate crop monitoring and yield estimation. Zhang et al., 2019 [32] predicted grain yield based on RapidScan CS-45 measurements. In a previous study, we demonstrated that the normalized readings of the proximal sensing tools, Yara N-TesterTM (chlorophyll meter) and RapidScan CS-45 (ground-based active-light proximal sensor), were good indicators of the N nutritional status of the plant, as the NNI or Nmin. The mineral fertilizer rate applied at stem elongation (GS30, following Zadoks et al., 1994 [2]) could be modulated with the use of those tools [33].
In this study, we annex a third year when the weather conditions in spring after the second and greater N application at GS30 were very dry (it did not rain in the following 20 days after application) in comparison with the first two years. The climate of the area is Temperate–Mediterranean according to the temperature regime of the Papadakis classification and humid Mediterranean according to the water regime [34], with an average rainfall of 779 mm year−1 and an average annual temperature of 11.5 °C. This climate covers a great portion of the territory of Araba (The Basque Country, norther Spain) and, although it is classified as Mediterranean, maritime and temperate characteristics are very evident [35]. In this area, three of the ten years have dry periods around the second and greater application at GS30 (media 1978–2017; period 15 March–1 May), as in the third year of this study. Weather conditions are variable from year to year [33] and the mineralization of nutrients from SOM and farmyard manures is influenced by many factors such as manure characteristics, soil and air temperature, soil moisture, soil properties and microbial activity [8]. Therefore, making the prediction of the N needed by the crop in different situations is necessary but complicated. Yara N-TesterTM and RapidScan CS-45 have shown promise for making N recommendations [17,19,20,29,30,32] and provide a practical and affordable option for on-farm implementation. The aim of this study was to assess the usefulness of the proximal sensing tools, Yara N-TesterTM and RapidScan CS-45, for adjusting the optimum N rate at GS30 when farmyard manures are applied before sowing in the variable humid Mediterranean climate conditions. We also aimed to decide whether the 40 kg N ha−1 rate at GS21 is necessary when organic manures are applied as basal fertilizers. In addition, the utility of a reference area on the field with non-limited N supply is questioned [14], making the diagnosis more complicated for farmers.
2. Materials and Methods
Three field trials were established in Arkaute (Araba, Basque Country, Spain) at NEIKER-Tecnalia facilities (42 °85′N, 2 °62′W; elevation 515 m above sea level) in three consecutive wheat-growing seasons: 2014–2015, 2015–2016 and 2016–2017 (defined as 2015, 2016 and 2017) in different fields under rainfed conditions. There was a 130-meter (m) distance between the three field trials. In the field trial carried out in 2015, a soil pit was made and after describing and analyzing its horizons, the soil was classified as Hypercalcic Kastanozem [36]. The mineralogical properties of the soil were analyzed by X-ray diffraction. The soil contained 40% clay (clay < 2 µm: Illite (%) = 30; Kaolinite (%) = 12; Smectite (%) = 58). In the field trials carried out in 2016 and 2017, several prospective holes were observed, verifying that the three soils had similar characteristics. The three fields were flat.
Representative soil samples were taken from each field trial to analyze the physical and chemical properties before wheat sowing from depths of 0–30 and 30–60 centimeter (cm). Soil texture was analyzed by the Pippete method [37] and classified (0–30 cm, sandy clay loam and 30–60cm, clay loam) [38]. Soils that had high pH values (1:2.5 soil:water using a pH-Meter CG840; 8.0–8.5), were calcareous (3.6–58% according to soil depth) [39] and had moderate organic matter content [40] in the upper layer (2–2.5%).
2.1. Experimental Setup and Treatments
In the area (Figure 1) where this study was carried out (Araba, Basque Country, norther Spain), the application of organic fertilizers is generally combined with the application of mineral fertilizers. Farmyard manures are typically applied as a basal dressing before sowing. For mineral fertilizers, an application is made at GS21 [2] and the last and greater mineral N dressing application is made at GS30 [2].
Three kinds of initial fertilization were applied: dairy slurry (40 tons per hectare t ha−1), sheep farmyard manure (40 t ha−1) and conventional treatment (no organic fertilizer basal dressing and 40 kg N ha−1 at tillering). These three types of fertilization were combined with five N rates (calcium ammonium nitrate, NAC 27%) in the topdressings applied at GS30 (0, 40, 80, 120 and 160 kg N ha−1). Apart from the treatments, two controls were established: a control without N fertilization (0N) and an overfertilized control plot (80 kg N ha−1; 80 kg N ha−1 applied at tillering and 200 kg N ha−1 applied at GS30; Table 1). The experiment was a factorial randomized complete block design with three factors (year, initial fertilization and N rate at GS30) and four replicates. The area of each plot was 4 m in width and 8 m in length.
Organic amendments were applied on 13 November 2014, 4 November 2015 and 17 November 2016. Slurry and manure were sampled and analyzed for total N and NH4+–N (Table 1). We decided to apply manure at 40 t ha−1 and slurry at 40 t ha−1 because this is the usual rate at which organic amendments are applied as initial fertilizers in Araba, Basque Country, Spain.
Wheat (Triticum aestivum var. Cezanne) was sown on 24 November 2014, 06 November 2015 and 18 November 2016, and was harvested on 21 July 2015, 2 August 2016 and 2 August 2017. The sowing rate was 220 kg seed ha−1. The preceding crops were flax (Linum usitatissimum), rapeseed (Brassica napus) and wheat (Triticum aestivum), respectively.
2.2. Mineral N Samples (Nmin) and Biomass Samples for the Nitrogen Nutrition Index (NNI)
Three soil samples from replicates I, II and III (there were four replicates per treatment) and three rows of aboveground biomass of wheat of one meter in length (four replications) were taken for each kind of initial fertilization treatment (dairy slurry, sheep farmyard manure and conventional treatment), in 40N + 0N, DS + 0N and SM + 0N treatments (Table 1) at 0–30 at two times: (1) At GS21 (09 March 2015, 19 January 2016 and 02 March 2017) just before mineral N fertilization in the conventional treatment; (2) at GS30 (04 April 2015, 17 March 2016 and 06 April 2017) just before mineral N fertilization. The soil samples were analyzed for soil mineral nitrogen (NH4+–N plus NO3−–N) by spectrophotometry [41,42].
Fresh biomass samples were weighed and oven dried, and the dried biomass samples were again weighted for dry matter content determination. Biomass was estimated and N concentration was determined by Kjeldahl’s method [43] to calculate the NNI (1) following Lemaire et al. [17]:
The NNI was calculated as a ratio of plant N concentration (Na) and the critical N concentration (Nc) in aerial biomass (shoots). Nc (2) is defined as the minimum concentration of N necessary to achieve maximum aerial biomass at any stage of vegetative growth [44]. For the wheat critical N concentration, dilution curves were developed for winter wheat in France [43] as a universal relationship. In 2012, another was built in China [45] with the aim of adjusting the original to the conditions in China. Since we did not have sufficient data to develop a specific function for our region, we used the original dilution curve developed by Justes et al. [46] due to the proximity to France.
where DM is the amount of dry matter accumulated in the aerial biomass expressed in t ha−1. Nc is expressed in % DM.
2.3. Proximal Sensing Tools for Adjusting the Optimum N Rate at GS30
The proximal sensing tools for the diagnosis of the N nutritional status tested were Yara N-TesterTM (Yara International ASA, Oslo, Norway) and RapidScan CS-45 (Holland Scientific, Lincoln, NE, USA). Yara N-TesterTM is a clip-on hand-held chlorophyll meter which measures light transmitted by the plant leaf at two different wavelengths, 650 (red light) and 940 nm (near infrared light, NIR). The ratio of the light transmitted at these wavelengths, in addition to the ratio determined with no sample, is processed by the instrument to produce a digital reading. The measurement point should be in the middle of the blade of the youngest, fully developed leaf. The values obtained are unitless and they express relative chlorophyll content. Thirty random measurements are recorded to get the representative value in each sampling point. RapidScan CS-45 is a portable entirely self-contained ground-based active crop canopy sensor that integrates a data logger, graphical display, GPS, active crop sensor and power source into a small and compact instrument. It measures crop reflectance at 670, 730 and 780 nm and provides the NDVI and NDRE. The measurements with RapidScan CS-45 were taken as the sensor was passed over the crop surface at approximately 1 m at constant walking speed. The sensor´s unit was handheld and two rows per elemental plot were scanned. NDVI and NDRE values were averaged to generate a value for that plot.
Measurements with the proximal sensing tools were taken in four replications in each kind of initial fertilization treatment (dairy slurry, sheep farmyard manure and conventional treatment) just before applying the topdressing at GS30. Measurements were taken in 40N + 0N, DS + 0N and SM + 0N treatments (Table 1). In addition, samples were taken in the control (0N) and overfertilized treatments (280N). We will refer to the Yara N-TesterTM absolute values as abs_NTester and the RapidScan CS-45 absolute values as abs_NDVI and abs_NDRE. The measurements with Yara N-TesterTM and RapidScan CS-45 were taken as described in Aranguren et al. [33].
Normalized values for the Yara N-TesterTM and RapidScan CS-45 measures were calculated to avoid the noise encountered by variables other than N fertilizer. These values were calculated as a percentage by assigning the 100% value to the overfertilized treatment (280N) described previously, similar to the technique suggested by Follett and Follett [47]. We will refer to the Yara N-TesterTM normalized values as nor_NTester and the RapidScan CS-45 normalized values as nor_NDVI and nor_NDRE.
2.4. Grain Yield
Yields were recorded at crop maturity using a plot harvester (1.5 × 8 m; Wintersteiger AG, Ried, Austria). For comparisons between fields, yields were converted to a 12% dry matter basis.
To show grain yield response to N fertilization at GS30, the grain yield was determined by fitting a Quadratic Plateau Function. It has been shown to best describe the yield response to N fertilization in humid Mediterranean climate conditions of Araba (Basque Country, northern Spain) after comparison with other models (quadratic and square root) as was shown by Ortuzar-Iragorri et al. [48], who selected those models because other authors reported that they were frequently used for studying the relationship between yield and N fertilization. Ortuzar-Iragorri et al. [48] used the NLIN procedure (SAS Institute 1998 [49]) to adjust the data to the proposed models to obtain statistical parameters. The most important attribute of the function is where yield becomes relatively insensitive to increases in N fertilizer addition at GS30. The optimum N rate was determined following Ortuzar-Iragorri et al. [48]. In the neighborhood region of Navarra (northern Spain), with similar climatic conditions, Arregui et al. [9] also used a Quadratic Plateau Function for wheat yield response to N fertilization. In the case of corn, a Quadratic Plateau Function was also shown to be the best model for yield response to N fertilization [49,50,51,52]. A Quadratic Plateau Function (3) was used to indicate the optimum N rate at GS30 to achieve the maximum yield (yield vs. N fertilizer rate at GS30):
where y is the dependent variable (yield, kg ha−1), N is the N rate applied at GS30 (kg N ha−1) and a, b and c are coefficients.
The equations obtained with the Quadratic Plateau Function were used to determine the economically optimal dose of N (4), following the technique suggested by Aizpurua et al. [53]. According to their findings, the revenues obtained can be calculated as:
where w is the wheat price (€ kg−1), f is the fertilizer price (€ kg−1), N is the nitrogen rate (kg ha−1) and Y is the quadratic plateau function.
When the revenue yield is derived with respect to the N rate and equals to zero, maximum revenues would be obtained, and that would be the economical optimum rate based on yield. The wheat grain price used was 0.18 € kg−1, and the fertilizer price was 1.19 € kg N [54].
2.5. Statistical Analysis
The Quadratic Plateau Function was used for the wheat yield response. A nonlinear regression procedure was carried out using R 3.2.5’ software [55] to plot curves that best described the yield response to N fertilizer application.
Both soil mineral nitrogen (Nmin) and NNI measurements were conducted before applying the N fertilization rates at GS21 and at GS30. The proximal sensing tool (Yara N-TesterTM and RapidScan CS-45) measurements (abs_NTester, abs_NDVI and abs_NDRE) were conducted before applying the N fertilization rate at GS30. Overfertilized plots were used to normalize absolute values (nor_NTester, nor_NDVI and nor_NDRE). The factors analyzed for statistical analysis in all cases were growing season and initial fertilization by analyses of variance (ANOVA) using ‘R 3.2.5’ software [55]. There was a significant interaction between growing season and initial fertilization for all these measurements. Therefore, an ANOVA was performed to analyze differences among initial fertilization treatments in each growing season. Another ANOVA was performed to analyze the differences among the wheat-growing seasons in each initial treatment. To separate the means, the Tukey test was used (p ≤ 0.05), utilizing the R package agricolae [56].
3. Results
3.1. Grain Yield
Optimum N Rate at GS30
The optimum N rate at GS30 was different for each kind of initial fertilizer (conventional treatment, slurry or sheep manure) in each wheat-growing season. In 2015 (Figure 2a), the optimum N rate at GS30 was 98 kg N ha−1 in the conventional treatment (plus 40 kg N ha−1 at tillering). In the organic treatments, the optimum N rate at GS30 was approximately 118 kg N ha−1. Maximum wheat grain yields were 8456, 8240 and 8356 kg ha−1 for conventional treatments, slurry and manure, respectively.
In 2016 (Figure 2b), the optimum N rate at GS30 in the conventional treatment was 109 kg N ha−1 (plus 40 kg N ha−1 at tillering). In the organic treatments, the optimum N rate in the slurry treatment was 98 kg N ha−1 and in the manure treatment was 147 kg N ha−1. Maximum wheat grain yields were 10,227, 10,271 and 10,723 kg ha−1 for the conventional, slurry and manure treatments, respectively.
In 2017 (Figure 2c), the optimum N rate at GS30 in the slurry treatment was 128 kg N ha−1 and in the manure treatment, it was 156 kg N ha−1. In the conventional treatment, the maximum yield was not achieved. Therefore, the maximum rate applied at GS30 (160 kg N ha−1) was taken as the optimum N rate at GS30. Maximum wheat grain yields were 5841 and 6205 kg ha−1 for slurry and manure treatments, respectively.
3.2. Economically Optimal Dose
In 2015 and 2016, the economically optimal dose at GS30 was almost the same as the optimum N rate at GS30. In 2015, the economically optimal dose was 98 kg N ha−1 for conventional treatment and 117 kg N ha−1 for organic amendments. In 2016, the economically optimal dose was 110, 100 and 141 kg N ha−1 for conventional, slurry and manure initial treatments, respectively. However, in 2017 the economically optimal dose at GS30 was lower than the optimum N rate at GS30 (131, 111 and 130 kg N ha−1 for conventional, slurry and manure initial treatments, respectively).
3.3. Soil Mineral Nitrogen (Nmin) and Total Rainfall
Before sowing, soil Nmin in 2015 was 50 kg N ha−1; in 2016, it was 42 kg N ha−1 and in 2017, it was 34 kg N ha−1 (Table 2). At GS21, Nmin values (Table 2) were lower in 2015 than in 2016 and 2017 in organic fertilization treatments. During the 2016 and 2017 wheat-growing seasons, the lower rainfall (Figure 3) allowed higher Nmin values (around 30 kg N ha−1) at GS21 (Table 2). In 2015 at GS21, conventional treatment had significantly higher Nmin values than dairy slurry and sheep manure (Table 2). At GS30, 0N and conventional treatment presented higher values in 2017 than in 2015 and in 2016. Nmin values in 2016 were extremely low in all cases (Table 2). No differences among treatments were detected at GS30 in any growing cycle.
Means followed by a different capital letter indicate significant differences among initial treatments for each year (Tukey, p ≤ 0.05). Means followed by a different lower-case letter indicate differences among each initial treatment for different years (Tukey, p ≤ 0.05). Both 0N and 40 + 0N have the same value at GS21 because the measurement was taken before topdressing application in 40 + 0N at GS21.
3.4. NNI
NNI values at GS21 (Table 3) in 2016 were significantly higher than in 2015 and 2017, and dairy slurry and sheep manure treatments had significantly higher values than the treatments without organics as initial fertilizer. However, there were no differences in 2015 and 2017 among initial fertilization treatments.
At GS30 (Table 3), in treatments with organics as initial fertilizer and in 0N, NNI values were significantly higher in 2016 than in 2015 and 2017. However, conventional treatment presented higher values in 2016 and 2017 than in 2015. There were significant differences in 2016 and 2017 among initial fertilization treatments. In 2017, the overfertilized plot presented the highest NNI followed by the conventional treatment and 0N and organic treatments. There were no differences between 0N and organic treatments. In 2016, the overfertilized plot presented the highest NNI and there were no differences among the rest of the treatments. In 2015, there were no differences among initial fertilization treatments.
Means followed by a different capital letter indicate significant differences among initial treatments for each year (Tukey, p < 0.05). Means followed by a different lower-case letter indicate differences among each initial treatment for different years (Tukey, p < 0.05). ND means no data. sd means standard deviation. 0N, 40 + 0N and OverFert treatments have the same value at GS21 because the measurement was taken before topdressing application in 40 + 0N and OverFert at GS21.
3.5. Proximal Sensing Tools
3.5.1. Absolute Values
The absolute values of RapidScan CS-45 (abs_NDVI and abs_NDRE) at GS30 were significantly higher in 2016 than in 2015 and 2017 in all treatments (Table 4). The absolute values of Yara N-TesterTM (abs_NTester) were significantly higher in 2016 than in 2015 (Table 4) in dairy slurry and sheep manure treatments. In the conventional treatment, there were no significant differences among years (Table 4). Finding values to adjust the optimum N rate with absolute values was complicated because variability among years was high.
Means with different lower-case letters (a, b) represent significant differences among initial treatments in Yara N-TesterTM (abs_NTester) measurements for each year (Tukey, p ≤ 0.05); means with different capital letters in italics (A, B) represent significant differences among initial treatments in NDVI RapidScan CS-45 measurements (abs_NDVI) for each year (Tukey, p ≤ 0.05); means with different underlined capital letters (A, B) represent significant differences among initial treatments in NDRE RapidScan CS-45 measurements (abs_NDRE) for each year (Tukey, p ≤ 0.05); means with different lower-case letters (y, z) represent significant differences among the three years in Yara N-TesterTM measurements (abs_NTester) for each treatment (Tukey, p ≤ 0.05); means with different capital letters in italics (Y, Z) represent significant differences among the three years for NDVI RapidScan CS-45 measurements (abs_NDVI) in each treatment (Tukey, p ≤ 0.05) and means with different underlined capital letters (Y, Z) represent significant differences among the three years for NDRE RapidScan CS-45 measurements (abs_NDRE) in each treatment (Tukey, p ≤ 0.05).
3.5.2. Normalized Values
The normalized values of RapidScan CS-45 and Yara N-TesterTM (as a percentage compared to the overfertilized (280 N) treatment) were significantly higher in 2016 (Figure 4b) than in 2015 and 2017 (Figure 4a,c) in all treatments with the exception of nor_NTester values in the conventional treatment. In 2015 (Figure 4a), the normalized measurements of both tools agreed with each other for all treatments, showing differences between the conventional treatment (88%), initial organic fertilization treatments (65%) and 0N (57%). In 2016 (Figure 4b), Yara N-TesterTM showed differences between the conventional treatment (92%), control (78%) and both organic treatments (85%). RapidScan CS-45 showed differences between the conventional treatment (88%) and 0N (72%), but the tool did not detect differences between the conventional treatment and organic treatment (84–87%). In 2017 (Figure 4c), the measurements of both proximal tools detected differences between the conventional treatment (83–87%) and the remaining treatments (control and organics). In 2017, only nor_NDRE detected differences between control and organic treatments.
It was possible to find a relationship between normalized values of RapidScan CS-45 and Yara N-TesterTM and optimum N rate at GS30 to achieve the maximum yield in the conventional treatment and in the slurry treatment (Table 5). When both proximal sensing tool values were 60–65%, the optimum N rate at GS30 to achieve the maximum yield was 118–128 kg N ha−1 in dairy slurry treatment (Table 5). When the readings were 85–90%, the optimum N rate was 100–110 kg N ha−1 in dairy slurry and conventional treatment (Table 5). In the sheep manure treatment, there was no clear relationship between sensor values and the optimum N rate. When values were 60–65%, the N recommendation was 117 or 155 kg N ha−1 and 147 kg N ha−1 for readings around 89%.
4. Discussion
Studies focused on the use of proximal sensing tools for adjusting topdressing N in wheat have been conducted in other climates. In this region with variable rainfall, it was necessary to study the usefulness of proximal sensing tools for an optimum N mineral rate application when organic manures had been applied as basal fertilizers.
4.1. Mineral N Fertilizer Reduction When Organic Fertilizer Was Applied before Sowing
In this study, maximum wheat grain yields were different in each growing season with 2016 being the year with the highest yields. Within each year for 2015 and 2016, maximum yields between the conventional treatment and organics as initial fertilizers treatment were comparable (Figure 2a,b). However, in 2017, there were differences among initial fertilization treatments, with the conventional treatment being 1300–1700 kg ha−1 more productive than the organic treatments depending on each individual N rate at GS30 (Figure 2c). In this regard, the optimum N rate at GS30 was different for each growing season and for each initial fertilization treatment. In fact, the application of organic manures as initial fertilizers reduced the mineral N rate used at GS30 in 2015 and 2016. In 2015, when organic manures were used as initial fertilizers, approximately 20 kg N mineral ha−1 less than in the conventional treatment was necessary to achieve the maximum wheat grain yield. In 2016, when applying slurry as an initial fertilizer, 51 kg N mineral ha−1 less than in the conventional treatment was necessary to achieve the maximum wheat grain yield. In 2016, when using manure as initial fertilizer, the same mineral N dose as in the conventional treatment was necessary to achieve the maximum wheat grain yield. However, in the manure treatment, the maximum yield was 500 kg ha−1 higher than in the conventional treatment. According to results shown in 2015 and 2016, the 40 kg N ha−1 application at the GS21 could be avoided when organic manures were applied even when Nmin at GS21 was very low (4–9 kg N ha−1) as in 2015 (Table 2). In 2017, following mineral N application at GS30, it did not rain until leaf flag emergence (GS37 [2]; Figure 3). In 2017, yields were higher in the conventional treatment where 40 kg N ha−1 had been applied at GS21 even if Nmin values at GS21 were high (Table 2).
Both economic and environmental costs are key considerations when N fertilization management strategies are being developed [53]. The economically optimum N rate at GS30 was similar to the optimum N rate in 2015 and 2016. However, in 2017, when mineral fertilizer price and wheat prices are considered, the N rate is lower than the optimum N rate. The low precipitation after the mineral N application at GS30 did not allow N absorption by the wheat crop until one month later, negatively affecting N use efficiency, hence reducing the economic N rate and the economic benefit of the fertilizer.
4.2. Soil N Availability
As the Nmin values showed, the soil N supply in soils amended with animal manure may be very variable (Table 2). The recommended rate of N fertilizer is calculated by the predicted N demand for the target yield minus the measured Nmin at the end of winter. However, some factors make this technique imprecise. On the one hand, using a target yield is not feasible because, each growing season, yields vary depending on the weather (Figure 2 and Figure 3). On the other hand, soil Nmin at GS21 depends not only on the mineralization (SOM, applied organic compounds and weather conditions) but also on crop uptake. Although Nmin values at GS21 in 2016 and 2017 were similar, yields achieved in 2016 (10,200–10,700) were higher than yields in 2017 (5800–6200; Figure 2). As the results showed (Table 2 and Table 3), it is possible to have high N availability in soil and plants with low N nutritional status (as in 2017), as well as low N availability in soil and acceptable N nutritional statuses in plants (as in 2016).
The weather has a significant effect on yield. Since the weather can be difficult to predict in the long term, predicting the mineralization of organic forms of N and other nutrients into plant available mineral forms and the wheat demand remains a challenge [57]. Many factors control the decomposition of SOM and the mineralization of nutrients, rendering the prediction difficult [58]. Arregui and Quemada [59], in similar climate conditions (humid Mediterranean), showed that due to the high rainfall, low evapotranspiration and low crop demand, from sowing to mid-tillering (GS25), most of the mineral N present in the soil before sowing was lost by nitrate leaching, as could have happened in 2015. The lower Nmin values in the treatments where organics were applied in 2015 could be explained by immobilization [57]. Basso et al. [10] showed that wheat yield production in the Mediterranean environment is highly affected by spring rainfall and the amount of soil water stored in soil before and during the growing season. In the area where the study was carried out (humid Mediterranean) [34], three of the ten years have dry periods (media 1978–2017; period 15 March–1 May) when N fertilizer topdressing is applied at GS30 at the stage of highest N uptake by the wheat crop. It should be mentioned that applying organics as initial fertilizers will probably not synchronize with the highest N demand by the crop because a long period of time passed between application and plant N uptake. However, the wet conditions in winter in Araba hinder the entrance of machinery to fields in spring. The unique alternative being their application in autumn, likely causing N loss by leaching.
Soil characteristics also have an effect on N mineralization. In our study, the soil presented 40% clay (58% Smectite). Chantigny et al. [60] suggested that clay fixation may have a negative effect on N availability during the crop growing season. Other studies also demonstrated that there is a significant interaction between manure and soil regarding the net mineralization and that the net N mineralization of cattle manures, cattle slurry and plant recovery is lower in clay soils is associated with the clay fixation of NH4+–N [61].
It is also remarkable that, in 2016, the preceding crop was rapeseed (Brassica napus). It has been shown that in the humid Mediterranean region of Spain, including rapeseed in the crop rotation increases wheat yields by about 10% [62]. Gallejones et al. [63] concluded that rapeseed as the preceding crop for wheat probably caused higher N mineralization.
Many factors affect soil N mineralization and soil N availability, making it difficult to estimate the amount of N mineralized from SOM to adjust the rate of N fertilizer required to optimize crop yield and also quality, even if soil Nmin is known at the end of winter. Otherwise, fields are heterogeneous, and it implies laborious and expensive sampling and analysis [64]. Ravier et al. [11] highlighted many sources of uncertainty in soil N analysis (lack of standardized procedure for soil sampling or the choice of the sampling zone and extrapolation) that led to the exclusion of decision rules based on the monitoring of soil mineral content. Recommendations for the start of the crop cycle are usually based on soil parameters, and the recommendations for later stages in the crop cycle are based on plant indicators. Plants integrate soil variability, climate, crop management and other environmental influences, which are good indicators of the nutrient needs.
4.3. Nitrogen Nutrition Index (NNI)
The topdressing N fertilizer recommendation rate can be adjusted according to the NNI, which can indicate the magnitude of the N surplus or deficiency [17]. In our experiment, all treatments were under N deficiency (NNI < 0.9), even the overfertilized ones. However, the NNI was able to detect differences among treatments in the same growing season and differences among the wheat-growing seasons for the same treatment. Different thresholds of the NNI have been proposed in on-farm applications to diagnose the N status of plants [12,65,66,67]. Ravier et al. [23] determined the NNI threshold that the wheat crop can tolerate in different growing stages without reducing the maximum yields. Thus, they consider NNI values <0.4 as situations that should be avoided, and when the NNI is between 0.4 and 0.7 before ear has reached 1 cm in length (before GS30, following Zadoks et al., 1994 [2]), they recommend the application of 40 kg N ha−1 at that stage. In our case, in 2016 at GS21, NNI values were 0.60–0.68. In 2016, yields were comparable between the conventional treatment (where 40 kg N ha−1 was applied at GS21) and treatments where organics were applied as initial fertilizers without N application at GS21. This fact suggests that increasing the N rate at GS30 can reverse the N deficiency at GS21 and organics could match the conventional treatment (where 40 kg N ha−1 was applied at GS21). In 2015 at GS21, NNI values were lower than 0.4 (0.34–0.38), which means that the crop had a severe deficiency and that the yields will be reduced. In 2015, yields were lower than in 2016 but as in 2016, yields between the conventional treatment (where 40 kg N ha−1 was applied at GS21) and organics treatment were comparable. In 2017, NNI values were 0.23–0.26 at GS21 and it did not rain after N application at GS30 until GS37, causing low yields. In 2017, the application of 40 kg N ha−1 at GS21 in the conventional treatment had a significant effect on the yield, allowing higher yields in the conventional treatment than in the organic treatment. Those events in 2015 and 2016 suggested that the tolerable N deficiency in GS21 could be lower (0.3) than the one identified by Ravier et al. [23] and that crop yield can be restored with the topdressing N application at GS30 when the N deficiency is not very severe, as in 2017. However, they also concluded that the extent of tolerable N deficiencies in the early stages is less clear than in more advanced stages. In fact, a low NNI occurring during tillering can lead to a low number of stems, but a higher NNI during GS30 can lead to an increase in the number of grains per ear [17]. It is important to highlight that tolerating N deficiency gives the crop the opportunity to absorb the available soil mineral N before applying fertilizer [11]. The determination of the NNI requires representative samples to be taken, the determination of dry matter content and the determination of N concentration by laboratory analytics, making the determination of the NNI difficult and time-consuming. Moreover, as with soil sampling, farmers cannot instantly know the N status of plants.
4.4. Proximal Sensing Tools and Vegetation Indices
Abs_NTester readings increased as NNI values increased. For NNI = 1 values, Ziadi et al. [68] determined an absolute chlorophyll meter reading with Minolta SPAD-502 of 42.5 at GS30 in wheat. Similar absolute chlorophyll meter readings (ranging from 39 to 45, depending on the site-year) for NNI = 1 in wheat were also reported by Peltonen et al. [69] and Bundy and Andraski [70]. The crop sensor performance for N status diagnosis is influenced by many other variables apart from N: seasonal variation, plant water status, diseases and pests, plant growth stage, genotype, etc. [31]. Normalized readings have been recommended to reduce the year effect [21,23] and the noise promoted by other variables other than N fertilization [18].
In normalized values, chlorophyll meter readings have been correlated with the NNI [21,22]. Ziadi et al. [68] established the critical relativized chlorophyll meter readings ranging from 0.89 to 0.95 for NNI = 1. However, the normalization of the chlorophyll meter readings does not entirely remove the year effect [71], but these readings better predict the NNI [68]. Prost and Jeuffroy [21] suggested that the overfertilized plot should have an NNI higher than 1, indicating that N is not limiting. Ravier et al. [72] concluded that the use of normalized values is problematic because it is essential to ensure that a well-fertilized strip is not N deficient. They determined that using relativized values from an N-deficient overfertilized plot (NNI < 0.9) may lead to an error of 0.34%. The overfertilized treatments of our dataset did not obtain NNI ≥ 0.9 (Table 3) even after the application of large amounts of N. Yao et al. [73] showed that normalized values were more correlated with the NNI at later stages of development than at early stages. In our results, both absolute values and normalized values were able to similarly detect differences among treatments. However, finding values to adjust the optimum N rate was complicated with absolute values because variability among years was higher than with relativized values. Regarding normalized values, in dairy slurry treatment, when both proximal sensing tool values were 60–65%, the optimum N rate at GS30 to achieve the maximum yield was 118–128 kg N ha−1 (Table 5). In dairy slurry and conventional treatments, when the readings were 85–90%, the optimum N rate was 100–110 kg N ha−1 (Table 5). In the sheep manure treatment, there was no clear relationship between sensor values and the optimum N rate. When values were 60–65%, the N recommendation was 117 or 155 kg N ha−1 and 147 kg N ha−1 for readings around 89%. That may be due to the heterogeneous nature of manures that makes it difficult to predict how quickly and how much N will be transformed in plant-available N during the wheat-growing season. The composition of manures depends on animal diet, the amount of bedding, water and nutrient loss during storage and land application [4]. However, in this study, the main factor that brings variability is the maturation (curing) phase. Thus, sheep manure characteristics were different depending on the year: in 2016, the sheep manure was “fresh”, containing NH4+ (0.33% of total N; Table 1), whereas in 2015 and 2017, it was “old” and the manures did not present any NH4+. In dairy slurry treatments, the NH4+ content in the three wheat-growing seasons was around 0.55% of total N, having lower variability compared to sheep manure. In 2016, the N availability in sheep manure treatment was high when the crop N demand was high, allowing greater tool values than in 2015 and 2017 (Table 4 and Figure 4). However, the N recommendation at GS30 was much higher in sheep manure treatments than in treatments with dairy slurry as initial fertilizer, even if tools’ values were similar at GS30 (Table 4 and Figure 4). Manures also contain organic N that becomes available to crops after enzymatic hydrolysis. The amount of N mineralized from organic N depends on its physical–chemical characteristics, soil properties and climatic conditions [74]. Typically, slurries are more susceptible to enzymatic hydrolysis than solid manures that have bedding materials made of lignified compounds [4]. This can also justify the higher and variable N required by the crop when sheep manure was applied than when slurry was applied, especially when crop N requirements were high, as in 2016. Moreno-García et al. [75] and Zhao et al. [76] found that the higher availability of micronutrients provided by the organic fertilizers allowed higher yield than in conventional treatment and suggested that it is necessary to establish overfertilized plots for each type of fertilization.
These results look promising in order to adjust the N application rate at GS30 with the Yara N-TesterTM and RapidScan CS-45 normalized readings when applying dairy slurry before sowing. However, in the sheep manure treatment, it is more difficult to find a relationship between sensor readings and yield. Both handheld N diagnostic tools were able to detect differences among N nutritional status in plants. Siband et al. [77] suggested that the NNI responded faster to N applications than chlorophyll meters, which is probably related to the time between N uptake and chlorophyll synthesis [22]. Ziadi et al. [68] saw that the whole plant can be less N deficient than the uppermost collared leaf. In this sense, evaluating the whole plant would be more precise than just a leaf. At early growth stages, evaluating the NDVI would be more accurate, although some authors such as Broge and Mortensen [78] highlighted that, when the wheat canopy is not closed, soil background exposure reduces the reliability of using reflectance for the estimation of crop N status. However, at the end of the growing cycle, the use of a chlorophyll meter is suitable [20], as 35% of N in the grain comes from the last developed leaf [79]. The utility of proximal tools to detect the N nutritional status of plants was supported by Arregui et al. [9] and Ortuzar-Iragorri et al. [18] who observed that chlorophyll meters enabled the prediction of the N status of plants. Furthermore, Mullen et al. [80] showed that in-season N demand for added N fertilizer in winter wheat could be detected using NDVI readings collected at GS30. Moreover, algorithms using crop canopy reflectance sensing to make N recommendation for wheat have been identified, and it has been shown that active canopy sensors could be used in determining variable N rate applications in wheat from the mid-growing season [81,82]. Marti et al. [28] found significant correlations between the NDVI, yield and biomass in wheat. On the other hand, Sylvester-Bradley et al. [64] developed an alternative strategy for signaling soil N status and observed that the NDVI of young canopies can signal soil N status where Nmin is lower than 120–140 kg N ha−1. In our conditions, generally Nmin values were lower than 120–140 kg N ha−1. In our case, both proximal tools showed a greater sensitivity than Nmin when differentiating the initial fertilization treatments applied in the field trial. All of these findings were very promising because the type of fertilization could be changed to achieve a more precise N rate adjusted to the wheat crop demand. It should be noted that measurements taken with RapidScan CS-45 were less time consuming than with Yara N-TesterTM and were taken on the plant canopy and not just in the uppermost fully expanded leaf, as with chlorophyll meters. Thus, samples taken with RapidScan CS-45 can better represent the spatial variation of the crop N status.
These hand-held tools are used during the wheat growth period (GS30), but many environmental variables (rainfall, temperature or relative humidity) affect crop growth and development after this stage until harvest [83]. However, any method of diagnosing N nutritional status at a particular stage has the same limitation. Furthermore, it has been shown that it is always possible to correct N deficiency until the end of the cereal growth season (GS65) [23] if soil is wet [84]. Since remote sensing measurements are not invasive and can be repeated several times during the growth period, information obtained on N status dynamics of plants can be used for decision making in N fertilizer management. What is more, ground-based remote sensing tools can be applied to satellite or airborne remote sensing.
5. Conclusions
Experimental findings to date have shown that Yara N-TesterTM or Rapidscan CS-45 normalized readings look promising in order to adjust the N application rate at GS30 under rainfed conditions in humid Mediterranean climate conditions. For dairy slurry, when either proximal sensor readings were 60–65% of the reference plants with non-limiting N, the optimum N rate for maximizing yield was 118–128 kg N ha−1. When the readings were 85–90%, the optimum N rate dropped to 100–110 kg N ha−1 for both dairy slurry and conventional treatments. However, in the sheep manure treatment, it is more difficult to find a relationship between sensor readings and yield due to the variable composition of the manure and subsequently, the available N.
When rainfall conditions between mid-March and April are as usual (seven out of ten years), a low N status (60–65%) can be recovered with no adverse effect on yield when mineral N is applied at GS30. However, during those years in which dry periods occur (three of ten), when mineral N is applied at GS30, the N deficiency is not recovered because the lack of soil moisture prevents proper N uptake by the crop. In these cases, the application of 40 kg N ha−1 at GS21 leads to higher yields. As the N rate at GS30 can be modulated with the proximal tools, the application of 40 kg N ha−1 at GS21 is necessary to ensure an optimal N status from the beginning of wheat crop development.
These hand-held tools are used during the wheat-growing period (GS30), but many environmental variables may affect crop development until harvest. In order to address this, given that remote sensing measurements are not invasive, these measurements should be taken periodically to monitor crop N status in an effective way. Routine measurements throughout the growing season are particularly needed in climates with variable rainfall. Measurements taken with RapidScan C-45 were less time consuming and better represent the spatial variation as they are taken on the plant canopy.
While Yara N-TesterTM or Rapidscan CS-45 look promising for adjusting N application rates, further research is needed to improve the use of these sensors. These research findings could be used in applicator-mounted sensors to make variable-rate N applications.
Author Contributions
M.A., A.C. and A.A. contributed to the conception and design of the study. M.A and A.C. carried out fieldwork for acquisition of the data analysed. M.A., A.C. and A.A. contributed to different aspects of analysis and interpretation of data. M.A. and A.A. wrote the paper, and M.A., A.C. and A.A. authors revised it critically or approved of the final version.
Funding
This study was funded by the National Institute of Agricultural and Food Research and Technology (RTA2013-00057-01 and RTA2017-00088-C03-00) and by the Department for Economic Development and Infrastructures of the Basque Government. M. Aranguren is the recipient of a predoctoral fellowship from the Department for Economic Development and Infrastructures of the Basque Government.
Conflicts of Interest
The author declares no conflict of interest.
References
- Cameron, K.C.; Di, H.J.; Moir, J.L. Nitrogen losses from the soil/plant system: a review. Ann. Appl. Biol. 2013, 162, 145–173. [Google Scholar] [CrossRef] [Green Version]
- Zadoks, J.C.; Chang, T.T.; Konzak, C.F. A decimal code for the growth stages of cereals. Weed Res. 1974, 14, 415–421. [Google Scholar] [CrossRef]
- FAO. Pollution from Industrialized Livestock Production; Agriculture and Consumer Protection Department: Rome, Italy, 2005. [Google Scholar]
- Whalen, J.K.; Thomas, B.W.; Sharifi, M. Novel Practices and Smart Technologies to Maximize the Nitrogen Fertilizer Value of Manure for Crop Production in Cold Humid Temperate Regions. Adv. Agron. 2019, 153, 1–85. [Google Scholar]
- Defra. Nutrient Management Guide (RB209). Available online: https://ahdb.org.uk/documents/RB209/RB209_Section2_WEB_2001.pdf (accessed on 11 January 2017).
- Ros, G.H.; Hanegraaf, M.C.; Hoffland, E.; Van Riemsdijk, W.H. Predicting soil N mineralization: Relevance of organic matter fractions and soil properties. Soil Boil. Biochem. 2011, 43, 1714–1722. [Google Scholar] [CrossRef]
- Eghball, B. Nitrogen Mineralization from Field-Applied Beef Cattle Feedlot Manure or Compost. Soil Sci. Soc. J. 2000, 64, 2024–2030. [Google Scholar] [CrossRef]
- Eghball, B.; Wienhold, B.J.; Gilley, J.E.; Eigenberg, R.A. Mineralization of Manure Nutrients. Biol. Syst. Eng. Pap. Publ. 2002, 139. [Google Scholar]
- Arregui, L.; Lasa, B.; Lafarga, A.; Irañeta, I.; Baroja, E.; Quemada, M. Evaluation of chlorophyll meters as tools for N fertilization in winter wheat under humid Mediterranean conditions. Eur. J. Agron. 2006, 24, 140–148. [Google Scholar] [CrossRef]
- Basso, B.; Fiorentino, C.; Cammarano, D.; Cafiero, G.; Dardanelli, J. Analysis of rainfall distribution on spatial and temporal patters of wheat yield in Mediterranean environment. Eur. J. Agron. 2012, 41, 52–65. [Google Scholar] [CrossRef]
- Ravier, C.; Jeuffroy, M.-H.; Meynard, J.-M. Mismatch between a science-based decision tool and its use: The case of the balance-sheet method for nitrogen fertilization in France. NJAS-Wagening. J. Life Sci. 2016, 79, 31–40. [Google Scholar] [CrossRef]
- Ravier, C. Conception innovante d’une méthode de fertilization azotée: Ariculation entre diagnostic des usages, ateliers participatifs et modélisation. Ph.D. Thesis, University of Paris-Saclay, Saint-Aubin, France, 2017. [Google Scholar]
- Antille, D.L.; Lobsey, C.R.; McCarthy, C.L.; Thomasson, J.A.; Baillie, C.P. A review of the state of the art in agricultural automation. Part IV: Sensor-based nitrogen management technologies. ASABE Annu. Int. Meet. 2018. [Google Scholar] [CrossRef]
- Diacono, M.; Rubino, P.; Montemurro, F. Precision nitrogen management of wheat. Agron. Sustain. Dev. 2013, 33, 219–241. [Google Scholar] [CrossRef]
- Raun, W.R.; Solie, J.B.; Johnson, G.V.; Stone, M.L.; Mullen, R.W.; Freeman, K.W.; Thomason, W.E.; Lukina, E.V. Improving Nitrogen Use Efficiency in Cereal Grain Production with Optical Sensing and Variable Rate Application. Agron. J. 2002, 94, 815. [Google Scholar] [CrossRef] [Green Version]
- Samborski, S.M.; Tremblay, N.; Fallon, E. Strategies to Make Use of Plant Sensors-Based Diagnostic Information for Nitrogen Recommendations. Agron. J. 2009, 101, 800. [Google Scholar] [CrossRef] [Green Version]
- Lemaire, G.; Jeufroy, M.H.; Gastal, F. Diagnosis tool for plant and crop N status in vegetative stage: Teory and practices for crop N management. Eur. J. Agron. 2008, 28, 614–624. [Google Scholar] [CrossRef]
- Ortuzar-Iragorri, M.A.; Alonso, A.; Castellón, A.; Besga, G.; Estavillo, J.M.; Aizpurua, A. N-Tester use in soft winter wheat: evaluation of nitrogen status and grain yield prediction. Agron. J. 2005, 97, 1380–1389. [Google Scholar] [CrossRef]
- Piekelek, W.P.; Fox, R.H. Use of a chlorophyll meter to predict sidedress nitrogen requirements for maize. Agron. J. 1992, 84, 59–65. [Google Scholar] [CrossRef]
- Ortuzar-Iragorri, M.A.; Aizpurua, A.; Castellón, A.; Alonso, A.; José, M.; Estavillo, J.M.; Besga, G. Use of an N-Tester chlorophyll meter to tune a late third nitrogen application to wheat under humid Mediterranean conditions. J. Plant Nutr. 2017, 41, 6635. [Google Scholar] [CrossRef]
- Prost, L.; Jeuffroy, M.-H. Replacing the nitrogen nutrition index by the chlorophyll meter to assess wheat N status. Agron. Sustain. Dev. 2007, 27, 321–330. [Google Scholar] [CrossRef] [Green Version]
- Debaeke, P.; Rouet, P.; Justes, E. Relationship Between the Normalized SPAD Index and the Nitrogen Nutrition Index: Application to Durum Wheat. J. Plant Nutr. 2006, 29, 75–92. [Google Scholar] [CrossRef]
- Ravier, C.; Meynard, J.-M.; Cohan, J.-P.; Gate, P.; Jeuffroy, M.-H. Early nitrogen deficiencies favor high yield, grain protein content and N use efficiency in wheat. Eur. J. Agron. 2017, 89, 16–24. [Google Scholar] [CrossRef]
- Shanahan, J.; Kitchen, N.; Raun, W.; Schepers, J.; Raun, W. Responsive in-season nitrogen management for cereals. Comput. Electron. Agric. 2008, 61, 51–62. [Google Scholar] [CrossRef] [Green Version]
- Ali, A.M.; Thind, H.S.; Varinderpal-Singh, B.-S. A framework for refining nitrogen management in dry direct-seeded rice using GreenSeeker™ optical sensor. Comput. Electron. Agric. 2015, 110, 114–120. [Google Scholar] [CrossRef]
- Mulla, D.J. Twenty five years of remote sensing in precision agriculture: Key advances and remaining knowledge gaps. Biosyst. Eng. 2013, 114, 358–371. [Google Scholar] [CrossRef]
- Cao, Q.; Miao, Y.; Feng, G.; Gao, X.; Li, F.; Liu, B.; Yue, S.; Cheng, S.; Ustin, S.L.; Khosla, R. Active canopy sensing of winter wheat nitrogen status: An evaluation of two sensor systems. Comput. Electron. Agric. 2015, 112, 54–67. [Google Scholar] [CrossRef]
- Marti, J.; Bort, J.; Slafer, G.A.; Araus, J.L. Can wheat yield be assessed by early measurements of Normalized Difference Vegetation Index? Ann. Appl. Biol. 2007, 150, 225. [Google Scholar] [CrossRef]
- Lu, J.; Miao, Y.; Shi, W.; Li, J.; Yuan, F. Evaluating different approaches to non-destructive nitrogen status diagnosis of rice using portable RapidSCAN active canopy sensor. Sci. Rep. 2017, 7, 14073. [Google Scholar] [CrossRef] [PubMed] [Green Version]
- Li, S.; Ding, X.; Kuang, Q.; Ata-Ui-Karim, S.T.; Cheng, T.; Liu, X.; Tian, Y.; Zhu, Y.; Cao, W.; Cao, Q. Potential of UAV-Based Active Sensing for Monitoring Rice Leaf Nitrogen Status. Front. Plant Sci. 2018, 9, 1834. [Google Scholar] [CrossRef] [PubMed]
- Bonfil, D.J. Monitoring wheat fields by RapidScan: Accuracy and limitations. In Proceedings of the Conference on Precision Agriculture (ECPA 2017), Edinburgh, UK, 16–20 July 2017. [Google Scholar]
- Zhang, K.; Ge, X.; Shen, P.; Li, W.; Liu, X.; Cao, Q.; Zhu, Y.; Cao, W.; Tian, Y. Predicting Rice Grain Yield Based on Dynamic Changes in Vegetation Indexes during Early to Mid-Growth Stages. Remote Sens. 2019, 11, 387. [Google Scholar] [CrossRef]
- Aranguren, M.; Castellon, A.; Aizpurua, A. Topdressing nitrogen recommendation in wheat after applying organic manures: the use of field diagnostic tools. Nutr. Cycl. Agroecosyst. 2018, 110, 89–103. [Google Scholar] [CrossRef]
- Papadakis, J. Climates of the World and Their Agricultural Potentialities; Libro de Edicion Argentina: Buenos Aires, Argentina, 1966. [Google Scholar]
- Euskalmet. Euskal Meteorologia Agentzia. 2018. Available online: http://www.euskalmet.euskadi.eus/ (accessed on 21 November 2018).
- IUSS Working Group, WRB. Base referencial mundial del recurso suelo 2014, Actualización 2015. Sistema internacional de clasificación de suelos para la nomenclatura de suelos y la creación de leyendas de mapas de suelos. In Informes Sobre Recursos Mundiales de Suelos 106; FAO: Roma, Italy, 2014. [Google Scholar]
- Gee, G.W.; Bauder, J.W. Particle-size analysis. In Methods of Soil Analysis: Part 1. Physical and Mineralogical Methods; Klute, A., Ed.; SSSA: Madison, WI, USA, 1986; pp. 383–411. [Google Scholar]
- Soil Survey Staff. Soil Taxonomy: A Basic System of Soil Classification for Making and Interpreting Soil Surveys, 2nd ed.; Natural Resources Conservation Service. U.S. Department of Agriculture: Washington, DC, USA, 1999.
- MAPA. Métodos oficiales de análisis. In Tomo III; Ministerio de Agricultura, Pesca y Alimentación: Madrid, Spain, 1994. [Google Scholar]
- Walkey, A.; Black, I.A. An examination of Degtjareff method for determining soil organic matter and a proposed modification of the chromic and titration method. Soil Sci. 1934, 37, 29–37. [Google Scholar] [CrossRef]
- Cawse, P.A. The determination of nitrate in soil solutions by ultraviolet spectrophotometry. Analyst 1967, 92, 311–315. [Google Scholar] [CrossRef]
- Nelson, D.W. Determination of ammonium in KCl extracts of soils by the salicylate method. Commun. Soil Sci. Plant Anal. 1983, 14, 1051–1062. [Google Scholar] [CrossRef]
- AOAC, Association of Official Analytical Chemists International. Plants, 24, 127. In Official Methods of AOAC International, 16th ed.; Patricia, C., Ed.; AOAC International: Gaithersburg, MD, USA, 1999. [Google Scholar]
- Lemaire, G.; Salette, J.; Sigogne, M.; Terrasson, J.P. Relation entre dynamique de croissance et dynamique de prélèvement d’azote pour un peuplement de graminées fourragéres. I: Etude de l’effet du milieu. Agronomie 1984, 4, 423–430. [Google Scholar] [CrossRef]
- Yue, S.; Zhao, R.; Zhang, F.; Cui, Z.; Meng, Q.; Li, F.; Chen, X. Critical Nitrogen Dilution Curve for Optimizing Nitrogen Management of Winter Wheat Production in the North China Plain. Agron. J. 2012, 104, 523–529. [Google Scholar] [CrossRef] [Green Version]
- Justes, E.; Mary, B.; Meynard, J.-M.; Machet, J.-M.; Thelier-Huche, L. Determination of a Critical Nitrogen Dilution Curve for Winter Wheat Crops. Ann. Bot. 1994, 74, 397–407. [Google Scholar] [CrossRef]
- Follett, R.; Follett, R.; Halvorson, A. Use of a chlorophyll meter to evaluate the nitrogen status of dryland winter wheat. Commun. Soil Sci. Plant Anal. 1992, 23, 687–697. [Google Scholar] [CrossRef]
- Ortuzar-Iragorri, M.A.; Castellón, A.; Alonso, A.; Besga, G.; Estavillo, J.M.; Aizpurua, A. Estimation of optimum nitrogen fertilizer rates in winter wheat in humid Mediterranean conditions, I: Selection of yield and protein response models. Commun. Soil Sci. Plant Anal. 2010, 41, 2293–2300. [Google Scholar] [CrossRef]
- SAS Institute. SAS version 8; SAS Institute: Cary, NC, USA, 1998. [Google Scholar]
- Cerrato, M.E.; Blackmer, A.M. Comparison of Models for Describing; Corn Yield Response to Nitrogen Fertilizer. Agron. J. 1990, 82, 138. [Google Scholar] [CrossRef]
- Roberts, D.F.; Ferguson, R.B.; Kitchen, N.R.; Adamchuk, V.I.; Shanahan, J.F. Relationships between Soil-Based Management Zones and Canopy Sensing for Corn Nitrogen Management. Agron. J. 2012, 104, 119. [Google Scholar] [CrossRef]
- Scharf, P.C.; Kitchen, N.R.; Sudduth, K.A.; Davis, J.G. Spatially Variable Corn Yield is a Weak Predictor of Optimal Nitrogen Rate Peter C. Soil Sci. Soc. Am. J. 2006, 70, 2154–2160. [Google Scholar] [CrossRef]
- Aizpurua, A.; Estavillo, J.M.; Castellón, A.; Alonso, A.; Besga, G.; Ortuzar-Iragorri, M.A. Estimation of optimum nitrogen fertilizer rates in winter wheat in humid mediterranean conditions. II: Economically optimal dose nitrogen. Commun. Soil Sci. Plant Anal. 2010, 41, 301–307. [Google Scholar] [CrossRef]
- MAPAMA. Publicación de indicadores de precios y salarios agrarios; Ministerio de Agricultura y Pesca, Alimentación y Medio Ambiente: Madrid, Spain, 2017. [Google Scholar]
- R Core Team. R: A Language and Environment for Statistical Computing; R Foundation for Statistical Computing: Vienna, Austria, 2013.
- De Mendiburu, F. Una herramienta de análisis estadístico para la investigación agrícola. Ph.D. Thesis, Universidad Nacional de Ingeniería, Lima, Peru, 2009. [Google Scholar]
- Mohanty, M.; Sinha, N.K.; Reddy, K.S.; Chaudhary, R.S.; Rao, A.S.; Dalal, R.C.; Menzies, N.W. How important is the quality of organic amendments in relation to mineral N availability in soils? Agric. Res. 2013, 2, 99–110. [Google Scholar] [CrossRef]
- Walley, F.; Yates, T.; Van Groenigen, J.-W.; Van Kessel, C. Relationships between Soil Nitrogen Availability Indices, Yield, and Nitrogen Accumulation of Wheat. Soil Sci. Soc. J. 2002, 66, 1549. [Google Scholar] [CrossRef]
- Arregui, L.M.; Quemada, M. Drainage and nitrate leaching in a crop rotation under different N-fertilizer strategies: application of capacitance probes. Plant Soil 2006, 288, 57–69. [Google Scholar] [CrossRef]
- Chantigny, M.H.; Angers, D.A.; Morvan, T.; Pomar, C. Dynamics of Pig Slurry Nitrogen in Soil and Plant as Determined with N. Soil Sci. Soc. J. 2004, 68, 637. [Google Scholar] [CrossRef]
- Shah, G.M.; Rashid, M.I.; Shah, G.A.; Groot, J.C.J.; Lantinga, E.A. Mineralization and herbage recovery of animal manure nitrogen after application to various soil types. Plant Soil 2013, 365, 69–79. [Google Scholar] [CrossRef]
- INTIA. Manual del cultivo de colza de otoño. Instituto Navarro de Tecnologías e Infraestructuras agroalimentarias. Available online: https://intiasa.es/repositorio/images/docs/ManualCOLZA2012.pdf (accessed on 11 January 2017).
- Gallejones, P.; Castellón, A.; del Prado, A.; Unamunzaga, O.; Aizpurua, A. Nitrogen and sulphur fertilization effect on leaching losses, nutrient balance and plant quality in a wheat–rapeseed rotation under a humid Mediterranean climate. Nutr. Cycl. Agroecosyst. 2012, 93, 3355. [Google Scholar] [CrossRef]
- Sylvester-Bradley, R.; Wiltshire, J.J.J.; Kindred, D.R.; Hatley, D.L.J.; Clarke, S. Detecting Soil Nitrogen Supplies by Canopy Sensing—Project Report 460; HGCA: London, UK, 2009. [Google Scholar]
- Cilia, C.; Panigada, C.; Rossini, M.; Meroni, M.; Busetto, L.; Amaducci, S.; Boschetti, M.; Picchi, V.; Colombo, R. Nitrogen Status Assessment for Variable Rate Fertilization in Maize through Hyperspectral Imagery. Remote Sens. 2014, 6, 6549–6565. [Google Scholar] [CrossRef] [Green Version]
- Huang, S.; Miao, Y.; Zhao, G.; Yuan, F.; Ma, X.; Tan, C.; Yu, W.; Gnyp, M.L.; Lenz-Wiedemann, V.I.; Rascher, U.; et al. Satellite Remote Sensing-Based In-Season Diagnosis of Rice Nitrogen Status in Northeast China. Remote Sens. 2015, 7, 10646–10667. [Google Scholar] [CrossRef] [Green Version]
- Xia, T.; Miao, Y.; Wu, D.; Shao, H.; Khosla, R.; Mi, G. Active Optical Sensing of Spring Maize for In-Season Diagnosis of Nitrogen Status Based on Nitrogen Nutrition Index. Remote Sens. 2016, 8, 605. [Google Scholar]
- Ziadi, N.; Brassard, M.; Bélanger, G.; Claessens, A.; Tremblay, N.; Cambouris, A.N.; Nolin, M.C.; Parent, L.-É. Chlorophyll Measurements and Nitrogen Nutrition Index for the Evaluation of Corn Nitrogen Status. Agron. J. 2008, 100, 1264. [Google Scholar] [CrossRef] [Green Version]
- Peltonen, J.; Virtanen, A.; Haggrèn, E. Using a Chlorophyll Meter to Optimize Nitrogen Fertilizer Application for Intensively-Managed Small-Grain Cereals. J. Agron. Sci. 1995, 174, 309–318. [Google Scholar] [CrossRef]
- Bundy, L.G.; Andraski, T.W. Diagnostic Tests for Site-Specific Nitrogen Recommendations for Winter Wheat. Agron. J. 2004, 96, 608–614. [Google Scholar] [CrossRef]
- Ravier, C.; Quemada, M.; Jeuffroy, M.-H. Use of a chlorophyll meter to assess nitrogen nutrition index during the growth cycle in winter wheat. Field Crop. Res. 2017, 214, 73–82. [Google Scholar] [CrossRef]
- Ravier, C.; Jeuffroy, M.H.; Gate, P.; Cohan, J.P.; Meynard, J.M. Combining user involvement with innovative design to develop a radical new method for managing N fertilization. Nutr. Cycl. Agroecosyst. 2018, 110, 117. [Google Scholar] [CrossRef]
- Yao, Y.; Miao, Y.; Cao, Q.; Wang, H.; Gnyp, M.L.; Bareth, G.; Khosla, R.; Yang, W.; Liu, F.; Liu, C. In-Season Estimation of Rice Nitrogen Status with an Active Crop Canopy Sensor. IEEE J. Sel. Top. Appl. Earth Obs. Sens. 2014, 7, 4403–4413. [Google Scholar] [CrossRef]
- Sharifi, M.; Zebarth, B.J.; Burton, D.L.; Rodd, V.; Grant, C.A. Long-Term Effects of Semisolid Beef Manure Application to Forage Grass on Soil Mineralizable Nitrogen. Soil Sci. Soc. J. 2011, 75, 649. [Google Scholar] [CrossRef]
- Moreno-García, B.; Casterad, M.A.; Guillén, M.; Quílez, D. Agronomic and Economic Potential of Vegetation Indices for Rice N Recommendations under Organic and Mineral Fertilization in Mediterranean Regions. Remote Sens. 2018, 10, 1908. [Google Scholar] [CrossRef]
- Zhao, J.; Dong, S.T.; Liu, P.; Zhang, J.W.; Zhao, B. Effects of long-term mixed application of organic and inorganic fertilizers on canopy apparent photosynthesis and yield of winter wheat. Chin. J. Appl. Ecol. 2015, 26, 2362–2370. [Google Scholar]
- Siband, P.; Loyce, C.; Witt, C.; Dingkuhn, M. Evaluer le statut azote du riz irrigué. In Modélisation des Agroécosystémes et Aide á la Decision; Malézieux, E., Trébuil, G., Jaeger, M., Eds.; CIRAD: Montpellier, France, 2001; pp. 95–106. [Google Scholar]
- Broge, N.; Mortensen, J. Deriving green crop area index and canopy chlorophyll density of winter wheat from spectral reflectance data. Remote Sens. Environ. 2002, 81, 45–57. [Google Scholar] [CrossRef]
- Fuertes-Mendizábal, T.; Gonzalez-Murua, C.; González-Moro, M.B.; Estavillo, J.M. Late nitrogen fertilization affects nitrogen remobilization in wheat. J. Plant Nutr. Soil Sci. 2012, 175, 115–124. [Google Scholar] [CrossRef]
- Mullen, R.W.; Freeman, K.W.; Raun, W.R.; Johnson, G.V.; Stone, M.L.; Solie, J.B. Identifying an In-Season Response Index and the Potential to Increase Wheat Yield with Nitrogen. Agron. J. 2003, 95, 347. [Google Scholar] [CrossRef]
- Raun, W.R.; Solie, J.B.; Stone, M.L.; Martin, K.L.; Freeman, K.W.; Mullen, R.W.; Zhang, H.; Schepers, J.S.; Johnson, G.V.; Raun, W.; et al. Optical Sensor-Based Algorithm for Crop Nitrogen Fertilization. Commun. Soil Sci. Plant Anal. 2005, 36, 2759–2781. [Google Scholar] [CrossRef]
- Calvo, N.I.R.; Rozas, H.S.; Echeverría, H.; Diovisalvi, N. Using Canopy Indices to Quantify the Economic Optimum Nitrogen Rate in Spring Wheat. Agron. J. 2015, 107, 459–465. [Google Scholar] [CrossRef]
- Aranguren, M.; Castellón, A.; Aizpurua, A. Use of field diagnostic tools for top dressing nitrogen recommendation when organic manures are applied in humid Mediterranean conditions. In Proceedings of the 14th International Conference on Precision Agriculture, Montreal, QC, Canada, 24–27 June 2018. [Google Scholar]
- Soenen, B.; Cohan, J.P.; Jeuffroy, M.H.; Meynard, J.M.; Ravier, C. Fertilisation azotée du blé: raisonner sans objectif de rendement? Perspect. Agric. 2017, 445, 40–42. [Google Scholar]
Figure 1.
Location of the study (Arkaute, Araba) in the Basque Country, northern Spain. Letters “A”, “B” and “C” represent the field trials in the 2015, 2016 and 2017 wheat-growing seasons, respectively.
Figure 1.
Location of the study (Arkaute, Araba) in the Basque Country, northern Spain. Letters “A”, “B” and “C” represent the field trials in the 2015, 2016 and 2017 wheat-growing seasons, respectively.
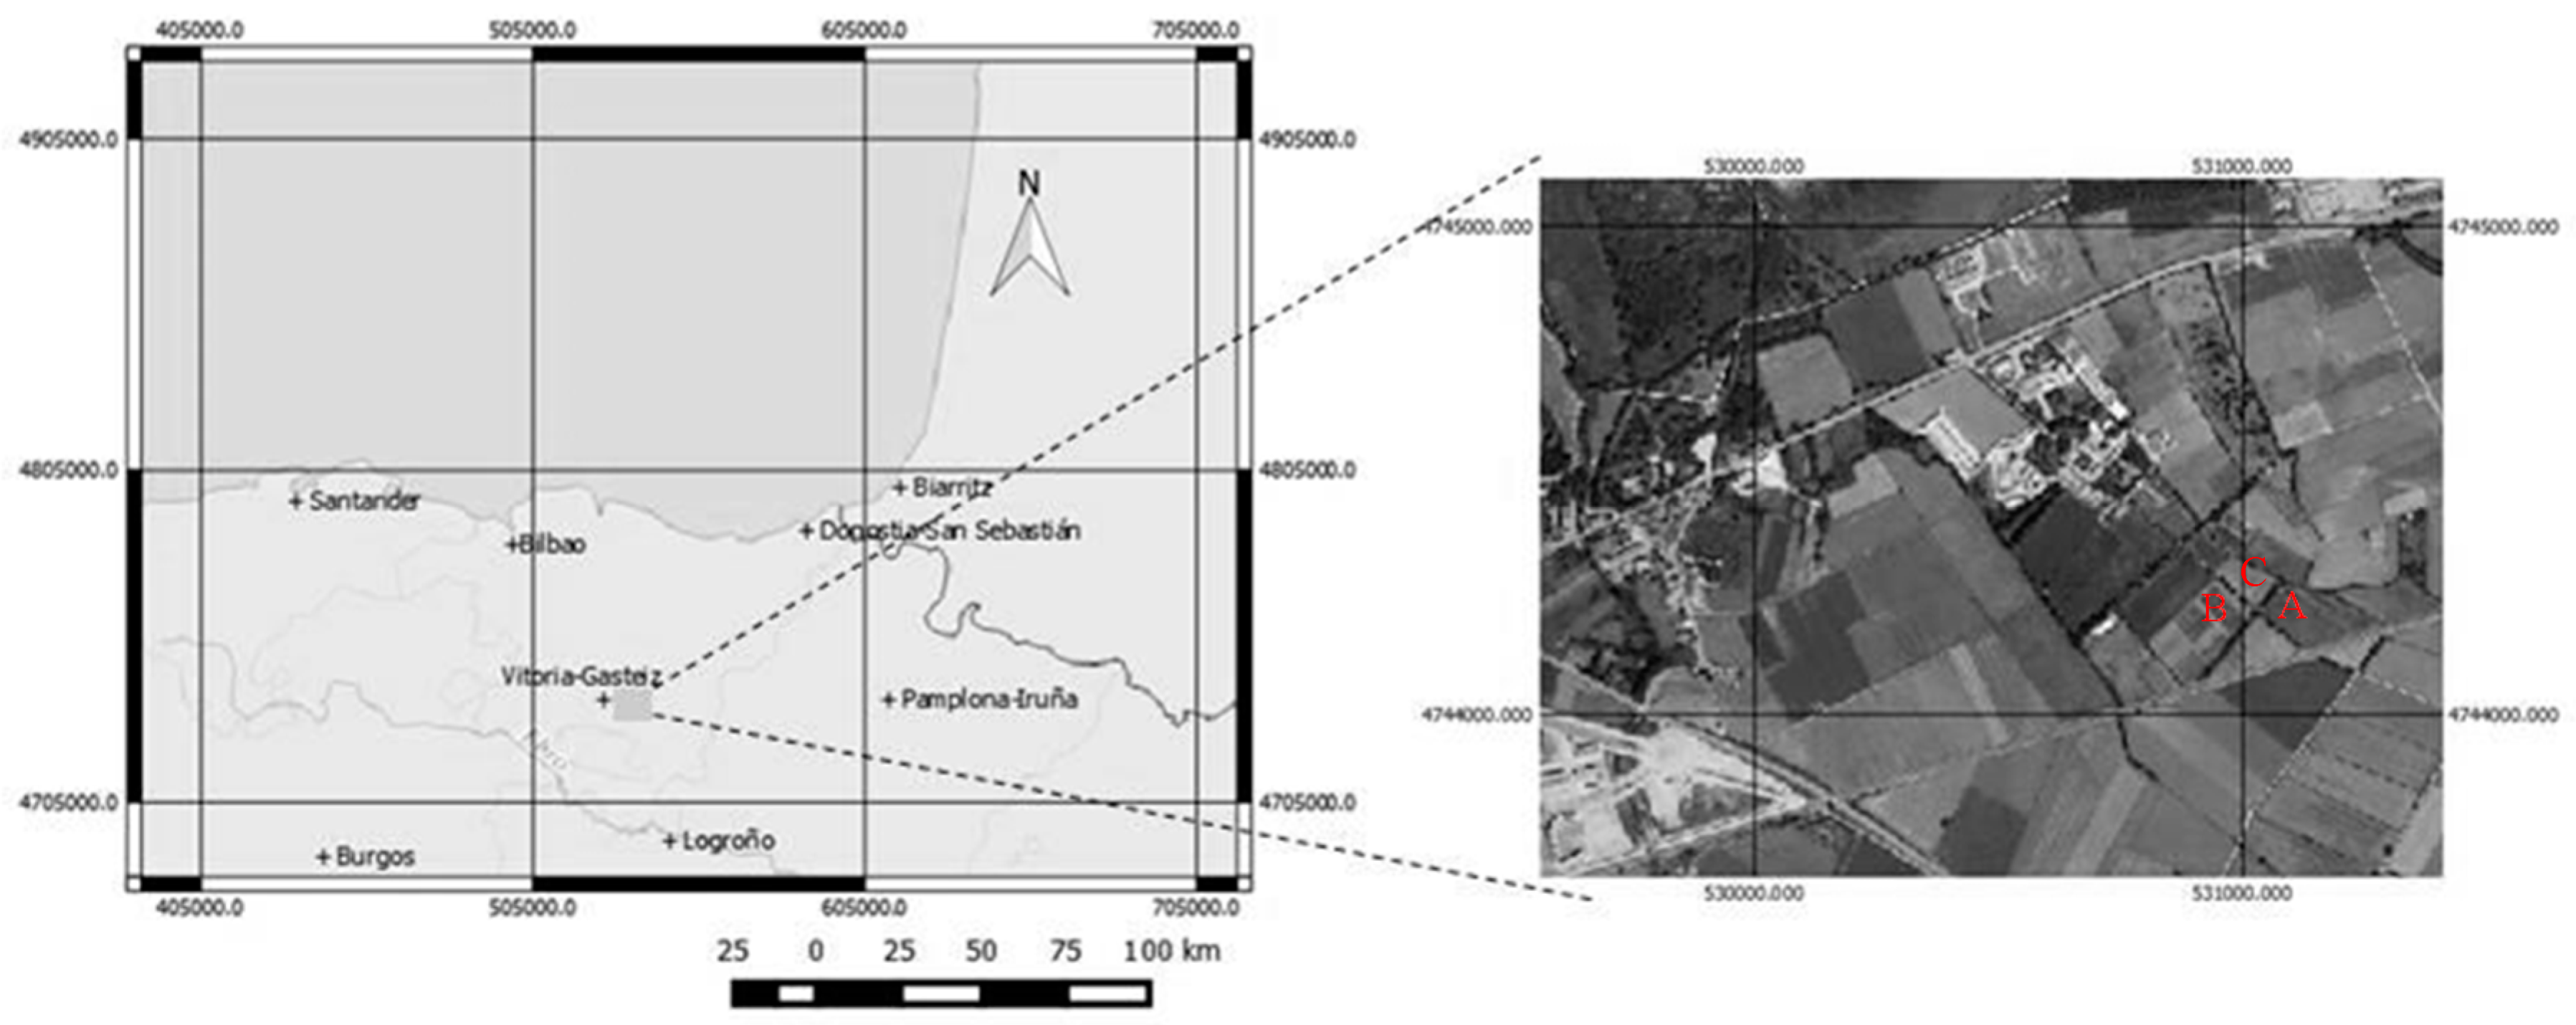
Figure 2.
Effect of the N fertilization rate at stem elongation (GS30) on yield (kg ha−1) in 2015 (a), 2016 (b) and 2017 (c); wheat-growing seasons with respect to initial fertilization: conventional treatment, dairy slurry, sheep manure. A quadratic plateau model was used to study the yield response. The arrow marked with C represents the N fertilization rate when the maximum yield was achieved by conventional treatment. S represents the N fertilization rate when the maximum yield was achieved by dairy slurry treatment, and M represents the N fertilization rate when the maximum yield was achieved by sheep manure treatment.

Figure 3.
Total rainfall (mm) and growing degree days (GDD, °C) between wheat growth stages [2] in three wheat-growing seasons (2015, 2016 and 2017) in Arkaute. Sow, sowing.
Figure 3.
Total rainfall (mm) and growing degree days (GDD, °C) between wheat growth stages [2] in three wheat-growing seasons (2015, 2016 and 2017) in Arkaute. Sow, sowing.

Figure 4.
Relation between initial fertilization (conventional treatment (40N), dairy slurry (DS) and sheep manure (SM)) and control (0N) and values obtained with tools for the diagnosis of the N nutritional status (RapidScan CS-45, Yara N-TesterTM) at stem elongation (GS30) in the 2015 (a), 2016 (b) and 2017 (c) wheat-growing seasons. Values were normalized assigning the 100% value to the overfertilized (280N) plot. Means with different lower-case letters (a, b) represent significant differences among initial treatments in Yara N-TesterTM (nor_NTester) measurements for each year (Tukey, p ≤0.05); means with different capital letters in italics (A, B) represent significant differences among initial treatments in NDVI RapidScan CS-45 measurements (nor_NDVI) for each year (Tukey, p ≤0.05); means with different underlined capital letters (A, B) represent significant differences among initial treatments in NDRE RapidScan CS-45 measurements (nor_NDRE) for each year (Tukey, p ≤0.05); means with different lower-case letters (y, z) represent significant differences among the three years in Yara N-TesterTM measurements (nor_NTester) for each treatment (Tukey, p ≤ 0.05); means with different capital letters in italics (Y, Z) represent significant differences among the three years for NDVI RapidScan CS-45 measurements (nor_NDVI) in each treatment (Tukey, p ≤ 0.05) and means with different underlined capital letters (Y, Z) represent significant differences among the three years for NDRE RapidScan CS-45 measurements (nor_NDRE) in each treatment (Tukey, p ≤ 0.05).
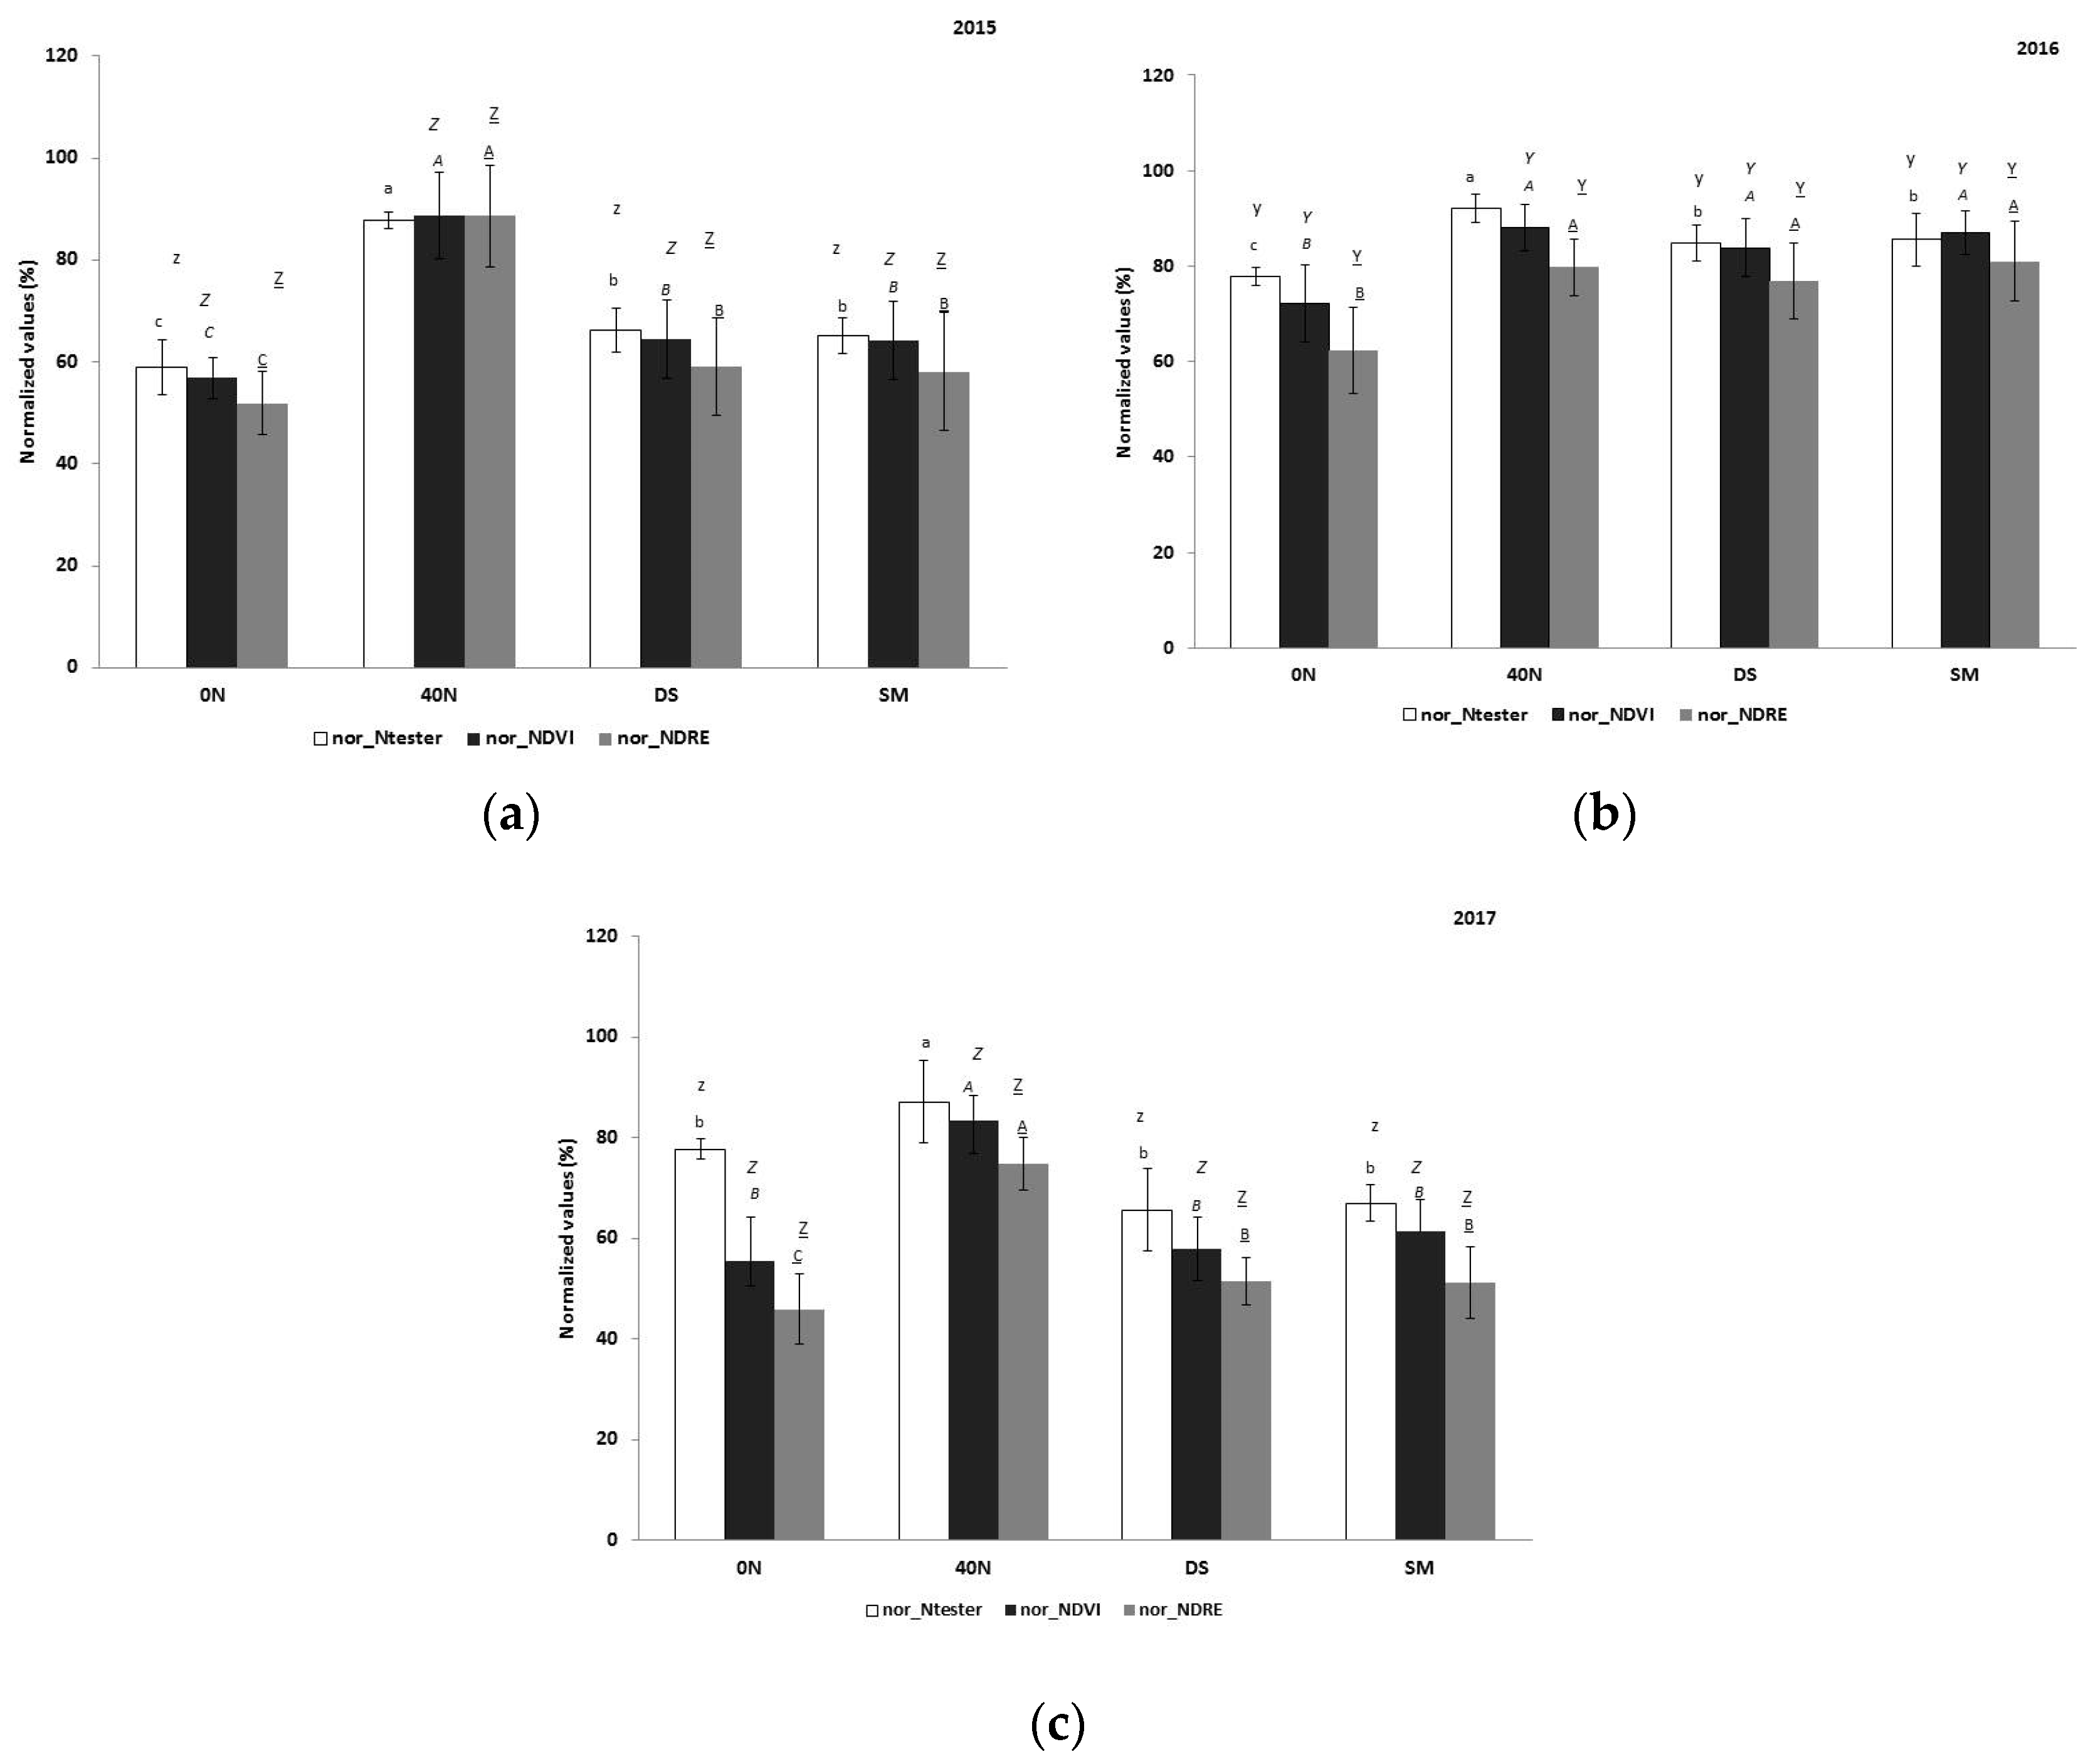

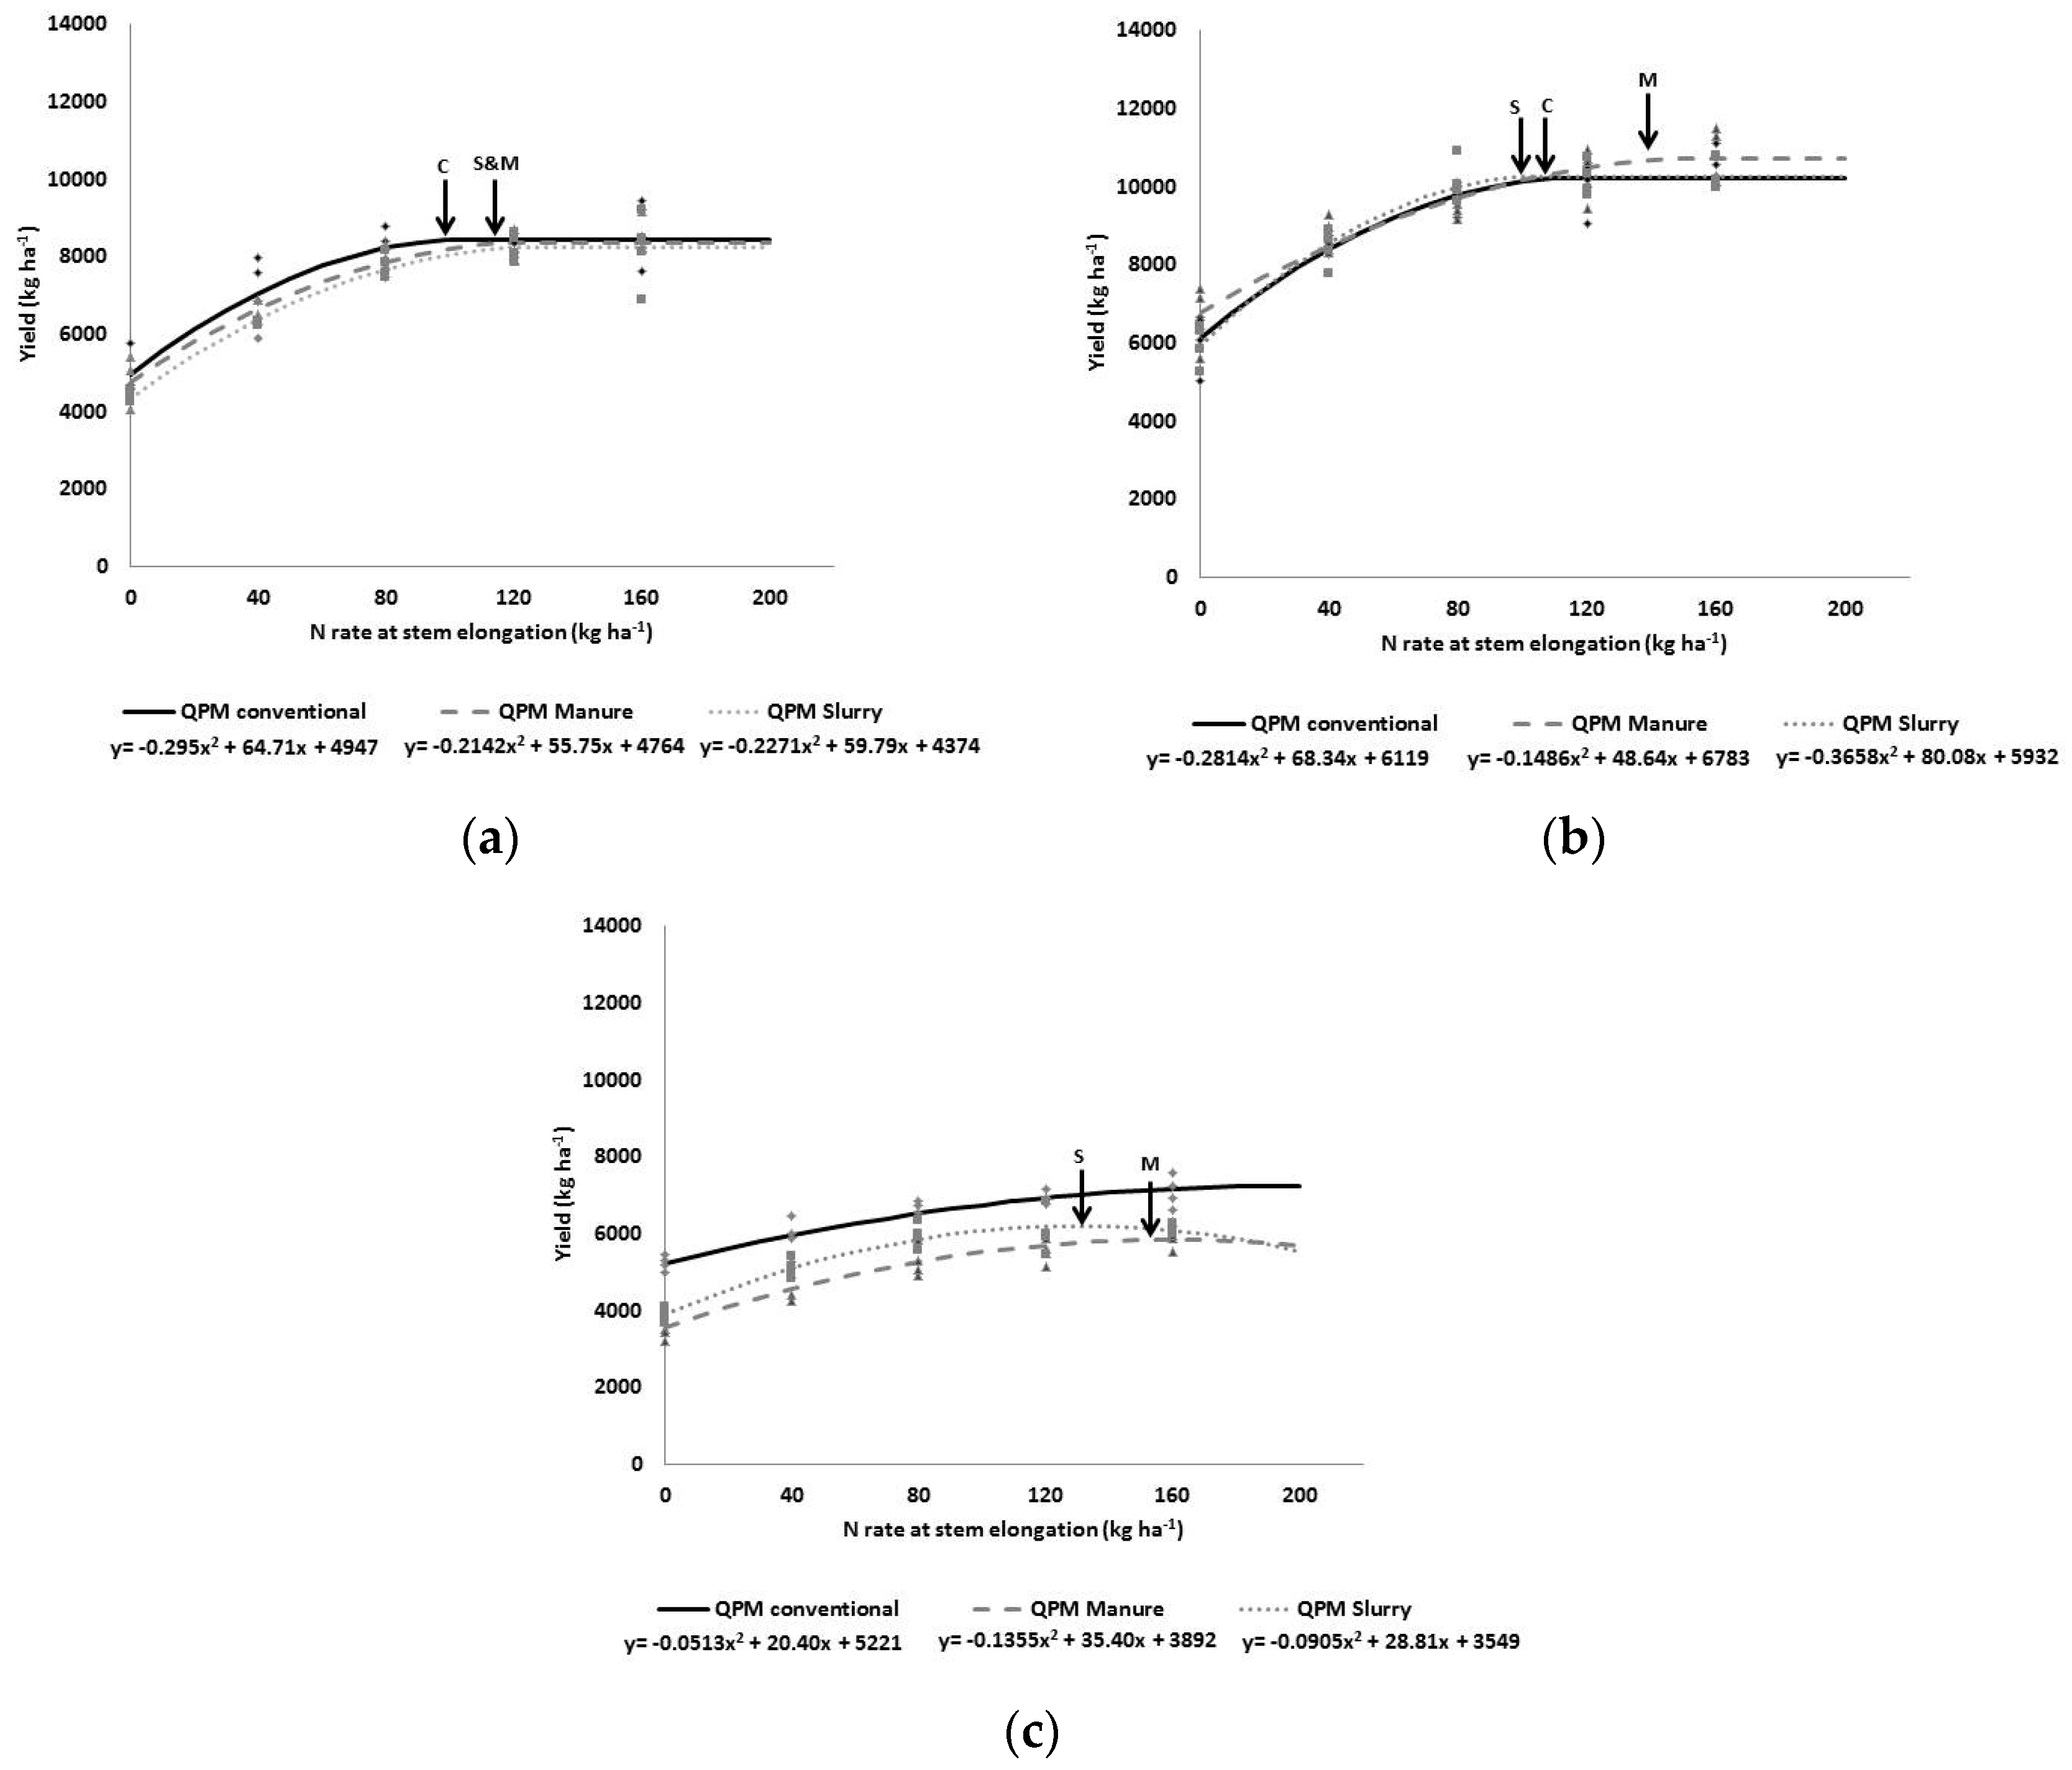
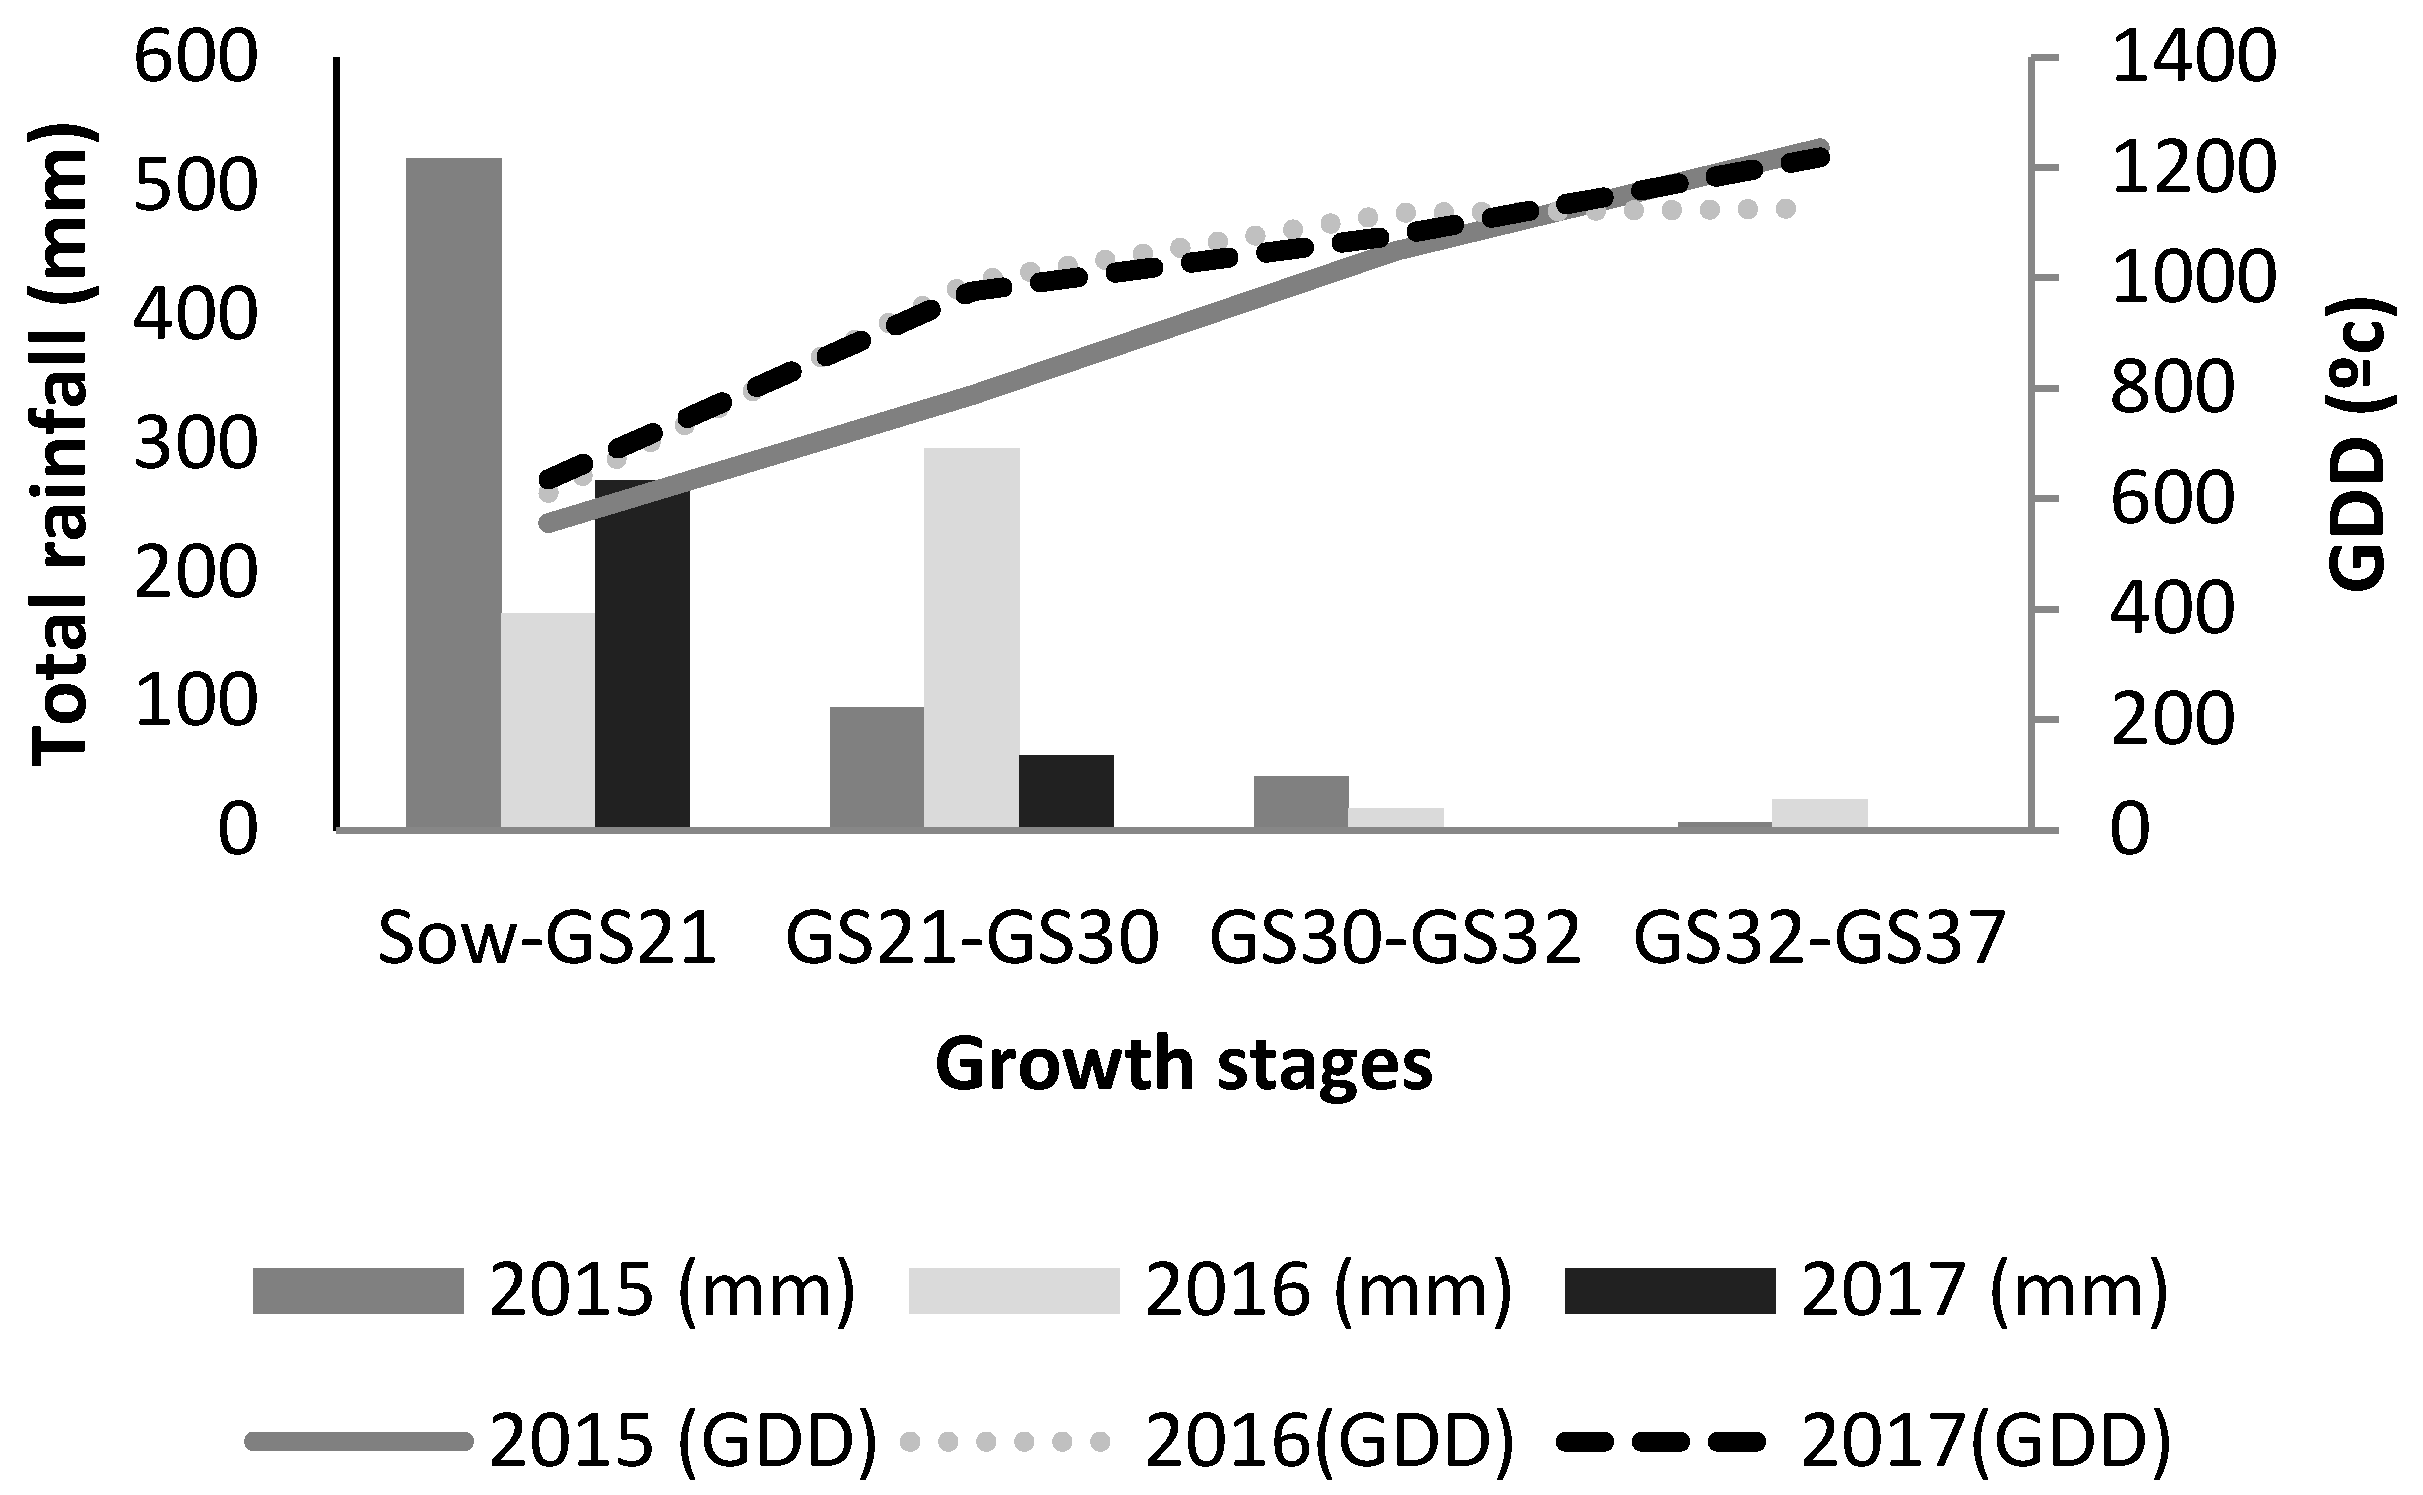
Table 1.
N application rates and timing for three initial fertilization treatments for field trial (2015, 2016 and 2017) and control (0N) and overfertilized (280N) plots. GS21 is the beginning of tillering (end of winter [2]); GS30 is the beginning of stem elongation [2].
| Initial Fertilization | 2015 | 2016 | 2017 | 2015–2016–2017 | Treatment Identification | ||||
|---|---|---|---|---|---|---|---|---|---|
| Total Na (kg ha−1) | N–NH4+b (kg ha−1) | Total Na (kg ha−1) | N–NH4+b (kg ha−1) | Total Na (kg ha−1) | N–NH4+b (kg ha−1) | Topdressing at GS21 (kg N ha−1) | Topdressing at GS30 (kg N ha−1) | ||
| Conventional [--] | -- | -- | -- | -- | -- | -- | 40 | 0 | 40N + 0N |
| 40 | 40N + 40N | ||||||||
| 80 | 40N + 80N | ||||||||
| 120 | 40N + 120N | ||||||||
| 160 | 40N + 160N | ||||||||
| Dairy Slurry (DS) [40 t ha−1] | 192 | 104 | 144 | 80 | 120 | 68 | -- | 0 | DS + 0N |
| 40 | DS + 4N | ||||||||
| 80 | DS + 80 N | ||||||||
| 120 | DS + 120N | ||||||||
| 160 | DS + 160N | ||||||||
| Sheep manure (SM) [40 t ha−1] | 336 | 0 | 592 | 200 | 448 | -- | -- | 0 | SM + 0N |
| 40 | SM + 40N | ||||||||
| 80 | SM + 80N | ||||||||
| 120 | SM + 120N | ||||||||
| 160 | SM + 120N | ||||||||
| Control | -- | -- | -- | -- | -- | -- | 0N | ||
| Overfertilized | -- | -- | -- | -- | 80 | 200 | 280N | ||
Table 2.
Soil Nmin content (kg N ha−1; 0–30 cm) at the beginning of the three wheat-growing seasons (2015, 2016 and 2017), beginning of tillering (GS21) and beginning of stem elongation (GS30) in Arkaute.
Table 2.
Soil Nmin content (kg N ha−1; 0–30 cm) at the beginning of the three wheat-growing seasons (2015, 2016 and 2017), beginning of tillering (GS21) and beginning of stem elongation (GS30) in Arkaute.
| Growing Season | Treatments | Nmin (0–30cm; kg N ha−1) | ||||
|---|---|---|---|---|---|---|
| Initial | GS21 | GS30 | ||||
| Mean Values | Mean Values | sd | Mean Values | sd | ||
| 2015 | 0N | 50 | 22 A | 5 | 12 b | 5 |
| 40 + 0N | 22 A | 5 | 13 b | 4 | ||
| DS + 0N | 4 B b | 1 | 13 | 9 | ||
| SM + 0N | 9 B b | 3 | 12 | 5 | ||
| 2016 | 0N | 42 | 30 | 9 | 1 c | 1 |
| 40 + 0N | 30 | 9 | 3 b | 1 | ||
| DS + 0N | 32 a | 4 | 4 | 0 | ||
| SM + 0N | 30 a | 2 | 1 | 4 | ||
| 2017 | 0N | 34 | 33 | 12 | 26 a | 3 |
| 40 + 0N | 33 | 12 | 32 a | 13 | ||
| DS + 0N | 36 a | 11 | 16 | 3 | ||
| SM + 0N | 16 ab | 12 | 14 | 11 | ||
Table 3.
Nitrogen Nutrition Index (NNI) at the beginning of tillering (GS21) and at stem elongation (GS30) for three initial fertilization treatments, as well as control (0N) and overfertilized (280), in three field trials (2015, 2016 and 2017) in Arkaute.
Table 3.
Nitrogen Nutrition Index (NNI) at the beginning of tillering (GS21) and at stem elongation (GS30) for three initial fertilization treatments, as well as control (0N) and overfertilized (280), in three field trials (2015, 2016 and 2017) in Arkaute.
| Growing Season | Treatments | NNI | |||
|---|---|---|---|---|---|
| GS21 | GS30 | ||||
| Mean Values | sd | Mean Values | sd | ||
| 2015 | OverFert | 0.37 b | 0.02 | ND | ND |
| 0N | 0.37 b | 0.02 | 0.26 b | 0.03 | |
| Conventional | 0.37 b | 0.02 | 0.35 b | 0.09 | |
| Dairy Slurry | 0.34 b | 0.05 | 0.37 | 0.08 | |
| Sheep manure | 0.38 b | 0.06 | 0.29 b | 0.02 | |
| 2016 | OverFert | 0.60 B a | 0.08 | 0.77 A a | 0.10 |
| 0N | 0.60 B a | 0.08 | 0.42 B a | 0.04 | |
| Conventional | 0.60 B a | 0.08 | 0.55 B a | 0.01 | |
| Dairy Slurry | 0.67 A a | 0.03 | 0.51 B | 0.03 | |
| Sheep manure | 0.68 A a | 0.05 | 0.51 B a | 0.07 | |
| 2017 | OverFert | 0.23 c | 0.02 | 0.80 A | 0.05 |
| 0N | 0.23 c | 0.02 | 0.33 C b | 0.03 | |
| Conventional | 0.23 c | 0.02 | 0.53 B a | 0.05 | |
| Dairy Slurry | 0.26 c | 0.02 | 0.38 C | 0.04 | |
| Sheep manure | 0.23 c | 0.04 | 0.37 C b | 0.05 | |
Table 4.
Absolute values obtained with tools for the diagnosis of the N nutritional status (Yara N-TesterTM and RapidScan CS-45) at stem elongation (GS30) for three initial fertilization treatments and control (0 N) in three wheat-growing seasons (2015, 2016 and 2017) in Arkaute.
Table 4.
Absolute values obtained with tools for the diagnosis of the N nutritional status (Yara N-TesterTM and RapidScan CS-45) at stem elongation (GS30) for three initial fertilization treatments and control (0 N) in three wheat-growing seasons (2015, 2016 and 2017) in Arkaute.
| Growing Season | Treatments | abs_Ntester | RapidScan CS-45 | ||||
|---|---|---|---|---|---|---|---|
| abs_NDVI | abs_NDRE | ||||||
| Mean Values | sd | Mean Values | sd | Mean Values | sd | ||
| 2015 | 0N | 304b z | 34 | 0.35 B Z | 0.04 | 0.12 B Z | 0.01 |
| 40N | 460 a | 22 | 0.54 A Z | 0.04 | 0.20 A Z | 0.02 | |
| DS | 334 b z | 16 | 0.39 B Z | 0.04 | 0.14 B Z | 0.02 | |
| SM | 332 b z | 10 | 0.39 B Z | 0.05 | 0.13 B Z | 0.02 | |
| 2016 | 0N | 403 c y | 8 | 0.55 B Y | 0.05 | 0.18 B Y | 0.02 |
| 40N | 477 a | 14 | 0.67 AY | 0.02 | 0.24 A Y | 0.15 | |
| DS | 438 b y | 15 | 0.65 AY | 0.04 | 0.23 A Y | 0.02 | |
| SM | 442 b y | 28 | 0.66 AY | 0.03 | 0.23 A Y | 0.02 | |
| 2017 | 0N | 377 b z | 13 | 0.39 C Y | 0.06 | 0.12 B | 0.01 |
| 40N | 507 a | 54 | 0.59 A Z | 0.03 | 0.19 A | 0.01 | |
| DS | 382 b z | 53 | 0.43 B Z | 0.04 | 0.13 B | 0.01 | |
| SM | 389 b z | 12 | 0.41 C Z | 0.04 | 0.13 B | 0.01 | |
Table 5.
Normalized values (nor_Ntester, nor_NDVI, nor_NDRE) obtained with tools for the diagnosis of the N nutritional status (Yara N-Tester and RapidScan CS-45) at stem elongation (GS30) and their corresponding optimal N application at GS30 for dairy slurry and conventional treatments.
Table 5.
Normalized values (nor_Ntester, nor_NDVI, nor_NDRE) obtained with tools for the diagnosis of the N nutritional status (Yara N-Tester and RapidScan CS-45) at stem elongation (GS30) and their corresponding optimal N application at GS30 for dairy slurry and conventional treatments.
| Initial Fertilization | Proximal Tool Readings at GS30 (%) | Optimal N Application at GS30 (kg N ha−1) |
|---|---|---|
| Dairy Slurry | 60–65 | 118–128 |
| Dairy Slurry/Conventional | 85–90 | 100–110 |
© 2019 by the authors. Licensee MDPI, Basel, Switzerland. This article is an open access article distributed under the terms and conditions of the Creative Commons Attribution (CC BY) license (http://creativecommons.org/licenses/by/4.0/).
Share and Cite
MDPI and ACS Style
Aranguren, M.; Castellón, A.; Aizpurua, A. Crop Sensor-Based In-Season Nitrogen Management of Wheat with Manure Application. Remote Sens. 2019, 11, 1094. https://doi.org/10.3390/rs11091094
AMA Style
Aranguren M, Castellón A, Aizpurua A. Crop Sensor-Based In-Season Nitrogen Management of Wheat with Manure Application. Remote Sensing. 2019; 11(9):1094. https://doi.org/10.3390/rs11091094
Chicago/Turabian StyleAranguren, Marta, Ander Castellón, and Ana Aizpurua. 2019. "Crop Sensor-Based In-Season Nitrogen Management of Wheat with Manure Application" Remote Sensing 11, no. 9: 1094. https://doi.org/10.3390/rs11091094
Note that from the first issue of 2016, this journal uses article numbers instead of page numbers. See further details here.