Identification of a Threshold Minimum Area for Reflectance Retrieval from Thermokarst Lakes and Ponds Using Full-Pixel Data from Sentinel-2

 ,
,  ,
,  ,
,
Abstract
:
1. Introduction
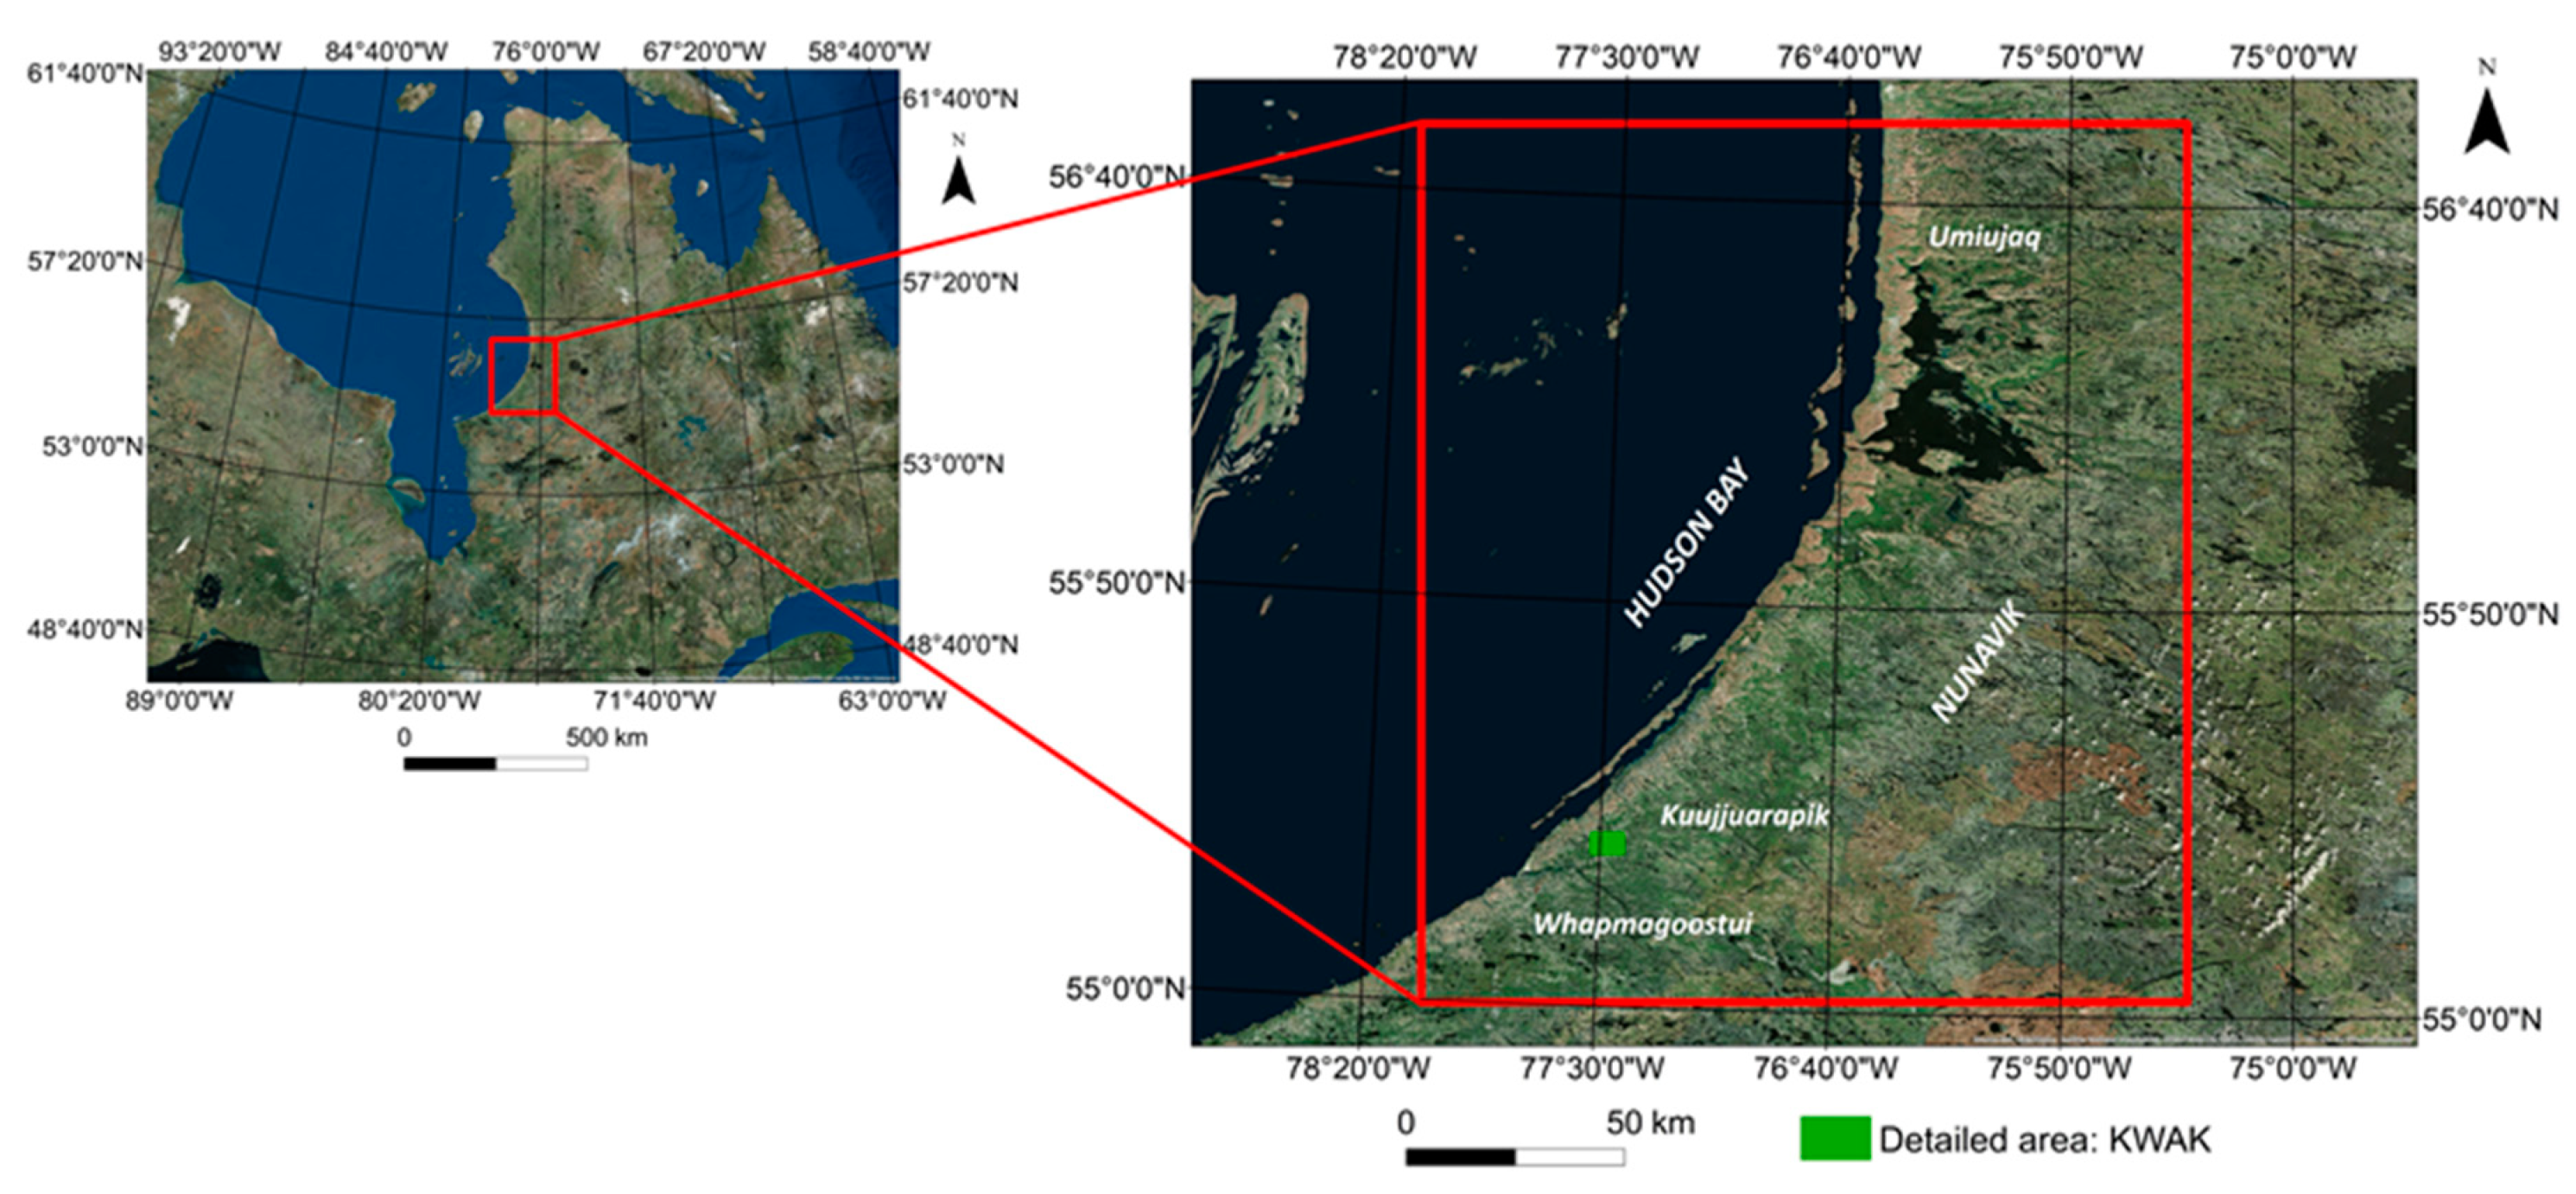
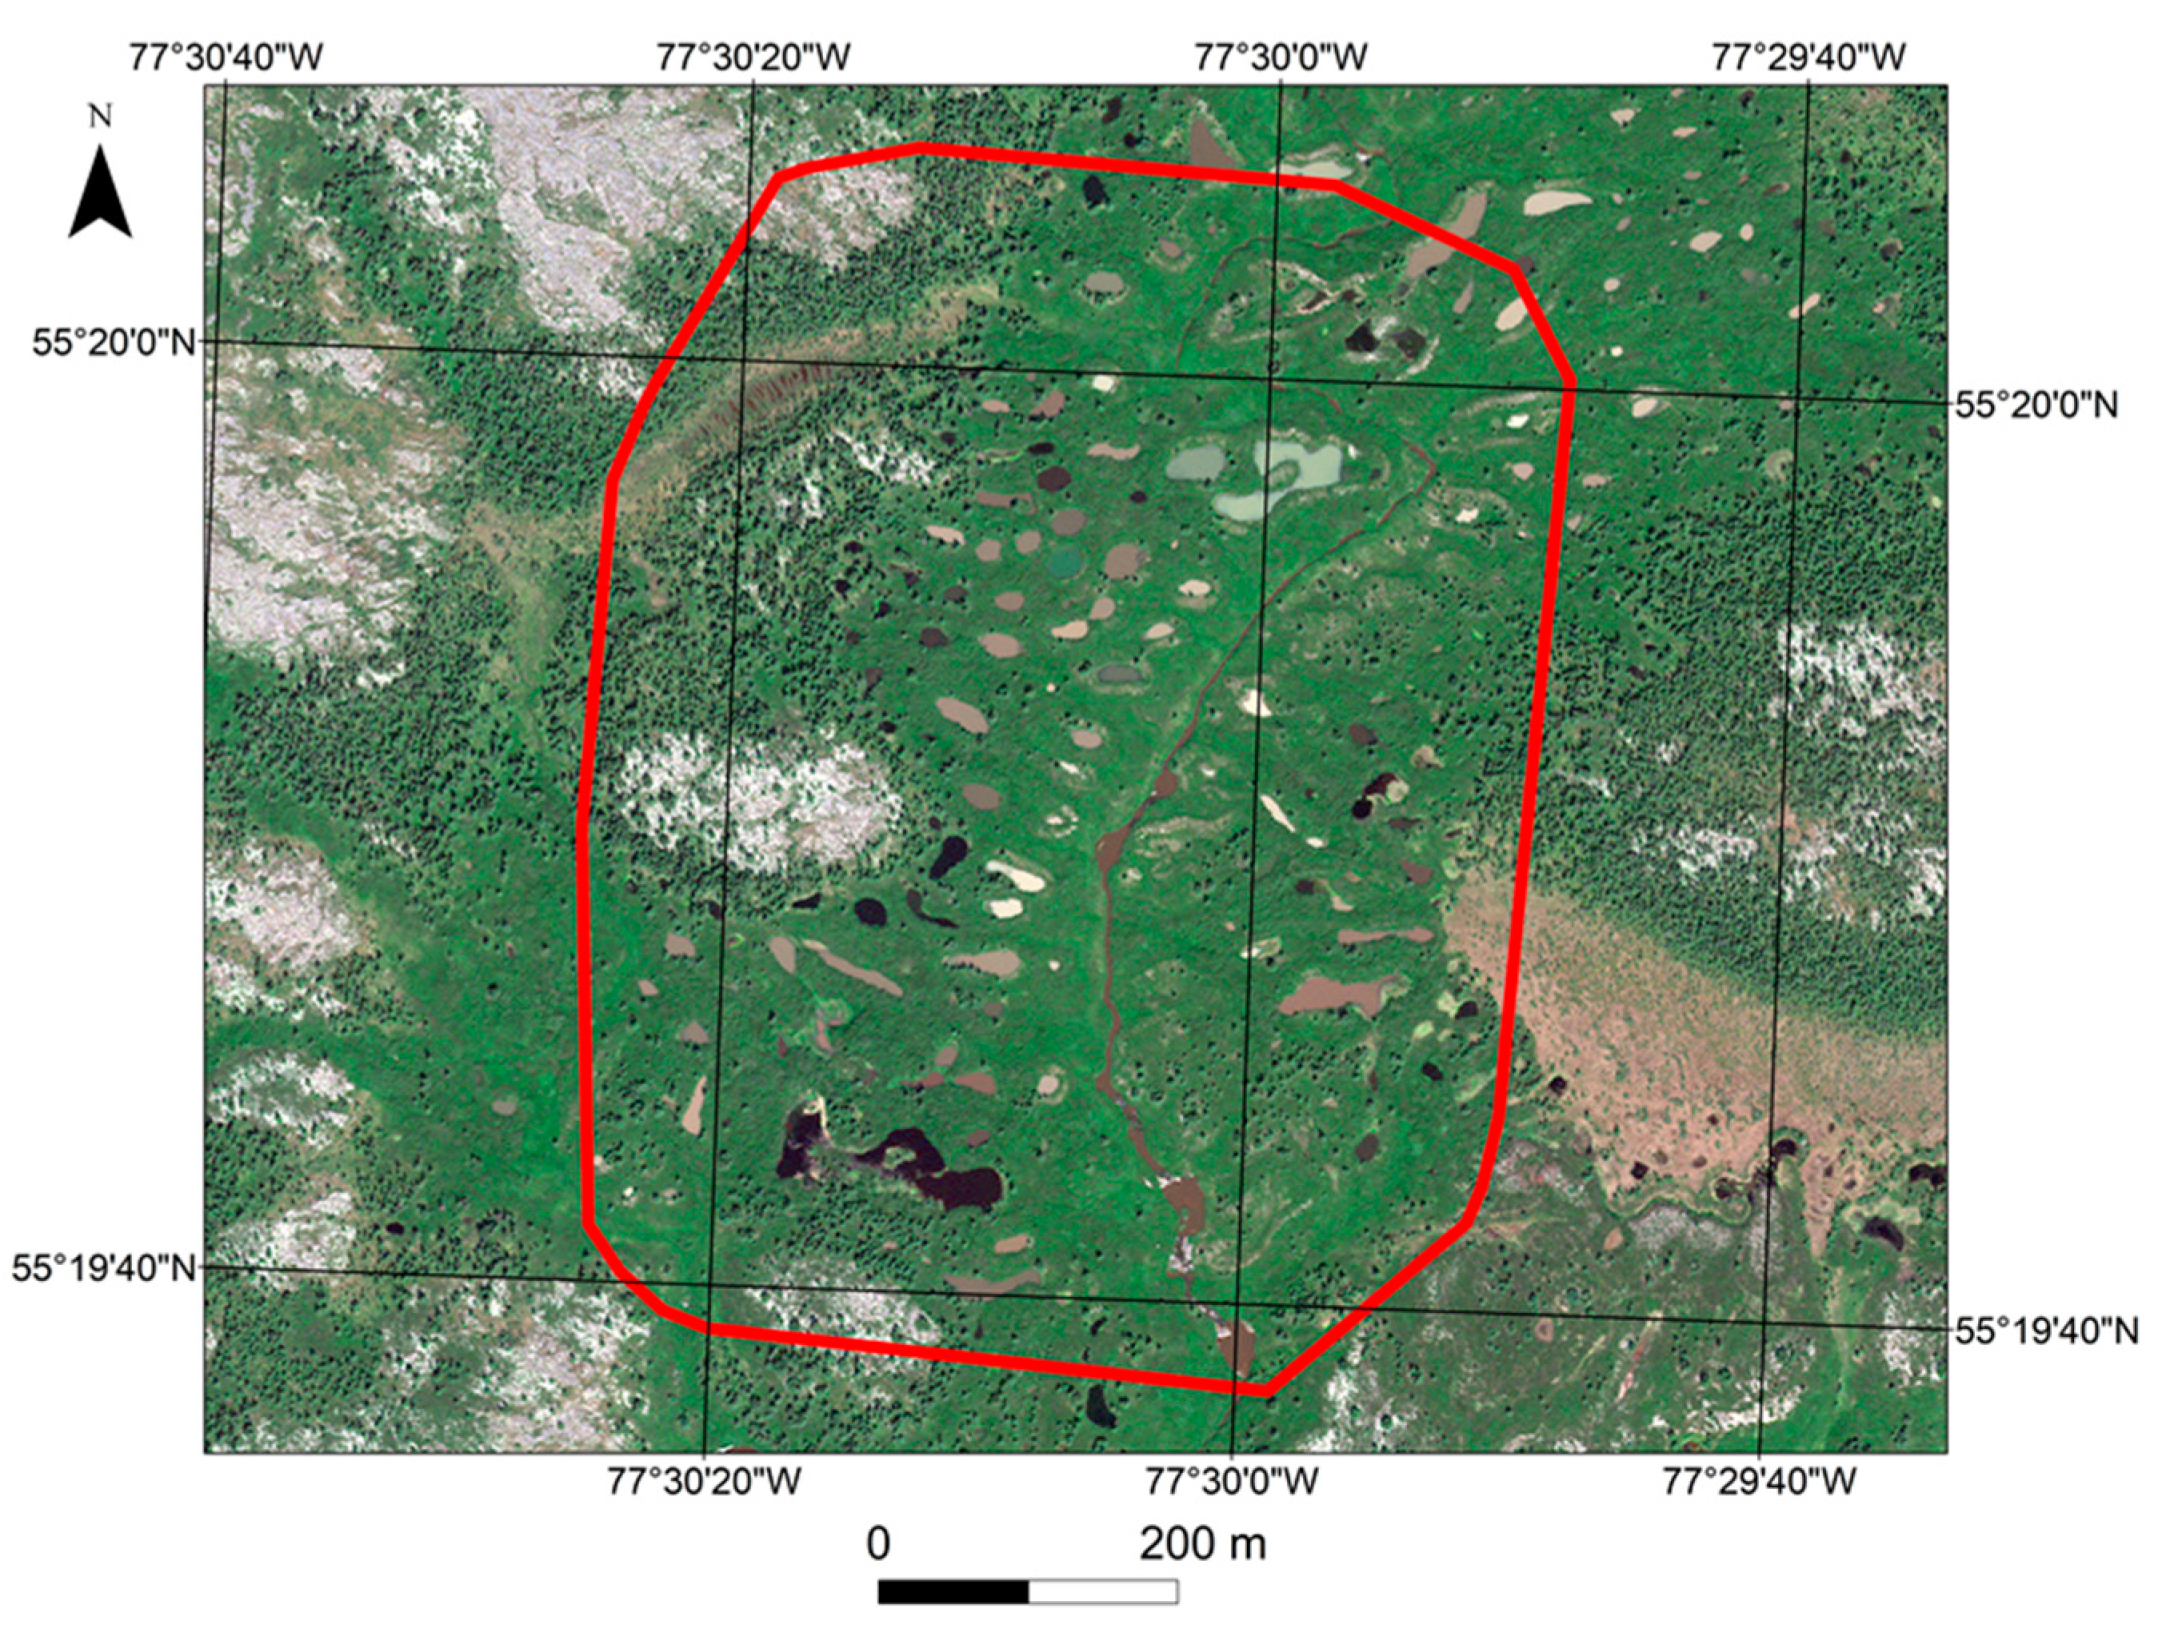
2. Study Area
3. Materials and Methods
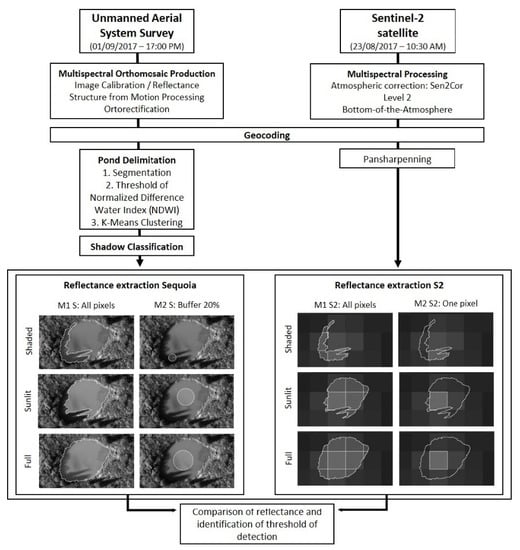
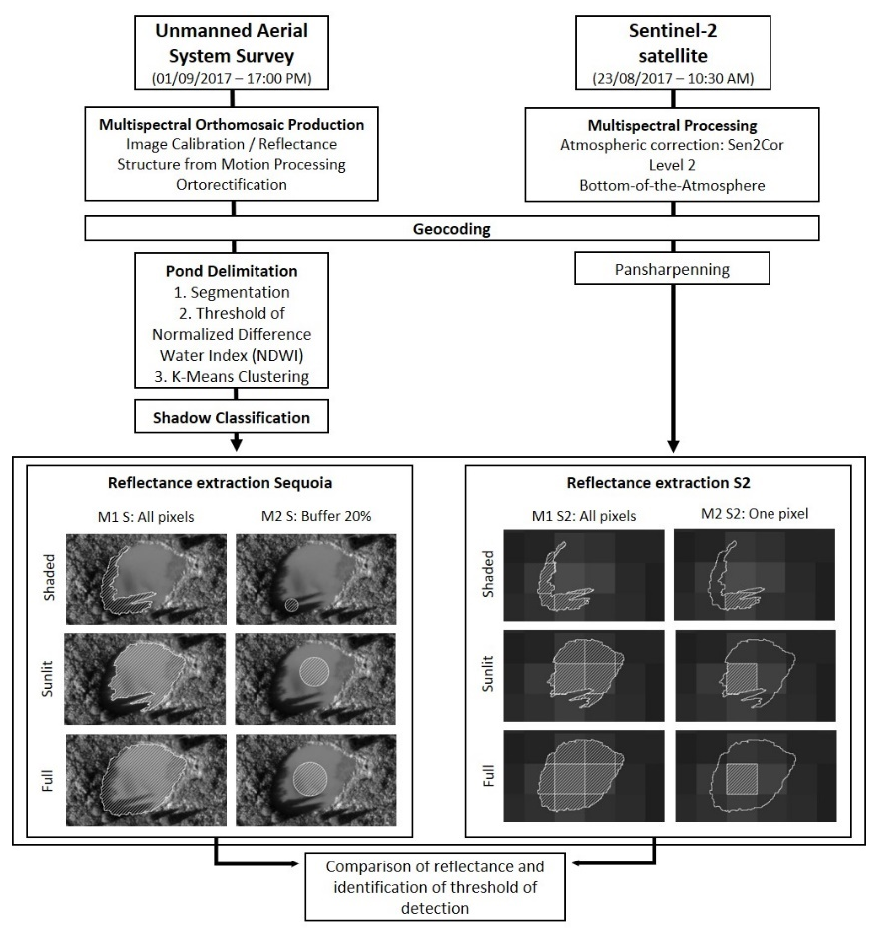
3.1. Workflow
3.2. Characteristics of the Remote Sensing Data
3.3. Processing of the UAS Imagery
3.4. Delineation of the Thermokarst Lakes and Ponds
3.4.1. Segmentation
3.4.2. Classification
3.4.3. Clustering
3.5. Limitations and Base Assumptions
3.6. Methods for Extraction of Sensor Reflectance
4. Results
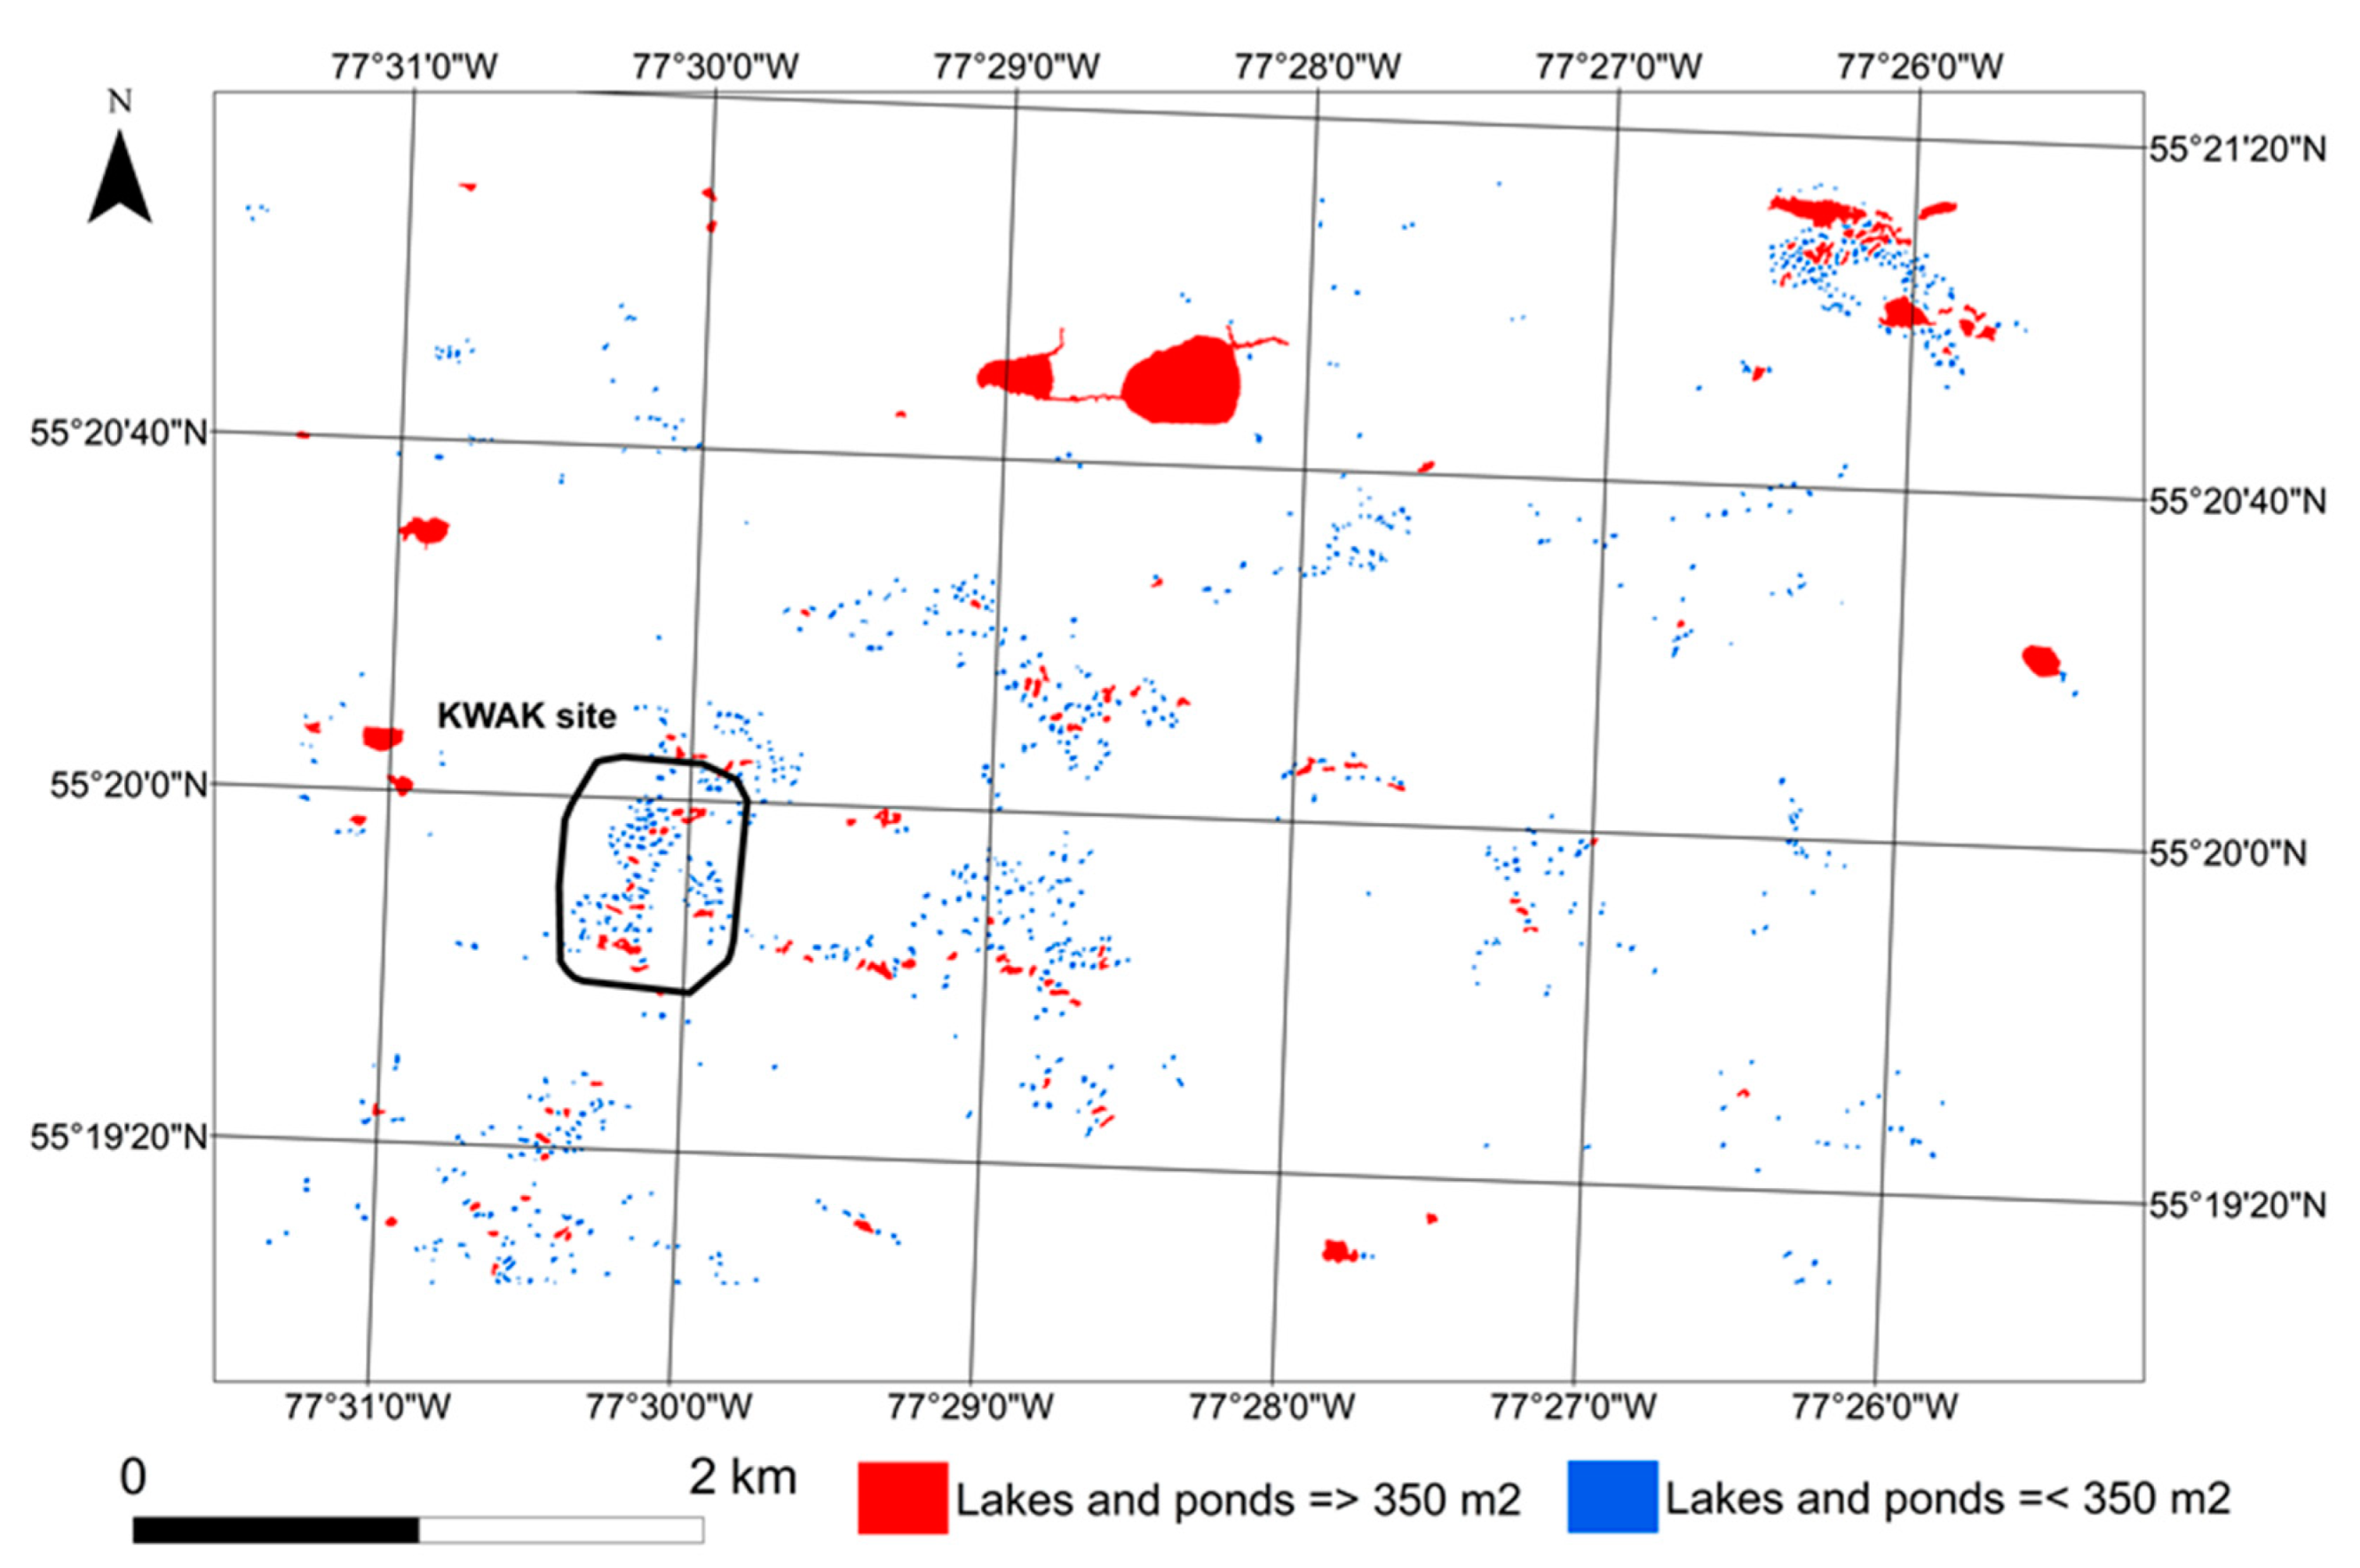
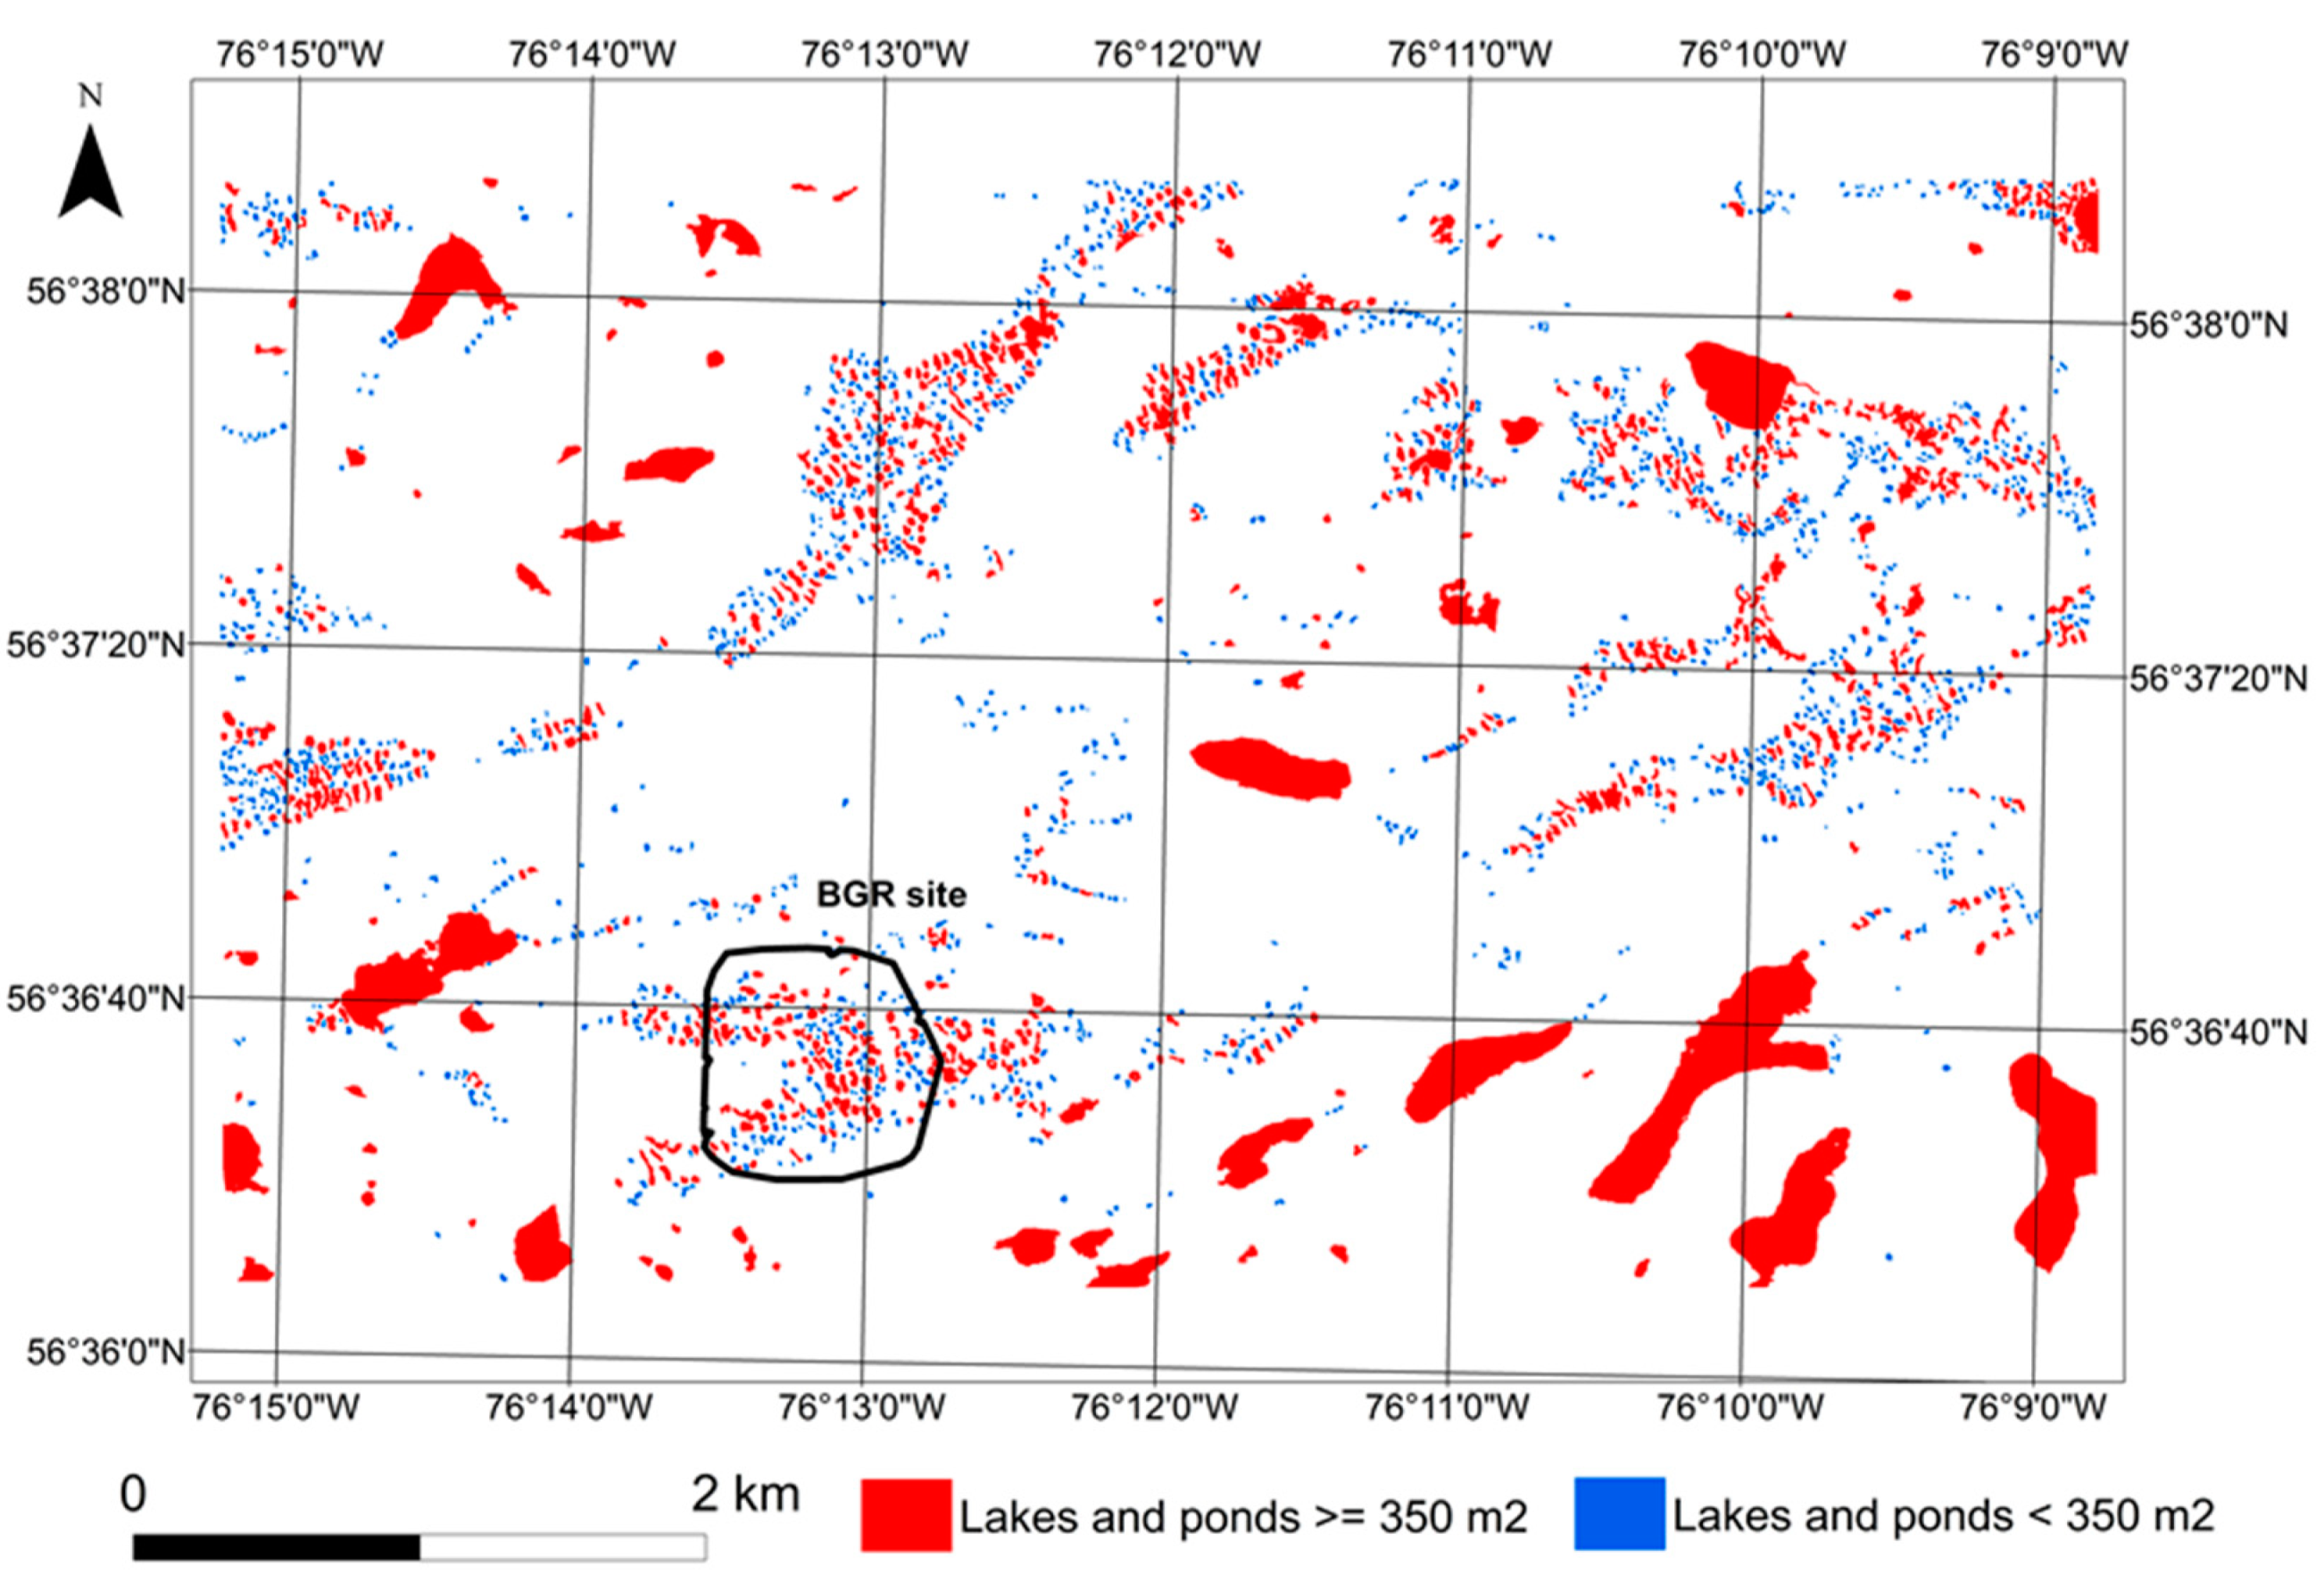
4.1. Characteristics of the Themokarst Lakes and Ponds
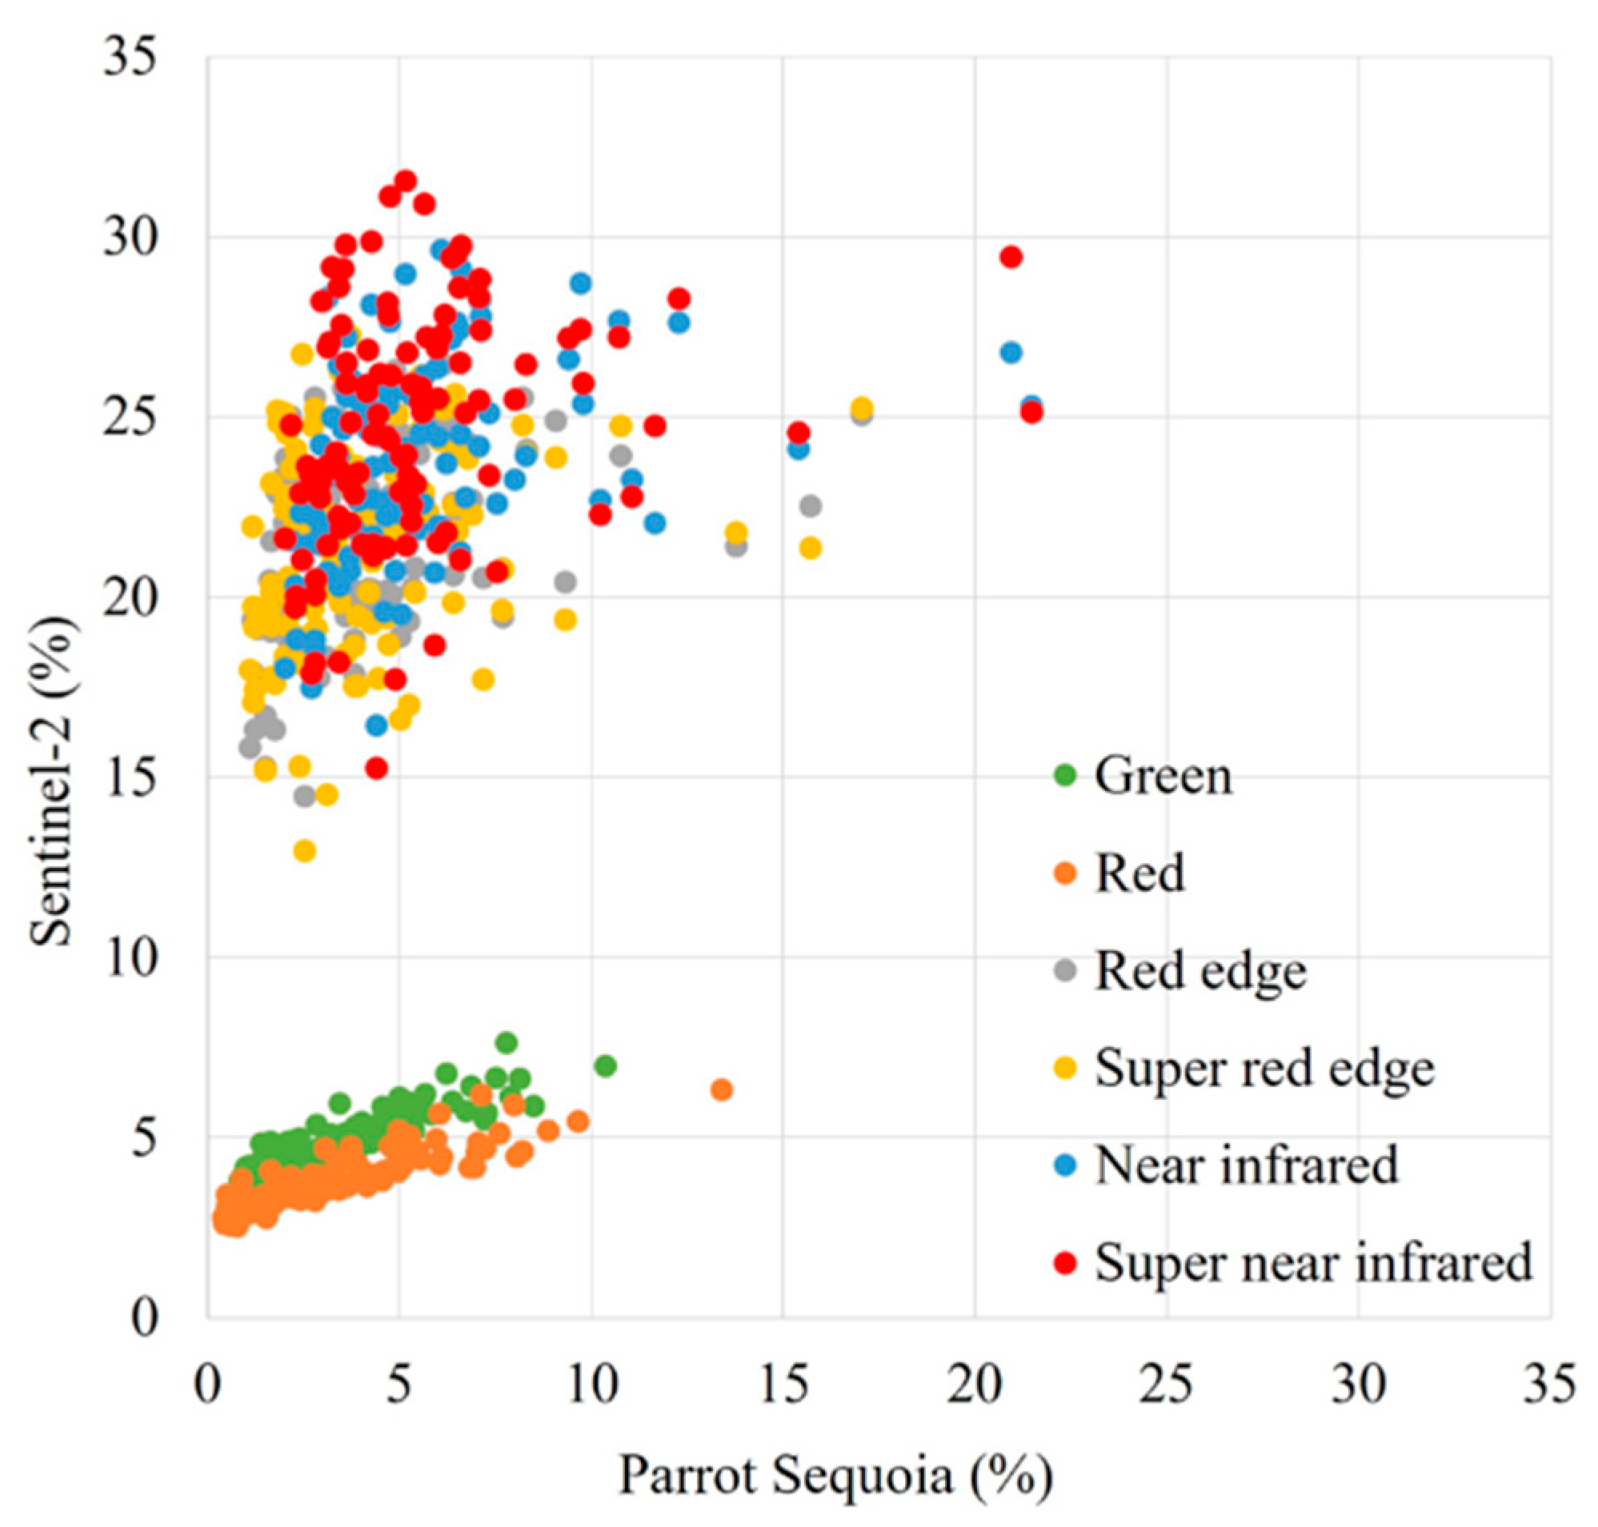
4.2. Evaluation of the Potential of Sentinel-2 for the Characterization of Small Water Bodies
4.3. Identification of the Minimum Water Body Area Allowing for Spectral Characterization by Sentinel-2 Imagery
5. Discussion
6. Conclusions
Author Contributions
Funding
Acknowledgments
Conflicts of Interest
References
- Schuur, E.A.G.; McGuire, A.D.; Schädel, C.; Grosse, G.; Harden, J.W.; Hayes, D.J.; Hugelius, G.; Koven, C.D.; Kuhry, P.; Lawrence, D.M.; et al. Climate change and the permafrost carbon feedback. Nature 2015, 520, 171–179. [Google Scholar] [CrossRef] [PubMed]
- Vincent, W.F.; Lemay, M.; Allard, M. Arctic permafrost landscapes in transition: Towards an integrated Earth system approach. Arct. Sci. 2017, 3, 39–64. [Google Scholar] [CrossRef]
- Wauthy, M.; Rautio, M.; Christoffersen, K.S.; Forsström, L.; Laurion, I.; Mariash, H.L.; Peura, S.; Vincent, W.F. Increasing dominance of terrigenous organic matter in circumpolar freshwaters due to permafrost thaw. Limnol. Oceanogr. 2018, 3, 186–198. [Google Scholar] [CrossRef]
- Laurion, I.; Vincent, W.F.; MacIntyre, S.; Retamal, L.; Dupont, C.; Francus, P.; Pienitz, R. Variability in greenhouse gas emissions from permafrost thaw ponds. Limnol. Oceanogr. 2010, 55, 115–133. [Google Scholar] [CrossRef]
- Matveev, A.; Laurion, I.; Deshpande, B.N.; Bhiry, N.; Vincent, W.F. High methane emissions from thermokarst lakes in subarctic peatlands. Limnol. Oceanogr. 2016, 61, S150–S164. [Google Scholar] [CrossRef]
- Bouchard, F.; Francus, P.; Pienitz, R.; Laurion, I.; Feyte, S. Subarctic thermokarst ponds: Investigating recent landscape evolution and sediment dynamics in thawed permafrost of northern Québec (Canada). Arct. Antarct. Alp. Res. 2014, 46, 251–271. [Google Scholar] [CrossRef]
- Polishchuk, Y.M.; Bryksina, N.A.; Polishchuk, V.Y. Remote analysis of changes in the number of small thermokarst lakes and their distribution with respect to their sizes in the cryolithozone of western Siberia. Izv. Atmos. Ocean. Phys. 2015, 51, 999–1006. [Google Scholar] [CrossRef]
- Anthony, W.K.; Deimling, T.S.; Nitze, I.; Frolking, S.; Emond, A.; Daanen, R.; Anthony, P.; Lindgren, P.; Jones, B.; Grosse, G. 21st-century modeled permafrost carbon emissions accelerated by abrupt thaw beneath lakes. Nat. Commun. 2018, 9, 3262. [Google Scholar] [CrossRef] [PubMed]
- Kokelj, S.V.; Jorgenson, M.T. Advances in thermokarst research. Permafr. Periglac. Process. 2013, 24, 108–119. [Google Scholar] [CrossRef]
- Breton, J.; Vallières, C.; Laurion, I. Limnological properties of permafrost thaw ponds in northeastern Canada. Can. J. Fish. Aquat. Sci. 2009, 66, 1635–1648. [Google Scholar] [CrossRef]
- Watanabe, S.; Laurion, I.; Chokmani, K.; Pienitz, R.; Vincent, W.F. Optical diversity of thaw ponds in discontinuous permafrost: A model system for water color analysis. J. Geophys. Res. 2011, 116, 1–17. [Google Scholar] [CrossRef]
- Bouchard, F.; Francus, P.; Pienitz, R.; Laurion, I. Sedimentology and geochemistry of thermokarst ponds in discontinuous permafrost, subarctic Quebec, Canada. J. Geophys. Res. 2011, 116, 1–14. [Google Scholar] [CrossRef]
- Payette, S.; Delwaide, A.; Caccianiga, M.; Beauchemin, M. Accelerated thawing of subarctic peatland permafrost over the last 50 years. Geophys. Res. Lett. 2004, 31, 1–4. [Google Scholar] [CrossRef]
- Ropars, P.; Boudreau, S. Shrub expansion at the forest–tundra ecotone: Spatial heterogeneity linked to local topography. Environ. Res. Lett. 2012, 7, 015501. [Google Scholar] [CrossRef]
- Kuhn, M.; Lundin, E.J.; Giesler, R.; Johansson, M.; Karlsson, J. Emissions from thaw ponds largely offset the carbon sink of northern permafrost wetlands. Sci. Rep. 2018, 8, 9535. [Google Scholar] [CrossRef]
- Muster, S.; Heim, B.; Abnizova, A.; Boike, J. Water body distributions across scales: A remote sensing based comparison of three Arctic tundra wetlands. Remote Sens. 2013, 5, 1498–1523. [Google Scholar] [CrossRef]
- Tian, B.; Li, Z.; Zhang, M.; Huang, L.; Qiu, Y.; Li, Z.; Tang, P. Mapping thermokarst lakes on the Qinghai–Tibet plateau using nonlocal active contours in Chinese GaoFen-2 multispectral imagery. IEEE J. Sel. Top. Appl. Earth Obs. Remote Sens. 2017, 10, 1687–1700. [Google Scholar] [CrossRef]
- Verpoorter, C.; Kutser, T.; Seekell, D.A.; Tranvik, L.J. A global inventory of lakes based on high-resolution satellite imagery. Geophys. Res. Lett. 2014, 41, 6396–6402. [Google Scholar] [CrossRef] [Green Version]
- Pekel, J.-F.; Cottam, A.; Gorelick, N.; Belward, A.S. High-resolution mapping of global surface water and its long-term changes. Nature 2016, 540, 418–422. [Google Scholar] [CrossRef]
- Muster, S.; Roth, K.; Langer, M.; Lange, S.; Aleina, F.C.; Bartsch, A.; Morgenstern, A.; Grosse, G.; Jones, B.; Sannel, A.B.K.; et al. PeRL: A circum-Arctic permafrost region pond and lake database. Earth Syst. Sci. Data 2017, 9, 317–348. [Google Scholar] [CrossRef]
- Hese, S.; Grosse, G.; Pöcking, S. Object based thermokarst lake change mapping as part of the ESA data user element (DUE) permafrost. ISPRS 2010, XXXVIII-4/C7, 1682–1777. [Google Scholar]
- Du, Y.; Zhang, Y.; Ling, F.; Wang, Q.; Li, W.; Li, X. Water bodies’ mapping from Sentinel-2 imagery with modified normalized difference water index at 10-m spatial resolution produced by sharpening the SWIR band. Remote Sens. 2016, 8, 354. [Google Scholar] [CrossRef]
- Toming, K.; Kutser, T.; Laas, A.; Sepp, M.; Paavel, B.; Nõges, T. First experiences in mapping lake water quality parameters with Sentinel-2 MSI imagery. Remote Sens. 2016, 8, 640. [Google Scholar] [CrossRef]
- Manfreda, S.; McCabe, M.F.; Miller, P.E.; Lucas, R.; Madrigal, V.P.; Mallinis, G.; Dor, E.B.; Helman, D.; Estes, L.; Ciraolo, G.; et al. On the use of unmanned aerial systems for environmental monitoring. Remote Sen. 2018, 10, 641. [Google Scholar] [CrossRef]
- Bhiry, N.; Delwaide, A.; Allard, M.; Bégin, Y.; Filion, L.; Lavoie, M.; Nozais, C.; Payette, S.; Pienitz, R.; Saulnier-Talbot, E.; Vincent, W.F. Environmental change in the Great Whale River region, Hudson Bay: Five decades of multidisciplinary research by Centre d’études nordiques (CEN). Écoscience 2011, 18, 182–203. [Google Scholar] [CrossRef]
- McManus, K.M.; Morton, D.C.; Masek, J.G.; Wang, D.; Sexton, J.O.; Nagol, J.; Ropars, P.; Boudreau, S. Satellite-based evidence for shrub and graminoid tundra expansion in northern Quebec from 1986 to 2010. Glob. Chang. Boil. 2012, 18, 2313–2323. [Google Scholar] [CrossRef] [Green Version]
- Dufour-Tremblay, G.; Vriendt, L.D.; Lévesque, E.; Boudreau, S. The importance of ecological constrains on the control of multi-species treeline dynamics in Eastern Nunavik, Québec. Am. J. Bot. 2012, 99, 1638–1646. [Google Scholar] [CrossRef] [PubMed]
- Tremblay, B.; Lévesque, E.; Boudreau, S. Recent expansion of erect shrubs in the Low Arctic: Evidence from Eastern Nunavik. Environ. Res. Lett. 2012, 7, 035501. [Google Scholar] [CrossRef]
- Bégin, P.N.; Vincent, W.F. Permafrost thaw lakes and ponds as habitats for abundant rotifer populations. Arct. Sci. 2017, 3, 354–377. [Google Scholar] [CrossRef] [Green Version]
- Assmann, J.J.; Kerby, J.T.; Cunliffe, A.M.; Myers-Smith, I.H. Vegetation monitoring using multispectral sensors—Best practices and 3 lessons learned from high latitudes. NRC J. Unmanned Veh. Syst. 2019, 7, 54–75. [Google Scholar] [CrossRef]
- MicaSense. Sequoia User Guide; Drones Parrot SAS: Paris, France, 2018; pp. 4–33. [Google Scholar]
- ESA. Sentinel-2: ESA’s Optical High-Resolution Mission for GMES Operational Services; European Space Agency: Noordwijk, The Netherlands, 2012; pp. 15–45. [Google Scholar]
- Brodu, N. Super-resolving multiresolution images with band-independent geometry of multispectral pixels. IEEE Trans. Geosci. Remote Sens. 2017, 55, 4610–4617. [Google Scholar] [CrossRef]
- Pix4D. Pix4Dmapper 4.0 User Manual; Pix4D SA: Lausanne, Switzerland, 2017. [Google Scholar]
- Canadian Digital Elevation Model. Available online: https://open.canada.ca/data/en/dataset/7f245e4d-76c2-4caa-951a-45d1d2051333 (accessed on 8 January 2008).
- Kelly, M.; Blanchard, S.D.; Kersten, E.; Koy, K. Terrestrial remotely sensed imagery in support of public health: New avenues of research using object-based image analysis. Remote Sen. 2011, 3, 2321–2345. [Google Scholar] [CrossRef]
- Dey, V. A Supervised Approach for the Estimation of Parameters of Multiresolution Segmentation and Its Application in Building Feature Extraction from VHR Imagery. Master’s Thesis, Department of Geodesy and Geomatics Engineering, University of New Brunswick, Fredericton, NB, Canada, September 2011. [Google Scholar]
- Jawak, S.D.; Kulkarni, K.; Luis, A.J. A review on extraction of lakes from remotely sensed optical satellite data with a special focus on cryospheric lakes. Adv. Remote Sens. 2015, 4, 196–213. [Google Scholar] [CrossRef]


| Parrot Sequoia | Sentinel-2 | |
|---|---|---|
| Acquisition date | 01/09/2017 | 23/08/2017 |
| Acquisition time (local) | 17:00 | 10:30 |
| Spectral resolution | 10 bits | 12 bits |
| Spatial resolution | 0.13 m | B3,4–10 m, B6,7–20 m |
| Green band | 530–570 nm | 543–578 nm (B3) |
| Red band | 640–680 nm | 650–680 nm (B4) |
| Red Edge band | 730–740 nm | 733–748 nm (B6) |
| Super Red Edge band | - | 733–748 nm (Super B6) |
| NIR band | 770–810 nm | 773–793 nm (B7) |
| Super NIR | - | 773–793 nm (Super B7) |
| Bands | Sentinel-2 | |||
|---|---|---|---|---|
| M1 S2 | M2 S2 | |||
| Method 1 Sequoia (M1 Sequoia) | Full-Water Body (FWB) | Green | 0.89 | 0.83 |
| Red | 0.88 | 0.83 | ||
| Red-edge | 0.33 | 0.29 | ||
| Super red edge | 0.22 | 0.20 | ||
| Near-infrared | 0.29 | 0.26 | ||
| Super near-infrared | 0.22 | 0.19 | ||
| Sunlit Water Surface (SLW) | Green | 0.90 | 0.86 | |
| Red | 0.87 | 0.83 | ||
| Red-edge | 0.27 | 0.26 | ||
| Super red edge | 0.27 | 0.24 | ||
| Near-infrared | 0.24 | 0.24 | ||
| Super near-infrared | 0.26 | 0.25 | ||
| Shady Water Surface (SHW) | Green | 0.82 | 0.78 | |
| Red | 0.74 | 0.70 | ||
| Red-edge | –0.05 | –0.02 | ||
| Super red edge | –0.11 | –0.09 | ||
| Near-infrared | –0.04 | 0.00 | ||
| Super near-infrared | –0.08 | –0.06 | ||
| Method 2 Sequoia (M2 Sequoia) | Full-Water Body (FWB) | Green | 0.89 | 0.83 |
| Red | 0.88 | 0.82 | ||
| Red-edge | 0.38 | 0.31 | ||
| Super red edge | 0.27 | 0.23 | ||
| Near-infrared | 0.32 | 0.27 | ||
| Super near-infrared | 0.26 | 0.23 | ||
| Sunlit Water Surface (SLW) | Green | 0.91 | 0.87 | |
| Red | 0.87 | 0.81 | ||
| Red-edge | 0.28 | 0.27 | ||
| Super red edge | 0.28 | 0.24 | ||
| Near-infrared | 0.23 | 0.23 | ||
| Super near-infrared | 0.26 | 0.24 | ||
| Shady Water Surface (SHW) | Green | 0.75 | 0.73 | |
| Red | 0.63 | 0.60 | ||
| Red-edge | –0.04 | –0.04 | ||
| Super red edge | –0.05 | –0.03 | ||
| Near-infrared | –0.04 | –0.02 | ||
| Super near-infrared | –0.04 | –0.02 | ||
© 2019 by the authors. Licensee MDPI, Basel, Switzerland. This article is an open access article distributed under the terms and conditions of the Creative Commons Attribution (CC BY) license (http://creativecommons.org/licenses/by/4.0/).
Share and Cite
Freitas, P.; Vieira, G.; Canário, J.; Folhas, D.; Vincent, W.F. Identification of a Threshold Minimum Area for Reflectance Retrieval from Thermokarst Lakes and Ponds Using Full-Pixel Data from Sentinel-2. Remote Sens. 2019, 11, 657. https://doi.org/10.3390/rs11060657
Freitas P, Vieira G, Canário J, Folhas D, Vincent WF. Identification of a Threshold Minimum Area for Reflectance Retrieval from Thermokarst Lakes and Ponds Using Full-Pixel Data from Sentinel-2. Remote Sensing. 2019; 11(6):657. https://doi.org/10.3390/rs11060657
Chicago/Turabian StyleFreitas, Pedro, Gonçalo Vieira, João Canário, Diogo Folhas, and Warwick F. Vincent. 2019. "Identification of a Threshold Minimum Area for Reflectance Retrieval from Thermokarst Lakes and Ponds Using Full-Pixel Data from Sentinel-2" Remote Sensing 11, no. 6: 657. https://doi.org/10.3390/rs11060657