Article

Registration of Terrestrial Laser Scanning Surveys Using Terrain-Invariant Regions for Measuring Exploitative Volumes over Open-Pit Mines

1
College of Geoscience and Surveying Engineering, China University of Mining and Technology (Beijing), Beijing 100083, China
2
Key Laboratory of Geohazard Prevention of Hilly Mountains, Ministry of Land and Resources (Fujian Key Laboratory of Geohazard Prevention), Fuzhou 350002, China
3
School of Geosciences and Info-Physics, Central South University, Changsha 410006, China
4
School of Resources & Civil Engineering, Northeastern University, Shenyang 110819, China
*
Authors to whom correspondence should be addressed.
Remote Sens. 2019, 11(6), 606; https://doi.org/10.3390/rs11060606
Submission received: 22 January 2019 / Revised: 26 February 2019 / Accepted: 6 March 2019 / Published: 13 March 2019

Abstract

:
Terrestrial laser scanning (TLS) techniques have been widely used in open-pit mine applications. It is a crucial task to measure the exploitative volume of open-pit mines, within a specific time interval. One major challenge is posed, however, when conducting accurate registrations for temporal TLS surveys in continuously changing areas, created by excavation activities. In this paper, we propose a coarse-to-fine registration method, based on terrain-invariant regions (TIR), for temporal TLS surveys. More specifically, an approximate four-point congruent set (4PCS) of temporal TLS surveys is first identified, based on affine invariant rules. Second, a set of correspondences among temporal TLS surveys were collected by matching multi-scale sparse features of the 3D neighbors, centered at the approximate 4PCS. Third, the correspondences were used to estimate a rigid motion between the overlapping TLS surveys for the coarse registration, according to which the initial TIR from temporal TLS surveys were identified. Finally, the rigid motion between temporal TLS was iteratively optimized, based on the point clouds, only from the TIR. Based on the fine-level registered TLS surveys, Digital Elevation Models (DEMs) can be generated to calculate the exploitative volume, through a DEM differential. We applied the proposed method to two open-pit mines in China, and also compared our method with five state-of-the-art methods for registering temporal TLS surveys. Experimental results indicated that the proposed method achieved a higher registration accuracy than the state-of-the-art methods. Based on the registered result, our method achieved a 98.03% overall accuracy for measuring the exploitative volume, compared to in-situ measurement.

1. Introduction

Measuring the exploitative volume over open-pit mines plays an important role in excavation planning, environment protection, and hazards prevention. Field surveying, photogrammetry, and terrestrial laser scanning (TLS) are common methods for measuring exploitative volume over open-pit mines [1]. Compared with the two former methods, TLS enables the collection of dense 3D data in a straightforward scheme. Good examples of using TLS for measuring exploitative volume over open-pit mines can be found in the literature [2,3]. In these studies, the exploitative volume between time intervals was calculated by means of Difference of Digital Elevation Models (DoD) techniques. Telling, et al. [4] provided a comprehensive review on branches of Earth Science research, using TLS, and concluded analogous applications in earthquake [5,6], volcanic [7,8,9], mass wasting hazards (landslide [10,11,12], rockfall [13]), geomorphology [14,15,16,17], as well as cryosphere (snow [18,19,20], ice [21], and permafrost [22]).
There were two main challenges for measuring the exploitative volume over open-pit mines, i.e., temporal TLS surveys registration and Digital Elevation Model (DEM) interpolation. In this work, attention was mainly devoted to temporal TLS surveys registration. Extensive studies have been carried out on registering TLS surveys, involving two steps, with respect to coarse and fine registration [23]. The aim of coarse registration is to estimate a global rigid motion between overlapping TLS surveys. The global rigid motion is then further optimized by minimizing the distances between the nearest point pairs.
In the coarse registration phase, the global rigid motion can be estimated by either feature-based, nonfeature-based, or combined techniques. For feature-based methods, Böhm and Becker [24] investigated the use of keypoints extracted by a scale-invariant feature transform descriptor to register markerless TLS point clouds. Zai, et al. [25] proposed a covariance descriptor to fuse geometry, color, and intensity information, for pairwise registration of TLS point clouds. Dong, et al. [26] used a binary shape context descriptor to register multi-view TLS point clouds. Apart from point features, features related to lines, surface patches, and semantics can also be used to register TLS surveys [27,28,29,30]. For non-feature-based techniques, Aiger, et al. [31] first proposed a four-Points Congruent Sets (4PCS) method to identify an approximate congruent four-point tuples, for grid point cloud registration, in order to handle the problems associated with small overlap, featureless, and many noise between the registered point clouds. Based on 4PCS, many variants were proposed, such as the intelligent indexing scheme [32] and tuples generalization [33,34]. Considering the advantages of both feature-based and nonfeature-based registration methods, Theiler, et al. [35] presented a keypoint-based 4PCS (k-4PCS) method, in which only a small set of representative keypoints were used to identify correspondences. The optimized variants of the k-4PCS algorithm have also been investigated in [36,37]. Ge [38,39] proposed an extended 4PCS method based on geodesic distances for non-rigid cases. Xu, et al. [40] investigated the use of multi-scale sparse features (MSSF) to optimize the 4PCS for the global registration of TLS point clouds.
Following the coarse registration, initial estimates can be fine-tuned through an optimization process. One common practice is to locally align multi-surveys, using an iterative closest point (ICP) algorithm [41,42,43]. This practice, however, requires static scenes and small motion between different surveys, for example [43,44,45]. It is still challenging to obtain a consistent result when using ICP for scenes that change with excavation activities over open-pit mines. Nevertheless, some efforts have been invested to use the only subset of the data for speeding-up ICP optimization. For instance, Chen and Medioni [46] suggested the use of points lying in smooth areas for ICP optimization, so as to get reliable registration results with a reduced time cost. Rusinkiewicz and Levoy [47] introduced a normal-space sampling strategy that used only the points with large normal distribution for ICP optimization. Our previous work first introduced the use of terrain-invariant-regions (TIR) for ICP optimization, in change detection applications, where the experimental results showed a high registration accuracy for measuring volume changes [48]. However, it is still needed to overcome the major limitations in full automation and high robustness. In this paper, we propose a coarse-to-fine method to identify the TIR, upon which the ICP is performed to register temporal TLS surveys before measuring the exploitative volume. Specifically, we first identified an approximate four-point congruent set (4PCS) from the temporal TLS surveys, under mathematical and geometrical rules. Following that, we collected a set of correspondences from the 3D neighbors of the approximate 4PCS, by matching multi-scale sparse features. Then, we estimated a rigid motion between the different TLS surveys by using the correspondences for the coarse registration. Following that, the TIRs from the temporal TLS surveys were identified and used for ICP optimization, leading to fine estimates of rigid motion. With that, we transformed the rigid motion for better registration of temporal TLS surveys. At last, we measured the exploitative volume through DoD techniques.
This paper is organized as follows. Section 2 describes the experimental sites and data used. Section 3 starts by describing the framework of the proposed method, followed by illustrations of each component of the proposed method and baseline methods used for comparison. The experimental results are presented in Section 4, followed by a discussion in Section 5 and the conclusions of this study in Section 6.

2. Study Area and Data Acquisition
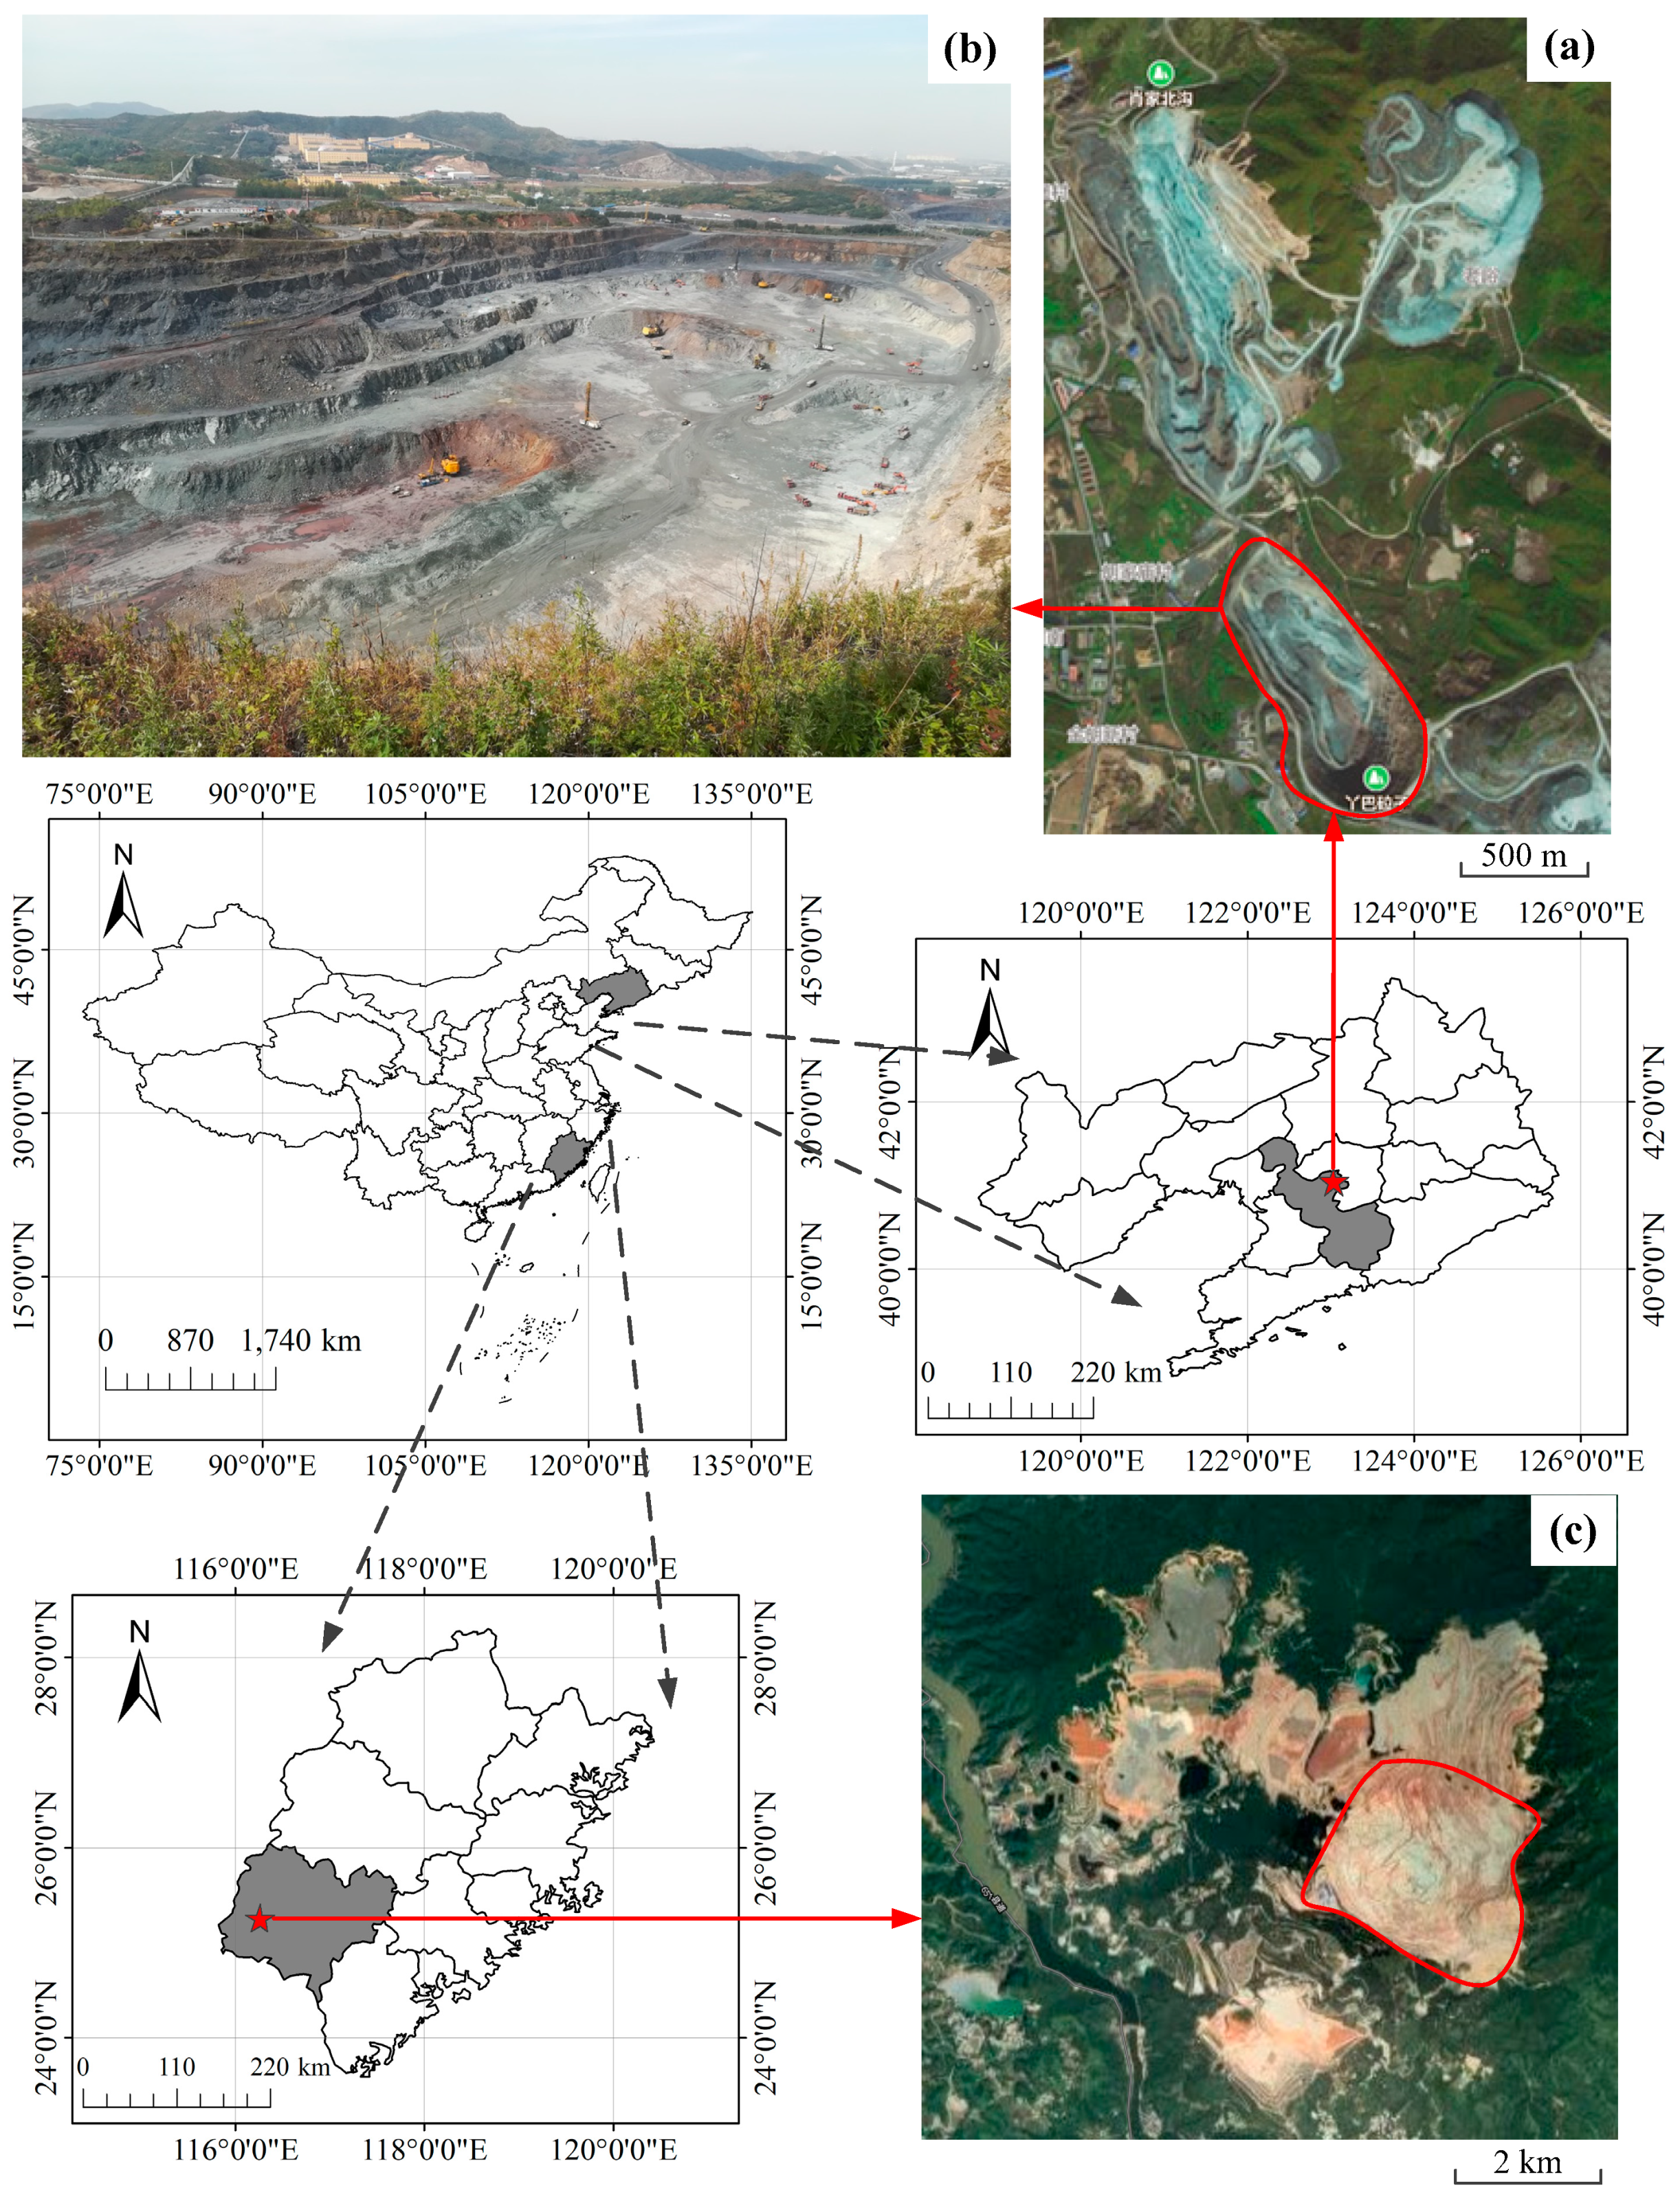
2.1. Study Area

We conducted experiments in two open-pit mines in China, labelled as site A and site B (Figure 1). The site A was an iron open-pit mine, located in the southwest of Anqian City in the Liaoning province (Figure 1a). It had an area of 0.6 km2, with a maximum depth of 170 m, where seven types of minerals, with respect to Fehw, Fepp, Fehp, Feh, Fec, Am, and Cs were found. Site B was a gold-copper mine in the southwest of the Fujian province of China (Figure 1b). Compared with site A, site B had a larger area of 4.5 km2, with a maximum depth of 1140 m.

2.2. Data Acquisition

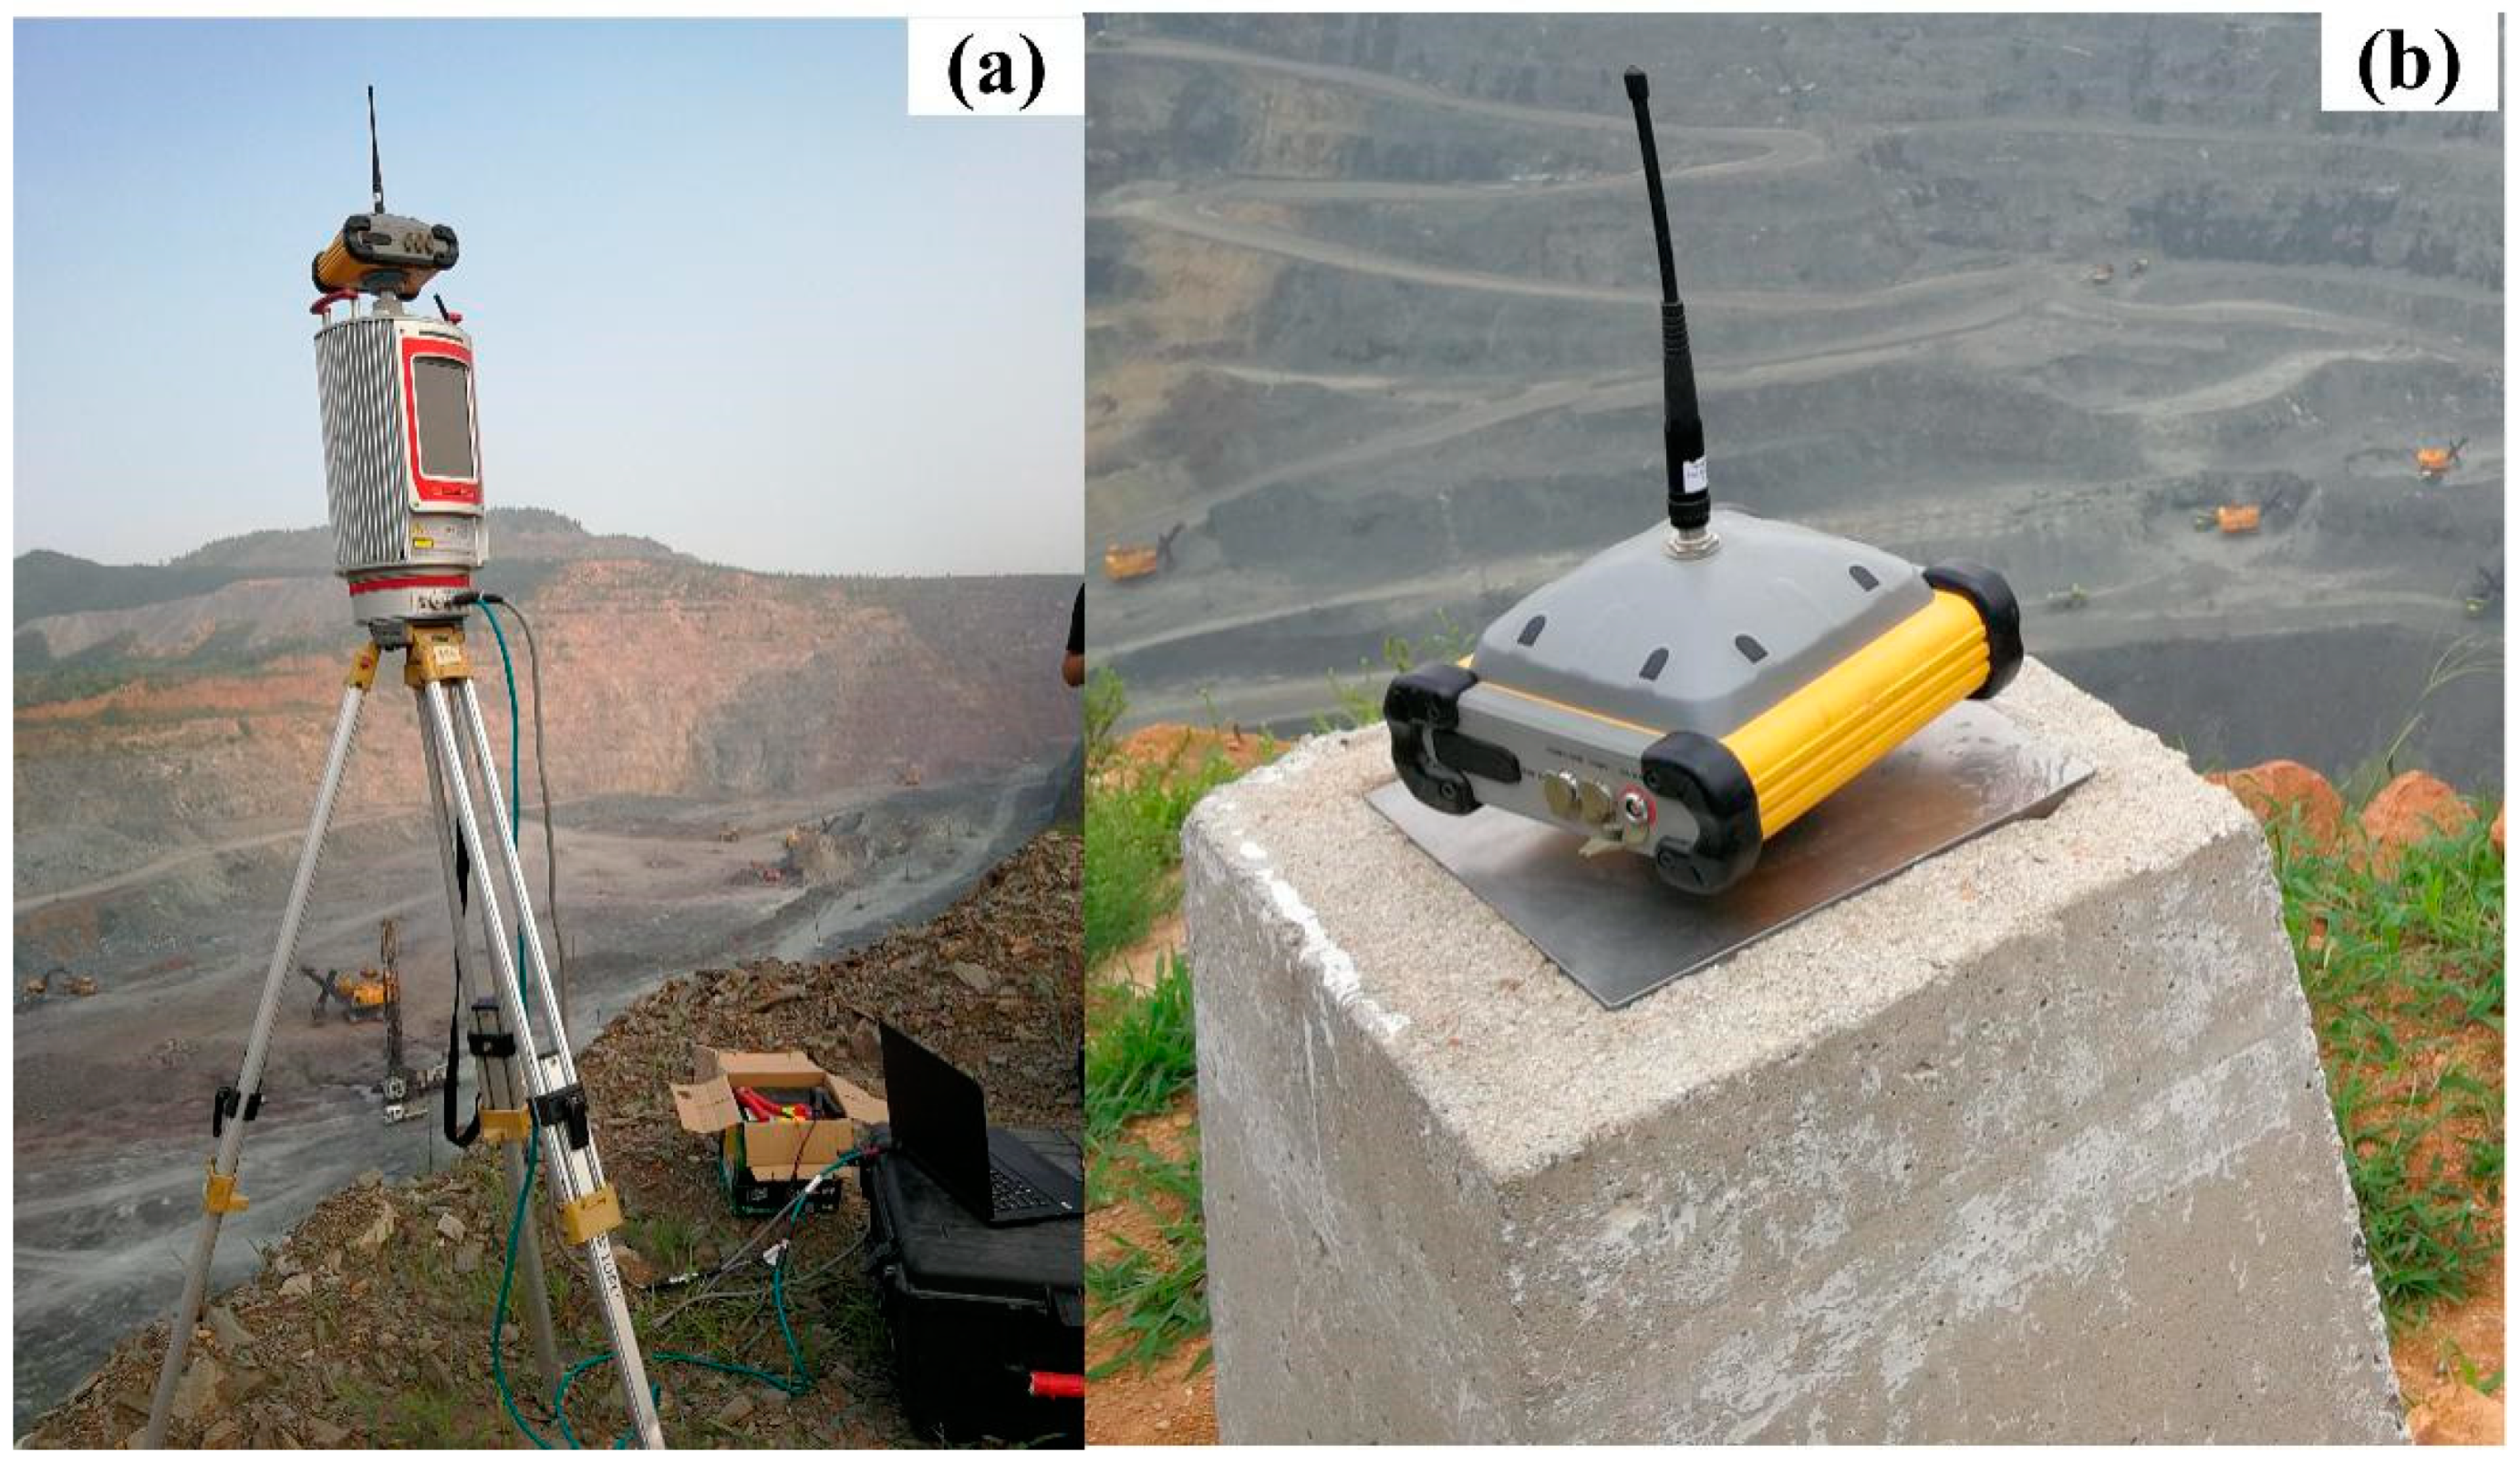
Terrestrial Surveying
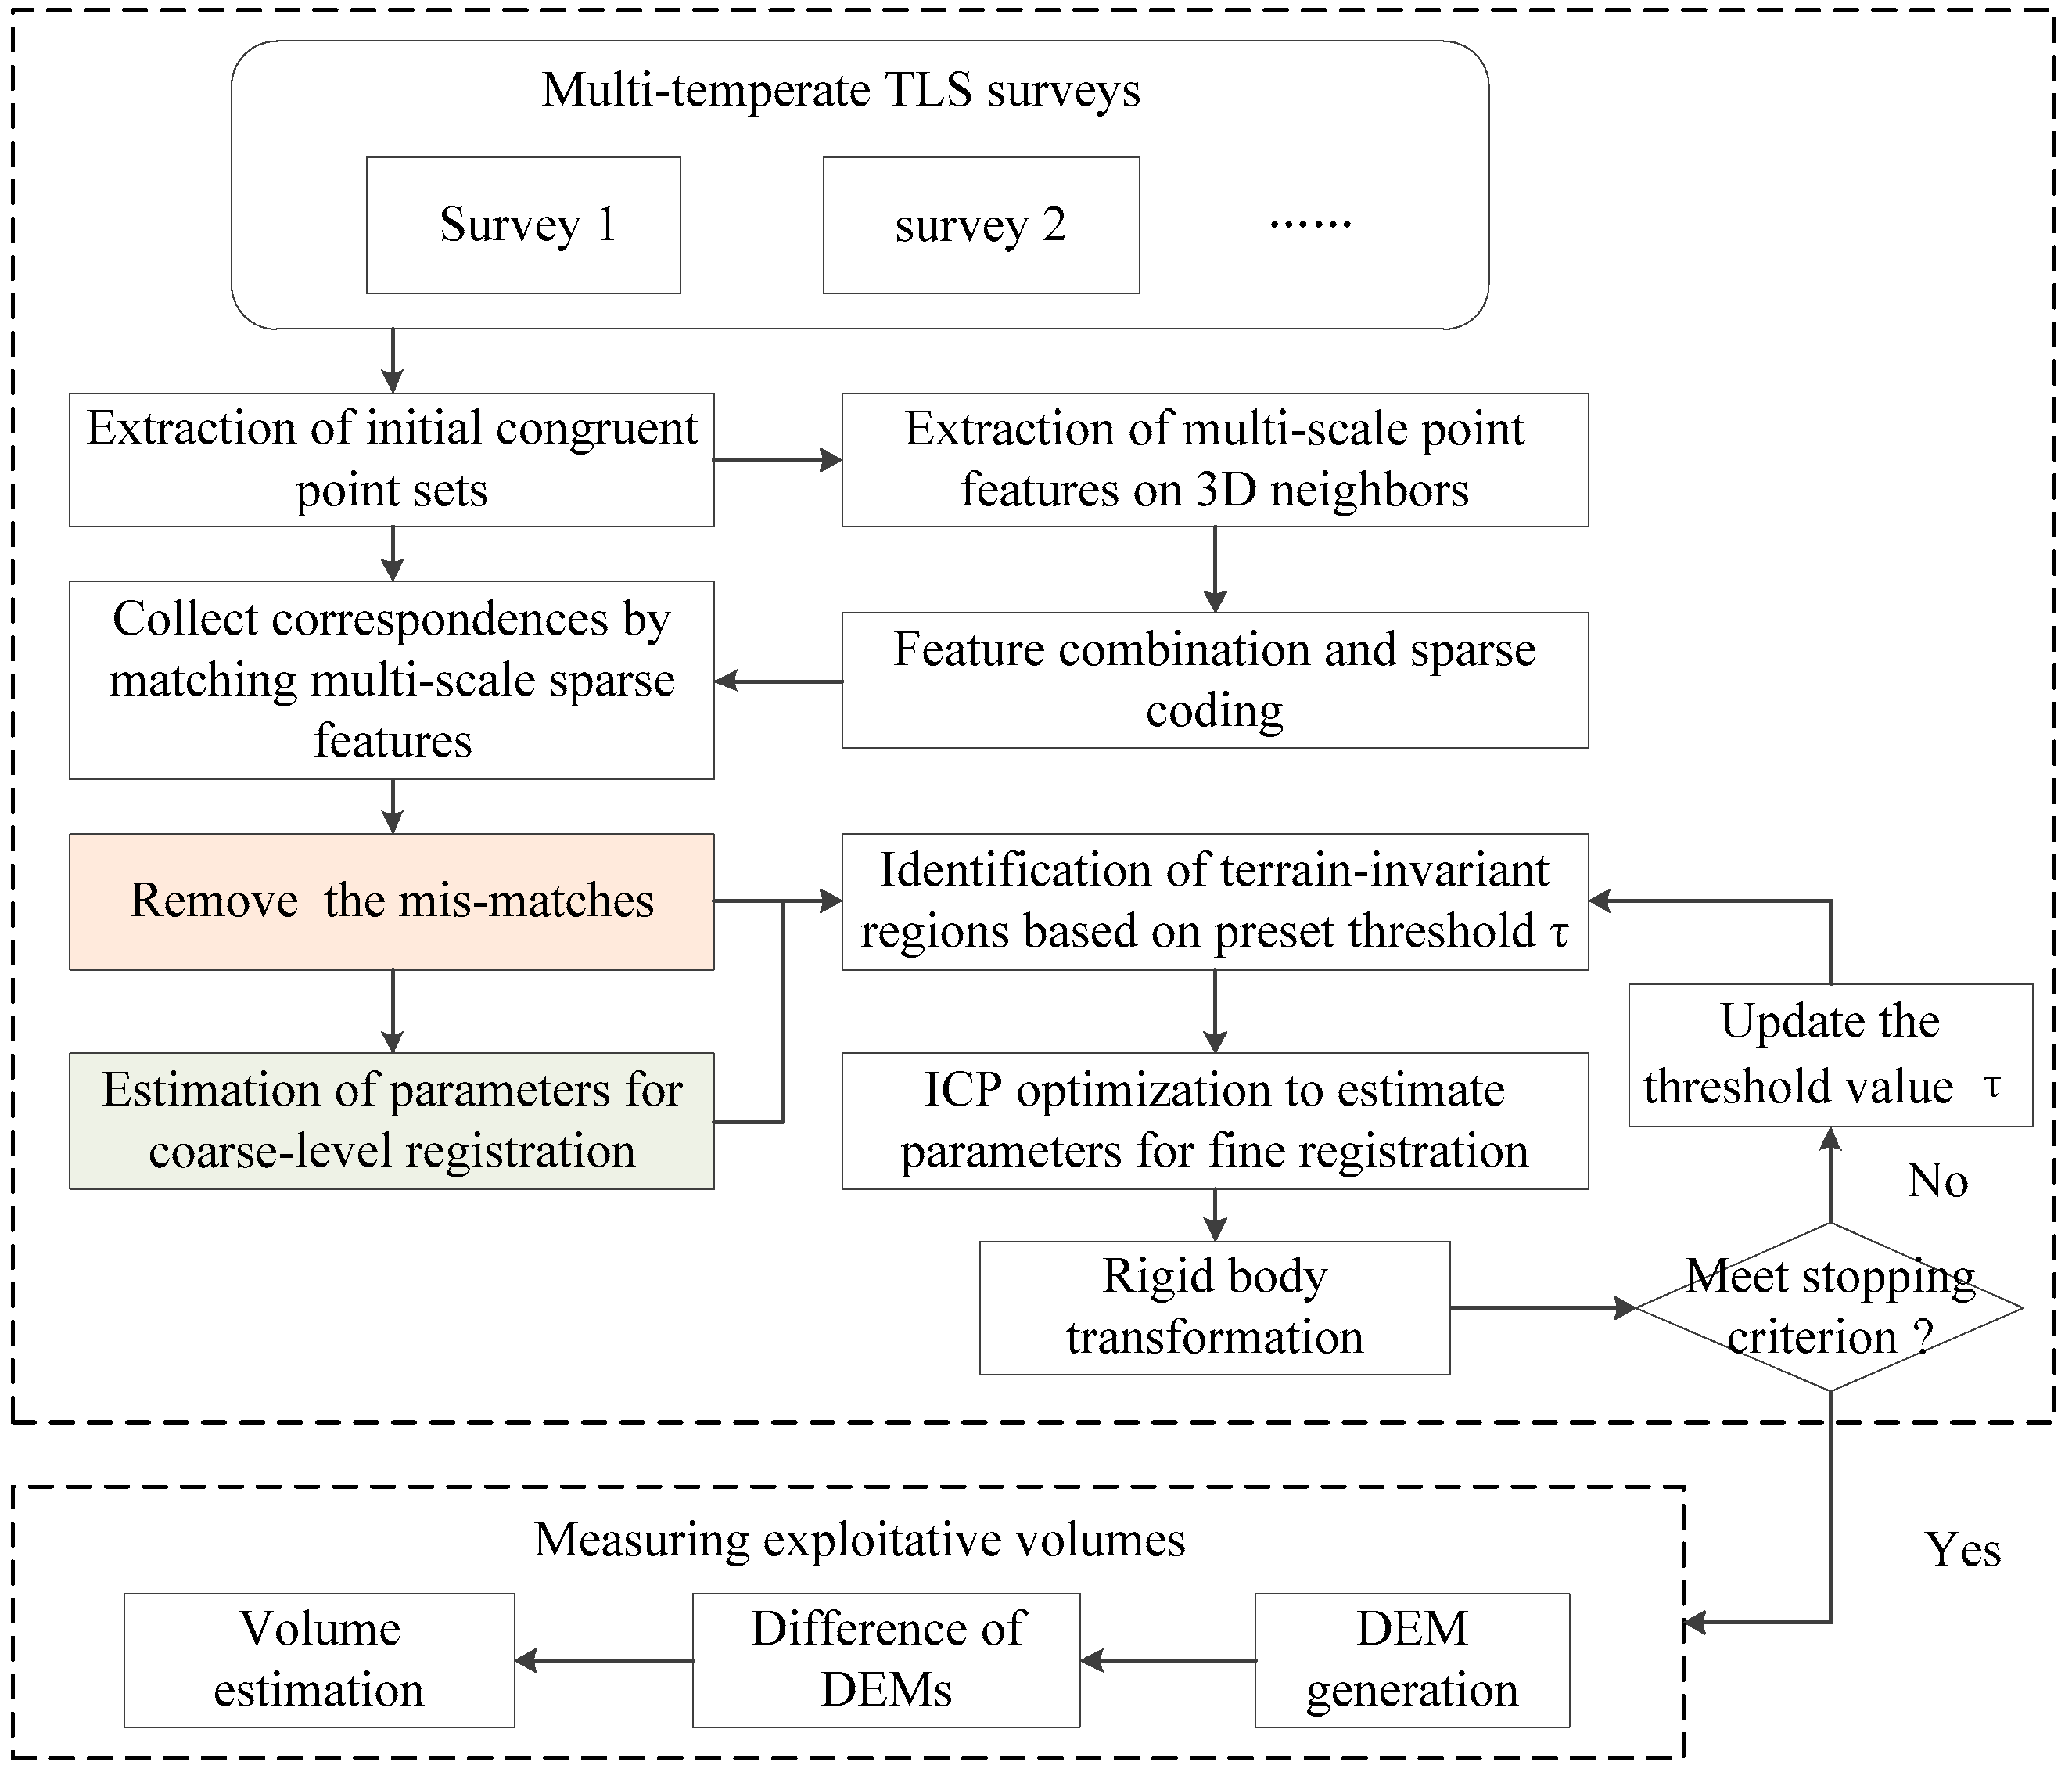
We used a long-range terrestrial laser scanner, i.e., Riegl VZ-4000 (Figure 2a), to capture the point clouds over sites A and B. The technical specifications of the scanner are listed in Table 1. We conducted two sequential surveys in site A on 12 September 2017 and 12 October 2017 and site B on 13 March 2013 and 10 July 2013, respectively. For each survey, we obtained three partial scans to cover the whole mine surface of both sites. The maximum distance from the scanner to the ore surface was estimated at 1 km and 1.5 km for sites A and B, leading to point resolution (horizontal × vertical) of 0.8 m × 0.24 m and 1.2 m × 0.36 m, at the corresponding distances, respectively. For fast implementation, the point clouds for each scans were resampled, with a point resolution of 0.8 m and 1.5 m, for site A and site B, respectively. By doing so, the unevenness of point clouds due to scanning range was removed, maintaining a small number of points that was adequate for characterizing the terrain.
In addition, we measured the scanning positions with an external GNSS rover based on the local Continuous Operational Reference System (CORSS), with a maximum positioning error of ± 1 cm. In order to guarantee the accuracy of all surveys, we checked the positions for a permanent control point (Figure 2b), and corrected the system error of GNSS rover, before the surveys.

3. Methodology

Figure 3 illustrates the workflow of the proposed registration method of using terrain-invariant regions (TIR) for measuring exploitative volumes over open-pit mines from TLS point clouds. It consists of four main components: (a) the identification of approximate congruent sets from temporal TLS surveys, (b) the coarse-level registration of temporal TLS surveys by matching multi-scale sparse features, (c) the fine-level registration of temporal TLS surveys, through ICP optimization on TIR, and (d) the calculation of exploitative volumes from the registered temporal TLS surveys. More specifically, we first identified an approximate congruent set, based on methodical rules, considering affine invariant features and normal constraints. Then, we collected additional correspondences by matching multi-scale sparse features of 3D neighbors, centered at the approximate congruent sets, based on which a global rigid motion could be estimated. Next, the TIRs from the temporal TLS surveys were iteratively identified through a threshold scheme, where the ICP optimization was performed for fine registration. Last, the registered temporal TLS surveys were used for measurement of exploitative volumes, through DoD techniques. The four components of the proposed method are described in details in the following sections.

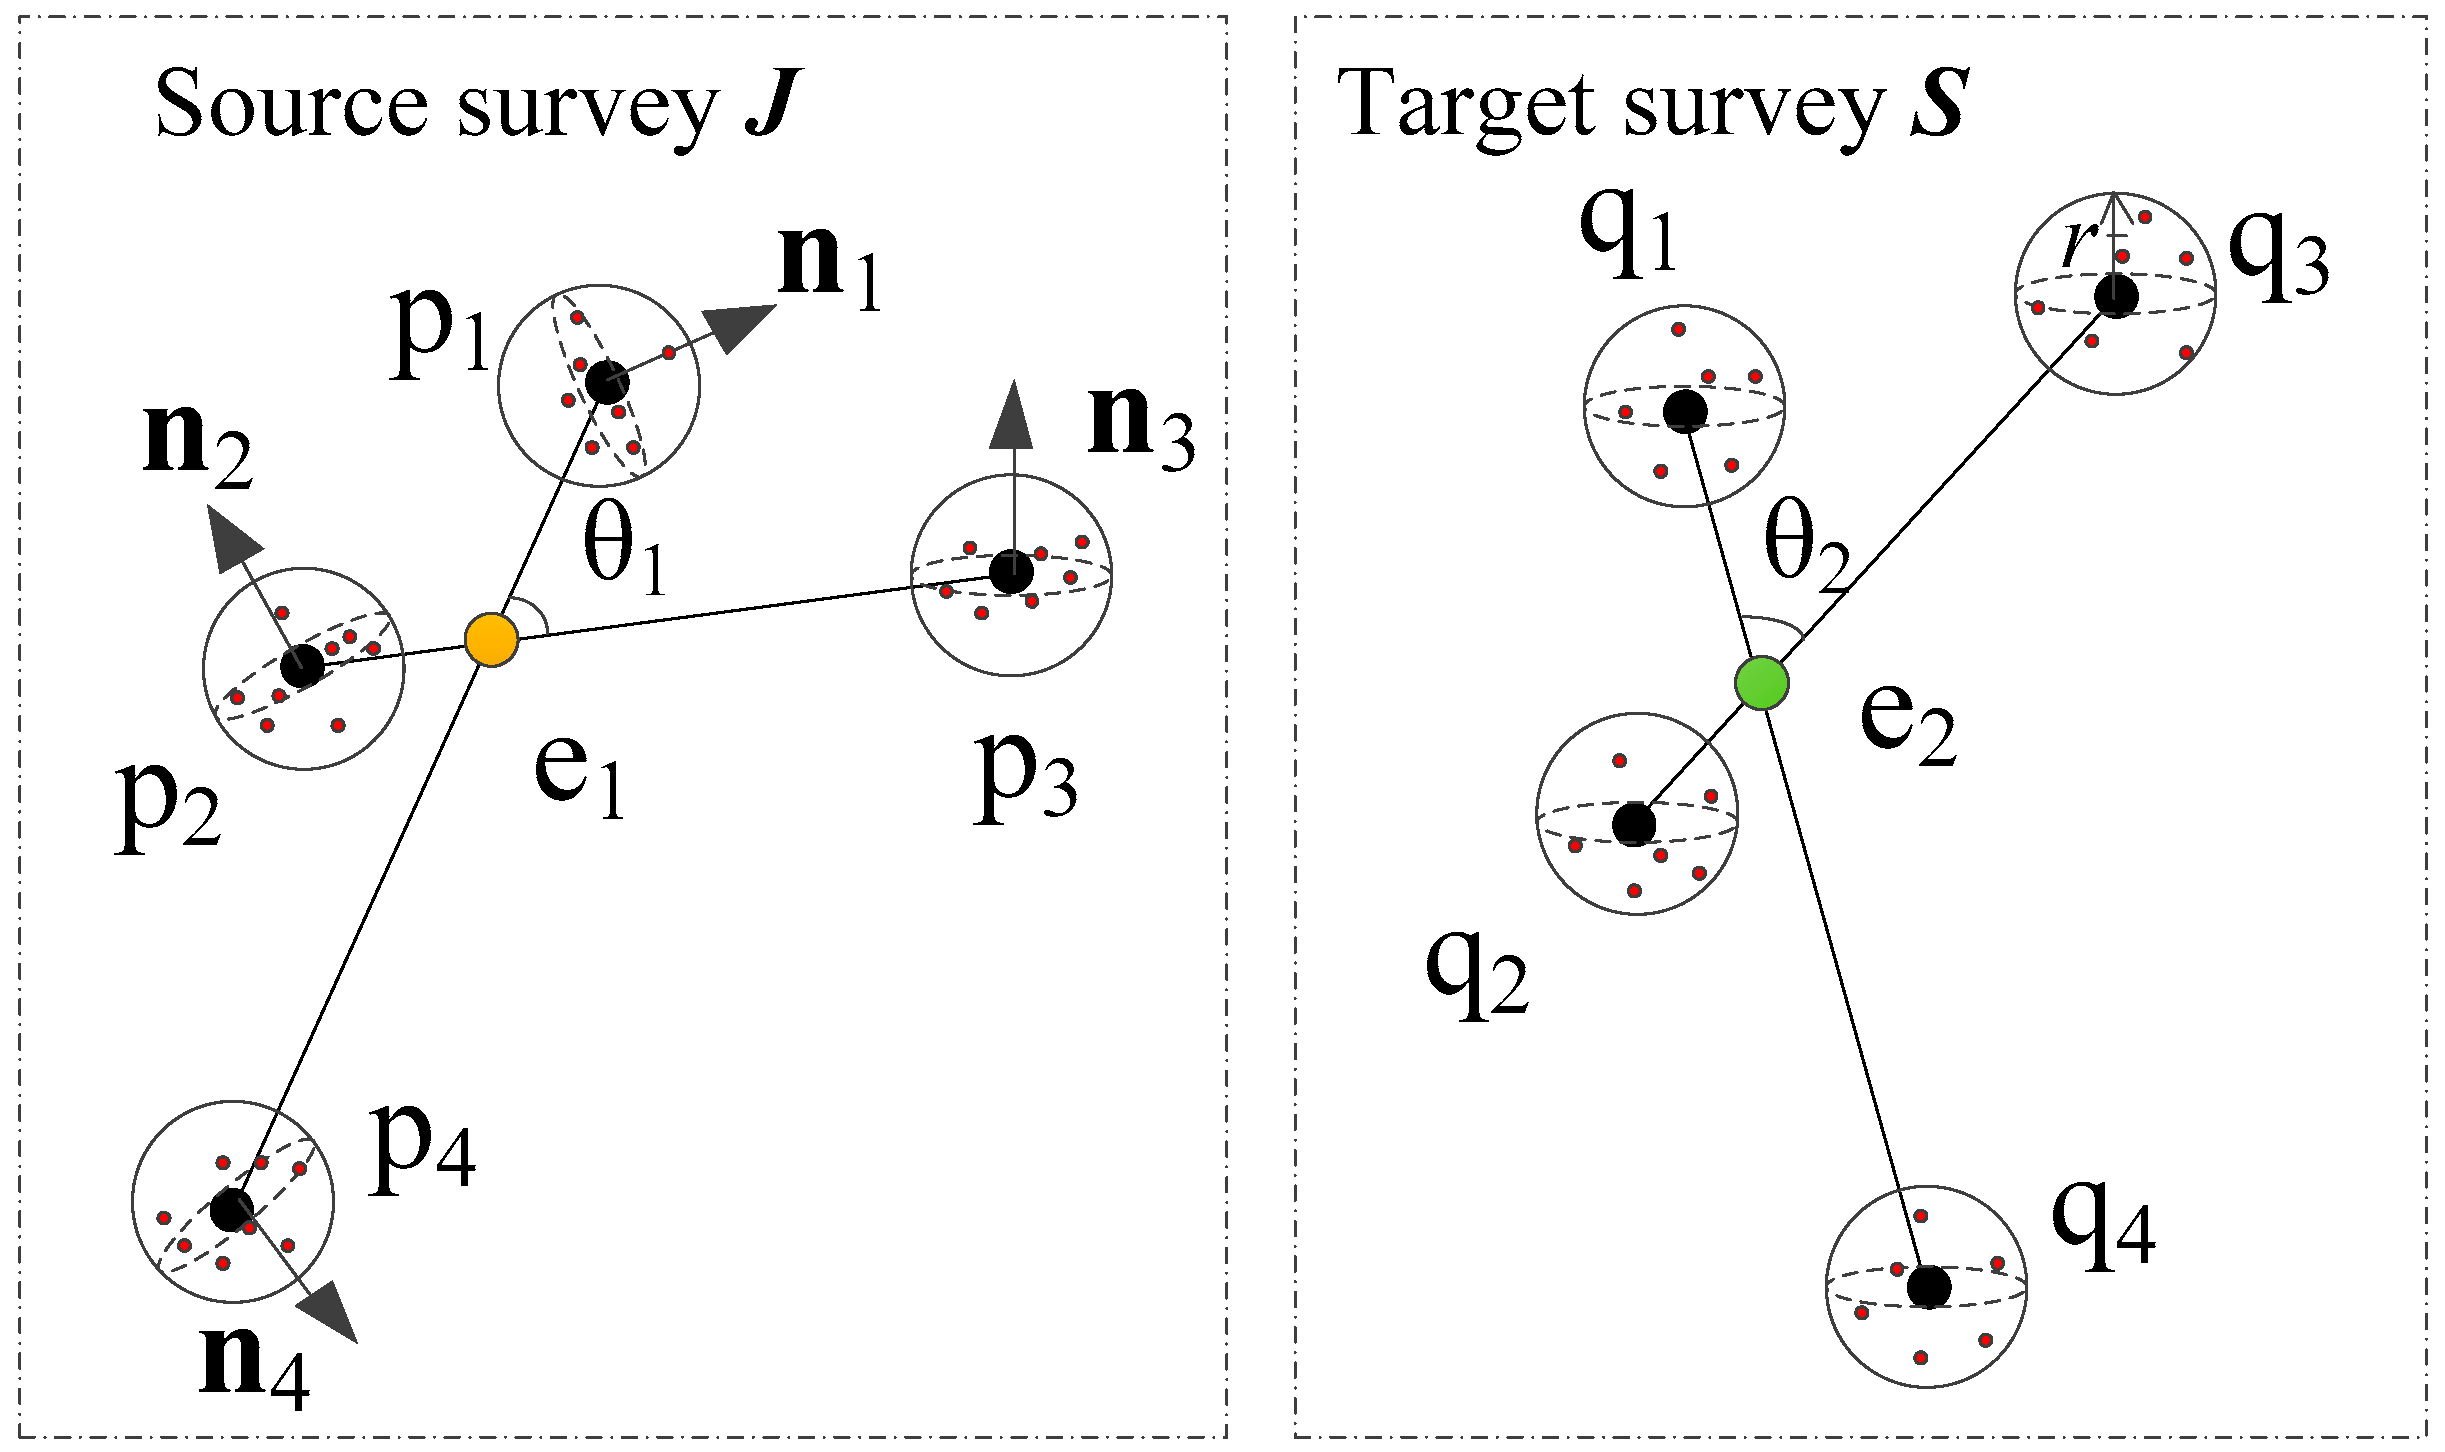
3.1. Identification of Approximate Congruent Sets from Temporal TLS Surveys

We use the 4PCS algorithm to identify the initial congruent sets from temporal TLS surveys. Let J = {p1, p2, p3, p4} and S = {q1, q2, q3, q4} be a pair of approximate 4-point congruent sets in two temporal TLS surveys, respectively, under the following conditions.
The corresponding affine invariant ratios are equal, i.e., λ1 = λ3, λ2 = λ4 and
{ λ 1 = p 1 e 1 / p 1 p 4 λ 2 = p 2 e 1 / p 2 p 3 , { λ 3 = q 1 e 2 / q 1 q 4 λ 4 = q 2 e 2 / q 2 q 3
The lengths of the corresponding lines are less than an epsilon ε as
{ p 4 p 1 q 4 q 1 < ε p 3 p 2 q 3 q 2 < ε
The angles of the corresponding lines, as shown in Figure 4, are equivalent to,
θ1 = θ2
We adopted normal constraints to remove the redundant 4-point bases that exist in a plane surface, to improve the efficiency and robustness [40].

3.2. Coarse Registration of Temporal TLS Surveys by Matching Multi-Scale Sparse Features

Since the point clouds are unordered, with an uneven density, the identified 4-point tuple in one TLS survey did not exactly match the 4-point bases in the other. To solve this issue, we considered the similarity of multi-scale features between the two sets of 3D neighborhood points that centered at the approximate 4PCS, from the different TLS surveys. Following the strategy in [40], we extracted the point features [49,50,51], at three scales, i.e., r, r + △r, and r + 2△r, where r is a predefined search radius, and △r is a scale interval. This configuration enabled us to handle the problems associated with various point densities and noise. The spherical neighborhood was used at each defined scale. For each point p , we designed a point feature descriptor x, by concatenating the obtained multi-scale geometric features into one vector. Since the extracted features might have different dimensions, we normalized the dimension of each extracted feature in x, before the sparse feature representation. Additionally, a sparse coding phase was performed on the achieved feature vector, in order to remove redundant information from the feature space, producing a set of multi-scale sparse features (MSSF).
Differing from the existing study in [40], which collected the most congruent 4-point sets, we identified all the matches from the 3D neighbor point sets centered at the approximated 4PCS. Let p 1 J and q 1 S be a pair of approximate congruent points from two temporal TLS surveys, where Adj ( p 1 ) and Adj ( q 1 ) are the corresponding 3D neighbors centered at p 1 and q 1 , respectively. For an MSSF vector X Adj ( p 1 ) , if there exists a MSSF vector Y Adj ( q 1 ) satisfying Equation (4), the pair of points c ( X , Y ) encoded X and Y vectors can be considered to be a correspondence. The definition is given by,
{ h = arg max r X Y h > T  
where T is a predefined threshold, r X Y is the correlation coefficient. The coefficient can then be estimated as,
r X Y = ( X X ¯ ) × ( Y Y ¯ ) i = 1 n ( X i X ¯ ) 2 × i = 1 n ( Y i Y ¯ ) 2
where X ¯ and Y ¯ are the mean values of MSSF vectors.
As the threshold-based models retrieved correspondences contain numerous incorrect matches, we used the random sample consensus method (RANSAC) [52] to eliminate the incorrect matches, where a set of pairwise correspondences C { c 1 , c 2 , , c m } between the two temporal TLS surveys was produced. With that, we estimated a pairwise coarse rigid motion M Q , P C between the two TLS surveys, i.e., P and Q, for the coarse-level registration as Equation (6).
σ = arg min i = 1 # C P ( i ) M Q , P C Q ( i )  
where σ is the sum of the Euclidean distance between the correspondences, after the coarse rigid motion, i.e., M Q , P C , between TLS surveys P and Q, P ( i ) and Q ( i ) are the i th correspondence c 1 C in P and Q TLS surveys, respectively, # C is number of correspondences in C .

3.3. Fine Registration of Temporal TLS Surveys through ICP Optimization on Terrain-Invariant Regions

The proposed algorithm aligns Q to P, with an iterative scheme consisting of TIR extraction, ICP optimization, and rigid body transformation.
TIR extraction: After the coarse registration, we estimated the Euclidean distance E ( P ( i ) , Q ( j ) ) between the nearest points P ( i ) and Q ( j ) from P and Q TLS surveys, respectively. Based on this, the corresponding points, with E ( P ( i ) , Q ( j ) ) < τ ( τ > 0 referring to a predefined threshold, were collected as the initial pair of TIRs between the two temporal TLS surveys, i.e., P and Q.
ICP optimization: With the retrieved TIRs, respectively named as TIR P and TIR Q from the P and Q temporal TLS surveys, we optimized the rigid motion through the least squares registration, as described in Equation (7).
δ t = arg min i = 1 N TIR P ( i ) M Q , P t F TIR Q ( i )  
where δ t is the sum of the Euclidean distance between the correspondences after the t th fine rigid motion M Q , P t F , N is the smaller number of points in TIR P and TIR Q , and TIR P ( i ) and TIR Q ( i ) are the i th pair of nearest points in the TIRs of the two temporal TLS surveys.
After each iteration of ICP optimization, we updated the TIRs by reducing the preset threshold τ as Equation (8).
τ = τ t ω  
where t is the iteration number, and ω is a constraint value.
The above phases were repeated, from the TIR extraction to ICP optimization, until they met the following criteria,
{ M Q , P t F TIR Q ( i ) M Q , P ( t 1 ) F TIR Q ( i )   < b , o r τ ω    
where b is a preset threshold.
Rigid body transformation: Based on the fine rigid motion M Q , P F , we transformed the overall TLS survey Q to the TLS P, accordingly.

3.4. Volume Calculation and Method Comparison

After registering the temporal TLS surveys, we obtained the difference map between the temporal DEMs, by subtracting the post-phase DEM from the pre-phase DEM. Then, we filled the difference map into a raster structure and calculated the volume extracted between a specific time interval, by summing up the raster cells volume as,
V = i = 1 i = m j = i j = n L i , j × L i , j × Δ h i , j × ω i , j  
where L i , j is the size of the ( i , j ) th raster, Δ h i , j is the distance value on the ( i , j ) th raster, and ω i , j is a weight that satisfies,
{ ω i , j = 1 ,   i f Δ h i , j > ϵ ω i , j = 0 ,   o t h e r w i s e  
where ϵ > 0 is a pre-defined threshold value.
We compared the proposed registration method with five state-of-the-art methods, as follows. First, we used a manual-based method, with a coarse-to-fine configuration, where we manually selected the correspondences for the coarse registration and the main TIRs for the ICP optimization. Then, we compared our approach with the two methods mentioned above, i.e., Super4PCS and MSSF-Super4PCS, respectively. Furthermore, we compared our approach to the aforementioned two methods with ICP optimization, labeled as Super4PCS+ICP and MSSF-Super4PCS+ICP, respectively. We estimated the root-mean-square error (RMSE) of distances between the nearest points from the registered temporal TLS surveys, to quantify the registration accuracy. For each registration, we calculates the RMSE value by,
RMSE = k = 1 n ( P ( k ) M Q , P F Q ( k ) ) 2 n  
where n is the minimum number of points in the P and Q TLS surveys. P ( k ) and Q ( k ) are the k th pair of nearest points between the P and Q TLS surveys, respectively. M Q , P F is the rigid motion of fine estimates from the P to Q TLS surveys.
Moreover, we compared our method with that of in situ counting in site A, for measuring the exploitative volumes. Note that, we cannot obtain the exact volume extracted between the time interval, we instead used the in-situ counting quantity for comparison. Here, the mineral distribution, together with their density were investigated. Following that, we calculated the exploitative quantity by multiplying the achieved exploitative volumes, to the corresponding mineral densities.

4. Results

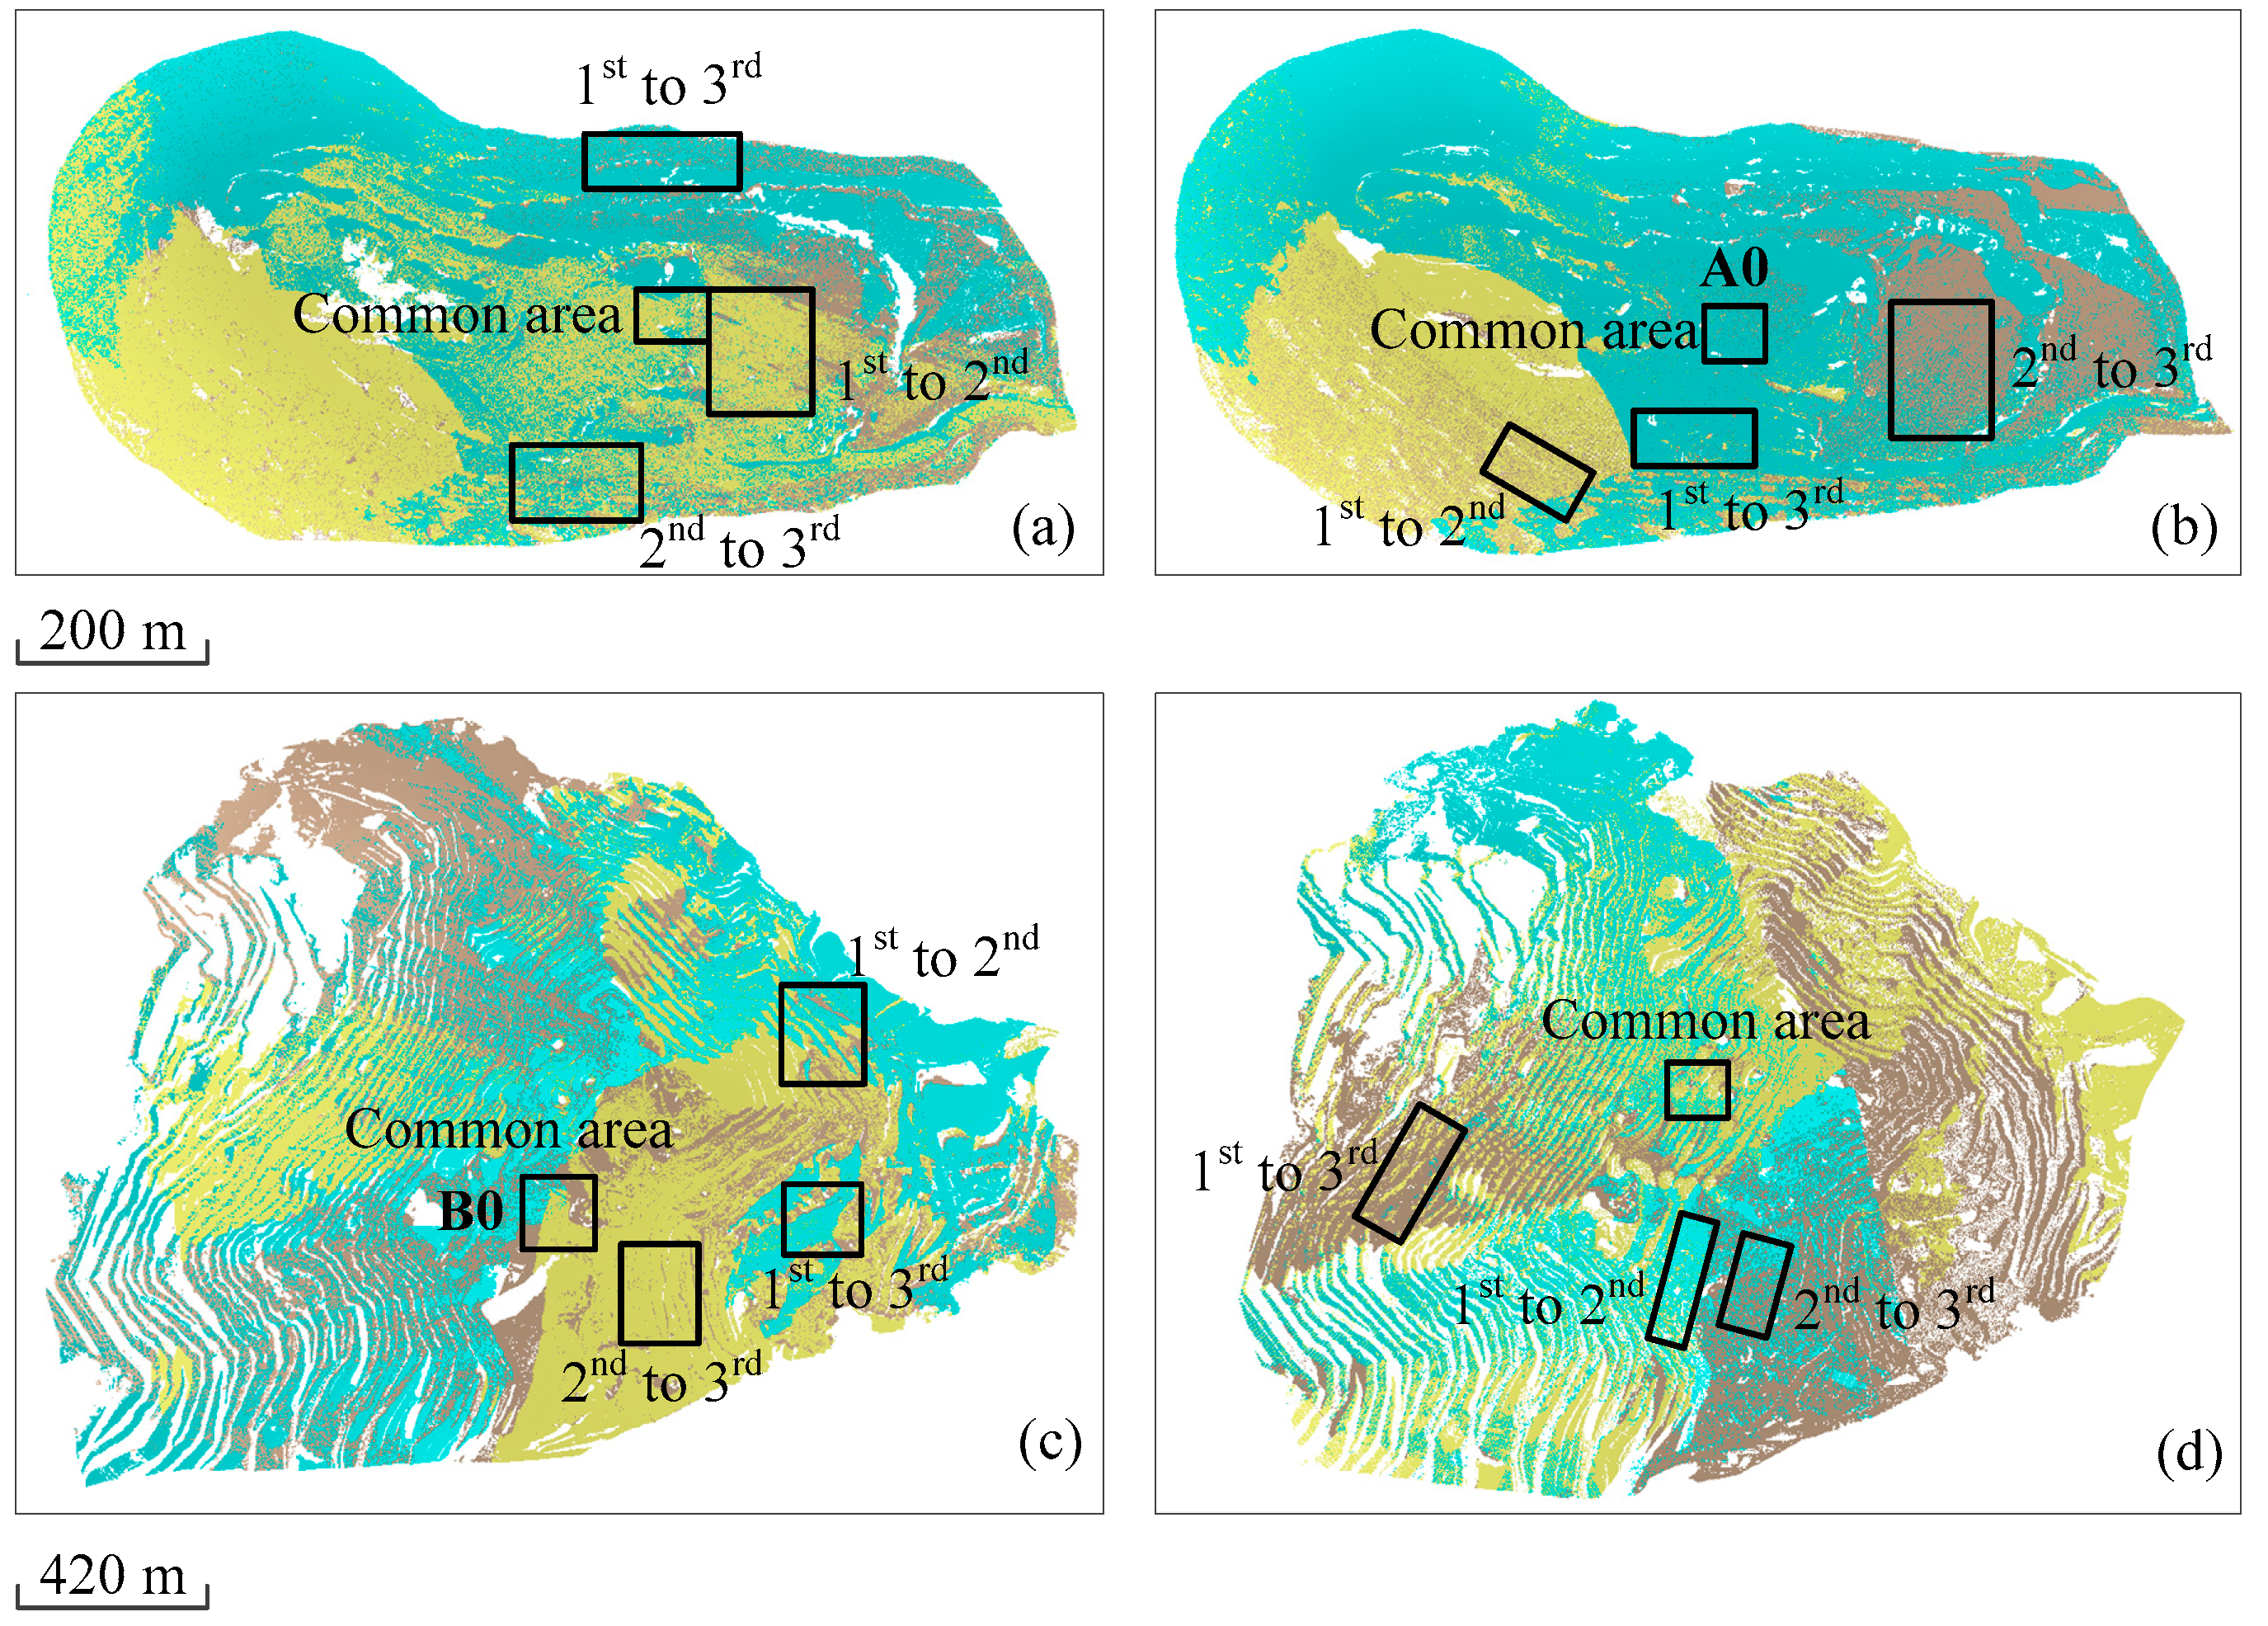
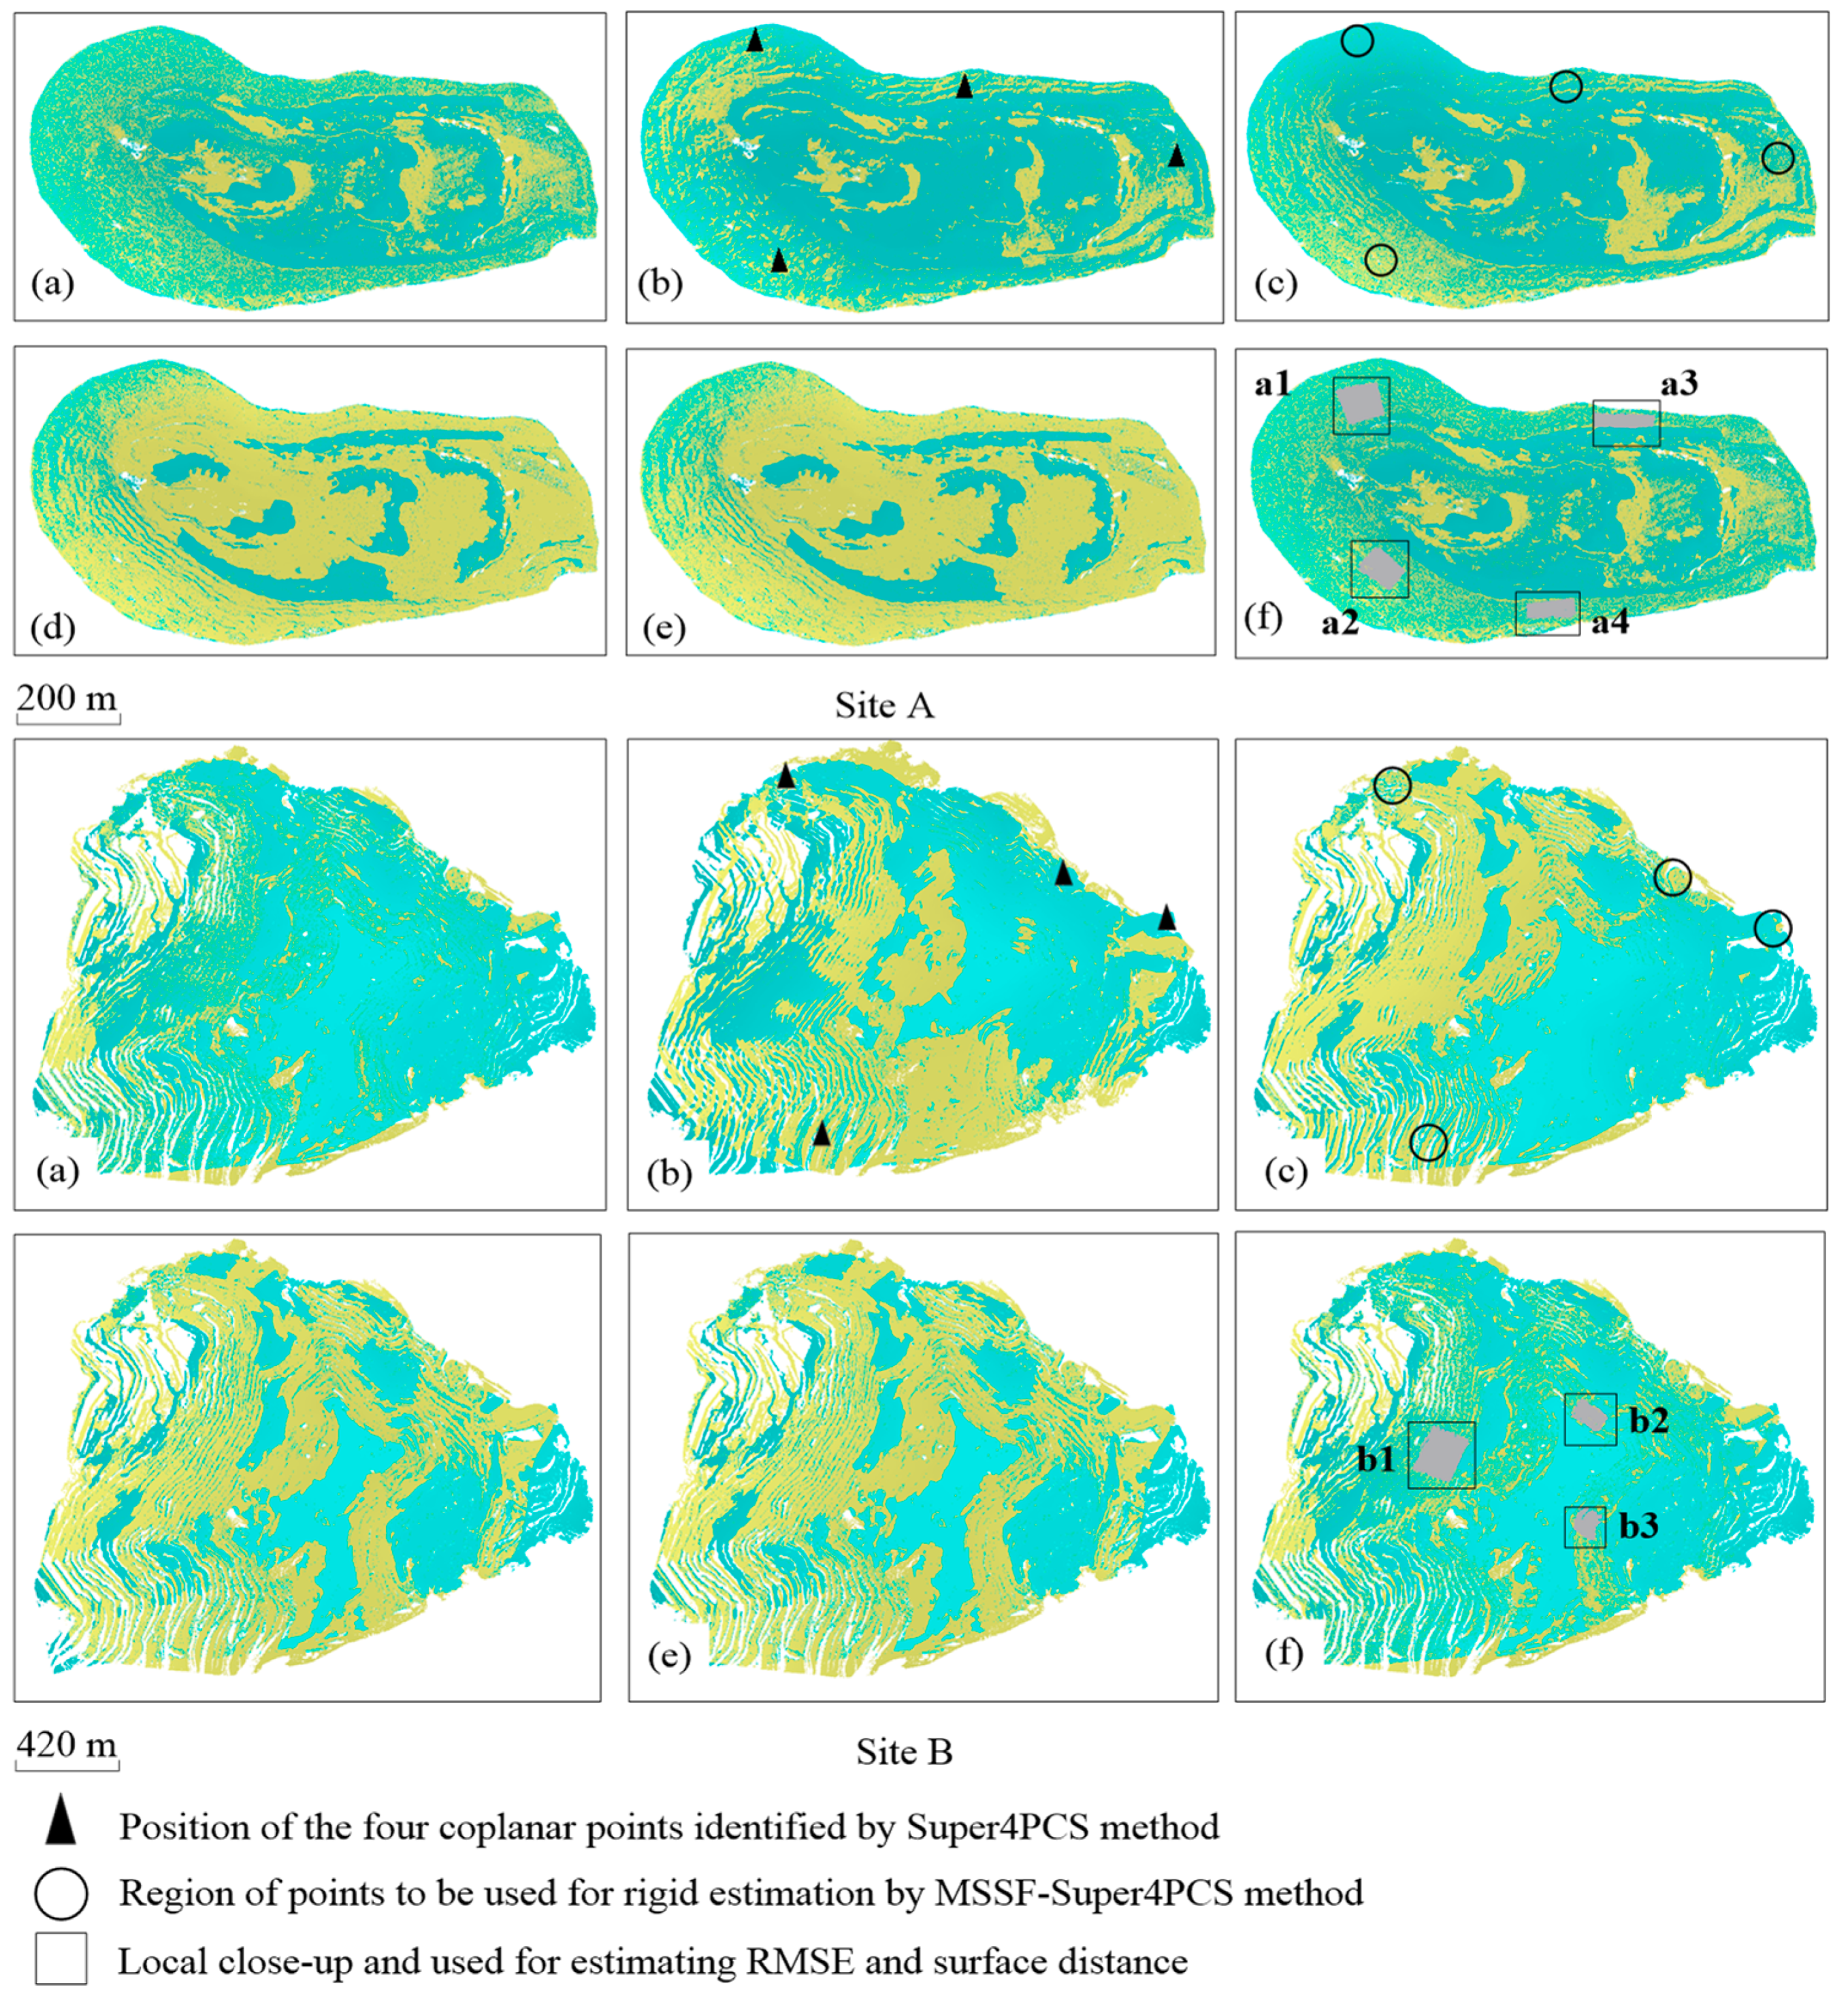
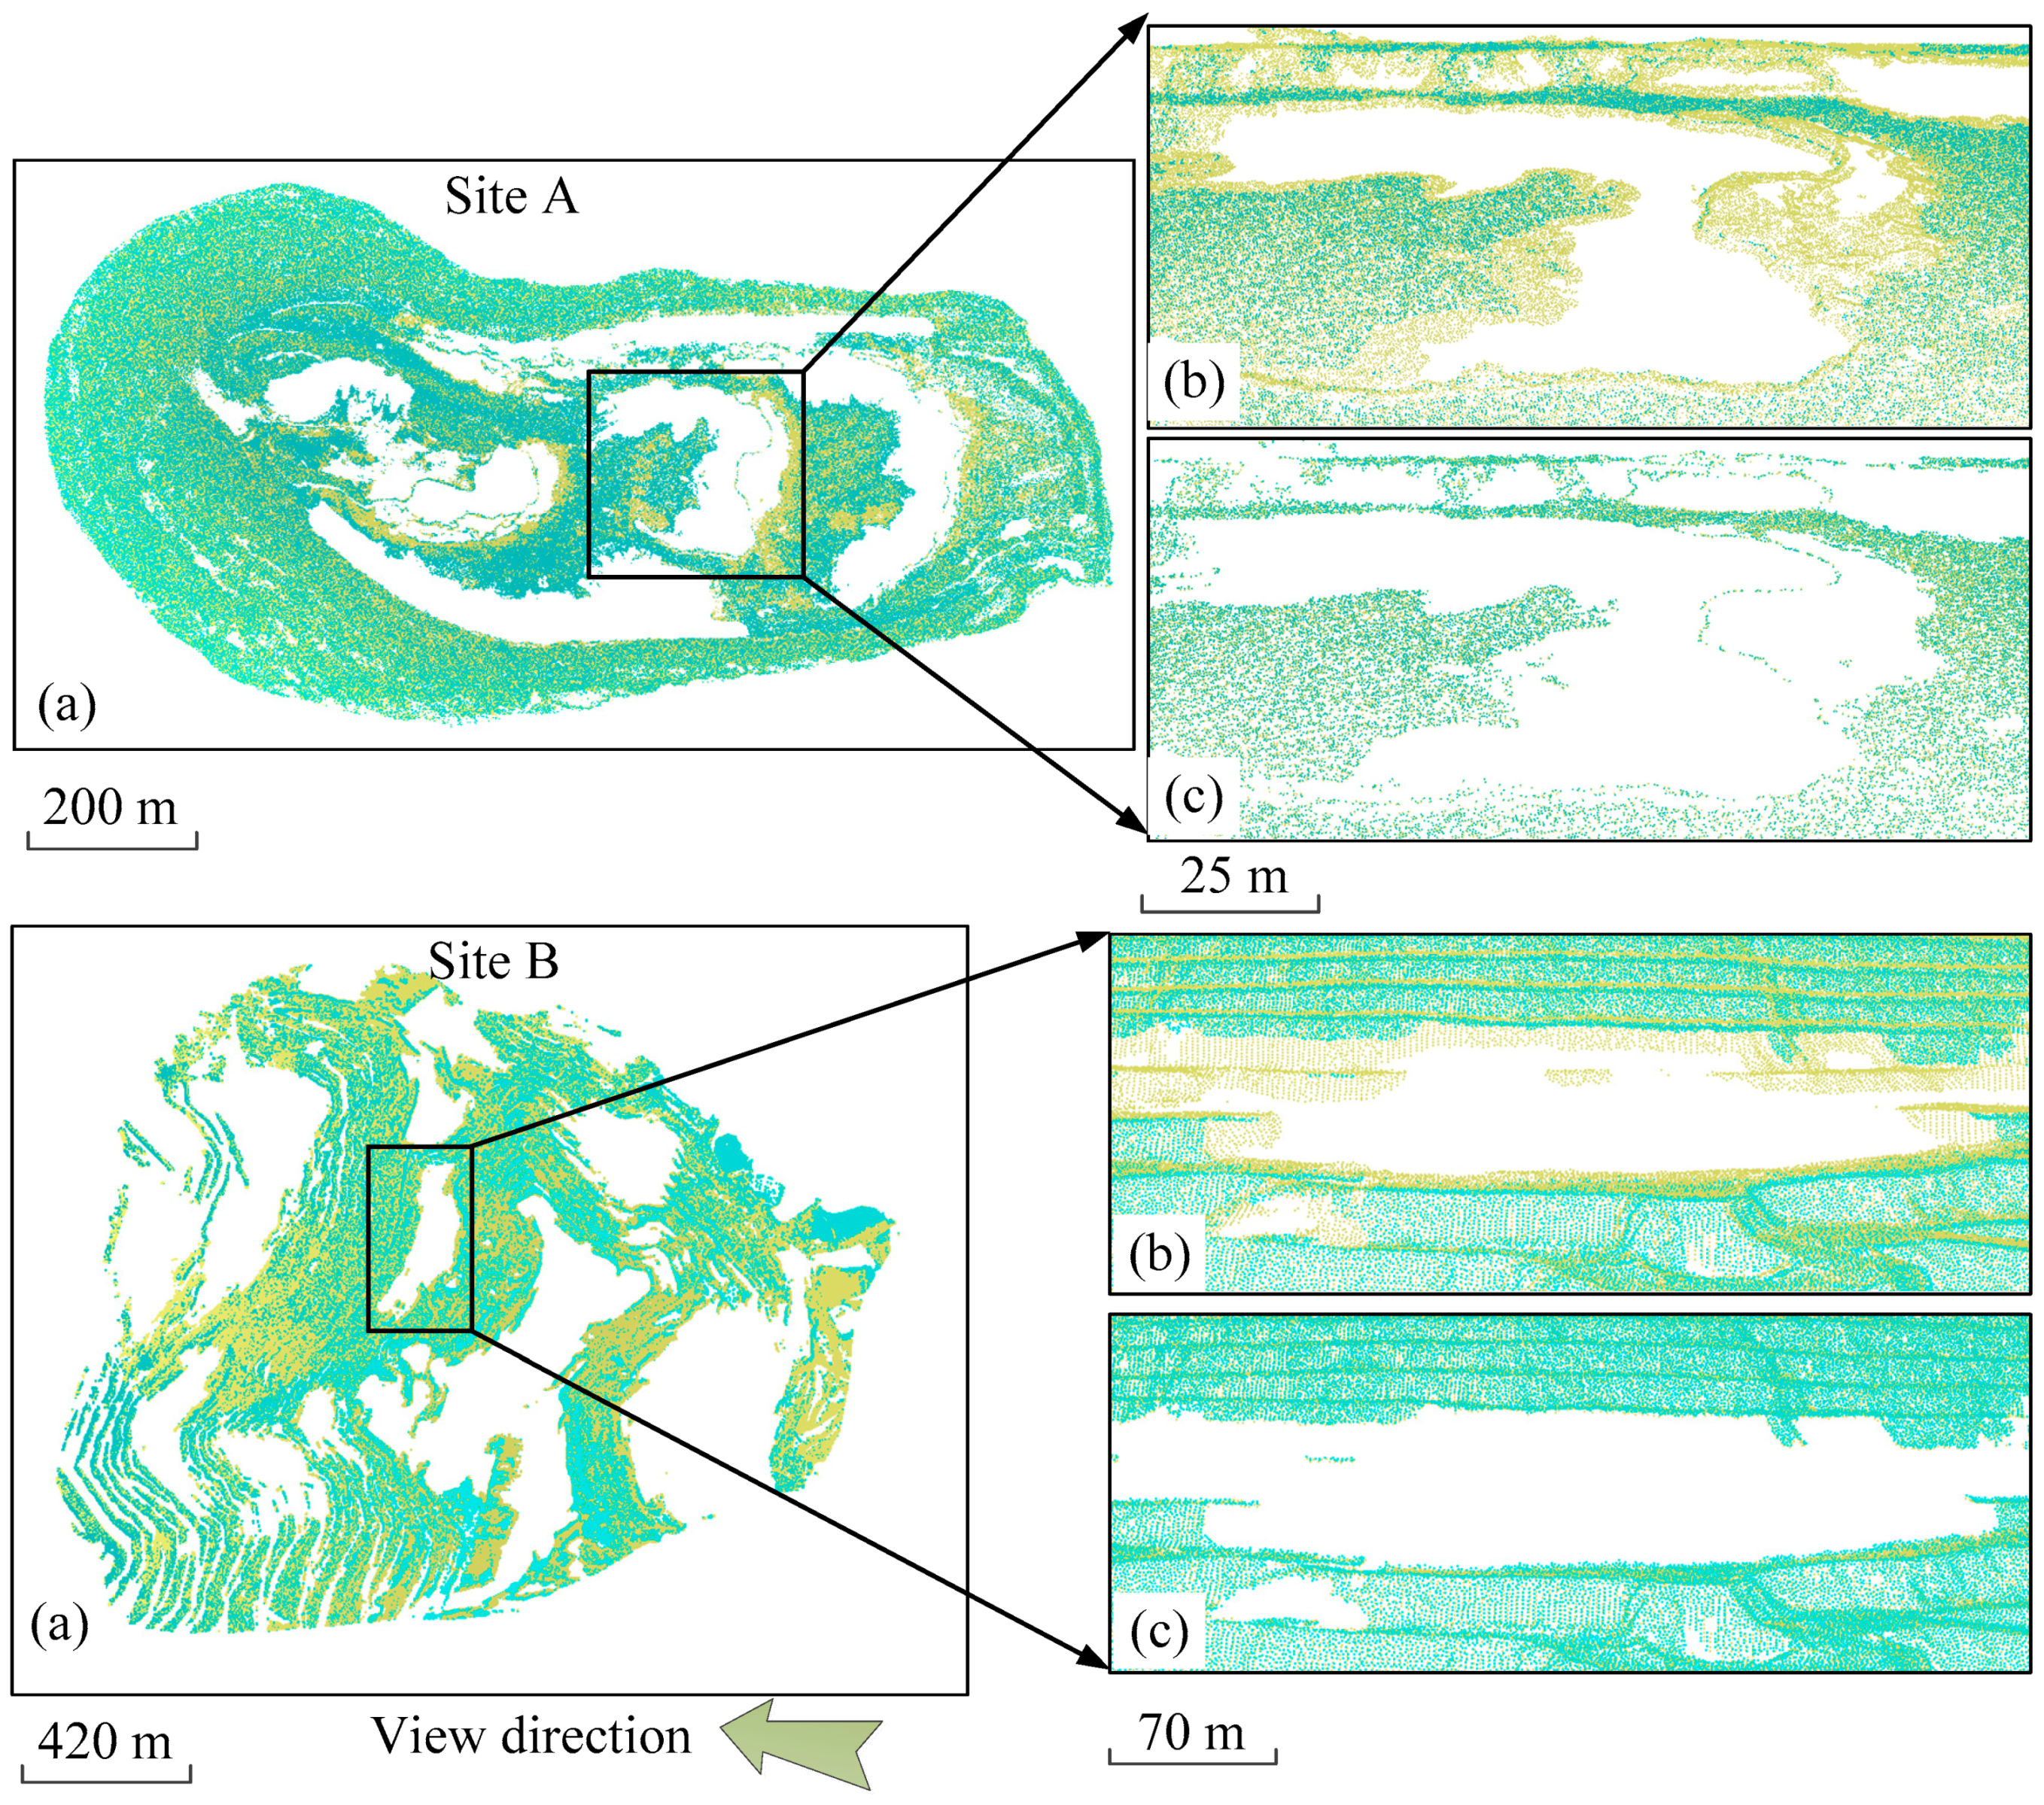
4.1. Registration of Multi-Station TLS Point Clouds

We used the MSSF-Super4PCS+ICP method to register the TLS point clouds from multiple scans of each survey in sites A and B, respectively. Figure 5 shows the registered results of the TLS surveys, in both sites. From the overlapping areas of local registration (marked in dark boxes), we calculated the RMSE values of distances between the nearest point pairs in Table 2. The RMSE values of the registration were 0.47 m and 0.38 m, for the two TLS surveys in site A, whereas the corresponding values of the registration in site B were 0.84 m and 1.05 m. Additionally, we respectively selected the local regions with respect to A0 and B0 from Figure 5b, c to generate the 2D-meshes with a plane triangulation algorithm. From these local regions, we measured the mesh-to-mesh distances, and demonstrated the maximum distances within ±0.04 m and ±0.15 m for the two sites, respectively. These distance values were comparable to the a priori range precisions of the TLS instrument (see Table 1), i.e., 0.057 m at a 500 m range distance for site A, and 0.117 m at a 1000 m range distance for site B, which demonstrated the accuracy of the registration.

4.2. Registration of Temporal TLS Surveys

Based on the registered results of each survey, we performed the registration of temporal TLS surveys. Figure 6 shows the registration results of both sites yielded by different methods. One can see that similar results were obtained for both sites. In detail, the proposed method obtained comparable results to the one achieved, manually, and outperformed the four other methods, i.e., Super4PCS, MSSF-Super4PCS, Super4PCS+ICP, and MSSF-Super4PCS+ICP.
We selected overlapping areas from sites A and B, corresponding to a1 and b1, respectively, to generate the mesh-to-mesh distance maps, as shown in Figure 7 and Figure 8. The distances between the registered two temporal TLS surveys were estimated, as shown in the color bar. Again, both, the proposed method and the manual method performed better than the four other methods. As shown in the neutral zone of the color bar, the maximum mesh-to-mesh distances between the registered temporal TLS surveys were within ±0.1 m and ±0.2 m for sites A and B, respectively.
Moreover, we respectively selected the local overlapping areas of a1–a4 and b1–b3 from the sites A and site B (see Figure 6) to calculate the RMSE values for each registration. The detailed information of the registration are listed in Table 3. Note that, the ICP implementation decreased the accuracy of registration achieved by Super4PCS and MSSF-Super4PCS, for both sites. Additionally, the registration achieved by our method led to an average RMSE value, about two-thirds of the point resolution of the temporal TLS surveys.

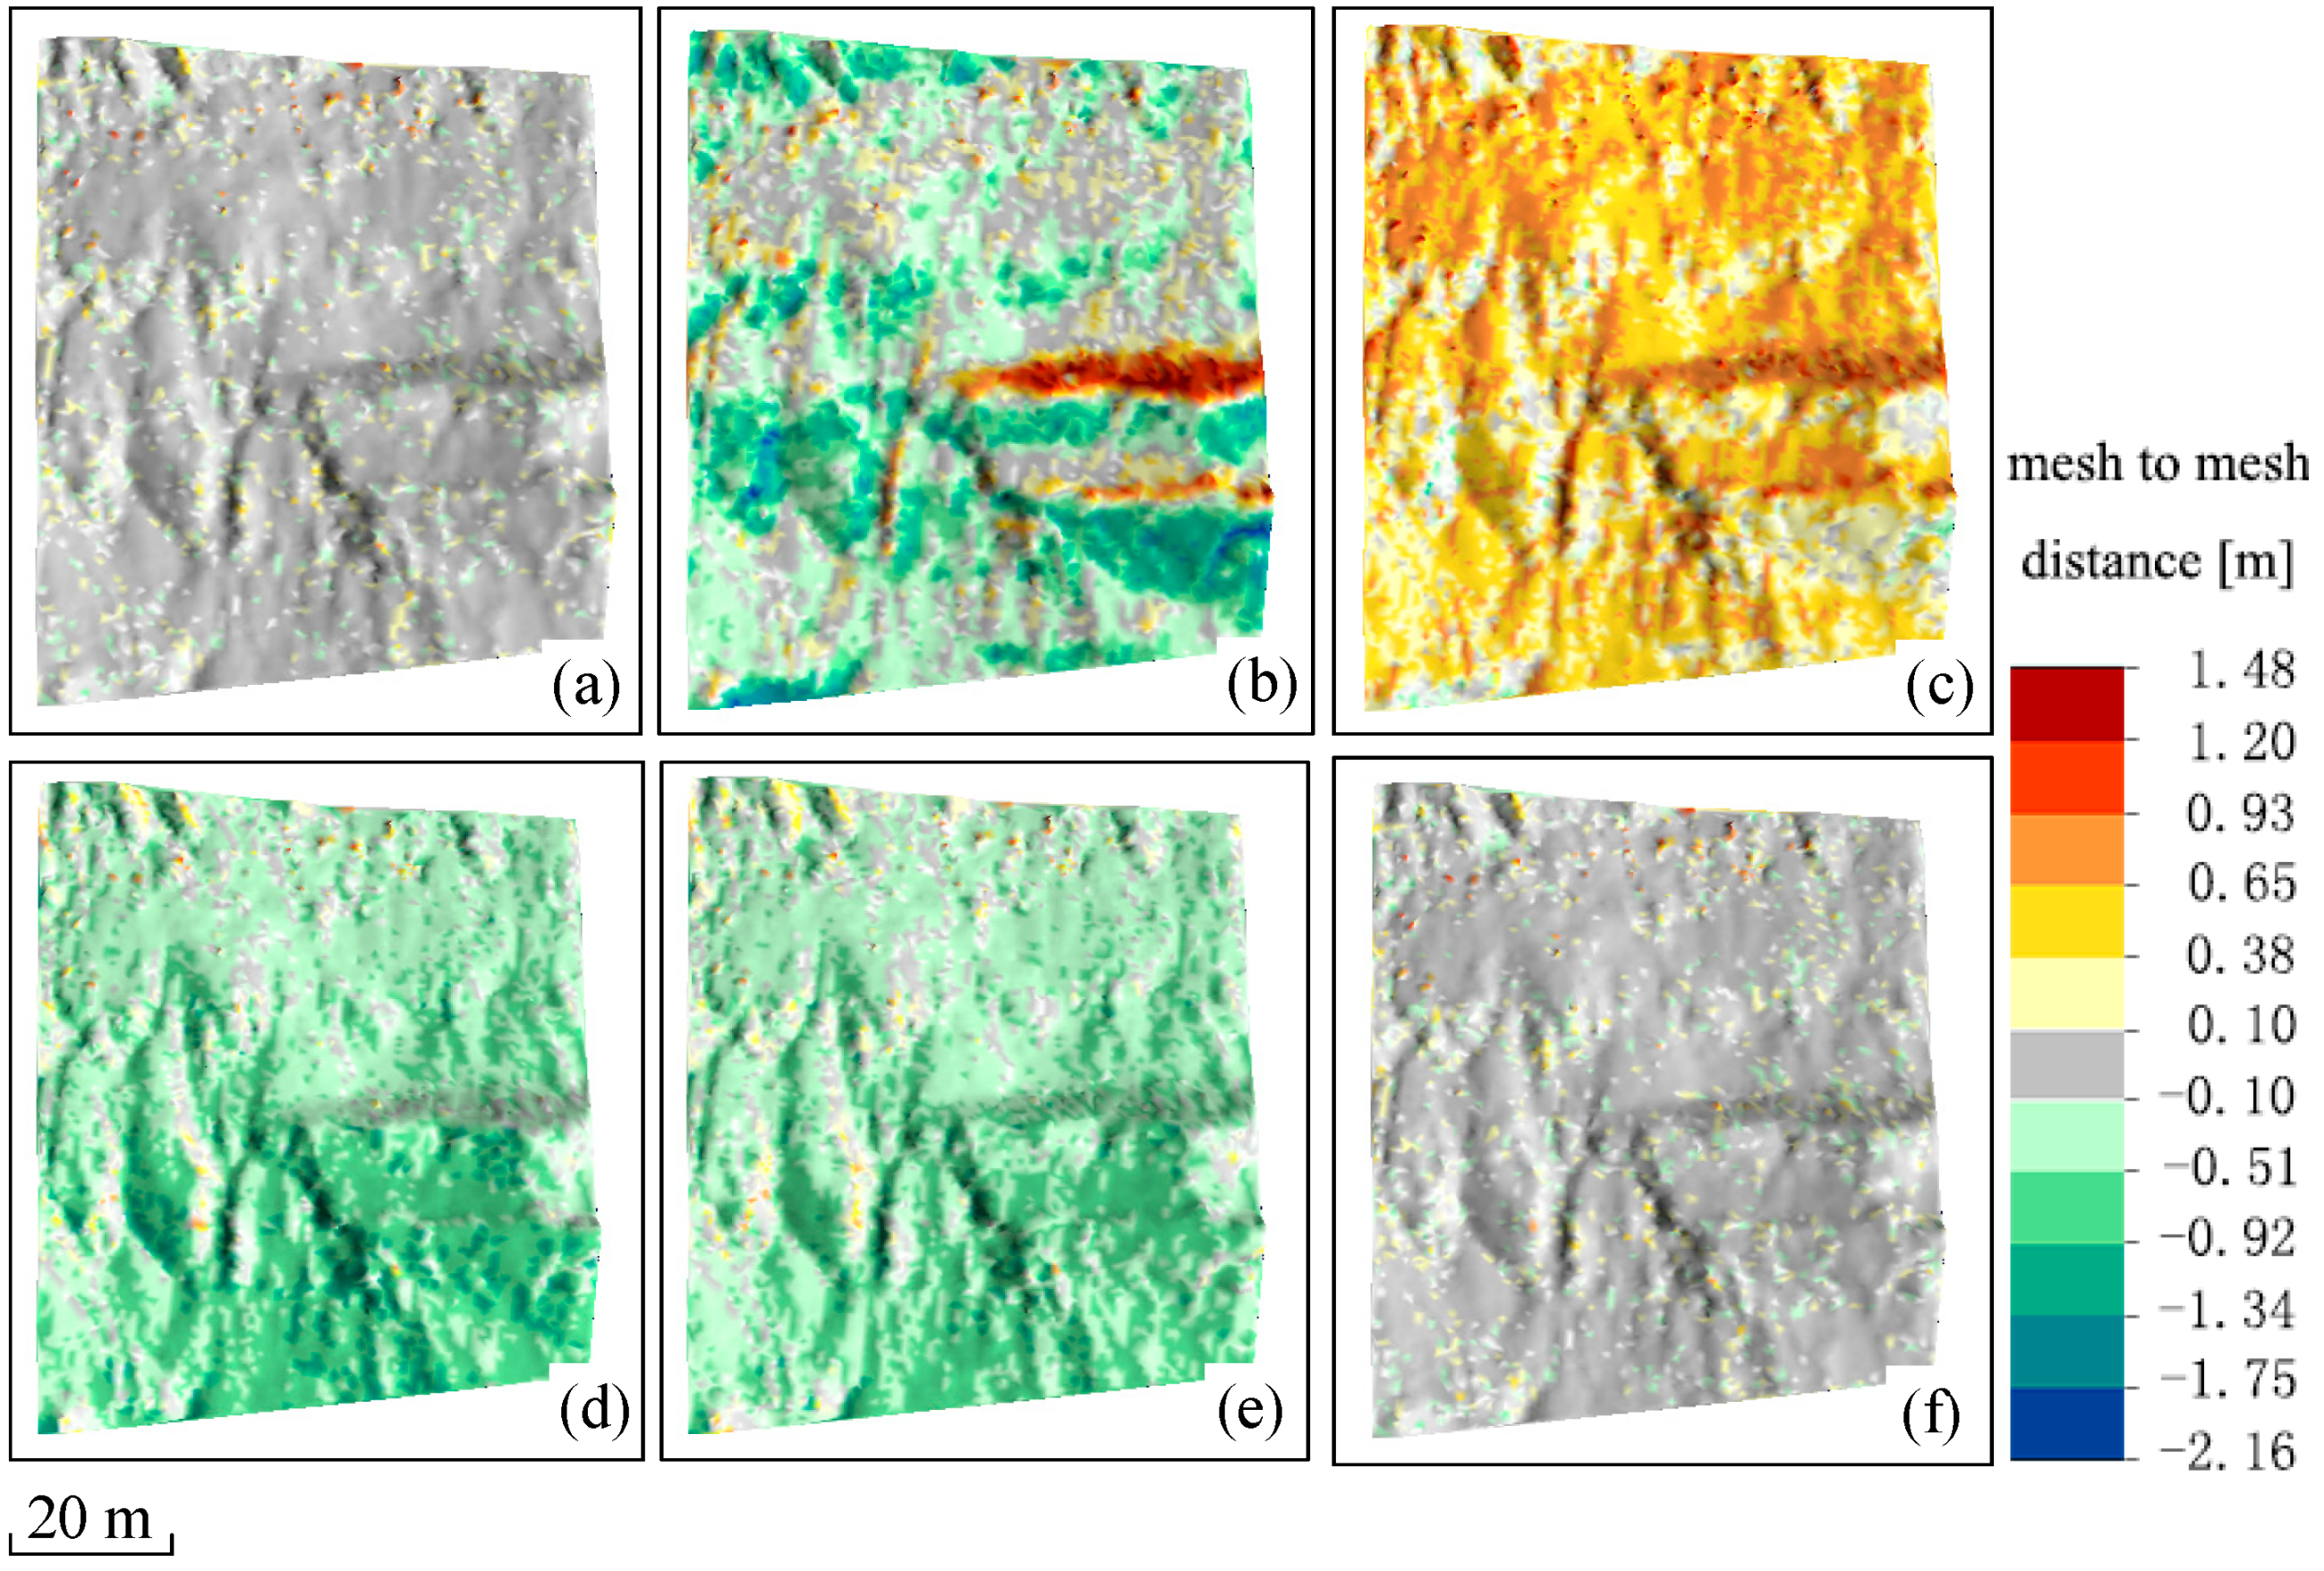
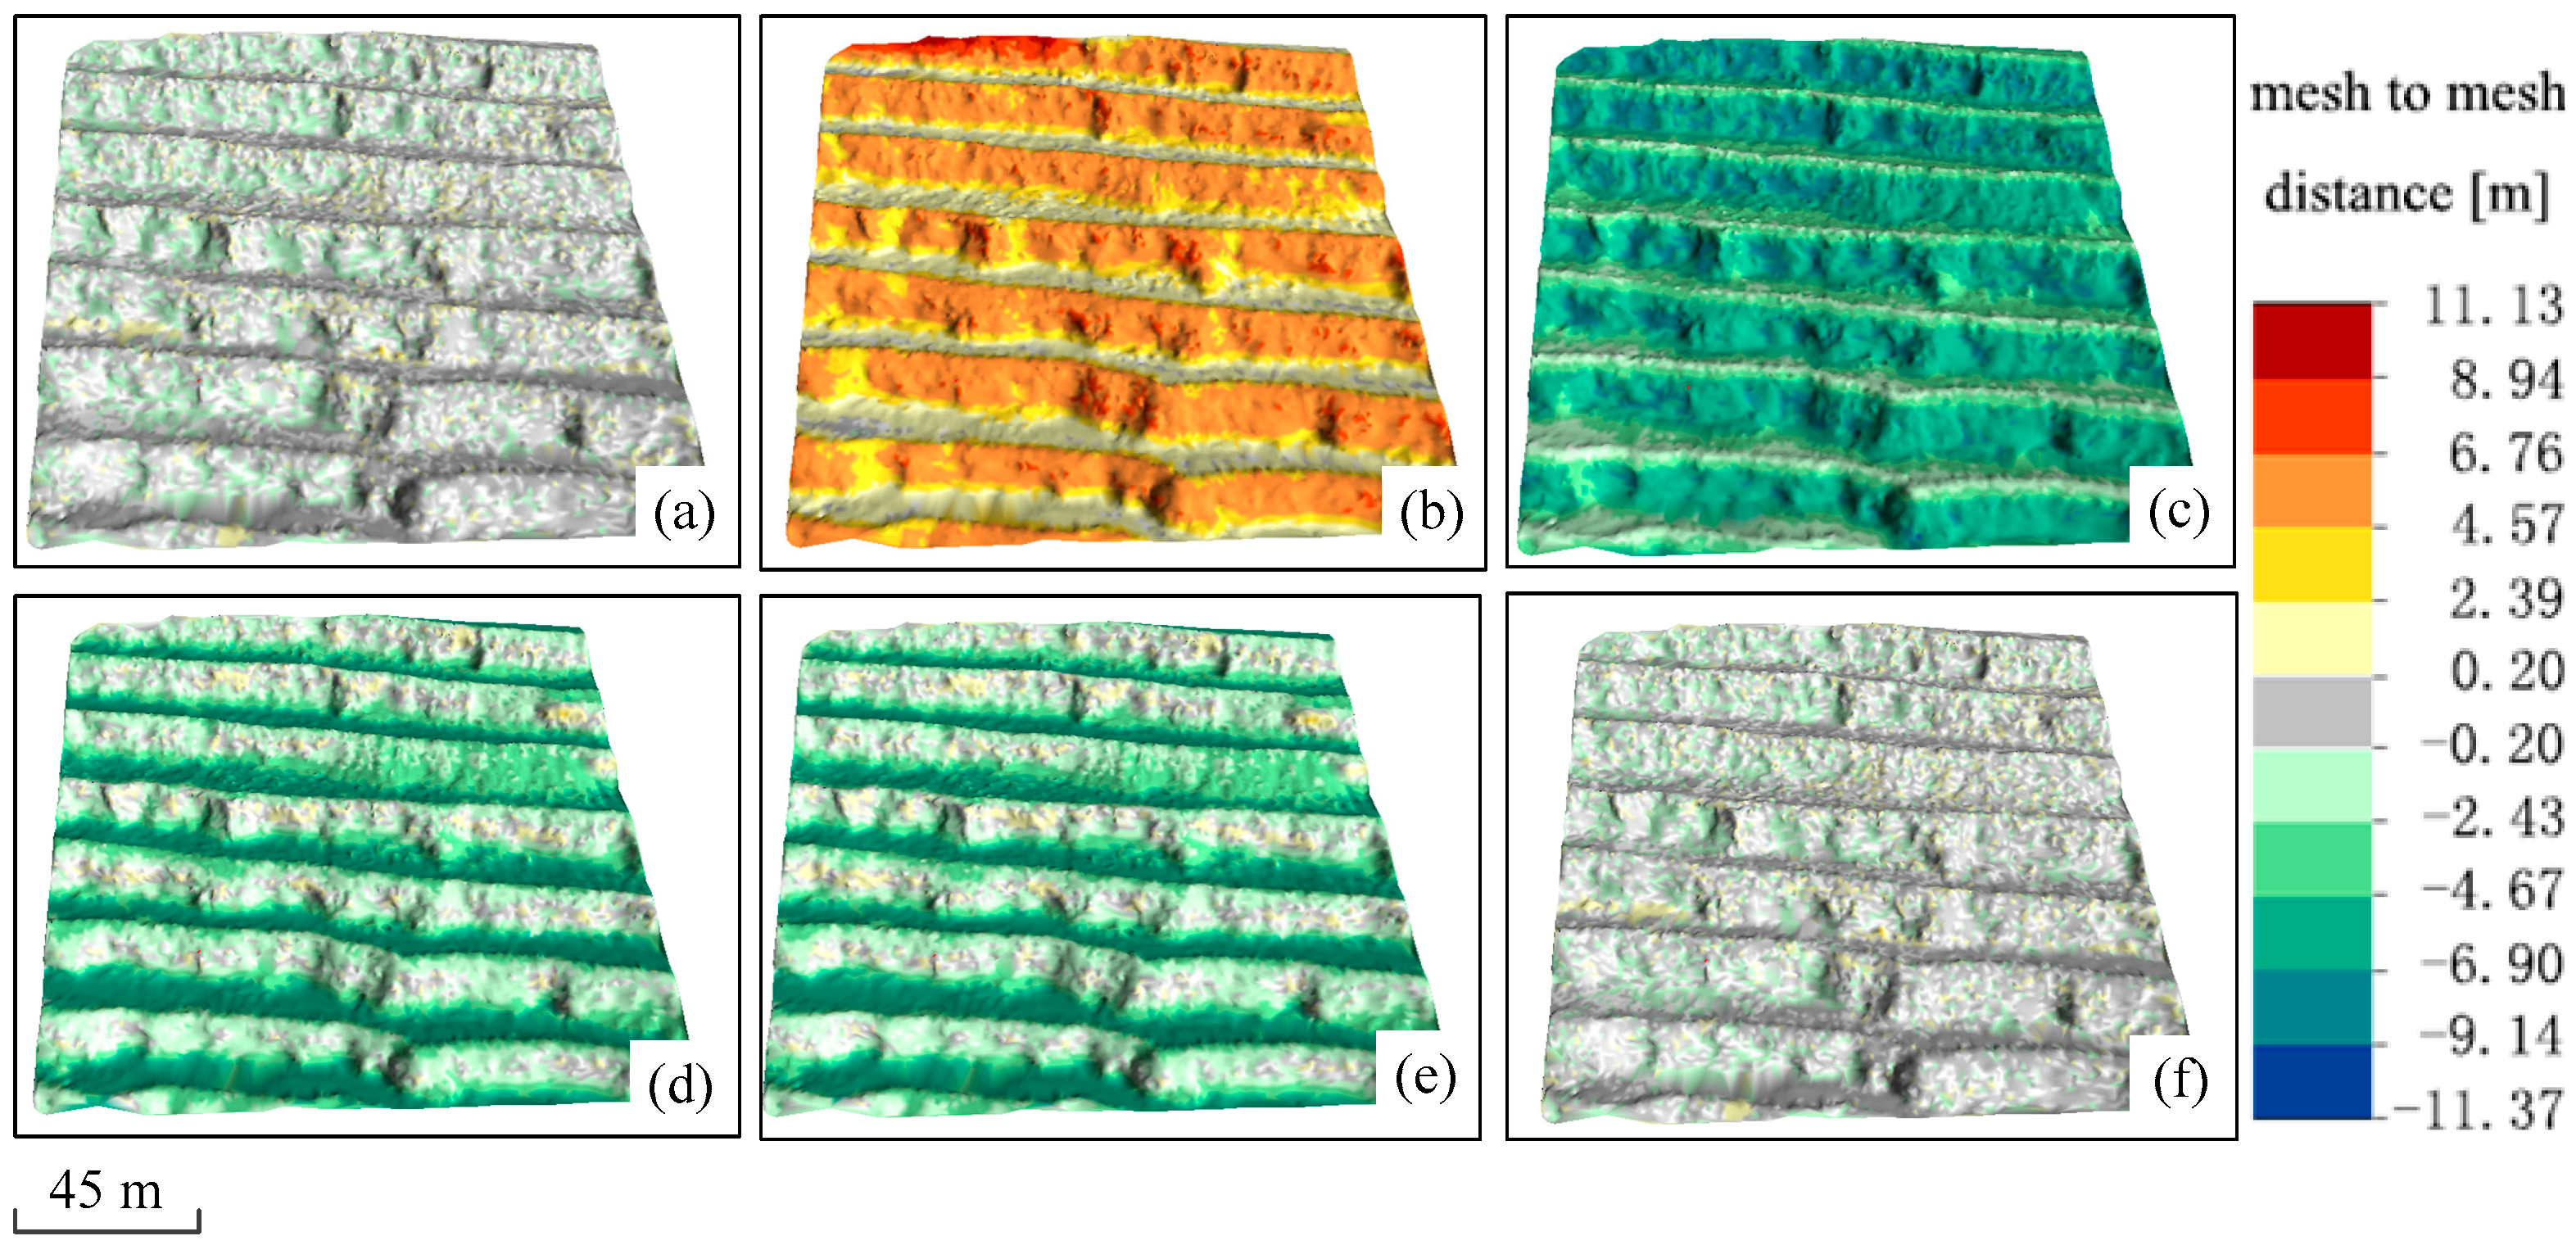
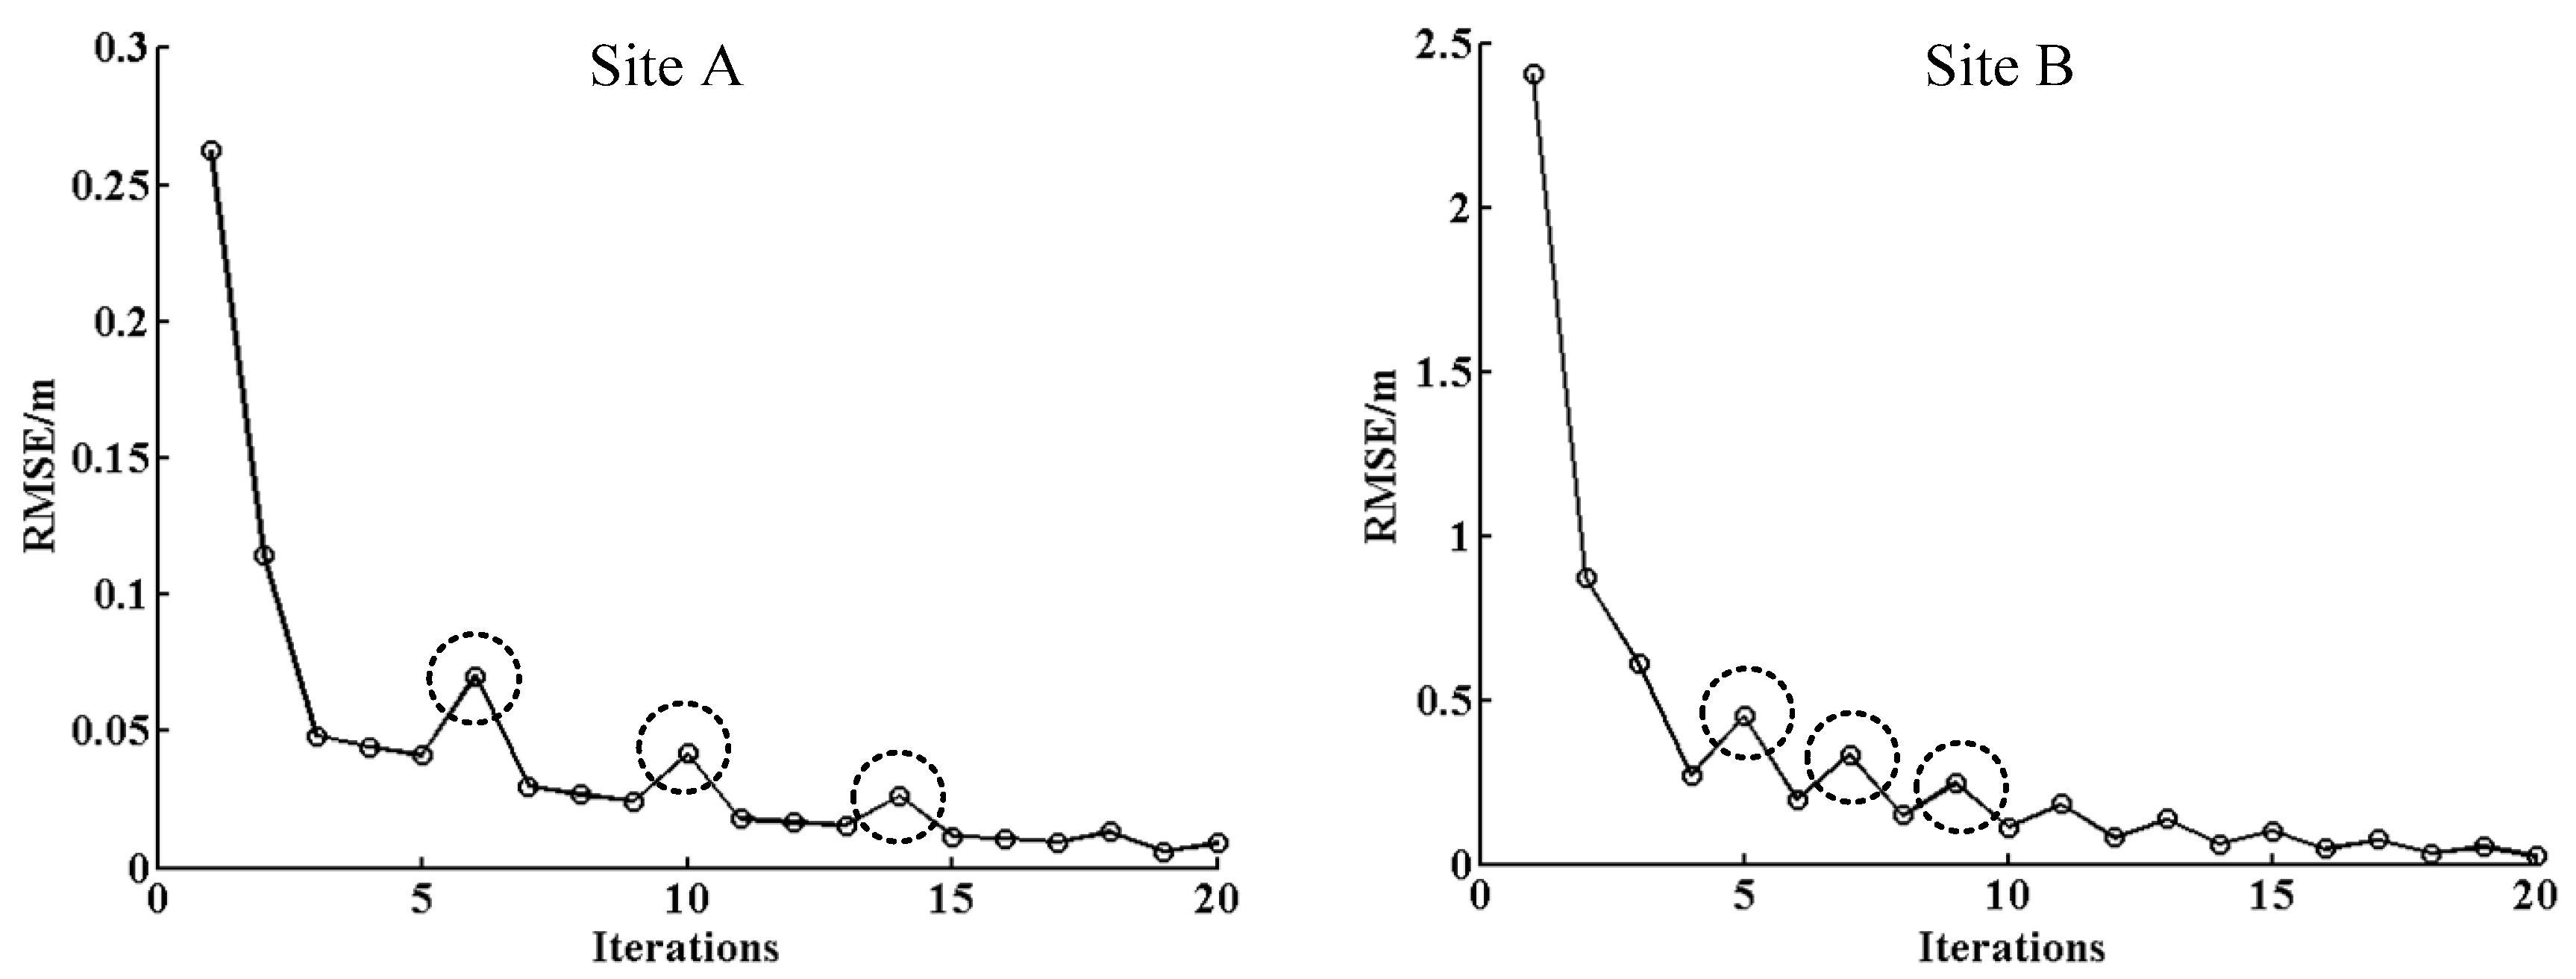
4.3. Parameter Test on Registration Accuracy for Identifying Terrain-Invariant Regions

Figure 9 plots the RMSE values of the TIRs over both sites generated by the proposed method, with increasing iterations. This figure shows that the RMSE value exhibits an exponential decrease with the rise of optimization iterations during the registration process. Moreover, the convergence rates of the curves for the registration were independent of the initial RMSE values. As marked by the dotted circles in Figure 9, there were some slight ups and downs along the overall decline curves, for both sites. Figure 10 shows the registration results of the identified TIR in the two sites, yielded by the proposed method. Comparing Figure 10b with Figure 10c, we found that the TIRs were optimized with the increase of ICP iterations, and the registration errors were significantly removed by the proposed method, after 20 optimization iterations.

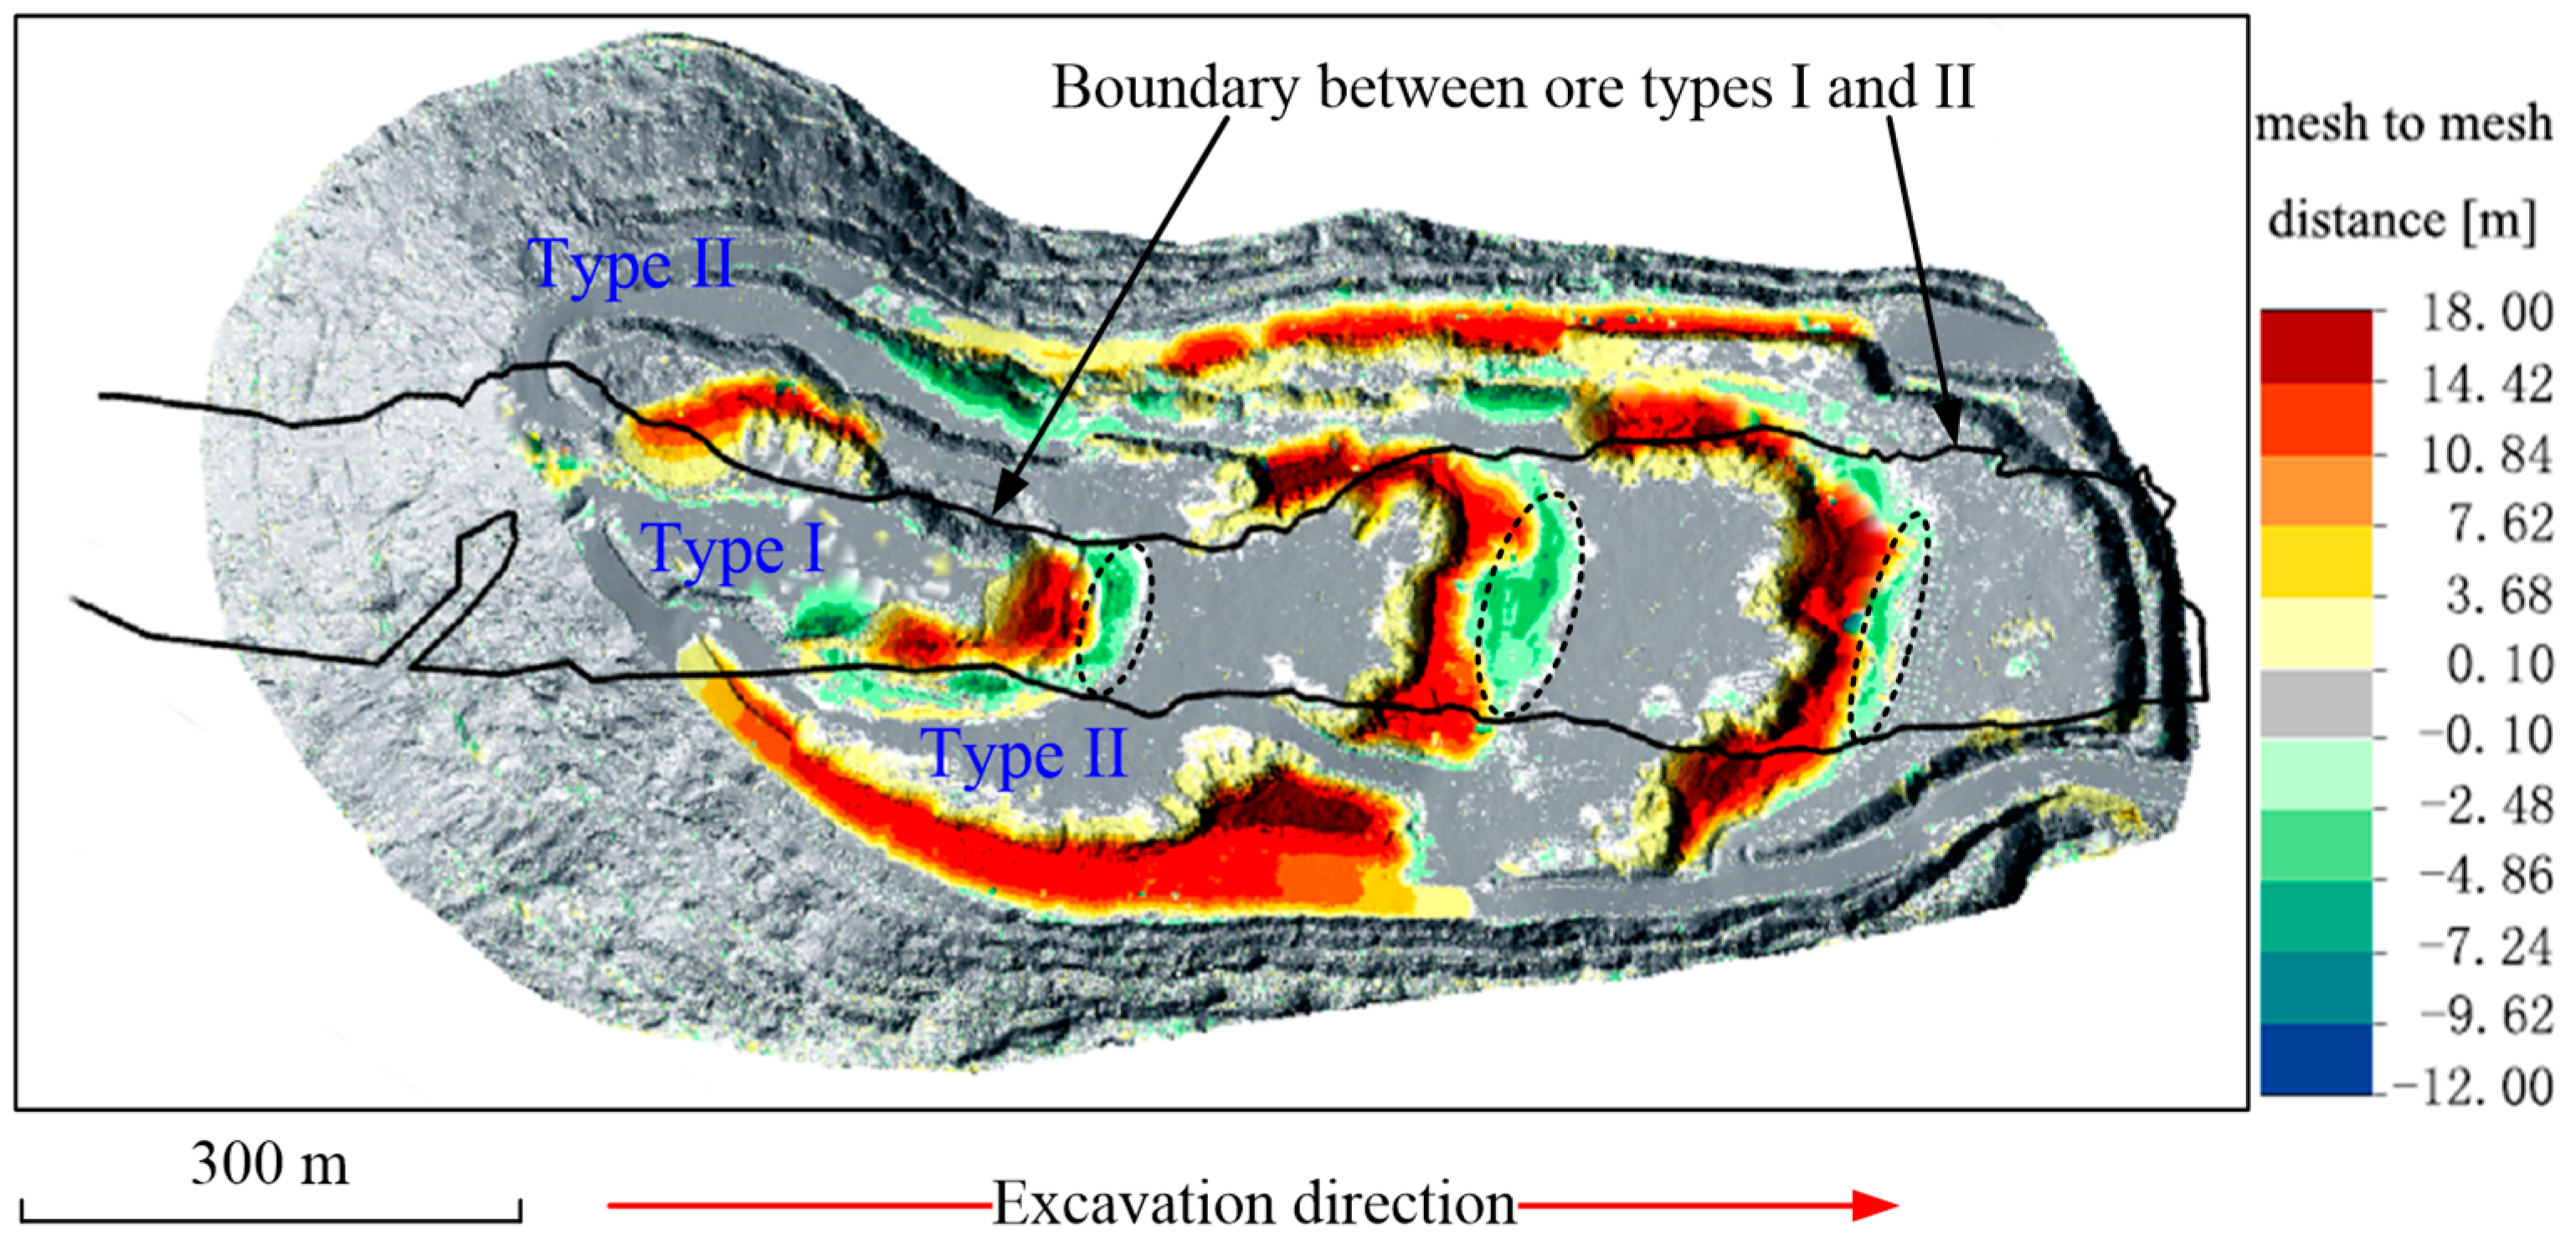
4.4. Measuring Exploitative Volume from Temporal TLS Survyes

Due to the lack of in-situ measurement data in site B, we only used the dataset from site A to quantify the accuracy of the proposed method, for measuring the exploitative volume. Figure 11 shows the distance map of site A, achieved by subtracting the post-phase DEM from the pre-phase DEM of the registered temporal TLS surveys. The boundary between the two ore types, with respect to Fehw-Fec-Fehp-Feh and Fepp-Me-Lph-Chq-Am-Cs was drawn on the distance map. Based on Equations (10) and (11), we estimated the exploitative volume of the distance map, where the rasterization size was set as 1.5 m, by experience. Following this, we calculated the exploitative quantities of different ore types, by multiplying their volumes, with corresponding densities. Finally, we compared our results to in-situ counting data in Table 4. The comparison indicated an overall accuracy of 98.03%, for the proposed method.

5. Discussion

This study investigated the use of TIR to register temporal TLS surveys for exploitative volume (or quantity) measurement over open-pit mines. Many studies on the registration of TLS surveys for measuring exploitative volume can be found in the literature, particularly in [48], who investigated the use of TIR for temporal point clouds registration for the first time. In their work, the main TIRs from two temporal point clouds were manually collected to do ICP optimization, and then to estimate the volume change of a mine heap with the fine-level registered point clouds. In this paper, the proposed method differs from that of the existing method, from the following aspects. First, a modified MSSF-Super4PCS method was used for coarse registration in an automatic configuration. Second, the proposed method provides an automatic strategy to identify the TIR at each iteration, for rigid motion estimation. Third, the study area was significantly enlarged, where the experiments contained larger-term changes. Finally, a detailed experimental evaluation was provided with the proposed registration method.
The results obtained from this study showed that the proposed method achieved a higher accuracy when registering two temporal TLS surveys, with large-scale changes caused by mining activities. In this study, the TIR extraction was treated as an iterative process. For instance, the TIR can be updated after each ICP iteration, according to a decreasing threshold that measures the surface distance between the registered temporal TLS surfaces. In practice, both the minimum threshold and its decreasing interval are recommended to quarter the point resolution. This recommendation enables the RMSE to achieve its convergence with a suitable number of ICP optimizations. In addition, the computation time of using the proposed method for registration is a few minutes, in which the coarse registration phase takes the majority of duration. Furthermore, our method enables a fully automated configuration, from coarse to fine, to achieve high registration results. The results also showed that the RMSE value of the final registration reached up to the two-thirds of the point resolution of the TLS surveys.
The results from Table 4 showed that the accuracy of measuring the exploitative volume (quantity) for type I was overestimated up to 8.43%. This was due to mining activities, in particular blasting activities that blasted the ore body into rubbles and raised the ore body up to 5 m higher than the surroundings (see Figure 11). Several solutions with respect to identifying the extraction boundary and averaging the blasting regions over temporal TLS surveys would be potentially useful to solve this problem. Our results also confirmed that performing ICP on the dynamic scenes, i.e., open-pit mines, could decrease the registration accuracy, despite having good initial estimates between the temporal TLS surveys (see Table 3). Although the accuracy obtained by the TIR-based registration method was comparable to or higher than the existing methods, the following issues could be considered for further improvements. First, like other coarse-to-fine registration methods, the accuracy of the coarse registration should be guaranteed before the ICP optimization. In our method, the high-level features, i.e., semantic and deep features, are advised for obtaining good estimates of the coarse registration. Second, a patch-based method should be considered rather than the ICP method, for the registration of the temporal TLS surveys, with significant density difference or in case the TLS surveys had different completeness.

6. Conclusions

Terrestrial laser scanning (TLS) techniques have already demonstrated their capabilities for measuring exploitative volumes in open-pit mines. This paper introduced a coarse-to-fine scheme for the registration of temporal TLS surveys, using terrain-invariant regions. Experimental tests were done in an open-pit mine in China, and the results showed that the proposed registration method obtained good performances, both in registration accuracy and convergence rate, and outperformed the state-of-the-art methods. We concluded that the proposed method could be used to measure the exploitative quantity in open-pit mine applications. Moreover, this study could also inspire some future studies to further improve the accuracy and robustness of the proposed method. For example, deep features could be considered in the coarse registration phase, in order to handle the registration problem in markerless scenarios. Further tests can also be conducted to detect small-scale changes. The registration of multi-source clouds, i.e., TLS, ALS, MLS, and photogrammetric point clouds for change detection also deserves further research.

Author Contributions

Conceptualization, Z.X., E.X., and L.W.; methodology, Z.X. and E.X.; data curation, Z.X., E.X., S.L., and Y.M.; writing—original draft preparation, Z.X.; writing—review and editing, L.W.; visualization, Z.X., and E.X.; supervision, L.W.; project administration, Z.X. and L.W.; funding acquisition, Z.X.

Funding

This work was supported in part by the National Natural Science Foundation of China under Grant 41701534, 41371437, the National Key R&D Program of China under Grant 2016YFC0801602, the Opening Fund of Key Laboratory of Geohazard Prevention of Hilly Mountains, Ministry of Land and Resources (Fujian Key Laboratory Of Geohazard Prevention) under Grant FJKLGH2017K001, and in part by the Innovation Leading Talent Project of Central South University under Grant 506030101.

Acknowledgments

We thank Mengmeng Li of the Department of Earth Observation Science, Faculty ITC, University of Twente for his helpful comments and writing suggestions. Furthermore, we thank Anqian Mining Co., Ltd., Anshan Iron and Steel Group Corporation, and Zijin Mining Group Co., Ltd. for providing the study areas of site A and site B, respectively.

Conflicts of Interest

The authors declare no conflict of interest.

References

  1. Xiang, J.; Chen, J.; Sofia, G.; Tian, Y.; Tarolli, P. Open-pit mine geomorphic changes analysis using multi-temporal UAV survey. Environ. Earth Sci. 2018, 77, 1–18. [Google Scholar] [CrossRef]
  2. Sokolš, B.M.; Lipták, M.; Brunčák, P. Volumes determination in terms of various data density and surface diversity. J. Sustain. Min. 2014, 13, 23–27. [Google Scholar]
  3. Jaroslaw, W. Research on surveying technology applied for DTM modelling and volume computation in open pit mines. Min. Sci. 2015, 22, 69–77. [Google Scholar]
  4. Telling, J.; Lyda, A.; Hartzell, P.; Glennie, C. Review of earth science research using terrestrial laser scanning. Earth-Sci. Rev. 2017, 169, 35–68. [Google Scholar] [CrossRef]
  5. Wilkinson, M.; McCaffrey, K.; Roberts, G.; Cowie, P.; Phillips, R.; Michetti, A.M.; Vittori, E.; Guerrieri, L.; Blumetti, A.; Bubeck, A. Partitioned postseismic deformation associated with the 2009 Mw 6.3 L’Aquila earthquake surface rupture measured using a terrestrial laser scanner. Geophys. Res. Lett. 2010, 37, 1–7. [Google Scholar] [CrossRef]
  6. DeLong, S.B.; Lienkaemper, J.J.; Pickering, A.J.; Avdievitch, N.N. Rates and patterns of surface deformation from laser scanning following the South Napa earthquake, California. Geosphere 2015, 11, 2015–2030. [Google Scholar] [CrossRef] [Green Version]
  7. James, M.R.; Pinkerton, H.; Applegarth, L.J. Detecting the development of active lava flow fields with a very-long-range terrestrial laser scanner and thermal imagery. Geophys. Res. Lett. 2009, 36, 1–5. [Google Scholar] [CrossRef]
  8. Slatcher, N.; James, M.; Calvari, S.; Ganci, G.; Browning, J. Quantifying effusion rates at active volcanoes through integrated time-lapse laser scanning and photography. Remote Sens. 2015, 7, 14967–14987. [Google Scholar] [CrossRef]
  9. Jones, L.K.; Kyle, P.R.; Oppenheimer, C.; Frechette, J.D.; Okal, M.H. Terrestrial laser scanning observations of geomorphic changes and varying lava lake levels at Erebus volcano, Antarctica. J. Volcanol. Geotherm. Res. 2015, 295, 43–54. [Google Scholar] [CrossRef] [Green Version]
  10. Teza, G.; Pesci, A.; Genevois, R.; Galgaro, A. Characterization of landslide ground surface kinematics from terrestrial laser scanning and strain field computation. Geomorphology 2008, 97, 424–437. [Google Scholar] [CrossRef]
  11. Kasperski, J.; Delacourt, C.; Allemand, P.; Potherat, P.; Jaud, M.; Varrel, E. Application of a terrestrial laser scanner (TLS) to the study of the Séchilienne Landslide (Isère, France). Remote Sens. 2010, 2, 2785–2802. [Google Scholar] [CrossRef]
  12. Aryal, A.; Brooks, B.A.; Reid, M.E. Landslide subsurface slip geometry inferred from 3D surface displacement fields. Geophys. Res. Lett. 2015, 42, 1411–1417. [Google Scholar] [CrossRef]
  13. Strunden, J.; Ehlers, T.A.; Brehm, D.; Nettesheim, M. Spatial and temporal variations in rockfall determined from TLS measurements in a deglaciated valley, Switzerland. J. Geophys. Res. Earth Surf. 2015, 120, 1251–1273. [Google Scholar] [CrossRef] [Green Version]
  14. Picco, L.; Mao, L.; Cavalli, M.; Buzzi, E.; Rainato, R.; Lenzi, M. Evaluating short-term morphological changes in a gravel-bed braided river using terrestrial laser scanner. Geomorphology 2013, 201, 323–334. [Google Scholar] [CrossRef]
  15. Nield, J.M.; Wiggs, G.F. The application of terrestrial laser scanning to aeolian saltation cloud measurement and its response to changing surface moisture. Earth Surf. Process. Landf. 2011, 36, 273–278. [Google Scholar] [CrossRef]
  16. Lee, H.; Lim, S.; Park, D. Application of terrestrial laser scanner and raster operations to change detection of beach. J. Coast. Res. 2011, 64, 1692–1696. [Google Scholar]
  17. Grayson, R.; Holden, J.; Jones, R.; Carle, J.; Lloyd, A. Improving particulate carbon loss estimates in eroding peatlands through the use of terrestrial laser scanning. Geomorphology 2012, 179, 240–248. [Google Scholar] [CrossRef] [Green Version]
  18. Hartzell, P.J.; Gadomski, P.J.; Glennie, C.L.; Finnegan, D.C.; Deems, J.S. Rigorous error propagation for terrestrial laser scanning with application to snow volume uncertainty. J. Glaciol. 2015, 61, 1147–1158. [Google Scholar] [CrossRef] [Green Version]
  19. Prokop, A. Assessing the applicability of terrestrial laser scanning for spatial snow depth measurements. Cold Reg. Sci. Technol. 2008, 54, 155–163. [Google Scholar] [CrossRef]
  20. Egli, L.; Jonas, T.; Grünewald, T.; Schirmer, M.; Burlando, P. Dynamics of snow ablation in a small Alpine catchment observed by repeated terrestrial laser scans. Hydrol. Process. 2012, 26, 1574–1585. [Google Scholar] [CrossRef]
  21. Fischer, M.; Huss, M.; Kummert, M.; Hoelzle, M. Application and validation of long-range terrestrial laser scanning to monitor the mass balance of very small glaciers in the Swiss Alps. Cryosphere 2016, 10, 1279–1295. [Google Scholar] [CrossRef]
  22. Avian, M.; Kellerer-Pirklbauer, A.; Bauer, A. LiDAR for monitoring mass movements in permafrost environments at the cirque Hinteres Langtal, Austria, between 2000 and 2008. Nat. Hazards Earth Syst. Sci. 2009, 9, 1087–1094. [Google Scholar] [CrossRef] [Green Version]
  23. Guo, Y.; Sohel, F.; Bennamoun, M.; Lu, M.; Wan, J. Rotational projection statistics for 3D local surface description and object recognition. Int. J. Comput. Vis. 2013, 105, 63–86. [Google Scholar] [CrossRef]
  24. Böhm, J.; Becker, S. Automatic marker-free registration of terrestrial laser scans using reflectance. In Proceedings of the 8th Conference on Optical 3D Measurement Techniques, Zurich, Switzerland, 9–12 July 2007; pp. 9–12. [Google Scholar]
  25. Zai, D.; Li, J.; Guo, Y.; Cheng, M.; Huang, P.; Cao, X.; Wang, C. Pairwise registration of TLS point clouds using covariance descriptors and a non-cooperative game. ISPRS J. Photogramm. Remote Sens. 2017, 134, 15–29. [Google Scholar] [CrossRef]
  26. Dong, Z.; Yang, B.; Liang, F.; Huang, R.; Scherer, S. Hierarchical registration of unordered TLS point clouds based on binary shape context descriptor. ISPRS J. Photogramm. Remote Sens. 2018, 144, 61–79. [Google Scholar] [CrossRef]
  27. Von Hansen, W. Robust automatic marker-free registration of terrestrial scan data. Proc. Photogramm. Comput. Vis 2006, 36, 105–110. [Google Scholar]
  28. Theiler, P.; Schindler, K. Automatic registration of terrestrial laser scanner point clouds using natural planar surfaces. ISPRS Ann. Photogramm. Remote Sens. Spat. Inf. Sci. 2012, 3, 173–178. [Google Scholar] [CrossRef]
  29. Lin, Y.; Wang, C.; Chen, B.; Zai, D.; Li, J. Facet segmentation-based line segment extraction for large-scale point clouds. IEEE Trans. Geosci. Remote Sens. 2017, 55, 4839–4854. [Google Scholar] [CrossRef]
  30. Yang, B.; Dong, Z.; Liang, F.; Liu, Y. Automatic registration of large-scale urban scene point clouds based on semantic feature points. ISPRS J. Photogramm. Remote Sens. 2016, 113, 43–58. [Google Scholar] [CrossRef]
  31. Aiger, D.; Mitra, N.J.; Cohen-Or, D. 4-points congruent sets for robust pairwise surface registration. ACM Trans. Graph. 2008, 27, 1–10. [Google Scholar] [CrossRef]
  32. Mellado, N.; Aiger, D.; Mitra, N.J. Super 4PCs fast global pointcloud registration via smart indexing. Comput. Graph. Forum 2014, 33, 205–215. [Google Scholar] [CrossRef]
  33. Mohamad, M.; Ahmed, M.T.; Rappaport, D.; Greenspan, M. Super generalized 4pcs for 3d registration. In Proceedings of the International Conference on 3D Vision, Lyon, France, 19–22 October 2015; pp. 598–606. [Google Scholar]
  34. Mohamad, M.; Rappaport, D.; Greenspan, M. Generalized 4-points congruent sets for 3d registration. In Proceedings of the 2nd International Conference on 3D Vision, Tokyo, Japan, 8–11 December 2014; pp. 83–90. [Google Scholar]
  35. Theiler, P.W.; Wegner, J.D.; Schindler, K. Keypoint-based 4-Points Congruent Sets–Automated marker-less registration of laser scans. ISPRS J. Photogramm. Remote Sens. 2014, 96, 149–163. [Google Scholar] [CrossRef]
  36. Theiler, P.W.; Wegner, J.D.; Schindler, K. Fast registration of laser scans with 4-point congruent sets-what works and what doesn’t. ISPRS Ann. Photogramm. Remote Sens. Spat. Inf. Sci. 2014, 2, 149–156. [Google Scholar] [CrossRef]
  37. Theiler, P.W.; Wegner, J.D.; Schindler, K. Globally consistent registration of terrestrial laser scans via graph optimization. ISPRS J. Photogramm. Remote Sens. 2015, 109, 126–138. [Google Scholar] [CrossRef]
  38. Ge, X. Non-rigid registration of 3D point clouds under isometric deformation. ISPRS J. Photogramm. Remote Sens. 2016, 121, 192–202. [Google Scholar] [CrossRef]
  39. Ge, X. Automatic markerless registration of point clouds with semantic-keypoint-based 4-points congruent sets. ISPRS J. Photogramm. Remote Sens. 2017, 130, 344–357. [Google Scholar] [CrossRef]
  40. Xu, Z.; Xu, E.; Zhang, Z.; Wu, L. Multi-Scale Sparse Features Embedded 4-Points Congruent Sets for Global Registration of TLS Point Clouds. Geosci. Remote Sens. Lett. 2018, 16, 186–190. [Google Scholar]
  41. Besl, P.J.; McKay, N.D. Method for registration of 3-D shapes. IEEE Trans. Pattern Anal. Mach. Intell. 1992, 14, 239–256. [Google Scholar] [CrossRef]
  42. Granger, S.; Pennec, X. Multi-scale EM-ICP: A fast and robust approach for surface registration. In Proceedings of the European Conference on Computer Vision, Copenhagen, Denmark, 28–31 May 2002; pp. 418–432. [Google Scholar]
  43. Yang, J.; Li, H.; Campbell, D.; Jia, Y. Go-ICP: A globally optimal solution to 3D ICP point-set registration. arXiv, 2016; arXiv:1605.03344. [Google Scholar]
  44. Pomerleau, F.; Colas, F.; Siegwart, R.; Magnenat, S. Comparing ICP variants on real-world data sets. Auton. Robots 2013, 34, 133–148. [Google Scholar] [CrossRef]
  45. Chetverikov, D.; Stepanov, D.; Krsek, P. Robust Euclidean alignment of 3D point sets: The trimmed iterative closest point algorithm. Image Vis. Comput. 2005, 23, 299–309. [Google Scholar] [CrossRef]
  46. Chen, Y.; Medioni, G. Object modelling by registration of multiple range images. Image Vis. Comput. 1992, 10, 145–155. [Google Scholar] [CrossRef]
  47. Rusinkiewicz, S.; Levoy, M. Efficient variants of the ICP algorithm. In Proceedings of the Third International Conference on 3-D Digital Imaging and Modeling, Quebec City, QC, Canada, 28 May–1 June 2001; pp. 145–152. [Google Scholar]
  48. Xu, Z.; Wu, L.; Chen, S. Method of engineering volume monitoring and calculation for open-pit mine from UAV images. J. Northeast. Univ. Nat. Sci. 2016, 37, 84–88. [Google Scholar]
  49. Rusu, R.B.; Blodow, N.; Beetz, M. Fast point feature histograms (FPFH) for 3D registration. In Proceedings of the IEEE International Conference on Robotics and Automation, Kobe, Japan, 12–17 May 2009; pp. 3212–3217. [Google Scholar]
  50. Weinmann, M.; Urban, S.; Hinz, S.; Jutzi, B.; Mallet, C. Distinctive 2D and 3D features for automated large-scale scene analysis in urban areas. Comput. Graph. 2015, 49, 47–57. [Google Scholar] [CrossRef]
  51. Assfalg, J.; Bertini, M.; Del Bimbo, A.; Pala, P. Content-based retrieval of 3-D objects using spin image signatures. IEEE Trans. Multimedia 2007, 9, 589–599. [Google Scholar] [CrossRef]
  52. Li, Y.; Snavely, N.; Huttenlocher, D.; Fua, P. Worldwide pose estimation using 3d point clouds. In Proceedings of the European Conference on Computer Vision, Florence, Italy, 7–13 October 2012; pp. 15–29. [Google Scholar]
Figure 1. Study areas in terms of global geographic coordinates (WGS-1984). (a,b) The overview and in-site view of site A, and (c) overview of site B.
Remotesensing 11 00606 g001
Figure 2. The instruments used in the experiments. (a) A long-range terrestrial laser scanner, i.e., Riegl VZ-4000. (b) A GNSS rover, i.e., SOUTH S86, fixed on the permanent control point, for correcting the system error.
Remotesensing 11 00606 g002
Figure 3. Framework of registering TLS surveys using terrain-invariant regions for measuring exploitative volume over open-pit mines.
Remotesensing 11 00606 g003
Figure 4. Scheme of the approximate four-point congruent sets from (left) source TLS survey and (right) target TLS survey.
Remotesensing 11 00606 g004
Figure 5. Registration results of TLS stations over site A acquired on (a) 12 September 2017, (b) 12 October 2017, and over the site B acquired on (c) 13 March 2013, and (d) 10 July 2013.
Remotesensing 11 00606 g005
Figure 6. Registration results of both sites yielded by (a) manual-based, (b) Super4PCS, (c) MSSF-Super4PCS, (d) Super4PCS+ICP, (e) MSSF-Super4PCS+ICP, and (f) the proposed method.
Remotesensing 11 00606 g006
Figure 7. Distance map of the a1 area in site A between the two temporal TLS surveys achieved by (a) the manual-based, (b) Super4PCS, (c) MSSF-Super4PCS, (d) Super4PCS+ICP, (e) MSSF-Super4PCS+ICP, and (f) the proposed method.
Remotesensing 11 00606 g007
Figure 8. Distance map of b1 area in site B between the two temporal TLS surveys achieved by (a) the manual-based, (b) Super4PCS, (c) MSSF-Super4PCS, (d) Super4PCS+ICP, (e) MSSF-Super4PCS+ICP, and (f) the proposed method.
Remotesensing 11 00606 g008
Figure 9. RMSE values of the terrain-invariant regions over both sites yielded by the proposed method, with increasing iterations.
Remotesensing 11 00606 g009
Figure 10. Registration of terrain-invariant regions over both sites with the proposed method. (a) Overview results at the first iteration, (b) and (c) local close-up view of the registration yielded by the proposed method at the first and last iterations, respectively.
Remotesensing 11 00606 g010
Figure 11. Distances between Digital Elevation Models (DEMs) of the registered two-temporal TLS surveys in site A calculated using the mesh-to-mesh distances. The boundary between two ore types I and II is overlapped, where type I contains Fehw, Fec, Fehp, Feh minerals and type II contains Fepp, Me, Lph, Chq, Am, Cs. The dotted circles indicate the regions with negative values from the distance map.
Remotesensing 11 00606 g011
Table 1. Technical specifications of the terrestrial laser scanning (TLS) instrument used in the experiment.
ItemValue
Range5–3100 m
Pulse repetition rate100 kHz
Effective measurement rate74,000 points per second
Laser beam divergence0.12 mrad
Laser beam footprint70 mm to 500 m, 140 mm to 1000 m, 280 mm to 2000 m
Range accuracy15 mm to 150 m,
12 mm increase of beam width pre 100 m of range
Scanning resolution0.02° × 0.014° (horizontal × vertical)
Repeatability/Precision10 mm
Table 2. Root-mean-square error (RMSE) values of the distance between the nearest point pairs from the registered multiple scans of TLS surveys.
TLS SurveyPoint Resolution (m)RMSE Value between Overlapping Scans (m)
1st to 2nd1st to 3rd2nd to 3rdAverage
Site A: 12 September 20170.80.440.460.510.47
Site A: 12 October 20170.80.380.390.370.38
Site B: 13 March 20131.50.830.890.790.84
Site B: 10 July 20131.51.240.911.001.05
Table 3. RMSE values of the distances between the registered temporal TLS surveys by the different methods.
Basic InformationRMSE Values (m)
Point Resolution (m)Area (km2)Number of PointsRegistration Method
Manual-BasedSuper4PCSMSSF-Super4PCSSuper4PCS+ICP MSSF-Super4PCS+ICP Our Method
a10.600.07510,9110.430.640.610.59 (+0.05)0.55 (+0.06)0.42
a20.590.05785150.400.650.410.97 (−0.32)0.94 (−0.53)0.39
a30.570.04883790.420.860.461.18 (−0.32)1.16 (−0.70)0.42
a40.600.05274120.480.710.581.30 (−0.59)1.14 (−0.43)0.48
Ave.0.600.05888040.430.720.521.01 (−0.29)0.95 (−0.43)0.43
b11.260.32118,7020.853.744.382.91 (+0.83)2.90 (+1.48)0.85
b21.350.10663350.942.71.304.29 (−1.59)4.41 (−3.11)0.96
b31.240.08346930.812.553.564.67 (−1.12)4.73 (−1.17)0.80
Ave.1.250.17099100.8733.083.96 (−0.96)4.01 (−0.93)0.87
We respectively compared the RMSE values achieved by Super4PCS+ICP and MSSF-Super4PCS+ICP, with those of Super4PCS and MSSF-Super4PCS methods, and listed the differences in the brackets.
Table 4. Comparison on the accuracy of measuring exploitative quantity, achieved by our method and in-situ data in site A.
Ore TypeOur Method (×103 kg)In-Situ Quality (×103 kg)Error (×103 kg)Accuracy (%)Overall Accuracy (%)
Type I654,050.65603,18550,865.6591.5798.03
Type II1,633,763.261,640,477−6713.7499.59
Note: type I contains Fehw, Fec, Fehp, Feh minerals, whereas type II contains Fepp, Me, Lph, Chq, Am, Cs.

